Embed Size (px)
Citation preview
�
T h E E C o N o M I C S o F E C o S y S T E M SA N D B I o D I v E R S I T yTEEB for National and International Policy Makers
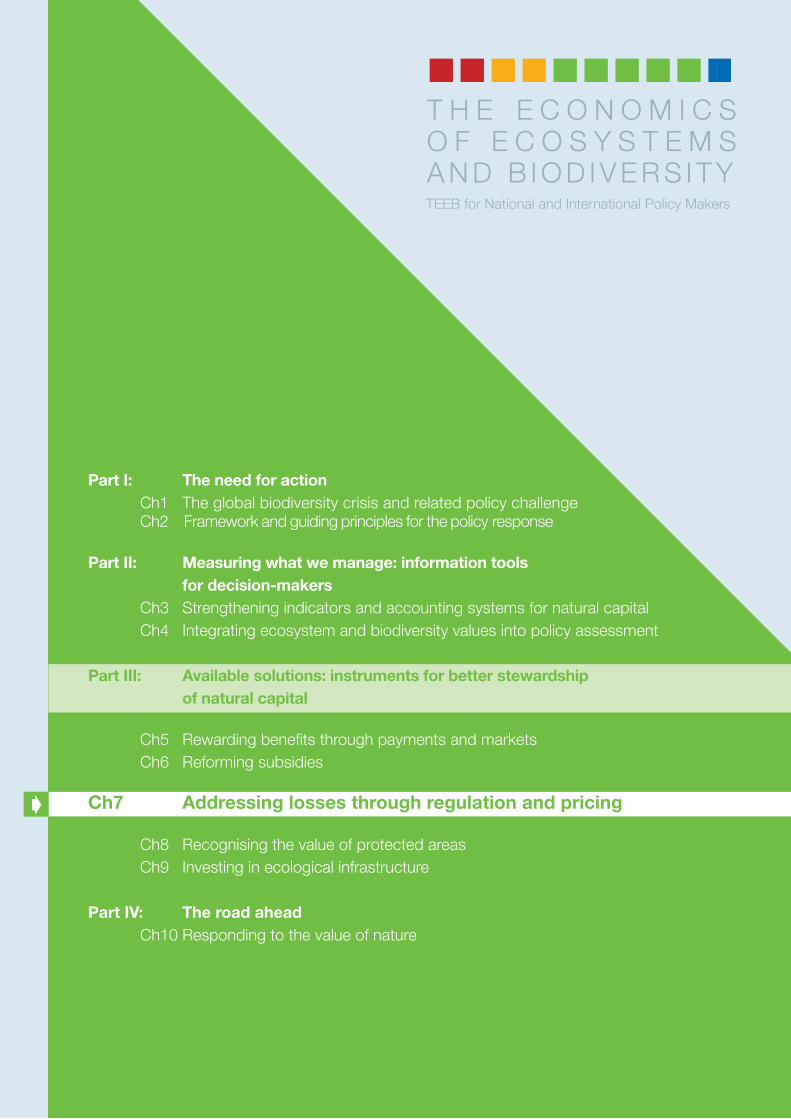
Part I: The need for actionCh1 The global biodiversity crisis and related policy challengeCh2 Framework and guiding principles for the policy response
Part II: Measuring what we manage: information tools for decision-makers
Ch3 Strengthening indicators and accounting systems for natural capital
Ch4 Integrating ecosystem and biodiversity values into policy assessment
Part III: Available solutions: instruments for better stewardship of natural capital
Ch5 Rewarding benefits through payments and markets
Ch6 Reforming subsidies
Ch7 Addressing losses through regulation and pricing
Ch8 Recognising the value of protected areas
Ch9 Investing in ecological infrastructure
Part IV: The road aheadCh10 Responding to the value of nature
Chapter 7: Addressing losses through regulation and pricing
Chapter Coordinating Lead Authors: Bernd hansjürgens, Christoph Schröter-Schlaack (helmholtz
Centre for Environmental Research - UFZ)
Lead authors: Graham Tucker and Alexandra vakrou
Contributing authors: Samuela Bassi, Patrick ten Brink, Ece ozdemiroglu, Clare Shine, heidi Wittmer
Editing and language check: Clare Shine
Acknowledgements: for comments and inputs from Jonathan Armstrong, Burkhard Schweppe Kraft,
Thomas Kretzschmar, Dorit Lehr, hylton Murray Philipson, Manfred Rosenstock, Jo Treweek and
Frank Wätzold and many others.
Disclaimer: The views expressed in this chapter are purely those of the authors and may not in any circumstances
be regarded as stating an official position of the organisations involved.
Citation: TEEB – The Economics of Ecosystems and Biodiversity for National and International Policy Makers (2009).
URL: www.teebweb.org
TEEB for Policy Makers Team
TEEB for Policy Makers Coordinator: Patrick ten Brink (IEEP)
TEEB for Policy Makers Core Team: Bernd hansjuergens (UFZ), Sylvia Kaplan (BMU, Germany), Katia Karousakis (oECD),
Marianne Kettunen (IEEP), Markus Lehmann (SCBD), Meriem Bouamrane (UNESCo), helen Mountford (oECD), Alice Ruhweza
(Katoomba Group, Uganda), Mark Schauer (UNEP), Christoph Schröter-Schlaack (UFZ), Benjamin Simmons (UNEP), Alexandra vakrou
(European Commission), Stefan van der Esch (vRoM, The Netherlands), James vause (Defra, United Kingdom), Madhu verma
(IIFM, India), Jean-Louis Weber (EEA), Stephen White (European Commission) and heidi Wittmer (UFZ).
TEEB Study Leader: Pavan Sukhdev (UNEP)
TEEB communications: Georgina Langdale (UNEP)
Table of Contents
Key Messages of Chapter 7 27.1 Basic principles for halting ongoing losses 47.2 Regulating to avoid damage: environmental standards 6
7.2.1 Importance of a strong regulatory baseline 67.2.2 Rules for environmental liability 97.2.3 Using economic analysis in standard setting 10
7.3 Compensating for losses: offsets and biodiversity banks 117.3.1 Why do we need compensation mechanisms? 117.3.2 Ways to maximise biodiversity benefits and minimise risks 157.3.3 Experience of compensation to date 17
7.4 Setting more accurate prices: market-based instruments 187.4.1 Changing incentives in decision-making 187.4.2 What can market-based instruments contribute? 217.4.3 Limitations of market-based instruments 267.4.4 Role of economic information in instrument design 27
7.5 Monitoring, enforcement and criminal prosecution 297.5.1 Environmental crime: a local and global problem 297.5.2 The need for new approaches to tackle crime 32
7.6 Making it happen – policy mixes to get results 34References 37
ThE ECoNoMICS oF ECoSySTEMS AND BIoDIvERSITy
TEEB for National and International Policy Makers
Chapter 7
Addressing losses through regulation and pricing
T E E B F o R N A T I o N A L A N D I N T E R N A T I o N A L P o L I C y M A K E R S - C h A P T E R 7 : P A G E 1
A D D R E S S I N G L O S S E S T H R O U G H R E G U L A T I O N A N D P R I C I N G
Key Messages of Chapter 7Policies to date have not succeeded in curbing ongoing losses or degradation of biodiversity and eco-system services, e.g. the loss of forests, fisheries and the pollution of air, marine and water resources.For the reasons outlined earlier in this report, the costs of these losses are still hidden or distorted.Polluters and resource users rarely meet the costs of the real damage caused by their activities andsometimes pay nothing at all.
Rewarding benefits and reforming subsidies (Chapters 5 and 6) are important components of policy reform but in
isolation they will never be enough to halt continuing losses. A coherent strategy to make the full costs of loss visible
and payable should form the backbone of new biodiversity policies.
Basic principles for halting ongoing lossesPolicy design should be based on two key principles: the polluter pays principle and the full cost recovery principle.
Many tools for this purpose already exist and more are coming on stream, but their potential is far from fully exploited.
Such instruments encourage private and public actors to incorporate biodiversity values in their decisions and in-
vestments and can stimulate economic efficiency and technical innovation. They contribute to social and distributional
equity and can increase the credibility and acceptability of public policies in force.
Regulating to avoid damage: environmental standards Environmental regulation has long been and will remain central to addressing pressures on biodiversity and eco-
systems. The use of prohibitions, standards and technical conditions has a proven track record and has delivered
major benefits. A well-defined and comprehensive regulatory framework should be the baseline for policies to avoid
damage and a precondition for introducing compensation mechanisms and market-based instruments.
Regulatory frameworks should support attribution of environmental liability to provide further orientation for the private
sector and promote more efficient approaches both to prevention and remediation of damage by responsible parties.
Setting more accurate prices by the use of market-based instrumentsA systematic proactive approach is needed to send accurate price signals about the true value of ecosystem services.
Incentives can be adjusted by using opportunities to apply standards or introduce taxes, charges, fees, fines,
compensation mechanisms and/or tradable permits. This should be part of a wider fiscal reform in favour of biodiversity
(see also Chapters 5, 6 and 9).
Designing smart policy mixesCombining policies provides the opportunity to adequately address different ecosystem services and different actors.
Effective policy mixes need to take account of institutional background, capacity, traditions, affordability and the
characteristics of the resource or service in question.
It is crucial to communicate the benefits of introducing regulation and market-based instruments to overcome
political/social opposition. Flexible policy mixing can:
• stimulate greater efficiency through price signals and least cost solutions to environmental problems;
• through compensation tools, provide for no net loss in policies or even create net-gain solutions;
• generate additional public revenues that, if earmarked, can support pro-biodiversity measures.
Monitoring, enforcement and criminal prosecutionEffective enforcement is critical to give policies teeth and demonstrate the gravity of environmental crimes.
Adequate funding for technical equipment and trained staff is essential to show policy makers’ commitment to
tackling biodiversity and ecosystem losses.
T E E B F o R N A T I o N A L A N D I N T E R N A T I o N A L P o L I C y M A K E R S - C h A P T E R 7 : P A G E 2
Chapter 7 focuses on ways to increase accountability
for the cost of damage to biodiversity and ecosystem
services in order to curb further losses. 7.1 sets outkey concepts to underpin all policies, aligned with the
polluter pays principle. 7.2 describes the role of envi-ronmental regulation and shows how economic in-
formation can be used to inform and target regulatory
standards. 7.3 analyses compensation schemes de-
signed to ensure no net loss or a net gain of biodiver-
sity and ecosystem services. 7.4 discusses the scope
and limitations of market-based instruments in deli-
vering additional conservation gains and encouraging
innovative approaches. 7.5 addresses the critical need
to improve enforcement and international cooperation
in the area of environmental crime. 7.6 concludes
the chapter with design indicators for a smart policymix.
T E E B F o R N A T I o N A L A N D I N T E R N A T I o N A L P o L I C y M A K E R S - C h A P T E R 7 : P A G E 3
A D D R E S S I N G L O S S E S T H R O U G H R E G U L A T I O N A N D P R I C I N G
Addressing losses through regulation and pricing7
"If we were running a business with the biosphere as our major
asset, we would not allow it to depreciate. We would ensure
that all necessary repairs and maintenance
were carried out on a regular basis."
Prof. Alan Malcolm, Chief Scientific Advisor, Institute of Biology,IUPAC -- ThE INTERNATIoNAL UNIoN of Pure and Applied Chemistry
http://www.naturalcapitalinitiative.org.uk/34-quotes/
“We should not limit our attention toprotected areas. If we do we will be
left with a patchwork quilt: pockets ofnature in a desert of destruction.”
José Manuel Durão BarrosoPresident of the European Commission ‘Biodiversity Protection –
Beyond 2010’ conference in Athens, 27 April 2009
As highlighted throughout this report, policies to date
have not managed to halt loss or degradation of
ecosystems and biodiversity. We need instrumentsthat reflect and incorporate the cost of such losses to turn this situation around. Many promising
tools are available and can be more widely shared but
their potential is not yet fully exploited.
Chapters 5 and 6 showed how payments for eco-
system services and reformed subsidies can help build
up natural capital and create positive incentives for
biodiversity action. however, their contribution will be
undercut if economic activities continue to lead to
releases of pollutants and ecosystem degradation.
Measures explicitly designed to avoid ongoing losses
are therefore a core component of the policy mix.
Decision-makers and resource users will onlytake such losses into account if confronted withthe real costs involved. This report has already
stressed the factors that conceal such costs: lack of
information, lack of appropriate incentives, incomplete
property rights, relatively few markets or regulation. We
face a situation of market failure because most markets
do not signal the true value of biodiversity and ecosys-
tem services or show what their losses cost us.
This chapter focuses on a range of policy tools to in-
corporate such costs, showing their respective advan-
tages and disadvantages and providing guidance for
improved instrument design.
BASIC PRINCIPLES FoR hALTING
oNGoING LoSSES7.1 Strengthening instruments to make costs visible can
have several advantages for policy makers:
• using values transparently can justify environ-
mental regulation and help overcome political
resistance (see Chapter 2). Showing what and
how much society is losing can strengthen the hand
of policy makers arguing for improved policies;
• confronting those who cause damage with the
associated costs can stimulate efforts to take preventive action, thus boosting efficiency(e.g. by less water-intensive production, less
fertiliser use, greater use of bio-degradable pro-
ducts, switching to low-carbon energy sources etc.);
• making the polluter pay is more equitable:it is quite simply not fair that a few benefit from
resource use while society has to pay for the
resulting damage (see Box 7.1). This also supports
good governance and increases the credibility of
the regulatory system by giving a clear signal that
those causing damage are also responsible for
addressing it;
• applying the full cost recovery principle to the
user/polluter/emitter can set appropriate incentives
and reduce burdens on public budgets
(see Box 7.1);
• some instruments (e.g. taxes, fees and charges,
auctioned licences) can generate revenues for conservation (see also e.g. PES/REDD in
Chapter 5, Protected Areas in Chapter 8,
investment in natural capital in Chapter 9).
T E E B F o R N A T I o N A L A N D I N T E R N A T I o N A L P o L I C y M A K E R S - C h A P T E R 7 : P A G E 4
A D D R E S S I N G L O S S E S T H R O U G H R E G U L A T I O N A N D P R I C I N G
T E E B F o R N A T I o N A L A N D I N T E R N A T I o N A L P o L I C y M A K E R S - C h A P T E R 7 : P A G E 5
A D D R E S S I N G L O S S E S T H R O U G H R E G U L A T I O N A N D P R I C I N G
Box 7.1: Fundamental principles for incorporating costs of biodiversity loss
Together with equity and social considerations, three closely-related principles should guide the choice
and design of policy instruments:
The polluter pays principle (PPP) is anchored in the 1992 Rio Declaration on Environment and Develop-
ment (UNEP 2009a) and embedded in a growing number of national environmental policies (e.g. most
oECD countries and EU Member States). It requires environmental costs to be ‘internalised’ and reflected
in the price of goods and services. To this end, the polluter has to take measures to prevent or reduce
pollution and in some cases pay taxes or charges for pollution and compensate for pollution impacts. For
ecosystem degradation, this means that the polluter should pay directly for clean up and restoration costs
or pay a fine that would help offset damage costs.
The user/beneficiary pays principle is a variant of the PPP. Where an action provides a benefit e.g. use
of natural resources, recipients should pay for the cost of providing that benefit. This could be used to
argue that e.g. users of a clean beach should contribute towards beach cleaning expenses.
The full cost recovery principle provides that the full costs of environmental services should be recovered
from the entity benefiting from the service. There is a growing trend internationally for this principle to be
applied directly and explicitly to energy, electricity and water pricing which means that full costs are passed
on to consumers.
Source: Adapted from ten Brink et al. 2009
T E E B F o R N A T I o N A L A N D I N T E R N A T I o N A L P o L I C y M A K E R S - C h A P T E R 7 : P A G E 6
A D D R E S S I N G L O S S E S T H R O U G H R E G U L A T I O N A N D P R I C I N G
“It is bad policy to regulate every-thing... where things may better
regulate themselves and can be bet-ter promoted by private exertions;
but it is no less bad policy to let those things alone which can only be promoted by interfering social
power.”Friedrich List
German Economist (1789-1846)
7.2.1 IMPORTANCE OF A STRONG REGULATORY BASELINE
Regulation has long been – and still is – the most
widely used instrument for environmental protection. It
is used to establish protection objectives, reducepollution and hazardous events and trigger urgentenvironmental improvements.
REGULATING To AvoID DAMAGE:
ENvIRoNMENTAL STANDARDS 7.2 A clearly defined regulatory framework provides
orientation for the private sector. Regulation needs
to be conducive to business, compatible with commer-
cial activities and set a level playing field to encourage
capacity building, local training and compliance with
best professional standards (see TEEB D3 Report for
Business forthcoming).
A strong system of regulation and governance isalso essential for the establishment of market-based
policies such as trading schemes, biodiversity offsets
and banking (see 7.4). Regulation is the reference point
upon which market-based instruments can build and
needs to be underpinned by adequate monitoring and
enforcement arrangements (see 7.5).
Environmental regulation sets rules and standards
across a range of areas (see Box 7.2).
Box 7.2: Scope and flexibility of environmental regulation
As in many other fields of law, the regulatory toolkit includes a battery of prohibitions, restrictions, mandatory
requirements, standards and procedures that directly authorise or limit certain actions or impacts. The term
‘command-and-control’ is often used as a generic term for regulatory instruments promulgated by a
(government) authority (c.f. non-enforceable self-regulation and social norms).
There are three basic types of regulatory instruments for biodiversity and ecosystem services:
• regulation of emissions: usually involves emissions standards, ambient quality standards and technical
standards (e.g. Best Available Techniques (BAT)); performance standards (e.g. air quality management);
or management prescriptions for good practice (e.g. in agriculture);
• regulation of products set restrictions on the use of products (e.g. illegally logged timber, activities damaging
to endangered species etc.) or establishes production standards (certification, best practice codes, etc.);
• spatial planning involves regulation of land uses that have direct implications for ecosystem services or
habitats. Planning decisions in most countries are devolved to local or regional planning boards (see TEEB D2).
Designation and establishment of protected areas is a specific regulatory tool based on spatial planning
(see Chapter 8).
T E E B F o R N A T I o N A L A N D I N T E R N A T I o N A L P o L I C y M A K E R S - C h A P T E R 7 : P A G E 7
A D D R E S S I N G L O S S E S T H R O U G H R E G U L A T I O N A N D P R I C I N G
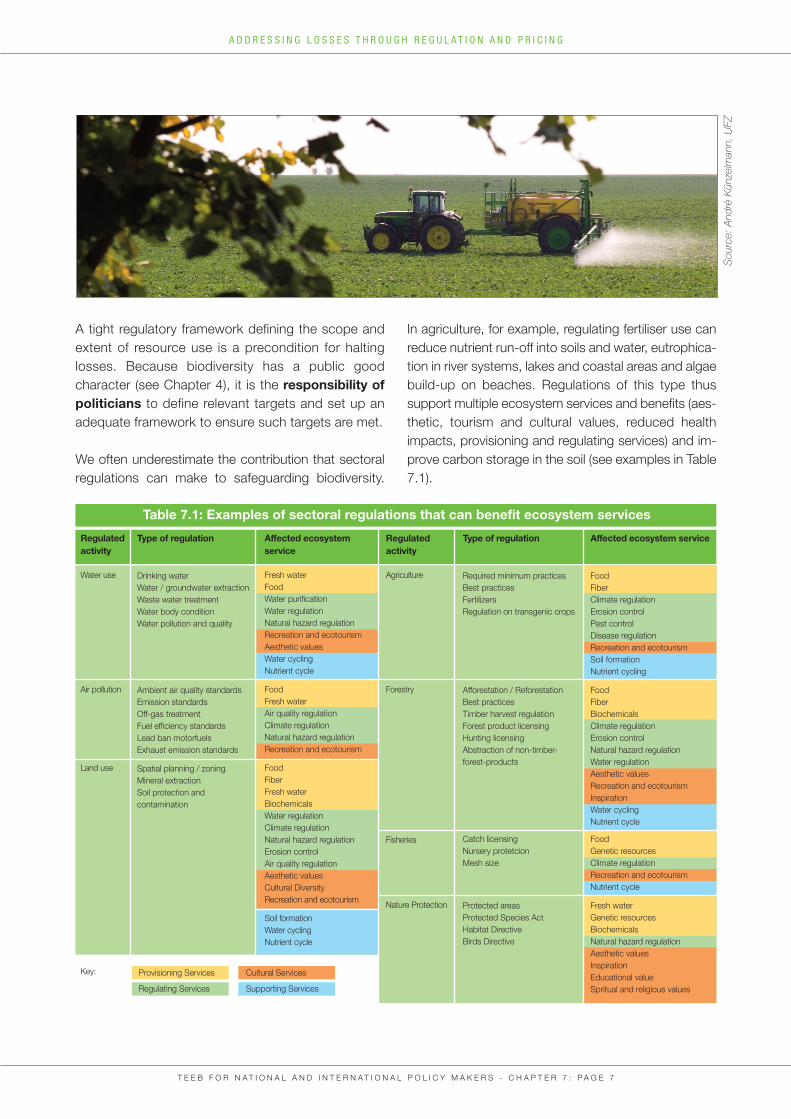
In agriculture, for example, regulating fertiliser use can
reduce nutrient run-off into soils and water, eutrophica-
tion in river systems, lakes and coastal areas and algae
build-up on beaches. Regulations of this type thus
support multiple ecosystem services and benefits (aes-
thetic, tourism and cultural values, reduced health
impacts, provisioning and regulating services) and im-
prove carbon storage in the soil (see examples in Table
7.1).
A tight regulatory framework defining the scope and
extent of resource use is a precondition for halting
losses. Because biodiversity has a public good
character (see Chapter 4), it is the responsibility ofpoliticians to define relevant targets and set up an
adequate framework to ensure such targets are met.
We often underestimate the contribution that sectoral
regulations can make to safeguarding biodiversity.
Table 7.1: Examples of sectoral regulations that can benefit ecosystem services
Regulated activity
Water use
Air pollution
Land use
Key:
Type of regulation
Drinking water
Water / groundwater extraction
Waste water treatment
Water body condition
Water pollution and quality
Ambient air quality standards
Emission standards
off-gas treatment
Fuel efficiency standards
Lead ban motorfuels
Exhaust emission standards
Spatial planning / zoning
Mineral extraction
Soil protection and
contamination
Regulatedactivity
Agriculture
Forestry
Fisheries
Nature Protection
Type of regulation
Required minimum practices
Best practices
Fertilizers
Regulation on transgenic crops
Afforestation / Reforestation
Best practices
Timber harvest regulation
Forest product licensing
hunting licensing
Abstraction of non-timber-
forest-products
Catch licensing
Nursery protetcion
Mesh size
Protected areas
Protected Species Act
habitat Directive
Birds Directive
Provisioning Services Cultural Services
Regulating Services Supporting Services
Affected ecosystem service
Fresh water
Food
Water purification
Water regulation
Natural hazard regulation
Recreation and ecotourism
Aesthetic values
Water cycling
Nutrient cycle
Food
Fresh water
Air quality regulation
Climate regulation
Natural hazard regulation
Recreation and ecotourism
Food
Fiber
Fresh water
Biochemicals
Water regulation
Climate regulation
Natural hazard regulation
Erosion control
Air quality regulation
Aesthetic values
Cultural Diversity
Recreation and ecotourism
Soil formation
Water cycling
Nutrient cycle
Affected ecosystem service
Food
Fiber
Climate regulation
Erosion control
Pest control
Disease regulation
Recreation and ecotourism
Soil formation
Nutrient cycling
Food
Fiber
Biochemicals
Climate regulation
Erosion control
Natural hazard regulation
Water regulation
Aesthetic values
Recreation and ecotourism
Inspiration
Water cycling
Nutrient cycle
Food
Genetic resources
Climate regulation
Recreation and ecotourism
Nutrient cycle
Fresh water
Genetic resources
Biochemicals
Natural hazard regulation
Aesthetic values
Inspiration
Educational value
Spritual and religious values
Source: André Künzelmann, UFZ
Regulation has already provided a catalyst for sig-nificant environmental improvements by reducing
the release of pollutants that threaten ecosystem
status and functions. Management of air quality, water
and soils all rely heavily on this type of regulation
(see Box 7.3). Chemicals regulation addresses risks
associated with producing, distributing and using
certain products or their compounds.
Where hazards to human health or the environ-ment are potentially high, strong interventions arecalled for. In practice, strict regulation is often reactive
and adopted in response to a catastrophe (e.g. US oil
Pollution Act 1990 adopted in response to the Exxon
valdez oil spill, see Chapter 4).
Regulation is not in itself expensive for publicbudgets but carries administrative costs in terms of
monitoring and enforcement (see 7.5). Costs of imple-
mentation and compliance fall primarily on private
resource users who must finance abatement or equi-
valent measures to reach the required standard.
Regulation can also require monitoring activities (e.g.
waste water effluent or river water quality downstream),
at cost to the emitting source. This is consistent with
the polluter pays principle.
T E E B F o R N A T I o N A L A N D I N T E R N A T I o N A L P o L I C y M A K E R S - C h A P T E R 7 : P A G E 8
A D D R E S S I N G L O S S E S T H R O U G H R E G U L A T I O N A N D P R I C I N G
Decision-makers and administrators already havefar-reaching experience with regulation. Where
institutional capacity for implementing regulations is
already set up, it is often easier to expand regulation
than to set up market-based approaches. Emission
limits (e.g. for power stations emissions to air, quality of
effluent discharge from industrial plant) can be tightened
over time as it becomes clear that there is an environ-
mental or health need. BAT standards lay down detailed
prescriptions on type of technology, requirements of a
particular technical solution, monitoring etc. Where such
standards are available, it may be easiest to adapt them
to local conditions, offering opportunities for learning
and applying regulatory experience from other countries.
As noted, regulation forms the baseline and catalyst for additional complementary measures.
Emissions trading instruments, for example, emerged
against a background of air quality regulatory standards
in the USA (hansjürgens 2000). The first generation of
instruments in the 1970s (i.e. netting, offset, bubble and
banking policy) were based on credits that could be
created if abatement went beyond a certain standard.
only additional emissions ‘saved’ by over-compliance
could be used for compensation or trading. Similar rules
apply for biodiversity offsets and/or banking (see 7.3).
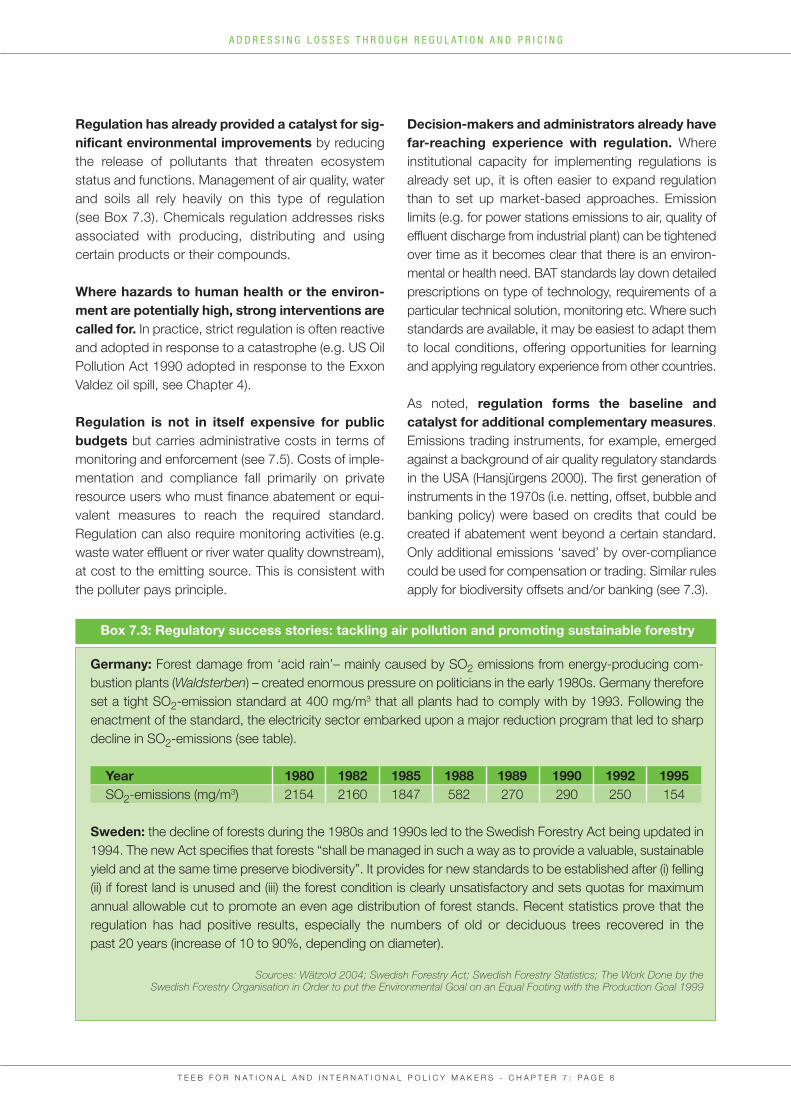
Box 7.3: Regulatory success stories: tackling air pollution and promoting sustainable forestry
Germany: Forest damage from ‘acid rain’– mainly caused by So2 emissions from energy-producing com-
bustion plants (Waldsterben) – created enormous pressure on politicians in the early 1980s. Germany therefore
set a tight So2-emission standard at 400 mg/m3 that all plants had to comply with by 1993. Following the
enactment of the standard, the electricity sector embarked upon a major reduction program that led to sharp
decline in So2-emissions (see table).
Year 1980 1982 1985 1988 1989 1990 1992 1995So2-emissions (mg/m3) 2154 2160 1847 582 270 290 250 154
Sweden: the decline of forests during the 1980s and 1990s led to the Swedish Forestry Act being updated in
1994. The new Act specifies that forests “shall be managed in such a way as to provide a valuable, sustainable
yield and at the same time preserve biodiversity”. It provides for new standards to be established after (i) felling
(ii) if forest land is unused and (iii) the forest condition is clearly unsatisfactory and sets quotas for maximum
annual allowable cut to promote an even age distribution of forest stands. Recent statistics prove that the
regulation has had positive results, especially the numbers of old or deciduous trees recovered in the
past 20 years (increase of 10 to 90%, depending on diameter).
Sources: Wätzold 2004; Swedish Forestry Act; Swedish Forestry Statistics; The Work Done by the Swedish Forestry Organisation in Order to put the Environmental Goal on an Equal Footing with the Production Goal 1999
T E E B F o R N A T I o N A L A N D I N T E R N A T I o N A L P o L I C y M A K E R S - C h A P T E R 7 : P A G E 9
A D D R E S S I N G L O S S E S T H R O U G H R E G U L A T I O N A N D P R I C I N G
7.2.2 RULES FOR ENVIRONMENTAL LIABILITY
Environmental liability is an overarching term –covering prevention and remedial action – forthe process by which responsibility for the costof damage is explicitly assigned to those whocause that damage. Liability rules are based on the
polluter pays principle and provide economic incen-
tives to developers/users to incorporate the risk of a
potential hazard and the value of remediation.
Environmental liability regimes operate by reference to
regulatory frameworks that set standards for resource
use. The basic rule is that those who damage the
environment beyond a defined limit have to pay for
necessary clean-up and/or restoration. Depending on
the regime, they may also have to provide for the
continued losses of ecosystem services pending res-
toration (or in perpetuity if restoration is not possible).
Earlier systems had an essentially pollution-based
focus but several laws now address broader environ-
mental damage in recognition of its public good
character. Box 7.4 outlines the two main types of
liability.
Liability rules require resource users to pay for the im-
pacts of potentially hazardous activities. The potentialpolluter therefore balances risks and costs and
decides what measures are appropriate to avoid a
certain risk. options include abatement (e.g. through
better filters), recycling, less hazardous production
techniques, rigorous risk management procedures and
standards (e.g. international environmental manage-
ment ISo standards and the European EMAS) and
insuring against potential claims if insurance is
available. Liability rules provide economic incen-tives to reduce risk and can directly stimulate technical improvements.
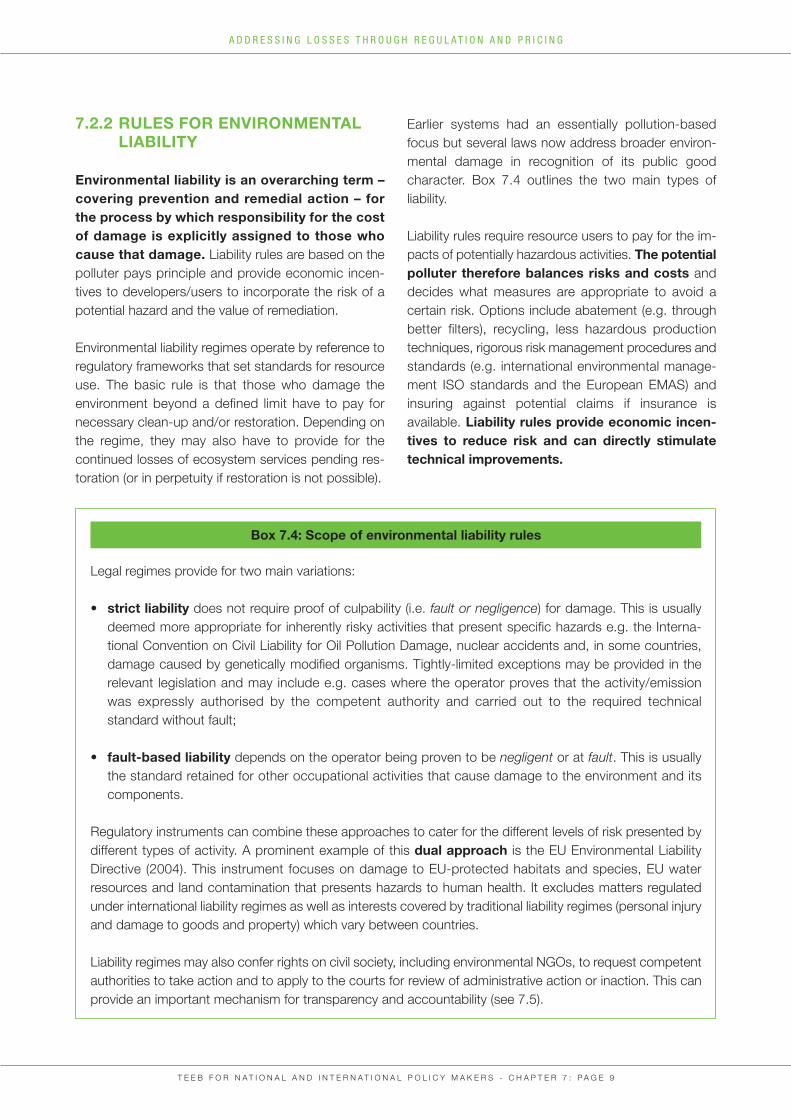
Box 7.4: Scope of environmental liability rules
Legal regimes provide for two main variations:
• strict liability does not require proof of culpability (i.e. fault or negligence) for damage. This is usually
deemed more appropriate for inherently risky activities that present specific hazards e.g. the Interna-
tional Convention on Civil Liability for oil Pollution Damage, nuclear accidents and, in some countries,
damage caused by genetically modified organisms. Tightly-limited exceptions may be provided in the
relevant legislation and may include e.g. cases where the operator proves that the activity/emission
was expressly authorised by the competent authority and carried out to the required technical
standard without fault;
• fault-based liability depends on the operator being proven to be negligent or at fault. This is usually
the standard retained for other occupational activities that cause damage to the environment and its
components.
Regulatory instruments can combine these approaches to cater for the different levels of risk presented by
different types of activity. A prominent example of this dual approach is the EU Environmental Liability
Directive (2004). This instrument focuses on damage to EU-protected habitats and species, EU water
resources and land contamination that presents hazards to human health. It excludes matters regulated
under international liability regimes as well as interests covered by traditional liability regimes (personal injury
and damage to goods and property) which vary between countries.
Liability regimes may also confer rights on civil society, including environmental NGos, to request competent
authorities to take action and to apply to the courts for review of administrative action or inaction. This can
provide an important mechanism for transparency and accountability (see 7.5).
Economic information can help introduce and implement liability rules by reducing uncertainties
with respect to expected costs of hazardous risks and
assisting resource users in defining abatement strate-
gies. It can also help insurance companies not only to
determine financial risks and product premiums but
also to develop new products.
Liability regimes face some major constraints. Pro-blems often arise when the operator responsiblefor damage caused by accidents cannot be traced. This results in ‘orphan liability’ cases or sites
affected by the accident. other problems relate to da-
mage generated by repetitive actions and negligence
that lead to significant cumulative damage (e.g. diffuse
pollution). In such cases, transaction costs for
assessing natural resource damage can be substantial.
The same is true for the task of apportioning respon-
sibility between individual polluters: conventional
liability rules may not apply if e.g. the individual
polluter’s share of the damage is not enough to trigger
liability. In such cases, it often makes sense for the
state to provide directly for the restoration of the
damage (see Chapter 9).
7.2.3 USING ECONOMIC ANALYSIS IN STANDARD SETTING
Economic valuation of ecosystem services canhelp to build up and extend a regulatory frame-work for biodiversity conservation. It can sup-port arguments in favour of policies to avoid netlosses and, by informing better regulatory stan-dards, increase their credibility and acceptance.
Cost-benefit considerations were often not in-cluded, or only implicitly, when regulatory instru-ments were initially designed. This balancing act
was rarely required because early regulations focused
on preventing hazardous situations i.e. urgent con-
cerns of human life and health. This is still the case for
some environmental fields with respect to well-known
hazards, e.g. carcinogenic substances, ambient air
quality standards for particulates.
The urgency of including costs and benefits in deci-
sion-making has increased in recent years for several
reasons:
• many countries have an unseen potential for regulation. Where institutions are weak and
administrative capacities underdeveloped, identi-
fying and valuing ecosystem services can feed
information on development constraints and
opportunities into national and local planning
process. This can help raise awareness of the
need for better regulation (see Box 7.5);
• many countries now apply the precautionary
principle in relevant policy fields even where
environmental risks are not hazardous to human
life. Balancing costs and benefits is even more important for precautionary policies than for prevention of known hazards i.e. to
provide justification for possible regulation.
Stricter controls are often only accepted by
stakeholders and the general public if it is clearly
shown that the benefits outweigh the costs.
T E E B F o R N A T I o N A L A N D I N T E R N A T I o N A L P o L I C y M A K E R S - C h A P T E R 7 : P A G E 1 0
A D D R E S S I N G L O S S E S T H R O U G H R E G U L A T I O N A N D P R I C I N G
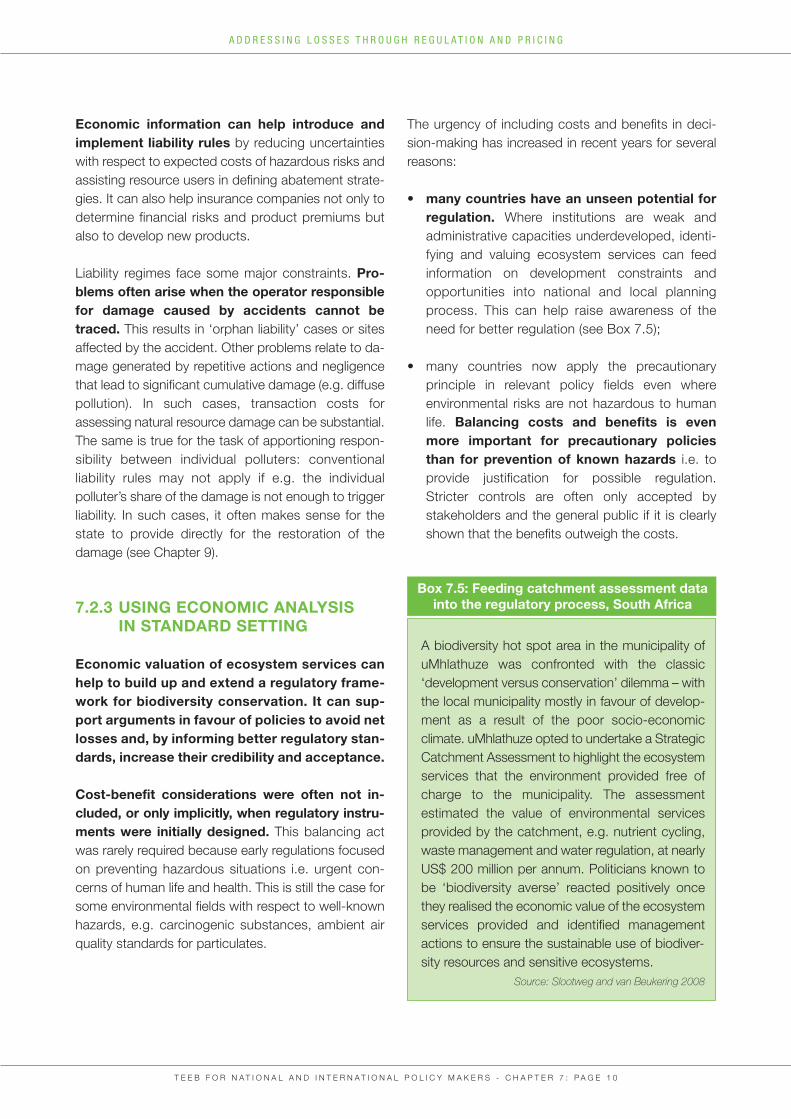
Box 7.5: Feeding catchment assessment datainto the regulatory process, South Africa
A biodiversity hot spot area in the municipality of
uMhlathuze was confronted with the classic
‘development versus conservation’ dilemma – with
the local municipality mostly in favour of develop-
ment as a result of the poor socio-economic
climate. uMhlathuze opted to undertake a Strategic
Catchment Assessment to highlight the ecosystem
services that the environment provided free of
charge to the municipality. The assessment
estimated the value of environmental services
provided by the catchment, e.g. nutrient cycling,
waste management and water regulation, at nearly
US$ 200 million per annum. Politicians known to
be ‘biodiversity averse’ reacted positively once
they realised the economic value of the ecosystem
services provided and identified management
actions to ensure the sustainable use of biodiver-
sity resources and sensitive ecosystems.
Source: Slootweg and van Beukering 2008
T E E B F o R N A T I o N A L A N D I N T E R N A T I o N A L P o L I C y M A K E R S - C h A P T E R 7 : P A G E 1 1
A D D R E S S I N G L O S S E S T H R O U G H R E G U L A T I O N A N D P R I C I N G
7.3.1 WHY DO WE NEED COMPENSATION INSTRUMENTS?
Developments linked to economic growth often lead
to habitat loss and degradation, pollution, disturbance
and over-exploitation. These impacts can often be
avoided or substantially reduced through measures
at the design stage (see Chapter 4) and during ope-
and adaptive management).
Even with avoidance and other measures, it is in-evi-table that some developments will result in
CoMPENSATING FoR LoSSES:
oFFSETS AND BIoDIvERSITy BANKS7.3 significant residual impacts. Compensating forsuch impacts is essential to avoid ongoing cumu-
lative losses of bio-diversity and ecosystem services.
offsets and biodiversity banks are the main instru-
ments for this purpose. They are suited for use in
habitats that can be restored within a reasonable time-
frame and/or may benefit from additional protection
(see Box 7.6). offsets can play a key role in delivering
‘no net loss’ policies (Bean et al. 2008). They are
implicitly required as part of an overall policy package
where biodiversity policy targets aim to halt the loss
of biodiversity (such as in the EU).
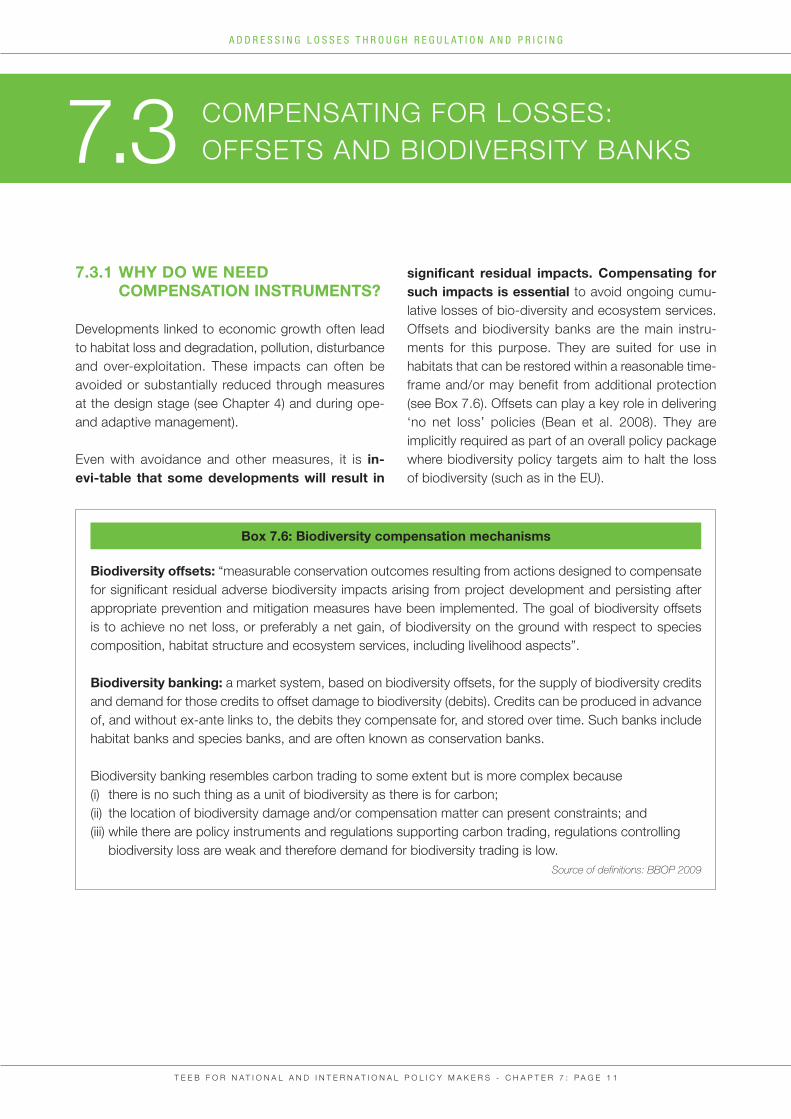
Box 7.6: Biodiversity compensation mechanisms
Biodiversity offsets: “measurable conservation outcomes resulting from actions designed to compensate
for significant residual adverse biodiversity impacts arising from project development and persisting after
appropriate prevention and mitigation measures have been implemented. The goal of biodiversity offsets
is to achieve no net loss, or preferably a net gain, of biodiversity on the ground with respect to species
composition, habitat structure and ecosystem services, including livelihood aspects”.
Biodiversity banking: a market system, based on biodiversity offsets, for the supply of biodiversity credits
and demand for those credits to offset damage to biodiversity (debits). Credits can be produced in advance
of, and without ex-ante links to, the debits they compensate for, and stored over time. Such banks include
habitat banks and species banks, and are often known as conservation banks.
Biodiversity banking resembles carbon trading to some extent but is more complex because
(i) there is no such thing as a unit of biodiversity as there is for carbon;
(ii) the location of biodiversity damage and/or compensation matter can present constraints; and
(iii) while there are policy instruments and regulations supporting carbon trading, regulations controlling
biodiversity loss are weak and therefore demand for biodiversity trading is low.
Source of definitions: BBOP 2009
Offsets and habitat banking work by triggeringactions that provide measurable benefits for biodiversity (credits) comparable to the damage(debits). This equivalence can involve the same kind
of habitat or species (like-for-like) or different kinds of
habitats and species of equal or higher importance or
value.
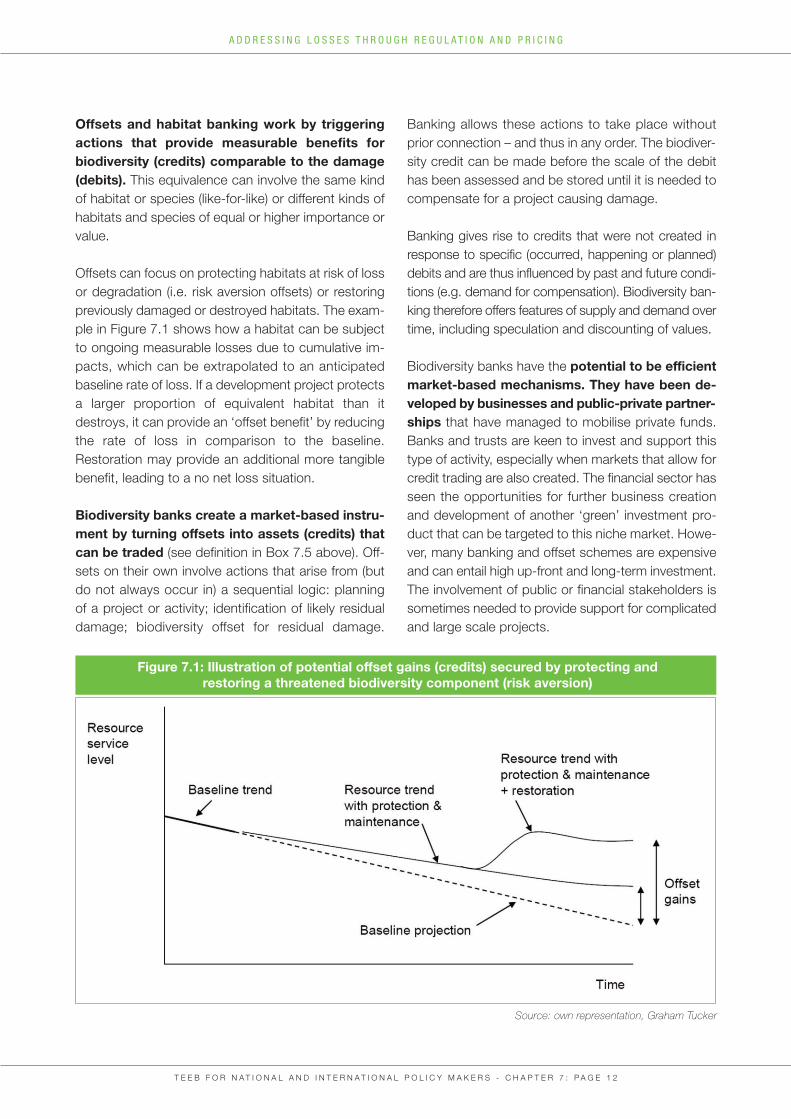
offsets can focus on protecting habitats at risk of loss
or degradation (i.e. risk aversion offsets) or restoring
previously damaged or destroyed habitats. The exam-
ple in Figure 7.1 shows how a habitat can be subject
to ongoing measurable losses due to cumulative im-
pacts, which can be extrapolated to an anticipated
baseline rate of loss. If a development project protects
a larger proportion of equivalent habitat than it
destroys, it can provide an ‘offset benefit’ by reducing
the rate of loss in comparison to the baseline.
Restoration may provide an additional more tangible
benefit, leading to a no net loss situation.
Biodiversity banks create a market-based instru-ment by turning offsets into assets (credits) thatcan be traded (see definition in Box 7.5 above). off-
sets on their own involve actions that arise from (but
do not always occur in) a sequential logic: planning
of a project or activity; identification of likely residual
damage; biodiversity offset for residual damage.
Banking allows these actions to take place without
prior connection – and thus in any order. The biodiver-
sity credit can be made before the scale of the debit
has been assessed and be stored until it is needed to
compensate for a project causing damage.
Banking gives rise to credits that were not created in
response to specific (occurred, happening or planned)
debits and are thus influenced by past and future condi-
tions (e.g. demand for compensation). Biodiversity ban-
king therefore offers features of supply and demand over
time, including speculation and discounting of values.
Biodiversity banks have the potential to be efficientmarket-based mechanisms. They have been de-veloped by businesses and public-private partner-ships that have managed to mobilise private funds.
Banks and trusts are keen to invest and support this
type of activity, especially when markets that allow for
credit trading are also created. The financial sector has
seen the opportunities for further business creation
and development of another ‘green’ investment pro-
duct that can be targeted to this niche market. howe-
ver, many banking and offset schemes are expensive
and can entail high up-front and long-term investment.
The involvement of public or financial stakeholders is
sometimes needed to provide support for complicated
and large scale projects.
T E E B F o R N A T I o N A L A N D I N T E R N A T I o N A L P o L I C y M A K E R S - C h A P T E R 7 : P A G E 1 2
A D D R E S S I N G L O S S E S T H R O U G H R E G U L A T I O N A N D P R I C I N G
Figure 7.1: Illustration of potential offset gains (credits) secured by protecting and restoring a threatened biodiversity component (risk aversion)
Source: own representation, Graham Tucker
The following drivers create demand for compensation
mechanisms:
• clear policy requirements for no net loss or a net gain of biodiversity;
• legislation that requires compensation for
residual impacts to achieve no net loss or a net
gain of biodiversity (e.g. as for Natura 2000 sites
under the EU habitats Directive). Such measures
are normally strictly regulated and must be pro-
ject-specific offsets that are like-for-like, usually
within or close to the project development site;
• planning and impact assessment procedures(like the EIA and SEA Directives in Europe) that
create a requirement for offsets by identifying
significant residual adverse effects through
application of the mitigation hierarchy. Impact
assessments are much more effective when
implemented within a clear policy framework
requiring no net loss or a net gain: this places
the onus on proponents of developments to
demonstrate how such a result will be achieved;
• commercial considerations (e.g. management
of business risks and liabilities; access to invest-
ments; accreditation requirements; public relations;
corporate social responsibility goals that encourage
‘voluntary’ compensation measures). For example,
the mining company Rio Tinto uses offsets to
compensate for unavoidable residual impacts and
thereby meet its “aim to have a net positive impact
on biodiversity” (Rio Tinto 2004).
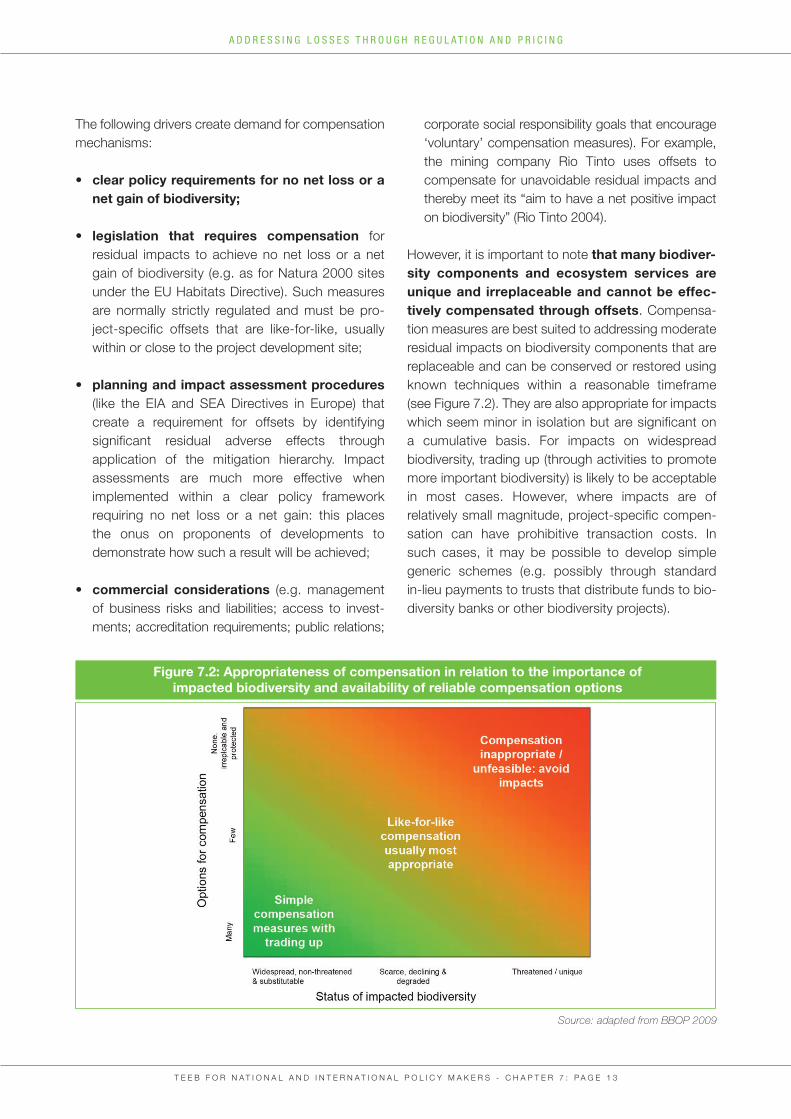
however, it is important to note that many biodiver-sity components and ecosystem services are unique and irreplaceable and cannot be effec-tively compensated through offsets. Compensa-
tion measures are best suited to addressing moderate
residual impacts on biodiversity components that are
replaceable and can be conserved or restored using
known techniques within a reasonable timeframe
(see Figure 7.2). They are also appropriate for impacts
which seem minor in isolation but are significant on
a cumulative basis. For impacts on widespread
biodiversity, trading up (through activities to promote
more important biodiversity) is likely to be acceptable
in most cases. however, where impacts are of
relatively small magnitude, project-specific compen-
sation can have prohibitive transaction costs. In
such cases, it may be possible to develop simple
generic schemes (e.g. possibly through standard
in-lieu payments to trusts that distribute funds to bio-
diversity banks or other biodiversity projects).
T E E B F o R N A T I o N A L A N D I N T E R N A T I o N A L P o L I C y M A K E R S - C h A P T E R 7 : P A G E 1 3
A D D R E S S I N G L O S S E S T H R O U G H R E G U L A T I O N A N D P R I C I N G
Figure 7.2: Appropriateness of compensation in relation to the importance of impacted biodiversity and availability of reliable compensation options
Source: adapted from BBOP 2009
PoTENTIAL BENEFITS oF oFFSETS ANDBIoDIvERSITy BANKING
Well-designed biodiversity offsets and banks canprovide additional benefits beyond the achieve-ment of no net loss from individual developments.
Net biodiversity gains are most feasible in regions
where past impacts have resulted in landscapes do-
minated by artificial or cultural habitats with relatively
low biodiversity and where remaining areas of semi-na-
tural or natural habitats are small, fragmented and de-
graded. In such cases, offsets can:
• balance development and conservation, while
delivering more conservation efforts than the
‘status quo’;
• introduce additional finance for conservation and
mainstream biodiversity into business and regional
planning;
• reverse some past losses of restorable threatened
habitats and increase the size of remaining small
habitat patches, thereby increasing the viability of
species populations and resilience to pressures
such as climate change;
• reduce habitat fragmentation by re-creating
habitats in appropriate locations that restore
connectivity;
• secure more reliable biodiversity outcomes than
mitigation measures, especially if biodiversity banks
are established in advance;
• prove more cost-effective than avoidance and
mitigation measures, especially where banks
benefit from economies of scale and competitive
market forces. Cost reductions may increase the
likelihood that measures are implemented beyond
strict legal requirements;
• provide a mechanism that enables the cumulative
impacts of low-level impacts to be addressed in a
cost-effective and practical manner.
CoNSTRAINTS AND PoTENTIAL RISKS oFoFFSETS AND BIoDIvERSITy BANKING
Significant constraints on offsets and banks need to
be considered to avoid risks to biodiversity if compen-
sation measures are inappropriately applied. Probably
the most fundamental constraint is that such measures
must provide long-term added value (i.e. not just
benefits that would have occurred without new ac-
tions). Measures must also be based on outcomes
going beyond those under existing/foreseen policy and
legislative requirements.
In some situations (see Figure 7.1) significant benefits
may be obtained by stopping ongoing degradation and
avoiding losses from e.g. agricultural improvement, de-
forestation, wetland drainage and pollution. This can
be done through by entering into agreements with in-
dividuals (e.g. contracts or covenants) who give up the
right to convert habitat in return for payment or other
benefits. however, offsets of this kind can only deliver
benefits where there are significant areas of remaining
habitat that meet three conditions:
• worth maintaining;
• unprotected and likely to remain so in the future
(to ensure additionality);
• subject to significant and predictable levels of
loss or degradation.
In practice, options for risk aversion compensation may
therefore be limited in areas with already high levels of
protection for important habitats. Furthermore, even
when protection of one area of habitat is successful,
this can simply lead to the threat being displaced to
another area, resulting in no impact on the overall rate
of loss (often referred to as ‘leakage’).
Given these constraints, many offsets and biodi-versity banks focus instead on habitat restorationor re-creation (see Chapter 9). This requires proposed
offsets to provide a high level of certainty that their
intended conservation outcomes will be achieved (or
at least that they are high compared to alternative
mitigation measures). In practice, the creation or res-
toration of many habitats is extremely difficult, parti-
cularly natural and ancient habitats that have develo-
ped over thousands of years.
Another important principle is that reliability of com-pensation outcomes should increase in relation tothe importance of the habitat/species affected(Figure 7.2). Stringent avoidance and mitigation
measures should be taken to avoid residual impacts
on very rare or otherwise valuable habitats, where
these are considered more reliable than restoration or
other offset measures.
T E E B F o R N A T I o N A L A N D I N T E R N A T I o N A L P o L I C y M A K E R S - C h A P T E R 7 : P A G E 1 4
A D D R E S S I N G L O S S E S T H R O U G H R E G U L A T I O N A N D P R I C I N G
In this respect, biodiversity banks have a distinct ad-
vantage if they store credits (restored or enhanced ha-
bitats) in advance of possible impacts: this reduces
uncertainty and concerns over the feasibility and likely
quality of compensation, even if some long-term un-
certainty remains. however, the commercial risks and
long timescales involved in creating many habitat
banks are likely to restrict their establishment and the
supply of credits.
This summary again highlights the need for a strong
regulatory baseline to establish policies for biodiversity
offsets and banking systems. Without this, there are
significant risks that project proponents will use offsets
to avoid other more costly measures and project
delays. Proponents have a financial incentive to
underestimate potential impacts, overestimate the
reliability and benefits of offsets (or other mitigation
measures if these have lower costs) and avoid im-
plementation of agreed measures. It is therefore
critical to develop offset and habitat banking systems
alongside appropriate regulation and adequate ad-
ministrative capacities. A robust regulatory framework
makes it possible to ensure that biodiversity impacts
by programmes or projects are properly assessed and
that appropriate compensation measures are properly
implemented, monitored and managed for at least as
long as the period of residual impacts; which often
means in perpetuity.
7.3.2 WAYS TO MAXIMISE BIO-DIVERSITY BENEFITS AND MINIMISE RISKS
The potential benefits and risks of offsets and bio-
diversity banking have been widely recognised (e.g.
Bean et al. 2008; Carroll et al. 2007; ten Kate et al.
2004). The Biodiversity and Business offsets
Programme (BBoP) has developed a set of design
principles in consultation with stakeholders (see most
recent version in Box 7.7).
T E E B F o R N A T I o N A L A N D I N T E R N A T I o N A L P o L I C y M A K E R S - C h A P T E R 7 : P A G E 1 5
A D D R E S S I N G L O S S E S T H R O U G H R E G U L A T I O N A N D P R I C I N G
Source: Jutta Luft, UFZ
T E E B F o R N A T I o N A L A N D I N T E R N A T I o N A L P o L I C y M A K E R S - C h A P T E R 7 : P A G E 1 6
A D D R E S S I N G L O S S E S T H R O U G H R E G U L A T I O N A N D P R I C I N G
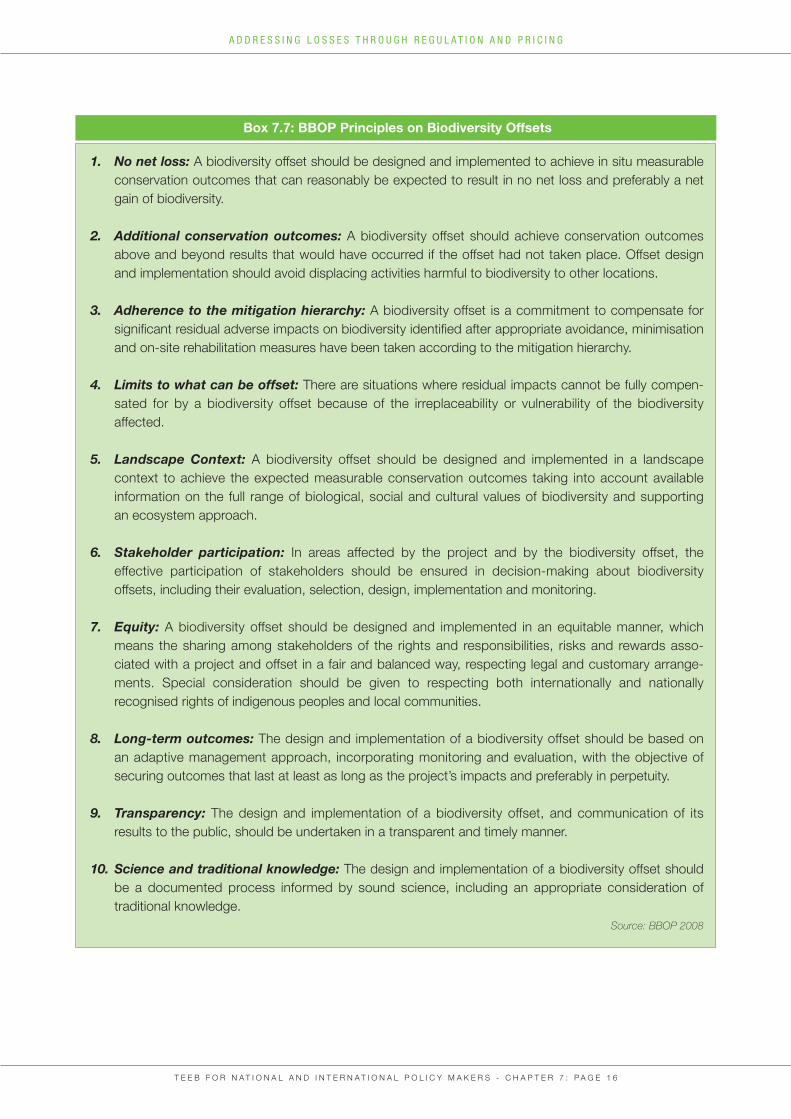
Box 7.7: BBOP Principles on Biodiversity Offsets
1. No net loss: A biodiversity offset should be designed and implemented to achieve in situ measurable
conservation outcomes that can reasonably be expected to result in no net loss and preferably a net
gain of biodiversity.
2. Additional conservation outcomes: A biodiversity offset should achieve conservation outcomes
above and beyond results that would have occurred if the offset had not taken place. offset design
and implementation should avoid displacing activities harmful to biodiversity to other locations.
3. Adherence to the mitigation hierarchy: A biodiversity offset is a commitment to compensate for
significant residual adverse impacts on biodiversity identified after appropriate avoidance, minimisation
and on-site rehabilitation measures have been taken according to the mitigation hierarchy.
4. Limits to what can be offset: There are situations where residual impacts cannot be fully compen-
sated for by a biodiversity offset because of the irreplaceability or vulnerability of the biodiversity
affected.
5. Landscape Context: A biodiversity offset should be designed and implemented in a landscape
context to achieve the expected measurable conservation outcomes taking into account available
information on the full range of biological, social and cultural values of biodiversity and supporting
an ecosystem approach.
6. Stakeholder participation: In areas affected by the project and by the biodiversity offset, the
effective participation of stakeholders should be ensured in decision-making about biodiversity
offsets, including their evaluation, selection, design, implementation and monitoring.
7. Equity: A biodiversity offset should be designed and implemented in an equitable manner, which
means the sharing among stakeholders of the rights and responsibilities, risks and rewards asso-
ciated with a project and offset in a fair and balanced way, respecting legal and customary arrange-
ments. Special consideration should be given to respecting both internationally and nationally
recognised rights of indigenous peoples and local communities.
8. Long-term outcomes: The design and implementation of a biodiversity offset should be based on
an adaptive management approach, incorporating monitoring and evaluation, with the objective of
securing outcomes that last at least as long as the project’s impacts and preferably in perpetuity.
9. Transparency: The design and implementation of a biodiversity offset, and communication of its
results to the public, should be undertaken in a transparent and timely manner.
10. Science and traditional knowledge: The design and implementation of a biodiversity offset should
be a documented process informed by sound science, including an appropriate consideration of
traditional knowledge.
Source: BBOP 2008
T E E B F o R N A T I o N A L A N D I N T E R N A T I o N A L P o L I C y M A K E R S - C h A P T E R 7 : P A G E 1 7
A D D R E S S I N G L O S S E S T H R O U G H R E G U L A T I O N A N D P R I C I N G
These principles are generally applicable to allcompensation measures, but care needs to be given
to their interpretation and application. In particular,
Principle 3 is often misinterpreted. A key objective of
its mitigation hierarchy is to reduce the risk of biodiver-
sity loss from developers taking easy least-cost
actions, i.e. using offsets and biodiversity banking as
a ‘licence to trash’. on the other hand, authorities
insisting on extremely expensive mitigation measures
(e.g. tunnels or viaducts) may not obtain good value
for money. It is also clearly inappropriate to expect
project proponents to take preventive measures for
low-level impacts if much greater benefits could be
obtained by simple compensation measures that trade
up to provide higher biodiversity benefits.
The term ‘appropriate’ is therefore central to the miti-
gation hierarchy principle. The specific aim should be
to compare the conservation benefits of the potential mitigation and compensation measuresto identify the combination that delivers the hig-hest reliable benefit. The question of reliability must
be considered in accordance with the precautionary
principle. Uncertainty can affect all types of mitigation
and compensation measures depending on the
circumstances: some mitigation measures may be
more reliable than compensation measures or vice
versa. The weight given to the reliability of measures
should increase with the importance and irreplaceabi-
lity of the habitats and species that may be impacted.
For biodiversity of high conservation importance,
measures should therefore focus on avoidance actions
(assuming they are most likely to be reliable) rather than
risky compensation options.
An advantage of established biodiversity banks, noted
above, is to reduce uncertainty over the amount and
quality of compensation that will be realised, given that
credits already exist and can be measured directly in
terms of their ecological value and ecosystem benefits.
however, it is still important to assess the ongoing
value of the benefits (e.g. in relation to climate change
or other external pressures) as well as their additio-
nality.
7.3.3 EXPERIENCE OF COMPENSATION TO DATE
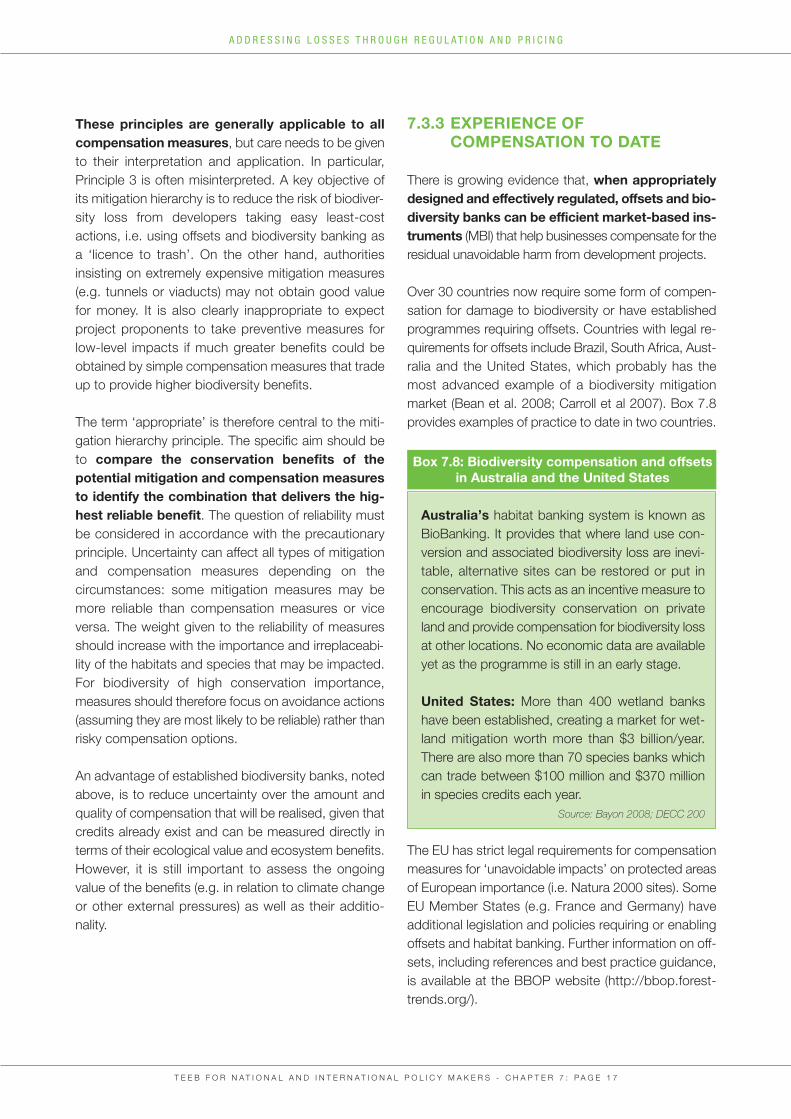
There is growing evidence that, when appropriately designed and effectively regulated, offsets and bio-diversity banks can be efficient market-based ins-truments (MBI) that help businesses compensate for the
residual unavoidable harm from development projects.
over 30 countries now require some form of compen-
sation for damage to biodiversity or have established
programmes requiring offsets. Countries with legal re-
quirements for offsets include Brazil, South Africa, Aust-
ralia and the United States, which probably has the
most advanced example of a biodiversity mitigation
market (Bean et al. 2008; Carroll et al 2007). Box 7.8
provides examples of practice to date in two countries.
The EU has strict legal requirements for compensation
measures for ‘unavoidable impacts’ on protected areas
of European importance (i.e. Natura 2000 sites). Some
EU Member States (e.g. France and Germany) have
additional legislation and policies requiring or enabling
offsets and habitat banking. Further information on off-
sets, including references and best practice guidance,
is available at the BBoP website (http://bbop.forest-
trends.org/).
Box 7.8: Biodiversity compensation and offsetsin Australia and the United States
Australia’s habitat banking system is known as
BioBanking. It provides that where land use con-
version and associated biodiversity loss are inevi-
table, alternative sites can be restored or put in
conservation. This acts as an incentive measure to
encourage biodiversity conservation on private
land and provide compensation for biodiversity loss
at other locations. No economic data are available
yet as the programme is still in an early stage.
United States: More than 400 wetland banks
have been established, creating a market for wet-
land mitigation worth more than $3 billion/year.
There are also more than 70 species banks which
can trade between $100 million and $370 million
in species credits each year.
Source: Bayon 2008; DECC 200
T E E B F o R N A T I o N A L A N D I N T E R N A T I o N A L P o L I C y M A K E R S - C h A P T E R 7 : P A G E 1 8
A D D R E S S I N G L O S S E S T H R O U G H R E G U L A T I O N A N D P R I C I N G
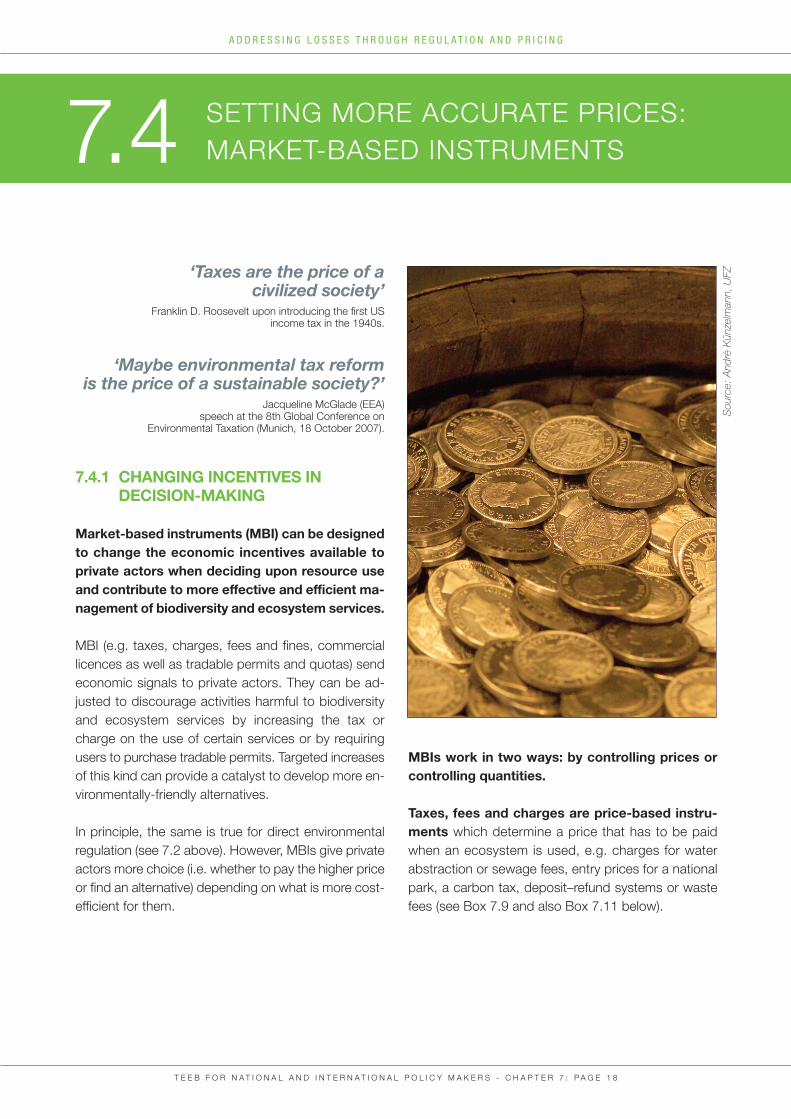
‘Taxes are the price of a civilized society’
Franklin D. Roosevelt upon introducing the first US income tax in the 1940s.
‘Maybe environmental tax reform is the price of a sustainable society?’
Jacqueline McGlade (EEA)speech at the 8th Global Conference on
Environmental Taxation (Munich, 18 october 2007).
7.4.1 CHANGING INCENTIVES IN DECISION-MAKING
Market-based instruments (MBI) can be designedto change the economic incentives available toprivate actors when deciding upon resource useand contribute to more effective and efficient ma-nagement of biodiversity and ecosystem services.
MBI (e.g. taxes, charges, fees and fines, commercial
licences as well as tradable permits and quotas) send
economic signals to private actors. They can be ad-
justed to discourage activities harmful to biodiversity
and ecosystem services by increasing the tax or
charge on the use of certain services or by requiring
users to purchase tradable permits. Targeted increases
of this kind can provide a catalyst to develop more en-
vironmentally-friendly alternatives.
In principle, the same is true for direct environmental
regulation (see 7.2 above). however, MBIs give private
actors more choice (i.e. whether to pay the higher price
or find an alternative) depending on what is more cost-
efficient for them.
SETTING MoRE ACCURATE PRICES:
MARKET-BASED INSTRUMENTS 7.4
MBIs work in two ways: by controlling prices orcontrolling quantities.
Taxes, fees and charges are price-based instru-ments which determine a price that has to be paid
when an ecosystem is used, e.g. charges for water
abstraction or sewage fees, entry prices for a national
park, a carbon tax, deposit–refund systems or waste
fees (see Box 7.9 and also Box 7.11 below).
Source: André Künzelmann, UFZ
Tradable permits schemes are quantity-based in-struments that restrict the absolute extent for using a
resource. They create an artificial market for a resource
by:
• determining the number of rights to use a resource
(e.g. tons of timber to be cut per year);
• allocating the rights (e.g. to cut one tonne of timber)
to the users (e.g. logging companies or local land-
holders) via auction or free of charge; and
• facilitating trading of rights between potential users
(e.g. between different logging companies or the
sale of logging rights from local landholders to
commercial loggers).
The permit price is set by supply and demand. The
best-known example of permit trading is to control air
pollution (e.g. Co2 or So2) but the concept has been
successfully adapted to a range of resources and
goods e.g. to manage fish stocks (see Box 7.10),
regulate water abstraction (see Box 7.12) or limit urban
sprawl and preserve open space (see Box 7.14).
Further applications are being discussed, notably
forest carbon trading (see Chapter 5 for the REDD-Plus
mechanism), water quality trading or habitat trading
(see hansjürgens et al. forthcoming).
T E E B F o R N A T I o N A L A N D I N T E R N A T I o N A L P o L I C y M A K E R S - C h A P T E R 7 : P A G E 1 9
A D D R E S S I N G L O S S E S T H R O U G H R E G U L A T I O N A N D P R I C I N G
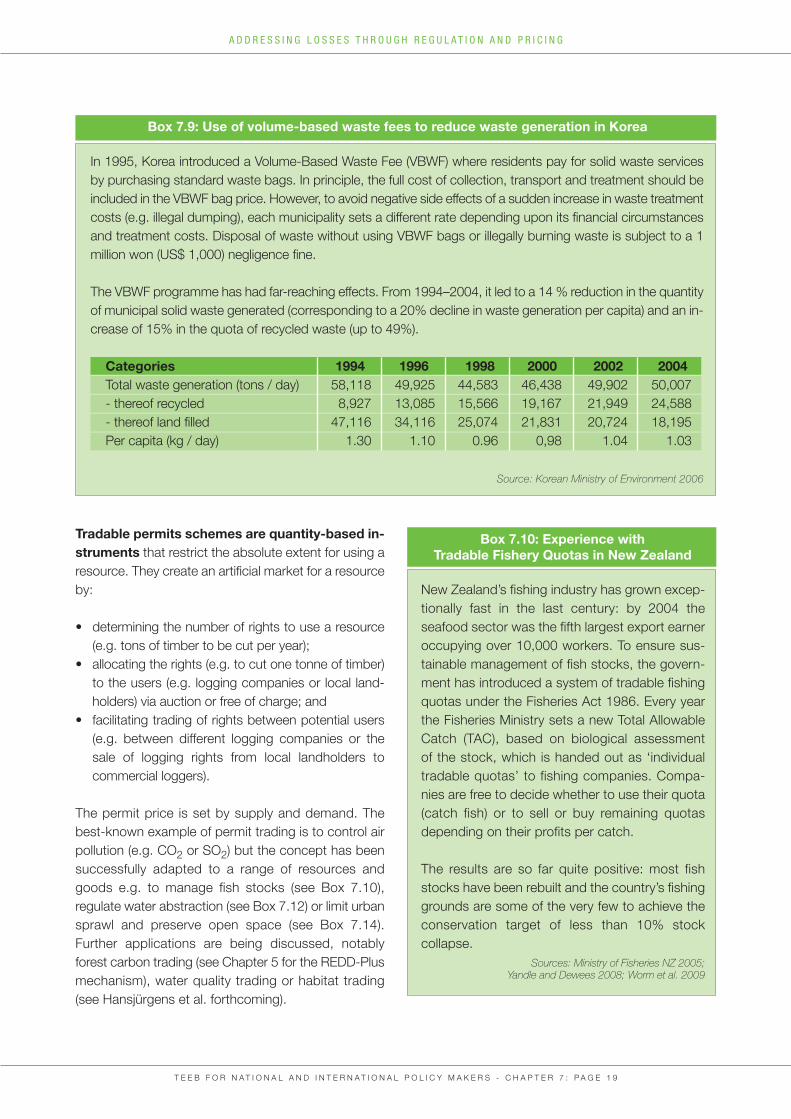
Box 7.9: Use of volume-based waste fees to reduce waste generation in Korea
In 1995, Korea introduced a volume-Based Waste Fee (vBWF) where residents pay for solid waste services
by purchasing standard waste bags. In principle, the full cost of collection, transport and treatment should be
included in the vBWF bag price. however, to avoid negative side effects of a sudden increase in waste treatment
costs (e.g. illegal dumping), each municipality sets a different rate depending upon its financial circumstances
and treatment costs. Disposal of waste without using vBWF bags or illegally burning waste is subject to a 1
million won (US$ 1,000) negligence fine.
The vBWF programme has had far-reaching effects. From 1994–2004, it led to a 14 % reduction in the quantity
of municipal solid waste generated (corresponding to a 20% decline in waste generation per capita) and an in-
crease of 15% in the quota of recycled waste (up to 49%).
Categories 1994 1996 1998 2000 2002 2004Total waste generation (tons / day) 58,118 49,925 44,583 46,438 49,902 50,007
- thereof recycled 8,927 13,085 15,566 19,167 21,949 24,588
- thereof land filled 47,116 34,116 25,074 21,831 20,724 18,195
Per capita (kg / day) 1.30 1.10 0.96 0,98 1.04 1.03
Source: Korean Ministry of Environment 2006
Box 7.10: Experience with Tradable Fishery Quotas in New Zealand
New Zealand’s fishing industry has grown excep-
tionally fast in the last century: by 2004 the
seafood sector was the fifth largest export earner
occupying over 10,000 workers. To ensure sus-
tainable management of fish stocks, the govern-
ment has introduced a system of tradable fishing
quotas under the Fisheries Act 1986. Every year
the Fisheries Ministry sets a new Total Allowable
Catch (TAC), based on biological assessment
of the stock, which is handed out as ‘individual
tradable quotas’ to fishing companies. Compa-
nies are free to decide whether to use their quota
(catch fish) or to sell or buy remaining quotas
depending on their profits per catch.
The results are so far quite positive: most fish
stocks have been rebuilt and the country’s fishing
grounds are some of the very few to achieve the
conservation target of less than 10% stock
collapse.
Sources: Ministry of Fisheries NZ 2005; Yandle and Dewees 2008; Worm et al. 2009
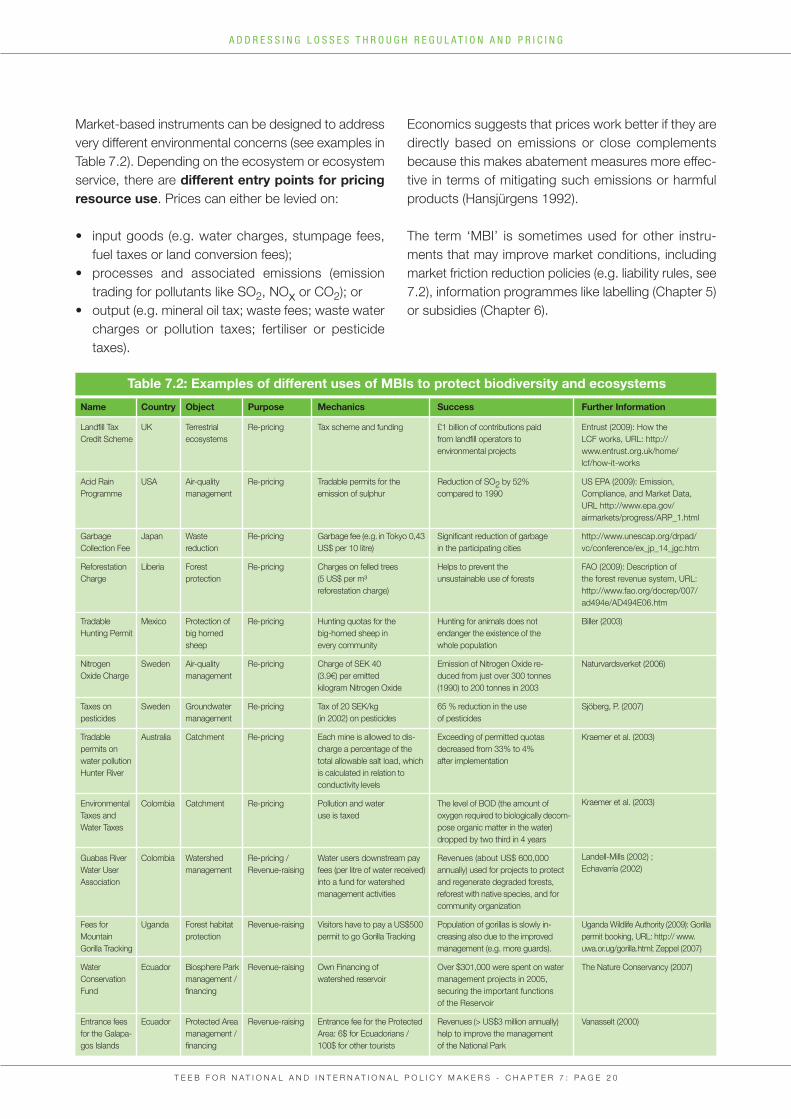
Market-based instruments can be designed to address
very different environmental concerns (see examples in
Table 7.2). Depending on the ecosystem or ecosystem
service, there are different entry points for pricingresource use. Prices can either be levied on:
• input goods (e.g. water charges, stumpage fees,
fuel taxes or land conversion fees);
• processes and associated emissions (emission
trading for pollutants like So2, Nox or Co2); or
• output (e.g. mineral oil tax; waste fees; waste water
charges or pollution taxes; fertiliser or pesticide
taxes).
Economics suggests that prices work better if they are
directly based on emissions or close complements
because this makes abatement measures more effec-
tive in terms of mitigating such emissions or harmful
products (hansjürgens 1992).
The term ‘MBI’ is sometimes used for other instru-
ments that may improve market conditions, including
market friction reduction policies (e.g. liability rules, see
7.2), information programmes like labelling (Chapter 5)
or subsidies (Chapter 6).
T E E B F o R N A T I o N A L A N D I N T E R N A T I o N A L P o L I C y M A K E R S - C h A P T E R 7 : P A G E 2 0
A D D R E S S I N G L O S S E S T H R O U G H R E G U L A T I O N A N D P R I C I N G
Table 7.2: Examples of different uses of MBIs to protect biodiversity and ecosystems
Name
Landfill Tax
Credit Scheme
Acid Rain
Programme
Garbage
Collection Fee
Reforestation
Charge
Tradable
hunting Permit
Nitrogen
oxide Charge
Taxes on
pesticides
Tradable
permits on
water pollution
hunter River
Environmental
Taxes and
Water Taxes
Guabas River
Water User
Association
Fees for
Mountain
Gorilla Tracking
Water
Conservation
Fund
Entrance fees
for the Galapa-
gos Islands
Country
UK
USA
Japan
Liberia
Mexico
Sweden
Sweden
Australia
Colombia
Colombia
Uganda
Ecuador
Ecuador
Object
Terrestrial
ecosystems
Air-quality
management
Waste
reduction
Forest
protection
Protection of
big horned
sheep
Air-quality
management
Groundwater
management
Catchment
Catchment
Watershed
management
Forest habitat
protection
Biosphere Park
management /
financing
Protected Area
management /
financing
Purpose
Re-pricing
Re-pricing
Re-pricing
Re-pricing
Re-pricing
Re-pricing
Re-pricing
Re-pricing
Re-pricing
Re-pricing /
Revenue-raising
Revenue-raising
Revenue-raising
Revenue-raising
Mechanics
Tax scheme and funding
Tradable permits for the
emission of sulphur
Garbage fee (e.g. in Tokyo 0,43
US$ per 10 litre)
Charges on felled trees
(5 US$ per m³
reforestation charge)
hunting quotas for the
big-horned sheep in
every community
Charge of SEK 40
(3.9€) per emitted
kilogram Nitrogen oxide
Tax of 20 SEK/kg
(in 2002) on pesticides
Each mine is allowed to dis-
charge a percentage of the
total allowable salt load, which
is calculated in relation to
conductivity levels
Pollution and water
use is taxed
Water users downstream pay
fees (per litre of water received)
into a fund for watershed
management activities
visitors have to pay a US$500
permit to go Gorilla Tracking
own Financing of
watershed reservoir
Entrance fee for the Protected
Area: 6$ for Ecuadorians /
100$ for other tourists
Success
£1 billion of contributions paid
from landfill operators to
environmental projects
Reduction of So2 by 52%
compared to 1990
Significant reduction of garbage
in the participating cities
helps to prevent the
unsustainable use of forests
hunting for animals does not
endanger the existence of the
whole population
Emission of Nitrogen oxide re-
duced from just over 300 tonnes
(1990) to 200 tonnes in 2003
65 % reduction in the use
of pesticides
Exceeding of permitted quotas
decreased from 33% to 4%
after implementation
The level of BoD (the amount of
oxygen required to biologically decom-
pose organic matter in the water)
dropped by two third in 4 years
Revenues (about US$ 600,000
annually) used for projects to protect
and regenerate degraded forests,
reforest with native species, and for
community organization
Population of gorillas is slowly in-
creasing also due to the improved
management (e.g. more guards).
over $301,000 were spent on water
management projects in 2005,
securing the important functions
of the Reservoir
Revenues (> US$3 million annually)
help to improve the management
of the National Park
Further Information
Entrust (2009): how the
LCF works, URL: http://
www.entrust.org.uk/home/
lcf/how-it-works
US EPA (2009): Emission,
Compliance, and Market Data,
URL http://www.epa.gov/
airmarkets/progress/ARP_1.html
http://www.unescap.org/drpad/
vc/conference/ex_jp_14_jgc.htm
FAo (2009): Description of
the forest revenue system, URL:
http://www.fao.org/docrep/007/
ad494e/AD494E06.htm
Biller (2003)
Naturvardsverket (2006)
Sjöberg, P. (2007)
Kraemer et al. (2003)
Kraemer et al. (2003)
Landell-Mills (2002) ;
Echavarría (2002)
Uganda Wildlife Authority (2009): Gorilla
permit booking, URL: http:// www.
uwa.or.ug/gorilla.html; Zeppel (2007)
The Nature Conservancy (2007)
vanasselt (2000)
7.4.2 WHAT CAN MARKET-BASED INSTRUMENTS CONTRIBUTE?
Market-based instruments (MBI) to price resource use
have particular strengths in four areas: They can, if
set at sufficient rates, make the polluter pay more
explicitly than regulation and put the full cost recovery
principle into effect. Experience shows that environ-
mental goals may be reached more efficiently with
potential for cost savings – however, actual cost
savings depend on instrument design and implemen-
tation as well as the ecosystem service in question.
Lastly, pricing instruments can generate public
revenues that can be used to finance biodiversity-
friendly policies.
IMPLEMENTATIoN oF ThEPoLLUTER/USER PAyS PRINCIPLE
Direct regulation and the use of MBIs are both in ac-
cordance with the polluter pays principle but onlymarket-based instruments make the values at-tached to resource use explicitly visible. MBIs
confront actors with at least part of the environmental
and social costs their actions cause (i.e. costs that
were previously externalised and thus not considered
in private decision-making) and lead to explicit pay-
ments. Tax bills or permit prices are more transparent
and more easily mainstreamed into private accounts
than investments in technical adaptations to comply
with environmental regulations.
Boxes 7.11-7.13 present successful examples of using
different MBIs for specific goals.
T E E B F o R N A T I o N A L A N D I N T E R N A T I o N A L P o L I C y M A K E R S - C h A P T E R 7 : P A G E 2 1
A D D R E S S I N G L O S S E S T H R O U G H R E G U L A T I O N A N D P R I C I N G
Box 7.11: Contribution of product taxation to reducing biodiversity loss
Product taxes are important drivers of ecosystem change. Fertiliser taxes or taxes on excess nutrientsprovide an incentive to increase efficiency in fertiliser use for crops and thereby reduce negative externalities.
Application of various schemes saw decreases in product use (and subsequent reduction of levels in soil and
water) of 20-30% in the Netherlands, 11-22% in Finland, 15-20% in Sweden and 15% in Austria. (Ecotec
2001).
In 2002, Ireland introduced a tax on plastic bags; customers now pay 33 cents per bag at checkout. Plastic
bag consumption dropped by 80% from 1.2 billion to 230 million bags in the first year, generating tax revenues
(US$ 9.6 million) earmarked for a green fund. The tax also halted a major import as only 21% of plastic bags
were manufactured in Ireland (New york Times, 2 Feb 2008).
Papua New Guinea has significant foreign receipts through exporting crocodile skins, mainly to Japan. To
promote sustainable resource use, taxes levied on exports provide an important source of funding for control
and monitoring operations by the Department of Conservation (hunt, 1997).
The Eritrean government implemented a series of fiscal reforms in the energy sector, including subsidies
to kerosene, promotion of energy-efficient fuel-wood stoves and dismantling of duties on imported solar tech-
nology. The goal was to encourage people to consume less fuelwood, thus addressing deforestation and forest
degradation problems in the country (UNDP 2001).
DESIGNING MBIS FoR FULL CoST RECovERy
Market-based instruments have the potential to makethe polluter/user carry the full cost of pollution/re-
source use, provided that charge/tax rates are set high
enough or the number of permits is adequately
restricted. This is a key difference with regulatory ap-
proaches which require compliance to a set standard
and leave resource use up to this limit free of charge
i.e. there is no incentive to reduce pollution below the
standard. Under MBIs like taxes, the tax is imposed on
all emissions (e.g. every tonne of carbon, every litre of
discharged water) and thus increases incentives to
reduce resource use. however, tax rates, fees or char-
ges will only reflect the true economic value of the
resource in question if the MBIs are explicitly designed
and set at an adequate level to secure full cost reco-
very (see Box 7.13).
T E E B F o R N A T I o N A L A N D I N T E R N A T I o N A L P o L I C y M A K E R S - C h A P T E R 7 : P A G E 2 2
A D D R E S S I N G L O S S E S T H R O U G H R E G U L A T I O N A N D P R I C I N G
Box 7.12: Experience of water use rights in reducing water consumption in China
China’s first water use rights system with tradable water use quotas was launched early in 2002 (Zhangye City,
Ganzhou District, Gansu Province) as part of a national water saving project. Water use in the pilot area was
readjusted based on local ecological and social conditions: high-efficiency water users were given preference
for distribution of use rights, and per capita water use was determined based on proximity to water resources.
Water use rights certificates were distributed to counties and irrigation districts, and subsequently to townships,
villages and households.
In Minle County, each irrigation district distributed water rights certificates to households based on land area
and a water resource deployment scheme which was checked, ratified and strictly enforced. Water used for
irrigation was reduced to 1,500–1,800 m3/ha/year, significantly lower than the previous year.
Source: Forest Trend 2009
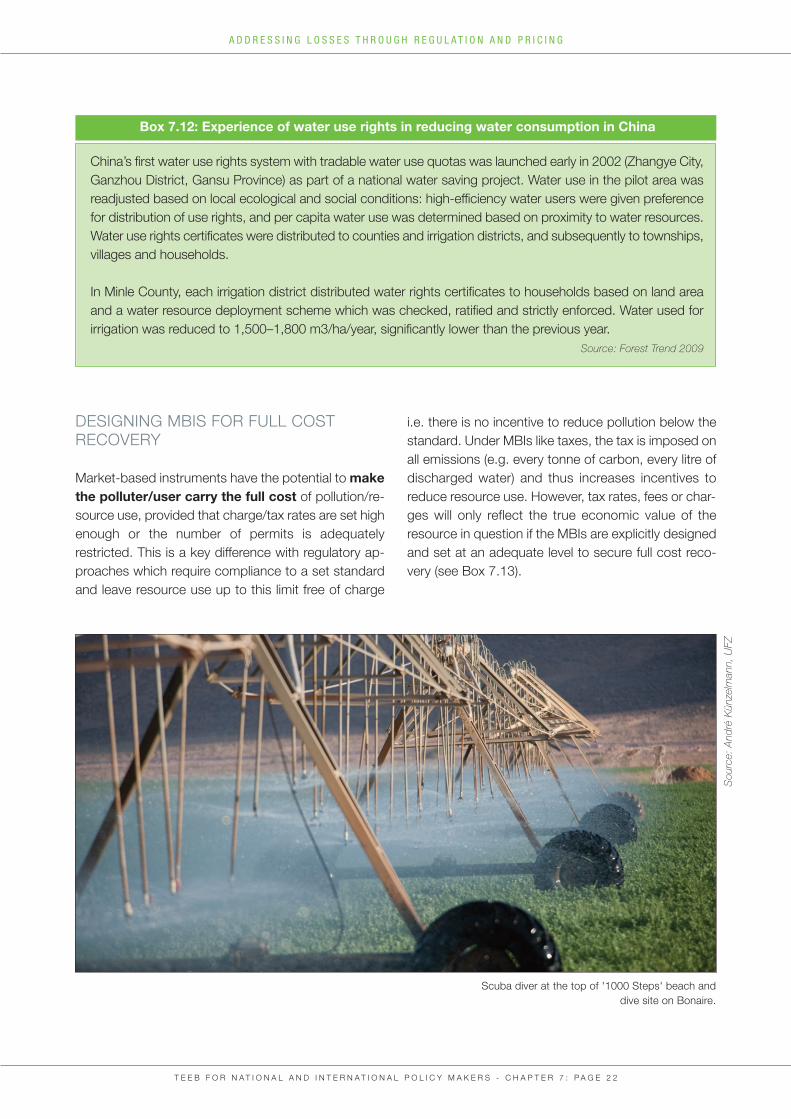
Source: André Künzelmann, UFZ
Scuba diver at the top of '1000 Steps' beach and
dive site on Bonaire.
T E E B F o R N A T I o N A L A N D I N T E R N A T I o N A L P o L I C y M A K E R S - C h A P T E R 7 : P A G E 2 3
A D D R E S S I N G L O S S E S T H R O U G H R E G U L A T I O N A N D P R I C I N G
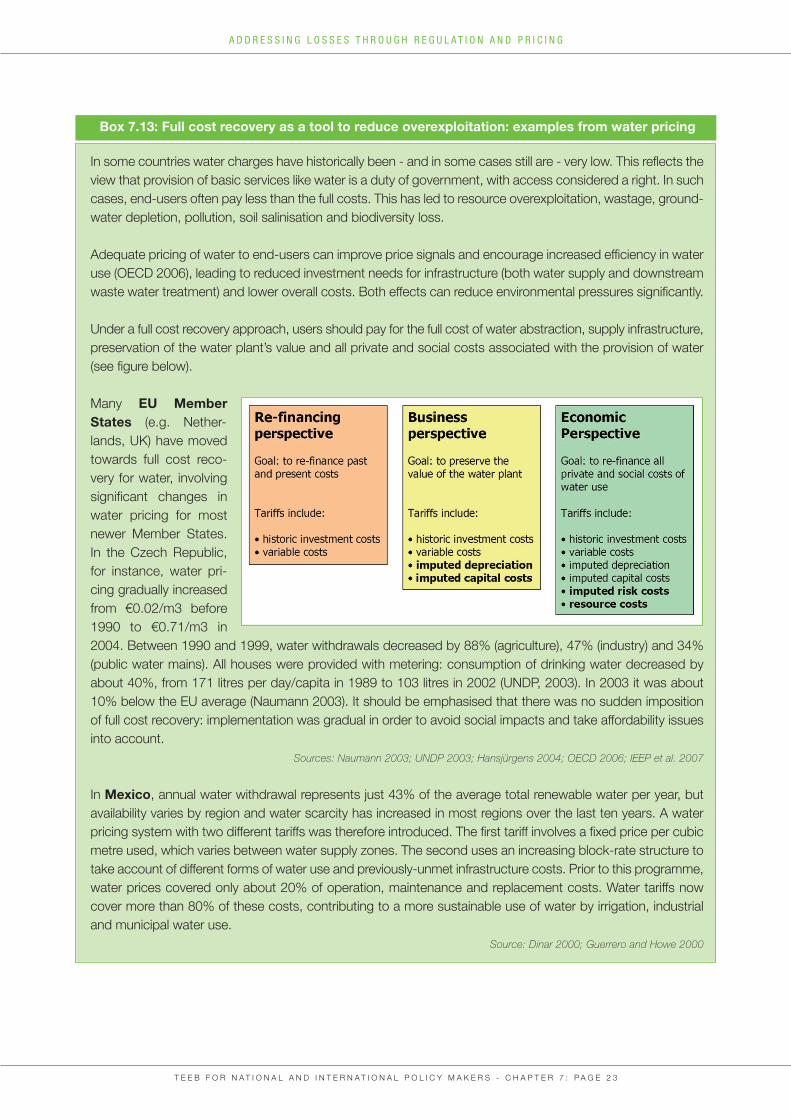
Box 7.13: Full cost recovery as a tool to reduce overexploitation: examples from water pricing
In some countries water charges have historically been - and in some cases still are - very low. This reflects the
view that provision of basic services like water is a duty of government, with access considered a right. In such
cases, end-users often pay less than the full costs. This has led to resource overexploitation, wastage, ground-
water depletion, pollution, soil salinisation and biodiversity loss.
Adequate pricing of water to end-users can improve price signals and encourage increased efficiency in water
use (oECD 2006), leading to reduced investment needs for infrastructure (both water supply and downstream
waste water treatment) and lower overall costs. Both effects can reduce environmental pressures significantly.
Under a full cost recovery approach, users should pay for the full cost of water abstraction, supply infrastructure,
preservation of the water plant’s value and all private and social costs associated with the provision of water
(see figure below).
Many EU MemberStates (e.g. Nether-
lands, UK) have moved
towards full cost reco-
very for water, involving
significant changes in
water pricing for most
newer Member States.
In the Czech Republic,
for instance, water pri-
cing gradually increased
from €0.02/m3 before
1990 to €0.71/m3 in
2004. Between 1990 and 1999, water withdrawals decreased by 88% (agriculture), 47% (industry) and 34%
(public water mains). All houses were provided with metering: consumption of drinking water decreased by
about 40%, from 171 litres per day/capita in 1989 to 103 litres in 2002 (UNDP, 2003). In 2003 it was about
10% below the EU average (Naumann 2003). It should be emphasised that there was no sudden imposition
of full cost recovery: implementation was gradual in order to avoid social impacts and take affordability issues
into account.
Sources: Naumann 2003; UNDP 2003; Hansjürgens 2004; OECD 2006; IEEP et al. 2007
In Mexico, annual water withdrawal represents just 43% of the average total renewable water per year, but
availability varies by region and water scarcity has increased in most regions over the last ten years. A water
pricing system with two different tariffs was therefore introduced. The first tariff involves a fixed price per cubic
metre used, which varies between water supply zones. The second uses an increasing block-rate structure to
take account of different forms of water use and previously-unmet infrastructure costs. Prior to this programme,
water prices covered only about 20% of operation, maintenance and replacement costs. Water tariffs now
cover more than 80% of these costs, contributing to a more sustainable use of water by irrigation, industrial
and municipal water use.
Source: Dinar 2000; Guerrero and Howe 2000
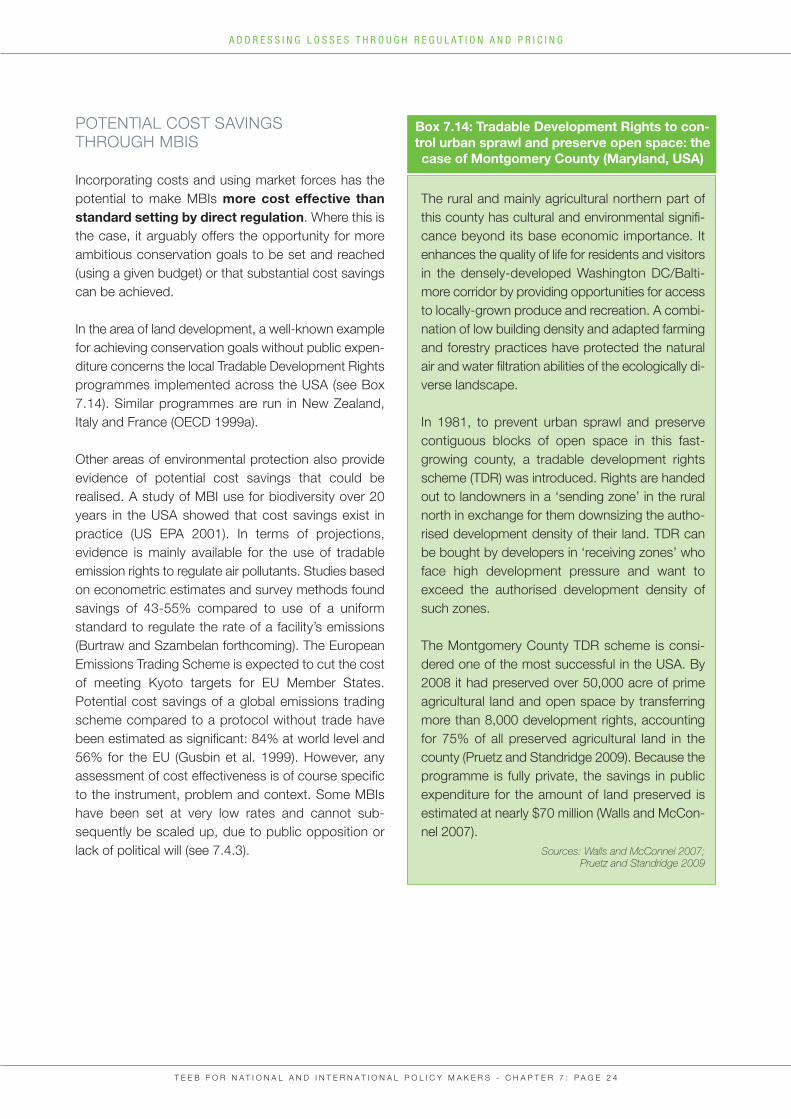
PoTENTIAL CoST SAvINGS ThRoUGh MBIS
Incorporating costs and using market forces has the
potential to make MBIs more cost effective thanstandard setting by direct regulation. Where this is
the case, it arguably offers the opportunity for more
ambitious conservation goals to be set and reached
(using a given budget) or that substantial cost savings
can be achieved.
In the area of land development, a well-known example
for achieving conservation goals without public expen-
diture concerns the local Tradable Development Rights
programmes implemented across the USA (see Box
7.14). Similar programmes are run in New Zealand,
Italy and France (oECD 1999a).
other areas of environmental protection also provide
evidence of potential cost savings that could be
realised. A study of MBI use for biodiversity over 20
years in the USA showed that cost savings exist in
practice (US EPA 2001). In terms of projections,
evidence is mainly available for the use of tradable
emission rights to regulate air pollutants. Studies based
on econometric estimates and survey methods found
savings of 43-55% compared to use of a uniform
standard to regulate the rate of a facility’s emissions
(Burtraw and Szambelan forthcoming). The European
Emissions Trading Scheme is expected to cut the cost
of meeting Kyoto targets for EU Member States.
Potential cost savings of a global emissions trading
scheme compared to a protocol without trade have
been estimated as significant: 84% at world level and
56% for the EU (Gusbin et al. 1999). however, any
assessment of cost effectiveness is of course specific
to the instrument, problem and context. Some MBIs
have been set at very low rates and cannot sub-
sequently be scaled up, due to public opposition or
lack of political will (see 7.4.3).
T E E B F o R N A T I o N A L A N D I N T E R N A T I o N A L P o L I C y M A K E R S - C h A P T E R 7 : P A G E 2 4
A D D R E S S I N G L O S S E S T H R O U G H R E G U L A T I O N A N D P R I C I N G
Box 7.14: Tradable Development Rights to con-trol urban sprawl and preserve open space: thecase of Montgomery County (Maryland, USA)
The rural and mainly agricultural northern part of
this county has cultural and environmental signifi-
cance beyond its base economic importance. It
enhances the quality of life for residents and visitors
in the densely-developed Washington DC/Balti-
more corridor by providing opportunities for access
to locally-grown produce and recreation. A combi-
nation of low building density and adapted farming
and forestry practices have protected the natural
air and water filtration abilities of the ecologically di-
verse landscape.
In 1981, to prevent urban sprawl and preserve
contiguous blocks of open space in this fast-
growing county, a tradable development rights
scheme (TDR) was introduced. Rights are handed
out to landowners in a ‘sending zone’ in the rural
north in exchange for them downsizing the autho-
rised development density of their land. TDR can
be bought by developers in ‘receiving zones’ who
face high development pressure and want to
exceed the authorised development density of
such zones.
The Montgomery County TDR scheme is consi-
dered one of the most successful in the USA. By
2008 it had preserved over 50,000 acre of prime
agricultural land and open space by transferring
more than 8,000 development rights, accounting
for 75% of all preserved agricultural land in the
county (Pruetz and Standridge 2009). Because the
programme is fully private, the savings in public
expenditure for the amount of land preserved is
estimated at nearly $70 million (Walls and McCon-
nel 2007).
Sources: Walls and McConnel 2007; Pruetz and Standridge 2009
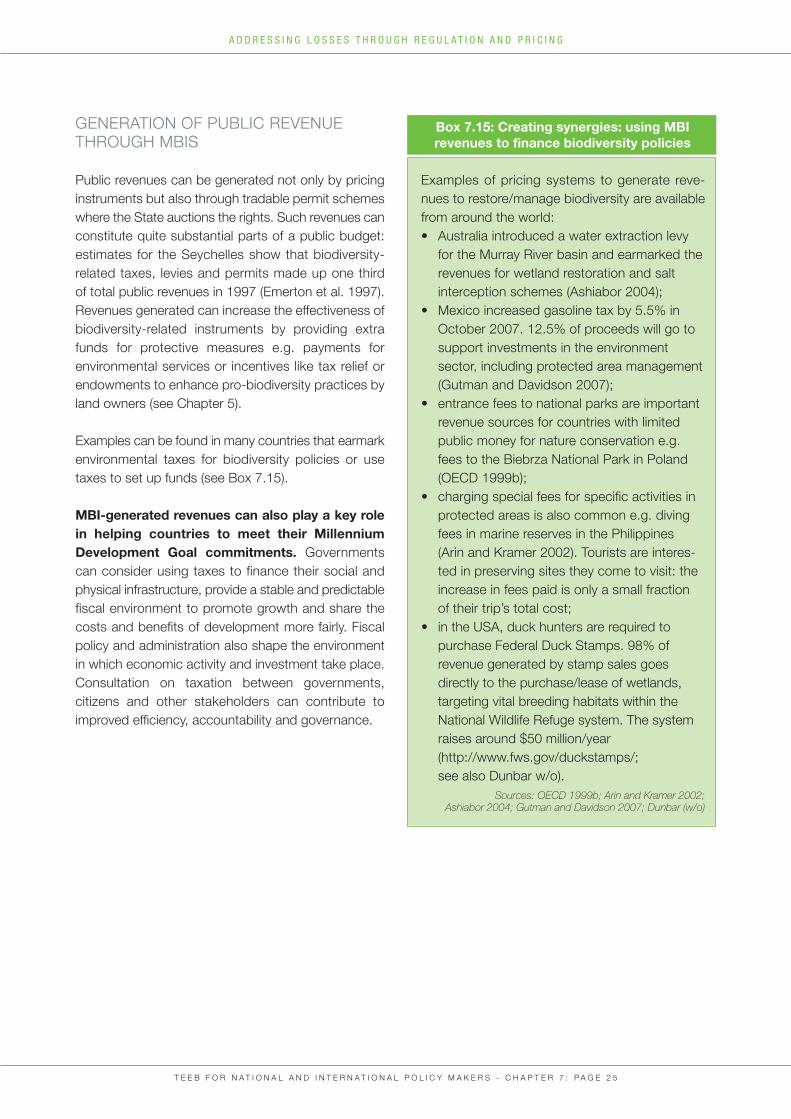
GENERATIoN oF PUBLIC REvENUEThRoUGh MBIS
Public revenues can be generated not only by pricing
instruments but also through tradable permit schemes
where the State auctions the rights. Such revenues can
constitute quite substantial parts of a public budget:
estimates for the Seychelles show that biodiversity-
related taxes, levies and permits made up one third
of total public revenues in 1997 (Emerton et al. 1997).
Revenues generated can increase the effectiveness of
biodiversity-related instruments by providing extra
funds for protective measures e.g. payments for
environmental services or incentives like tax relief or
endowments to enhance pro-biodiversity practices by
land owners (see Chapter 5).
Examples can be found in many countries that earmark
environmental taxes for biodiversity policies or use
taxes to set up funds (see Box 7.15).
MBI-generated revenues can also play a key rolein helping countries to meet their Millennium Development Goal commitments. Governments
can consider using taxes to finance their social and
physical infrastructure, provide a stable and predictable
fiscal environment to promote growth and share the
costs and benefits of development more fairly. Fiscal
policy and administration also shape the environment
in which economic activity and investment take place.
Consultation on taxation between governments,
citizens and other stakeholders can contribute to
improved efficiency, accountability and governance.
T E E B F o R N A T I o N A L A N D I N T E R N A T I o N A L P o L I C y M A K E R S - C h A P T E R 7 : P A G E 2 5
A D D R E S S I N G L O S S E S T H R O U G H R E G U L A T I O N A N D P R I C I N G
Box 7.15: Creating synergies: using MBI revenues to finance biodiversity policies
Examples of pricing systems to generate reve-
nues to restore/manage biodiversity are available
from around the world:
• Australia introduced a water extraction levy
for the Murray River basin and earmarked the
revenues for wetland restoration and salt
interception schemes (Ashiabor 2004);
• Mexico increased gasoline tax by 5.5% in
october 2007. 12.5% of proceeds will go to
support investments in the environment
sector, including protected area management
(Gutman and Davidson 2007);
• entrance fees to national parks are important
revenue sources for countries with limited
public money for nature conservation e.g.
fees to the Biebrza National Park in Poland
(oECD 1999b);
• charging special fees for specific activities in
protected areas is also common e.g. diving
fees in marine reserves in the Philippines
(Arin and Kramer 2002). Tourists are interes-
ted in preserving sites they come to visit: the
increase in fees paid is only a small fraction
of their trip’s total cost;
• in the USA, duck hunters are required to
purchase Federal Duck Stamps. 98% of
revenue generated by stamp sales goes
directly to the purchase/lease of wetlands,
targeting vital breeding habitats within the
National Wildlife Refuge system. The system
raises around $50 million/year
(http://www.fws.gov/duckstamps/;
see also Dunbar w/o).
Sources: OECD 1999b; Arin and Kramer 2002; Ashiabor 2004; Gutman and Davidson 2007; Dunbar (w/o)
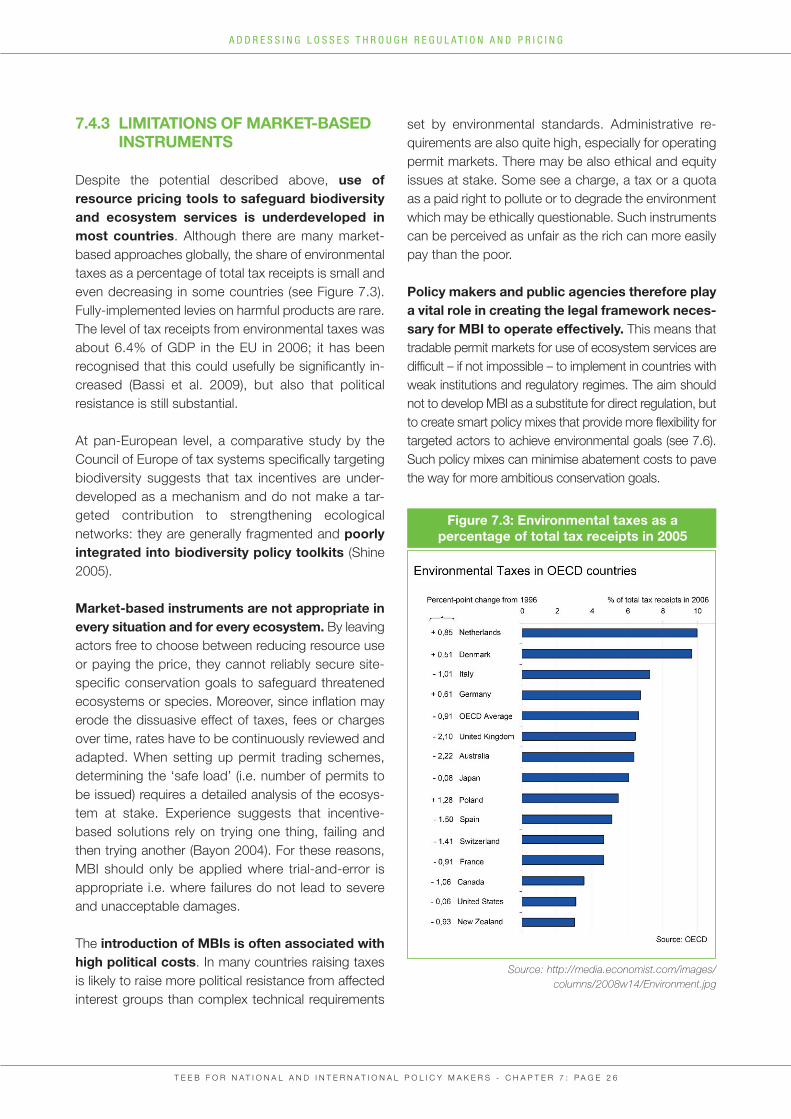
7.4.3 LIMITATIONS OF MARKET-BASED INSTRUMENTS
Despite the potential described above, use of resource pricing tools to safeguard biodiversityand ecosystem services is underdeveloped inmost countries. Although there are many market-
based approaches globally, the share of environmental
taxes as a percentage of total tax receipts is small and
even decreasing in some countries (see Figure 7.3).
Fully-implemented levies on harmful products are rare.
The level of tax receipts from environmental taxes was
about 6.4% of GDP in the EU in 2006; it has been
recognised that this could usefully be significantly in-
creased (Bassi et al. 2009), but also that political
resistance is still substantial.
At pan-European level, a comparative study by the
Council of Europe of tax systems specifically targeting
biodiversity suggests that tax incentives are under-
developed as a mechanism and do not make a tar-
geted contribution to strengthening ecological
networks: they are generally fragmented and poorly integrated into biodiversity policy toolkits (Shine
2005).
Market-based instruments are not appropriate inevery situation and for every ecosystem. By leaving
actors free to choose between reducing resource use
or paying the price, they cannot reliably secure site-
specific conservation goals to safeguard threatened
ecosystems or species. Moreover, since inflation may
erode the dissuasive effect of taxes, fees or charges
over time, rates have to be continuously reviewed and
adapted. When setting up permit trading schemes,
determining the ‘safe load’ (i.e. number of permits to
be issued) requires a detailed analysis of the ecosys-
tem at stake. Experience suggests that incentive-
based solutions rely on trying one thing, failing and
then trying another (Bayon 2004). For these reasons,
MBI should only be applied where trial-and-error is
appropriate i.e. where failures do not lead to severe
and unacceptable damages.
The introduction of MBIs is often associated withhigh political costs. In many countries raising taxes
is likely to raise more political resistance from affected
interest groups than complex technical requirements
set by environmental standards. Administrative re-
quirements are also quite high, especially for operating
permit markets. There may be also ethical and equity
issues at stake. Some see a charge, a tax or a quota
as a paid right to pollute or to degrade the environment
which may be ethically questionable. Such instruments
can be perceived as unfair as the rich can more easily
pay than the poor.
Policy makers and public agencies therefore playa vital role in creating the legal framework neces-sary for MBI to operate effectively. This means that
tradable permit markets for use of ecosystem services are
difficult – if not impossible – to implement in countries with
weak institutions and regulatory regimes. The aim should
not to develop MBI as a substitute for direct regulation, but
to create smart policy mixes that provide more flexibility for
targeted actors to achieve environmental goals (see 7.6).
Such policy mixes can minimise abatement costs to pave
the way for more ambitious conservation goals.
T E E B F o R N A T I o N A L A N D I N T E R N A T I o N A L P o L I C y M A K E R S - C h A P T E R 7 : P A G E 2 6
A D D R E S S I N G L O S S E S T H R O U G H R E G U L A T I O N A N D P R I C I N G
Source: http://media.economist.com/images/columns/2008w14/Environment.jpg
Figure 7.3: Environmental taxes as a percentage of total tax receipts in 2005
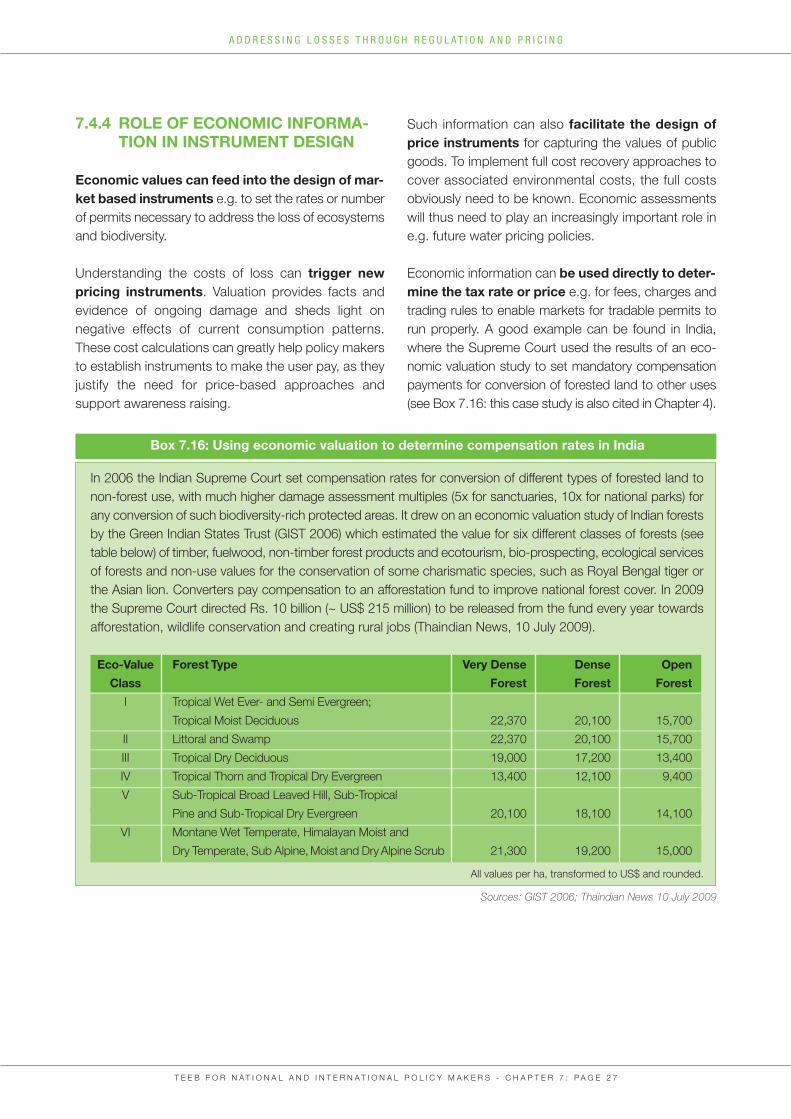
7.4.4 ROLE OF ECONOMIC INFORMA-TION IN INSTRUMENT DESIGN
Economic values can feed into the design of mar-ket based instruments e.g. to set the rates or number
of permits necessary to address the loss of ecosystems
and biodiversity.
Understanding the costs of loss can trigger new pricing instruments. valuation provides facts and
evidence of ongoing damage and sheds light on
negative effects of current consumption patterns.
These cost calculations can greatly help policy makers
to establish instruments to make the user pay, as they
justify the need for price-based approaches and
support awareness raising.
Such information can also facilitate the design ofprice instruments for capturing the values of public
goods. To implement full cost recovery approaches to
cover associated environmental costs, the full costs
obviously need to be known. Economic assessments
will thus need to play an increasingly important role in
e.g. future water pricing policies.
Economic information can be used directly to deter-mine the tax rate or price e.g. for fees, charges and
trading rules to enable markets for tradable permits to
run properly. A good example can be found in India,
where the Supreme Court used the results of an eco-
nomic valuation study to set mandatory compensation
payments for conversion of forested land to other uses
(see Box 7.16: this case study is also cited in Chapter 4).
T E E B F o R N A T I o N A L A N D I N T E R N A T I o N A L P o L I C y M A K E R S - C h A P T E R 7 : P A G E 2 7
A D D R E S S I N G L O S S E S T H R O U G H R E G U L A T I O N A N D P R I C I N G
Box 7.16: Using economic valuation to determine compensation rates in India
In 2006 the Indian Supreme Court set compensation rates for conversion of different types of forested land to
non-forest use, with much higher damage assessment multiples (5x for sanctuaries, 10x for national parks) for
any conversion of such biodiversity-rich protected areas. It drew on an economic valuation study of Indian forests
by the Green Indian States Trust (GIST 2006) which estimated the value for six different classes of forests (see
table below) of timber, fuelwood, non-timber forest products and ecotourism, bio-prospecting, ecological services
of forests and non-use values for the conservation of some charismatic species, such as Royal Bengal tiger or
the Asian lion. Converters pay compensation to an afforestation fund to improve national forest cover. In 2009
the Supreme Court directed Rs. 10 billion (~ US$ 215 million) to be released from the fund every year towards
afforestation, wildlife conservation and creating rural jobs (Thaindian News, 10 July 2009).
All values per ha, transformed to US$ and rounded.
Forest Type
Tropical Wet Ever- and Semi Evergreen;
Tropical Moist Deciduous
Littoral and Swamp
Tropical Dry Deciduous
Tropical Thorn and Tropical Dry Evergreen
Sub-Tropical Broad Leaved hill, Sub-Tropical
Pine and Sub-Tropical Dry Evergreen
Montane Wet Temperate, himalayan Moist and
Dry Temperate, Sub Alpine, Moist and Dry Alpine Scrub
Very Dense
Forest
22,370
22,370
19,000
13,400
20,100
21,300
Dense
Forest
20,100
20,100
17,200
12,100
18,100
19,200
Open
Forest
15,700
15,700
13,400
9,400
14,100
15,000
Eco-Value
Class
I
II
III
Iv
v
vI
Sources: GIST 2006; Thaindian News 10 July 2009
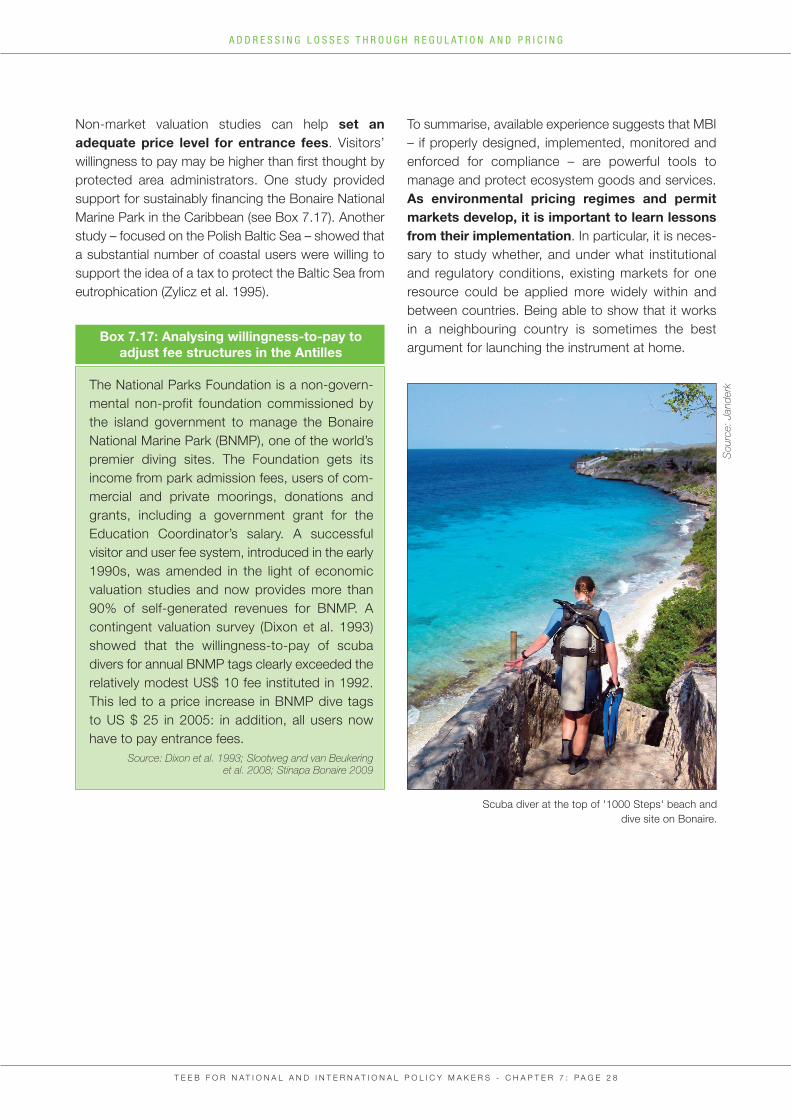
Non-market valuation studies can help set an adequate price level for entrance fees. visitors’
willingness to pay may be higher than first thought by
protected area administrators. one study provided
support for sustainably financing the Bonaire National
Marine Park in the Caribbean (see Box 7.17). Another
study – focused on the Polish Baltic Sea – showed that
a substantial number of coastal users were willing to
support the idea of a tax to protect the Baltic Sea from
eutrophication (Zylicz et al. 1995).
To summarise, available experience suggests that MBI
– if properly designed, implemented, monitored and
enforced for compliance – are powerful tools to
manage and protect ecosystem goods and services.
As environmental pricing regimes and permitmarkets develop, it is important to learn lessonsfrom their implementation. In particular, it is neces-
sary to study whether, and under what institutional
and regulatory conditions, existing markets for one
resource could be applied more widely within and
between countries. Being able to show that it works
in a neighbouring country is sometimes the best
argument for launching the instrument at home.
T E E B F o R N A T I o N A L A N D I N T E R N A T I o N A L P o L I C y M A K E R S - C h A P T E R 7 : P A G E 2 8
A D D R E S S I N G L O S S E S T H R O U G H R E G U L A T I O N A N D P R I C I N G
Box 7.17: Analysing willingness-to-pay to adjust fee structures in the Antilles
The National Parks Foundation is a non-govern-
mental non-profit foundation commissioned by
the island government to manage the Bonaire
National Marine Park (BNMP), one of the world’s
premier diving sites. The Foundation gets its
income from park admission fees, users of com-
mercial and private moorings, donations and
grants, including a government grant for the
Education Coordinator’s salary. A successful
visitor and user fee system, introduced in the early
1990s, was amended in the light of economic
valuation studies and now provides more than
90% of self-generated revenues for BNMP. A
contingent valuation survey (Dixon et al. 1993)
showed that the willingness-to-pay of scuba
divers for annual BNMP tags clearly exceeded the
relatively modest US$ 10 fee instituted in 1992.
This led to a price increase in BNMP dive tags
to US $ 25 in 2005: in addition, all users now
have to pay entrance fees.
Source: Dixon et al. 1993; Slootweg and van Beukering et al. 2008; Stinapa Bonaire 2009
Source: Janderk
Scuba diver at the top of '1000 Steps' beach and
dive site on Bonaire.
T E E B F o R N A T I o N A L A N D I N T E R N A T I o N A L P o L I C y M A K E R S - C h A P T E R 7 : P A G E 2 9
A D D R E S S I N G L O S S E S T H R O U G H R E G U L A T I O N A N D P R I C I N G
Building awareness across society and politicalcommitment at all levels is a fundamental step towards improving environmental performanceand compliance.
In parallel, monitoring, enforcement and criminalprosecution of non-compliant behaviour are essential for any environmental policy to becomeeffective. Environmental crimes often yield high profits
for perpetrators, while risks of detection are too low
and punishment is not severe enough to deter illegal
practices. Change will require adequate funding for
monitoring activities, international cooperation on law
enforcement and the provision of viable and legal al-
ternatives for certain groups.
MoNIToRING, ENFoRCEMENT AND
CRIMINAL PRoSECUTIoN 7.5 7.5.1 ENVIRONMENTAL CRIME:
A LOCAL AND GLOBAL PROBLEM
Individuals and businesses will more likely comply with
an environmental standard, fulfil a compensation
re-quirement or pay a tax if the incentives are right,
including a meaningful risk that any illegal behaviour
will be detected and appropriately punished. Where
government efforts to track down crimes and enforce
the law are perceived as weak, this will be taken by
some as a tacit acceptance that regulatory require-
ments do not need to be respected. Good governance
and credibility are therefore critical to law enforcement.
Box 7.18 outlines the range of activities and sectors
concerned by environmental crime.
Box 7.18: What are environmental crimes?
Environmental crimes include any actions – or failure to act - that breach environmental legislation. They
can range from relatively minor offences to serious offences that cause significant harm or risk to the en-
vironment and human health. The best-known categories include the illegal emission or discharge of
substances into air, water or soil, illegal trade in ozone-depleting substances, illegal shipment or dumping
of wastes, illegal trade in wildlife, illegal logging and illegal fisheries but there are many others, including
illegal building, land conversion and water extraction.
The impacts of environmental crime can be felt from very local through to global level. offences with a
trade-related or pollution dimension are particularly likely to have a cross-border aspect which can widen
the number of impacted people. Not paying attention to this dimension can have implications for a country’s
trading status and the ability of its businesses to develop new opportunities. Several initiatives to improve
international governance and collaboration on monitoring and enforcement are therefore under way.
Many drivers need to be considered, from poverty (i.e. lack of alternatives) to corruption and organised
crime. The economics of wildlife crime, for example, show that trade of illegally harvested biodiversity is
extremely profitable, generating billions of dollars. The same magnitude of profits can be made by polluters
who defy environmental standards and permit conditions. There is a huge need to change people's attitude
towards environmental crimes.
PoLLUTIoN AND oThER DAMAGINGACTIvITIES
Serious pollution-related offences include the
handling, transport, trading, possession and disposal
of hazardous waste or resources in breach of national
and/or international law. They have a clear and direct
impact on human health, biodiversity and provision of
ecosystem services due to the hazardous nature of the
substances in question and can have knock-ontransboundary or wider impacts. Illegal actions can
thus have far-reaching consequences going beyond the damage caused by the initial act, often over a considerable period of time. Moreover,
businesses that violate applicable laws have an unfair
economic advantage over law-abiding ones.
We easily overlook what seem to be minor offen-ces but these too have a significant cumulativeimpact on biodiversity, cause disturbance to species
or lead to ecosystem degradation. Examples include
the destruction of breeding places or nests; ongoing
pollution of water resources through excessive
discharges of chemicals, dangerous substances and
wastes; and non-compliance with conditions laid down
by administrative permits (see Box 7.19).
As noted in 7.2, regulatory frameworks set rules and
standards to avoid or minimise the risk of damage.
These, along with best practices adopted in different
sectors, are widely incorporated into environmen-tal management procedures implemented by reputable operators around the world. Whilst acci-
dents can always happen, negligent practices and/or
failure to comply with applicable rules and standards
foreseeably increase the likelihood of damage to the
environment and/or human interests. The main sectors
concerned include the oil storage and transport sector,
oil distilleries, chemical manufacturing and storage, the
waste treatment and water services sectors, as well as
agriculture.
Environmental liability rules, coming on stream in some
parts of the world, provide a mechanism for relating
the harmful activity to the polluter (where identified) and
securing restoration and compensation (see 7.2).
Environmental criminal law goes a step further by de-
fining what constitutes illegal conduct, whether it is
deliberate and setting penalties (monetary, imprison-
ment or both). however, its enforcement is always
cumbersome as relevant activities are often wide-
spread and surveillance on the spot cannot reliably
take place. Corruption in certain countries further adds
to the problem. Too often monitoring comes into play
only after the damage has occurred and its effects on
the ecosystem are apparent. Such monitoring rarely
makes it possible to trace a polluting incident back
to the polluter with the degree of certitude required
for penal actions.
T E E B F o R N A T I o N A L A N D I N T E R N A T I o N A L P o L I C y M A K E R S - C h A P T E R 7 : P A G E 3 0
A D D R E S S I N G L O S S E S T H R O U G H R E G U L A T I O N A N D P R I C I N G
Box 7.19: Wider impacts of pollution and dumping
Oceans are fast becoming a garbage dump.In Australia, surveys near cities indicate up to 80%of marine litter originating from land-basedsources (sea-based sources are in the lead in
more remote areas). Cigarette products, paper
and plastic bags headed the Top 10 List of Marine
Debris items for 1989-2007. Plastic, especially
plastic bags and polyethylene terephthalate (PET)
bottles, is the most pervasive type of marine litter
around the world, accounting for over 80% of all
litter collected in several regional seas assessed.
one key step is to review the level of fines for
ocean dumping to increase the level of deterrent
where necessary. In the USA, for example, the
cruise ship Regal Princess was fined $ 500,000 in
1993 for dumping 20 bags of garbage at sea
(UNEP 2009b).
Dumping of mining waste: The Panguna copper
mine in Papua New Guinea dumped 130,000 tons
per day of tailings into the Kawerogn/Jaba river
system (a total of 600 million tons). The damage
spread over 30 kilometres from the source and
all life disappeared from the river due to the metal
and leach acids. The conflict over the mine also
inflamed a civil war which lead to its eventual
closure (young 1992). Although this particular case
has been dealt with, mining remains one of the
most polluting and controversial activities with
potentially severe effects on biodiversity and
ecosystem services.
Sources: UNEP 2009, ten Brink et al., Young 1992
ILLEGAL USE oF RESoURCES ANDWILDLIFE CRIME
offences related to natural resource use and wildlife
can take many forms and take place at many levels.
Most countries have long regulated direct taking, trade
and other activities affecting valued resources, species
and their derivatives where these could collectively lead
to over-exploitation or irreversible damage. These rules
and associated permit requirements (e.g. to prevent
over-collection of wild plants and poaching of animals)
are very familiar to environmental administrations, even
if detection of offences and subsequent enforcement
present major logistical difficulties.
We should not neglect the fact that some illegal activity
is generated by poverty in developing countries. For
example, illegal hunting can be triggered by increasing
demand for bush-meat from indigenous people through
to global buyers. Poorer people are selling bush-meat to
collectors and restaurants, meat suppliers and
poachers as a means of survival.
As noted throughout this report, many rural and indige-
nous populations depend on ecosystem goods and ser-
vices for their livelihoods, cultural identity and even
survival. Access to common resources and harvesting is
a de facto right. Conflicts of interest are often inevitable
and foreseeable where regulatory restrictions or bans are
extended to resources used by such groups.
The guiding principles for policy makers set out in Chap-
ter 2 are particularly relevant when negotiating new con-
trols in this field. More broadly, where environmental
crime exists, it needs to be addressed through the pro-
vision of income-producing alternatives and education.
Linking conservation strategies with poverty alleviation is
an absolute must for developing countries.
Global illegal trade in wildlife species has growninto a multibillion-dollar business. Species most at
risk are plants of edible, medicinal or decorative use, em-
blematic animal species for their skins and trophies and
exotic species (e.g. reptiles, amphibians, fish/corals and
birds) collected as pets, ornamentals and for their eggs
or venom. Existing black markets, as problematic as they
are, mirror the values underlying biodiversity and specific
ecosystem services (see Box 7.20).
T E E B F o R N A T I o N A L A N D I N T E R N A T I o N A L P o L I C y M A K E R S - C h A P T E R 7 : P A G E 3 1
A D D R E S S I N G L O S S E S T H R O U G H R E G U L A T I O N A N D P R I C I N G
Box 7.20: The economics behind environmental crimes
A whole economy is associated with illegal poa-
ching and hunting. Related profits can be substan-
tial and easily exceed the financial penalties
imposed were the crime to be detected. By way
of example:
• Cambodian farmers can reap 250 times their
monthly salary through the sale of one dead
tiger;
• in Papua Province, Indonesia, a shipload of
illegal timber yields profits of roughly $92,000,
while the penalty is only US $6.47: the rewards
are over 14,000 times greater than the risks;
• in Brazil, illegal loggers in the Atlantic Forest
can make $75 per tree they harvest but face a
deterrent of only US$6.44;
• in Mexico's Selva Maya Forest, poachers
obtain a net average of $191.57 per trip but
face a deterrent of only $5.66;
• in the Philippines, illegal dynamite and cyanide
fishing in the Calamianes Islands earn fisher-
men an average of $70.57 per trip. The value
of the deterrent is only $0.09.
Smuggling wildlife, including many endange-red species, is the third largest and most profitable illegal cross-border activity afterarms and drugs. Due to increasing demand for
animal parts, tigers and other big animal popula-
tions (elephants, rhinos) have declined drastically
since 1950. Growing demand from Asia for ivory
is driving the black market where it now sells for
$750 per kilogram, up from $100 in 1989 and
$200 in 2004.
Source: Akella and Cannon 2004
International treaties may help to protect endan-gered and threatened species but enforcement isdifficult and penalties lack teeth. The 1973 CITES
treaty (Convention on International Trade in Endangered
Species) protects 900 species from being commercially
traded and restricts international trade for 29,000
species that may become threatened. however, a major
constraint on global implementation is that even though
over 170 countries are party to CITES, implementation
and enforcement are inadequate at national level.
7.5.2 NEW APPROACHES NEEDED TO TACKLE CRIME
The economic values of biodiversity and wildlifedriving illegal activities can shed light on possiblepolicy responses. Public spending for improved mo-
nitoring and detection may be a worthwhile investment
as well as providing viable alternatives of livelihoods for
local people. Being a global problem, international col-
laboration to fight environmental crimes is an essential
step towards greater efficiency and effectiveness.
Better enforcement of existing regulations is keyto stopping illegal activities. Poor enforcement often
results in more breaches of legislation affecting all the
threats identified above (pollution, dumping, illegal wild-
life trade, etc). Stronger enforcement can be assisted
by high-tech tools that facilitate crime detection and
identifying the source (detection of illegal logging acti-
vities, DNA tests on poached animals, pollution alerts
and monitoring, satellite tracking of fishing vessels).
however, detection is not an enforcement measure
and more needs to be done to strengthen implemen-
tation. A study by Akella and Cannon (2004) suggests
that strengthening crime detection in isolation has often
been ineffective; it is more promising to address theentire enforcement chain - detection, arrest, prosecution, conviction and penalties - in an inte-grated way.
Applying meaningful penalties and sanctions is
critical to address all types of environmental crimes:
only if penalties are high enough will they deter people
and businesses from undertaking illegal activities. In EU
Member States, environmental offences are subject to
similar penalties as traditional crimes (fines, prison,
community sentences) but in practice, fines are by far
the most common sanction and it is extremely rare to
see prison sentences imposed. however, there is now
a general trend towards more severe sentencing and
a recent study has revealed that the number of prose-
cutions for environmental crimes is increasing (huglo
Lepage and Partners 2003, 2007).
A promising avenue for further progress is the partici-pation of citizens in monitoring and management
activities. Environmental NGos are often in a good
position to monitor conditions on the ground, inves-
tigate breaches of legislation and raise the alarm about
environmental crimes at national or global level.
Several do this very effectively in cases of e.g. forest
destruction, dumping from minefields or marine pollu-
tion. other NGos provide technical support for tracing,
detecting and investigating wildlife trade crimes.
There are now good examples of how citizens can
engage actively in protecting wildlife and reporting bad
practices, which can also help with improving
prosecution rates (see Box 7.21).
T E E B F o R N A T I o N A L A N D I N T E R N A T I o N A L P o L I C y M A K E R S - C h A P T E R 7 : P A G E 3 2
A D D R E S S I N G L O S S E S T H R O U G H R E G U L A T I O N A N D P R I C I N G
Box 7.21: Investigating bats crime in the United Kingdom
All UK bats and their roosts are protected by law.
The Bat Conservation Trust's Investigations
Project was established in 2001 as a two-year
project in collaboration with the Royal Society for
the Protection of Birds to monitor bat-related
crime. 144 incidents were reported to the Investi-
gations Project but it was acknowledged that this
was likely to be just the tip of the iceberg. Building
development and maintenance accounted for
67% of incidents. In addition, 87% of all incidents
involved destruction or obstruction of a roost
threatening the bat population of an area. The
work of the BCT led to the criminal prosecution
and penalisation of several offenders (recent fines
include £3,500 for destruction of 2 roosts by a
developer).
Source: Bat Conservation Trust 2009
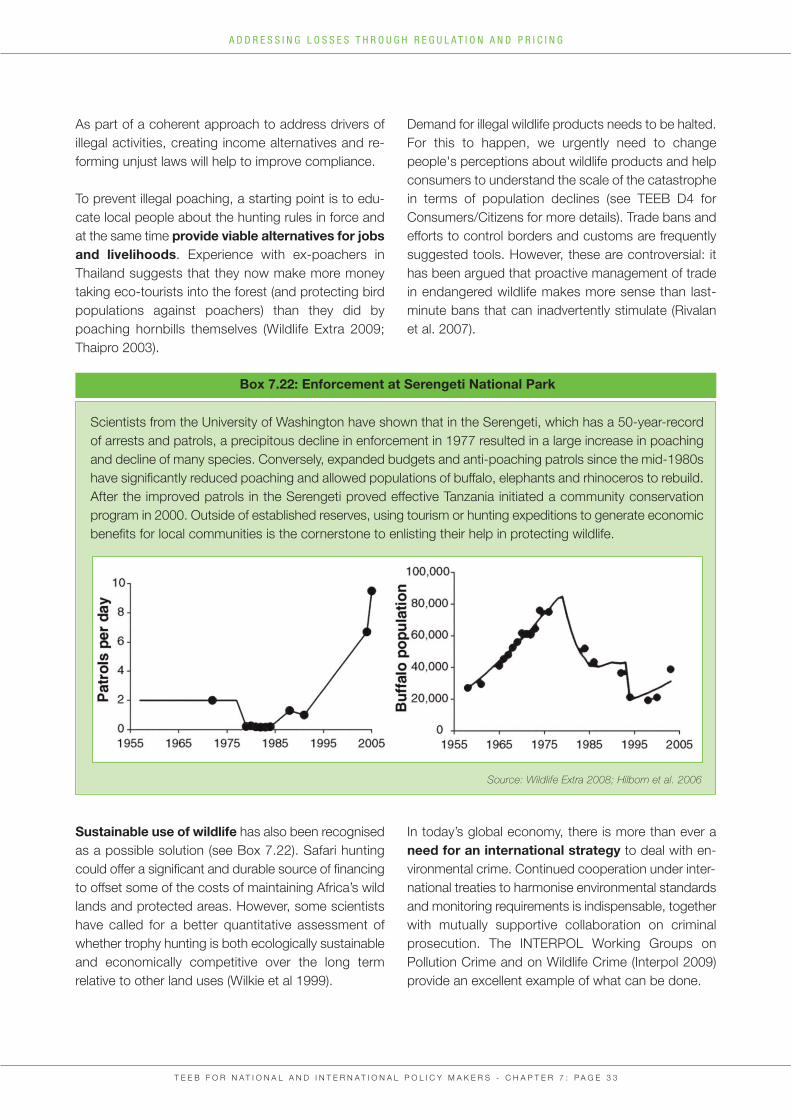
As part of a coherent approach to address drivers of
illegal activities, creating income alternatives and re-
forming unjust laws will help to improve compliance.
To prevent illegal poaching, a starting point is to edu-
cate local people about the hunting rules in force and
at the same time provide viable alternatives for jobsand livelihoods. Experience with ex-poachers in
Thailand suggests that they now make more money
taking eco-tourists into the forest (and protecting bird
populations against poachers) than they did by
poaching hornbills themselves (Wildlife Extra 2009;
Thaipro 2003).
Sustainable use of wildlife has also been recognised
as a possible solution (see Box 7.22). Safari hunting
could offer a significant and durable source of financing
to offset some of the costs of maintaining Africa’s wild
lands and protected areas. however, some scientists
have called for a better quantitative assessment of
whether trophy hunting is both ecologically sustainable
and economically competitive over the long term
relative to other land uses (Wilkie et al 1999).
Demand for illegal wildlife products needs to be halted.
For this to happen, we urgently need to change
people's perceptions about wildlife products and help
consumers to understand the scale of the catastrophe
in terms of population declines (see TEEB D4 for
Consumers/Citizens for more details). Trade bans and
efforts to control borders and customs are frequently
suggested tools. however, these are controversial: it
has been argued that proactive management of trade
in endangered wildlife makes more sense than last-
minute bans that can inadvertently stimulate (Rivalan
et al. 2007).
In today’s global economy, there is more than ever a
need for an international strategy to deal with en-
vironmental crime. Continued cooperation under inter-
national treaties to harmonise environmental standards
and monitoring requirements is indispensable, together
with mutually supportive collaboration on criminal
prosecution. The INTERPoL Working Groups on
Pollution Crime and on Wildlife Crime (Interpol 2009)
provide an excellent example of what can be done.
T E E B F o R N A T I o N A L A N D I N T E R N A T I o N A L P o L I C y M A K E R S - C h A P T E R 7 : P A G E 3 3
A D D R E S S I N G L O S S E S T H R O U G H R E G U L A T I O N A N D P R I C I N G
Box 7.22: Enforcement at Serengeti National Park
Scientists from the University of Washington have shown that in the Serengeti, which has a 50-year-record
of arrests and patrols, a precipitous decline in enforcement in 1977 resulted in a large increase in poaching
and decline of many species. Conversely, expanded budgets and anti-poaching patrols since the mid-1980s
have significantly reduced poaching and allowed populations of buffalo, elephants and rhinoceros to rebuild.
After the improved patrols in the Serengeti proved effective Tanzania initiated a community conservation
program in 2000. outside of established reserves, using tourism or hunting expeditions to generate economic
benefits for local communities is the cornerstone to enlisting their help in protecting wildlife.
Source: Wildlife Extra 2008; Hilborn et al. 2006
T E E B F o R N A T I o N A L A N D I N T E R N A T I o N A L P o L I C y M A K E R S - C h A P T E R 7 : P A G E 3 4
A D D R E S S I N G L O S S E S T H R O U G H R E G U L A T I O N A N D P R I C I N G
Policies that make the polluter take the full costof loss into account are a key element of respon-ses to the biodiversity challenge. Policy mixes arecrucial for this purpose – they can combine theadvantages of different instruments and deliverpositive synergies, if properly designed and if in-stitutional and cultural factors are not neglected.
Policies to avoid ongoing losses form the back-bone of the policy response. Minimising emissions
from point sources (e.g. factories) and diffuse sources
(e.g. pesticides) and tackling resource over-use are
essential to halt losses and maintain ecosystem
services and functions.
Policy makers already have a useful toolkit at their
disposal. Pollution control, resource use minimisation
and land use management can best be achieved on
the basis of a strong regulatory framework. Regulation,
especially setting standards, has achieved great
successes: many environmental problems that were
pressing in the past (e.g. contamination of water
bodies, high concentrations of pollutants in the
atmosphere) have been significantly reduced through
this type of instrument. There is considerable scope for
further use of regulation to address environmental pro-
blems directly. however, a strong regulatory frame-work can also provide more: it is a basic pre-condition for introducing other instruments such
as offset requirements, biodiversity banking or ecolo-
gically-focused taxes.
No single policy instrument is enough to tackle the
wide range of activities, sources and sectors affecting
biodiversity and ecosystem services provision. Market-
based instruments are crucial to keep the costs of
action low as they encourage actors to develop and
implement the cheapest abatement options. The real
challenge is to create smart policy mixes combining
MAKING IT hAPPEN – PoLICy MIxES
To GET RESULTS 7.6 the advantages of regulation and flexible market-based instruments to reach the full potential of
the polluter pays and full cost recovery principles
(see Figure 7.4).
Policy mixes offer opportunities to address various
ecosystem services and various actors at the same
time. The optimal policy mix will depend on the state
of the resource or ecosystem in question and the num-
ber and variety of actors affected. By way of example:
• in the field of hazard prevention, strong environmen-
tal regulation is important (e.g. banning highly
toxic substances that may be released into the
environment);
• for sustainable management of renewable resour-
ces, market-based solutions such as permit
trading or introducing taxes merit serious con-
sideration;
• even for a single resource, a combined approach
is often suitable e.g. in fisheries policies, no-take
zones such as marine protected areas might be
appropriate to provide undisturbed spawning
grounds while fish catch might best be managed
through individual tradable quotas.
Market-based instruments can deliver significant
social benefits as they stimulate consideration of
different abatement costs among resource users and
development of least-cost solutions. however, these
appro-aches are insensitive to distributional concerns
and often neglect the needs of the poor and vulner-
able. Governments around the world already use a
significant share of their revenues to equalise incomes
and regulate market activity to ensure wider access to
goods and services by such groups. For this reason,
smart policy mixes need to go beyond simple cost
recovery mechanisms to include appropriate distri-butional measures.
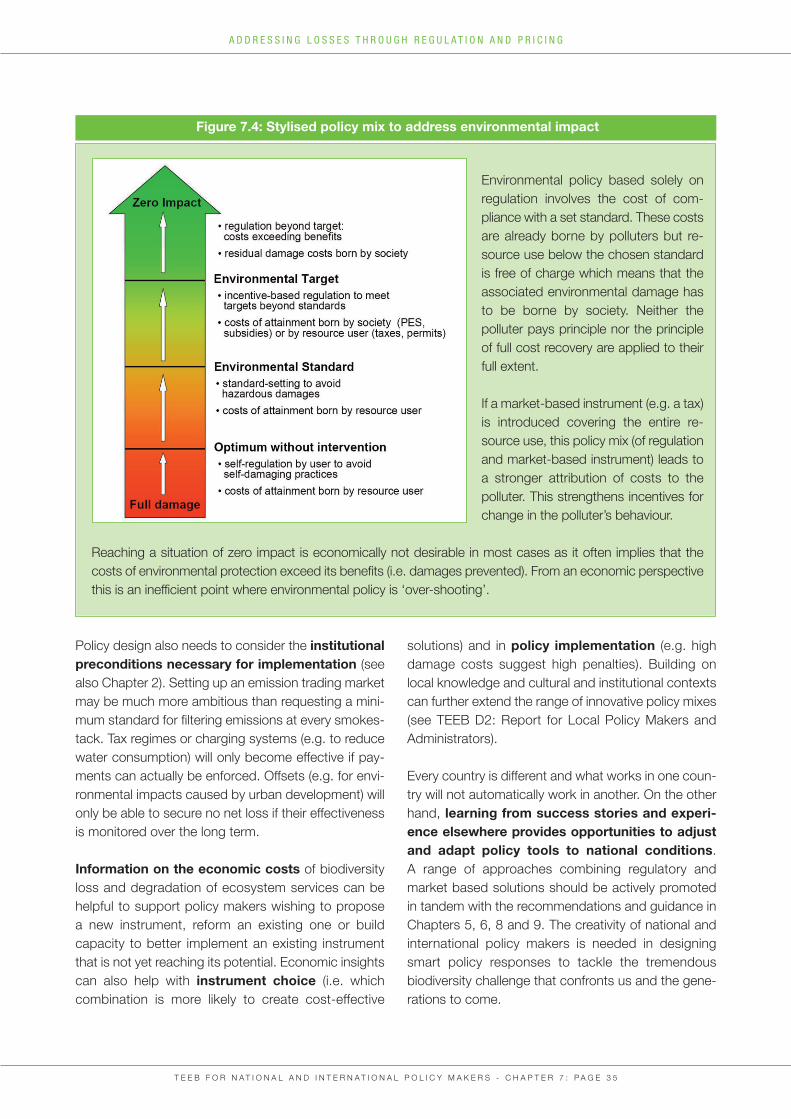
solutions) and in policy implementation (e.g. high
damage costs suggest high penalties). Building on
local knowledge and cultural and institutional contexts
can further extend the range of innovative policy mixes
(see TEEB D2: Report for Local Policy Makers and
Administrators).
Every country is different and what works in one coun-
try will not automatically work in another. on the other
hand, learning from success stories and experi-ence elsewhere provides opportunities to adjustand adapt policy tools to national conditions.
A range of approaches combining regulatory and
market based solutions should be actively promoted
in tandem with the recommendations and guidance in
Chapters 5, 6, 8 and 9. The creativity of national and
international policy makers is needed in designing
smart policy responses to tackle the tremendous
biodiversity challenge that confronts us and the gene-
rations to come.
T E E B F o R N A T I o N A L A N D I N T E R N A T I o N A L P o L I C y M A K E R S - C h A P T E R 7 : P A G E 3 5
A D D R E S S I N G L O S S E S T H R O U G H R E G U L A T I O N A N D P R I C I N G
Figure 7.4: Stylised policy mix to address environmental impact
Environmental policy based solely on
regulation involves the cost of com-
pliance with a set standard. These costs
are already borne by polluters but re-
source use below the chosen standard
is free of charge which means that the
associated environmental damage has
to be borne by society. Neither the
polluter pays principle nor the principle
of full cost recovery are applied to their
full extent.
If a market-based instrument (e.g. a tax)
is introduced covering the entire re-
source use, this policy mix (of regulation
and market-based instrument) leads to
a stronger attribution of costs to the
polluter. This strengthens incentives for
change in the polluter’s behaviour.
Reaching a situation of zero impact is economically not desirable in most cases as it often implies that the
costs of environmental protection exceed its benefits (i.e. damages prevented). From an economic perspective
this is an inefficient point where environmental policy is ‘over-shooting’.
Policy design also needs to consider the institutionalpreconditions necessary for implementation (see
also Chapter 2). Setting up an emission trading market
may be much more ambitious than requesting a mini-
mum standard for filtering emissions at every smokes-
tack. Tax regimes or charging systems (e.g. to reduce
water consumption) will only become effective if pay-
ments can actually be enforced. offsets (e.g. for envi-
ronmental impacts caused by urban development) will
only be able to secure no net loss if their effectiveness
is monitored over the long term.
Information on the economic costs of biodiversity
loss and degradation of ecosystem services can be
helpful to support policy makers wishing to propose
a new instrument, reform an existing one or build
capacity to better implement an existing instrument
that is not yet reaching its potential. Economic insights
can also help with instrument choice (i.e. which
combination is more likely to create cost-effective
T E E B F o R N A T I o N A L A N D I N T E R N A T I o N A L P o L I C y M A K E R S - C h A P T E R 7 : P A G E 3 6
A D D R E S S I N G L O S S E S T H R O U G H R E G U L A T I O N A N D P R I C I N G
Chapter 7 has shown the critical need to strengthen and target a smart policy mix of instrumentsaligned, as far as possible, with the polluter pays and full cost recovery principles. A strong regulatory
framework and good governance is the baseline from which more innovative and ambitious compensation
and market-based mechanisms can be developed. Improved application of liability and enforcement
regimes is essential to make existing and new policies deliver effective and equitable results.
Chapter 8 discusses the potential of protected areas to add value to biodiversity and ecosystem services
with associated gains for local and wider communities.
REFERENCES
Akella, A. S. and Cannon, J. B. (2004) Strengthening the Weakest
Links: Strategies for Improving the Enforcement of Environmental
Laws Globally. Centre for Conservation and Government at
Conservation International. URL: http://www.oecd.org/dataoecd/
18/37/33947741.pdf (last access Sep 24, 2009).
Arin, T. and Kramer, R. A. (2002) Divers' Willingness to Pay to visit
Marine Sanctuaries: An Exploratory Study. ocean and Coastal
Management 45: 171-183.
Ashiabor, h. (2004) Taxation and the fostering of biodiversity con-
servation in Australia. Bulletin for International Fiscal Documenta-
tion 58(7): 315-325.
Barroso, J. M. D. (2009) Biodiversity: Giving Proper value to a
Priceless Asset. speech at ‘Biodiversity Protection – Beyond
2010’ conference in Athens, 27 April 2009. URL: http://www.
eu-un.europa.eu/articles/en/article_8673_en.htm (last access
Sep, 14, 2009).
Bassi, S.; ten Brink, P.; Pallemaerts, M. and von homeyer, I. (2009)
Feasibility of implementing a radical ETR and its acceptance.
Report under task C of the ‘Study on Tax Reform in Europe over
the Next Decades: Implication for the Environment, for Eco-
Innovation and for household Distribution’ for the European En-
vironment Agency. Forthcoming 2009. Brussels.
Bat Conservation Trust (2009) Bats – the real stars of the night.
URL: http://www.bats.org.uk/ (last access oct 16, 2009).
Bayon, R. (2008) Banking on Biodiversity. Chapter 9 in 2008 State
of the Environment Report - Innovations for a Sustainable
Economy. The Worldwatch Institute: 123-137.
Bayon, R. (2004) Making environmental markets work: Lessons
from early experience with sulphur, carbon, wetlands, and other
related markets. Forest Trend, Washington D.C.
BBoP – Business and Biodiversity offsets Programme (2008)
Principles on Biodiversity offsets Supported by the BBoP Advi-
sory Committee. URL: http://bbop.forest-trends.org/guidelines/
principles.pdf (last access oct 16, 2009).
BBoP – Business and Biodiversity offsets Programme (2009) Bio-
diversity offsets. URL: http://bbop.forest-trends.org/offsets.php
(last access Sep, 14, 2009).
Bean, M.; Kihslinger, R. and Wilkinson, J. (2008) Design of US
habitat banking systems to support the conservation of wildlife
habitat and at-risk species. The Environmental Law Institute,
Washington D.C.
Burtraw, D. and Szambelan, S. (forthcoming) US Emissions
Trading Markets for So2 and Nox. In: hansjürgens, B.; Antes,
R. and Sterk, M. (Eds.): Permit Trading in Different Applications.
Routledge Publisher, in print.
Carroll, N.; Fox, J. and Bayon, R. (2007) Conservation and bio-
diversity banking: a guide to setting up and running biodiversity
credit trading systems. Earthscan, London.
Department of Environment and Climate Change of the
Government of New South Wales (2009) BioBanking. URL:
http://www.environment.nsw.gov.au/biobanking/ (last access oct
16, 2009).
Dinar, A. (2000) The political economy of water pricing reforms.
A World Bank Publication, oxford University Press.
Dixon, J. A.; Fallon Scura, L. and van't hof, T. (1993) Meeting
ecological and economic goals: marine parks in the Caribbean.
Ambio 22: 117–125.
Dunbar, S. G. (w/o) Lecture 9 - Paying for Biodiversity. URL:
http://resweb.llu.edu/rford/courses/BIoL549/docs/Lecture9
PayingForBiodiversity.pdf (last access Aug 19, 2009).
Ecotec (2001) Study on the Economic and Environmental
Implications of the Use of Environmental Taxes and Charges in
the European Union and its Member States. URL:
http://ec.europa.eu/environment/enveco/taxation/pdf/ch1t4_
overview.pdf (last access Aug 19, 2009).
Emerton, L. (1997) Seychelles Biodiversity: Economic Assess-
ment. URL: http://www.cbd.int/doc/external/countries/seychel-
les-eco-assessment-1997-en.pdf (last access Aug 19, 2008).
ENCoRA (2008) overview of oil spills events from 1970 to 2000.
URL http://www.coastalwiki.org/coastalwiki/overview_of_oil_
spills_events_from_1970_to_2000 (last access oct 16, 2009).
Forest Trend (2009) Markets for Ecosystem Services in China:
An Exploration of China’s ‘Eco-compensation’ and other Market-
Based Environmental Policies. URL: http://www.forest-trends.org/
documents/files/doc_2317.pdf (last access Aug 19, 2009).
GIST – Green India States Trust (2006) The value of Timber,
Carbon, Fuelwood, and Non-Timber Forest Products in India’s
Forests. URL: http://www.gistindia.org/pdfs/GAISPMonograph.pdf
(last access Aug 19, 2009).
Guerrero, h. and howe. C (2000) Water pricing in Mexico:
principles and reality. URL: http://www.soc.uoc.gr/calen-
dar/2000EAERE/papers/PDF/D1-howe.pdf (last access oct 16,
2009).
Gusbin, D.; Klaassen, G. and Kouvaritakis, K. (1999) Costs of a
ceiling on Kyoto flexibility and Presentation at the IAEA Workshop
- The Clean Development Mechanism and Nuclear Power. URL:
http://r0.unctad.org/ghg/background.htm (last access Aug 19,
2009).
T E E B F o R N A T I o N A L A N D I N T E R N A T I o N A L P o L I C y M A K E R S - C h A P T E R 7 : P A G E 3 7
A D D R E S S I N G L O S S E S T H R O U G H R E G U L A T I O N A N D P R I C I N G
T E E B F o R N A T I o N A L A N D I N T E R N A T I o N A L P o L I C y M A K E R S - C h A P T E R 7 : P A G E 3 8
A D D R E S S I N G L O S S E S T H R O U G H R E G U L A T I O N A N D P R I C I N G
Gutman, P. and Davidson, S. (2007) A review of innovative inter-
national financial mechanism for biodiversity conservation with
a special focus on the international financing of developing
countries’ protected areas. URL: http://www.cbd.int/doc/
meetings/pa/wgpa-02/information/wgpa-02-inf-08-en.doc (last
access Aug 19, 2009).
hansjürgens, B. (1992) Umweltabgaben im Steuersystem. Zu
den Möglichkeiten einer Einfügung von Umweltabgaben in das
Steuer- und Abgabensystem der Bundesrepublik Deutschland.
Nomos, Baden-Baden.
hansjürgens, B. (2000) Effizienzsteigerungen in der Umweltpolitik
durch Policy-Mix – Umweltordnungsrecht und handelbare
Umweltnutzungsrechte. in: Gawel, E. und Lübbe-Wolff, G. (Eds.):
Effizientes Umweltordnungsrecht. Nomos, Baden-Baden:
251-275.
hansjürgens, B. (2004) Cost Recovery and Water Pricing. Presen-
tation at Wageningen University, May 26, 2004.
hansjürgens, B. Antes, R. and M. Sterk (Eds.) (forthcoming) Permit
Trading in Different Applications. Routledge Publisher, in print.
huglo Lepage & Partners Counsel (2003) Criminal Penalties in EU
Member States’ environmental law - Final Report, 15-09-03.
Study Contract:ENv.B.4-3040/2002/343499/MRA/A. Available at:
http://ec.europa.eu/environment/legal/crime/pdf/criminal_
penalties2.pdf (last access Aug 19, 2009).
huglo Lepage & Partners (2007) Study on environmental crime
in the 27 Member States. Contract JLS/D3/2006/05. URL:
http://ec.europa.eu/environment/legal/crime/pdf/report_
environmental_crime.pdf (last access Aug 19, 2009).
hunt C. (1997) Economic Instruments for Environmental and
Natural Resources Conservation and Management in the South
Pacific. Working paper in Ecological Economics No 9706. Centre
for Resource and Environmental Studies, Australian National
University, Canberra. URL: http://een.anu.edu.au/download_
files/eep9706.pdf (last access oct 16, 2009).
IEEP et al (2007) Reforming environmentally harmful subsidies.
Final report to the European Commission’s DG Environment,
March 2007.
Interpol (2009) Environmental crime. URL: http://www.interpol.int/
Public/EnvironmentalCrime/Default.asp (last access Aug 19, 2009).
IToPF – The International Tanker owners Pollution Federation
Limited (2009) Statistics. URL: http://www.itopf.com/information-
services/data-and-statistics/statistics/ (last access oct 16, 2009).
Korean Ministry of Environment (2009) Website of the Ministry.
URL: http://eng.me.go.kr/docs/sub2/policy_view.html?idx=
50&class=13&topmenu=B&cat=240 (last access Aug 19, 2009).
Korean Ministry of Environment (2006) volume-based Waste Fee
System in Korea. URL: http://eng.me.go.kr/docs/publication/
filedown.html?filename=vBWF(06).pdf&mcode=B (last access
Aug 19, 2009).
McGlade, J. (2007) speech of the morning plenary session on
18 october 2007 at the 8th Global Conference on Environmental
Taxation, Munich, Germany, 18–20 october 2007. URL:
http://www.eea.europa.eu/pressroom/speeches/eco-innovation-
and-climate-change-the-role-of-fiscal-instruments (last access
oct 16, 2009).
Millennium Ecosystem Assessment (2005) Ecosystems and
huamn Well-being: Global Assessment Reports. URL: http://
millenniumassessment.org/en/Global.aspx (last access oct 16,
2009).
Ministry of Fisheries New Zealand (2005) Characteristics of the
fishing sectors. URL: http://www.fish.govt.nz/en-nz/Publicati-
ons/Ministerial+Briefings/Ministerial+Briefing+05/Annex+1+-+
Fisheries+Management+in+New+Zealand/Characteristics+of+the
+fishing+sectors.htm (last access Aug 19, 2009).
Naumann, M. (2003) Current Status of Water Sector in the Czech
Republic. Working Paper.
New york Times, Feb 02, 2008: Motivated by a Tax, Irish Spurn
Plastic Bags. URL: http://www.nytimes.com/2008/02/02/world/
europe/02bags.html (last access oct 16, 2009).
oECD – organisation for Economic Co-operation and Develop-
ment (1999a) Implementing domestic tradable permits for
environmental protection. oECD, Paris.
oECD – organisation for Economic Co-operation and Develop-
ment (1999b) handbook of Incentive Measures for Biodiversity:
Design and Implementation. oECD, Paris.
oECD – organisation for Economic Co-operation and Develop-
ment (2006) Improving Water Management: Recent oECD
Experience. Policy Brief February 2006. URL:
http://www.oecd.org/dataoecd/31/41/36216565.pdf (last access
oct 16, 2009).
Pruetz, R. and Standridge, N. (2009) What makes Transfer of
Development Rights work? Success factors from esearch and
practice. Journal of the American Planning Association 75 (1):
78-87.
Rio Tinto (2004) Rio Tinto’s biodiversity strategy. URL:
http://www.riotinto.com/documents/CorpPub_Biodiversity
Strategy.pdf (last access Sep 14, 2009).
Rivalan, P.; Delmas, v.; Angulo, E.; Bull, L.S.; hall, R. J.;
Courchamp, F.; Rosser, A.M. and Leader-Williams, N. (2007)
Can bans stimulate wildlife trade? Nature 447: 529-530.
Shine, C. (2005) Using tax incentives to conserve and enhance
biodiversity in Europe. Council of Europe, Nature and Environ-
ment. N 143.
Slootweg, R. and van Beukering, P. (2008) valuation of ecosystem
services and strategic environmental assessment: lessons from
influential cases. Netherlands Commission for Environmental
Assessment. URL: http://www.indiaenvironmentportal.org.in/files/
cs-impact-nl-sea-valuation-en.pdf (last access oct 16, 2009).
Stinapa Bonaire - Stichting Nationale Park Foundation Bonaire
(2009) Stinapa Bonaire. URL: http://www.stinapa.org/ (last access
oct 16, 2009).
Swedish Forestry Act. URL: http://www.svo.se/episerver4/tem-
plates/SNormalPage.aspx?id=12677 (last access oct 16, 2009).
Swedish Forestry Statistics. URL: http://www.svo.se/minskog/
Templates/EPFileListing.asp?id=16685 (last access oct 16,
2009).
TEEB D0 – Ecological and Economic Foundations. Draft chapters
for comment available. URL: www.teebweb.org.
TEEB D2 – TEEB for Local Policy Makers and Administrators
(forthcoming). URL: www.teebweb.org.
TEEB D3 – TEEB for Business (forthcoming). URL: www.teeb-
web.org.
TEEB D4 – TEEB for Citizens (forthcoming). URL: www.teebweb.org.
ten Brink, P.; Lutchman, I.; Bassi, S.; Speck, S.; Sheavly, S.;
Register, K. and Woolaway, C. (2009) Guidelines on the Use of
Market-based Instruments to Address the Problem of Marine
Litter. Institute for European Environmental Policy (IEEP), Brussels,
Belgium, and Sheavly Consultants, virginia Beach, virginia, USA.
ten Kate, K.; Bishop, J. and Bayon, R. (2004) Biodiversity offsets:
views, experience, and the business case. IUCN and Insight
Investment, Gland, Switzerland and Cambridge, UK.
Thaindian News July 10, 2009 Apex court provides funds for
afforestation, wildlife conservation. URL: http://www.thaindian.
com/newsportal/enviornment/apex-court-provides-funds-
for-afforestation-wildlife-conservation_100216356.html (last
access Aug 19, 2009).
Thaipro (2003) Thai poachers become animal protectors. URL:
h t t p : / / w w w. w i l d l i f e e x t r a . c o m / g o / n e w s / t h a i l a n d -
hornbills783.html#cr (last access Sep 24, 2009).
The Work Done by the Swedish Forestry organisation in order to
put the Environmental Goal on an Equal Footing with the
Production Goal (1999). URL: http://eurosai.nik.gov.pl/en/site/px_
Swedish_Forestry_Sweden.pdf (last access oct 16, 2009).
UNDP – United Nations Development Programme (2001) The Use
of Economic Measures in National Biodiversity Strategies and
Action Plans: A Review of Experiences, Lessons Learned and
Ways Forward. URL: http://www.undp.org/biodiversity/biodiver-
sitycd/use%20of%20economic%20measures%20in%20NBSAPs
.pdf (last access Sep 9, 2009).
UNDP – United Nations Development Programme (2003) A Case
Study on Commitments-Related Best Practice or lessons learned.
In: Water in the Czech Republic. URL: http://waterwiki.net/
i n d e x . p h p / A _ C a s e _ S t u d y _ o n _ C o m m i t m e n t s -
Related_Best_Practice_or_Lessons_Learned_in_Water_in_the_C
zech_Republic (last access Sep 9, 2009).
UNEP – United Nations Environmental Programme (2009a) Rio
Declaration on Environment and Development. URL:
http://www.unep.org/Documents.Multilingual/Default.asp?
DocumentID=78&ArticleID=1163&l=en, (last access Sep 9, 2009).
UNEP – United Nations Environmental Programme (2009b) Marine
Litter: A Global Challenge. URL: http://www.unep.org/pdf/
UNEP_Marine_Litter-A_Global_Challenge.pdf (last access oct 16,
2009).
UN FAo – Food and Agriculture organization of the United Nations
(2001) Global Forest Resource Assessment 2000. URL:
ftp://ftp.fao.org/docrep/fao/003/y1997E/FRA%202000%20Main
%20report.pdf (last access oct 16, 2009).
UN FAo – Food and Agriculture organization of the United Nations
(2006) Global Forest Resource Assessment 2005. URL:
ftp://ftp.fao.org/docrep/fao/008/A0400E/A0400E00.pdf (last
access oct 16, 2009).
US EPA - US Environmental Protection Agency (2001) EPA’s acid rain
program: Results of phase I, EPA 430-F01-022. Washington D.C.
yandle, T. and Dewees, C. M. (2008) Consolidation in an Individual
Transferable Quota Regime: Lessons from New Zealand
1986–1999. Environmental Management 41 (6): 915–928.
Walls, M. and McConnel, v. (2007) Transfer of Development Rights
in US Communities: Evaluating program design, implementation,
and outcomes. RFF, Washington D.C. URL: http://www.rff.org/rff/
News/Features/upload/30347_1.pdf (last access Aug 19, 2009).
Wätzold, F. (2004) So2 Emissions in Germany: Regulations to
Fight Waldsterben. in: harrington, W., Morgenstern, D., Sterner,
T. (Eds.): Choosing Environmental Policy: Comparing Instruments
and outcomes in the United States and Europe. RFF-Press,
Washington D.C.: 23-40.
Worm, B. et al. (2009) Rebuilding Global Fisheries. Science 325:
578-585.
Wildlife Extra (2009) hornbill Conservation in Thailand - Poacher
to Gamekeeper. URL: http://www.wildlifeextra.com/go/news/
thailand-hornbills783.html#cr (last access Sep 24, 2009).
Wilkie, D. S. and Carpenter, J. (1999) The potential role of safari
hunting as a source of revenue for protected areas in the Congo
Basin. oryx 33(4): 340-345.
Wilkinson, C. R. (ed.) (2004) Status of the coral reefs of the world
- 2004. volumes 1 and 2. Australian institute for marine Sciences,
Townsville, Australia.
young, J.E. (1992) Mining the earth. Worldwatch Paper 109,
Worldwatch Institute, Washington D.C.
Zylicz, T.; Bateman, I.; Georgiou, S.; Markowska, A.; Dziegie-
lewska, D.; Turner, K.; Graham, A. and Langford, I. (1995) Contin-
gent valuation of eutrophication in the Baltic Sea region. CSERGE
Working Paper GEC 95-03. URL: http://www.uea.ac.uk/env/
cserge/pub/wp/gec/gec_1995_03.pdf (last access Sep, 19, 2009).
T E E B F o R N A T I o N A L A N D I N T E R N A T I o N A L P o L I C y M A K E R S - C h A P T E R 7 : P A G E 3 9
A D D R E S S I N G L O S S E S T H R O U G H R E G U L A T I O N A N D P R I C I N G