Embed Size (px)
Citation preview
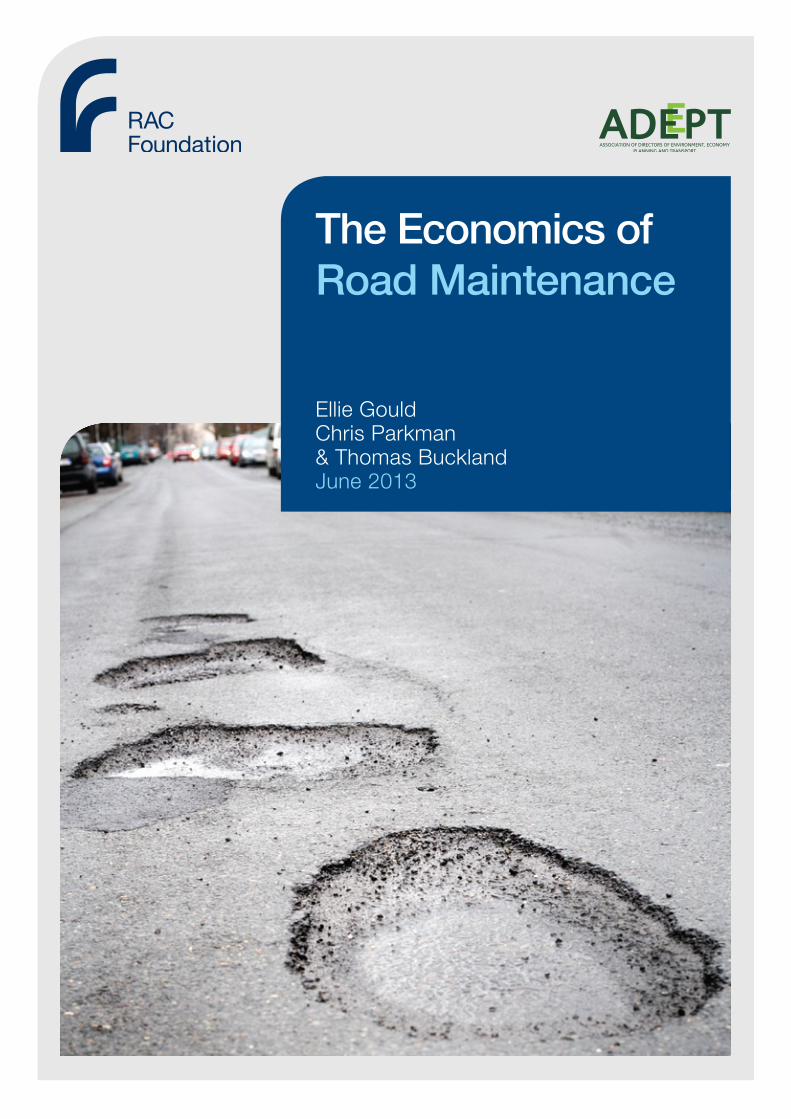
The Economics of Road Maintenance
Ellie Gould Chris Parkman & Thomas Buckland June 2013
The Association of Directors of Environment, Economy, Planning & Transport (ADEPT) is a professional association representing local authority Strategic Directors who manage some of the most pressing issues facing the UK today. ADEPT membership is drawn from across the United Kingdom and the Association’s ‘Prospectus for Growth’ recognises investment in the existing highway network as being a critical component in delivering sustainable growth, both locally and nationally.
The Royal Automobile Club Foundation for Motoring Ltd is a transport policy and research organisation which explores the economic, mobility, safety and environmental issues relating to roads and their users. The Foundation publishes independent and authoritative research with which it promotes informed debate and advocates policy in the interest of the responsible motorist.
RAC Foundation 89–91 Pall Mall London SW1Y 5HS
Tel no: 020 7747 3445 www.racfoundation.org
Registered Charity No. 1002705 June 2013 © Copyright Royal Automobile Club Foundation for Motoring Ltd
The Economics of Road Maintenance
Ellie Gould Chris Parkman & Thomas Buckland June 2013
i
About the AuthorsEllie Gould is a Senior Consultant at the UK’s Transport Research Laboratory, with a focus on the social aspects of transport planning; particularly mobility, inclusivity and the impact of environmental design on modal choice. She has led a number of research projects into pedestrian and cyclist environments, and has undertaken research both in the UK and internationally in Africa, Australasia, the Middle East and North America. She has presented international lectures on her work.
Chris Parkman is a Technical Director at the UK’s Transport Research Laboratory responsible for asset management projects at TRL. He has more than 20 years of international experience of road asset management having worked on assignments on every continent in research, consultancy and government client roles. He returned to TRL in 2010, having spent the previous 10 years in New Zealand, where he became Asset Manager of the national highway network. He is a chartered engineer, has published widely and has been a representative on various national and international committees (e.g. Austroads, World Road Association) at different times.
About this reportThis report has been produced by the Transport Research Laboratory (TRL) under a contract with the RAC Foundation, on behalf of the RAC Foundation and the Association of Directors of Environment, Economy, Planning & Transport (ADEPT). Any views expressed in this report are not necessarily those of RAC Foundation or ADEPT.
The information contained herein is the property of TRL Limited and does not necessarily reflect the views or policies of the customer for whom this report was prepared. While every effort has been made to ensure that the matter presented in this report is relevant, accurate and up-to-date, TRL Limited cannot accept any liability for any error or omission, or reliance on part or all of the content in another context.
The Economics of Road Maintenance
iiiThe Economics of Road Maintenance
Contents
About the Authors i
About this report i
Foreword iv
Executive Summary vi
1. Introduction 1
2. Background 3
3. Methodology 5
4. Network Characteristics 9
5. Summary of Impacts 14
6. Discussion and Conclusions 24
7. Recommendations for Future Study 26
8. References and Bibliography 28
Appendix A: Qualitative Impacts (tabulated) 32
Appendix B: Questionnaires to Local Authorities 42
B1: Initial questionnaire 42
B2: Follow-up-questionnaire 45
iv
ForewordThe state of our nation’s economy could be said to be reflected in the condition of our local roads. When times are good, central government invest more in the road network, both nationally and locally, leading to improvements in overall condition and reductions in impacts such as travel delays, vehicle damage and insurance claims. Conversely, when central budgetary belts are tightened, road maintenance funding is reduced and the network deteriorates. But, should we see this cyclical process in reverse and consciously increase spending on improved road condition as a means of increasing economic and social benefits, even during times of overall financial constraint?
The RAC Foundation and ADEPT have jointly commissioned this research to help better understand the wider effects of local road maintenance spending changes in England and Wales, beyond just the direct impact on network condition. The findings are based on a literature review and the results of a questionnaire circulated amongst a sample of local highway authorities to establish current and future maintenance activities. It is comparable and complementary to the recent work completed by Transport Scotland on the social, environmental and economic effects of road maintenance funding. This report is by no means the complete story. It is a starting point. More work is needed if we are to make a robust case for continued investment in this vital infrastructure.
The report draws two key conclusions. Firstly, the diversity in type, size and strategic approach across the large number of local highway authorities in England & Wales means that direct national correlation with the findings from similar work in Scotland is not appropriate. Whilst there is sufficient comparability to suggest that the headline from Scotland that ‘£1 cut in road maintenance spending resulting in wider costs to society of around £1.50’ is equally applicable in England & Wales, we cannot simply scale up our data to get a different, and probably higher, figure for England & Wales.
Secondly, and perhaps not surprisingly, the report confirms what intuition leads us to believe; that inadequate investment in highway maintenance leads to poor road conditions and increased costs for both network users and managers. It also concludes that over the coming year’s cuts to local government finances will create strong pressures to reduce local road maintenance spending, resulting in further increases in user costs – mainly in higher vehicle operating expenses. So whilst it does not provide the ‘magic bullet’ of a compelling case for increased, or even sustained, investment in maintenance of the local road network, this report provides a clear starting point for further work on determining appropriate levels of maintenance investment, consistent with the aim of sustaining a full contribution to the nation’s growth agenda.
The Economics of Road Maintenance

v
RAC Foundation and ADEPT firmly believe that continued collaboration, involving both central and local government, will be vital if we are to build on this start and make a comprehensive business case for investment in the local road network, whether considered nationally as a whole or at single council or sub-regional level.
Professor Stephen Glaister Director RAC Foundation
Miles Butler President ADEPT
The Economics of Road Maintenance
vi
Executive SummaryIn September 2012, the RAC Foundation and the Association of Directors of Environment, Economy, Planning & Transport (ADEPT) commissioned TRL to assess the effects of changes in non-trunk road maintenance expenditure in England and Wales.
Inadequate investment in highway maintenance results in deteriorating road conditions, which can increase costs for users and society. For example, vehicles consume more fuel when travelling on poorly maintained roads, and diversions because of failed infrastructure or emergency repair works cause additional travel time costs. There may also be wider costs to society associated with poorer environmental management (e.g. flood damage), safety and security controls (e.g. inadequate lighting provision), and even accessibility if parts of the network have to be permanently closed or restricted for travel. Such impacts affect businesses and economic activity. Delays to maintenance now can also lead to increased costs of maintenance later, when more significant interventions may be required.
The current and expected future funding levels for local authorities in England and Wales mean that there will be strong pressures to reduce road maintenance expenditure on local roads in the next few years. In this context, the RAC Foundation and ADEPT saw benefit in moving beyond a summary of the known generic impacts of maintenance, to establish the nature and magnitude of the impacts that might be expected on local roads in England and Wales. Such knowledge would provide a useful contribution to future decision-making by all levels of government.
To support the recent National Roads Maintenance Review for Scotland, a more comprehensive assessment of the social, environmental and economic impacts of road maintenance was undertaken. Qualitative and quantitative analyses were undertaken to establish the impacts in that context (Parkman et al, 2012a). The aim of the RAC Foundation and ADEPT study was not to repeat this work but rather to consolidate, explore key areas of difference, and understand the degree to which any results are transferable from the Scotland study to the local road context in England and Wales.
Recent literature was explored, and a questionnaire requesting specific items of information was circulated among a number of local authorities to obtain data for use in this study and to assess the data available for a more detailed future study. The qualitative evidence of impacts was summarised based on Department for Transport (DfT) guidance with a focus on those impacts that can potentially be monetised. The evidence shows that there will be economic, environmental, safety, accessibility and integration impacts associated with any reductions in road maintenance.
The Economics of Road Maintenance
vii
It was confirmed that no significant new impacts or approaches to the analysis have emerged since the completion of the Scotland study (Parkman et al., 2012a). However, the relative balance of the impacts will be different in England and Wales based on the differences in the networks (e.g. proportion of roads in urban areas and levels of traffic). It was also noted that the diversity across local authorities in England and Wales is possibly greater than in Scotland and this, in particular, will affect the formulation of any further in-depth study on the topic.
The Scotland study suggests that the most significant quantitative economic impact of road maintenance arose because of changes in carriageway maintenance investment and activity and resulting carriageway conditions (Parkman et al., 2012a). The review of quantitative evidence gained from that study indicates that this will also be true for England and Wales. With higher traffic levels in England and Wales, there is no a priori reason why the most significant quantitative impacts should not also be due to projected changes in carriageway maintenance on the English and Welsh local road networks.
It was more of a challenge to complete a quantitative analysis for the English and Welsh local road networks compared to the Scottish study, for two reasons:
• Scottish local authorities, through their Society of Chief Officers of Transportation in Scotland (SCOTS) collaboration, have developed a model that projects road conditions based on budget scenarios using a consistent approach for all local authorities in Scotland. Such a model is not available for the English and Welsh networks
• There is a greater proportion of C class and unclassified roads in England and Wales (for which there is less condition data available), which would mean the results of any scaling of results from the analyses on A and B class roads (for which information is more readily available) to provide the results for the whole network would be less reliable
An outline methodology has been developed to describe the recommended steps required for a future study to provide more comprehensive results. These are to:
• establish a carriageway condition projection model approach – a relatively simple, network-level model is suggested as the first step for an analysis of this type;
• summarise the current network condition for carriageways in the format required for the model – assumptions would need to be made for the significant parts of the network (i.e. C class and unclassified roads) for which data is likely to be unavailable;
• define funding scenarios and identify the impact of overall road maintenance budget reductions on carriageway maintenance spend;
The Economics of Road Maintenance
viii
• define road-user cost and vehicle operating cost models using standard parameters (e.g. from WebTAG) and other assumptions;
• determine future network condition and road-user and vehicle operating costs associated with each funding scenario; and
• perform sensitivity analyses to test the range and robustness of results and assumptions.
The methodology could be applied at a national level or by individual or groups of local authorities. However, it will be important that the steps are followed consistently to enable genuine comparisons between different analyses outputs.
Finally, it should be noted that the methodology is based on the assumption that, while budget variations considered may be significant, their dominant effect will be to drive incremental changes in network condition. If the variations are more extreme and may lead to closure of significant links on the network, a modified approach will be needed. The revised methodology would also need to address the direct and wider economic impacts of revised travel patterns caused by the rerouting of traffic.
The Economics of Road Maintenance
1. Introduction
1.1 The commission
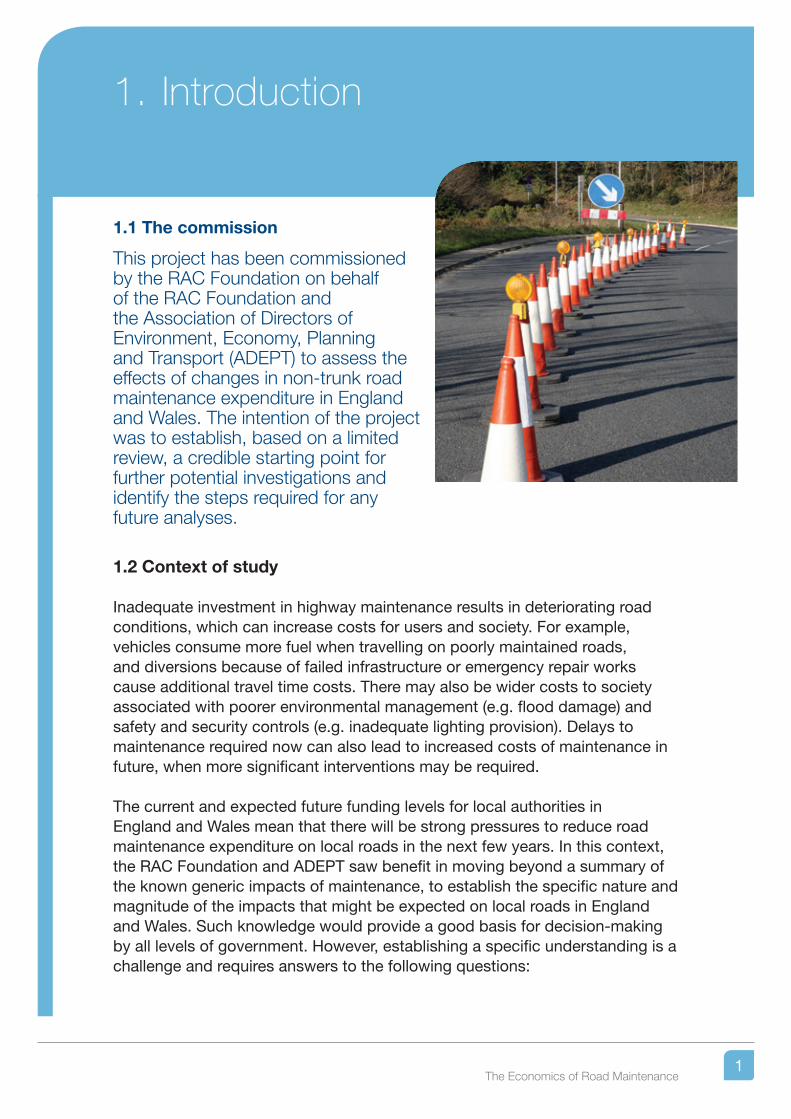
This project has been commissioned by the RAC Foundation on behalf of the RAC Foundation and the Association of Directors of Environment, Economy, Planning and Transport (ADEPT) to assess the effects of changes in non-trunk road maintenance expenditure in England and Wales. The intention of the project was to establish, based on a limited review, a credible starting point for further potential investigations and identify the steps required for any future analyses.
1.2 Context of study
Inadequate investment in highway maintenance results in deteriorating road conditions, which can increase costs for users and society. For example, vehicles consume more fuel when travelling on poorly maintained roads, and diversions because of failed infrastructure or emergency repair works cause additional travel time costs. There may also be wider costs to society associated with poorer environmental management (e.g. flood damage) and safety and security controls (e.g. inadequate lighting provision). Delays to maintenance required now can also lead to increased costs of maintenance in future, when more significant interventions may be required.
The current and expected future funding levels for local authorities in England and Wales mean that there will be strong pressures to reduce road maintenance expenditure on local roads in the next few years. In this context, the RAC Foundation and ADEPT saw benefit in moving beyond a summary of the known generic impacts of maintenance, to establish the specific nature and magnitude of the impacts that might be expected on local roads in England and Wales. Such knowledge would provide a good basis for decision-making by all levels of government. However, establishing a specific understanding is a challenge and requires answers to the following questions:
1The Economics of Road Maintenance
• What is the current state of the road asset and how has it performed over time?
• Which are the most significant impacts and issues of concern?• How might the road asset perform in the future under various investment
scenarios?• How reliable is the available evidence and analysis (based on an
understanding of the various uncertainties inherent in such evidence)?
1.3 Project aims and objectives
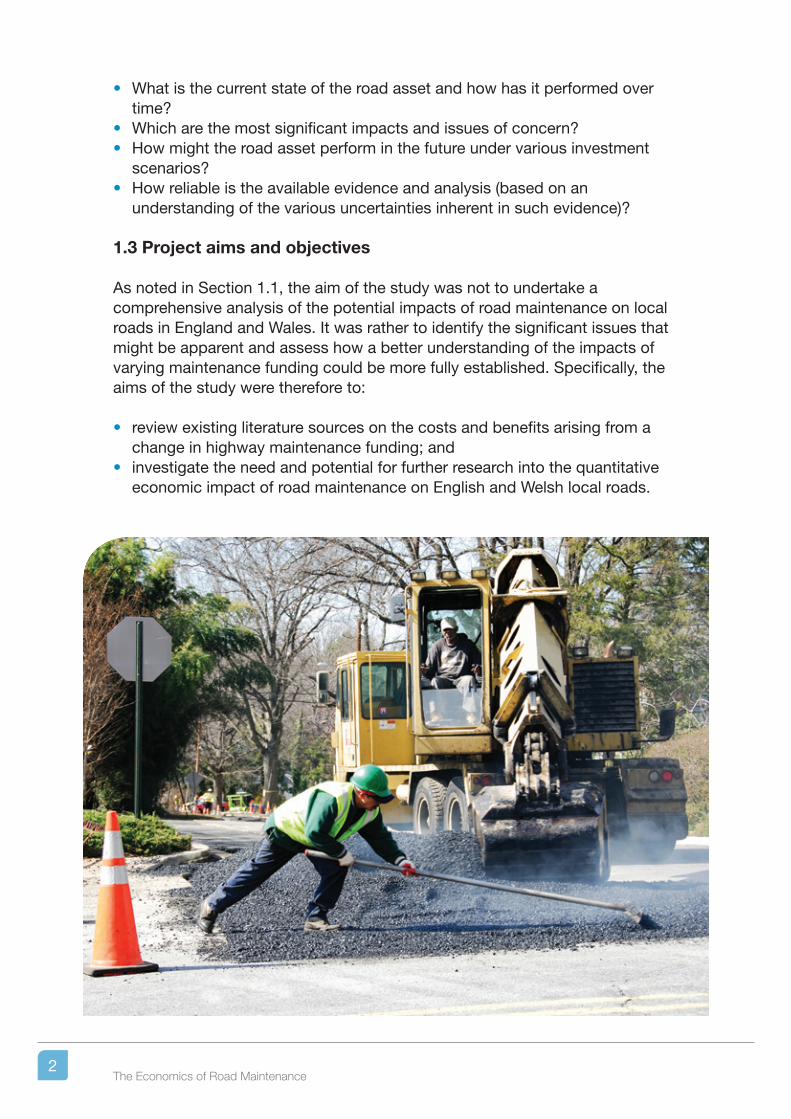
As noted in Section 1.1, the aim of the study was not to undertake a comprehensive analysis of the potential impacts of road maintenance on local roads in England and Wales. It was rather to identify the significant issues that might be apparent and assess how a better understanding of the impacts of varying maintenance funding could be more fully established. Specifically, the aims of the study were therefore to:
• review existing literature sources on the costs and benefits arising from a change in highway maintenance funding; and
• investigate the need and potential for further research into the quantitative economic impact of road maintenance on English and Welsh local roads.
2The Economics of Road Maintenance
2. Background
2.1 Potential impacts of reduced road maintenance budgets
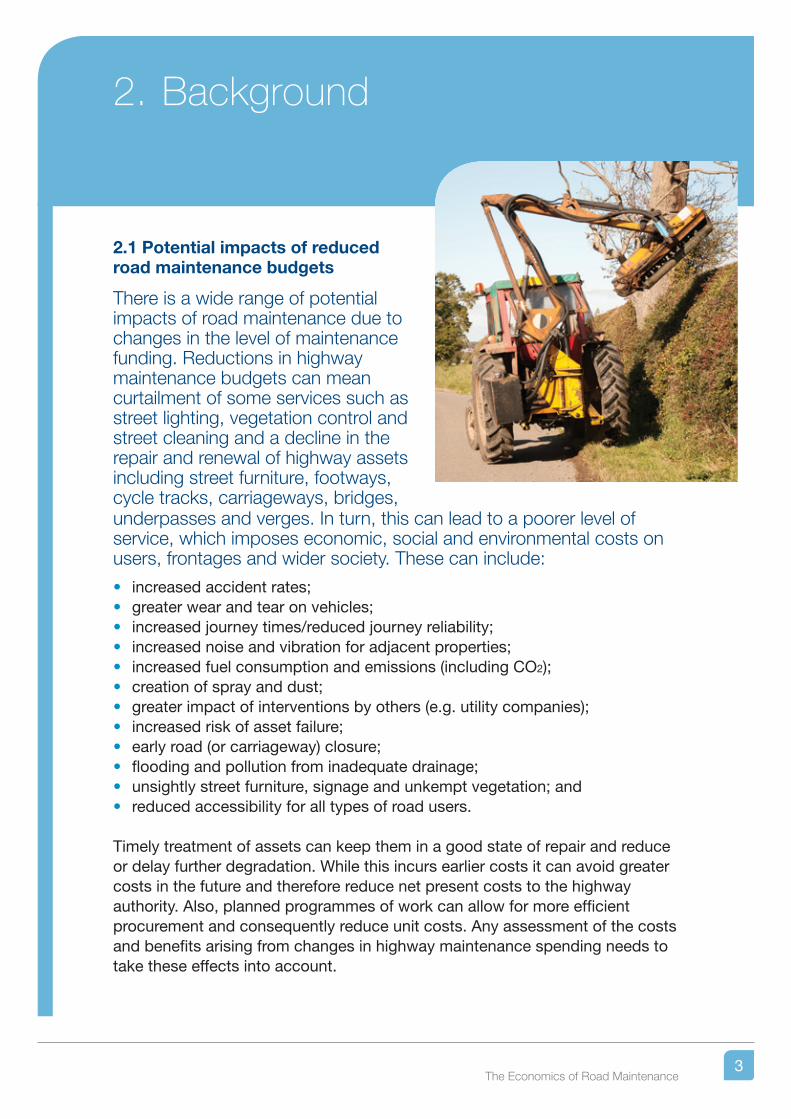
There is a wide range of potential impacts of road maintenance due to changes in the level of maintenance funding. Reductions in highway maintenance budgets can mean curtailment of some services such as street lighting, vegetation control and street cleaning and a decline in the repair and renewal of highway assets including street furniture, footways, cycle tracks, carriageways, bridges, underpasses and verges. In turn, this can lead to a poorer level of service, which imposes economic, social and environmental costs on users, frontages and wider society. These can include:
• increased accident rates;• greater wear and tear on vehicles;• increased journey times/reduced journey reliability;• increased noise and vibration for adjacent properties;• increased fuel consumption and emissions (including CO2);• creation of spray and dust;• greater impact of interventions by others (e.g. utility companies);• increased risk of asset failure;• early road (or carriageway) closure;• flooding and pollution from inadequate drainage;• unsightly street furniture, signage and unkempt vegetation; and• reduced accessibility for all types of road users.
Timely treatment of assets can keep them in a good state of repair and reduce or delay further degradation. While this incurs earlier costs it can avoid greater costs in the future and therefore reduce net present costs to the highway authority. Also, planned programmes of work can allow for more efficient procurement and consequently reduce unit costs. Any assessment of the costs and benefits arising from changes in highway maintenance spending needs to take these effects into account.
3The Economics of Road Maintenance
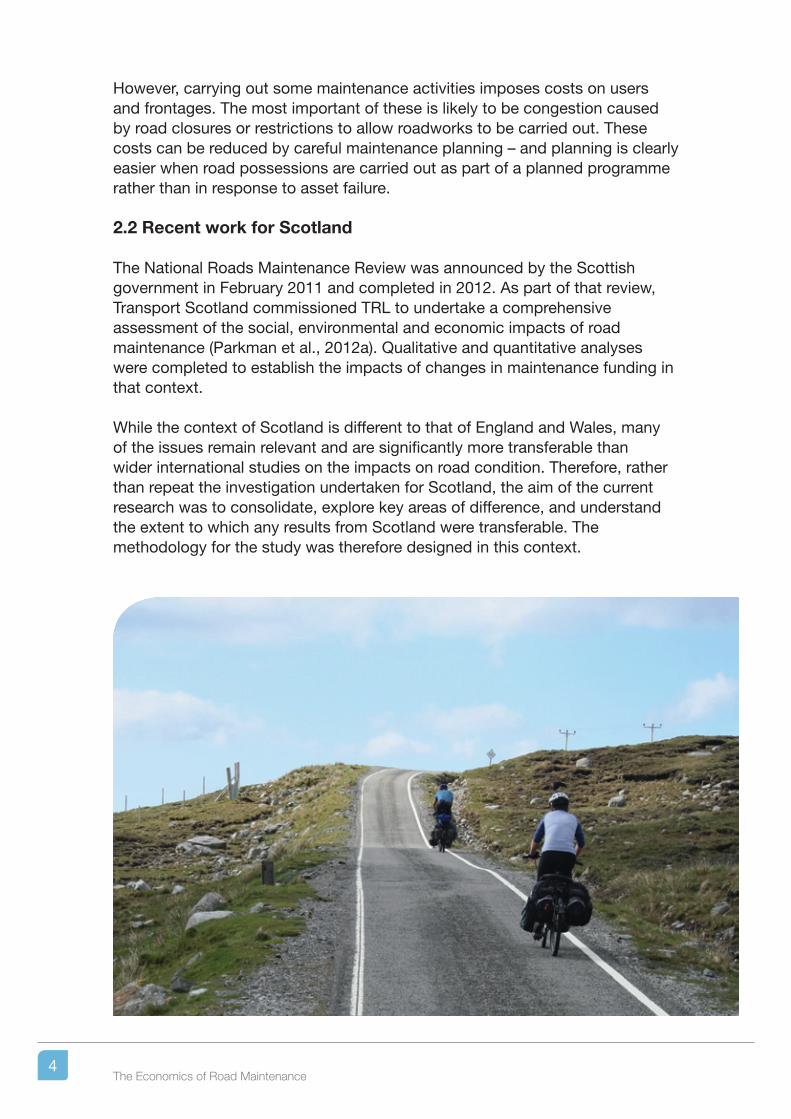
However, carrying out some maintenance activities imposes costs on users and frontages. The most important of these is likely to be congestion caused by road closures or restrictions to allow roadworks to be carried out. These costs can be reduced by careful maintenance planning – and planning is clearly easier when road possessions are carried out as part of a planned programme rather than in response to asset failure.
2.2 Recent work for Scotland
The National Roads Maintenance Review was announced by the Scottish government in February 2011 and completed in 2012. As part of that review, Transport Scotland commissioned TRL to undertake a comprehensive assessment of the social, environmental and economic impacts of road maintenance (Parkman et al., 2012a). Qualitative and quantitative analyses were completed to establish the impacts of changes in maintenance funding in that context.
While the context of Scotland is different to that of England and Wales, many of the issues remain relevant and are significantly more transferable than wider international studies on the impacts on road condition. Therefore, rather than repeat the investigation undertaken for Scotland, the aim of the current research was to consolidate, explore key areas of difference, and understand the extent to which any results from Scotland were transferable. The methodology for the study was therefore designed in this context.
4The Economics of Road Maintenance
3. Methodology
3.1 Overview
The methodology was designed to address the two aims of the project.A qualitative study involving a literature review addressed the first aim of the project, detailing the costs and benefits arising from changes in highway maintenance spending. The literature sources focused on evidence from the UK. The Scottish study includes a comprehensive literature review over ten years (Parkman et al., 2012b). Therefore, the aim of the literature review was not to repeat the review for Scotland, but to find any more recently published sources (in the 16 months since the review for Scotland) and, as far as possible, contextualise the information gained with information arising from the quantitative research.
To supplement published information with more specific knowledge of the English and Welsh context, a questionnaire was also developed, which was circulated in two stages to local authorities. In the first stage, it was sent to a sample of 52 local authorities requesting them to identify, if they could, various specific data in the time frame of the project. Twenty-two local authorities responded and from these, for the second stage, a sample of seven local authorities was selected to provide the identified information. Responses to the questionnaire provided further context and also addressed the quantitative element of the project – to investigate the need and potential for further research into the quantitative economic impact of road maintenance on English and Welsh local authority roads – by showing the data likely to be available from local authorities.
Based on the qualitative and quantitative research, consideration was then given to whether further research would be valid and, if so, what form it should take.
5The Economics of Road Maintenance
3.2 Qualitative study
3.2.1 Literature search
The literature search used information provided by TRL’s Library and Information Centre (LIC), using the Transport Research International Documentation (TRID) database. TRID covers more than 900,000 records of references to books, technical reports, conference proceedings and journal articles in the field of transportation research. The literature search for this study looked only at information added since undertaking the literature search for the Scotland study (Parkman et al., 2012b).
The literature search was structured to replicate the review for the Scotland study, using the cut-off point of the earlier search (June 2011) as the start date and the end of October 2012 (16 months) as the search end date.
The literature search primarily focused on UK and European sources. The Scotland study uses the Scottish Transport Appraisal Guidance (STAG) as a basis for structuring the literature search. This search was repeated to ensure robustness of the approach, but was also widened to include search terms found in WebTAG, the equivalent appraisal framework for England and Wales. The differences between STAG and WebTAG are detailed in Section 3.2.2.
The literature search produced nearly 450 abstracts (a small minority were duplicates), each of which was reviewed for relevance to the study. Between 10 and 15 were considered relevant, as the majority of the literature sources were based on international research (predominately in the USA), and were therefore not reviewed in detail unless there were particular aspects relevant to this study.
3.2.2 WebTAG and STAG context
The Scotland study uses the STAG criteria as a basis for grouping the impacts highlighted by the literature search. In an English and Welsh context, WebTAG (DfT, 2011) is the equivalent framework, which is used to guide transport studies and ensure that all potential impacts are considered.
Table 1 maps the WebTAG criteria to the equivalent STAG criteria. The table is mirrored so that the columns noting the sub-objective criteria for WebTAG and STAG are presented in the adjacent centre columns, with the summarised objective criteria forming the two outer columns. A simple colour coding has been used to show the level of matching between WebTAG and STAG sub-objectives. Green illustrates a full match, yellow indicates a partial match and red indicates no match.
6The Economics of Road Maintenance
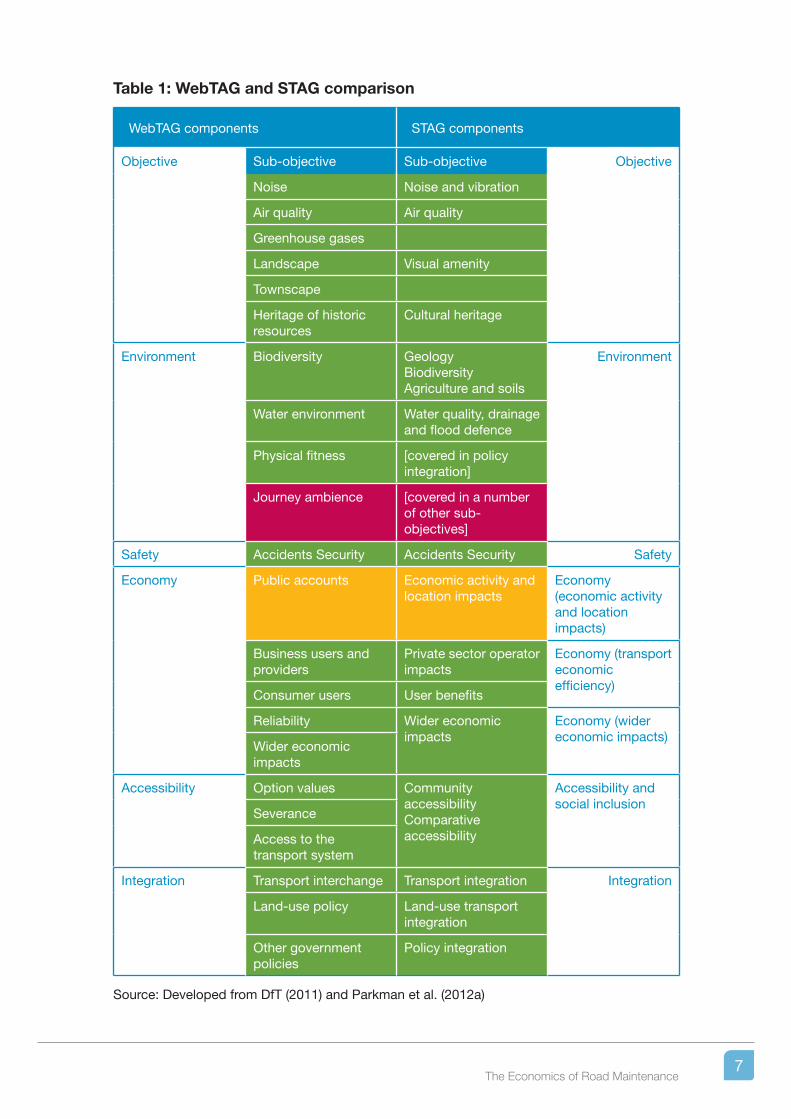
Table 1: WebTAG and STAG comparison
WebTAG components STAG components
Objective Sub-objective Sub-objective Objective
Noise Noise and vibration
Air quality Air quality
Greenhouse gases
Landscape Visual amenity
Townscape
Heritage of historic resources
Cultural heritage
Environment Biodiversity GeologyBiodiversityAgriculture and soils
Environment
Water environment Water quality, drainage and flood defence
Physical fitness [covered in policy integration]
Journey ambience [covered in a number of other sub-objectives]
Safety Accidents Security Accidents Security Safety
Economy Public accounts Economic activity and location impacts
Economy (economic activity and location impacts)
Business users and providers
Private sector operator impacts
Economy (transport economic efficiency)
Consumer users User benefits
Reliability Wider economic impacts
Economy (wider economic impacts)
Wider economic impacts
Accessibility Option values Community accessibilityComparative accessibility
Accessibility and social inclusion
Severance
Access to the transport system
Integration Transport interchange Transport integration Integration
Land-use policy Land-use transport integration
Other government policies
Policy integration
Source: Developed from DfT (2011) and Parkman et al. (2012a)
7The Economics of Road Maintenance
There is a high degree of overlap between WebTAG and STAG sub-objectives shown in Table 1, implying that the analysis undertaken for the Scotland study is structured in a very similar way. The qualitative results of the Scotland study are therefore represented by reorganising them to fit the WebTAG objectives and sub-objectives. Minor adaptations were made where appropriate and possible, and some grouping of similar categories was necessary.
Finally, by their very definition, each criterion has a different impact and the term ‘economic impact’ can mean different things to different audiences. For example, the safety criteria might identify that fatal road accidents are projected to increase under a given funding scenario, and this impact can be monetised to be included as a quantifiable ‘economic’ impact. Similarly, some impacts may be more local and specific (e.g. graffiti in urban areas), whereas others are more global and have impacts even beyond the national boundary (e.g. greenhouse gases). The review focused on those aspects for which it would be most likely and possible to produce a monetary impact. This differed from the Scotland study, which considered all aspects in accordance with the STAG criteria.
3.3 Quantitative study
3.3.1 Department for Transport data
Statistics from the DfT (DfT, n.d.) were accessed in November 2012 and used as the primary source for data on the complete English and Welsh local road networks. The review focused on key information that drives maintenance requirements including:
• network extent (length) by different road class;• traffic;• condition; and• maintenance expenditure.
Where data was provided for only Great Britain as a whole, requests were made to the DfT for the English and Welsh components, to provide greater detail.
3.3.2 Questionnaires
Initially, questionnaires were sent to 52 local authorities highlighting the data that would be required for the analysis and requesting information on any reports, analyses or justification for maintenance expenditure that might already be available. Nineteen responses were received within the project timeline, detailing whether all, some or none of the required data would be available. Follow-up questionnaires were then sent to a sample of seven local authorities that:
8The Economics of Road Maintenance

• had indicated they could provide a high proportion of the required data; and• provided a cross-section of different authority types, so that the diversity
of issues could be explored. (As well as the diverse physical nature of the network, ranging from remote rural to dense urban and affected by differing weather patterns, there is also a diversity in governance approaches.)
Five local authorities provided the responses, which became the basis of the analysis for this study. The representation included two city councils, one unitary council, one borough council and one large county council. Data from the questionnaires was subsequently analysed for any trends (e.g. increasing accidents associated with reductions in maintenance budgets) and has been anonymised to avoid sensitivity or distraction from the main theme of the report.
4. Network Characteristics
4.1 Overview
This Section provides general information on summary statistics for the English and Welsh networks, to assist generic comparisons to be made. The reader is referred to the DfT website for statistics (DfT, n.d.; accessed in November 2012) for more background and details on the statistics.
9The Economics of Road Maintenance
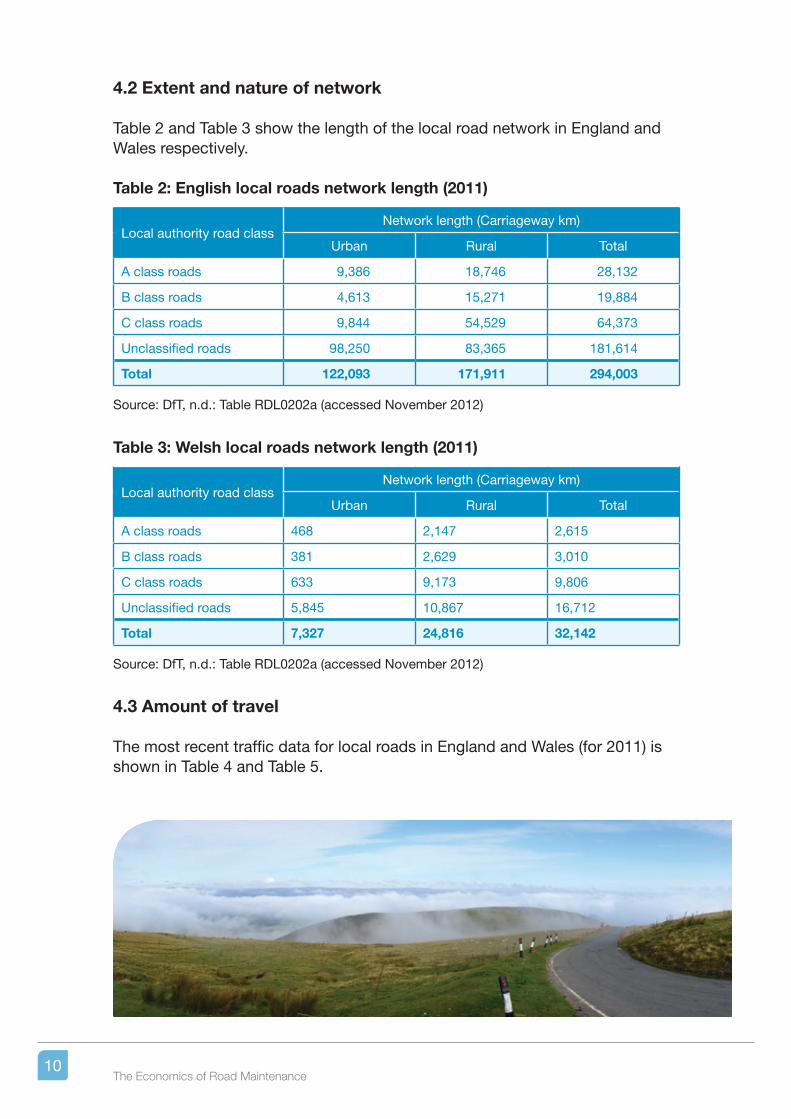
4.2 Extent and nature of network
Table 2 and Table 3 show the length of the local road network in England and Wales respectively.
Table 2: English local roads network length (2011)
Local authority road classNetwork length (Carriageway km)
Urban Rural Total
A class roads 9,386 18,746 28,132
B class roads 4,613 15,271 19,884
C class roads 9,844 54,529 64,373
Unclassified roads 98,250 83,365 181,614
Total 122,093 171,911 294,003
Source: DfT, n.d.: Table RDL0202a (accessed November 2012)
Table 3: Welsh local roads network length (2011)
Local authority road classNetwork length (Carriageway km)
Urban Rural Total
A class roads 468 2,147 2,615
B class roads 381 2,629 3,010
C class roads 633 9,173 9,806
Unclassified roads 5,845 10,867 16,712
Total 7,327 24,816 32,142
Source: DfT, n.d.: Table RDL0202a (accessed November 2012)
4.3 Amount of travel
The most recent traffic data for local roads in England and Wales (for 2011) is shown in Table 4 and Table 5.
10The Economics of Road Maintenance
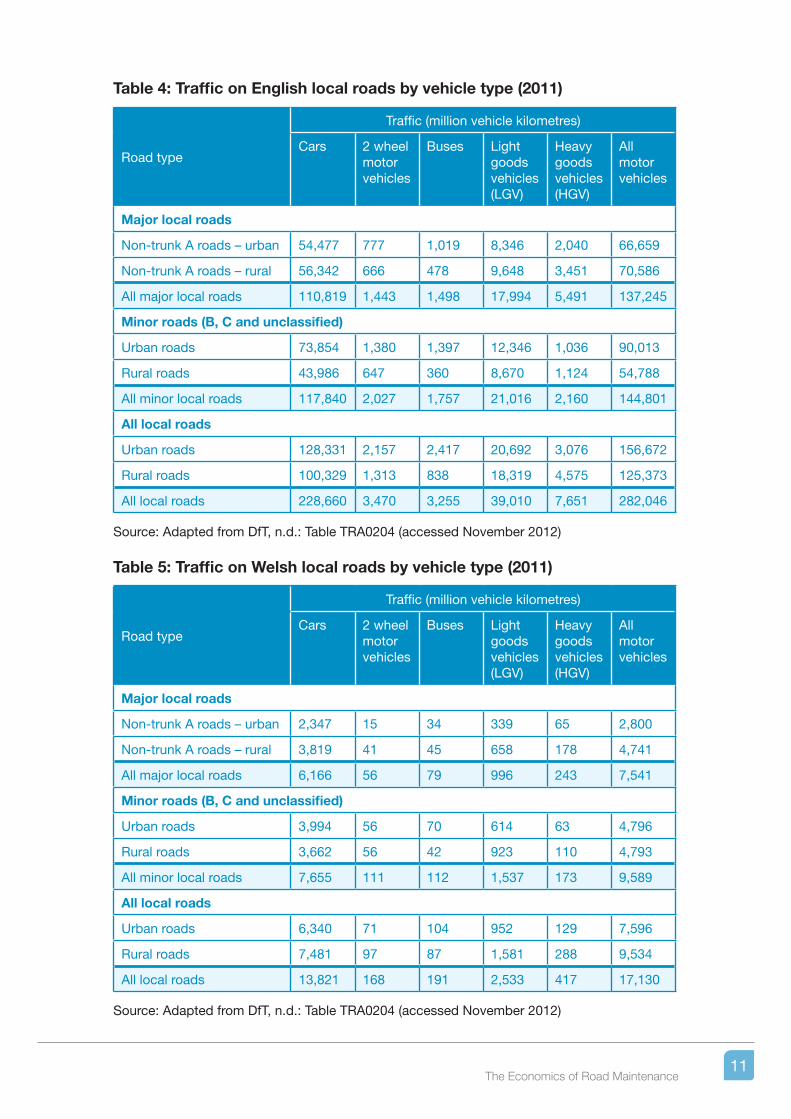
Table 4: Traffic on English local roads by vehicle type (2011)
Road type
Traffic (million vehicle kilometres)
Cars 2 wheel motor vehicles
Buses Light goods vehicles (LGV)
Heavy goods vehicles (HGV)
All motor vehicles
Major local roads
Non-trunk A roads – urban 54,477 777 1,019 8,346 2,040 66,659
Non-trunk A roads – rural 56,342 666 478 9,648 3,451 70,586
All major local roads 110,819 1,443 1,498 17,994 5,491 137,245
Minor roads (B, C and unclassified)
Urban roads 73,854 1,380 1,397 12,346 1,036 90,013
Rural roads 43,986 647 360 8,670 1,124 54,788
All minor local roads 117,840 2,027 1,757 21,016 2,160 144,801
All local roads
Urban roads 128,331 2,157 2,417 20,692 3,076 156,672
Rural roads 100,329 1,313 838 18,319 4,575 125,373
All local roads 228,660 3,470 3,255 39,010 7,651 282,046
Source: Adapted from DfT, n.d.: Table TRA0204 (accessed November 2012)
Table 5: Traffic on Welsh local roads by vehicle type (2011)
Road type
Traffic (million vehicle kilometres)
Cars 2 wheel motor vehicles
Buses Light goods vehicles (LGV)
Heavy goods vehicles (HGV)
All motor vehicles
Major local roads
Non-trunk A roads – urban 2,347 15 34 339 65 2,800
Non-trunk A roads – rural 3,819 41 45 658 178 4,741
All major local roads 6,166 56 79 996 243 7,541
Minor roads (B, C and unclassified)
Urban roads 3,994 56 70 614 63 4,796
Rural roads 3,662 56 42 923 110 4,793
All minor local roads 7,655 111 112 1,537 173 9,589
All local roads
Urban roads 6,340 71 104 952 129 7,596
Rural roads 7,481 97 87 1,581 288 9,534
All local roads 13,821 168 191 2,533 417 17,130
Source: Adapted from DfT, n.d.: Table TRA0204 (accessed November 2012)
11The Economics of Road Maintenance
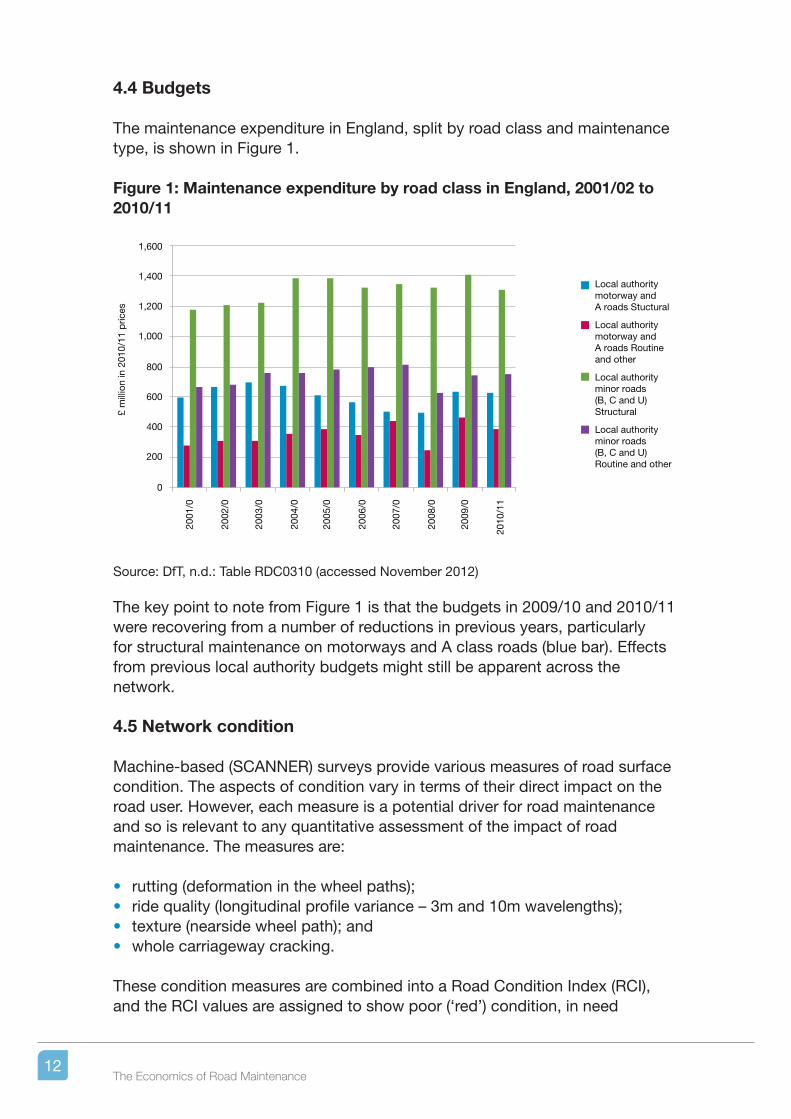
4.4 Budgets
The maintenance expenditure in England, split by road class and maintenance type, is shown in Figure 1.
Figure 1: Maintenance expenditure by road class in England, 2001/02 to 2010/11
Local authoritymotorway andA roads Stuctural
Local authoritymotorway andA roads Routineand other
Local authorityminor roads(B, C and U) Structural
Local authorityminor roads(B, C and U)Routine and other
1,600
1,400
2001
/0
2002
/0
2003
/0
2004
/0
2005
/0
2006
/0
2007
/0
2008
/0
2009
/0
2010
/11
£ m
illio
n in
201
0/11
pric
es 1,200
1,000
800
600
400
200
0
Source: DfT, n.d.: Table RDC0310 (accessed November 2012)
The key point to note from Figure 1 is that the budgets in 2009/10 and 2010/11 were recovering from a number of reductions in previous years, particularly for structural maintenance on motorways and A class roads (blue bar). Effects from previous local authority budgets might still be apparent across the network.
4.5 Network condition
Machine-based (SCANNER) surveys provide various measures of road surface condition. The aspects of condition vary in terms of their direct impact on the road user. However, each measure is a potential driver for road maintenance and so is relevant to any quantitative assessment of the impact of road maintenance. The measures are:
• rutting (deformation in the wheel paths);• ride quality (longitudinal profile variance – 3m and 10m wavelengths);• texture (nearside wheel path); and• whole carriageway cracking.
These condition measures are combined into a Road Condition Index (RCI), and the RCI values are assigned to show poor (‘red’) condition, in need
12The Economics of Road Maintenance
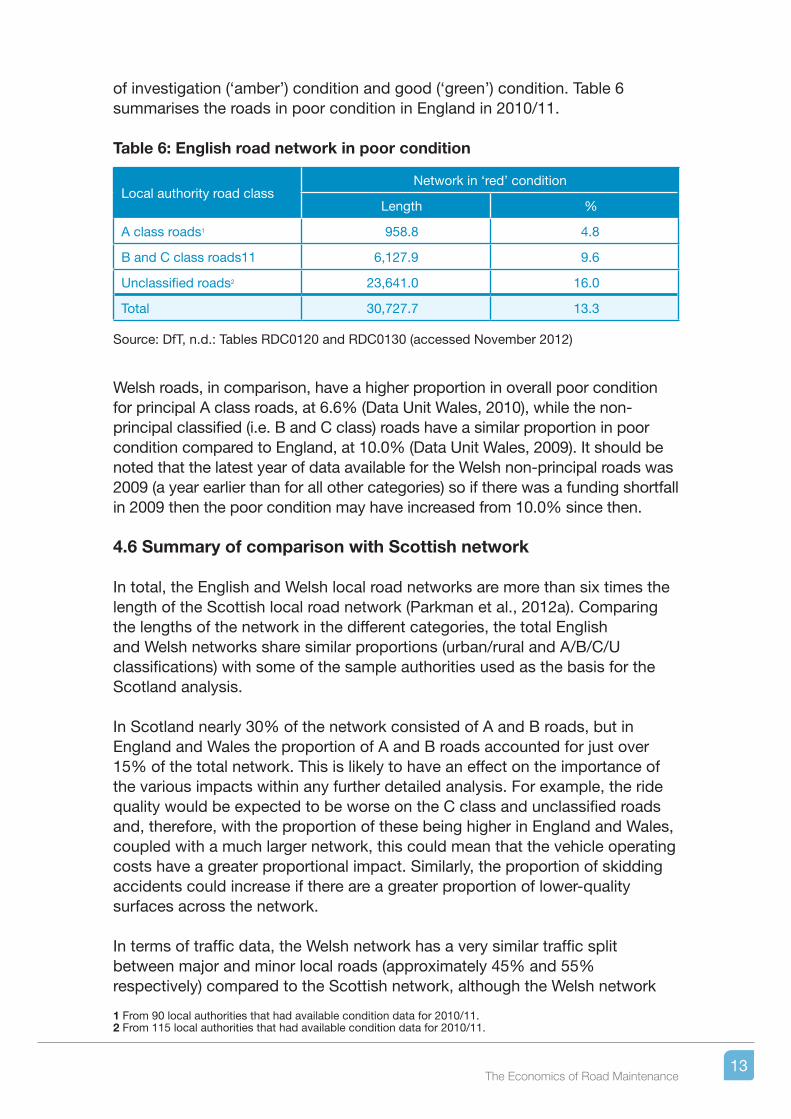
of investigation (‘amber’) condition and good (‘green’) condition. Table 6 summarises the roads in poor condition in England in 2010/11.
Table 6: English road network in poor condition
Local authority road classNetwork in ‘red’ condition
Length %
A class roads1 958.8 4.8
B and C class roads11 6,127.9 9.6
Unclassified roads2 23,641.0 16.0
Total 30,727.7 13.3
Source: DfT, n.d.: Tables RDC0120 and RDC0130 (accessed November 2012)
Welsh roads, in comparison, have a higher proportion in overall poor condition for principal A class roads, at 6.6% (Data Unit Wales, 2010), while the non-principal classified (i.e. B and C class) roads have a similar proportion in poor condition compared to England, at 10.0% (Data Unit Wales, 2009). It should be noted that the latest year of data available for the Welsh non-principal roads was 2009 (a year earlier than for all other categories) so if there was a funding shortfall in 2009 then the poor condition may have increased from 10.0% since then.
4.6 Summary of comparison with Scottish network
In total, the English and Welsh local road networks are more than six times the length of the Scottish local road network (Parkman et al., 2012a). Comparing the lengths of the network in the different categories, the total English and Welsh networks share similar proportions (urban/rural and A/B/C/U classifications) with some of the sample authorities used as the basis for the Scotland analysis.
In Scotland nearly 30% of the network consisted of A and B roads, but in England and Wales the proportion of A and B roads accounted for just over 15% of the total network. This is likely to have an effect on the importance of the various impacts within any further detailed analysis. For example, the ride quality would be expected to be worse on the C class and unclassified roads and, therefore, with the proportion of these being higher in England and Wales, coupled with a much larger network, this could mean that the vehicle operating costs have a greater proportional impact. Similarly, the proportion of skidding accidents could increase if there are a greater proportion of lower-quality surfaces across the network.
In terms of traffic data, the Welsh network has a very similar traffic split between major and minor local roads (approximately 45% and 55% respectively) compared to the Scottish network, although the Welsh network
1 From 90 local authorities that had available condition data for 2010/11.2 From 115 local authorities that had available condition data for 2010/11.
13The Economics of Road Maintenance
carries fewer vehicles. The English network has an almost equal split of all motor vehicle traffic between major and minor local roads, but carries significantly more traffic than either of the other two networks.
5. Summary of Impacts
5.1 Summary of qualitative impacts
5.1.1 Overview
As noted in Section 3, the results of the Scottish qualitative review (Parkman et al., 2012a) have been considered and amended where appropriate as follows:
• inclusion of newly published and relevant literature from the UK, which adds to the body of existing evidence;
• contextualisation based on network characteristics and the small-scale consultation with local authorities; and
• localisation of policy information and guidance documents to an English and Welsh context.
The qualitative impacts are summarised in Appendix A, structured by the WebTAG components. Key aspects of the impacts are summarised in this Section. For readability, references are not shown in this Section but can be found in Appendix A and the References and Bibliography in Section 8.
As the report focuses on the monetised economic impacts of changes in road maintenance, the economy subsection is presented first.
5.1.2 Economy
The costs of recovery from deteriorated infrastructure conditions can be much higher than the costs of retaining existing quality levels. For example, delaying
14The Economics of Road Maintenance
a resurfacing means further deterioration and may require more significant intervention in the future. This is an established principle, demonstrated by economic models such as the early World Bank HDM-III model (Watanatada et al., 1987), which continues to be shown in more recent studies and reviews. While calibrated deterioration models of the English or Welsh local road networks are not available, it is unlikely that the principle would not be true in England and Wales.
Deterioration in road conditions will cause an increase in vehicle operating costs for motorists. This includes, for example, tyre damage caused by potholes, and increased fuel consumption on rougher roads. Such costs were the most significant monetised costs identified in the Scotland study (Parkman et al., 2012a), but were also shown to be highly sensitive to the input assumptions and represented small percentage changes in the very large total vehicle operating costs.
Journey quality is also likely to decrease with reduced maintenance budgets. Ride quality is diminished as roads increase in roughness, and user dissatisfaction is likely to rise.
England and Wales have experienced some periods of low temperatures in recent years, with greater incidence of snow and ice than in previous years. Such conditions lead to increased degradation of the road surface: for example, through freeze–thaw weathering, which can cause sudden deterioration of small surface defects, leading to significantly worse condition. For a local authority under pressure to reduce its road maintenance budget, a harsh winter can be a real drain on resources in the following weeks and months.
15The Economics of Road Maintenance
Road users may experience reductions in route security and journey time reliability as a result of lower road maintenance budgets. This might be due to reductions in winter maintenance budgets, or acceptance of higher levels of risk (known or unknown) for some assets across the network. If the occurrence of failure of such assets increases then disruptions and, in extreme cases, route closures may necessitate diversions for motorists, leading to increased travel times. The Scotland study shows that this effect would be difficult to quantify and would depend on complex risk analysis and assumptions of network diversion routes. It is likely that the degree of this impact in England would be different to that in Scotland, as route diversions are more likely to be less significant, but this may be outweighed by the increased levels of traffic.
In extreme cases, catastrophic failure of parts of the infrastructure such as bridges may cause fatalities, resulting in significant accident costs and likely decreases in local economic activity and trade. Widespread disruption following the closure of a bridge can have significant (even if temporary) impacts on local businesses.
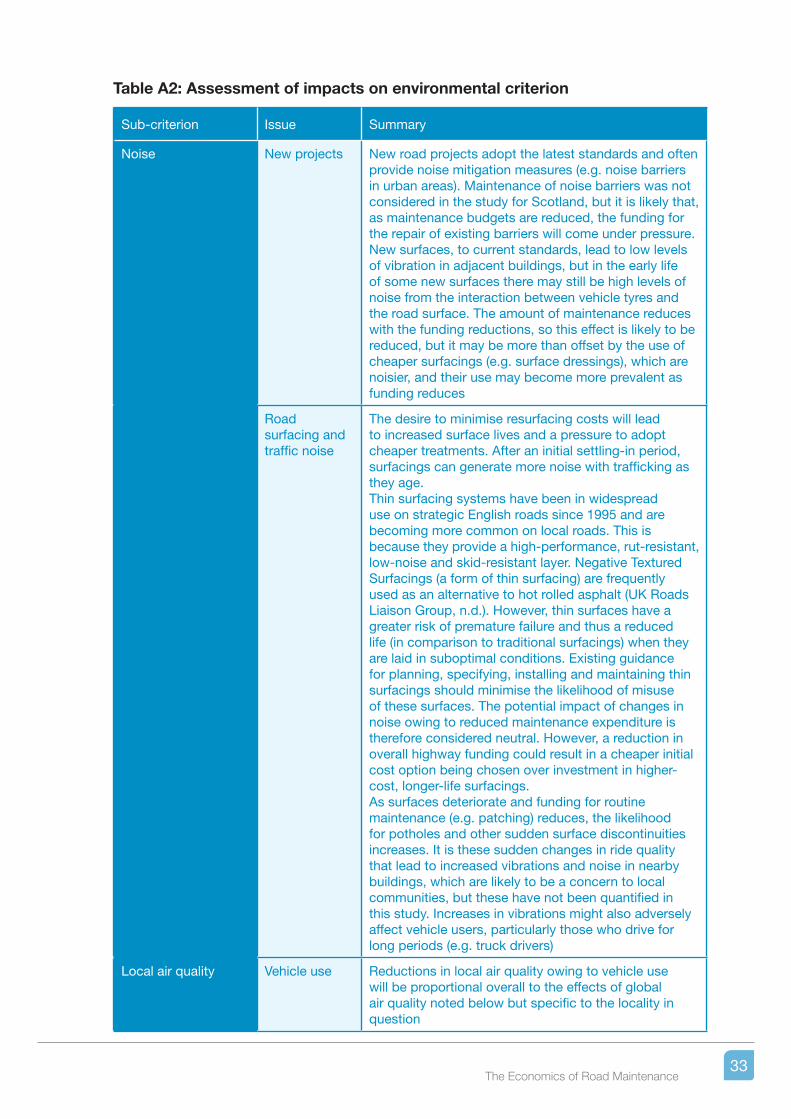
5.1.3 Environment
The reduction in funding for maintenance can adversely affect the levels of noise and vibration suffered by motorists, other road users, local businesses and residents. This is unlikely to have a significant impact until extreme reductions lead to very significantly deteriorated and potholed surfaces and will be more noticeable with heavy vehicle traffic.
As roads deteriorate, vehicle speeds reduce and fuel consumption and levels of emissions change. Some aspects of condition will drive the potential for increased fuel consumption: for example, rougher roads and any increased stopping and starting caused by disruption. If more roadworks are carried out, disruption on the network will increase. However, in the future, all effects may be countered by long-term improvements in vehicle efficiency. The impact on global emissions (greenhouse gases) is therefore probably marginal. Local air-quality effects would also be affected by similar considerations, but there may also be further effects due to less frequent street cleaning and build-up of dust and dirt. The literature search was unable to confirm conclusively any assertion on these aspects.
Reduced maintenance funding can have significant effects on landscapes and townscapes. Experience suggests that vegetation control and graffiti removal, for example, are among the budget items that are least defensible when funding is constrained. Impacts of such reductions in maintenance, for example for tackling graffiti and vandalism, can lead to increased incidence of more minor crime, ultimately reducing people’s quality of life and perceptions of an area. Once perceptions of an area are reduced, studies have shown street activity can diminish (i.e. ‘broken-windows’ effect), leading to exclusion zones, particularly at night and for specific types of people. The fear of crime
16The Economics of Road Maintenance
can be as influential in changing people’s behaviour as being a victim of crime. Lower street activity can be linked with increases in antisocial behaviour, thereby starting a spiral of community decay and creation of ‘sunk’ areas. There can then be repercussions for the viability of the local economy and propensity of businesses to invest in such an area.
The impact of reduced road maintenance on biodiversity is considered marginal. By contrast, the impact on the water environment is likely to be more significant. The risk of local flooding may increase with the reduction of routine and planned drainage maintenance. There is evidence of increases in the number of flooding events in England and Wales in recent years, such as in winter 2012/13, but there is no published evidence on the contribution of the effects of lower maintenance funding on these events.
Healthy lifestyles and physical fitness can be encouraged by providing well-connected, well-maintained, coherent and convivial routes and facilities. There are strong connections between road condition and policies on health and obesity – poor carriageway and footway condition deter walking and cycling. According to a 2012 Lancet report (Jarrett et al., 2012), if people in urban England and Wales walked and cycled more, the NHS could save £17 billion within 20 years, based on costs to the NHS for seven diseases that are associated with physical inactivity.
Journey ambience is a significant metric in the measurable impact of reduced maintenance. Rougher roads are less comfortable to drive on, reduced lighting will affect the ease of driving, and the visual appearance of roads may diminish. Information gained from one local authority suggested that a fall in user complaints could be correlated with increasing maintenance budgets.
5.1.4 Safety
Poor condition of the road surface can increase the risk of accidents caused by skidding and also by road users taking evasive action to avoid hazards (e.g. potholes). Skid-resistant surfacings, typically introduced through an area policy, can reduce these risks. However, reduced maintenance budgets may mean such initiatives cannot be funded.
The risk of structural failure can be catastrophic, but often, during times of reduced funding, the maintenance of structures is protected at the expense of other ‘lower risk’ assets (lower risk in terms of safety to road users). If failures do occur, these can result in an opportunity cost for other areas of the road maintenance budget, as a greater proportion of budgets is allocated to structures maintenance to avoid further failures.
Deterioration of facilities for pedestrians and cyclists on local roads is likely to increase the level of risk. However, no firm evidence was found to conclude the magnitude of the impact.
17The Economics of Road Maintenance

Lower levels of street lighting have recently been adopted by some UK authorities, with little impact on safety being reported for motorists. For pedestrians and cyclists, lower levels of lighting may generate a fear of crime, and darkened streets could become the focus for antisocial behaviour. Impacts such as increased graffiti and vandalism may cause local businesses to be reticent to invest in an area.
5.1.5 Accessibility
Community accessibility can be reduced if a structure (e.g. footbridge or underpass) is closed because of repairs or risk of failure. Often such facilities are built to avoid community severance resulting from divided communities (e.g. crossing a busy road), and so their closure can have a marked impact on general interaction and the ability of people to walk and cycle to local services and wider destinations. As noted in Section 5.1.4, however, budgets for structures are often protected against significant reductions.
Different groups of people interact with their environments differently, and some groups of people (e.g. older people, people with disabilities and women) may be adversely impacted by a reduction in maintenance that affects visual amenity, lighting and environmental quality.
18The Economics of Road Maintenance
Older people are likely to be adversely affected if there are more and worse footway defects, or if assets such as pedestrian crossings or street lights are not maintained to a working standard. Older people have a greater fear of crime and potential accidents, and they will experience a larger effect from deterioration of the road network than other groups in the population. Uneven footways are also likely to impact on pedestrians with disabilities, and those who are temporarily burdened (e.g. with luggage or a pushchair). Deterioration in the quality of assets can have a comparatively bigger effect on such groups. To an extent, disabled groups are protected by relevant legislation such as the Equality Act 2010, but it was noted that not all authorities currently adhere to best-practice guidance.
A reduction in traffic calming measures leads to less favourable conditions for cyclists. Poorly maintained carriageways with loose material, uneven edges and potholes increase the risk of accidents and are a major deterrent to these users. This is especially true for routes with inadequate illumination. These parts of the network are often one of the first to suffer budget reductions, and cyclists are therefore considered to experience comparatively greater impacts than other road users.
5.1.6 Integration
Integration refers to three sub-objectives of transport interchange, land use and other government policies (see Table 1).
Decreasing maintenance budgets are likely to have a similar effect on aspects of transport interchange as on other parts of the road network (e.g. lighting, safety, security, accessibility), but the impact may be less significant as these assets are likely to receive a high priority in the budget allocation process. Overall, additional impacts for transport interchange and land use are considered to be marginal.
As noted in Section 5.1.3, improved health outcomes are increasingly linked to levels of community physical fitness. There are strong connections between road condition and policies on health and obesity, as poor carriageway and footway condition deter walking and cycling activity.
5.2 Summary of quantifiable impacts
5.2.1 Overview
Results of the analysis of the questionnaires returned from the sample local authorities is included in this Section. Although five local authorities were able to provide returns within the required time frame, they were not all able to provide answers to all questions. All discussion has been anonymised, and the aim has been to demonstrate potential themes and issues that can be drawn from such data, which is summarised at the end of this Section.
19The Economics of Road Maintenance
5.2.2 Collisions on the network
Three local authorities provided a breakdown of collision data by road type. One of those had only three road types, so the data breakdown available to investigate trends was limited. Of the two local authorities that had a detailed collision data breakdown, one authority exhibited a slight downward trend in Killed and Serious Injury (KSI) collisions while the other revealed a strong upward trend for principal A class roads in 2010/11 and 2011/12 (but was constant for all other road types). Nationally, there has been a slight downward trend in reported KSI accidents in recent years, from a peak in 2004 (DfT, n.d.; accessed February 2013). No obvious link with overall maintenance budgets is visible from the data available.
5.2.3 Road maintenance expenditure
Carriageway road maintenance budgets for three of the local authorities have been relatively stable over the last five years, although it could be argued that there has been a slight increase in budgets over the five-year survey period (data from a larger sample over a longer time period would be needed to make any stronger conclusions). Two local authorities show a peak in 2009/10, then a noticeable drop in budgets in 2010/11 and 2011/12. One local authority is an exception, with carriageway maintenance budgets in 2011/12 more than double the two preceding years. Generally, the non-carriageway maintenance budgets show a decline over the reported period, and this is discussed further in section 5.2.5.
5.2.4 Carriageway maintenance expenditure
Capital carriageway maintenance expenditure is dominated by structural maintenance, and any change in total budget is closely tracked by a related change in the structural maintenance budget.
The only trends apparent from the responses for revenue expenditure are that budgets for some categories (e.g. lighting, winter maintenance) have been fairly consistent over the last five years, while structural and safety maintenance have shown the most variability. This reflects the level of service agreements taken up by local authorities insofar as there are commitments that have to be met for particular assets or operations and they cannot be reduced further. Variation may also be affected by the availability of centrally funded government initiatives.
The implication for any future research is that further analysis on budget cuts of the same order as seen in recent years should focus on the categories that are likely to be affected when the budgets change (e.g. structural maintenance budgets) rather than those that show little variation (e.g. lighting).
20The Economics of Road Maintenance
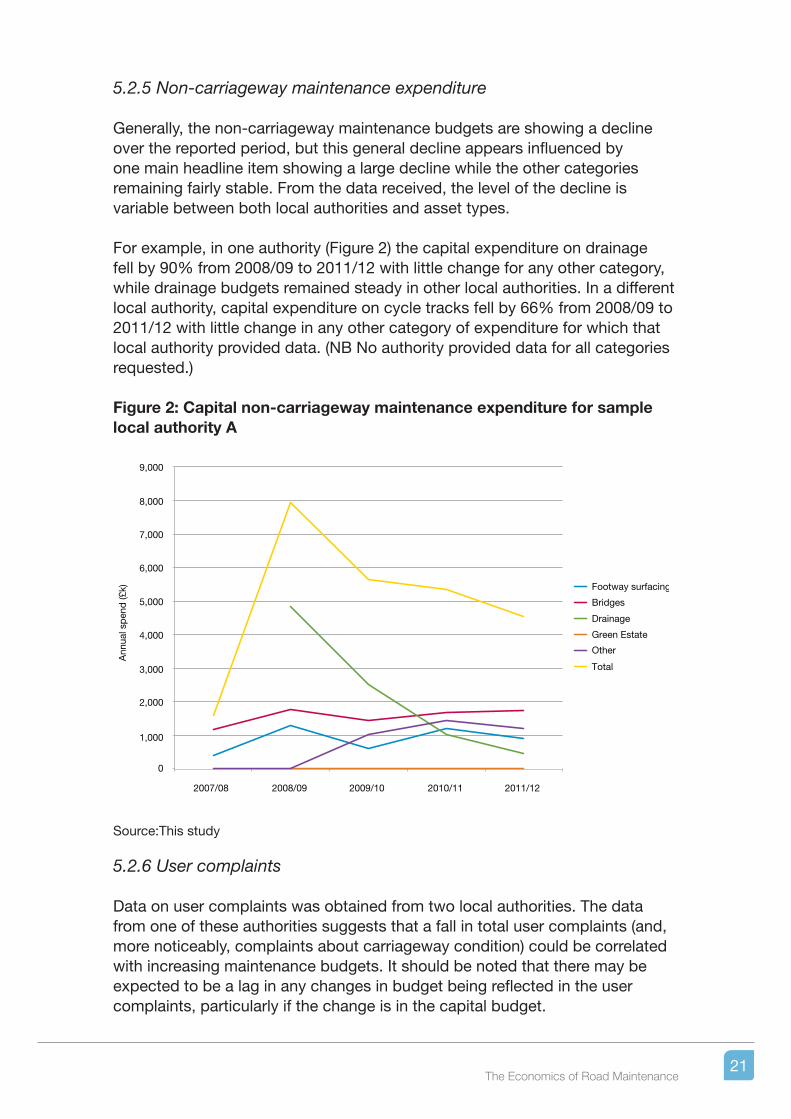
5.2.5 Non-carriageway maintenance expenditure
Generally, the non-carriageway maintenance budgets are showing a decline over the reported period, but this general decline appears influenced by one main headline item showing a large decline while the other categories remaining fairly stable. From the data received, the level of the decline is variable between both local authorities and asset types.
For example, in one authority (Figure 2) the capital expenditure on drainage fell by 90% from 2008/09 to 2011/12 with little change for any other category, while drainage budgets remained steady in other local authorities. In a different local authority, capital expenditure on cycle tracks fell by 66% from 2008/09 to 2011/12 with little change in any other category of expenditure for which that local authority provided data. (NB No authority provided data for all categories requested.)
Figure 2: Capital non-carriageway maintenance expenditure for sample local authority A
Footway surfacing
Bridges
Drainage
Green Estate
Other
Total
8,000
9,000
7,000
2007/08 2008/09 2009/10 2010/11 2011/12
Ann
ual s
pen
d (£
k)
6,000
5,000
4,000
3,000
2,000
1,000
0
Source:This study
5.2.6 User complaints
Data on user complaints was obtained from two local authorities. The data from one of these authorities suggests that a fall in total user complaints (and, more noticeably, complaints about carriageway condition) could be correlated with increasing maintenance budgets. It should be noted that there may be expected to be a lag in any changes in budget being reflected in the user complaints, particularly if the change is in the capital budget.
21The Economics of Road Maintenance
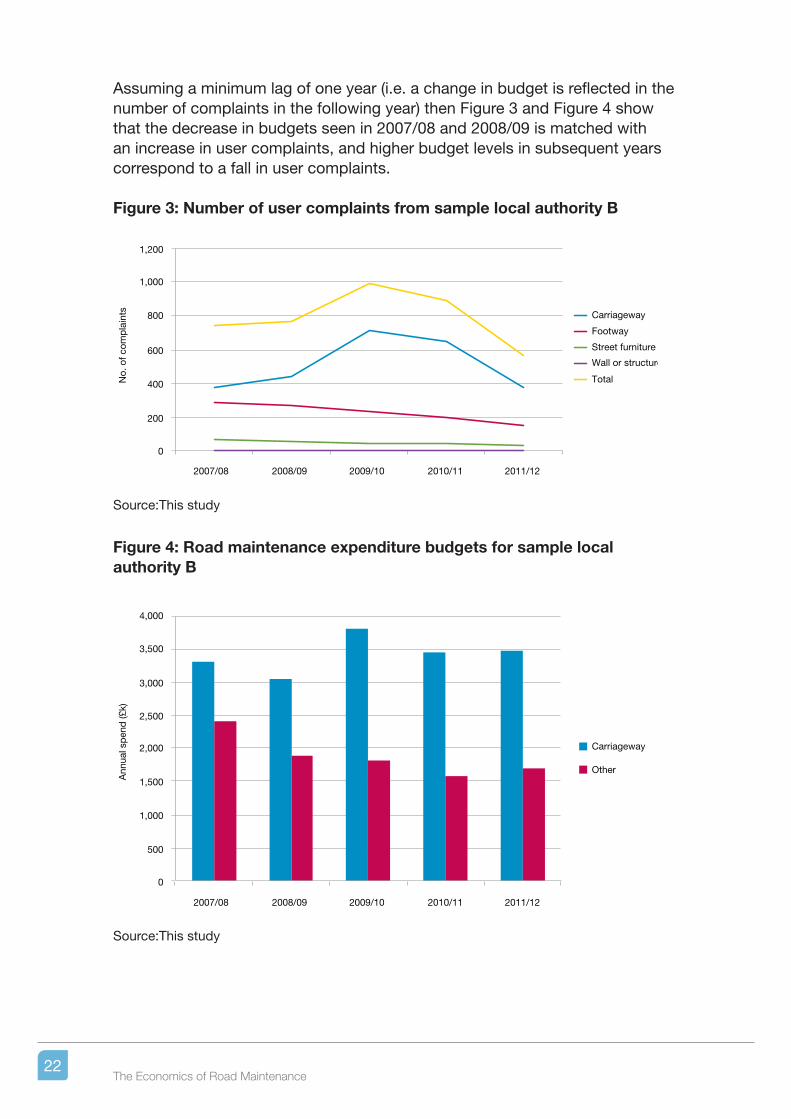
Assuming a minimum lag of one year (i.e. a change in budget is reflected in the number of complaints in the following year) then Figure 3 and Figure 4 show that the decrease in budgets seen in 2007/08 and 2008/09 is matched with an increase in user complaints, and higher budget levels in subsequent years correspond to a fall in user complaints.
Figure 3: Number of user complaints from sample local authority B
Carriageway
Footway
Street furniture
Wall or structure
Total
2007/08 2008/09 2009/10 2010/11 2011/12
No.
of c
omp
lain
ts
1,200
1,000
800
600
400
200
0
Source:This study
Figure 4: Road maintenance expenditure budgets for sample local authority B
Carriageway
Other
2007/08 2008/09 2009/10 2010/11 2011/12
Ann
ual s
pen
d (£
k)
3,000
3,500
4,000
2,500
2,000
1,500
1,000
500
0
Source:This study
22The Economics of Road Maintenance
5.2.7 Summary of issues raised by quantitative review
The small sample of local authorities that it has been possible to investigate in this study allows for only very general principles to be considered rather than any wider national conclusions. However, the fact that the targeted sample provided such a diverse response in terms of both data availability and discernible trends suggests there exists considerable diversity across the network. In some data areas (e.g. asset management planning and condition modelling), because of collaborative initiatives across councils in Scotland, it is likely that the diversity of information in England and Wales is greater than in Scotland. This effect may reduce as local authorities in England and Wales increasingly cooperate in planning and operational activities.
The results from the questionnaires do not show any clear conclusions on trends in maintenance budgets. A range of issues affect the amount of money a local authority will spend on any given activity on its network. Changes in procurement, climate and weather events and changes of political focus all influence maintenance expenditure as well as any a priori reasons for road maintenance activity. Local authorities also draw on a range of budget heads for their wider responsibilities, and this practice varies considerably between authorities.
23The Economics of Road Maintenance
6. Discussion and Conclusions
No new themes have emerged since the qualitative review of the impacts of different levels of maintenance funding carried out for Scotland in 2011 (Parkman et al., 2012a). The impacts identified in that study have been summarised as far as possible into the English and Welsh context in this report. It is important to note that the diversity within each country across local authorities means that the relative effect of each potential impact will vary as much within as between countries.
There is a diversity of context and practice across England and Wales, based on the quantitative review of impacts evidenced from the local authority questionnaire returns. This was not unexpected, but it does highlight that developing a comprehensive understanding of the quantifiable impacts of road maintenance needs to be progressed with care. No sample local authority provided evidence that robust predictions of the quantitative impacts of changes in road maintenance funding have been done. However, it is known that some authorities have made attempts in this area, and it might be possible to identify that work as part of a future investigation.
Some comparisons with the quantitative results for Scotland were explored, but, because of this diversity and the nature of the assumptions required, no result was directly transferable. However, there is no reason to suggest that the key summary conclusion for Scotland (that a reduction in maintenance of £1 results in wider costs to society of around £1.50) would not at least be true for England and Wales. The Scotland study also confirmed the long-term effect of road maintenance and the fact that savings now will increase costs later if the same standards as today are to continue to be adopted.
The breakdowns of the English and Welsh networks (greater proportion of C class and unclassified roads than in Scotland) make it harder reliably to transfer the results from the Scottish analysis to England and Wales. This will also be a challenge if further analysis is to be undertaken, as availability of good-quality
24The Economics of Road Maintenance
samples of data for these parts of the networks is known to be less than for A and B class roads.
The Welsh network is in better condition than the English network (after allowing for a difference in reporting years between the two latest datasets). In any future analysis, it will be useful to understand what effect budget cuts have on the condition from the different starting conditions between the networks.
It is evident that maintenance of different asset types will produce different impacts on road users and parts of society. It is also clear that local authorities respond in different ways to budget reductions. The evidence from the sample of local authorities in this study suggests that budgets for safety-critical infrastructure (e.g. structures, lighting) are likely to be held constant and that other budget areas are reduced first in the event of an overall funding reduction. It would be more efficient therefore to concentrate any future analysis on the categories that are historically shown to have greater exposure to changes in overall budgets.
25The Economics of Road Maintenance
There is little evidence to show that any further qualitative research, in the near future, would provide more depth to current understanding. This is, in part, because many of the literature sources referenced for the Parkman et al. (2012a) Scottish study provided a relevant background for the English context, and there has been little relevant material published since. Local authorities may have undertaken research activities to assess the effects of reduced maintenance budgets for their networks, and it would be useful in the future to collate the results of those studies.
Both the DfT-published statistics and the questionnaire responses provided information that could be used as input data within a fully quantified network analysis of the effects of maintenance budget cuts. However, one of the most critical parts of any analysis of future budget changes is the prediction of the resulting network conditions. In the analysis for Scotland, the projected conditions were available from an already established modelling approach for trunk roads. Scottish local authorities, through their Society of Chief Officers of Transportation in Scotland (SCOTS) collaboration, have a model that projects road conditions based on budget scenarios for all local authorities in Scotland. A similar source of projected condition for England or Wales is not available and will be required for a further study. Development of a network condition projection model can be tailored to the future study and, as a first step, need not be an overly complex model requiring detailed data.
The Scottish study suggested that the most significant quantitative economic impacts of road maintenance arose because of changes in carriageway
7. Recommendations for Future Study
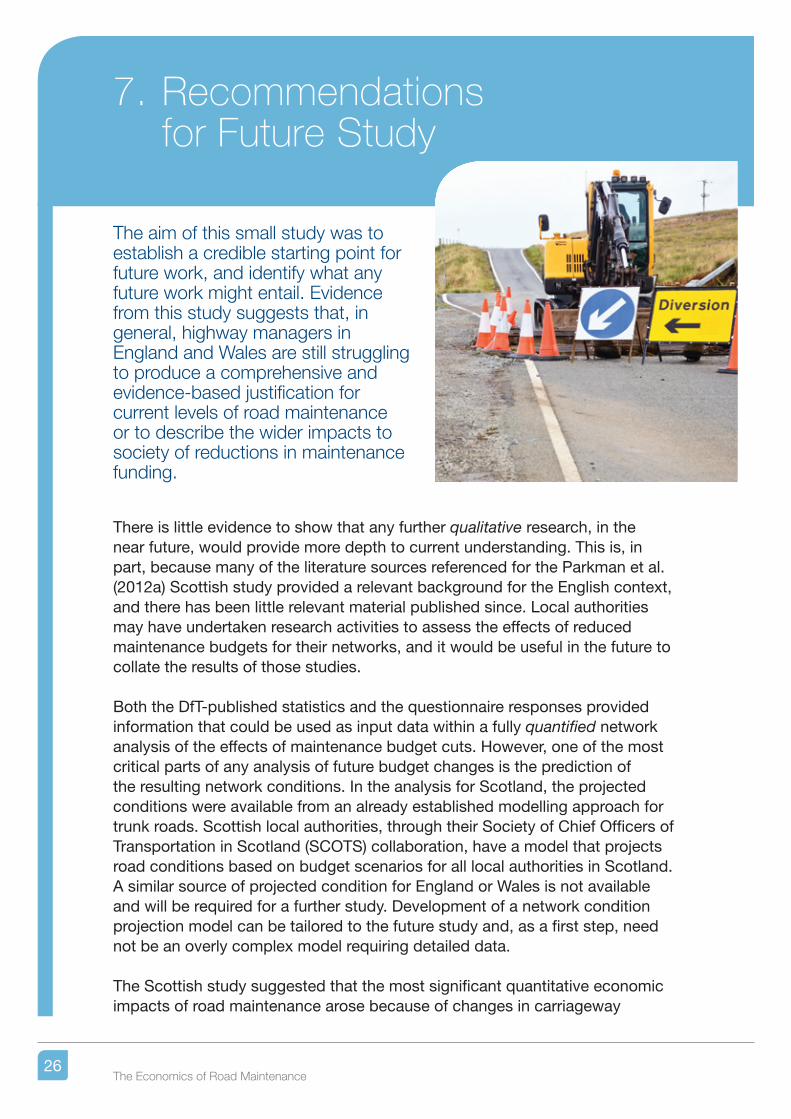
The aim of this small study was to establish a credible starting point for future work, and identify what any future work might entail. Evidence from this study suggests that, in general, highway managers in England and Wales are still struggling to produce a comprehensive and evidence-based justification for current levels of road maintenance or to describe the wider impacts to society of reductions in maintenance funding.
26The Economics of Road Maintenance
maintenance investment and activity and resulting road surface conditions. Variations in recent budgets by activity suggest this will also be the case for roads in England and Wales. With higher traffic levels in England and Wales, there is no a priori reason why the most significant quantitative impacts should not also be due to projected changes in carriageway maintenance on the English and Welsh networks.
Based on this evidence, the focus for any future work should be to:
• establish a carriageway condition projection model approach – a simple, network-level model is suggested as the first step;
• summarise current network condition for carriageways in the format required for the model – assumptions would need to be made at this stage about those significant parts of the network (i.e. C class and unclassified roads) for which less data is likely to be available;
• define funding scenarios and identify the impacts of overall road maintenance budget reductions on carriageway maintenance spend. This is an important task as it defines the extent to which changes in overall maintenance budgets are reflected through to changes in carriageway maintenance and the related economic impacts. It will vary depending on the characteristics of the local authority in terms of environment (rural, urban etc), traffic levels and existing network conditions;
• define road-user cost and vehicle operating cost models, using standard parameters where available from WebTAG and other assumptions as required, to calculate road-user costs;
• determine future network condition and road-user and vehicle operating costs for each funding scenario; and
• perform sensitivity analyses to test range and robustness of results and assumptions.
The methodology could be applied at a national level or by individual or groups of local authorities. However, it will be important that the steps are followed consistently to enable genuine comparison between different analyses outputs.
Finally, it should be noted that the methodology is based on the assumption that, while budget variations considered may be significant, their dominant effect will be to drive incremental change in network condition. If the changes to budgets are more extreme to the extent that closure of significant links on the network will be considered, then a revised methodology would need to be considered. The revised methodology should also address the direct and wider economic impacts of revised travel patterns caused by the use of permanent diversion routes.
27The Economics of Road Maintenance
8. References and Bibliography
Alonso, M. (2001). Analysis of Correlations Between Longitudinal Indices in the Filter Experiment. 80th TRB Conference. Washington DC, USA: Transport Research Board.
Anund, A. (1992). Vagytans Inverkan Pa Fordonshastigheter. Linkoping, Sweden: VTI.
Asphalt Industry Alliance (2011). Annual Local Authority Road Maintenance (ALARM) Survey. London, UK: Asphalt Industry Alliance.
Audit Commission (2011). Going the distance: Achieving better value for money in road maintenance. Local government report, May 2011. Audit Commission, London.
BCIS (Building Cost Information Service) (2011). BIS Construction Price and Cost Indices Online. Retrieved 2011 from www.bcis.co.uk/site/scripts/retail_product_browse.aspx?product_id=770.
Benbow, E., Nesnas, K. & Wright, A. (2006). Shape (Surface Form) of Local Roads (PPR131). Wokingham, UK: Transport Research Laboratory.
Bennett, C. R. & Greenwood, I. (2004). HDM-4 Highway Development and Management. Volume 7. Modelling road user and environmental effects in HDM-4. Washington DC, USA: The World Bank.
BSI (British Standards Institution) (2003). Code of Practice for the Design of Road Lighting. Lighting of Roads and Public Amenity Areas (BS5489). London, UK: British Standards Institution.
BSI (2008a). Specification for the Assessment of the Life Cycle Greenhouse Gas Emissions of Goods and Services (PAS 2050). London, UK: British Standards Institution.
BSI (2008b). Guide to PAS 2050. How to Assess the Carbon Footprint of Goods and Services. London, UK: British Standards Institution.
CABE (Commission for Architecture and the Built Environment) (2007). Paved with Gold – The Real Value of Good Street Design. London, UK: CABE.
28The Economics of Road Maintenance
CIHT (Chartered Institution of Highways and Transportation) (2010). Manual for Streets 2: Wider Application of the Principles. London, UK: CIHT.
Cooper, D. R., Jordan, P. G. & Young, J. C. (1980). The Effect on Traffic Speeds of Resurfacing a Road (Supplementary Report, SR571). Wokingham, UK: Transport Research Laboratory.
Cooper, J., Stafford, K., Owlett, P. & Mitchell, J. (2009). Review of the Lighting Requirement for Traffic Signs and Bollards (PPR382). Wokingham, UK: Transport Research Laboratory.
Coyle, F. & Viner, H. E. (2009). Accident Model for Prioritising Treatments to Improve Road Surface Skid Resistance (Unpublished report CPR750). Wokingham, UK: Transport Research Laboratory.
Crabb, G., Beaumont, R., Steele, D., Darley, P. & Burtwell, M. (2005). Visual Performance under CMH and HPS Lighting Systems: Numelite Project Final Report (PPR043). Wokingham, UK: Transport Research Laboratory.
Crabb, G., Beaumont, R. & Webster, D. (2009a). Review of the Class and Quality of Street Lighting. SL1 (PPR 380). Wokingham, UK: Transport Research Laboratory.
Crabb, G., Crinson, L., Beaumont, R. & Walter, L. (2009b). The Impact of Street Lighting on Night-Time Road Casualties (PPR318). Wokingham, UK: Transport Research Laboratory.
Data Unit Wales (2009). % of Non Principal Roads in Overall Poor Condition. Retrieved 6 December 2012 from www.dataunitwales.gov.uk/quickdatapicker/tableview.aspx?mid=476&id=302&year=latest.
Data Unit Wales (2010). % of Principal A Roads in Overall Poor Condition. Retrieved 6 December 2012 from www.dataunitwales.gov.uk/quickdatapicker/tableview.aspx?mid=476&id=301&year=latest.
DfT (Department for Transport) (n.d.). Statistics at DFT. Retrieved 22 November 2012 and February 2013 from www.gov.uk/government/organisations/department-for-transport/about/statistics.
DfT (2005). Inclusive Mobility: A Guide to Best Practice on Access to Pedestrian and Transport Infrastructure. Retrieved November 2012 from www.gov.uk/government/publications/inclusive-mobility.
DfT (2007). Manual for Streets. London, UK: HMSO.
DfT (2011). Road User Parameters for Use in Analyses on WebTAG Site. Retrieved November 2012 from www.dft.gov.uk/webtag.
29The Economics of Road Maintenance
Fu, L., Perchanok, M. S., Moreno, L. F. & Shah, Q. A. (2006). Effects of Winter Weather and Maintenance Treatments on Highway Safety (Paper 06–0728). TRB 2006 annual meeting. Washington, USA: Federal Highway Administration.
Hanbali, R. M. & Kuemmel, D. A. (1992). Accident Analysis of Ice Control Operation. Retrieved 2010 from www.trc.marquette.edu/publications/IceControl/ice-control-1992.pdf.
Highways Agency (2009). Design Manual for Roads and Bridges. Volume 14. Economic assessment of road maintenance. London, UK: Highways Agency.
ILE (Institution of Lighting Engineers) (2006). Street Lighting – Invest to Save. Retrieved 2010 from www.theilp.org.uk/documents/street-lighting-invest-to-save/street-lighting-invest-to-save.pdf.
ILE (2010). Save Money and Keep the Lights on. London, UK: ILE
Jarrett, J., Woodcock, J , Griffiths, U.K., Chalabi, Z., Edwards, P , Roberts, I , Haines, A. (2012). Effect of increasing active travel in urban England and Wales on costs to the National Health Service. The Lancet, 379 (9832): 2198–2205.
Kennedy, C. & Donbavand, J. (2008). Relationship Between Skid Resistance and Accidents on Local Roads in South West England. 2008 Safer Roads Conference. Cheltenham, UK.
Keizer, K. Lindenberg, S. and Steg, L. (2008). The Spreading of Disorder. Science Vol. 322 p1681-1685. University of Groningen. Groningen, Netherlands.
Linderoth, U. (1981). Samband Mellan Vagyta Och Reshastighet, Etappl. Linkoping, Sweden: VTI.
Parkman, C., Abell, R., Bradbury, T. & Peeling, D. (2012a). Economic, Environmental and Social Impacts of Changes in Maintenance Spend on Roads in Scotland. Summary Report. For Transport Scotland. Retrieved November 2012 from http://www.transportscotland.gov.uk/strategy-and-research/publications-and-consultations/j235740-00.htm
Parkman, C., Bradbury, T., Peeling, D. & Booth, C. (2012b). Economic, Environmental and Social Impacts of Changes in Maintenance Spend on Local Roads in Scotland. For Transport Scotland. Retrieved November 2012 from http://www.transportscotland.gov.uk/strategy-and-research/publications-and-consultations/j235737-00.htm
Parry, A. R., & Viner, H. E. (2005). Accidents and the Skidding Resistance Standard for Strategic Roads in England. Wokingham, UK: Transport Research Laboratory.
30The Economics of Road Maintenance
PIARC (1987). Technical Committee Report on Surface Characteristics. XVIIIth World Road Congress, Brussels, 1987. World Road Association, Paris.
Quarmby, D., Smith, B. & Green, C. (2010). The Resilience of England’s Transport Systems in Winter. Retrieved 2010 from http://transportwinterresilience.independent.gov.uk/docs/final-report.
Ramdas, V., Thomas, C., Lehman, C. & Young, D. (2007). Highway Service Levels (PPR251). Wokingham, UK: Transport Research Laboratory.
Robinson, R., Hide, H., Hodges, J. W., Rolt, J. & Abaynayaka, S. W. (1975). A Road Transport Investment Model for Developing Countries (LR675). Wokingham, UK: Transport Research Laboratory.
Rogers, M. P. & Gargett, T. (1991). A skidding resistance standard for the national road network. Highways and Transportation, 38 (4): 10–16.
Ubaka, D. (2011). Presentation at National Roads Maintenance Review – Wider economic issues, impacts, costs and benefits meeting for Workstream 7, Perth, 18th August 2011.
UK Roads Liaison Group (n.d.) Best Practice Guidelines for Specification of Modern Negative Texture Surfaces (NTS) on Local Authority Highways. London, UK: DfT/ UK Roads Board.
Usmana, T., Fua, L. & Miranda-Morenob, L. F. (2010). Quantifying safety benefit of winter road maintenance: Accident frequency modelling. Accident Analysis and Prevention, 42: 1878–87.
Viner, H. E., Sinhal, R. & Parry, A. R. (2005). Linking Road Traffic Accidents with Skid Resistance – Recent Developments. Wokingham, UK: Transport Research Laboratory.
Wallman, C. G., Wretling, P. & Oberg, G. (1997). Effects of Winter Road Maintenance (Report no. 423A). Linkoping, Sweden: VTI.
Watanatada, T., Harral, C. G., Paterson, W. D., Dhareshwar, A. M., Bhandari, A. & Tsunokawa, K. (1987). The Highway Design and Maintenance Standards Model. Volume 1. Description. Washington, USA: The World Bank, John Hopkins University Press.
Wilde, L. & Viner, H. E. (2001). Interim Report: New Accident Analysis for Friction Specification (PR/IP/29/01). Wokingham, UK: Transport Research Laboratory.
Wretling, P. (1996). Relationship Between the Functional Properties of Road Surface and Traffic Safety: A State-of-the-Art Report (Report no. 32A). Linkoping, Sweden: VTI.
31The Economics of Road Maintenance
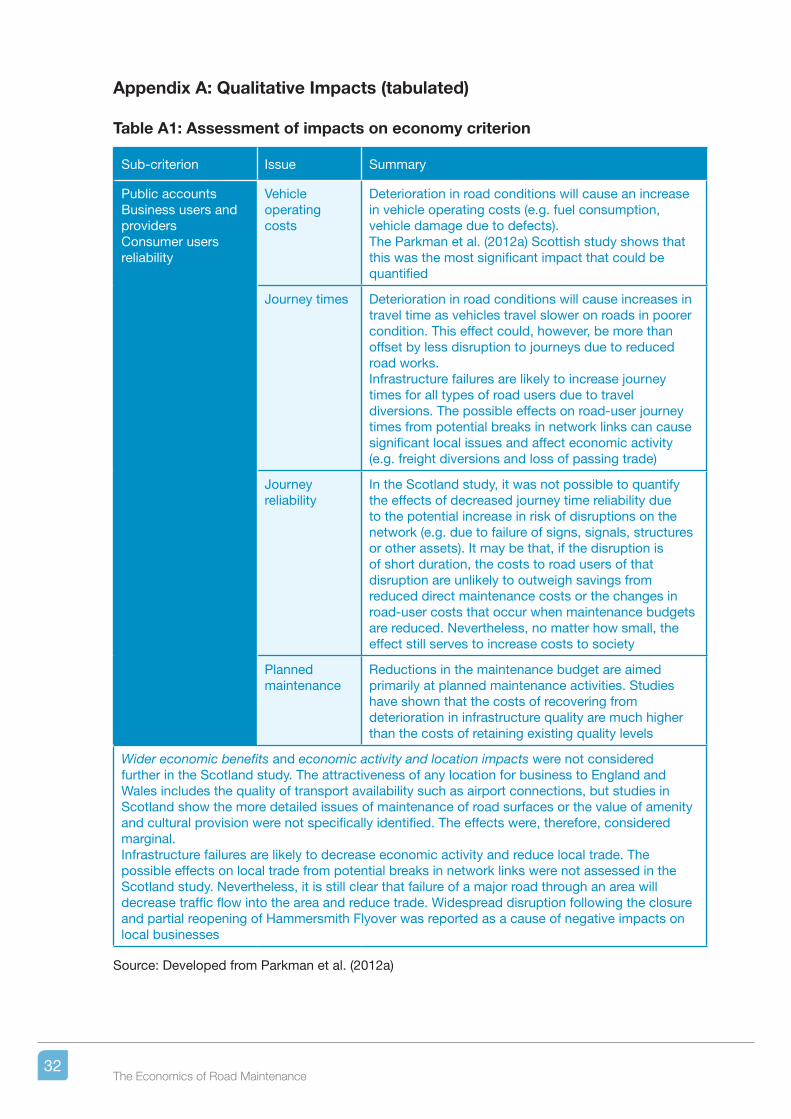
Appendix A: Qualitative Impacts (tabulated)
Table A1: Assessment of impacts on economy criterion
Sub-criterion Issue Summary
Public accountsBusiness users and providersConsumer users reliability
Vehicle operating costs
Deterioration in road conditions will cause an increase in vehicle operating costs (e.g. fuel consumption, vehicle damage due to defects).The Parkman et al. (2012a) Scottish study shows that this was the most significant impact that could be quantified
Journey times Deterioration in road conditions will cause increases in travel time as vehicles travel slower on roads in poorer condition. This effect could, however, be more than offset by less disruption to journeys due to reduced road works.Infrastructure failures are likely to increase journey times for all types of road users due to travel diversions. The possible effects on road-user journey times from potential breaks in network links can cause significant local issues and affect economic activity (e.g. freight diversions and loss of passing trade)
Journey reliability
In the Scotland study, it was not possible to quantify the effects of decreased journey time reliability due to the potential increase in risk of disruptions on the network (e.g. due to failure of signs, signals, structures or other assets). It may be that, if the disruption is of short duration, the costs to road users of that disruption are unlikely to outweigh savings from reduced direct maintenance costs or the changes in road-user costs that occur when maintenance budgets are reduced. Nevertheless, no matter how small, the effect still serves to increase costs to society
Planned maintenance
Reductions in the maintenance budget are aimed primarily at planned maintenance activities. Studies have shown that the costs of recovering from deterioration in infrastructure quality are much higher than the costs of retaining existing quality levels
Wider economic benefits and economic activity and location impacts were not considered further in the Scotland study. The attractiveness of any location for business to England and Wales includes the quality of transport availability such as airport connections, but studies in Scotland show the more detailed issues of maintenance of road surfaces or the value of amenity and cultural provision were not specifically identified. The effects were, therefore, considered marginal.Infrastructure failures are likely to decrease economic activity and reduce local trade. The possible effects on local trade from potential breaks in network links were not assessed in the Scotland study. Nevertheless, it is still clear that failure of a major road through an area will decrease traffic flow into the area and reduce trade. Widespread disruption following the closure and partial reopening of Hammersmith Flyover was reported as a cause of negative impacts on local businesses
Source: Developed from Parkman et al. (2012a)
32The Economics of Road Maintenance
Appendix A: Qualitative Impacts (tabulated)
Table A1: Assessment of impacts on economy criterion
Sub-criterion Issue Summary
Public accountsBusiness users and providersConsumer users reliability
Vehicle operating costs
Deterioration in road conditions will cause an increase in vehicle operating costs (e.g. fuel consumption, vehicle damage due to defects).The Parkman et al. (2012a) Scottish study shows that this was the most significant impact that could be quantified
Journey times Deterioration in road conditions will cause increases in travel time as vehicles travel slower on roads in poorer condition. This effect could, however, be more than offset by less disruption to journeys due to reduced road works.Infrastructure failures are likely to increase journey times for all types of road users due to travel diversions. The possible effects on road-user journey times from potential breaks in network links can cause significant local issues and affect economic activity (e.g. freight diversions and loss of passing trade)
Journey reliability
In the Scotland study, it was not possible to quantify the effects of decreased journey time reliability due to the potential increase in risk of disruptions on the network (e.g. due to failure of signs, signals, structures or other assets). It may be that, if the disruption is of short duration, the costs to road users of that disruption are unlikely to outweigh savings from reduced direct maintenance costs or the changes in road-user costs that occur when maintenance budgets are reduced. Nevertheless, no matter how small, the effect still serves to increase costs to society
Planned maintenance
Reductions in the maintenance budget are aimed primarily at planned maintenance activities. Studies have shown that the costs of recovering from deterioration in infrastructure quality are much higher than the costs of retaining existing quality levels
Wider economic benefits and economic activity and location impacts were not considered further in the Scotland study. The attractiveness of any location for business to England and Wales includes the quality of transport availability such as airport connections, but studies in Scotland show the more detailed issues of maintenance of road surfaces or the value of amenity and cultural provision were not specifically identified. The effects were, therefore, considered marginal.Infrastructure failures are likely to decrease economic activity and reduce local trade. The possible effects on local trade from potential breaks in network links were not assessed in the Scotland study. Nevertheless, it is still clear that failure of a major road through an area will decrease traffic flow into the area and reduce trade. Widespread disruption following the closure and partial reopening of Hammersmith Flyover was reported as a cause of negative impacts on local businesses
Source: Developed from Parkman et al. (2012a)
Table A2: Assessment of impacts on environmental criterion
Sub-criterion Issue Summary
Noise New projects New road projects adopt the latest standards and often provide noise mitigation measures (e.g. noise barriers in urban areas). Maintenance of noise barriers was not considered in the study for Scotland, but it is likely that, as maintenance budgets are reduced, the funding for the repair of existing barriers will come under pressure. New surfaces, to current standards, lead to low levels of vibration in adjacent buildings, but in the early life of some new surfaces there may still be high levels of noise from the interaction between vehicle tyres and the road surface. The amount of maintenance reduces with the funding reductions, so this effect is likely to be reduced, but it may be more than offset by the use of cheaper surfacings (e.g. surface dressings), which are noisier, and their use may become more prevalent as funding reduces
Road surfacing and traffic noise
The desire to minimise resurfacing costs will lead to increased surface lives and a pressure to adopt cheaper treatments. After an initial settling-in period, surfacings can generate more noise with trafficking as they age.Thin surfacing systems have been in widespread use on strategic English roads since 1995 and are becoming more common on local roads. This is because they provide a high-performance, rut-resistant, low-noise and skid-resistant layer. Negative Textured Surfacings (a form of thin surfacing) are frequently used as an alternative to hot rolled asphalt (UK Roads Liaison Group, n.d.). However, thin surfaces have a greater risk of premature failure and thus a reduced life (in comparison to traditional surfacings) when they are laid in suboptimal conditions. Existing guidance for planning, specifying, installing and maintaining thin surfacings should minimise the likelihood of misuse of these surfaces. The potential impact of changes in noise owing to reduced maintenance expenditure is therefore considered neutral. However, a reduction in overall highway funding could result in a cheaper initial cost option being chosen over investment in higher-cost, longer-life surfacings.As surfaces deteriorate and funding for routine maintenance (e.g. patching) reduces, the likelihood for potholes and other sudden surface discontinuities increases. It is these sudden changes in ride quality that lead to increased vibrations and noise in nearby buildings, which are likely to be a concern to local communities, but these have not been quantified in this study. Increases in vibrations might also adversely affect vehicle users, particularly those who drive for long periods (e.g. truck drivers)
Local air quality Vehicle use Reductions in local air quality owing to vehicle use will be proportional overall to the effects of global air quality noted below but specific to the locality in question
33The Economics of Road Maintenance
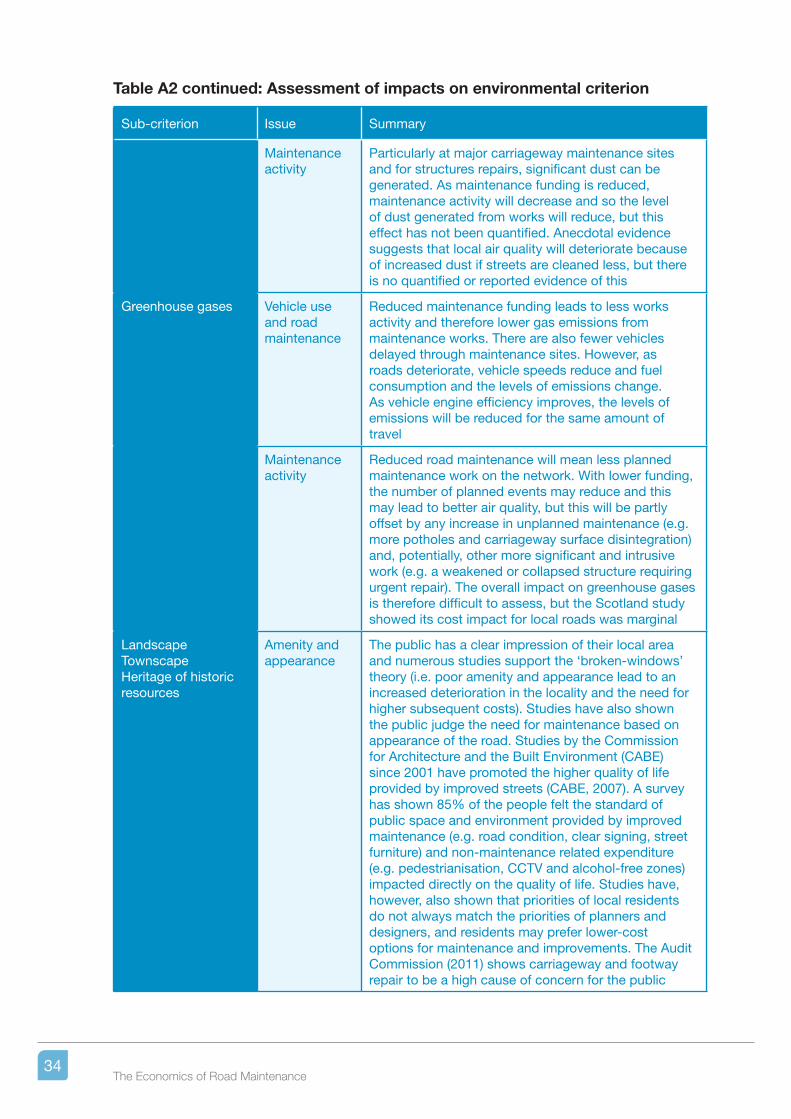
Sub-criterion Issue Summary
Maintenance activity
Particularly at major carriageway maintenance sites and for structures repairs, significant dust can be generated. As maintenance funding is reduced, maintenance activity will decrease and so the level of dust generated from works will reduce, but this effect has not been quantified. Anecdotal evidence suggests that local air quality will deteriorate because of increased dust if streets are cleaned less, but there is no quantified or reported evidence of this
Greenhouse gases Vehicle use and road maintenance
Reduced maintenance funding leads to less works activity and therefore lower gas emissions from maintenance works. There are also fewer vehicles delayed through maintenance sites. However, as roads deteriorate, vehicle speeds reduce and fuel consumption and the levels of emissions change. As vehicle engine efficiency improves, the levels of emissions will be reduced for the same amount of travel
Maintenance activity
Reduced road maintenance will mean less planned maintenance work on the network. With lower funding, the number of planned events may reduce and this may lead to better air quality, but this will be partly offset by any increase in unplanned maintenance (e.g. more potholes and carriageway surface disintegration) and, potentially, other more significant and intrusive work (e.g. a weakened or collapsed structure requiring urgent repair). The overall impact on greenhouse gases is therefore difficult to assess, but the Scotland study showed its cost impact for local roads was marginal
LandscapeTownscapeHeritage of historic resources
Amenity and appearance
The public has a clear impression of their local area and numerous studies support the ‘broken-windows’ theory (i.e. poor amenity and appearance lead to an increased deterioration in the locality and the need for higher subsequent costs). Studies have also shown the public judge the need for maintenance based on appearance of the road. Studies by the Commission for Architecture and the Built Environment (CABE) since 2001 have promoted the higher quality of life provided by improved streets (CABE, 2007). A survey has shown 85% of the people felt the standard of public space and environment provided by improved maintenance (e.g. road condition, clear signing, street furniture) and non-maintenance related expenditure (e.g. pedestrianisation, CCTV and alcohol-free zones) impacted directly on the quality of life. Studies have, however, also shown that priorities of local residents do not always match the priorities of planners and designers, and residents may prefer lower-cost options for maintenance and improvements. The Audit Commission (2011) shows carriageway and footway repair to be a high cause of concern for the public
Table A2 continued: Assessment of impacts on environmental criterion
34The Economics of Road Maintenance
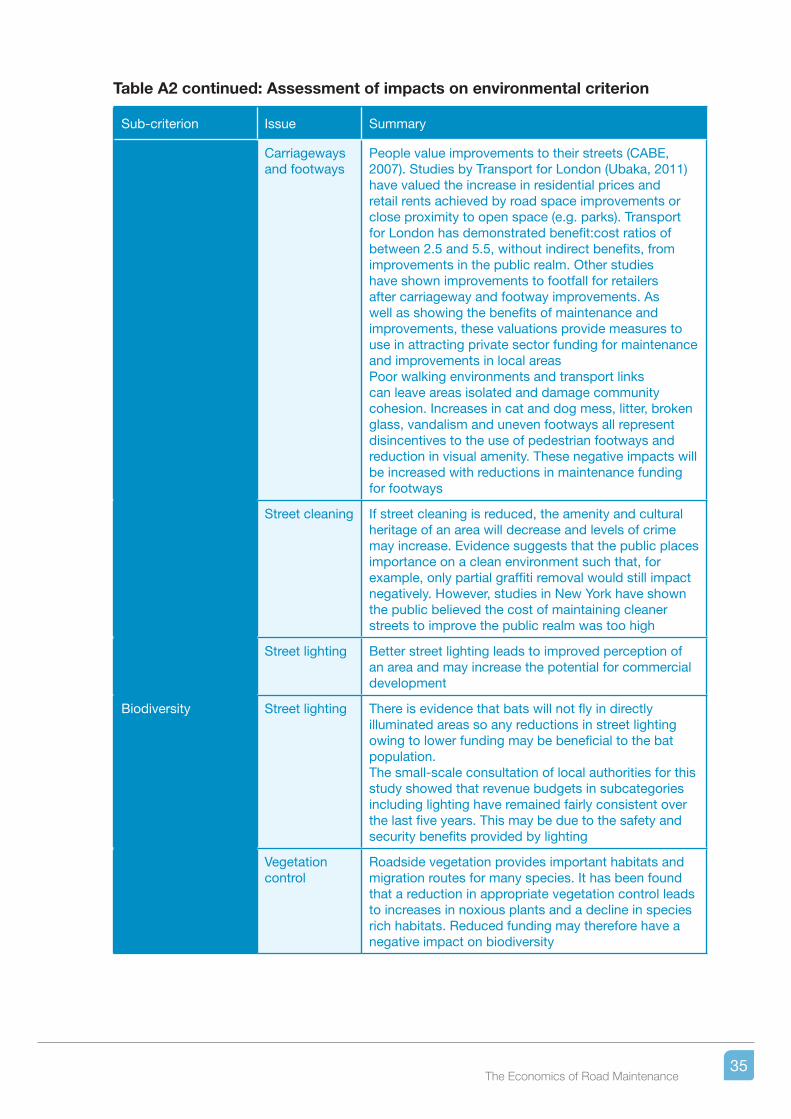
Sub-criterion Issue Summary
Carriageways and footways
People value improvements to their streets (CABE, 2007). Studies by Transport for London (Ubaka, 2011) have valued the increase in residential prices and retail rents achieved by road space improvements or close proximity to open space (e.g. parks). Transport for London has demonstrated benefit:cost ratios of between 2.5 and 5.5, without indirect benefits, from improvements in the public realm. Other studies have shown improvements to footfall for retailers after carriageway and footway improvements. As well as showing the benefits of maintenance and improvements, these valuations provide measures to use in attracting private sector funding for maintenance and improvements in local areasPoor walking environments and transport links can leave areas isolated and damage community cohesion. Increases in cat and dog mess, litter, broken glass, vandalism and uneven footways all represent disincentives to the use of pedestrian footways and reduction in visual amenity. These negative impacts will be increased with reductions in maintenance funding for footways
Street cleaning If street cleaning is reduced, the amenity and cultural heritage of an area will decrease and levels of crime may increase. Evidence suggests that the public places importance on a clean environment such that, for example, only partial graffiti removal would still impact negatively. However, studies in New York have shown the public believed the cost of maintaining cleaner streets to improve the public realm was too high
Street lighting Better street lighting leads to improved perception of an area and may increase the potential for commercial development
Biodiversity Street lighting There is evidence that bats will not fly in directly illuminated areas so any reductions in street lighting owing to lower funding may be beneficial to the bat population.The small-scale consultation of local authorities for this study showed that revenue budgets in subcategories including lighting have remained fairly consistent over the last five years. This may be due to the safety and security benefits provided by lighting
Vegetation control
Roadside vegetation provides important habitats and migration routes for many species. It has been found that a reduction in appropriate vegetation control leads to increases in noxious plants and a decline in species rich habitats. Reduced funding may therefore have a negative impact on biodiversity
Table A2 continued: Assessment of impacts on environmental criterion
35The Economics of Road Maintenance
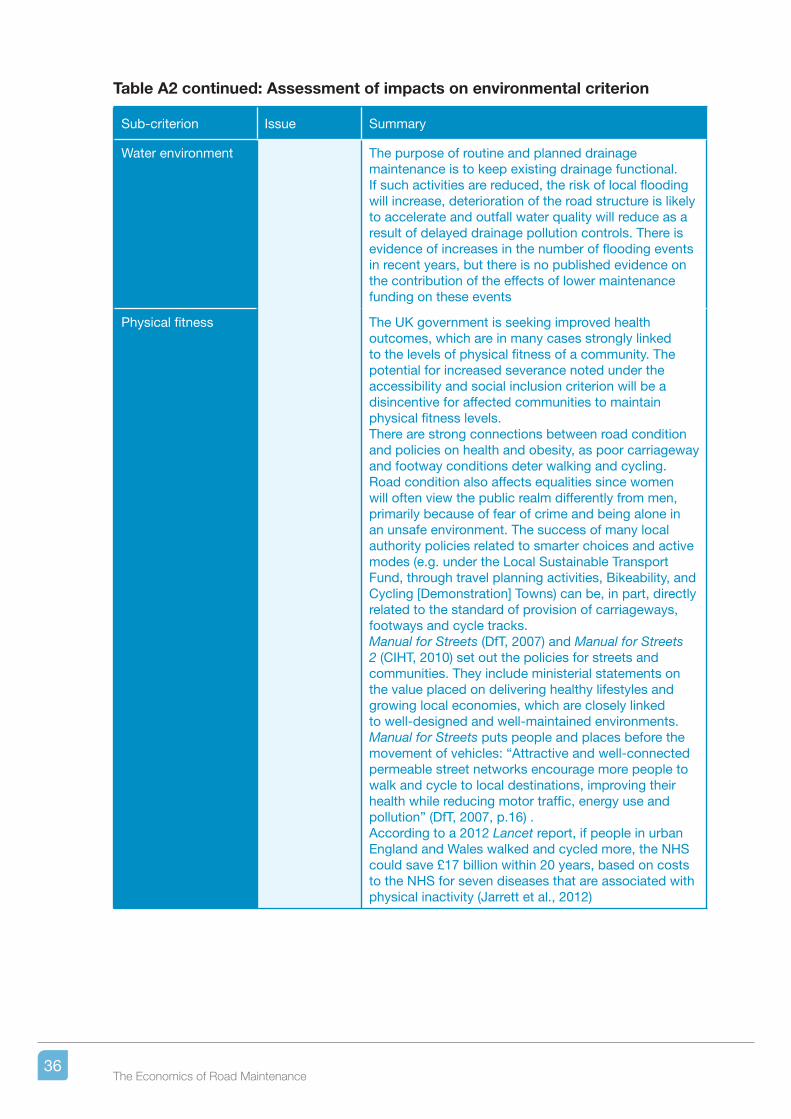
Sub-criterion Issue Summary
Water environment The purpose of routine and planned drainage maintenance is to keep existing drainage functional. If such activities are reduced, the risk of local flooding will increase, deterioration of the road structure is likely to accelerate and outfall water quality will reduce as a result of delayed drainage pollution controls. There is evidence of increases in the number of flooding events in recent years, but there is no published evidence on the contribution of the effects of lower maintenance funding on these events
Physical fitness The UK government is seeking improved health outcomes, which are in many cases strongly linked to the levels of physical fitness of a community. The potential for increased severance noted under the accessibility and social inclusion criterion will be a disincentive for affected communities to maintain physical fitness levels.There are strong connections between road condition and policies on health and obesity, as poor carriageway and footway conditions deter walking and cycling. Road condition also affects equalities since women will often view the public realm differently from men, primarily because of fear of crime and being alone in an unsafe environment. The success of many local authority policies related to smarter choices and active modes (e.g. under the Local Sustainable Transport Fund, through travel planning activities, Bikeability, and Cycling [Demonstration] Towns) can be, in part, directly related to the standard of provision of carriageways, footways and cycle tracks.Manual for Streets (DfT, 2007) and Manual for Streets 2 (CIHT, 2010) set out the policies for streets and communities. They include ministerial statements on the value placed on delivering healthy lifestyles and growing local economies, which are closely linked to well-designed and well-maintained environments. Manual for Streets puts people and places before the movement of vehicles: “Attractive and well-connected permeable street networks encourage more people to walk and cycle to local destinations, improving their health while reducing motor traffic, energy use and pollution” (DfT, 2007, p.16) .According to a 2012 Lancet report, if people in urban England and Wales walked and cycled more, the NHS could save £17 billion within 20 years, based on costs to the NHS for seven diseases that are associated with physical inactivity (Jarrett et al., 2012)
Table A2 continued: Assessment of impacts on environmental criterion
36The Economics of Road Maintenance
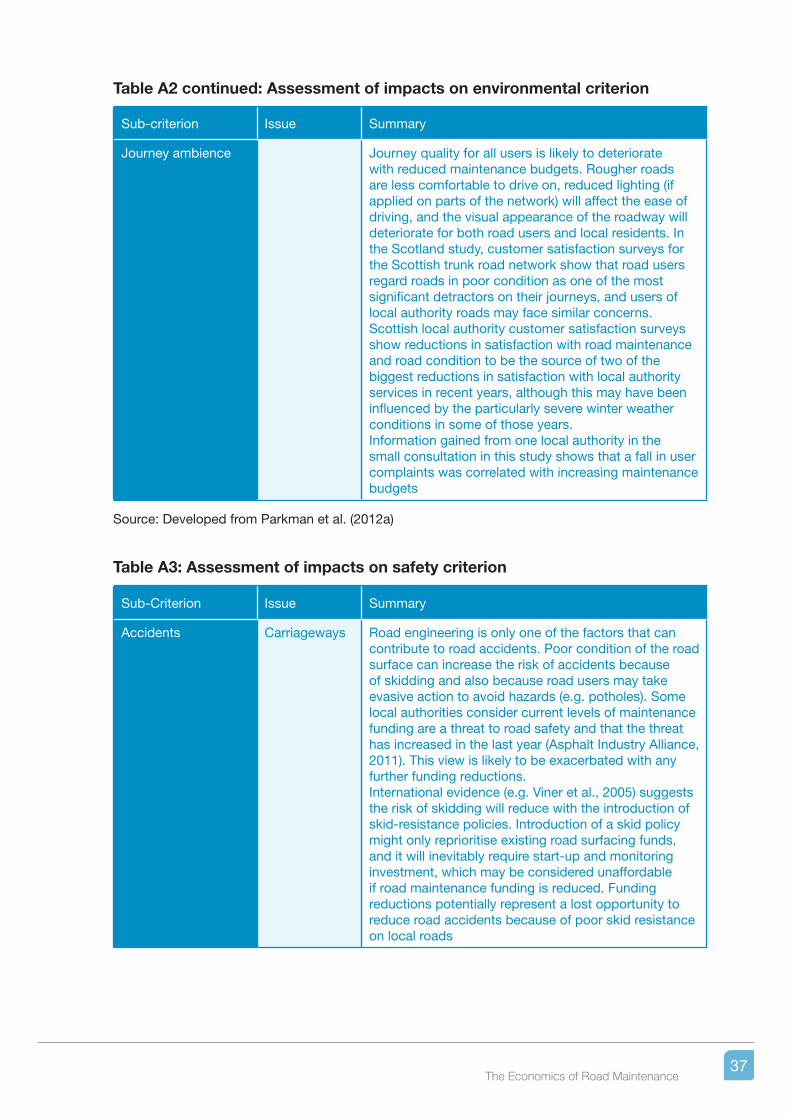
Sub-criterion Issue Summary
Journey ambience Journey quality for all users is likely to deteriorate with reduced maintenance budgets. Rougher roads are less comfortable to drive on, reduced lighting (if applied on parts of the network) will affect the ease of driving, and the visual appearance of the roadway will deteriorate for both road users and local residents. In the Scotland study, customer satisfaction surveys for the Scottish trunk road network show that road users regard roads in poor condition as one of the most significant detractors on their journeys, and users of local authority roads may face similar concerns.Scottish local authority customer satisfaction surveys show reductions in satisfaction with road maintenance and road condition to be the source of two of the biggest reductions in satisfaction with local authority services in recent years, although this may have been influenced by the particularly severe winter weather conditions in some of those years.Information gained from one local authority in the small consultation in this study shows that a fall in user complaints was correlated with increasing maintenance budgets
Source: Developed from Parkman et al. (2012a)
Table A3: Assessment of impacts on safety criterion
Sub-Criterion Issue Summary
Accidents Carriageways Road engineering is only one of the factors that can contribute to road accidents. Poor condition of the road surface can increase the risk of accidents because of skidding and also because road users may take evasive action to avoid hazards (e.g. potholes). Some local authorities consider current levels of maintenance funding are a threat to road safety and that the threat has increased in the last year (Asphalt Industry Alliance, 2011). This view is likely to be exacerbated with any further funding reductions.International evidence (e.g. Viner et al., 2005) suggests the risk of skidding will reduce with the introduction of skid-resistance policies. Introduction of a skid policy might only reprioritise existing road surfacing funds, and it will inevitably require start-up and monitoring investment, which may be considered unaffordable if road maintenance funding is reduced. Funding reductions potentially represent a lost opportunity to reduce road accidents because of poor skid resistance on local roads
Table A2 continued: Assessment of impacts on environmental criterion
37The Economics of Road Maintenance
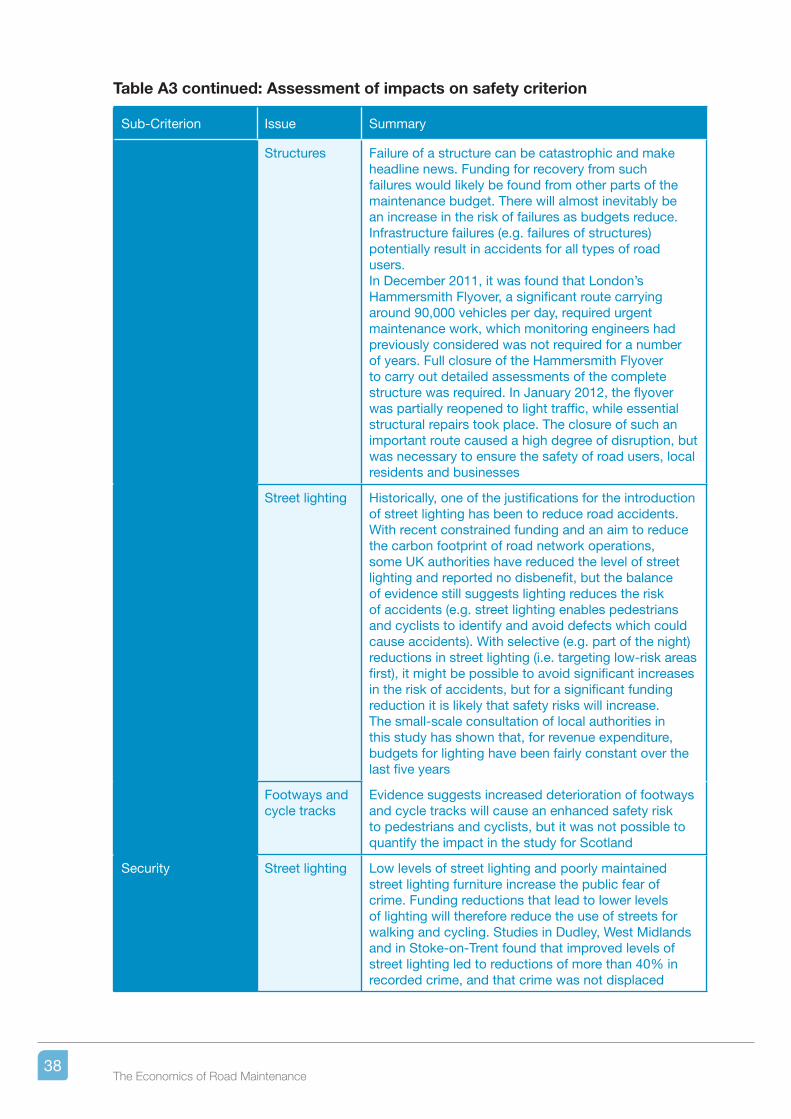
Table A3 continued: Assessment of impacts on safety criterion
Sub-Criterion Issue Summary
Structures Failure of a structure can be catastrophic and make headline news. Funding for recovery from such failures would likely be found from other parts of the maintenance budget. There will almost inevitably be an increase in the risk of failures as budgets reduce. Infrastructure failures (e.g. failures of structures) potentially result in accidents for all types of road users.In December 2011, it was found that London’s Hammersmith Flyover, a significant route carrying around 90,000 vehicles per day, required urgent maintenance work, which monitoring engineers had previously considered was not required for a number of years. Full closure of the Hammersmith Flyover to carry out detailed assessments of the complete structure was required. In January 2012, the flyover was partially reopened to light traffic, while essential structural repairs took place. The closure of such an important route caused a high degree of disruption, but was necessary to ensure the safety of road users, local residents and businesses
Street lighting Historically, one of the justifications for the introduction of street lighting has been to reduce road accidents. With recent constrained funding and an aim to reduce the carbon footprint of road network operations, some UK authorities have reduced the level of street lighting and reported no disbenefit, but the balance of evidence still suggests lighting reduces the risk of accidents (e.g. street lighting enables pedestrians and cyclists to identify and avoid defects which could cause accidents). With selective (e.g. part of the night) reductions in street lighting (i.e. targeting low-risk areas first), it might be possible to avoid significant increases in the risk of accidents, but for a significant funding reduction it is likely that safety risks will increase.The small-scale consultation of local authorities in this study has shown that, for revenue expenditure, budgets for lighting have been fairly constant over the last five years
Footways and cycle tracks
Evidence suggests increased deterioration of footways and cycle tracks will cause an enhanced safety risk to pedestrians and cyclists, but it was not possible to quantify the impact in the study for Scotland
Security Street lighting Low levels of street lighting and poorly maintained street lighting furniture increase the public fear of crime. Funding reductions that lead to lower levels of lighting will therefore reduce the use of streets for walking and cycling. Studies in Dudley, West Midlands and in Stoke-on-Trent found that improved levels of street lighting led to reductions of more than 40% in recorded crime, and that crime was not displaced
38The Economics of Road Maintenance
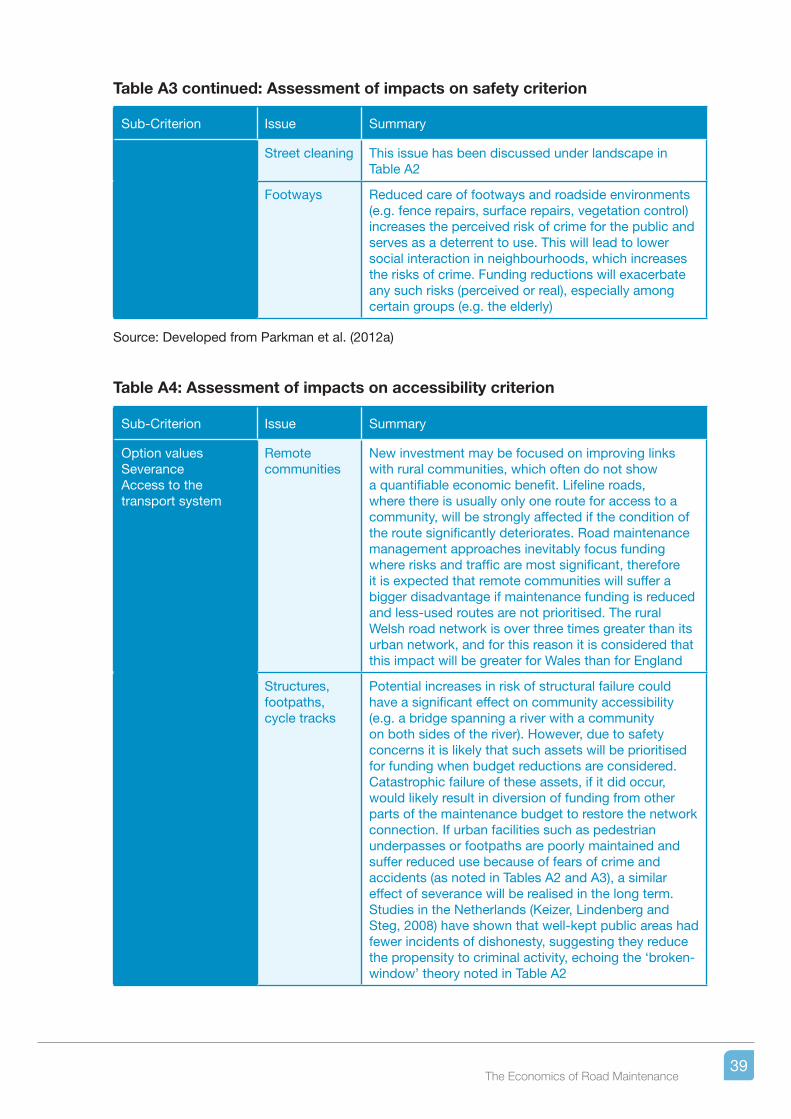
Sub-Criterion Issue Summary
Street cleaning This issue has been discussed under landscape in Table A2
Footways Reduced care of footways and roadside environments (e.g. fence repairs, surface repairs, vegetation control) increases the perceived risk of crime for the public and serves as a deterrent to use. This will lead to lower social interaction in neighbourhoods, which increases the risks of crime. Funding reductions will exacerbate any such risks (perceived or real), especially among certain groups (e.g. the elderly)
Source: Developed from Parkman et al. (2012a)
Table A4: Assessment of impacts on accessibility criterion
Sub-Criterion Issue Summary
Option valuesSeveranceAccess to the transport system
Remote communities
New investment may be focused on improving links with rural communities, which often do not show a quantifiable economic benefit. Lifeline roads, where there is usually only one route for access to a community, will be strongly affected if the condition of the route significantly deteriorates. Road maintenance management approaches inevitably focus funding where risks and traffic are most significant, therefore it is expected that remote communities will suffer a bigger disadvantage if maintenance funding is reduced and less-used routes are not prioritised. The rural Welsh road network is over three times greater than its urban network, and for this reason it is considered that this impact will be greater for Wales than for England
Structures, footpaths, cycle tracks
Potential increases in risk of structural failure could have a significant effect on community accessibility (e.g. a bridge spanning a river with a community on both sides of the river). However, due to safety concerns it is likely that such assets will be prioritised for funding when budget reductions are considered. Catastrophic failure of these assets, if it did occur, would likely result in diversion of funding from other parts of the maintenance budget to restore the network connection. If urban facilities such as pedestrian underpasses or footpaths are poorly maintained and suffer reduced use because of fears of crime and accidents (as noted in Tables A2 and A3), a similar effect of severance will be realised in the long term. Studies in the Netherlands (Keizer, Lindenberg and Steg, 2008) have shown that well-kept public areas had fewer incidents of dishonesty, suggesting they reduce the propensity to criminal activity, echoing the ‘broken-window’ theory noted in Table A2
Table A3 continued: Assessment of impacts on safety criterion
39The Economics of Road Maintenance
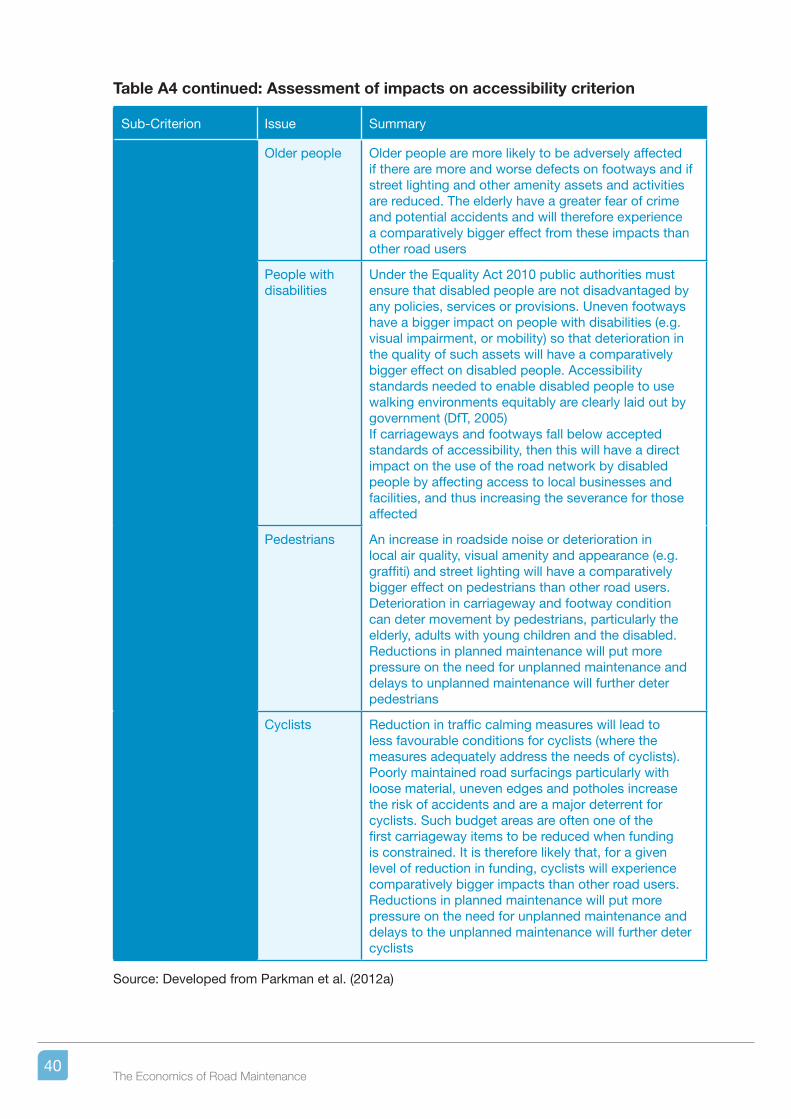
Table A4 continued: Assessment of impacts on accessibility criterion
Sub-Criterion Issue Summary
Older people Older people are more likely to be adversely affected if there are more and worse defects on footways and if street lighting and other amenity assets and activities are reduced. The elderly have a greater fear of crime and potential accidents and will therefore experience a comparatively bigger effect from these impacts than other road users
People with disabilities
Under the Equality Act 2010 public authorities must ensure that disabled people are not disadvantaged by any policies, services or provisions. Uneven footways have a bigger impact on people with disabilities (e.g. visual impairment, or mobility) so that deterioration in the quality of such assets will have a comparatively bigger effect on disabled people. Accessibility standards needed to enable disabled people to use walking environments equitably are clearly laid out by government (DfT, 2005)If carriageways and footways fall below accepted standards of accessibility, then this will have a direct impact on the use of the road network by disabled people by affecting access to local businesses and facilities, and thus increasing the severance for those affected
Pedestrians An increase in roadside noise or deterioration in local air quality, visual amenity and appearance (e.g. graffiti) and street lighting will have a comparatively bigger effect on pedestrians than other road users. Deterioration in carriageway and footway condition can deter movement by pedestrians, particularly the elderly, adults with young children and the disabled. Reductions in planned maintenance will put more pressure on the need for unplanned maintenance and delays to unplanned maintenance will further deter pedestrians
Cyclists Reduction in traffic calming measures will lead to less favourable conditions for cyclists (where the measures adequately address the needs of cyclists). Poorly maintained road surfacings particularly with loose material, uneven edges and potholes increase the risk of accidents and are a major deterrent for cyclists. Such budget areas are often one of the first carriageway items to be reduced when funding is constrained. It is therefore likely that, for a given level of reduction in funding, cyclists will experience comparatively bigger impacts than other road users. Reductions in planned maintenance will put more pressure on the need for unplanned maintenance and delays to the unplanned maintenance will further deter cyclists
Source: Developed from Parkman et al. (2012a)
40The Economics of Road Maintenance

Table A5: Assessment of Impacts on Integration Criterion
Sub-Criterion Issue Summary
Transport interchange land use policy
Transport interchange as well as transport and land-use integration were not considered further in the Scotland study. Decreasing maintenance budgets are likely to have an equal effect on aspects of transport interchanges (e.g. environment, safety, perceptions and accessibility) as on other parts of the road network. The effects of levels of maintenance funding on land-use integration are considered marginal
Policy integration Physical fitness and health
The UK government is seeking improved health outcomes, which are in many cases strongly linked to the levels of physical fitness of a community. Tables A2 and A3 have highlighted how such outcomes are linked to provision of adequate transport infrastructure
Source: Developed from Parkman et al. (2012a)
41The Economics of Road Maintenance
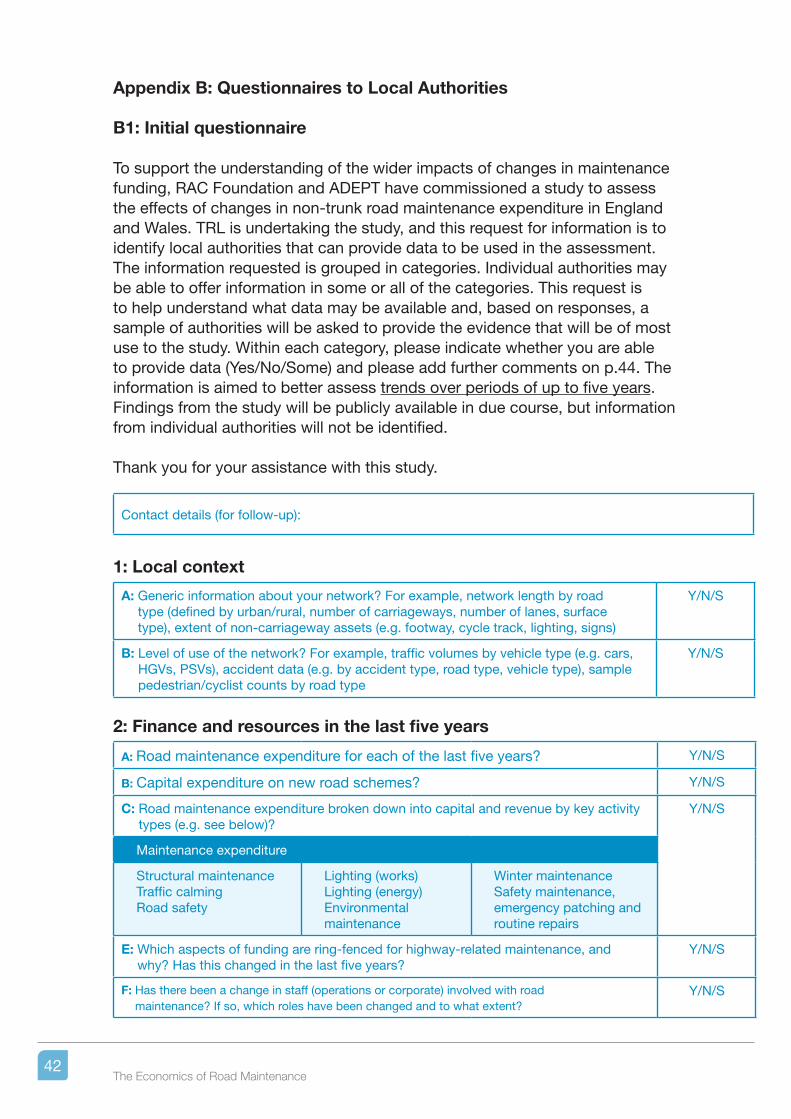
Appendix B: Questionnaires to Local Authorities
B1: Initial questionnaire
To support the understanding of the wider impacts of changes in maintenance funding, RAC Foundation and ADEPT have commissioned a study to assess the effects of changes in non-trunk road maintenance expenditure in England and Wales. TRL is undertaking the study, and this request for information is to identify local authorities that can provide data to be used in the assessment. The information requested is grouped in categories. Individual authorities may be able to offer information in some or all of the categories. This request is to help understand what data may be available and, based on responses, a sample of authorities will be asked to provide the evidence that will be of most use to the study. Within each category, please indicate whether you are able to provide data (Yes/No/Some) and please add further comments on p.44. The information is aimed to better assess trends over periods of up to five years. Findings from the study will be publicly available in due course, but information from individual authorities will not be identified.
Thank you for your assistance with this study.
Contact details (for follow-up):
1: Local context
A: Generic information about your network? For example, network length by road type (defined by urban/rural, number of carriageways, number of lanes, surface type), extent of non-carriageway assets (e.g. footway, cycle track, lighting, signs)
Y/N/S
B: Level of use of the network? For example, traffic volumes by vehicle type (e.g. cars, HGVs, PSVs), accident data (e.g. by accident type, road type, vehicle type), sample pedestrian/cyclist counts by road type
Y/N/S
2: Finance and resources in the last five years
A: Road maintenance expenditure for each of the last five years? Y/N/S
B: Capital expenditure on new road schemes? Y/N/S
C: Road maintenance expenditure broken down into capital and revenue by key activity types (e.g. see below)?
Y/N/S
Maintenance expenditure
Structural maintenance Traffic calmingRoad safety
Lighting (works)Lighting (energy)Environmental maintenance
Winter maintenanceSafety maintenance, emergency patching and routine repairs
E: Which aspects of funding are ring-fenced for highway-related maintenance, and why? Has this changed in the last five years?
Y/N/S
F: Has there been a change in staff (operations or corporate) involved with road maintenance? If so, which roles have been changed and to what extent?
Y/N/S
42The Economics of Road Maintenance
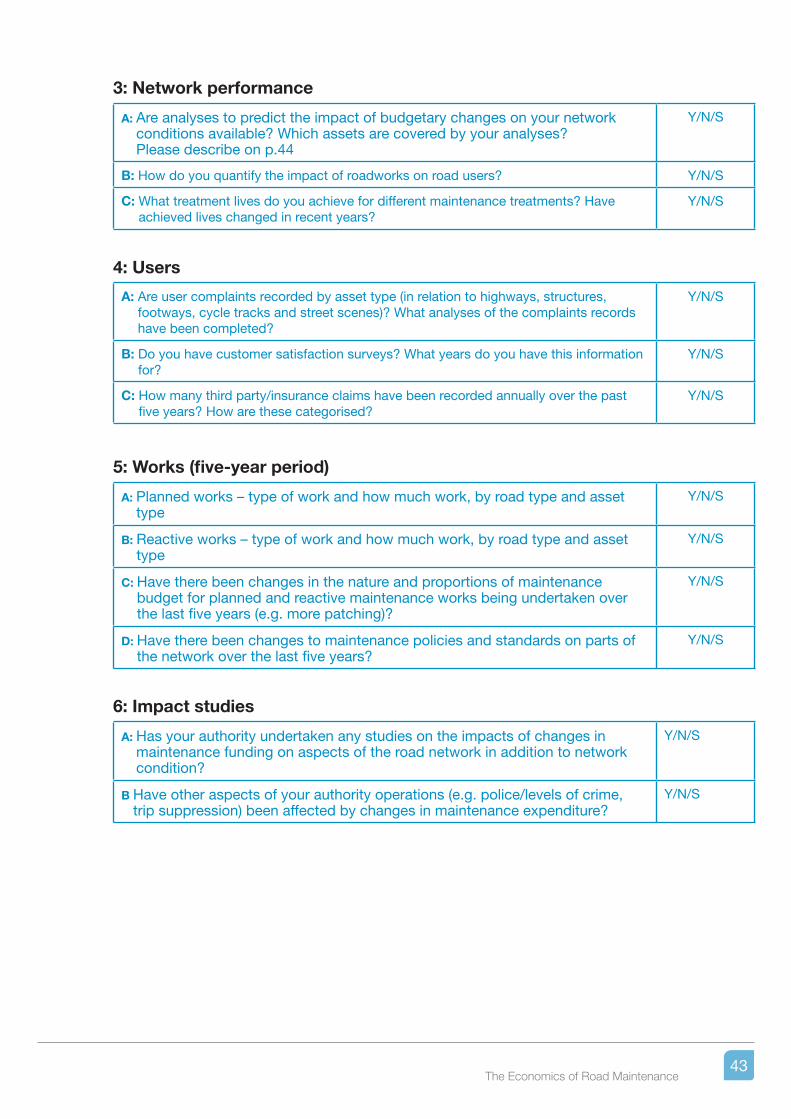
3: Network performance
A: Are analyses to predict the impact of budgetary changes on your network conditions available? Which assets are covered by your analyses? Please describe on p.44
Y/N/S
B: How do you quantify the impact of roadworks on road users? Y/N/S
C: What treatment lives do you achieve for different maintenance treatments? Have achieved lives changed in recent years?
Y/N/S
4: Users
A: Are user complaints recorded by asset type (in relation to highways, structures, footways, cycle tracks and street scenes)? What analyses of the complaints records have been completed?
Y/N/S
B: Do you have customer satisfaction surveys? What years do you have this information for?
Y/N/S
C: How many third party/insurance claims have been recorded annually over the past five years? How are these categorised?
Y/N/S
5: Works (five-year period)
A: Planned works – type of work and how much work, by road type and asset type
Y/N/S
B: Reactive works – type of work and how much work, by road type and asset type
Y/N/S
C: Have there been changes in the nature and proportions of maintenance budget for planned and reactive maintenance works being undertaken over the last five years (e.g. more patching)?
Y/N/S
D: Have there been changes to maintenance policies and standards on parts of the network over the last five years?
Y/N/S
6: Impact studies
A: Has your authority undertaken any studies on the impacts of changes in maintenance funding on aspects of the road network in addition to network condition?
Y/N/S
B Have other aspects of your authority operations (e.g. police/levels of crime, trip suppression) been affected by changes in maintenance expenditure?
Y/N/S
43The Economics of Road Maintenance

Local authority: [Authority name and contact details]
Additional comments
Ref (1A, etc)
Comment
44The Economics of Road Maintenance
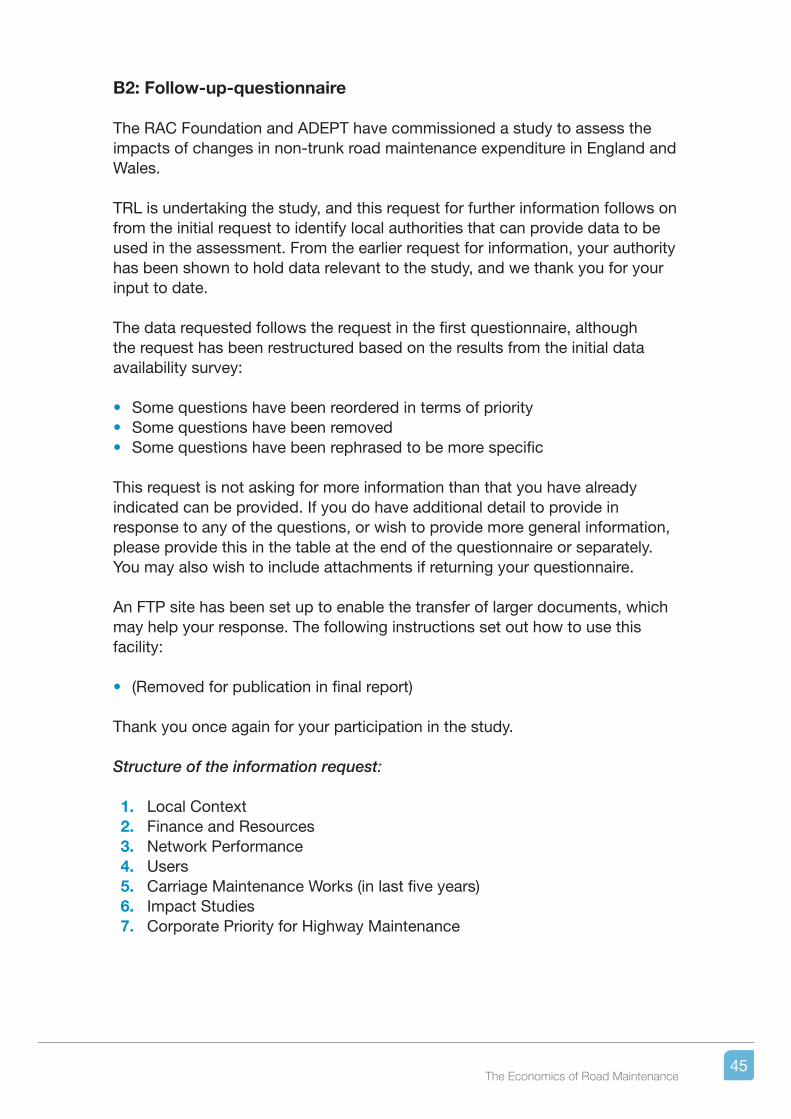
B2: Follow-up-questionnaire
The RAC Foundation and ADEPT have commissioned a study to assess the impacts of changes in non-trunk road maintenance expenditure in England and Wales.
TRL is undertaking the study, and this request for further information follows on from the initial request to identify local authorities that can provide data to be used in the assessment. From the earlier request for information, your authority has been shown to hold data relevant to the study, and we thank you for your input to date.
The data requested follows the request in the first questionnaire, although the request has been restructured based on the results from the initial data availability survey:
• Some questions have been reordered in terms of priority • Some questions have been removed • Some questions have been rephrased to be more specific
This request is not asking for more information than that you have already indicated can be provided. If you do have additional detail to provide in response to any of the questions, or wish to provide more general information, please provide this in the table at the end of the questionnaire or separately. You may also wish to include attachments if returning your questionnaire.
An FTP site has been set up to enable the transfer of larger documents, which may help your response. The following instructions set out how to use this facility:
• (Removed for publication in final report)
Thank you once again for your participation in the study.
Structure of the information request:
1. Local Context2. Finance and Resources3. Network Performance4. Users5. Carriage Maintenance Works (in last five years)6. Impact Studies7. Corporate Priority for Highway Maintenance
45The Economics of Road Maintenance
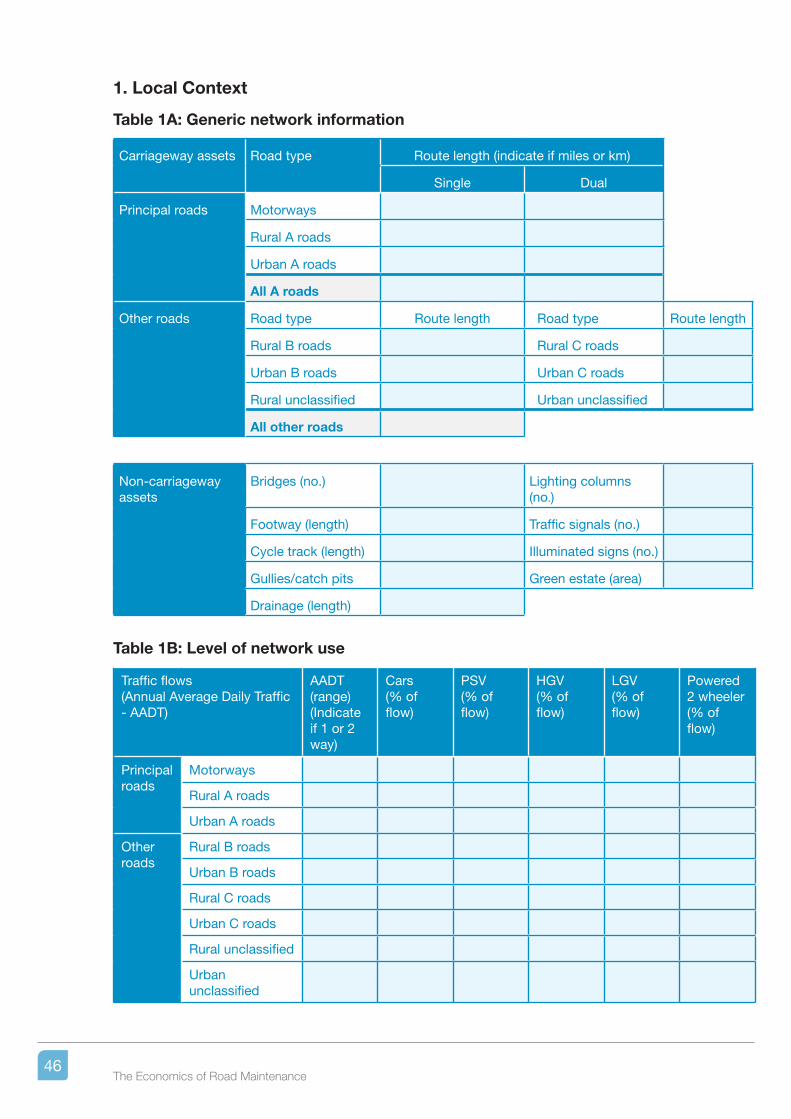
1. Local Context
Table 1A: Generic network information
Carriageway assets Road type Route length (indicate if miles or km)
Single Dual
Principal roads Motorways
Rural A roads
Urban A roads
All A roads
Other roads Road type Route length Road type Route length
Rural B roads Rural C roads
Urban B roads Urban C roads
Rural unclassified Urban unclassified
All other roads
Non-carriageway assets
Bridges (no.) Lighting columns (no.)
Footway (length) Traffic signals (no.)
Cycle track (length) Illuminated signs (no.)
Gullies/catch pits Green estate (area)
Drainage (length)
Table 1B: Level of network use
Traffic flows (Annual Average Daily Traffic - AADT)
AADT (range)(Indicate if 1 or 2 way)
Cars (% of flow)
PSV (% of flow)
HGV (% of flow)
LGV (% of flow)
Powered 2 wheeler (% of flow)
Principal roads
Motorways
Rural A roads
Urban A roads
Other roads
Rural B roads
Urban B roads
Rural C roads
Urban C roads
Rural unclassified
Urban unclassified
46The Economics of Road Maintenance
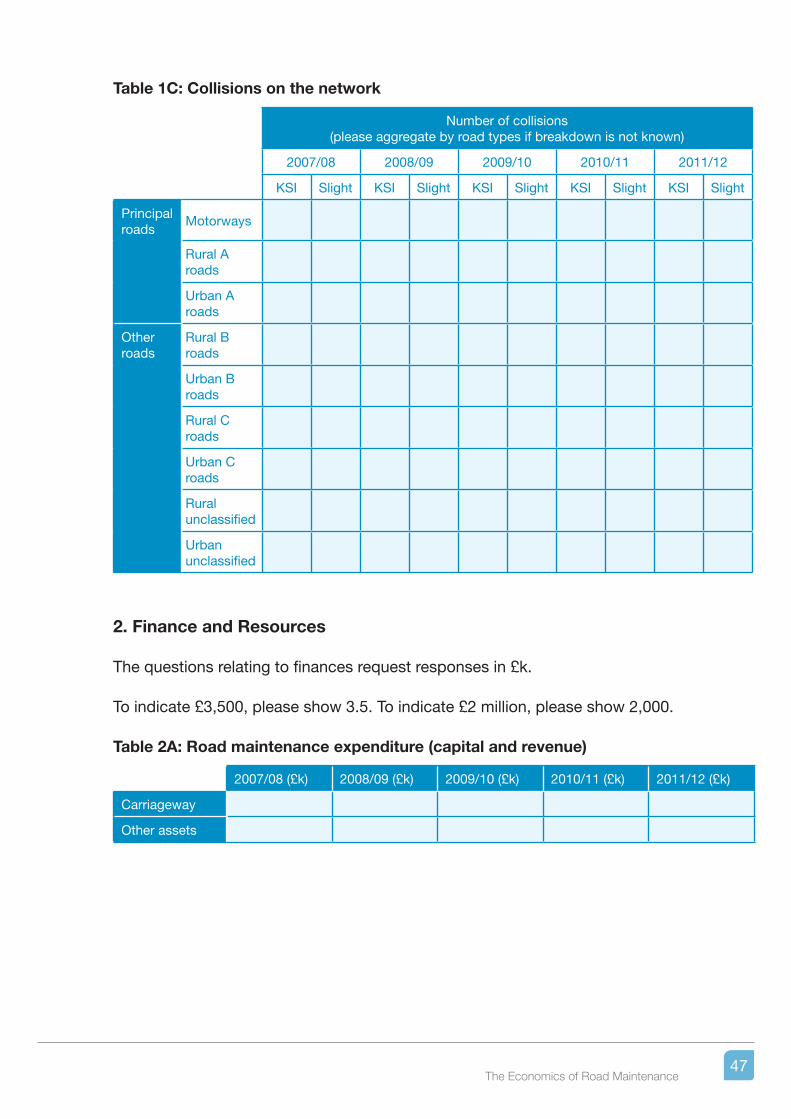
Table 1C: Collisions on the network
Number of collisions(please aggregate by road types if breakdown is not known)
2007/08 2008/09 2009/10 2010/11 2011/12
KSI Slight KSI Slight KSI Slight KSI Slight KSI Slight
Principal roads
Motorways
Rural A roads
Urban A roads
Other roads
Rural B roads
Urban B roads
Rural C roads
Urban C roads
Rural unclassified
Urban unclassified
2. Finance and Resources
The questions relating to finances request responses in £k.
To indicate £3,500, please show 3.5. To indicate £2 million, please show 2,000.
Table 2A: Road maintenance expenditure (capital and revenue)
2007/08 (£k) 2008/09 (£k) 2009/10 (£k) 2010/11 (£k) 2011/12 (£k)
Carriageway
Other assets
47The Economics of Road Maintenance
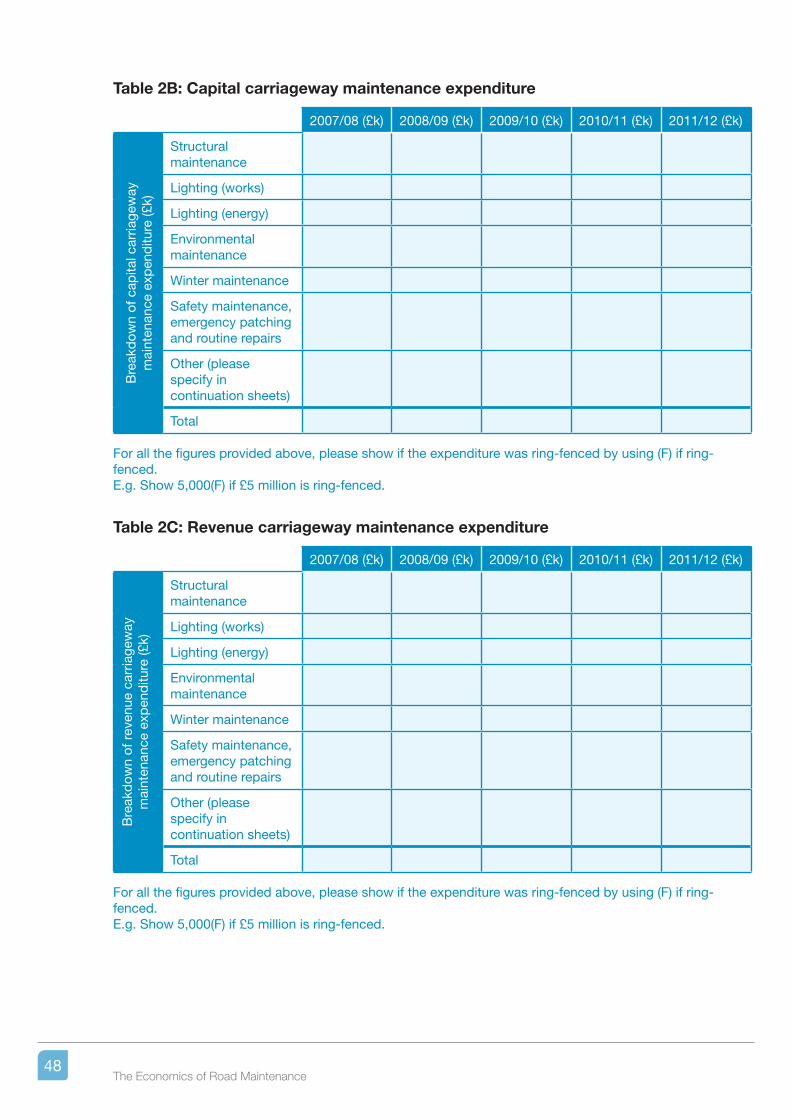
Table 2B: Capital carriageway maintenance expenditure
2007/08 (£k) 2008/09 (£k) 2009/10 (£k) 2010/11 (£k) 2011/12 (£k)B
reak
dow
n of
cap
ital c
arria
gew
ay
mai
nten
ance
exp
end
iture
(£k)
Structural maintenance
Lighting (works)
Lighting (energy)
Environmental maintenance
Winter maintenance
Safety maintenance, emergency patching and routine repairs
Other (please specify in continuation sheets)
Total
For all the figures provided above, please show if the expenditure was ring-fenced by using (F) if ring-fenced. E.g. Show 5,000(F) if £5 million is ring-fenced.
Table 2C: Revenue carriageway maintenance expenditure
2007/08 (£k) 2008/09 (£k) 2009/10 (£k) 2010/11 (£k) 2011/12 (£k)
Bre
akd
own
of r
even
ue c
arria
gew
ay
mai
nten
ance
exp
end
iture
(£k)
Structural maintenance
Lighting (works)
Lighting (energy)
Environmental maintenance
Winter maintenance
Safety maintenance, emergency patching and routine repairs
Other (please specify in continuation sheets)
Total
For all the figures provided above, please show if the expenditure was ring-fenced by using (F) if ring-fenced. E.g. Show 5,000(F) if £5 million is ring-fenced.
48The Economics of Road Maintenance
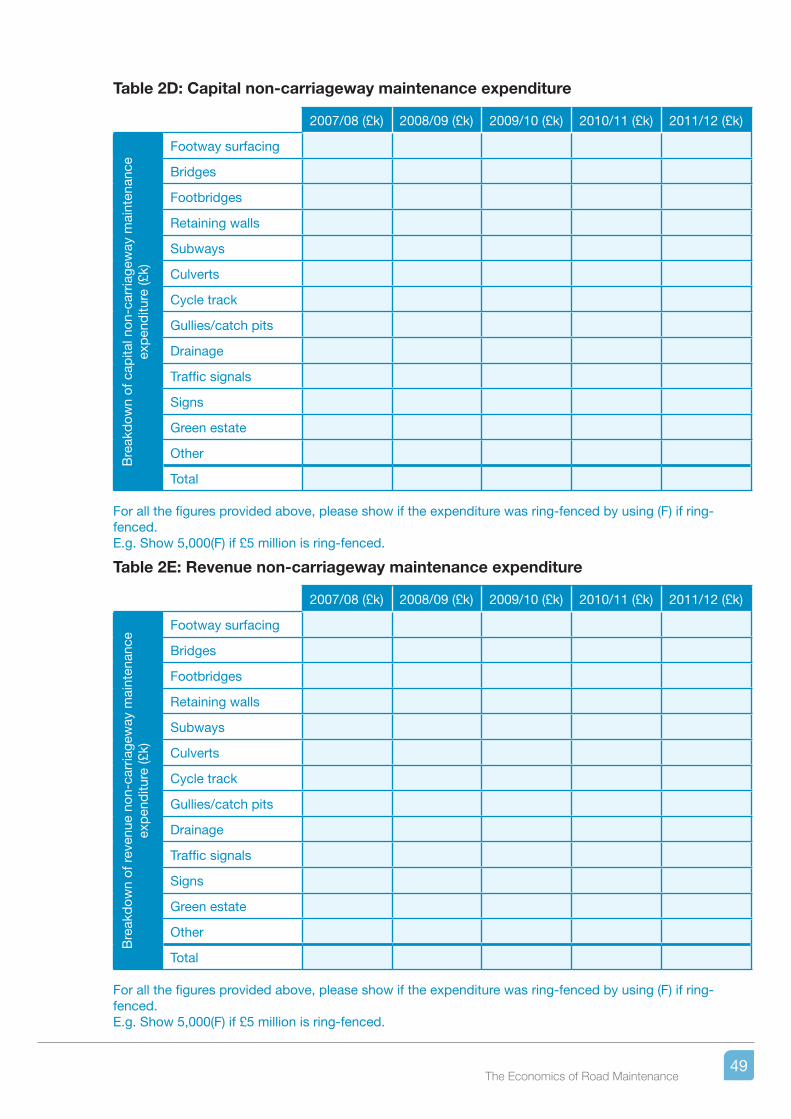
Table 2D: Capital non-carriageway maintenance expenditure
2007/08 (£k) 2008/09 (£k) 2009/10 (£k) 2010/11 (£k) 2011/12 (£k)B
reak
dow
n of
cap
ital n
on-c
arria
gew
ay m
aint
enan
ce
exp
end
iture
(£k)
Footway surfacing
Bridges
Footbridges
Retaining walls
Subways
Culverts
Cycle track
Gullies/catch pits
Drainage
Traffic signals
Signs
Green estate
Other
Total
For all the figures provided above, please show if the expenditure was ring-fenced by using (F) if ring-fenced. E.g. Show 5,000(F) if £5 million is ring-fenced.
Table 2E: Revenue non-carriageway maintenance expenditure
2007/08 (£k) 2008/09 (£k) 2009/10 (£k) 2010/11 (£k) 2011/12 (£k)
Bre
akd
own
of r
even
ue n
on-c
arria
gew
ay m
aint
enan
ce
exp
end
iture
(£k)
Footway surfacing
Bridges
Footbridges
Retaining walls
Subways
Culverts
Cycle track
Gullies/catch pits
Drainage
Traffic signals
Signs
Green estate
Other
Total
For all the figures provided above, please show if the expenditure was ring-fenced by using (F) if ring-fenced. E.g. Show 5,000(F) if £5 million is ring-fenced.
49The Economics of Road Maintenance
Table 2F: Future funding
Future funding (£m)
Please indicate whether you have confirmation of highway maintenance funding beyond this year.
Future highway maintenance funding confirmed
2013/14 2014/15 2015/16 Further ahead
If you do not have confirmation of future highway maintenance funding, do you have indication of whether future budgets are stable or changing? Please provide details below
3. Network Performance
Table 3A: Analyses to predict the impact of budgetary changes on network condition
Analyses to predict the impact of budgetary changes on network condition
Please describe below any analyses undertaken during the last five years to predict the impact of budgetary changes on your network conditions.
Please use the FTP site (details on p.1) for large documents
Table 3B: Analyses undertaken to quantify the impact of roadworks on road users
Analyses undertaken to quantify the impact of roadworks on road usersPlease describe below any analyses undertaken during the last five years to quantify the impact of roadworks on road users.
Please use the FTP site (details on p.1) for large documents
Table 3C: Pavement treatment lives (carriageway)
Principal roads Classified roads Unclassified roads
Urban Rural Urban Rural Urban Rural
Surface treatment (years)
Resurfacing (years)
Strengthening (years)
50The Economics of Road Maintenance
Table 3D: Pavement treatment lives (footway)
Material type
Life (yrs)
Material type
Life (yrs)
Material type
Life (yrs)
Primary walking route (Category 1)
Secondary walking route (Category 2)
Link footway (Category 3)
All other footways (metalled) (Category 4)
4. Users
Table 4A: User complaints
User complaints
Please breakdown the number of user complaints received in relation to asset types. Further rows can be added to define other asset types.
Please provide the total number of a detailed breakdown is not available.
Number of complaints
2007/08 2008/09 2009/10 2010/11 2011/12
Carriageway
Footway
Asset type _____ (define)
Asset type _____ (define)
TOTAL
Please also describe below any analyses undertaken with regards to user complaints over the last five years. We are interested in data recorded by asset type, and any trends over time.Please use the FTP site (details on p.1) for large documents
51The Economics of Road Maintenance
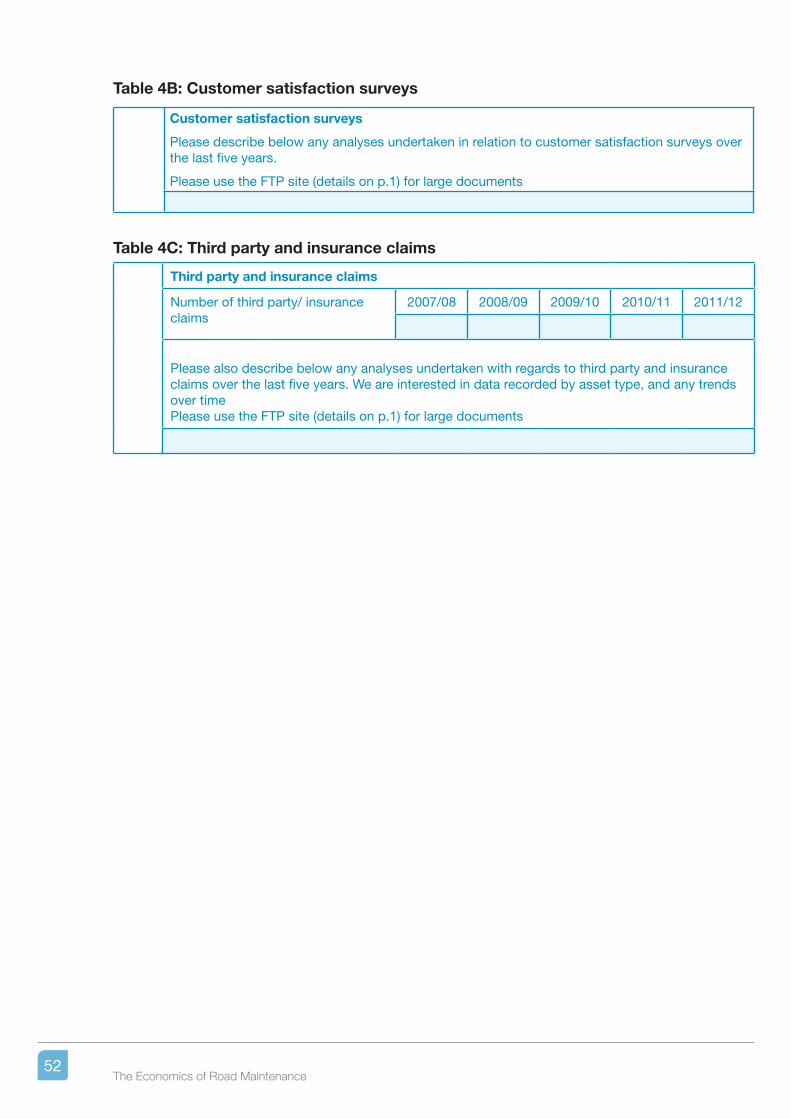
Table 4B: Customer satisfaction surveys
Customer satisfaction surveys
Please describe below any analyses undertaken in relation to customer satisfaction surveys over the last five years.
Please use the FTP site (details on p.1) for large documents
Table 4C: Third party and insurance claims
Third party and insurance claims
Number of third party/ insurance claims
2007/08 2008/09 2009/10 2010/11 2011/12
Please also describe below any analyses undertaken with regards to third party and insurance claims over the last five years. We are interested in data recorded by asset type, and any trends over timePlease use the FTP site (details on p.1) for large documents
52The Economics of Road Maintenance
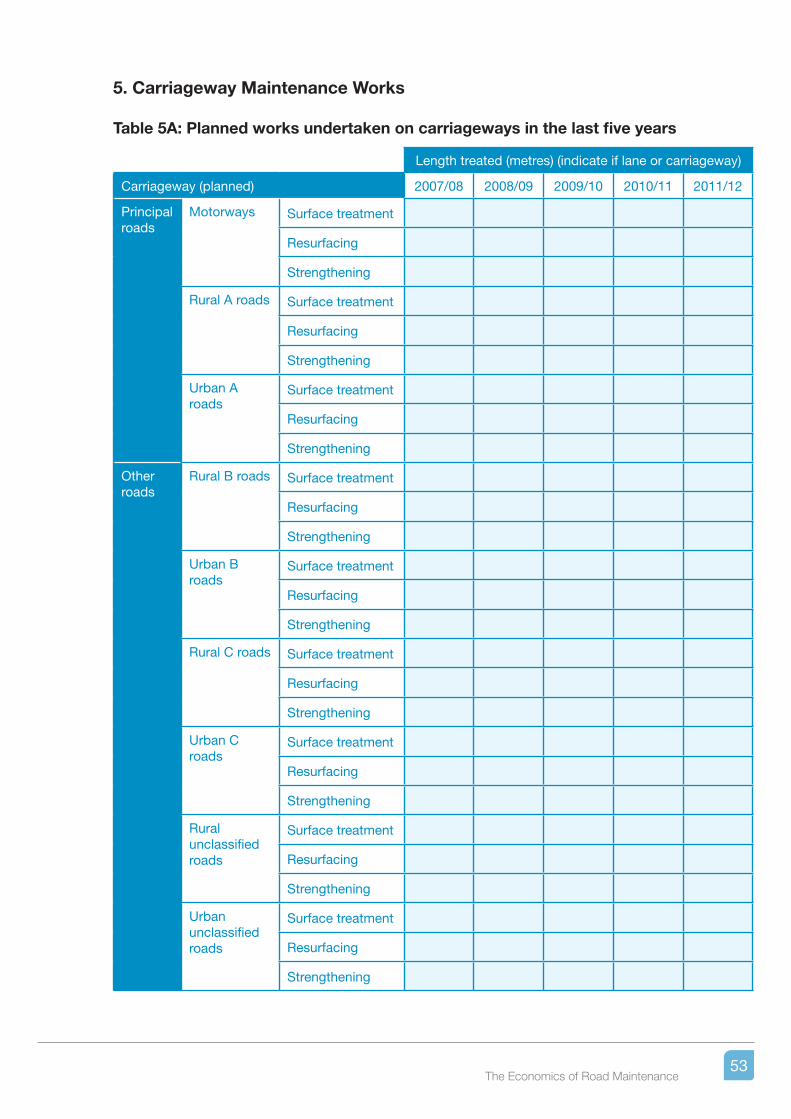
5. Carriageway Maintenance Works
Table 5A: Planned works undertaken on carriageways in the last five years
Length treated (metres) (indicate if lane or carriageway)
Carriageway (planned) 2007/08 2008/09 2009/10 2010/11 2011/12
Principal roads
Motorways Surface treatment
Resurfacing
Strengthening
Rural A roads Surface treatment
Resurfacing
Strengthening
Urban A roads
Surface treatment
Resurfacing
Strengthening
Other roads
Rural B roads Surface treatment
Resurfacing
Strengthening
Urban B roads
Surface treatment
Resurfacing
Strengthening
Rural C roads Surface treatment
Resurfacing
Strengthening
Urban C roads
Surface treatment
Resurfacing
Strengthening
Rural unclassified roads
Surface treatment
Resurfacing
Strengthening
Urban unclassified roads
Surface treatment
Resurfacing
Strengthening
53The Economics of Road Maintenance
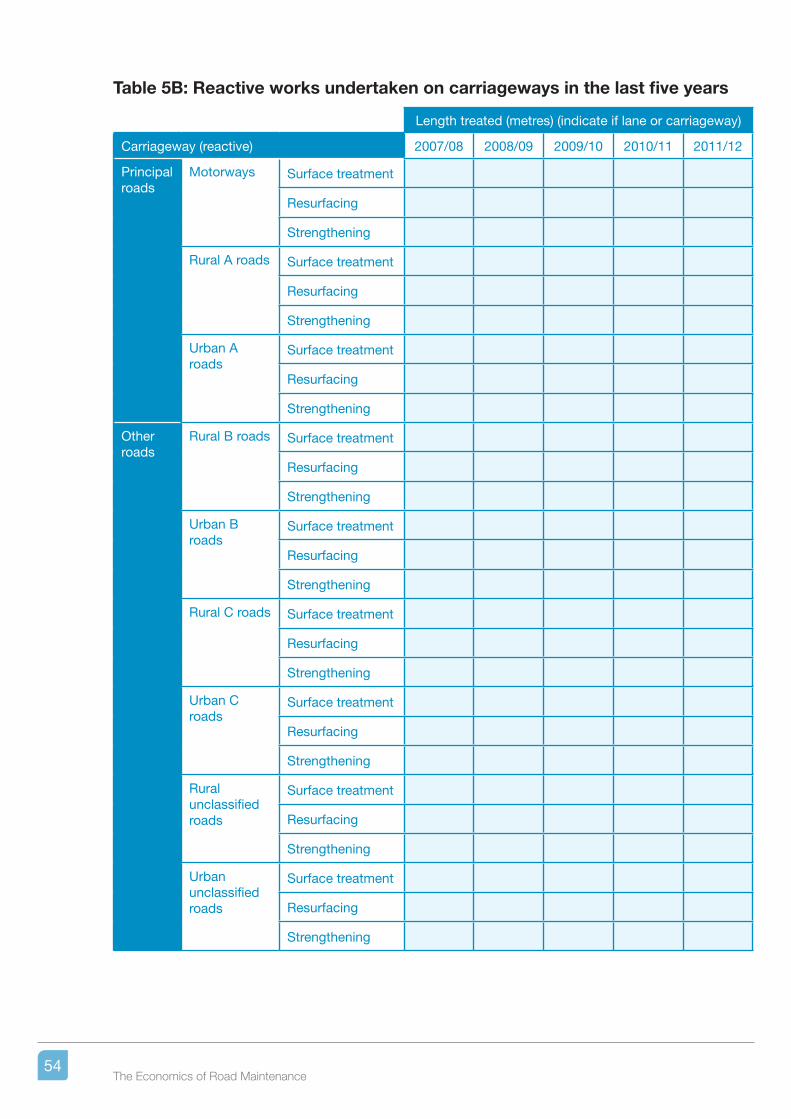
Table 5B: Reactive works undertaken on carriageways in the last five years
Length treated (metres) (indicate if lane or carriageway)
Carriageway (reactive) 2007/08 2008/09 2009/10 2010/11 2011/12
Principal roads
Motorways Surface treatment
Resurfacing
Strengthening
Rural A roads Surface treatment
Resurfacing
Strengthening
Urban A roads
Surface treatment
Resurfacing
Strengthening
Other roads
Rural B roads Surface treatment
Resurfacing
Strengthening
Urban B roads
Surface treatment
Resurfacing
Strengthening
Rural C roads Surface treatment
Resurfacing
Strengthening
Urban C roads
Surface treatment
Resurfacing
Strengthening
Rural unclassified roads
Surface treatment
Resurfacing
Strengthening
Urban unclassified roads
Surface treatment
Resurfacing
Strengthening
54The Economics of Road Maintenance
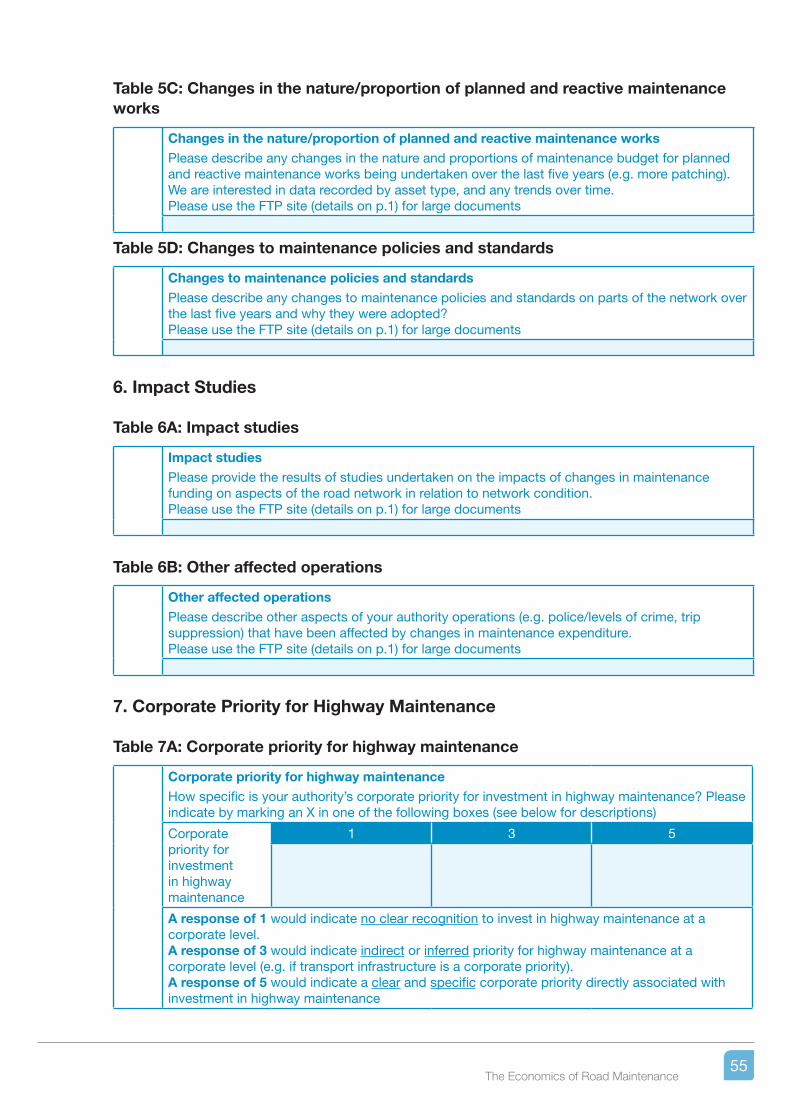
Table 5C: Changes in the nature/proportion of planned and reactive maintenance works
Changes in the nature/proportion of planned and reactive maintenance worksPlease describe any changes in the nature and proportions of maintenance budget for planned and reactive maintenance works being undertaken over the last five years (e.g. more patching). We are interested in data recorded by asset type, and any trends over time.Please use the FTP site (details on p.1) for large documents
Table 5D: Changes to maintenance policies and standards
Changes to maintenance policies and standardsPlease describe any changes to maintenance policies and standards on parts of the network over the last five years and why they were adopted? Please use the FTP site (details on p.1) for large documents
6. Impact Studies
Table 6A: Impact studies
Impact studiesPlease provide the results of studies undertaken on the impacts of changes in maintenance funding on aspects of the road network in relation to network condition. Please use the FTP site (details on p.1) for large documents
Table 6B: Other affected operations
Other affected operationsPlease describe other aspects of your authority operations (e.g. police/levels of crime, trip suppression) that have been affected by changes in maintenance expenditure. Please use the FTP site (details on p.1) for large documents
7. Corporate Priority for Highway Maintenance
Table 7A: Corporate priority for highway maintenance
Corporate priority for highway maintenanceHow specific is your authority’s corporate priority for investment in highway maintenance? Please indicate by marking an X in one of the following boxes (see below for descriptions)
Corporate priority for investment in highway maintenance
1 3 5
A response of 1 would indicate no clear recognition to invest in highway maintenance at a corporate level. A response of 3 would indicate indirect or inferred priority for highway maintenance at a corporate level (e.g. if transport infrastructure is a corporate priority).A response of 5 would indicate a clear and specific corporate priority directly associated with investment in highway maintenance
55The Economics of Road Maintenance

Continuation sheet
Q Comment
56The Economics of Road Maintenance
The Royal Automobile Club Foundation for Motoring is a transport policy and research organisation which explores the economic, mobility, safety and environmental issues relating to roads and their users. The Foundation publishes independent and authoritative research with which it promotes informed debate and advocates policy in the interest of the responsible motorist.
RAC Foundation 89–91 Pall Mall London SW1Y 5HS
Tel no: 020 7747 3445 www.racfoundation.org
Registered Charity No. 1002705 June 2013 © Copyright Royal Automobile Club Foundation for Motoring Limited
Designed and printed by The Javelin Partnership Ltd Tel: 0118 907 3494
Produced on paper from a managed sustainable source which is FSC certified as containing 50% recycled waste.
The Association of Directors of Environment, Economy, Planning & Transport (ADEPT) is a professional association representing local authority Strategic Directors who manage some of the most pressing issues facing the UK today. ADEPT membership is drawn from across the United Kingdom and the Association’s ‘Prospectus for Growth’ recognises investment in the existing highway network as being a critical component in delivering sustainable growth, both locally and nationally.