Embed Size (px)
Citation preview

The Educational Policy Institute’s
Institutional Student Retention Assessment
Program Manual
ISRAISRA
www.isra-online.com��� ��������������������������

��� ������������� ��������
The Institutional Student Retention Assessment (ISRA) was developed by the Educational Policy Institute with a generous grant from Lumina Foundation for Education. The EPI team was led by Dr. Watson Scott Swail, Ms. Patricia Moore Shaffer, Mr. Alex Usher.
ISRA Advisory Panel
Dr. John B. Lee, President, JBL Associates
Dr. Patrick Terenzini, Professor, Pennsylvania State University
Dr. Alberto Cabrera, Professor, University of Maryland, College Park
Dr. Rick Voorhees, President, Voorhees Consulting
Dr. Martin Carroll, Audit Director, Australian Universities Quality Agency
Dr. Derek Price, Consultant, DVP‐Praxis
Dr. Peter Dietsche, Vice President, Mohawk College
Dr. John Villamil‐Casanova, Executive Vice President, ASPIRA, Inc.
The Educational Policy Institute (EPI) is an international, non‐profit association of researchers and policy analysts focused on studying the academic preparation for, access to, and success through postsecondary education. Because of the increasingly competitive international economic environment, EPI is also committed to research which measures and improves the quality of education these students receive. For more information about EPI, please visit www.educationalpolicy.org.

Educational Policy Institute Institutional Student Retention Assessment
Introduction 1
Table of Contents Table of Contents ...................................................................................................................................... 1
Part I: Introduction .............................................................................................................................. 2
Welcome to the Institutional Student Retention Assessment ................................................................. 3
Getting Started .......................................................................................................................................... 5
Question & Answer ................................................................................................................................... 7
An Essay on Student Retention ............................................................................................................... 16
Part II: The Institutional Student Retention Assessment (ISRA) .......................................................... 35
Section I: Institutional Context ............................................................................................................... I‐1
Section II: Recruitment & Admissions .................................................................................................... II‐1
Section III: Financial Aid ........................................................................................................................ III‐1
Section IV: Student Services ................................................................................................................. IV‐1
Section V: Academic Services ................................................................................................................ V‐1
Section VI: Teaching & Learning .......................................................................................................... VI‐1

Educational Policy Institute Institutional Student Retention Assessment
Part II: The Institutional Student Retention Assessment 2
Part I: Introduction

Educational Policy Institute Institutional Student Retention Assessment
Part II: The Institutional Student Retention Assessment 3
Welcome to the Institutional Student Retention Assessment Congratulations for making it this far! If you’ve opened up this instruction book, you are on the road to improving student retention and success at your institution. We hope this assessment will help your institution deal with the complexities of student retention in your department, on your campus, or across the system. The ISRA is a special tool to help coordinate retention planning as it pertains to student‐centered initiatives. The information that follows should answer your questions about the ISRA and how it can help your institution.
According to Swail (2003), there are four phases of retention programming at the postsecondary level. Phase I is the pre‐planning stage, involving the collection of information about the campus. Phase II, planning, is the preparation of a plan to administer on campus. Phase III is the implementation of that plan, and Phase IV involves the monitoring of the impact of changes on campus. The ISRA is an important tool for Phase I, the pre‐planning phase. At this stage, institutions must audit their institution to determine what the specific challenges are regarding student retention, persistence, and success. Similarly, the institution must identify the practices and strategies currently in use and determine their level of effectiveness. And finally, the institution must also identify the structures and resources available to make change happen.
With these issues in mind, we developed the ISRA to help guide institution through this complex process. We firmly believe that most institutions do most of the right things to engage students and create a successful climate on campus (even if that campus is virtual). Where institutions fall short is in the following areas: first, they don’t always know what they are doing for students. Because the campus is a large organism, we are not always cognizant of the many strategies in use at any particular time, and this is problematic when trying to improve the institution. Second, we often don’t know how successful these strategies are in practice. They all make sense in theory, but do they work for your students? Third, do these strategies get to the students that need the support? Just because the institution “does it,” certainly does not mean that students with the greatest need “get it.”

Educational Policy Institute Institutional Student Retention Assessment
Part II: The Institutional Student Retention Assessment 4
To clarify, institutions must identify the challenges, document the current solutions, measure their effectiveness, and then devise plans for improving the entire system. There are other considerations for the second phase – planning, where institutions must determine the resources available to make change, but that’s for phase II, and our focus in the ISRA is Phase I – pre planning.
We hope you find the ISRA a useful tool for your institution. The ISRA took three years to develop by the Educational Policy Institute with support by Lumina Foundation for Education. We are dedicated to improving the ISRA over time, so that it does not remain a static program, but rather, an evolving instrument with evolving features for institutions. Just as institutions of higher education change, so must our strategies and tools for keeping current, responsive, and meaningful.
Please feel free to contact us at [email protected] or (757) 271‐6380 if you have any questions or comments.
Educational Policy Institute Institutional Student Retention Assessment
Part II: The Institutional Student Retention Assessment 5
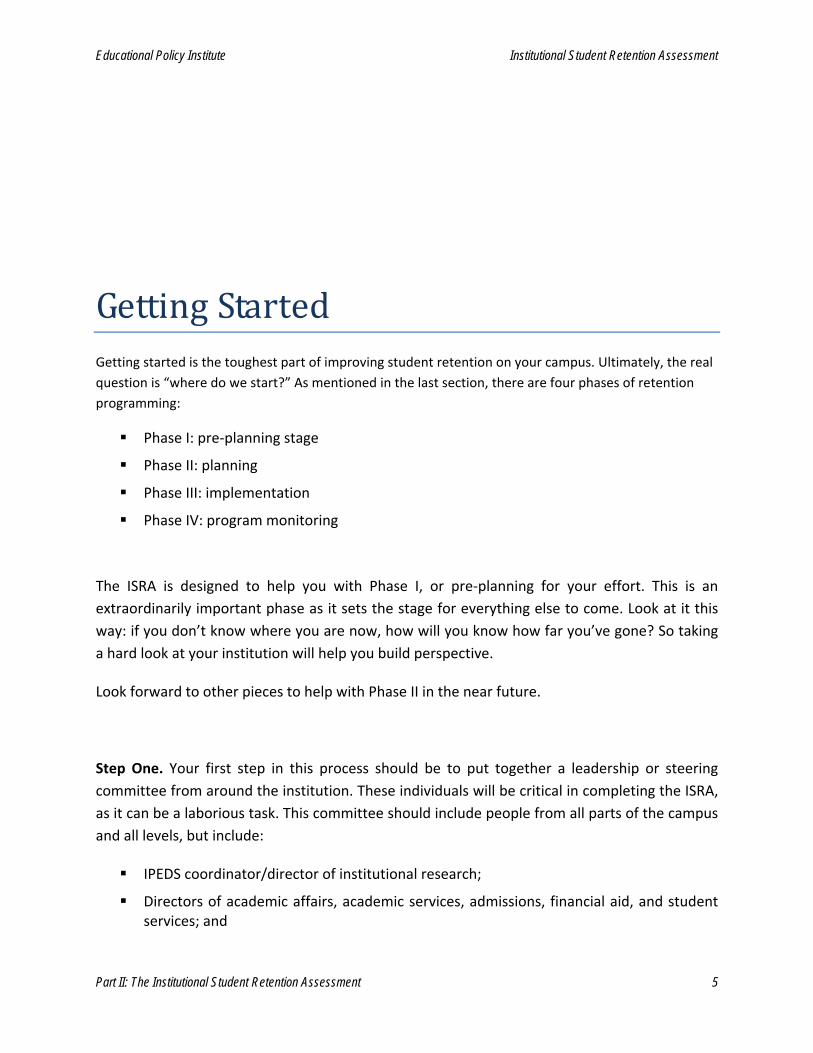
Getting Started Getting started is the toughest part of improving student retention on your campus. Ultimately, the real question is “where do we start?” As mentioned in the last section, there are four phases of retention programming:
Phase I: pre‐planning stage
Phase II: planning
Phase III: implementation
Phase IV: program monitoring
The ISRA is designed to help you with Phase I, or pre‐planning for your effort. This is an extraordinarily important phase as it sets the stage for everything else to come. Look at it this way: if you don’t know where you are now, how will you know how far you’ve gone? So taking a hard look at your institution will help you build perspective.
Look forward to other pieces to help with Phase II in the near future.
Step One. Your first step in this process should be to put together a leadership or steering committee from around the institution. These individuals will be critical in completing the ISRA, as it can be a laborious task. This committee should include people from all parts of the campus and all levels, but include:
IPEDS coordinator/director of institutional research;
Directors of academic affairs, academic services, admissions, financial aid, and student services; and

Educational Policy Institute Institutional Student Retention Assessment
Part II: The Institutional Student Retention Assessment 6
Representatives from campus constituent groups, including students, staff, and faculty.
Step Two. Read some of the background material contained in this manual as well as on our websites (www.educationalpolicy.org & www.studentretention.org). Specifically, we refer you to The Art of Student Retention and Retaining Minority Students in Higher Education.
Step Three. Complete the ISRA Pre‐Test on the website or in paper form. This will give you a quick guide as to where you and your colleagues think the institution is right now.
Step Four. Review the contents of this manual. The entire ISRA is documented in this manual and will give you a complete understanding of the process, questions, and information that must be collected.
Step Five. Make a plan. Decide how you plan to conduct the ISRA, who will lead the project, and how the team will contribute. Decide on a timeline. And Decide at the start what will be done with the final information gathered through the process.

Educational Policy Institute Institutional Student Retention Assessment
Part II: The Institutional Student Retention Assessment 7
Question & Answer What is the Institutional Student Retention Assessment (ISRA)? Developed with the financial support of Lumina Foundation for Education, the Institutional Student Retention Assessment (ISRA) is a web‐based self‐assessment for institutions of higher education. The ISRA is intended to help the institution assess its status with regard to serving students and, ultimately, keeping undergraduate students on course to degree and curbing the dropout dilemma encountered by many of our postsecondary institutions. The ISRA queries campus‐based stakeholders about their current use of resources, retention strategies and programs, institution‐wide characteristics, and policies and practices in the following areas:
Institutional Context
Recruitment & Admissions
Financial Aid
Student Services
Academic Services
Teaching & Learning
By entering this information into a web‐based system, stakeholders will participate in a process which produces a report illustrating their institution through the lens of student retention. An institution committed to student success can facilitate its mission by employing the ISRA as part of a wider effort to identify its particular strengths and weaknesses for purposes of continuous improvement. For this reason, the ISRA contains numerous items that ask an institution to rate its own performance or inventory its own policies and practices as honestly as it can.
The ISRA is based with the US‐system of higher education as a primary target (e.g., two‐year, four‐year, and proprietary institutions), but with a keen eye that the system can be used effectively by institutions in Canada and beyond. Some of the language and nomenclature will be different, but institutions should be able to use the tool effectively.

Educational Policy Institute Institutional Student Retention Assessment
Part II: The Institutional Student Retention Assessment 8
What is the Purpose of Doing the ISRA? Institutions that are truly interested in improving their services to students and, as a result, increasing student retention and persistence, can use the ISRA to guide them through the process of researching, planning, and institutionalizing retention‐focused programming and strategies on campus. The ISRA is not a silver‐bullet, sure‐thing tool to solve the student retention puzzle on campus. Rather, it is a tool that can help guide the institution through the steps necessary to make change on campus. The ISRA is less about content and more about process. If institutional teams are mindful of that statement, they will be much better prepared to get something meaningful out of the experience. While content is certainly important in acknowledging the status of the institution, it is the team building, staging of questions, and acknowledgement of where the institution is and determination of what it wants to be that matters in the end. Thus, a simple forewarning for institutions that can’t get beyond the wording or semantics of the ISRA: don’t start. You’ll simply waste your time and that of participating faculty and staff.
We acknowledge that the ISRA is not a perfect inventory. There are surely many things left out or some things that are phrased in a way that does not make perfect sense to a particular institution, department, or individual. The ISRA can’t be all things to all people or institutions. But the ISRA, when taken as intended, can be useful to institutions as a foundation for their internal processes.
In the end, it is our hope that the ISRA will help institutions by forcing them to think, in teams, about what works and what doesn’t at their institution. These pieces of information will then form the platform for moving forward toward the planning phase of the strategic process.
How is ISRA organized? ISRA is composed of six discrete sections: Institutional Context; Recruitment and Admissions; Financial Aid; Student Services; Academic Services; and Curriculum, Teaching, and Learning. With the exception of the Institutional Context section, each section opens with a Strategic Framework section, which poses questions on the mission statement, goals and objectives, policy and practice, and evaluation and assessment for this area. The Strategic Framework section is followed by sections on specific program areas within the larger unit (e.g., Counseling Services within the Student Services section). The program sections include questions on perceived strengths and weaknesses, as well as on specific strategies and practices within that program area.
What is the basis for the key areas of ISRA? The concept for ISRA is based largely on research conducted by Swail, Redd, and Perna (2003). Swail’s geometric model of student persistence and achievement acknowledges that student

Educational Policy Institute Institutional Student Retention Assessment
Part II: The Institutional Student Retention Assessment 9
success depends on the interaction of the student and the institution, and more specifically, how the institution understands and reacts to the cognitive and social attributes of the individual.
Figure 1. Swail’s Geometric Model of Student Persistence and Achievement (Swail, Redd, and Perna, 2003)
The framework was originally developed to better understand what it takes for students of color in STEM areas (science, technology, engineering, and mathematics) to succeed in higher education. Over the course of a decade, the model evolved after understanding that the central tenets of the model could improve success for all students, knowing that students are diverse in a number of ways, and not just by the color of their skin. Thus, the framework has evolved to its current design.
Using these theoretical pieces as a foundation, ISRA was developed to identify key factors on campus that support or detract from student retention. ISRA, in effect, seeks information about institutional support services currently in operation and issues affecting students who seem to fall through the cracks of the system. ISRA builds a model of goals, objectives, and related strategies for institutions and helps determine where the strengths and weaknesses are in the institution’s approach.
A more detailed description of the model and a background on student retention can be found at www.studentretention.org/rtn101_intro.html.

Educational Policy Institute Institutional Student Retention Assessment
Part II: The Institutional Student Retention Assessment 10
Who may participate and at what cost? Any institution that thinks they can benefit from the ISRA can register and use the instrument for free until January 2008. At that time, a licensing fee will be administered to help sustain the evolution of the ISRA.
What type of report is generated by ISRA? There are two general types of reports that can be generated by the ISRA. The first is general report for each of the six sections. This report produces a pdf of all information entered into the ISRA.
A second, summary report can also be produced for each section, summarizing the main components and using an analytical procedure to determine areas that an institution may wish to focus on for institutional improvement.
Who should conduct the assessment? Student success is everybody’s business and is ultimately about change management on campus. Our knowledge of student retention and practices on campus underscore our belief that it takes a campus to make positive change for students. Thus, it is critical to involve representatives from across the campus in planning and implementing student success programming.
An institution can determine its best strategy for completing the ISRA. However, we believe that the ISRA is best conducted through a steering committee formed by the institution’s senior leader, such as the president or his/her designate. This cross‐institutional team may include approximately 6 to 10 individuals representing various offices and academic divisions to complete the assessment on a collaborative basis. While team members will vary from institution to institution, participants may include:
IPEDS coordinator/director of institutional research;
Directors of academic affairs, academic services, admissions, financial aid, and student services; and
Representatives from campus constituent groups, including students, staff, and faculty.
How long will it take to conduct the assessment? The ISRA is designed as a comprehensive planning tool. Once teams review the ISRA for what it is, they will clearly understand that it will require the collection of information and the discussion of topics by various campus departments and groups to effectively answer the questions.

Educational Policy Institute Institutional Student Retention Assessment
Part II: The Institutional Student Retention Assessment 11
We estimate that, if done to completion, the ISRA will take between 1 and 6 months. It is unlikely to take less time, and could take more depending on the level of depth that the institution would like to address. Remember, this is a “process” as much as anything else.
Some institutions may not want to conduct the entire tool, focusing on key sections (e.g., financial aid), or only focusing on key faculties or colleges (e.g., Engineering). That obviously would reduce the time for completion, but institutions must decide what it is they want to accomplish and use the ISRA as necessary to help reach their goals.
How should we prepare our team for this task? Prior to conducting the work of the assessment, team members will benefit from learning more about the realities of, and strategies for, student retention. Direct team members to review the handbook, Retention 101, which is available as a free resource on this website.
We have our team ready. Now what do we do? The ISRA is a planning tool, not a survey instrument. As such, the conduct of the ISRA should be integrated into your institutional planning processes as much as possible. To initiate discussion within your institution, we have suggested a process for conducting the ISRA, but it is imperative to define a process that works within your own institutional context.
Selecting an Assessment Approach Following the convening of your cross‐institutional team, it is recommended that the team review the ISRA introduction and instructions and decide upon which (if not all) sections it would like to complete and in what order. The ISRA is designed as a series of six discrete sections (Institutional Context; Recruitment & Admissions; Financial Aid; Student Services; Academic Services; Curriculum, Teaching & Learning), and sections may be completed in any order. We recommend that your team consider one of the following options:
Single‐Section Assessment: If your institution has addressed the issue of student retention in its strategic planning and has already identified a certain area of interest for further study (e.g. Financial Aid), then select and complete the appropriate section of the assessment only.
Partial Assessment: If your institution has somewhat addressed the issue of student retention in its strategic planning and has already identified a few areas of interest for further study, then select and complete appropriate sections of interest only.
Full Assessment: If your institution has not addressed in its planning the issue of student retention in the last five years, it is recommended that the entire assessment be conducted.

Educational Policy Institute Institutional Student Retention Assessment
Part II: The Institutional Student Retention Assessment 12
Identifying and Collecting Relevant Data It is critical to respond to the assessment in the most informed manner possible. For this reason, the team should identify available sources of evidence for the assessment, including feedback from affected constituencies on campus, such as students, staff, and faculty, which may be in the form of survey data; policies and procedures documents; a copy of the institution’s IPEDS submission; program review data; etc. If such sources are lacking, your team should work with your institution’s IR unit to collect the necessary data. It is recommended that the team commit at least one meeting to reviewing the assessment questions and familiarizing themselves with the data sources relevant to the assessment section being conducted before beginning the assessment process.
Responding to the Assessment Questions It is strongly recommended that you print each assessment section and use it as a discussion agenda with your team prior to entering data and information. Each assessment section begins with global questions concerning the strategic framework (mission, goals and objectives, policy and practice, and assessment and evaluation) of this institutional area. Since the area under consideration (e.g. Student Services) may represent the activities of several departments and/or units on your campus, take the time in your team discussions to consider their shared mission and goals, for example. These strategic framework questions are followed by a list of components of the area under consideration. For instance, the Student Services section includes the following components: Housing and Residential Life; Commuter Student Services; Counseling Services; Campus Activities and Climate; and Health. Each component is assessed using a similar format. Questions concerning the strengths and weaknesses of this component are asked, followed by inventory worksheets of best practices for this component.
The inventory worksheets employ Likert scales and ask team members to rate the degree of implementation of selected best practices on their campus. It is critical that responses to these worksheets are based on empirical or institutional evidence and not solely on the subjective opinions of team members. It is also important that the entire team discuss and agree upon responses to these worksheets, even if an individual team member has been charged with the responsibility of initially responding to the question, to ensure as bias‐free a process as is possible. The worksheets also ask for narrative descriptions of the institution’s practice, evidence to support the rating of implementation, and a rating of how this practice contributes to student success. The team will also consider if this institutional practice requires improvement and, if yes, what could be done to improve its effectiveness. This narrative information will assist the team in prioritizing the strengths and weaknesses of this component in the final step of the section assessment process.

Educational Policy Institute Institutional Student Retention Assessment
Part II: The Institutional Student Retention Assessment 13
Prioritizing Institutional Needs After the team has completed a section, a summary report of the section assessment will be provided. This report will include all the narrative responses to questions as well as responses to rating questions. Responses to rating questions will also be averaged so that team members can see the average rating of a program component and for the entire section at a glance. Based on this report, team members can now complete the final step in the section assessment, which is to review the report and determine the major strengths, weaknesses, and opportunities for improvement (SWO) for each program component and the section as a whole.
Making Student Retention an Institutional Priority Completing the assessment is only the beginning of what should become a process of institutional change. While the exact process is highly dependent upon your institutional context, the team should produce recommendations based on the report for submission to the institution’s senior leadership. One institution consulted for this assessment suggested that, following the preparation of recommendations, the provost would ask the team chair to conduct a series of presentations to various campus constituencies, including academic deans, the student government, etc., in order to build campus‐wide support for this focus on student retention. Each institution must find their own unique approach to using the report findings to facilitate institutional change.
How do we save data in ISRA? When you first access ISRA, you will be asked to create a login name and password and to enter some basic information about your institution. This procedure establishes your institutional file in ISRA. When you log out of ISRA, the data you have entered will be saved in your institutional file. It is difficult to respond to some best practices statements. For example, look at the statement, “We provide useful financial literacy classes and counseling of sufficient quality to engage and enlighten students in these areas” in the Financial Aid section. Yes, we provide financial literacy classes, but we don’t believe the classes are “of sufficient quality to engage and enlighten students.” We do not, however, offer financial literacy counseling. How would we score this statement when we must answer both “yes” and “no?”
How Do We Use the Rating System? Many of the best practices listed in ISRA contain multiple conditions for success. In the case provided, it is not necessarily a “best practice” to offer financial literacy classes and counseling. It is a best practice to offer useful classes and counseling of sufficient quality to engage and enlighten students in these areas. It is challenging to respond to these statements that list multiple conditions for success. The point of rating this statement and responding to the

Educational Policy Institute Institutional Student Retention Assessment
Part II: The Institutional Student Retention Assessment 14
supplementary questions is to consider the conditions necessary for success, and compare this best practice to what is currently in place on your campus. If your current practice meets all conditions for success, the rating should be “5.” If your current practice meets some, but not all, of the conditions for success, a rating of “3” might be more appropriate, etc.
Most importantly, do not let team discussions get stalled over issues of semantics. The ISRA was not designed as a survey instrument. It was designed to lead an institutional team through a reflective process of examining current policies and practices and comparing these current practices to research‐based best practices in student retention with the end result of producing a plan for improving student retention on your campus. The written responses to the ISRA are not as important as the process of responding to ISRA questions.
Should we encounter problems, is there technical support provided for ISRA? The Educational Policy Institute provides technical support for ISRA. To request technical support, use the Contact function in the ISRA, email [email protected], or call 757‐271‐6380.
After completing an ISRA section, our team agreed that there was not enough emphasis on a certain best practice area. Is this type of feedback welcome? Feedback is absolutely welcomed and strongly encouraged. It is fully anticipated that ISRA will change and evolve over time as more scholarly research is conducted on student retention and success. Responses from practitioners are also critical to shaping the continued development of this tool. ISRA users are encouraged to provide feedback through the Contact form provided on the website. Also, if your institution believes that it employs a best practice in student retention on its campus, please submit information on this practice to our Effective Practices database. Submission information is provided on the ISRA website.
Who is the Educational Policy Institute? Founded in 2002, Educational Policy Institute (EPI) is an international, non‐profit association of researchers and policy analysts focused on studying the academic preparation for, access to, and success through postsecondary education. Because of the increasingly competitive international economic environment, EPI is also committed to research which measures and improves the quality of education these students receive.
As part of its mission, EPI operates studentretention.org, a research‐based center designed to study issues and disseminate information to college administrators, faculty, and other stakeholders regarding student retention and persistence. In addition to ISRA,

Educational Policy Institute Institutional Student Retention Assessment
Part II: The Institutional Student Retention Assessment 15
studentretention.org includes a number of useful services to the postsecondary community, including the development of a peer‐reviewed, web‐based “EFFECTIVE PRACTICES” database, a regular newsletter (Student Success) that updates subscribers on retention issues and resources, an annual survey of campus professionals, the Annual Student Retention Awards program, regional and national workshops and conferences on student retention, research projects, and research‐based services. Taken together, these programs and services provide administrators and practitioners with useful, hands‐on information to help them improve student retention and persistence on their campuses.
For more information about EPI, please visit www.educationalpolicy.org or www.studentretention.org.

Educational Policy Institute Institutional Student Retention Assessment
Part II: The Institutional Student Retention Assessment 16
An Essay on Student Retention Watson Scott Swail, Ed.D.
This three‐part series on student retention was previously published in the Educational Policy Institute’s Student Success newsletter in 2006.
Part I. Barriers to Student Retention and Success on College Campuses By Watson Scott Swail, Ed.D.
The discussion of why students leave campus takes us back to some theoretical underpinnings initially discussed by Spady (1970), Tinto (1975), and others. These researchers connected dropout with Durkheim’s theory of suicide, stating that when individuals are separated from the social fabric of society, they withdraw, and at worst, decide to sever the relationship completely. This theory is now used as the cornerstone of why students leave higher education and why we focus so much on the “social integration” of students on campus. Without this soft‐touch social connection, students become isolated and begin to withdraw from campus. This is, in one respect, academic suicide.
In the 1980s, then‐University of California‐Berkeley researcher Uri Treisman (who was named “Scientist of the Year” by the Harvard Foundation on February 6, 2006) conducted a study to look at the differences of academic study habits of Asian and Black students. Treisman found that the Asian students were likely to study and socialize together. In effect, they formed their own social microcosm on the campus of an institution that was largely white and largely American. Conversely, Black students were “loners,” often studying alone and less likely to “integrate” themselves into a subgroup or into the institution. The Asians prospered; the Blacks

Educational Policy Institute Institutional Student Retention Assessment
Part II: The Institutional Student Retention Assessment 17
suffered. The findings from Treisman’s study formed the basis for the Emerging Scholars Program (ESP), a program which provides students with an integrated supplementary program for learning. ESP is used on campuses across the United States.
Treisman’s work was truly important because it showed all that social systems on campus are uniquely and unequivocally connected to the academic progress and success of students. The two are inextricably connected, and campus officials must concern themselves with that reality. In my work, I’ve identified five areas that campuses should concern themselves with in the effort to support students. Each area is as important as the other, and often the dearth of resources in one area can undermine all progress. Thus, administrators must ensure that there is support across campus in these areas in order to support students.
1. Social and Academic Integration. As discussed above, the process of becoming socially integrated into the fabric of the university has also been found to be both a cumulative and compounding process, and the level of social integration within a given year of study is part of a cumulative experience that continues to build throughout one’s college experience. The establishment of peer relations and the development of role models and mentors have been defined in the literature as important factors in student integration, both academically and socially.
2. Academic Preparedness. Academic integration and preparation are primary features of many models of retention. Research shows that between 30 and 40 percent of all entering freshman are unprepared for college‐level reading and writing and approximately 44 per‐cent of all college students who complete a 2‐ or 4‐year degree had enrolled in at least one remedial/developmental course in math, writing, or reading.
3. Campus Climate. While researchers agree that “institutional “fit” and campus integration are important to retaining college students to degree completion, campus climate mediates undergraduates’ academic and social experiences in college. Minority and low‐income students inadequately prepared for non‐academic challenges can experience culture shock. Lack of diversity, with regard to income and race/ethnicity, in the student population, faculty, staff, and curriculum often restrict the nature and quality of minority students’ interactions within and out of the classroom, threatening their academic performance and social experiences.
4. Commitment to Educational Goals and the Institution. Tinto (1993) hypothesized that commitment to occupational and educational goals and commitment to the institution in which one enrolls significantly influence college performance and persistence. The stronger the goal and institutional commitment the more likely the student will graduate. Research shows that congruence between student goals and institutional mission is mediated by academic and social

Educational Policy Institute Institutional Student Retention Assessment
Part II: The Institutional Student Retention Assessment 18
components, and that increased integration into academic and social campus communities causes greater institutional commitment and student persistence.
5. Financial Aid. Attending college and persisting to degree completion is most often rewarded with higher annual and lifetime earnings. But for many low‐income and minority students, enrollment and persistence decisions are driven by the availability of financial aid. In 1999‐2000, 77 percent of financially dependent students from families with less than $20,000 in family income received some financial aid, with an average award of $6,727. In contrast, 44 percent of those from families with income of $100,000 or more received aid, with an average award of $7,838.
Low‐income and minority students who receive grants generally are more likely to persist than those who receive loans. However, given the rising costs of attending college, it is unlikely that low‐income students will be able to receive bachelor’s degrees without any loan aid. At the same time, the research also suggests that the shifts in aid from grants to loans and from need‐based to merit‐based programs adversely affects both enrollment and persistence for minority students. Reversing these shifts may be needed to increase college access and success for low‐income and minority students.
A Framework for Student Retention The importance of understanding the above discussion is knowing how to pull it together and what it means to the student in its entirety. I employ a simple graphic to illustrate the interaction of the student and the institution through the use of a triangle, where one side represents the cognitive attributes or skills that a student brings with him or her to campus; a second side which represents the student’s social attributes or skills; and a bottom side of the triangle which represents the level of support or, in a negative context, “interference,” that the institution applies to the mix. This framework is discussed in length under Retention 101 section of the studentretention.org website as well in the publication, Retaining Minority Students in Higher Education, under the publications section of EPI’s website (www.educationalpolicy.org).

Educational Policy Institute Institutional Student Retention Assessment
Part II: The Institutional Student Retention Assessment 19
Quickly stated, the cognitive, social, and institutional factors must be in some balance to support student success. When a student is deficient in cognitive skill, other factors must rise to make up for this deficiency. The same goes for social skills, and so on. The important knowledge gain here is that institutions must understand what each student brings with him or her in order to provide the appropriate support to ensure student success. If not, there is no guarantee that the institutional services are providing the right set of support to the right students.
This discussion is somewhat academic. Ultimately, we need to understand what the specific factors that influences a student’s decision to leave higher education. When I conduct workshops for campus officials, I typically ask participants to think back to their college days and what factors supported or detracted from their experience. the purpose here is two‐fold. First, it puts the professional in a situation of a student, hence developing an opportunity for reflection. Second, it provides us with a rich discussion of what matters to students on campus. When we ask about the experiences that negatively impacted persistence and the college experience, we received the following remarks:
Poor Relationships
Bureaucratic Processes
Isolation
Connections
Bias/Prejudice
Sense of Failure
Interaction
Unsupportive Environment

Educational Policy Institute Institutional Student Retention Assessment
Part II: The Institutional Student Retention Assessment 20
The above list is a truncated version of our discussions, but you get the idea. Now compare this list with the “positive” list reported by these professionals:
Positive interaction with a person or activity that boosted self‐confidence. The “light” eventually came on
Quality instructions, relationship with faculty, interactions, feeling of connectedness
Relationships with faculty, advisors, peers
Connecting with some group
Academic growth
Engaged, meaningful connections (personally, with peers or superiors, academically, etc.)
Relationships with key people: instructors, students, administrators (US TOO)
Encouragement
Connecting with other students and/or faculty in and out of the classroom
Interaction with outstanding faculty/staff
Relationships with key people: instructors, students, administrators
Notice that in both lists the issue of academics seems almost secondary, even though college is an academic pursuit. What you should notice is the importance of “connections” between students and their peers or to their instructors. This certainly underscores the “social integration” theory proposed by Spady and Tinto over a quarter century ago. Remember, this isn’t something pulled from research or even from students. It comes from people like you who have experienced these issues first hand and through their students.
As a campus professional, you should be asking what matters on your campus. What is it that your students need to succeed, and what are the major reasons that students leave? Do the items above resonate with you and your staff? What are you doing in these areas? Are your services getting to the students that actually need them? And perhaps most importantly, are your current services effective?
If you are not currently working closely with your institutional research staff, start now. Find out what makes your students tick. Conduct exit interviews, especially of students who leave, and actually use that information for strategic planning. This isn’t a “don’t ask‐‐don’t tell” policy. Ask and tell. Otherwise, opportunities to improve campus services are squashed.

Educational Policy Institute Institutional Student Retention Assessment
Part II: The Institutional Student Retention Assessment 21
Part II: Institutional Strategies Strategies to Increase Student Success Ultimately, we all want solutions. That’s what I find when I speak around the US and Canada on issues related to student retention and institutional change. The educators I meet in the field are generally talented, well‐guided, and dedicated individuals searching for a way to keep students in school. The pressures from governments and institutions are pushing professionals to expand their knowledge about barriers, as discussed in Part I, and solutions, the topic of this discussion.
In Search of the “Simple Answer” In some cases, I feel that many campus professionals are looking for the Holy Grail of student retention—the silver bullet that will solve all their problems. But even these individuals understand that no such chalice exists. Case in point: at our recent Retention Retreat in Tucson, Arizona, this past March (2006), an individual from a Canadian institution asked a very prudent question: “Where can we find a model of how to do this?,” he asked, referring to designing a framework for student retention for their campus. Before anyone jumps to the conclusion that this is a naïve question, it is ultimately the most requested question I get from practitioners, and one that would hopefully elicit a simple answer. Unfortunately, no simple answer exists because the process and the machinery—both campus and human—are inherently complex devices.
In their book, Student Success in College, George Kuh and associates (2005) assert that, in their study of 20 institutions that performed better than expected with regard to student retention, there was no definite pattern in how institutions succeeded. For their institutions, “a unique combination of external and internal factors worked together to crystallize and support an institution‐wide focus on student success. No blueprint exists to reproduce what they do, or how, in another setting” (Kuh, Kinzie, Schuh, Whitt, & Associates, 2005, p. 21). While this may be a stake to the heart for many readers, Kuh et al. think differently. “The absence of such a blueprint and the fact that many roads lead to student success are, in fact, good news for those who desire to enhance student learning and engagement at their own institutions” (p. 21).
Of the thousands of institutions in the US and Canada that serve students, I can guarantee that every one of those institutions is doing something right that positively impacts student performance and retention. This might be as simple as hiring the right professor who engages students or as complex as a redesign of their freshman curricula to match teaching pedagogy to learning styles. But everyone does something right. Conversely, those very same institutions

Educational Policy Institute Institutional Student Retention Assessment
Part II: The Institutional Student Retention Assessment 22
ultimately do something uniquely wrong for students and, in many cases, I surmise they don’t even know about it. For example, an institution may not provide adequate psychological counseling, or may not offer career development in concert with academic planning. Do you know what your students need and can you provide it?
For those who have heard me speak before, you may remember me making this point: all of us do some of the right things; what we don’t do well is getting the right things to the right students. Institutions can provide all the resources and assistance they can muster, but if they don’t identify and serve the students with the greatest need, institutions are left with simple warm and fuzzy notions that they are doing the right thing. They aren’t. Remember this: students who have issues, either socially or academically, aren’t those who typically knock on doors for help. These students have troubles in part because they don’t always seek out the help they need. In contrast, students who excel academically and have better social/psychological skills are more likely to seek out support to give them further advantage. Thus, advantage continues to beget advantage.
For institutions, this is an important point. Practitioners must work hard and diligently to ensure that (a) the appropriate services are in place; and (b) the institution intrusively identifies and serves students that are in need of these services.
With regard to the former, institutions must conduct an audit of what they offer and whom they need to serve. This was discussed in our January Student Success article, “Seven Guiding Questions for Student Retention.” Institutions must reflect on what they currently offer and decide whether these programs and strategies fit the bill. Second, they must find what their student body needs in terms of academic and social support, especially for students who have the profiles of school leavers. The third step is to then match what the institution offers with student needs and see what fits and what doesn’t. That’s when identifying new possibilities enter the process.
Strategies for Improvement When I work with postsecondary professionals, typically student affairs personnel and faculty, I often ask them to conduct a simple assignment: “List the most positive and negative experiences of your undergraduate experience?” The following table illustrates examples of things that participants have said in the past meetings. Take a moment to review the table.
In reading the list, do you relate to any of the statements, either as an undergraduate student or those whom you work with now? My bet is the table largely hits home. What is uniquely interesting in both the positive and negative experiences is that almost all of the comments

Educational Policy Institute Institutional Student Retention Assessment
Part II: The Institutional Student Retention Assessment 23
regard the “social” or personal side of higher education. Yes, people remember either positively or negatively the academic portion of their education, but when asked for a historical perspective, ex‐students focus on the community, the atmosphere, the social experience of going to college. Again, none of this is to say that the academic isn’t important. That’s why we go to college. And students do look for “academic growth.” But the social experience is often the deciding factor in whether a student stays or leaves, succeeds or fails. See how often the table refers to “connections,” “isolation,” and “relationships.”
Part I introduced the geometric framework for student retention. In short, the framework provides a visual to understand the interaction of students (through their cognitive and social attributes) and institutional factors. Student persistence or retention occurs when there is an “equilibrium” in these forces: a balance of all factors—cognitive, social, and institutional. Going back to the table, we need to strongly consider the impact of social circumstances and situations on student behavior. These include student‐faculty interaction, social clubs and get‐togethers, concerts, study groups (combination of academic and social), and so on. Your institution surely does all of this now, to some degree. The big questions looming here are (a) do you do enough to encourage these activities or opportunities, (b) do you do them well, and (c) are you getting those students who desperately need the support involved?

Educational Policy Institute Institutional Student Retention Assessment
Part II: The Institutional Student Retention Assessment 24
Discussing strategies is difficult because it is a huge area to cover. Strategies for what? Student retention? OK, do we want to focus by department, or is this an issue for a certain student population on campus? Do we feel this is an issue related mostly to student services, or is financing a major deterrent to persistence and degree completion?
If you are looking for a more academic description of what institutions can do, I’ll refer you to two sources on our studentretention.org website. The first is the Retention 101 section of our website, available at www.studentretention.org/retention101.html.
Second is my book, Minority Student Retention in Higher Education, also available for free download at www.studentretention.org/publications.html.
In my discussions, I often split items into six areas: recruitment and admissions, student services, academic services, financial aid, curriculum and instruction, and leadership and institutional change. It is difficult to provide much information in a short piece like this, but beyond the references above, let me share with you what people have said in our seminars about what they believe works on campus to increase student retention. Future issues of Student Success will discuss these core areas to a greater degree.
1. Recruitment and Admissions. Typically, the first contact that a student has with a postsecondary institution is in the recruitment and/or admissions office. It is imperative that staff at this stage are adequately trained to deal professionally‐yet‐comfortably with students. Three core areas to consider here are:
Student recruitment/identification. What are you doing to work with students in your feeder schools? Are you providing adequate information? In a timely manner? Are you sending graduates, students, staff, or faculty to schools? Is your staff working in concert with middle and high school counseling staff? Do you conduct joint programs, such as pre‐college academic outreach efforts, with feeder schools?
Admissions processes. We construct admissions processes almost like a science, with the emergence of enrolment management software and techniques. But many students require the hands‐on approach to admissions, allowing multiple approaches for discussion, including email, phone, and face‐to‐face contact. Does your admission process allow for non‐traditional evaluation of students, especially with respect to extracurricular activities and challenging backgrounds? Do you work with the student to determine whether you are the best fit for him or her? And do you provide students with information on transfer policies to and from your institution?

Educational Policy Institute Institutional Student Retention Assessment
Part II: The Institutional Student Retention Assessment 25
Orientation. This is a critical juncture for students. Institutions that carefully plan and make this a positive, meaningful period for students seem to reap the rewards of that preparation. Some institutions blow this off as just another thing to get through; often students think the same thing. But this can be a fun, extraordinary experience when done well. Also, orientation doesn’t only include the “event,” but also other activities before and after that help students acclimate to the intellectual, cultural, and social climate of the institution.
2. Financial Aid. The financial aid office is typically the second place of contact for students. For many, their findings at this stage can necessitate a go/no‐go decision for their education future. Here are areas where institutions can focus:
Training/Counseling. As with recruitment and other service areas, your staff requires appropriate training not only in financial aid content, but in dealing with diverse students and families. This is a very stressful area for families, and professional staff must be able to put students and families at ease and provide them with the essential knowledge required to make informed decisions.
Grants/Scholarships. With a huge push toward merit‐based aid at the institutional level, institutions must strive to ensure that students with financial need get the support they need to persist. Unmet need is a huge issue in student retention, and students shouldn’t be forced to leave because of money.
Loans. A necessary but unwanted form of student support, students must be encouraged to take on a prudent level of loan burden to support their education and career goals. But institutions must consider who they are loading up with loans and who is getting institutional aid in the form of grants. There must be a good balance that offers relative affordability for all students.
Assistantships/Workstudy. Assistantships and work study jobs are excellent opportunities for students to earn money and work in an area that encourages study and learning. Research shows that when students work on or near campus approximately 15 hours a week, there is a positive impact on retention and academic growth.
3. Student Services. Perhaps one of the most important areas on today’s campus, student services must identify students with non‐academic needs and provide sufficient resources to support their academic and social growth.
Campus Climate. Students often leave because they don’t feel comfortable or welcome. While all parts of a campus are responsible for the “climate” of the institution, student services must

Educational Policy Institute Institutional Student Retention Assessment
Part II: The Institutional Student Retention Assessment 26
provide leadership to ensure the right things are happening to create a supportive atmosphere for learning and personal growth.
Accessibility/Transportation. Students, especially those who must commute, must have viable options for transportation to and from the campus. Are there appropriate parking or bus routes? Are classes provided at times convenient to students, rather than convenient to faculty? Are classes provided in consecutive semesters to allow students to finish off their programs without having to wait for a certain class to be offered again?
Housing. On‐campus housing comes in a variety of styles and conditions. Is your housing both affordable and “livable?” Students require housing that is comfortable, affordable, and provides an excellent opportunity for growth and maturation. Are there programs within housing units to assist students both academically and socially? Are these programs effective?
Counseling. Does your institution provide proactive counseling for students who have specific, if not special, needs? More students require psychological and social counseling than ever, and institutions must provide support to allow students to focus on academics. But offering counseling isn’t enough; institutions must seek out those who need it.
4. Academic Services. The classroom is where students are instructed, but it is often outside the classroom where learning occurs. An institution must be prepared to provide adequate support or “safety nets” for students to learn the content.
Academic Advising. Are students given suitable advisements by either faculty or other staff regarding the academic direction and course‐taking patterns needed for degree completion? Are they taking adequate loads correlated to their ability? Advising is a very important part of student retention, and many institutions do a less‐than‐acceptable job.
Supplementary Instruction. Providing extra opportunities to practice content and is important for many students. Many institutions utilize the SI approach (Supplemental Instruction) developed out of the University of Missouri‐Kansas City back in the 1970s, which has been empirically found to have dramatic impact on the academic success of students. But there are many forms of supplementary instruction that institutions can do beyond SI.
Tutoring/Mentoring. Providing tutoring and mentoring is another mode of supplementary instruction. Individual, group, and peer mentoring can be effective methods of increasing the academic prowess of students, but it is, ultimately, labor intensive and costly. Still, there are few strategies that have the impact of direct tutoring to students. Mentoring, by faculty and peers, provides more than the academic content; it illustrates the work ethic and other important aspects of success to students.

Educational Policy Institute Institutional Student Retention Assessment
Part II: The Institutional Student Retention Assessment 27
Research Opportunities. As with work study noted in financial aid, research and experiential opportunities in one’s major academic area help students relate content to the real world, further embedding learning.
Pre‐College Programs. Colleges can support future learning by helping secondary students along the way. Many colleges work with secondary schools through federal (e.g., TRIO and GEAR UP), state, or institutional programs. These not only help students become academically prepared and gain “college knowledge” (e.g., learning about college and what is required), but also help with recruitment.
Bridging Programs. Many students can be successful when the institution provides bridging programs to soften the orientation of the college. Bridging programs occur after high school graduation and before the fall schedule begins, and provide academic support and acculturation to students, affording them the opportunity to “ramp up” to speed for the fall semester. This is a valuable tool when targeted appropriately at students with the greatest need.
5. Curriculum & Instruction. It seems that only a small percentage of institutions take the role of teaching and learning with students with the serious it deserves. Here are some of the areas that institutions must consider:
Curricula Review & Revision. Is your curricula in various disciplines up to date? Are professors and other instructional staff teaching in a parallel manner commensurate with the requirements for the course? It is often found that course curricula differs greatly from instructor to instructor, even in the same course on the same campus. Is this true at your campus or are there standards in place?
Instructional Strategies. Students learn in a variety of ways, and instructional staff should consider this in the development of teaching pedagogy for class. Teaching should utilize a variety of strategies to correlate for learning styles.
Assessment Strategies. Are assessments sufficiently diversified? As with learning styles, students vary in their test‐taking skills. Not all students do well on multiple choice questionnaires.
Faculty Development/Resources. Faculty and staff can’t become better educators and teachers without the support of the institution. Many institutions now house “teacher” or “faculty development” centers to provide resources, such as inservice training, for instructional staff. Does yours?

Educational Policy Institute Institutional Student Retention Assessment
Part II: The Institutional Student Retention Assessment 28
6. Leadership and Commitment. A final area that impacts the five previous areas is the level of commitment and leadership on campus. Institutions without powerful leadership in support of student retention and success rarely succeed. Conversely, those with strong leadership often do.
Committed Leadership. Leadership can show the direction and empower others to work toward shared goals. But to succeed in the retention game the president and other leaders must show that this is a priority for the institution. Is it at your campus?
Committed Faculty/Staff. Faculty and staff see a lot of faces and priorities come and go. They must be convinced that the retention effort is real and that it only succeeds with their buy‐in. Planning committees and leadership must ensure that all stakeholders understand their role in the larger picture.
Clear Expectations and Direction. With leadership must come direction. Does everyone understand what the expectations are and where this effort will lead? If these are unclear, little progress will be made.
Support to Work Toward Goals. Institutional change is a difficult process. Invariably, the theory of change states that risks must be taken and that staff and other stakeholders must be given the opportunity to risk and to fail. If the cost is too high, then these stakeholders will not take the risk. Leadership again needs to show its support for change.
I understand this brief discussion provides only a cursory review of areas for consideration in the aim to increase student retention on campus. As stated, future issues will provide more tangible practices and strategies for consideration. However, in closing, I urge you to look at Exhibit 2 on page 6. This is a simple checklist associated with our discussion. Take this list and, from your viewpoint only, check off the boxes as to your satisfaction level with progress in the associated area with respect to student success and retention. Then have your colleagues do the same exercise and compare notes. If you find agreement in areas where you are all unsatisfied, that seems to be a likely place to start. Use the Exhibit as an effort to stimulate discussion on your campus.
Part III: The BuyIn Challenge Understanding the challenges facing our campuses with respect to student retention is important, as is understanding the strategies we can use to ameliorate problems. But these two important areas, each forming our Part I and Part II discussions, are largely moot if the campus

Educational Policy Institute Institutional Student Retention Assessment
Part II: The Institutional Student Retention Assessment 29
is either unwilling or unable to make the change necessary to promote growth. Ultimately, instituting (or better, institutionalizing) retention policies and practices on campus is about change management. To be done effectively, change involves all departments on campus, all stakeholders (including administration, faculty, staff, students, boards), and much of the resources (human and fiscal) to make change happen.
The Importance of Leadership It is a terrible thing to look over your shoulder when you are trying to lead — and find no one there. ~ Franklin D. Roosevelt
Leadership, from above and below, is essential to making change happen. We have found in our work that campuses that are successful in increasing retention and persistence had involved, visionary leadership: presidents and CEOs who made it clear that retention was an institutional priority and that everyone must work collectively toward those goals. Institutions that were less successful often had leadership that gave lip service to retention.
Take a moment and look at your own experience as a litmus test. Think of all the leaders that you’ve had to deal with during your career. You’ll probably agree that there is a learned expectation of faculty and staff that when a new president enters the picture, the institution tends to “wait it out” to see what happens. Leaders often come in with the expectation of change. In many cases, they were hired for that purpose. But faculty and staff have seen this before, and many figure if they just hold tough for 2‐3 years, the revolving door of leadership will provide them with yet a newer leader with very different ideas and expectations.
That’s why leadership must show commitment—and not just by words—by exhibiting that the retention effort is truly an important concern for the campus. Thus, leadership must move from intangible suggestions toward concrete messages that convince faculty and staff that—at least this time—it’s real.
To move forward we must understand the essence of leadership. There are volumes of books dedicated to leadership. Some good, some not so good. I appreciate the way Peter Drucker, the esteemed economist, looks at leadership: “Management is doing things right; leadership is doing the right things.” We look to leadership to lay out the direction for the organization and provide vision and focus for the effort. This is ultimately what allows for buy‐in by campus stakeholders. If they can see a vision that makes sense to them, one that is parallel to their goals and expectations as individuals and as a collective unit, they will work toward that goal.

Educational Policy Institute Institutional Student Retention Assessment
Part II: The Institutional Student Retention Assessment 30
Antithetically, if the vision and direction do not exist, nor does the desire to follow, bringing us back to FDR’s quote at the start of this section.
As stated, we have found that the greatest success is where we see leadership “lead” with vision. To give you concrete examples, I recall being at an HBCU in Alabama which was having retention challenges. The president established a retention committee and assigned a Director of Student Retention to lead the effort. The Director worked out of the President’s office and reported directly to the President. Don’t tell me that faculty and staff didn’t notice this. They did. Through this strategic decision, the President demonstrated that he meant business, and the staff got it immediately. As a result, retention became a huge issue on this campus, and efforts to improve retention largely succeeded.
In a separate example at another, smaller institution, I met a president who was what I would call a “pull‐your‐bootstraps‐up” leader. I wouldn’t go so far as to say he was an ineffective leader. He had many leadership skills and qualities. But faculty and staff whom I interviewed balked at some of his claims and expectations. Bottom line: if the vision isn’t realistic, people will not follow. In this case, they didn’t.
Beyond the Ivory Tower Leadership is not just about those few individuals who hold formal leadership positions. Leadership must come from all parts of a college or university, all departments, and levels. Campus stakeholders truly buy in to a program when they realize that their voices will be heard. The leadership from the top must listen—and illustrate that they listen—to those who must follow and provide additional leadership. Success will not come from top‐down protocol. But faculty and staff will listen, follow, and assist when the leadership shows that it is willing to let others mold the discussion and direction. As Stephen Covey of the Seven Success Habits series says, “An empowered organization is one in which individuals have the knowledge, skill, desire, and opportunity to personally succeed in a way that leads to collective organizational success.” Campus leadership must let that evolve over time.
Managing Change Part of making change on campus is the process of managing change. Although institutions of higher education are somewhat removed from the economic world where Darwinian theory rules, the current postsecondary culture is moving toward a system where there exists higher levels of accountability, increased knowledge of the product by the client (student), and a need to reflect the needs of society and the global economy in rapid turnover. As Peter Drucker

Educational Policy Institute Institutional Student Retention Assessment
Part II: The Institutional Student Retention Assessment 31
suggests, “every organization must be prepared to abandon everything it does to survive in the future.” Higher education is not immune to this reality.
Students change, economies change, and so do we. It follows that our institutions must evolve to serve an increasingly diverse student body in a rapidly‐changing and competitive world. If we are truly in this business because we believe in the power of higher education, then we must be prepared to make the necessary changes to ensure that our product is of utility to students today and tomorrow. Otherwise, we’re just well‐paid toll‐booth attendants.
But managing change is a difficult task, because change as a process is complex. While change is inevitable, human nature likes things that stay mostly the same, or at least similar. We are creatures of habit, and the things we do on a daily basis, repeated hundreds and hundreds of times, become comfortable, perhaps safe.
Managing change on campus, like in any organization, involves caretaking. It involves ensuring that people are heard, participate in a meaningful way, and feel in some control of their future. Any leadership group or individual that walks in with fire and brimstone is unlikely to get much buy in. Leadership by fear isn’t a progressive leadership strategy.
A change management strategy must invoke an expectation of involvement and opportunity. Change must be about hope, about a future that is better for students and staff. Change must ultimately be about doing the right thing, and leadership must follow that lead.
Total Quality Management Management guru and statistician W. Edwards Deming, the man behind total quality management, was steadfast about the importance of data in management and change. In the 1950s, his work with the Japanese helped them become the economic powerhouse of the 1960s, 70s, and 80s. It was only at that point that America learned of his work, and, of course, TQM, or total quality management, remains alive and well in industry.
There is much to learn from Deming’s work. For this piece, I think it’s appropriate to take Deming’s Fourteen Points of management and discuss them in terms of campus change and student retention. While these are targeted more for the industrial sector, I believe you will see how the basic tenets of his work are easily translatable to higher education.
1. Create constancy of purpose for improvement of product and service. Change managers must provide evidence of the nature of the problem and what is at stake by

Educational Policy Institute Institutional Student Retention Assessment
Part II: The Institutional Student Retention Assessment 32
remaining at the status quo. With no evidence, there is no will to change or evolve. This becomes the purpose behind change and evolution.
2. Adopt the new philosophy. The campus must be led to understand the purpose and adopt this philosophy as a foundation for change management. This is the caretaking aspect of leadership. If people don’t buy in at this point, realizing the goals of student retention will be difficult at best.
3. Cease dependence on mass inspection. I recall a statement by Art Levine and Jana Nidiffer, in their book Beating the Odds, in which they suggest that student success comes down to “one arm around one child.” If we continue to look at incoming cohorts of students as a unit, we miss the point. We must look at the process of how we deal with all students, individually. It can be done.
4. End the practice of awarding business on price tag alone. This sounds like it doesn’t belong, but it is essential in retention programming. The best things we do on campus aren’t always the cheapest. In terms of student services and other essential services, it can pay off in the long run to provide better, more expensive services if it keeps students engaged. Figure out the budget once you’ve found what works best for your students.
5. Improve constantly and forever the system of production and service. Retention solutions aren’t a one‐stop, one‐time shop. This is a continuous process that requires retooling and re‐articulation of the mission on a consistent basis. As Deming says himself, “Management is obligated to continually look for ways to reduce waste and improve quality.” In our case, we look at waste as the inefficient use of resources.
6. Institute training. Administrators, faculty, and staff generally only do what their predecessors told them to do, which is inadequate for institutions seeking to change how they do things. Professional development is an important area of support at your campus, but it is often relegated to the back burner. Do it well. Do it right. Make it important.
7. Institute leadership. If leadership is such an important issue with regard to change management and retention programming, then institutions must ensure that their leadership possesses the skill necessary to “lead,” not “demand.” There is a difference. Some argue that leadership is not learned, but leaders are born. Maybe so, but a lot can be learned, for sure.
8. Drive out fear. Change usually falters because people are scared of change. Change means less security. But if people are led to believe that a philosophy of change in an organization is the path to excellence, individually and collectively, they can learn to embrace

Educational Policy Institute Institutional Student Retention Assessment
Part II: The Institutional Student Retention Assessment 33
continuous improvement. In supporting change on campus, faculty and staff also must be given the opportunity to fail without repercussions. .
9. Break down barriers between staff areas. Higher education is famous for its silos and fortifications between departments and colleges. Even within schools on campus, there are often tangible barriers that break down communications and make teambuilding extraordinarily difficult. In addition, there is often a mentality of competition on campuses. Competition in itself isn’t bad, but it is detrimental to the larger cause if it results in teams working against rather than with each other. Retention programming only works when everyone is on board.
10. Eliminate slogans, exhortations, and targets for the workforce. Deming never was a fan of simple statements and targets. The focus is on the process.
11. Eliminate numerical quotas. Quotas are an end game result and do not take into consideration the process or the quality that goes into the educational experience. When students are treated, supported, and educated well, the numbers take care of themselves. Be mindful of setting arbitrary numbers for people to achieve. Instead of quotas, set up expectations for staff performance and “continuous improvement.” Continually ask “how do we do this better?”
12. Remove barriers to pride of workmanship. People like to do well and like to be rewarded and acknowledged when they do. Bring staff into the project and let them shine. More often than not, they will continually surprise you. There is nothing better than employees—at all levels of the university—that like to come to work every day. Remove the poor management conditions that reduce people to numbers.
13. Institute a vigorous program of education and retraining. If people are to make retention programming work, they must learn about how the change will happen and what their role is within the larger picture. Take the time to teach them about change and about student retention and how it impacts the institution.
14. Take action to accomplish the transformation. Increasing student retention at your campus takes willpower, teamwork, and great ideas. It also takes the knowledge and skill to make that change happen. Do everything in your power to ensure that the road map for change is well designed, with input from all, and destined for success.
If we use Deming’s work as a guide, we can carefully orchestrate the change process and how we can best meet our goals. Just following his Fourteen Points doesn’t ensure success,

Educational Policy Institute Institutional Student Retention Assessment
Part II: The Institutional Student Retention Assessment 34
however. Deming also talks about pitfalls and diseases within an organization that dooms progress. Use this as you think best fits your institution.
Hopefully this brief discussion provides a keystone to the two previous parts in this series. I remain interested in your comments and experiences related to student retention and institutional progress. Feel free to email me at [email protected].

Educational Policy Institute Institutional Student Retention Assessment
Part II: The Institutional Student Retention Assessment 35
Part II: The Institutional Student Retention Assessment (ISRA)

Educational Policy Institute Institutional Student Retention Assessment
Part II: The Institutional Student Retention Assessment I-1
Section I: Institutional Context

Educational Policy Institute Institutional Student Retention Assessment
Institutional Context I-2
TABLE OF CONTENTS SECTION I: Institutional Context 4
Introduction ............................................................................................................................................................ 4
PART A. Institutional Characteristics 5 A1. Directory Information ........................................................................................................................................ 5 A2. Institutional Classifications ............................................................................................................................... 5 A3. Admissions Criteria .......................................................................................................................................... 7
PART B: Student Characteristics 8 B1. Student Recruitment & Admissions .................................................................................................................. 8 B2. Student Enrollment ........................................................................................................................................ 10 B3. Student Retention Rates ................................................................................................................................ 14 B4. Student Graduation Rates.............................................................................................................................. 18
PART C: Strategic Framework 32 C1. Mission .......................................................................................................................................................... 32 C2. Vision ............................................................................................................................................................. 32 C4. Goals & Objectives ........................................................................................................................................ 33 C5. Policies .......................................................................................................................................................... 34
PART D: Institutional Practices 35 D1. Strengths & Weaknesses............................................................................................................................... 35 D2. Planning ......................................................................................................................................................... 35 D3. Leadership ..................................................................................................................................................... 37 D4. Institutional Research on Students ................................................................................................................ 38 D5. Human Resources ......................................................................................................................................... 39
SOURCES CITED 40

Educational Policy Institute Institutional Student Retention Assessment
Institutional Context I-3
Table of Tables Table 1. Directory Information .................................................................................................................................... 5 Table 2. Institutional Classifications ............................................................................................................................ 5 Table 3. Highest Level of Offering .............................................................................................................................. 6 Table 4. Carnegie Classification ................................................................................................................................. 6 Table 5. Accreditation Organizations .......................................................................................................................... 6 Table 6. Educational Offerings ................................................................................................................................... 7 Table 7. Admissions Policies ...................................................................................................................................... 7 Table 8. Admissions Criteria ....................................................................................................................................... 7 Table 9. New Freshmen Recruitment By Special Groupings (headcount) .................................................................. 8 Table 10. New Freshmen Recruitment by Academic Department (headcount) .......................................................... 9 Table 11. Institutional Undergraduate Enrollment by Level (from IPEDS) ................................................................ 10 Table 12. Institutional FIRST-TIME, FULL-TIME Undergraduate Enrollment by Ethnicity (from IPEDS) .................. 12 Table 13. Institutional FIRST-TIME, FULL-TIME Undergraduate Enrollment by Academic Department .................. 13 Table 14. New Freshmen (FULL-TIME) First Semester Retention Rates* by Race/Ethnicity, and Gender .............. 14 Table 15. New Freshmen (FULL-TIME) First Semester Retention Rates by Academic Department ........................ 15 Table 16. New Freshmen (FULL-TIME) First Year Retention Rates* (IPEDS GRS) ............................................... 16 Table 17. New Freshmen (FULL-TIME) First Year Retention Rates by Academic Department ................................ 17 Table 18. New Freshmen (FULL-TIME) Four-Year Graduation Rate (IPEDS GRS) ................................................. 18 Table 19. New Freshmen (FULL-TIME) Four-Year Graduation Rate (IPEDS GRS) ................................................. 20 Table 20. New Freshmen (FULL-TIME) Five-Year Graduation Rate (IPEDS GRS) ................................................. 20 Table 21. New Freshmen (FULL-TIME) Five-Year Graduation Rate (IPEDS GRS) ................................................. 22 Table 22. New Freshmen (FULL-TIME) Six-Year Graduation Rate (IPEDS GRS) ................................................... 22 Table 23. New Freshmen (FULL-TIME) Six-Year Graduation Rate (IPEDS GRS) ................................................... 24 Table 24. New Freshmen (FULL-TIME) Two-Year Graduation Rate – IPEDS GRS ................................................. 25 Table 25. New Freshmen (FULL-TIME) Two-Year Graduation Rate – IPEDS GRS ................................................. 26 Table 26. New Freshmen (FULL-TIME) Three-Year Graduation Rate (IPEDS GRS) ............................................... 27 Table 27. New Freshmen (FULL-TIME) Three-Year Graduation Rate – IPEDS GRS .............................................. 28 Table 28. New Freshmen On-Time Graduation Rate – Proprietary Institutions (IPEDS GRS) ................................. 29 Table 29. New Freshmen On-Time Graduation Rate – Proprietary Institutions (IPEDS GRS) ................................ 30 Table 30. Institutional Mission .................................................................................................................................. 32 Table 31. Institutional Vision ..................................................................................................................................... 32 Table 32. Institutional Goals & Objectives ................................................................................................................ 33 Table 33. Institutional Policies .................................................................................................................................. 34 Table 34. Institutional Planning ................................................................................................................................. 35 Table 35. Institutional Leadership ............................................................................................................................. 37 Table 36. Institutional Research ............................................................................................................................... 38 Table 37. Human Resources .................................................................................................................................... 39

Educational Policy Institute Institutional Student Retention Assessment
Institutional Context I-4
SECTION I: INSTITUTIONAL CONTEXT INTRODUCTION
Relationship to Framework Improving student success demands attention by the entire institution. At the same time, meaningful improvements need to be consistent with the institutional mission and resources. Institutional staff, administrators, and faculty members need to collect and analyze baseline data on student retention, persistence, and success, assess current institutional efforts to increase student retention and achievement, and set strategic goals and implement action plans. The Institutional Context assessment is designed to be a “snapshot” of your institution. It encourages your team to collect critical data on students, develop a stronger understanding of the institution’s strategic framework as it impacts student success, and compare current institutional practices to best practices associated with student retention and success.
Instructions In this section, you will first be asked to respond to a series of questions about the characteristics of your institution and student population. Since many of these questions are drawn from the IPEDS survey instrument, U.S. institutions are encouraged to use data from their IPEDS submissions for these questions. Following this section are a series of questions about the institution’s strategic framework, including mission, vision, beliefs and values, goals and objectives, and policies. In order to fully respond to these questions, your team should carefully review the institution’s strategic documents in regards to how they provide guidance or direction on student retention and success. Finally, there are a series of questions on institutional practices in the areas of planning, institutional research, human resources, and leadership. These are not meant to be comprehensive reviews of these areas, but rather a focused examination of how student retention and success are supported through these practices. We strongly recommend that you print each assessment section [link to printable assessment section] and use it as a discussion agenda with your team prior to entering data. Part of your team’s work will be to collect the required information (e.g., recruitment, enrollment, retention data; strategic documents) as part of the assessment process. [add more detailed instructions about saving data, etc.]

Educational Policy Institute Institutional Student Retention Assessment
Institutional Context I-5
PART A. INSTITUTIONAL CHARACTERISTICS This section collects basic information about the institution. U.S. institutions should note that many of the fields used in this section are drawn from the Integrated Postsecondary Education Data System (IPEDS).
A1. DIRECTORY INFORMATION Table 1. Directory Information 1. Institution (entity) name:
2. Street address or post office box:
3. City location of institution:
4. State / territory / province abbreviation:
5. ZIP / postal code:
6. Name of chief administrator:
7. Title of chief administrator:
8. General information telephone number:
9. Institution’s internet website address:
10. ISRA contact person:
11. ISRA contact telephone number:
12. ISRA contact e-mail:
A2. INSTITUTIONAL CLASSIFICATIONS 13. Institutional level and control. Please select one of the following options:
Table 2. Institutional Classifications Private, for profit (proprietary)
Private, not-for-profit four-year institution
Public, not-for-profit four-year institution
Public, not-for-profit two-year institution (community college)
Other

Educational Policy Institute Institutional Student Retention Assessment
Institutional Context I-6
14. Highest level of offering. Please select one of the following options:
Table 3. Highest Level of Offering Award of less than one academic year Postbaccalaureate certificate
At least 1, but less than 2 academic years Master's degree
Associate's degree Post-master's certificate
At least 2, but less than 4 academic years Doctor's degree
Bachelor's degree Not applicable, first-professional only
15. Carnegie Classification Code. Please select one of the following options:
Table 4. Carnegie Classification Doctoral/Research Universities--Extensive Medical schools and medical centers
Doctoral/Research Universities--Intensive Other separate health profession schools
Masters Colleges and Universities I Schools of engineering and technology
Masters Colleges and Universities II Schools of business and management
Baccalaureate Colleges--Liberal Arts Schools of art, music, and design
Baccalaureate Colleges—General Schools of law
Baccalaureate/Associates Colleges Teachers colleges
Associates Colleges Other specialized institutions
Theological seminaries and other specialized faith-related institutions
Tribal colleges
16. With what type of accreditation organizations/agencies are you affiliated?
Table 5. Accreditation Organizations Yes If yes, what is the name of agency
National institutional or specialized accrediting agency
Regional accrediting agency
State or provincial accrediting or approval agency

Educational Policy Institute Institutional Student Retention Assessment
Institutional Context I-7
17. Educational Offerings. Please indicate below if the following types of educational offerings are available at your institution.
Table 6. Educational Offerings Yes No Occupational
Academic
Continuing professional
Recreational or avocational
Adult basic remedial or high school equivalent
Secondary (high school)
A3. ADMISSIONS CRITERIA 18. What type of admissions policy does your institution have?
Table 7. Admissions Policies
Open admission policy
Moderately selective institution
Highly selective institution
19. Please indicate below if the following admission criteria are required, recommended, or neither required or recommended.
Table 8. Admissions Criteria Required Recommended Neither
Required or Recommended
Secondary school grades / GPA Secondary school rank Secondary school record Completion of college preparatory program Recommendations Formal demonstration of competencies Admission test scores (SAT/ACT) TOEFL (Test of English as a Foreign Language)

Educational Policy Institute Institutional Student Retention Assessment
Institutional Context I-8
PART B: STUDENT CHARACTERISTICS B1. STUDENT RECRUITMENT & ADMISSIONS The next two tables collect disaggregated information about the institution’s enrollment. U.S. institutions should note that many of the fields used in this section are drawn from the Integrated Postsecondary Education Data System (IPEDS). Table 9. New Freshmen Recruitment By Special Groupings (headcount) Past Year Current Year Current Yield - Percentages Inquiries Applications Admitted Enrolled Inquiries Applications Admitted Enrolled Inquiries to
Apps Apps to Admit
Admit to Enrolled
20. Asian American/Asian (Male)
21. Asian American/Asian (Female)
22. African American/Black (Male)
23. African American/Black (Female)
24. Hispanic (Male)
25. Hispanic (Female)
26. Native American* (Male)
27. Native American* (Female)
28. White (Male)
29. White (Female)
30. Non-Resident Aliens (Male)
31. Non-Resident Aliens (Female)

Educational Policy Institute Institutional Student Retention Assessment
Institutional Context I-9
32. Other (Male)
33. Other (Female)
34. Unknown (Male)
35. Unknown (Female)
36. Low-Income** (Male)
37. Low-Income** (Female)
38. Dependent
39. Independent
40. Total (Male)
41. Total (Female)
42. TOTAL*** (ALL)
*Does not sum all rows due to duplicity of data.
Table 10. New Freshmen Recruitment by Academic Department (headcount) Past Year Current Year Current Yield - Percentages Department (add departments below)
Inquiries Applications Admitted Enrolled Inquiries Applications Admitted Enrolled Inquiries to Apps
Apps to Admit
Admit to Enrolled
43.
44.
45.
46.
47.
48.

Educational Policy Institute Institutional Student Retention Assessment
Institutional Context I-10
49.
50.
51.
52.
53. TOTAL
** THIS WILL HAVE AN “ADD BUTTON” OPTION ON THE WEB, RATHER THAN SO MANY LINES **
B2. STUDENT ENROLLMENT This section collects disaggregated information about the institution’s enrollment. U.S. institutions should note that many of the fields used in this section are drawn from the Integrated Postsecondary Education Data System (IPEDS). This chart is meant to be scalable for proprietary (for profit), two-year (community colleges), and four-year (colleges and universities) institutions. For less-than four-year institutions, please disregard rows or columns regarding junior and seniors. For the following charts, please note the column titles. You will be asked to fill in the year, as we have done below. EXAMPLE Institutional Undergraduate Enrollment by Level– Taken From IPEDS Fall Previous Year
(Current – 3) Fall Previous
Year (Current – 2)
% Change Fall Previous Year (Current – 1)
% Change Fall Current Year % Change
2003 2004 2005 2006
XX. Full-Time, Degree-Seeking
Table 11. Institutional Undergraduate Enrollment by Level (from IPEDS) Fall Previous Year
(Current – 3) Fall Previous
Year (Current – 2)
% Change Fall Previous Year (Current – 1)
% Change Latest Year Available (e.g.,
AY2000)
% Change
Enter ACADEMIC YEAR HERE
Enter ACADEMIC YEAR HERE
Enter ACADEMIC YEAR HERE
Enter ACADEMIC YEAR HERE
54. Full-Time, Degree-Seeking
a. New Freshmen (1st Year)
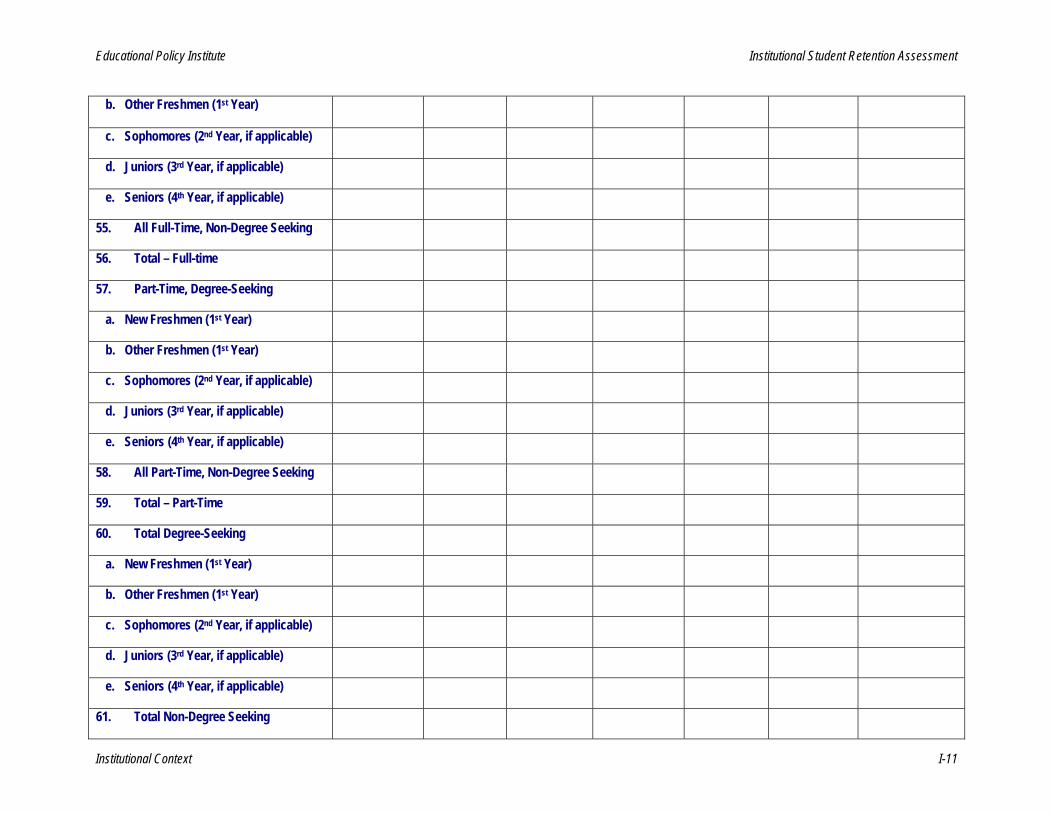
Educational Policy Institute Institutional Student Retention Assessment
Institutional Context I-11
b. Other Freshmen (1st Year)
c. Sophomores (2nd Year, if applicable)
d. Juniors (3rd Year, if applicable)
e. Seniors (4th Year, if applicable)
55. All Full-Time, Non-Degree Seeking
56. Total – Full-time
57. Part-Time, Degree-Seeking
a. New Freshmen (1st Year)
b. Other Freshmen (1st Year)
c. Sophomores (2nd Year, if applicable)
d. Juniors (3rd Year, if applicable)
e. Seniors (4th Year, if applicable)
58. All Part-Time, Non-Degree Seeking
59. Total – Part-Time
60. Total Degree-Seeking
a. New Freshmen (1st Year)
b. Other Freshmen (1st Year)
c. Sophomores (2nd Year, if applicable)
d. Juniors (3rd Year, if applicable)
e. Seniors (4th Year, if applicable)
61. Total Non-Degree Seeking

Educational Policy Institute Institutional Student Retention Assessment
Institutional Context I-12
62. TOTAL (ALL)
Table 12. Institutional FIRST-TIME, FULL-TIME Undergraduate Enrollment by Ethnicity (from IPEDS) Fall Previous Year
(Current – 3) Fall Previous
Year (Current – 2)
% Change Fall Previous Year (Current – 1)
% Change Latest Year Available (e.g.,
AY2000)
% Change
Enter ACADEMIC YEAR HERE
Enter ACADEMIC YEAR HERE
Enter ACADEMIC YEAR HERE
Enter ACADEMIC YEAR HERE
63. Asian American/Asian (Male)
64. Asian American/Asian (Female)
65. African American/Black (Male)
66. African American/Black (Female)
67. Hispanic (Male)
68. Hispanic (Female)
69. Native American* (Male)
70. Native American* (Female)
71. White (Male)
72. White (Female)
73. Non-Resident Aliens (Male)
74. Non-Resident Aliens (Female)
75. Other (Male)
76. Other (Female)
77. Unknown (Male)
78. Unknown (Female)

Educational Policy Institute Institutional Student Retention Assessment
Institutional Context I-13
79. Low-Income** (Male)
80. Low-Income** (Female)
81. Dependent
82. Independent
83. Total (Male)
84. Total (Female)
85. TOTAL*** (ALL)
*Including aboriginals, first-nations, Alaskan, Inuit, and others who are original North Americans. **Low-income defined by the user. In the US, use students eligible for Pell Grants. ***Does not sum all rows due to duplicity of data. Table 13. Institutional FIRST-TIME, FULL-TIME Undergraduate Enrollment by Academic Department Department (add departments below)
Fall Previous Year (Current – 3)
Fall Previous Year (Current –
2)
% Change Fall Previous Year (Current – 1)
% Change Latest Year Available (e.g.,
AY2000)
% Change
Enter ACADEMIC YEAR HERE
Enter ACADEMIC YEAR HERE
Enter ACADEMIC YEAR HERE
Enter ACADEMIC YEAR HERE
86.
87.
88.
89.
90.
91.
92.
93.
94.

Educational Policy Institute Institutional Student Retention Assessment
Institutional Context I-14
95.
96. TOTAL (ALL)
B3. STUDENT RETENTION RATES This section collects disaggregated information about the institution’s retention rates. U.S. institutions should note that many of the fields used in this section are drawn from the Integrated Postsecondary Education Data System (IPEDS). Table 14. New Freshmen (FULL-TIME) First Semester Retention Rates* by Race/Ethnicity, and Gender Fall Previous Year
(Current – 3) Fall Previous
Year (Current – 2)
% Change Fall Previous Year (Current – 1)
% Change Latest Year Available (e.g.,
AY2000)
% Change
Enter ACADEMIC YEAR HERE
Enter ACADEMIC YEAR HERE
Enter ACADEMIC YEAR HERE
Enter ACADEMIC YEAR HERE
97. Asian American/Asian (Male)
98. Asian American/Asian (Female)
99. African American/Black (Male)
100. African American/Black (Female)
101. Hispanic (Male)
102. Hispanic (Female)
103. Native American** (Male)
104. Native American** (Female)
105. White (Male)
106. White (Female)
107. Non-Resident Aliens (Male)
108. Non-Resident Aliens (Female)

Educational Policy Institute Institutional Student Retention Assessment
Institutional Context I-15
109. Other (Male)
110. Other (Female)
111. Unknown (Male)
112. Unknown (Female)
113. Low-Income** (Male)
114. Low-Income** (Female)
115. Dependent
116. Independent
117. Total (Male)
118. Total (Female)
119. TOTAL*** (ALL)
*Defined as those students who begin the semester and enroll in the subsequent semester (e.g., enter Fall 2006; still enrolled Spring 2006; or: enter summer 2005, still enrolled fall 2006). **Including aboriginals, first-nations, Alaskan, Inuit, and others who are original North Americans. ***Does not sum all rows due to duplicity of data.
Table 15. New Freshmen (FULL-TIME) First Semester Retention Rates by Academic Department Fall Previous Year
(Current – 3) Fall Previous
Year (Current – 2)
% Change Fall Previous Year (Current – 1)
% Change Latest Year Available (e.g.,
AY2000)
% Change
Academic Department (add departments below)
Enter ACADEMIC YEAR HERE
Enter ACADEMIC YEAR HERE
Enter ACADEMIC YEAR HERE
Enter ACADEMIC YEAR HERE
120.
121.
122.
123.

Educational Policy Institute Institutional Student Retention Assessment
Institutional Context I-16
124.
125.
126.
127.
128.
129.
130. TOTAL (ALL)
Table 16. New Freshmen (FULL-TIME) First Year Retention Rates* (IPEDS GRS) Fall Previous Year
(Current – 3) Fall Previous
Year (Current – 2)
% Change Fall Previous Year (Current – 1)
% Change Latest Year Available (e.g.,
AY2000)
% Change
Enter ACADEMIC YEAR HERE
Enter ACADEMIC YEAR HERE
Enter ACADEMIC YEAR HERE
Enter ACADEMIC YEAR HERE
131. Asian American/Asian (Male)
132. Asian American/Asian (Female)
133. African American/Black (Male)
134. African American/Black (Female)
135. Hispanic (Male)
136. Hispanic (Female)
137. Native American** (Male)
138. Native American** (Female)
139. White (Male)
140. White (Female)

Educational Policy Institute Institutional Student Retention Assessment
Institutional Context I-17
141. Non-Resident Aliens (Male)
142. Non-Resident Aliens (Female)
143. Other (Male)
144. Other (Female)
145. Unknown (Male)
146. Unknown (Female)
147. Low-Income** (Male)
148. Low-Income** (Female)
149. Dependent
150. Independent
151. Total (Male)
152. Total (Female)
153. TOTAL*** (ALL)
*Defined as those who enroll in one year and still enrolled in subsequent academic year (e.g., Enter Fall 2005 and still enrolled Fall 2006) **Including aboriginals, first-nations, Alaskan, Inuit, and others who are original North Americans. ***Does not sum all rows due to duplicity of data.
Table 17. New Freshmen (FULL-TIME) First Year Retention Rates by Academic Department Fall Previous Year
(Current – 3) Fall Previous
Year (Current – 2)
% Change Fall Previous Year (Current – 1)
% Change Latest Year Available (e.g.,
AY2000)
% Change
Academic Department (add departments below)
Enter ACADEMIC YEAR HERE
Enter ACADEMIC YEAR HERE
Enter ACADEMIC YEAR HERE
Enter ACADEMIC YEAR HERE
154.
155.
156.

Educational Policy Institute Institutional Student Retention Assessment
Institutional Context I-18
157.
158.
159.
160.
161.
162.
163.
164. TOTAL (ALL)
B4. STUDENT GRADUATION RATES
Four-Year Institutions This section collects disaggregated information about the institution’s graduation rates. U.S. institutions should note that many of the fields used in this section are drawn from the Integrated Postsecondary Education Data System (IPEDS). Table 18. New Freshmen (FULL-TIME) Four-Year Graduation Rate (IPEDS GRS) Fall Previous Year
(Current – 3) Fall Previous
Year (Current – 2)
% Change Fall Previous Year (Current – 1)
% Change Latest Year Available (e.g.,
AY2000)
% Change
Enter ACADEMIC YEAR HERE
Enter ACADEMIC YEAR HERE
Enter ACADEMIC YEAR HERE
Enter ACADEMIC YEAR HERE
165. Asian American/Asian (Male)
166. Asian American/Asian (Female)
167. African American/Black (Male)
168. African American/Black (Female)
169. Hispanic (Male)

Educational Policy Institute Institutional Student Retention Assessment
Institutional Context I-19
170. Hispanic (Female)
171. Native American** (Male)
172. Native American** (Female)
173. White (Male)
174. White (Female)
175. Non-Resident Aliens (Male)
176. Non-Resident Aliens (Female)
177. Other (Male)
178. Other (Female)
179. Unknown (Male)
180. Unknown (Female)
181. Low-Income** (Male)
182. Low-Income** (Female)
183. Dependent
184. Independent
185. Total (Male)
186. Total (Female)
187. TOTAL*** (ALL)

Educational Policy Institute Institutional Student Retention Assessment
Institutional Context I-20
Table 19. New Freshmen (FULL-TIME) Four-Year Graduation Rate (IPEDS GRS) Fall Previous Year
(Current – 3) Fall Previous
Year (Current – 2)
% Change Fall Previous Year (Current – 1)
% Change Latest Year Available (e.g.,
AY2000)
% Change
Academic Department (add departments below)
Enter ACADEMIC YEAR HERE
Enter ACADEMIC YEAR HERE
Enter ACADEMIC YEAR HERE
Enter ACADEMIC YEAR HERE
188.
189.
190.
191.
192.
193.
194.
195.
196.
197.
198. TOTAL (ALL)
Table 20. New Freshmen (FULL-TIME) Five-Year Graduation Rate (IPEDS GRS) Fall Previous Year
(Current – 3) Fall Previous
Year (Current – 2)
% Change Fall Previous Year (Current – 1)
% Change Latest Year Available (e.g.,
AY2000)
% Change
Enter ACADEMIC YEAR HERE
Enter ACADEMIC YEAR HERE
Enter ACADEMIC YEAR HERE
Enter ACADEMIC YEAR HERE
199. Asian American/Asian (Male)
200. Asian American/Asian (Female)
201. African American/Black (Male)

Educational Policy Institute Institutional Student Retention Assessment
Institutional Context I-21
202. African American/Black (Female)
203. Hispanic (Male)
204. Hispanic (Female)
205. Native American** (Male)
206. Native American** (Female)
207. White (Male)
208. White (Female)
209. Non-Resident Aliens (Male)
210. Non-Resident Aliens (Female)
211. Other (Male)
212. Other (Female)
213. Unknown (Male)
214. Unknown (Female)
215. Low-Income** (Male)
216. Low-Income** (Female)
217. Dependent
218. Independent
219. Total (Male)
220. Total (Female)
221. TOTAL*** (ALL)

Educational Policy Institute Institutional Student Retention Assessment
Institutional Context I-22
Table 21. New Freshmen (FULL-TIME) Five-Year Graduation Rate (IPEDS GRS) Fall Previous Year
(Current – 3) Fall Previous
Year (Current – 2)
% Change Fall Previous Year (Current – 1)
% Change Latest Year Available (e.g.,
AY2000)
% Change
Academic Department (add departments below)
Enter ACADEMIC YEAR HERE
Enter ACADEMIC YEAR HERE
Enter ACADEMIC YEAR HERE
Enter ACADEMIC YEAR HERE
222.
223.
224.
225.
226.
227.
228.
229.
230.
231.
232. TOTAL (ALL)
Table 22. New Freshmen (FULL-TIME) Six-Year Graduation Rate (IPEDS GRS) Fall Previous Year
(Current – 3) Fall Previous
Year (Current – 2)
% Change Fall Previous Year (Current – 1)
% Change Latest Year Available (e.g.,
AY2000)
% Change
Enter ACADEMIC YEAR HERE
Enter ACADEMIC YEAR HERE
Enter ACADEMIC YEAR HERE
Enter ACADEMIC YEAR HERE
233. Asian American/Asian (Male)
234. Asian American/Asian (Female)
235. African American/Black (Male)

Educational Policy Institute Institutional Student Retention Assessment
Institutional Context I-23
236. African American/Black (Female)
237. Hispanic (Male)
238. Hispanic (Female)
239. Native American** (Male)
240. Native American** (Female)
241. White (Male)
242. White (Female)
243. Non-Resident Aliens (Male)
244. Non-Resident Aliens (Female)
245. Other (Male)
246. Other (Female)
247. Unknown (Male)
248. Unknown (Female)
249. Low-Income** (Male)
250. Low-Income** (Female)
251. Dependent
252. Independent
253. Total (Male)
254. Total (Female)
255. TOTAL*** (ALL)

Educational Policy Institute Institutional Student Retention Assessment
Institutional Context I-24
Table 23. New Freshmen (FULL-TIME) Six-Year Graduation Rate (IPEDS GRS) Fall Previous Year
(Current – 3) Fall Previous
Year (Current – 2)
% Change Fall Previous Year (Current – 1)
% Change Latest Year Available (e.g.,
AY2000)
% Change
Academic Department (add departments below)
Enter ACADEMIC YEAR HERE
Enter ACADEMIC YEAR HERE
Enter ACADEMIC YEAR HERE
Enter ACADEMIC YEAR HERE
256.
257.
258.
259.
260.
261.
262.
263.
264.
265.
266. TOTAL (ALL)

Educational Policy Institute Institutional Student Retention Assessment
Institutional Context I-25
Two-Year Institutions This section collects disaggregated information about the institution’s graduation rates. U.S. institutions should note that many of the fields used in this section are drawn from the Integrated Postsecondary Education Data System (IPEDS). Table 24. New Freshmen (FULL-TIME) Two-Year Graduation Rate – IPEDS GRS Fall Previous Year
(Current – 3) Fall Previous
Year (Current – 2)
% Change Fall Previous Year (Current – 1)
% Change Latest Year Available (e.g.,
AY2000)
% Change
Enter ACADEMIC YEAR HERE
Enter ACADEMIC YEAR HERE
Enter ACADEMIC YEAR HERE
Enter ACADEMIC YEAR HERE
267. Asian American/Asian (Male)
268. Asian American/Asian (Female)
269. African American/Black (Male)
270. African American/Black (Female)
271. Hispanic (Male)
272. Hispanic (Female)
273. Native American** (Male)
274. Native American** (Female)
275. White (Male)
276. White (Female)
277. Non-Resident Aliens (Male)
278. Non-Resident Aliens (Female)
279. Other (Male)
280. Other (Female)
281. Unknown (Male)
282. Unknown (Female)

Educational Policy Institute Institutional Student Retention Assessment
Institutional Context I-26
283. Low-Income** (Male)
284. Low-Income** (Female)
285. Dependent
286. Independent
287. Total (Male)
288. Total (Female)
289. TOTAL*** (ALL)
Table 25. New Freshmen (FULL-TIME) Two-Year Graduation Rate – IPEDS GRS Fall Previous Year
(Current – 3) Fall Previous
Year (Current – 2)
% Change Fall Previous Year (Current – 1)
% Change Latest Year Available (e.g.,
AY2000)
% Change
Academic Department (add departments below)
Enter ACADEMIC YEAR HERE
Enter ACADEMIC YEAR HERE
Enter ACADEMIC YEAR HERE
Enter ACADEMIC YEAR HERE
290.
291.
292.
293.
294.
295.
296.
297.
298.
299.

Educational Policy Institute Institutional Student Retention Assessment
Institutional Context I-27
300. TOTAL (ALL)
Table 26. New Freshmen (FULL-TIME) Three-Year Graduation Rate (IPEDS GRS) Fall Previous Year
(Current – 3) Fall Previous
Year (Current – 2)
% Change Fall Previous Year (Current – 1)
% Change Latest Year Available (e.g.,
AY2000)
% Change
Enter ACADEMIC YEAR HERE
Enter ACADEMIC YEAR HERE
Enter ACADEMIC YEAR HERE
Enter ACADEMIC YEAR HERE
301. Asian American/Asian (Male)
302. Asian American/Asian (Female)
303. African American/Black (Male)
304. African American/Black (Female)
305. Hispanic (Male)
306. Hispanic (Female)
307. Native American** (Male)
308. Native American** (Female)
309. White (Male)
310. White (Female)
311. Non-Resident Aliens (Male)
312. Non-Resident Aliens (Female)
313. Other (Male)
314. Other (Female)
315. Unknown (Male)
316. Unknown (Female)

Educational Policy Institute Institutional Student Retention Assessment
Institutional Context I-28
317. Low-Income** (Male)
318. Low-Income** (Female)
319. Dependent
320. Independent
321. Total (Male)
322. Total (Female)
323. TOTAL*** (ALL)
Table 27. New Freshmen (FULL-TIME) Three-Year Graduation Rate – IPEDS GRS Fall Previous Year
(Current – 3) Fall Previous
Year (Current – 2)
% Change Fall Previous Year (Current – 1)
% Change Latest Year Available (e.g.,
AY2000)
% Change
Academic Department (add departments below)
Enter ACADEMIC YEAR HERE
Enter ACADEMIC YEAR HERE
Enter ACADEMIC YEAR HERE
Enter ACADEMIC YEAR HERE
324.
325.
326.
327.
328.
329.
330.
331.
332.
333.

Educational Policy Institute Institutional Student Retention Assessment
Institutional Context I-29
334. TOTAL (ALL)
Proprietary (Less than Two-Year) Institutions This section collects disaggregated information about the institution’s graduation rates. U.S. institutions should note that many of the fields used in this section are drawn from the Integrated Postsecondary Education Data System (IPEDS). Table 28. New Freshmen On-Time Graduation Rate – Proprietary Institutions (IPEDS GRS) Fall Previous Year
(Current – 3) Fall Previous
Year (Current – 2)
% Change Fall Previous Year (Current – 1)
% Change Latest Year Available (e.g.,
AY2000)
% Change
Enter ACADEMIC YEAR HERE
Enter ACADEMIC YEAR HERE
Enter ACADEMIC YEAR HERE
Enter ACADEMIC YEAR HERE
335. Asian American/Asian (Male)
336. Asian American/Asian (Female)
337. African American/Black (Male)
338. African American/Black (Female)
339. Hispanic (Male)
340. Hispanic (Female)
341. Native American** (Male)
342. Native American** (Female)
343. White (Male)
344. White (Female)
345. Non-Resident Aliens (Male)
346. Non-Resident Aliens (Female)
347. Other (Male)

Educational Policy Institute Institutional Student Retention Assessment
Institutional Context I-30
348. Other (Female)
349. Unknown (Male)
350. Unknown (Female)
351. Low-Income** (Male)
352. Low-Income** (Female)
353. Dependent
354. Independent
355. Total (Male)
356. Total (Female)
357. TOTAL*** (ALL)
Table 29. New Freshmen On-Time Graduation Rate – Proprietary Institutions (IPEDS GRS) Fall Previous Year
(Current – 3) Fall Previous
Year (Current – 2)
% Change Fall Previous Year (Current – 1)
% Change Latest Year Available (e.g.,
AY2000)
% Change
Academic Department (add departments below)
Enter ACADEMIC YEAR HERE
Enter ACADEMIC YEAR HERE
Enter ACADEMIC YEAR HERE
Enter ACADEMIC YEAR HERE
358.
359.
360.
361.
362.
363.
364.

Educational Policy Institute Institutional Student Retention Assessment
Institutional Context I-31
365.
366.
367.
368. TOTAL (ALL)

Educational Policy Institute Institutional Student Retention Assessment
Institutional Context I-32
PART C: STRATEGIC FRAMEWORK C1. MISSION
369. Enter the mission or mission statement of your institution and respond to the statements below.
Table 30. Institutional Mission Please answer the following questions and elaborate through the supplementary questions.
1 NO
2
3
4
5 YES N/A
370. Our mission statement focuses on student success. (Voorhees, 2004) 1 NO
2
3
4
5 YES NA
371. The mission statement identifies the institution’s responsibility for student success. 1
NO 2
3
4
5 YES NA
372. Our mission statement is consistent with standards created by other professional organizations, including accrediting organizations (e.g., the Professional Standards for Higher Education by the Council for the Advancement of Standards in Higher Education).
1 NO
2
3
4
5 YES NA
373. Our mission is actively used to guide policy development and practical application. 1
NO 2
3
4
5 YES NA
374. Our leadership communicates our mission to all campus constituencies and key stakeholder groups. 1
NO 2
3
4
5 YES NA
375. Our staff, administrators, and faculty are aware of the mission statement. 1 NO
2
3
4
5 YES NA
376. Our students are aware of the mission statement. 1 NO
2
3
4
5 YES NA
377. Our community is aware of the mission statement. 1 NO
2
3
4
5 YES NA
378. We regularly review our mission statement. (Miller, 2001) 1 NO
2
3
4
5 YES NA
C2. VISION
379. Enter the vision for your institution and respond to the statements below.
Table 31. Institutional Vision Please answer the following questions and elaborate through the supplementary questions.
1 NO
2
3
4
5 YES N/A
380. Our vision statement focuses on student success. 1 NO
2
3
4
5 YES NA
381. The vision statement identifies an expanded institutional responsibility for student success in the future. 1
NO 2
3
4
5 YES NA
382. Our leadership communicates our vision to all campus constituencies and key stakeholder groups. 1
NO 2
3
4
5 YES NA

Educational Policy Institute Institutional Student Retention Assessment
Institutional Context I-33
383. Our vision is actively used to guide our strategic planning. 1 NO
2
3
4
5 YES NA
384. Our staff, administrators, and faculty are aware of the vision statement. 1 NO
2
3
4
5 YES NA
385. Our students are aware of the vision statement. 1 NO
2
3
4
5 YES NA
386. Our community is aware of the vision statement. 1 NO
2
3
4
5 YES NA
387. We regularly review our vision statement. (Miller, 2001) 1 NO
2
3
4
5 YES NA
C4. GOALS & OBJECTIVES 388. Enter below the goals and objectives of your institution and respond to the following statements.
Goal 1 (ADD Button)
Objective 1 (ADD Button)
Table 32. Institutional Goals & Objectives Please answer the following questions and elaborate through the supplementary questions.
1 NO
2
3
4
5 YES N/A
389. Our goals and objectives are consistent with our mission statement and beliefs and values. 1
NO 2
3
4
5 YES NA
390. Our goals and objectives are consistent with standards created by other professional organizations, including accrediting organizations (e.g., the Professional Standards for Higher Education by the Council for the Advancement of Standards in Higher Education; NASFAA, NACAN, AACRAO, etc.).
1 NO
2
3
4
5 YES NA
391. We disseminate, implement, and regularly review our goals and objectives. (Miller, 2001) 1
NO 2
3
4
5 YES NA
392. Our goals and objectives focus on student success. 1 NO
2
3
4
5 YES NA
393. Our goals and objectives are actively used to guide policy development and practical application. 1
NO 2
3
4
5 YES NA
394. Our leadership communicates our goals and objectives to all campus constituencies and key stakeholder groups. 1
NO 2
3
4
5 YES NA
395. Our staff, administrators, and faculty are aware of our goals and objectives. 1
NO 2
3
4
5 YES NA

Educational Policy Institute Institutional Student Retention Assessment
Institutional Context I-34
C5. POLICIES For each of the upcoming questions, please answer these supplementary questions. The online system will bring these up automatically. a) Please elaborate and describe.
c) Provide empirical or institutional evidence to support your rating. b) On a scale of 1 – 5, do you believe this strategy could/does support student success?
1
NO
2
3
4
5
YES
d) Do you believe this area requires improvement? 1 NO 5
YES e) If yes, what could be done to improve the effectiveness of this area? Table 33. Institutional Policies Please answer the following questions and elaborate through the supplementary questions.
1 NO
2
3
4
5 YES N/A
396. Our institutional policies are consistent with our mission statement, beliefs and values, and goals and objectives. 1
NO 2
3
4
5 YES NA
397. Our institutional policies are consistent with standards created by other professional organizations, including accrediting organizations (e.g., the Professional Standards for Higher Education by the Council for the Advancement of Standards in Higher Education; NASFAA, NACAN, AACRAO, etc.).
1 NO
2
3
4
5 YES NA
398. Our institutional policies are actively used to guide our practices. 399. Our leadership ensures that our policies are disseminated to all campus
constituencies and key stakeholder groups. 1 NO
2
3
4
5 YES NA
400. Our staff, administrators, and faculty are aware of our goals and objectives.
401. Our policies focus on student success. 1 NO
2
3
4
5 YES NA
402. Our institutional policies were cooperatively developed by staff, administrators, and faculty. 1
NO 2
3
4
5 YES NA
403. We review our institutional policies on a regularly scheduled basis. 1 NO
2
3
4
5 YES NA

Educational Policy Institute Institutional Student Retention Assessment
Institutional Context I-35
PART D: INSTITUTIONAL PRACTICES D1. STRENGTHS & WEAKNESSES
1. Please describe below your institution’s main strategies/practices for student success.
Strategy 1
(ADD button) 2. Please describe below the strategies/practices that you believe have most effectively supported the
learning/development/success of students.
Success Strategy 1
Description of Strategy
Evidence of Success
(ADD button) 3. Please describe the challenges or areas of weakness of which you are aware along with potential solutions or strategies to
ameliorate these issues.
Challenge 1
Evidence
Solution Strategy
(ADD button)
D2. PLANNING For each of the upcoming questions, please answer these supplementary questions. The online system will bring these up automatically. a) Please elaborate and describe.
c) Provide empirical or institutional evidence to support your rating. b) On a scale of 1 – 5, do you believe this strategy could/does support student success?
1
NO
2
3
4
5
YES
d) Do you believe this area requires improvement? 1 NO 5
YES e) If yes, what could be done to improve the effectiveness of this area? Table 34. Institutional Planning Please answer the following questions and elaborate through the supplementary questions.
1 NO
2
3
4
5 YES N/A
404. Our leadership has assigned responsibility to an individual and/or an institutional team, composed of representatives of various campus
1 NO
2
3
4
5 YES NA

Educational Policy Institute Institutional Student Retention Assessment
Institutional Context I-36
constituencies and key stakeholder groups to address student retention, persistence, and success. (Dietsche, 2006; Kuh, et. al., 2005)
405. There is a separate budget allocated for student retention, persistence, and success. (Dietsche, 2006) 1
NO 2
3
4
5 YES NA
406. Our team systematically collects and analyzes data on student retention, persistence, and success. (Voorhees, 2004) 1
NO 2
3
4
5 YES NA
407. We regularly survey and determine the key requirements and changing expectations of our students, in regards to our academic programs and campus services.
1 NO
2
3
4
5 YES NA
408. We systematically assess our institutional strengths, weaknesses, opportunities, and threats pertaining to the retention, persistence, and success of students.
1 NO
2
3
4
5 YES NA
409. We monitor policy or practice changes in higher education, technology, student and community demographics, markets, competition, or regulatory environments and we assess these changes for their impact on student retention, persistence, and success.
1 NO
2
3
4
5 YES NA
410. We develop a strategic plan that directly addresses student success. 1 NO
2
3
4
5 YES NA
411. There is congruence between our student success plan and the broader institutional strategic plan. 1
NO 2
3
4
5 YES NA
412. Our strategic plan for student success includes both short- and longer-term planning timelines. 1
NO 2
3
4
5 YES NA
413. We have identified strategic goals and measurable objectives for student success. 1
NO 2
3
4
5 YES NA
414. Our strategic objectives were developed in response to information collected and analyzed through our planning process as outlined above. 1
NO 2
3
4
5 YES NA
415. Our strategic objectives balance the needs of all students, campus constituencies, and key stakeholder groups. 1
NO 2
3
4
5 YES NA
416. We have developed action plans to achieve our strategic objectives. 1 NO
2
3
4
5 YES NA
417. We have allocated institutional resources appropriate to ensure the accomplishment of the action plans. 1
NO 2
3
4
5 YES NA
418. We have identified key performance indicators or benchmarks for tracking progress on our action plans. (Dietsche, 2006) 1
NO 2
3
4
5 YES NA
419. Our action plan measurement system involves all affected campus departments, constituencies, and stakeholders. 1
NO 2
3
4
5 YES NA
420. Our team evaluates the process and outcomes of its action plans in regards to improving student retention, persistence, and success. 1
NO 2
3
4
5 YES NA
421. Evaluation data are used to develop or revise the action plan and related strategies. 1
NO 2
3
4
5 YES NA
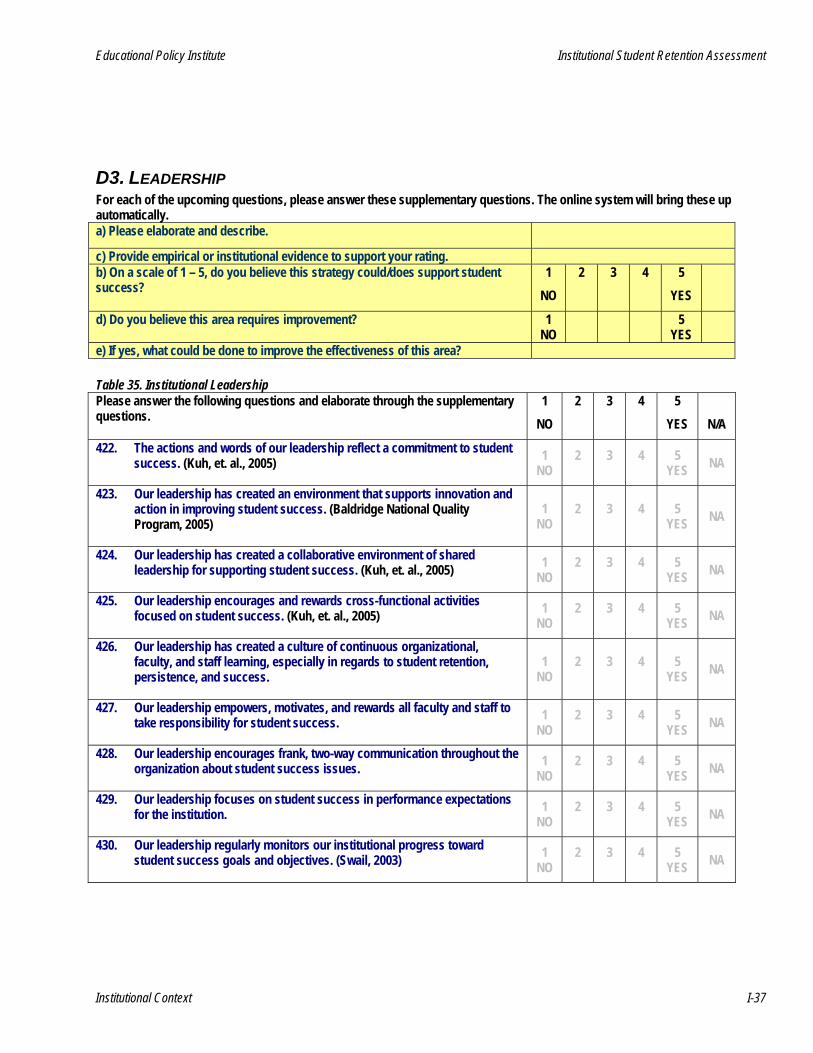
Educational Policy Institute Institutional Student Retention Assessment
Institutional Context I-37
D3. LEADERSHIP For each of the upcoming questions, please answer these supplementary questions. The online system will bring these up automatically. a) Please elaborate and describe.
c) Provide empirical or institutional evidence to support your rating. b) On a scale of 1 – 5, do you believe this strategy could/does support student success?
1 NO
2
3
4
5 YES
d) Do you believe this area requires improvement? 1 NO 5
YES e) If yes, what could be done to improve the effectiveness of this area? Table 35. Institutional Leadership Please answer the following questions and elaborate through the supplementary questions.
1 NO
2
3
4
5 YES N/A
422. The actions and words of our leadership reflect a commitment to student success. (Kuh, et. al., 2005) 1
NO 2
3
4
5 YES NA
423. Our leadership has created an environment that supports innovation and action in improving student success. (Baldridge National Quality Program, 2005)
1 NO
2
3
4
5 YES NA
424. Our leadership has created a collaborative environment of shared leadership for supporting student success. (Kuh, et. al., 2005) 1
NO 2
3
4
5 YES NA
425. Our leadership encourages and rewards cross-functional activities focused on student success. (Kuh, et. al., 2005) 1
NO 2
3
4
5 YES NA
426. Our leadership has created a culture of continuous organizational, faculty, and staff learning, especially in regards to student retention, persistence, and success.
1 NO
2
3
4
5 YES NA
427. Our leadership empowers, motivates, and rewards all faculty and staff to take responsibility for student success. 1
NO 2
3
4
5 YES NA
428. Our leadership encourages frank, two-way communication throughout the organization about student success issues. 1
NO 2
3
4
5 YES NA
429. Our leadership focuses on student success in performance expectations for the institution. 1
NO 2
3
4
5 YES NA
430. Our leadership regularly monitors our institutional progress toward student success goals and objectives. (Swail, 2003) 1
NO 2
3
4
5 YES NA

Educational Policy Institute Institutional Student Retention Assessment
Institutional Context I-38
D4. INSTITUTIONAL RESEARCH ON STUDENTS For each of the upcoming questions, please answer these supplementary questions. The online system will bring these up automatically. a) Please elaborate and describe.
c) Provide empirical or institutional evidence to support your rating. b) On a scale of 1 – 5, do you believe this strategy could/does support student success?
1 NO
2
3
4
5 YES
d) Do you believe this area requires improvement? 1 NO 5
YES e) If yes, what could be done to improve the effectiveness of this area? Table 36. Institutional Research Please answer the following questions and elaborate through the supplementary questions.
1 NO
2
3
4
5 YES N/A
431. We collect data on the pre-college academic achievement of our incoming students, such as high school grades, the rigor and quality of courses taken, and academic-related extracurricular activities. (Swail, 2003; Woodard, Mallory, & DeLuca, 2001)
1 NO
2
3
4
5 YES NA
432. We collect data on the academic abilities of our incoming students, such as aptitude, content knowledge, critical thinking ability, technological ability, study skills, learning skills, and time management. (Swail, 2003; Woodard, Mallory, & DeLuca, 2001)
1 NO
2
3
4
5 YES NA
433. We monitor students’ academic history and progress through a comprehensive and longitudinal tracking system that traces student activities and achievement from high school through degree completion and/or transfer. (Kuh, et. al., 2005; Swail, 2003; Voorhees, 2004)
1 NO
2
3
4
5 YES NA
434. We collect data on social factors impacting individual students. Specifically, we track students' pre-college status and progress through graduation using criteria such as financial issues / ability to pay, socioeconomic status, educational legacy, attitude toward learning, academic and extracurricular interests, social coping skills, purpose/goal commitment, family influence and support, peer influence, and social lifestyle. (Swail, 2003; Woodard, Mallory, & DeLuca, 2001)
1 NO
2
3
4
5 YES NA
435. Our tracking system is able to produce disaggregated reports on various populations on campus, including, but not limited to, students of color, Pell-eligible students, historically under-represented students, students from certain geographic areas, and other groups of interest to our institution. (Swail, 2006)
1 NO
2
3
4
5 YES NA
436. We analyze student data on an ongoing basis, enabling us to identify institutional trends and use this information in our strategic planning efforts. (Swail, 2003)
1 NO
2
3
4
5 YES NA
437. We analyze individual student data on an ongoing basis and use this information for counseling and advising for individual students and for

Educational Policy Institute Institutional Student Retention Assessment
Institutional Context I-39
targeting other academic and student services to individuals or groups.
438. We conduct exit interviews with students who decide to leave the institution and use the data to make changes. (Swail, 2006) 1
NO 2
3
4
5 YES NA
D5. HUMAN RESOURCES For each of the upcoming questions, please answer these supplementary questions. The online system will bring these up automatically. a) Please elaborate and describe.
c) Provide empirical or institutional evidence to support your rating. b) On a scale of 1 – 5, do you believe this strategy could/does support student success?
1 NO
2
3
4
5 YES
d) Do you believe this area requires improvement? 1 NO 5
YES e) If yes, what could be done to improve the effectiveness of this area? Table 37. Human Resources Please answer the following questions and elaborate through the supplementary questions.
1 NO
2
3
4
5 YES N/A
439. We recruit new faculty and staff whose values, educational philosophies, and pedagogical skills match up well with student needs and our institutional mission. (Kuh, et. al., 2005)
1 NO
2
3
4
5 YES N/A
440. A strong interest in helping students succeed is emphasized during the recruitment of staff and faculty. (Kuh, et. al., 2005) 1
NO 2
3
4
5 YES N/A
441. We are committed to recruit a diverse staff and faculty. (Kuh, et. al., 2005) 1 NO
2
3
4
5 YES N/A
442. New staff and faculty are oriented to the institutional mission, values, and our student-centered orientation. (Kuh, et. al., 2005) 1
NO 2
3
4
5 YES N/A
443. New staff and faculty are provided basic training in what they can do to help students succeed. Training may include information on engaging instructional strategies, student characteristics, and factors influencing retention, persistence, and success. (Kuh, et. al., 2005; Dietsche, 2006)
1 NO
2
3
4
5 YES N/A
444. We provide inservice training to our staff and faculty in what they can do to help students succeed. Inservice training may include instruction in engaging instructional strategies, authentic assessment strategies, student characteristics, and factors influencing retention, persistence, and success. (Kuh, et. al., 2005; Swail, 2003)
1 NO
2
3
4
5 YES N/A
445. Our personnel performance management system supports work and rewards staff who support student success initiatives. (Kuh, et. al., 2005; Swail, 2003)
1 NO
2
3
4
5 YES N/A
446. Our promotion and tenure policies award faculty for teaching and who are involved in other support student success initiatives. (Kuh, et. al., 2005;

Educational Policy Institute Institutional Student Retention Assessment
Institutional Context I-40
Swail, 2003)
SOURCES CITED
Baldridge National Quality Program. (2005). Education Criteria for Performance Excellence. Retrieved April 26, 2006, from: http://www.baldrige.nist.gov/PDF_files/2006_Education_Criteria.pdf. Dietsche, Peter. (2006). The Campus Audit: Understanding Your Campus. Presentation at the Spring ’06 Retention Retreat, Tucson, Arizona, March 20, 2006. Retrieved April 26, 2006, from: http://www.studentretention.org/RetentionRetreatPPT/TAB7.3_CampusAudit.pdf. Kuh, George D., Kinzie, Jillian, Schuh, John H., Whitt, Elizabeth J., and Associates. (2005). Student Success in College: Creating Conditions that Matter. Washington, D.C.: Jossey-Bass. Swail, Watson S. (2006). “Seven Guiding Questions for Student Retention.” Student Success. January 2006 issue. Virginia Beach, VA: Educational Policy Institute. Retrieved May 16, 2006, from: http://www.educationalpolicy.org/success0601/0601_Success.pdf. Swail, Watson S., Redd, Kenneth E., & Perna, Laura W. (2003). Retaining Minority Students in Higher Education: A Framework for Success. ASHE-ERIC Higher Education Report: Vol. 30, No. 2. San Francisco, CA: Wiley Periodicals, Inc. Voorhees, Richard. (2004). Framework: Retention Audit. Paper prepared for the Educational Policy Institute. Stafford, VA.
Educational Policy Institute Institutional Student Retention Assessment
Part II: The Institutional Student Retention Assessment II-1
Section II: Recruitment & Admissions

Educational Policy Institute Institutional Student Retention Assessment
Recruitment and Admissions II-2
TABLE OF CONTENTS
SECTION II: Recruitment and Admissions ....................................................................................................... 4 Instructions ....................................................................................................................................................... 4
PART A. Strategic Framework ........................................................................................................................... 5 A1. Mission ....................................................................................................................................................... 5 A2. Goals & Objectives .................................................................................................................................... 5 A3. Policy & Practice ........................................................................................................................................ 6 A4. Assessment & Evaluation .......................................................................................................................... 7
PART B: Student Recruitment ........................................................................................................................... 8 B1. Strengths & Weaknesses ........................................................................................................................... 8 B2. School, College, and Community Relations and Outreach ........................................................................ 8 B3. Campus Visits and Involvement ............................................................................................................... 10 B4. Marketing & Communications .................................................................................................................. 10
PART C: Admissions ........................................................................................................................................ 12 C1. Strengths & Weaknesses......................................................................................................................... 12 C2. Admissions Requirements & Selection Criteria ........................................................................................ 12
PART D: Student Orientation ........................................................................................................................... 14 D1. Strengths & Weaknesses......................................................................................................................... 14 D2. Orientation Events ................................................................................................................................... 15 D3. First-Year Experience .............................................................................................................................. 16 D5. Marketing and Communications .............................................................................................................. 17
SOURCES .......................................................................................................................................................... 18

Educational Policy Institute Institutional Student Retention Assessment
Recruitment and Admissions II-3
TABLE OF TABLES Table 1. Institutional Mission ................................................................................................................................ 5 Table 2. Institutional Goals and Objectives ........................................................................................................... 5 Table 3. Institutional Policy & Practice .................................................................................................................. 6 Table 4. Institutional Assessment & Evaluation .................................................................................................... 7 Table 5. School, College, and Community Relations and Outreach ..................................................................... 8 Table 6. Campus Visits and Involvement ............................................................................................................ 10 Table 7. Marketing & Communications ............................................................................................................... 10 Table 8. Admissions Requirements & Selection Criteria ..................................................................................... 12 Table 9. Orientation Events ................................................................................................................................ 15 Table 10. First-Year Experience ......................................................................................................................... 16 Table 11. Marketing and Communications ......................................................................................................... 17

Educational Policy Institute Institutional Student Retention Assessment
Recruitment and Admissions II-4
SECTION II: RECRUITMENT AND ADMISSIONS “The development of enrollment management programs in recent years has empowered the recruitment and admissions staff on many campuses. From an institutional perspective, how an institution “chooses” its prospective students and what financial aid it offers is the crux of institutional business. Institutions must be cognizant of the issue of institution-student fit, and at some point the business side must regress to allow for the personal side of the college connection. Ultimately, college is a service industry, and the student is the client.” (Swail, 2003, p. 96) INSTRUCTIONS This assessment provides your institution with an overview of what is already in place. We strongly recommend that you print each assessment section [link to printable assessment section] and use it as a discussion agenda with your team prior to entering data. Part of your team’s work will be to collect the required information as part of the assessment process. [add more detailed instructions about saving data, etc.]

Educational Policy Institute Institutional Student Retention Assessment
Recruitment and Admissions II-5
PART A. STRATEGIC FRAMEWORK A1. MISSION It is the mission of recruitment and admissions to identify and recruit students whose abilities and aspirations are closely matched to the institutional mission, goals, policies, and capabilities, and to facilitate the integration of incoming students into the cultural, intellectual, and social climate of the institution. (Miller, 2001; Swail, 2003; The Admissions Profession, 1995) 1. We have a mission statement for recruitment and admissions. __ Yes __ No If yes, please enter below your current mission statement for recruitment and admissions and respond to the following statements: Table 1. Institutional Mission 1
NO 2
3
4
5 YES N/A
2. Our mission statement is consistent with the mission and goals of our institution. (Miller, 2001)
1 NO
2
3
4
5 YES NA
3. Our mission statement is consistent with standards created by other professional organizations, including accrediting organizations. (e.g., the Professional Standards for Higher Education by the Council for the Advancement of Standards in Higher Education; NASFAA, NACAN, AACRAO, etc.).
1 NO
2
3
4
5 YES NA
4. Our mission statement focuses on student success. 1 NO
2
3
4
5 YES NA
5. Our mission is actively used to guide policy development and practical application.
1 NO
2
3
4
5 YES NA
6. Our staff is cognizant of the mission statement. 1 NO
2
3
4
5 YES NA
7. We disseminate, implement, and regularly review our mission statement. (Miller, 2001)
1 NO
2
3
4
5 YES NA
A2. GOALS & OBJECTIVES 8. We have goals and objectives for our recruitment and admissions program/department(s). __ Yes __ No If yes, please enter below the goals and objectives of your recruitment and admissions program/department(s).
Goal 1 (ADD Button)
Objective 1 (ADD Button)
If yes, please respond to the following statements: Table 2. Institutional Goals and Objectives 1
NO 2
3
4
5 YES
NA
9. Our goals and objectives are consistent with our mission statement for recruitment and admissions.
1 NO
2
3
4
5 YES NA
10. Our goals and objectives are consistent with standards created by other 1 2 3 4 5 NA

Educational Policy Institute Institutional Student Retention Assessment
Recruitment and Admissions II-6
professional organizations, including accrediting organizations. (e.g., the Professional Standards for Higher Education by the Council for the Advancement of Standards in Higher Education; NASFAA, NACAN, AACRAO, etc.).
NO YES
11. We disseminate, implement, and regularly review our goals and objectives. (Miller, 2001)
1 NO
2
3
4
5 YES NA
12. Our goals and objectives focus on student success. 1 NO
2
3
4
5 YES NA
13. Our goals and objectives are actively used to guide policy development and practical application.
1 NO
2
3
4
5 YES NA
14. Our staff is cognizant of the goals and objectives. 1 NO
2
3
4
5 YES NA
A3. POLICY & PRACTICE
For each of the upcoming questions, please answer these supplementary questions. The online system will bring these up automatically. a) Please elaborate and describe. c) Provide empirical or institutional evidence to support your rating. b) On a scale of 1 – 5, where 1 is “no, not at all,” 3 is “somewhat/average,” and 5 is “yes, very much so,” do you believe this strategy could/does support student success?
1 NO
2
3
4
5 YES
d) Do you believe this area requires improvement? 1 NO 5
YES e) If yes, what could be done to improve the effectiveness of this area? Table 3. Institutional Policy & Practice Please answer the following questions and elaborate through the supplementary questions.
1 NO
2
3
4
5 YES
NA
15. Our recruitment and admissions staff are well trained in their areas. 1 NO
2
3
4
5 YES NA
16. Our recruitment and admissions staff are well trained to serve a diverse set of people, including students and parents.
1 NO
2
3
4
5 YES NA
17. Our recruitment and admissions policies are shared with and easily and clearly understood by prospective students and their families. (The Admissions Profession, 1995)
1 NO
2
3
4
5 YES NA
18. Our recruitment and admissions policies are shared with and easily and clearly understood by high school and/or community college counselors, faculty, other personnel, and the general public. (The Admissions Profession, 1995)
1 NO
2
3
4
5 YES NA
19. Our recruitment and admissions policies are well articulated to all other departments, faculty, and staff throughout the campus
1 NO
2
3
4
5 YES NA
20. Our recruitment and admissions policies were cooperatively developed by staff, administrators, and faculty. (The Admissions Profession, 1995)
1 NO
2
3
4
5 YES NA
21. Our recruitment and admissions policies are consistent with statements of good practices articulated by relevant and appropriate professional associations, such as the National Association for College Admission Counseling (NACAC).
1 NO
2
3
4
5 YES NA
22. Our recruitment and admissions policies emphasize the protection of the best interests of all students as a primary concern in the recruitment and admissions process.
1 NO
2
3
4
5 YES NA
23. Our recruitment and admissions policies promote and provide equal 1 2 3 4 5 NA
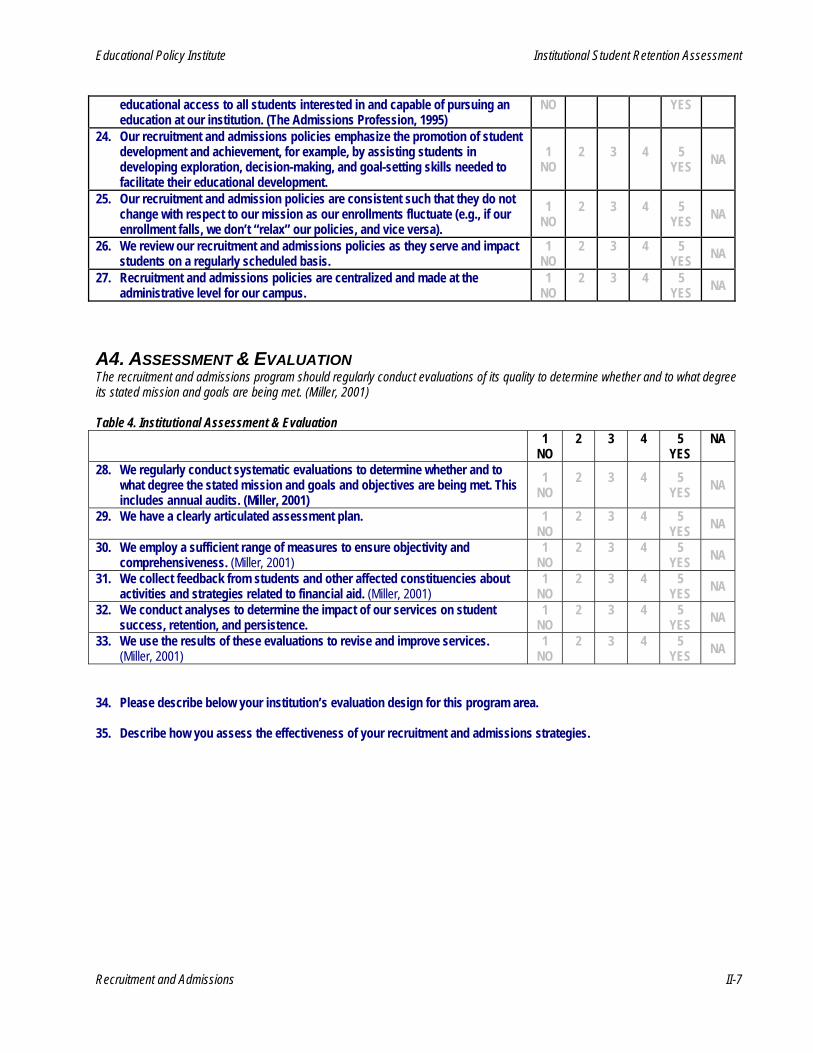
Educational Policy Institute Institutional Student Retention Assessment
Recruitment and Admissions II-7
educational access to all students interested in and capable of pursuing an education at our institution. (The Admissions Profession, 1995)
NO YES
24. Our recruitment and admissions policies emphasize the promotion of student development and achievement, for example, by assisting students in developing exploration, decision-making, and goal-setting skills needed to facilitate their educational development.
1 NO
2
3
4
5 YES NA
25. Our recruitment and admission policies are consistent such that they do not change with respect to our mission as our enrollments fluctuate (e.g., if our enrollment falls, we don’t “relax” our policies, and vice versa).
1 NO
2
3
4
5 YES NA
26. We review our recruitment and admissions policies as they serve and impact students on a regularly scheduled basis.
1 NO
2
3
4
5 YES NA
27. Recruitment and admissions policies are centralized and made at the administrative level for our campus.
1 NO
2
3
4
5 YES NA
A4. ASSESSMENT & EVALUATION The recruitment and admissions program should regularly conduct evaluations of its quality to determine whether and to what degree its stated mission and goals are being met. (Miller, 2001) Table 4. Institutional Assessment & Evaluation 1
NO 2
3
4
5 YES
NA
28. We regularly conduct systematic evaluations to determine whether and to what degree the stated mission and goals and objectives are being met. This includes annual audits. (Miller, 2001)
1 NO
2
3
4
5 YES NA
29. We have a clearly articulated assessment plan. 1 NO
2
3
4
5 YES NA
30. We employ a sufficient range of measures to ensure objectivity and comprehensiveness. (Miller, 2001)
1 NO
2
3
4
5 YES NA
31. We collect feedback from students and other affected constituencies about activities and strategies related to financial aid. (Miller, 2001)
1 NO
2
3
4
5 YES NA
32. We conduct analyses to determine the impact of our services on student success, retention, and persistence.
1 NO
2
3
4
5 YES NA
33. We use the results of these evaluations to revise and improve services. (Miller, 2001)
1 NO
2
3
4
5 YES NA
34. Please describe below your institution’s evaluation design for this program area. 35. Describe how you assess the effectiveness of your recruitment and admissions strategies.

Educational Policy Institute Institutional Student Retention Assessment
Recruitment and Admissions II-8
PART B: STUDENT RECRUITMENT B1. STRENGTHS & WEAKNESSES 36. Please describe below your institution’s main strategies/practices in this area.
Strategy 1
(ADD button) 37. Please describe below the strategies/practices that you believe have most effectively supported the
learning/development/success of students.
Success Strategy 1
Description of Strategy
Evidence of Success
(ADD button) 38. Please describe the challenges or areas of weakness of which you are aware along with potential solutions or
strategies to ameliorate these issues.
Challenge 1
Evidence
Solution Strategy
(ADD button)
B2. SCHOOL, COLLEGE, AND COMMUNITY RELATIONS AND OUTREACH For each of the upcoming questions, please answer these supplementary questions. The online system will bring these up automatically. a) Please elaborate and describe. c) Provide empirical or institutional evidence to support your rating. b) On a scale of 1 – 5, where 1 is “no, not at all,” 3 is “somewhat/average,” and 5 is “yes, very much so,” do you believe this strategy could/does support student success?
1 NO
2
3
4
5 YES
d) Do you believe this area requires improvement? 1 NO 5
YES e) If yes, what could be done to improve the effectiveness of this area? Table 5. School, College, and Community Relations and Outreach Please answer the following questions and elaborate through the supplementary questions.
1 NO
2
3
4
5 YES
NA
39. Our institution uses a program advisory committee for recruitment/admissions.
1 NO
2
3
4
5 YES NA

Educational Policy Institute Institutional Student Retention Assessment
Recruitment and Admissions II-9
40. The articulation agreement between institutions (e.g., two- and four-year) in our region allows for a seamless transfer for students. (The Admissions Profession, 1995)
1 NO
2
3
4
5 YES NA
41. We cultivate relationships with community organizations, associations, and businesses to identify and recruit adult and/or nontraditional students. (The Admissions Profession, 1995)
1 NO
2
3
4
5 YES NA
42. Our staff maintains current information about local high schools and/or community colleges, including community demographics, socioeconomic composition of student body, and percentage enrolling in postsecondary education. (The Admissions Profession, 1995)
1 NO
2
3
4
5 YES NA
43. Our recruitment staff maintains active and ongoing relationships with high school counselors and others who counsel students on college selection.
1 NO
2
3
4
5 YES NA
44. We coordinate recruitment with alumni associations to identify prospective students. (Swail, 2003)
1 NO
2
3
4
5 YES NA
45. Our recruitment staff speaks accurately and comprehensively in presenting our institution to counseling staff, potential students, and their families, including clearly stating admission requirements and informing these constituencies about any changes made to admission requirements. (The Admissions Profession, 1995)
1 NO
2
3
4
5 YES NA
46. Our recruitment staff clearly and accurately inform constituencies of all deadlines for admissions, student aid, and housing.
1 NO
2
3
4
5 YES NA
47. Our recruitment staff provide accurate information about the role and use of standardized testing in the admissions process. (The Admissions Profession, 1995)
1 NO
2
3
4
5 YES NA
48. We have a procedure in place for high school and college visits, which includes identification of schools, initial contact, scheduling or rescheduling of visits, follow up on concerns raised during visit, notes of appreciation, et cetera. (The Admissions Profession, 1995)
1 NO
2
3
4
5 YES NA
49. We provide information to high school and/or community college counselors on the academic progress of their former students. (The Admissions Profession, 1995)
1 NO
2
3
4
5 YES NA
50. We provide information to high school and/or community college counselors regarding changes in curriculum, courses or programs, or cost increases. (The Admissions Profession, 1995)
1 NO
2
3
4
5 YES NA
51. We collaborate with pre-college programs inside and outside our institution to identify prospective recruits. (Swail, 2003)
1 NO
2
3
4
5 YES NA
52. We furnish data on the profile of our currently enrolled freshman class (aggregated) to high school counselors and prospective students. This profile includes information that helps students compare their academic credentials with those of currently enrolled students and serves as a guideline for high school counselors for advising their students in making college choices. (The Admissions Profession, 1995)
1 NO
2
3
4
5 YES NA
53. Our institution is part of a cooperative effort by local institutions of higher education, high schools, and community colleges to organize college night programs and other recruitment events. (The Admissions Profession, 1995)
1 NO
2
3
4
5 YES NA
54. We have established and implemented plans to recruit students from specific target populations (e.g. traditionally under-represented groups). (The Admissions Profession, 1995; Swail, 2003)
1 NO
2
3
4
5 YES NA
55. We subscribe to and support the ethical statements of AACRAO and other organizations that address ethical practices in the recruitment of students. (The Admissions Profession, 1995)
1 NO
2
3
4
5 YES NA
56. If we use student referral services, we are fully informed about the quality and reputation of these services. (The Admissions Profession, 1995)
1 NO
2
3
4
5 YES NA

Educational Policy Institute Institutional Student Retention Assessment
Recruitment and Admissions II-10
B3. CAMPUS VISITS AND INVOLVEMENT Table 6. Campus Visits and Involvement Please answer the following questions and elaborate through the supplementary questions.
1 NO
2
3
4
5 YES
NA
57. We conduct on-campus visits for potential students and their families. The visits minimally include an orientation to the institution’s physical resources, including student residences, and to faculty, staff, and other students whose services might be of interest to them. (The Admissions Profession, 1995)
1 NO
2
3
4
5 YES NA
58. We conduct on-campus orientation activities for counselors and teachers from local secondary schools and pre-college programs. (Swail, 2003)
1 NO
2
3
4
5 YES NA
59. We involve federal work-study students, graduate assistants, and other student personnel on college recruitment teams to inform middle and high school students of the academic, social, and financial requirements for college participation. (Swail, 2003)
1 NO
2
3
4
5 YES NA
60. We involve faculty, staff, administrators, and alumni in campus visits to provide potential students with firsthand knowledge of their expertise and to begin the acculturation process to our institutional mission, culture, and values. (The Admissions Profession, 1995)
1 NO
2
3
4
5 YES NA
61. We train all participating staff, faculty, administrators, alumni, and students in the following areas: admission requirements; financial aid; academic and co-curricular programs; and composition of the student body. (The Admissions Profession,1995)
1 NO
2
3
4
5 YES NA
62. We ensure that special constituencies (e.g., students with disabilities) are appropriately considered and served during campus visits. (The Admissions Profession, 1995)
1 NO
2
3
4
5 YES NA
63. We have literature available for potential students who drop in for a campus visit to guide them through a successful experience. (The Admissions Profession, 1995)
1 NO
2
3
4
5 YES NA
64. We follow up with potential students following their campus visit. (The Admissions Profession, 1995)
1 NO
2
3
4
5 YES NA
B4. MARKETING & COMMUNICATIONS Table 7. Marketing & Communications Please answer the following questions and elaborate through the supplementary questions.
1 NO
2
3
4
5 YES
NA
65. Our communications with students and families clearly and accurately state our admission policies and procedures, including requirements for secondary school preparation, admission tests, and transfer student admission. (The Admissions Profession, 1995)
1 NO
2
3
4
5 YES NA
66. Our communications includes an accurate and current admissions calendar and deadlines. (The Admissions Profession, 1995)
1 NO
2
3
4
5 YES NA
67. We communicate to potential students and their families through various media, including printed matter, in-person presentations, and electronic or web-based communications.
1 NO
2
3
4
5 YES NA
68. We communicate accurate information about costs, opportunities, and requirements for all types of financial aid, and we state the general relationship between admission policies and procedures and financial aid policies and procedures. (The Admissions Profession, 1995; Miller, 2001)
1 NO
2
3
4
5 YES NA
69. We communicate accurate information about the opportunities/selection for institutional housing, deadline dates for housing deposits and refunds, and the policies for renewal availability of institutional housing. (The Admissions
1 NO
2
3
4
5 YES NA

Educational Policy Institute Institutional Student Retention Assessment
Recruitment and Admissions II-11
Profession, 1995) 70. We communicate information about relevant special programs, including
credit by examination or advanced placement. (The Admissions Profession, 1995)
1 NO
2
3
4
5 YES NA
71. In our communication, we use current and accurate images and text descriptions of our campus and community. (The Admissions Profession, 1995)
1 NO
2
3
4
5 YES NA
72. We furnish data on the profile of our currently enrolled freshman class. (The Admissions Profession, 1995)
1 NO
2
3
4
5 YES NA
73. We provide information about the success of current students and former graduates.
1 NO
2
3
4
5 YES NA
74. We regularly assess the effectiveness of our marketing initiatives. 1 NO
2
3
4
5 YES NA

Educational Policy Institute Institutional Student Retention Assessment
Recruitment and Admissions II-12
PART C: ADMISSIONS C1. STRENGTHS & WEAKNESSES 75. Please describe below your institution’s main strategies/practices in this area.
Strategy 1
(ADD button) 76. Please describe below the strategies/practices that you believe have most effectively supported the
learning/development/success of students.
Success Strategy 1
Description of Strategy
Evidence of Success
(ADD button) 77. Please describe the challenges or areas of weakness of which you are aware along with potential solutions or
strategies to ameliorate these issues.
Challenge 1
Evidence
Solution Strategy
(ADD button) C2. ADMISSIONS REQUIREMENTS & SELECTION CRITERIA For each of the upcoming questions, please answer these supplementary questions. The online system will bring these up automatically. a) Please elaborate and describe. c) Provide empirical or institutional evidence to support your rating. b) On a scale of 1 – 5, where 1 is “no, not at all,” 3 is “somewhat/average,” and 5 is “yes, very much so,” do you believe this strategy could/does support student success?
1 NO
2
3
4
5 YES
d) Do you believe this area requires improvement? 1 NO 5
YES e) If yes, what could be done to improve the effectiveness of this area? Table 8. Admissions Requirements & Selection Criteria Please answer the following questions and elaborate through the supplementary questions.
1 NO
2
3
4
5 YES
NA
78. Our admission requirements, while consistently applied to all candidates, are flexible to ensure fairness and to allow for unusual circumstances. (The Admissions Profession, 1995)
1 NO
2
3
4
5 YES NA
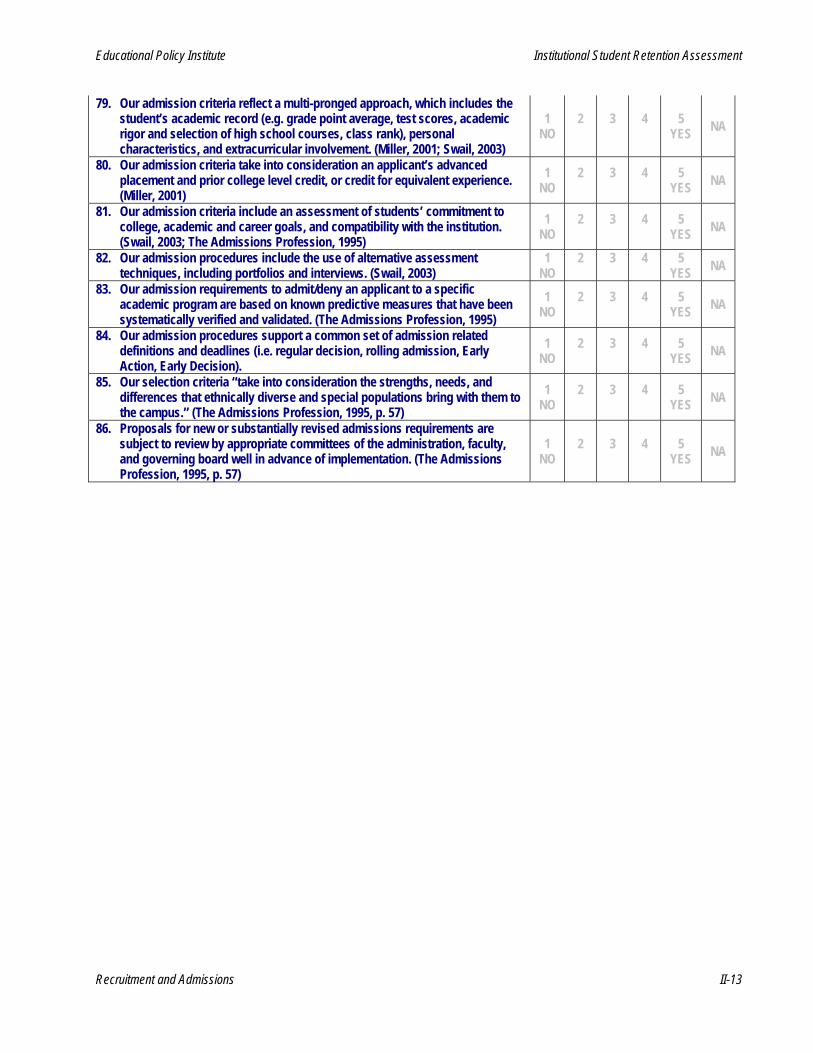
Educational Policy Institute Institutional Student Retention Assessment
Recruitment and Admissions II-13
79. Our admission criteria reflect a multi-pronged approach, which includes the student’s academic record (e.g. grade point average, test scores, academic rigor and selection of high school courses, class rank), personal characteristics, and extracurricular involvement. (Miller, 2001; Swail, 2003)
1 NO
2
3
4
5 YES NA
80. Our admission criteria take into consideration an applicant’s advanced placement and prior college level credit, or credit for equivalent experience. (Miller, 2001)
1 NO
2
3
4
5 YES NA
81. Our admission criteria include an assessment of students’ commitment to college, academic and career goals, and compatibility with the institution. (Swail, 2003; The Admissions Profession, 1995)
1 NO
2
3
4
5 YES NA
82. Our admission procedures include the use of alternative assessment techniques, including portfolios and interviews. (Swail, 2003)
1 NO
2
3
4
5 YES NA
83. Our admission requirements to admit/deny an applicant to a specific academic program are based on known predictive measures that have been systematically verified and validated. (The Admissions Profession, 1995)
1 NO
2
3
4
5 YES NA
84. Our admission procedures support a common set of admission related definitions and deadlines (i.e. regular decision, rolling admission, Early Action, Early Decision).
1 NO
2
3
4
5 YES NA
85. Our selection criteria “take into consideration the strengths, needs, and differences that ethnically diverse and special populations bring with them to the campus.” (The Admissions Profession, 1995, p. 57)
1 NO
2
3
4
5 YES NA
86. Proposals for new or substantially revised admissions requirements are subject to review by appropriate committees of the administration, faculty, and governing board well in advance of implementation. (The Admissions Profession, 1995, p. 57)
1 NO
2
3
4
5 YES NA
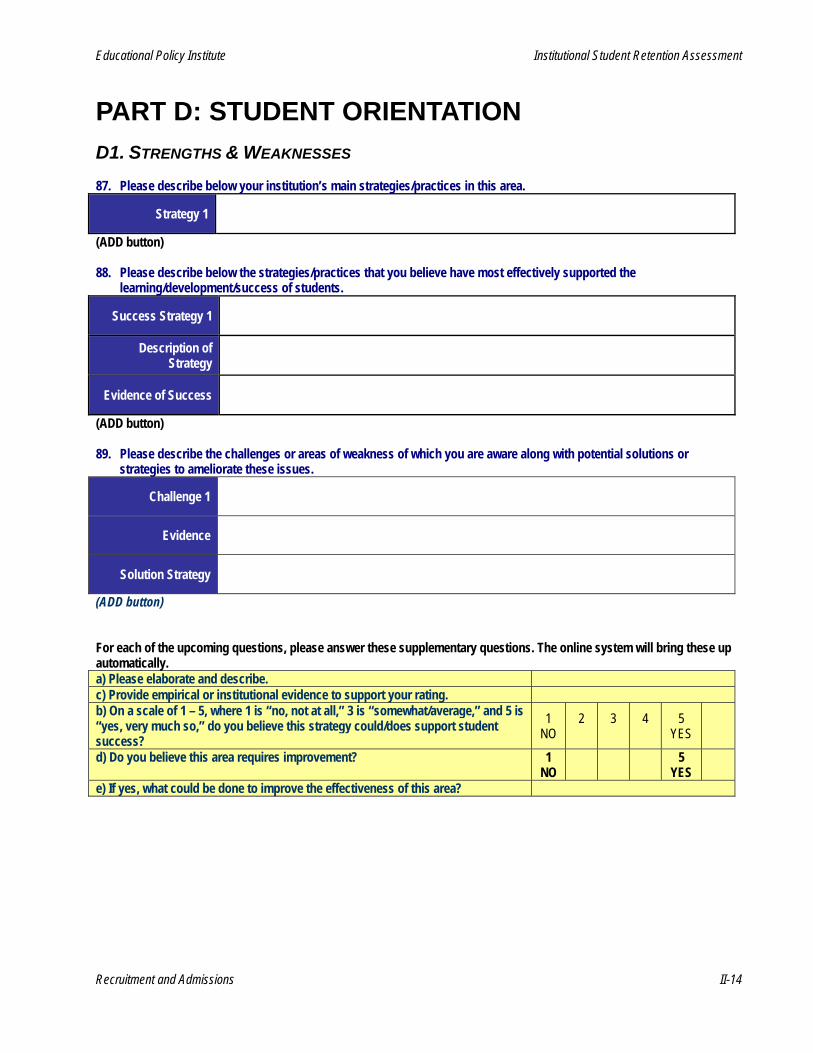
Educational Policy Institute Institutional Student Retention Assessment
Recruitment and Admissions II-14
PART D: STUDENT ORIENTATION D1. STRENGTHS & WEAKNESSES 87. Please describe below your institution’s main strategies/practices in this area.
Strategy 1
(ADD button) 88. Please describe below the strategies/practices that you believe have most effectively supported the
learning/development/success of students.
Success Strategy 1
Description of Strategy
Evidence of Success
(ADD button) 89. Please describe the challenges or areas of weakness of which you are aware along with potential solutions or
strategies to ameliorate these issues.
Challenge 1
Evidence
Solution Strategy
(ADD button) For each of the upcoming questions, please answer these supplementary questions. The online system will bring these up automatically. a) Please elaborate and describe. c) Provide empirical or institutional evidence to support your rating. b) On a scale of 1 – 5, where 1 is “no, not at all,” 3 is “somewhat/average,” and 5 is “yes, very much so,” do you believe this strategy could/does support student success?
1 NO
2
3
4
5 YES
d) Do you believe this area requires improvement? 1 NO 5
YES e) If yes, what could be done to improve the effectiveness of this area?

Educational Policy Institute Institutional Student Retention Assessment
Recruitment and Admissions II-15
D2. ORIENTATION EVENTS Table 9. Orientation Events Please answer the following questions and elaborate through the supplementary questions.
1 NO
2
3
4
5 YES
NA
90. Our orientation events are made available to all students new to our institution, including transfer students. (Miller, 2001)
1 NO
2
3
4
5 YES NA
91. Orientation events are mandatory for all new students, including transfer students.
1 NO
2
3
4
5 YES NA
92. Our orientation events are coordinated with the involvement of all departments and units on campus. (Miller, 2001; Swail, 2003)
1 NO
2
3
4
5 YES NA
93. Our orientation events include a physical orientation to the campus, including academic facilities, support services, co-curricular venues, and administrative offices.” (Miller, 2001, p. 222)
1 NO
2
3
4
5 YES NA
94. Our orientation events are a campus-wide effort, involving faculty, staff, administrators, students, and alumni. (Swail, 2003)
1 NO
2
3
4
5 YES NA
95. We orient all staff, faculty, administrators, alumni, and students to content covered during orientation events.
1 NO
2
3
4
5 YES NA
96. We treat first-year, transfer, and entering graduate students (if applicable) as distinct groups during the orientation process and plan separate events or special events/components for these groups. (Miller, 2001)
1 NO
2
3
4
5 YES NA
97. We pay attention to the special needs of sub-groups (e.g. adult learners, international students, students with disabilities) during the orientation process. (Miller, 2001; Kuh, et. al., 2005)
1 NO
2
3
4
5 YES NA
98. Our orientation events involve students’ primary support groups (e.g. parents, spouses). (Miller, 2001)
1 NO
2
3
4
5 YES NA
99. Orientation events expose students to the overall purpose of higher education and to the mission of our institution. (Miller, 2001)
1 NO
2
3
4
5 YES NA
100. Orientation events communicate the “roles, responsibilities, and expectations of faculty, staff, and students.” (Miller, 2001, p. 222)
1 NO
2
3
4
5 YES NA
101. Orientation events communicate our expectation of students, including financial obligations. (Miller, 2001)
1 NO
2
3
4
5 YES NA
102. Orientation events provide students with information about administrative and academic policies, procedures, and requirements. (Miller, 2001)
1 NO
2
3
4
5 YES NA
103. Orientation events provide opportunities for students to connect with and talk to faculty.
1 NO
2
3
4
5 YES NA
104. Our orientation events provide information about campus services and programs. (Miller, 2001)
1 NO
2
3
4
5 YES NA
105. Orientation includes assistance with course selection. (Miller, 2001) 1 NO
2
3
4
5 YES NA
106. Orientation includes assistance with placement examinations and other assessment tools.
1 NO
2
3
4
5 YES NA
107. We offer orientation events at satellite locations for non-local students. (Swail, 2003)
1 NO
2
3
4
5 YES NA
108. We use trained peer mentors/advisors as an integral aspect of orientation events.
1 NO
2
3
4
5 YES NA
109. We orient students to the campus culture, symbols, and history, including specific elements of campus language—words or terms that have special meaning on our campus.
1 NO
2
3
4
5 YES NA
110. We orient students on how to get involved in the life of the institution, including sharing specific tips on how students can link their campus involvement to success.
1 NO
2
3
4
5 YES NA
111. We have a first-year experience seminar or course available for new students 1 NO 5
YES

Educational Policy Institute Institutional Student Retention Assessment
Recruitment and Admissions II-16
112. We have a comprehensive first-year program available for students 1 NO 5
YES If the answer to either question Error! Reference source not found. or Error! Reference source not found. is “yes,” complete the questions below in D3. First-Year Experience.
D3. FIRST-YEAR EXPERIENCE Table 10. First-Year Experience Please answer the following questions and elaborate through the supplementary questions.
1 NO
2
3
4
5 YES
NA
113. We acculturate students to our institutional mission, values, and culture through our first-year experience program(s).
1 NO
2
3
4
5 YES NA
114. We acculturate students to the aims and meaning of higher education and the nature of scholarly work through our first-year experience program(s).
1 NO
2
3
4
5 YES NA
115. We orient students to academic expectations and requirements, codes of conduct, and the roles, responsibilities, and expectations of faculty and staff through our first-year experience program(s).. (Miller, 2005; Kuh, et. al., 2005)
1 NO
2
3
4
5 YES NA
116. We orient students to the campus and its resources and co-curricular opportunities through our first-year experience program(s).. (Kuh, et. al., 2005)
1 NO
2
3
4
5 YES NA
117. Our first-year experience curriculum includes comprehensive developmental skills as well as enhancement and enrichment activities.
1 NO
2
3
4
5 YES NA
118. We support students in their preparation for continuing study at our institution. (Swail, 2003)
1 NO
2
3
4
5 YES NA
119. We closely monitor the academic progress of all freshmen. 1 NO
2
3
4
5 YES NA
120. We offer the first-year experience to all freshmen. (Miller, 2001) 1 NO
2
3
4
5 YES NA
121. Our first-year experience is mandatory for all freshmen. (Miller, 2001) 1 NO
2
3
4
5 YES NA
122. Our first-year experience is mandatory for all transfer students. (Miller, 2001) 1 NO
2
3
4
5 YES NA
123. Our comprehensive first-year experience program includes tutoring, mentoring, and/or other supplementary instructional programs for students at academic risk. (Kuh, et. al., 2005)
1 NO
2
3
4
5 YES NA
124. First-year experience is a campus-wide effort that involves most departments and units on campus.
1 NO
2
3
4
5 YES NA
125. We orient all participating staff, faculty, administrators, alumni, and students to content covered during the first-year experience.
1 NO
2
3
4
5 YES NA
126. We pay attention to the special needs of sub-groups (e.g. adult learners, international students, students with disabilities) during the first-year experience. (Kuh, et. al., 2005)
1 NO
2
3
4
5 YES NA
127. We provide professional development to faculty who teach a first-year course in the developmental and other characteristics of entering first-year students and appropriate instructional strategies.
1 NO
2
3
4
5 YES NA
128. Faculty members leading first-year courses also serve as academic advisors. (Kuh, et. al., 2005)
1 NO
2
3
4
5 YES NA
129. Residential programs are aligned with the first-year program, with comprehensive academic, personal, and social support provided to freshmen living on campus.
1 NO
2
3
4
5 YES NA
130. We use trained peer mentors/advisors as an integral aspect of the first-year experience.
1 NO
2
3
4
5 YES NA

Educational Policy Institute Institutional Student Retention Assessment
Recruitment and Admissions II-17
D5. MARKETING AND COMMUNICATIONS Table 11. Marketing and Communications Please answer the following questions and elaborate through the supplementary questions.
1 NO
2
3
4
5 YES
NA
131. Our orientation communications are coordinated with related communications organized by all departments and units on campus. (Miller, 2001; Swail, 2003)
1 NO
2
3
4
5 YES NA
132. We personally provide information on all orientation activities with all new students and their families through various media, including telephone, printed matter, and electronic or web-based communications. (Miller, 2001; Swail, 2003)
1 NO
2
3
4
5 YES NA
133. Assistance with course selection, including making use of placement examinations and other assessment tools, is featured in our orientation communications. (Miller, 2001)
1 NO
2
3
4
5 YES NA
134. We treat first-year, transfer, and entering graduate students (if applicable) as distinct groups during the orientation process and plan separate communications for these groups. (Miller, 2001)
1 NO
2
3
4
5 YES NA
135. We pay attention to the special needs of sub-groups (e.g. adult learners, international students, students with disabilities) during the orientation process and plan separate communications for these groups. (Miller, 2001)
1 NO
2
3
4
5 YES NA
136. Orientation communications expose students to the overall purpose of higher education and to the mission of our institution. (Miller, 2001)
1 NO
2
3
4
5 YES NA
137. Orientation communications state the “roles, responsibilities, and expectations of faculty, staff, and students.” (Miller, 2001, p. 222)
1 NO
2
3
4
5 YES NA
138. Orientation communications state our expectation of students, including, but not limited to, financial obligations and conduct. (Miller, 2001)
1 NO
2
3
4
5 YES NA
139. Orientation communications provide students with information about administrative and academic policies, procedures, and requirements. (Miller, 2001)
1 NO
2
3
4
5 YES NA
140. Our orientation communications provide information about campus services and programs. (Miller, 2001)
1 NO
2
3
4
5 YES NA
Educational Policy Institute Institutional Student Retention Assessment
Recruitment and Admissions II-18
SOURCES
Kuh, George D., Kinzie, Jillian, Schuh, John H., Whitt, Elizabeth J., and Associates. (2005). Student Success in College: Creating Conditions that Matter. Washington, D.C.: Jossey-Bass. Miller, Theodore K., (2001). The CAS Book of Professional Standards for Higher Education 2001. Washington, DC: Council for the Advancement of Standards in Higher Education. Swail, Watson S., Redd, Kenneth E., & Perna, Laura W. (2003). Retaining Minority Students in Higher Education: A Framework for Success. ASHE-ERIC Higher Education Report: Vol. 30, No. 2. San Francisco, CA: Wiley Periodicals, Inc. The Admissions Profession: A Guide for Staff Development and Program Management. (1995). American Association of Collegiate Registrars and Admissions Officers, Washington, DC; National Association of College Admissions Counselors, Alexandria, VA.

Educational Policy Institute Institutional Student Retention Assessment
Part II: The Institutional Student Retention Assessment III-1
Section III: Financial Aid

Educational Policy Institute Institutional Student Retention Assessment
Financial Aid III-2
TABLE OF CONTENTS SECTION III: Financial Aid ................................................................................................................................. 3
Instructions ....................................................................................................................................................... 3
PART A. Strategic Framework ........................................................................................................................... 4 A1. Mission ....................................................................................................................................................... 4 A2. Goals & Objectives .................................................................................................................................... 4 A3. Policy & Practice ........................................................................................................................................ 5 A4. Assessment & Evaluation .......................................................................................................................... 6
PART B: Student Employment Programs ......................................................................................................... 8 B1. Strengths & Weaknesses ........................................................................................................................... 8 B2. Program Considerations ............................................................................................................................ 9
PART C: Financial Aid Counseling ................................................................................................................. 10 C1. Strengths & Weaknesses ........................................................................................................................ 10 C2. Program Considerations .......................................................................................................................... 11
PART D: Grant & Loan Programs .................................................................................................................... 12 D1. Strengths & Weaknesses ........................................................................................................................ 12 D2. Program Considerations .......................................................................................................................... 13
SOURCES .......................................................................................................................................................... 14
TABLE OF TABLES Table 1. Financial Aid Mission .............................................................................................................................. 4 Table 2. Financial Aid Goals and Objectives ........................................................................................................ 5 Table 3. Financial Aid Policy & Practice ............................................................................................................... 6 Table 4. Financial Aid Assessment & Evaluation .................................................................................................. 6 Table 5. Student Employment Programs .............................................................................................................. 9 Table 6. Financial Aid Counseling ...................................................................................................................... 11 Table 7. Financial Aid Grants & Loans ............................................................................................................... 13

Educational Policy Institute Institutional Student Retention Assessment
Financial Aid III-3
SECTION III: FINANCIAL AID “Financial aid is a critical part of the persistence puzzle. For students from low-income backgrounds . . . finances are a make-it or break-it issue. A strong financial aid office is often the sign of a well-oiled campus . . .” (Swail, 2003, 92)
INSTRUCTIONS This assessment provides your institution with an overview of what is already in place. We strongly recommend that you print each assessment section [link to printable assessment section] and use it as a discussion agenda with your team prior to entering data. Part of your team’s work will be to collect the required information as part of the assessment process.

Educational Policy Institute Institutional Student Retention Assessment
Financial Aid III-4
PART A. STRATEGIC FRAMEWORK
A1. MISSION The mission of the financial aid program focuses on service to students and stewardship of funds. The financial aid program should “develop, review and disseminate financial resources to students to help them in achieving their educational goals from pre-enrollment through graduation. Many aspects of financial aid are mandated by federal and state entities that define the parameters within which institutional programs must operate.” (Miller, 2001, p. 127) An institution’s financial aid program should be consistent with statements of good practices articulated by relevant and appropriate professional associations such as the National Association of Student Financial Aid Administrators and the Canadian Association of Student Financial Aid Administrators. 1. We have a mission statement for our financial aid program. __ Yes __ No If yes, enter your current mission statement below and respond to the following statements:
Table 1. Financial Aid Mission 1
NO 2
3
4
5 YES N/A
2. Our mission statement is consistent with the mission and goals of our institution. (Miller, 2001)
1 NO
2
3
4
5 YES NA
3. Our mission statement is consistent with standards created by other professional organizations, including accrediting organizations. (e.g., the Professional Standards for Higher Education by the Council for the Advancement of Standards in Higher Education; NASFAA, NACAN, AACRAO, etc.).
1 NO
2
3
4
5 YES NA
4. Our mission statement focuses on student success. 1 NO
2
3
4
5 YES NA
5. Our mission is actively used to guide policy development and practical application.
1 NO
2
3
4
5 YES NA
6. Our staff is cognizant of the mission statement. 1 NO
2
3
4
5 YES NA
7. We disseminate, implement, and regularly review our mission statement. (Miller, 2001)
1 NO
2
3
4
5 YES NA
A2. GOALS & OBJECTIVES 8. We have goals and objectives for our financial aid program/department. __ Yes __ No

Educational Policy Institute Institutional Student Retention Assessment
Financial Aid III-5
If yes, please enter below the goals and objectives of your financial aid program/department and respond to the following statements.
Goal 1 (ADD Button)
Objective 1 (ADD Button)
Table 2. Financial Aid Goals and Objectives 1
NO 2
3
4
5 YES
NA
9. Our goals and objectives are consistent with our mission statement for financial aid.
1 NO
2
3
4
5 YES NA
10. Our goals and objectives are consistent with standards created by other professional organizations, including accrediting organizations. (e.g., the Professional Standards for Higher Education by the Council for the Advancement of Standards in Higher Education; NASFAA, NACAN, AACRAO, etc.).
1 NO
2
3
4
5 YES NA
11. We disseminate, implement, and regularly review our goals and objectives. (Miller, 2001)
1 NO
2
3
4
5 YES NA
12. Our goals and objectives focus on student success. 1 NO
2
3
4
5 YES NA
13. Our goals and objectives are actively used to guide policy development and practical application.
1 NO
2
3
4
5 YES NA
14. Our staff is cognizant of the goals and objectives. 1 NO
2
3
4
5 YES NA
A3. POLICY & PRACTICE For each of the upcoming questions, please answer these supplementary questions. The online system will bring these up automatically. a) Please elaborate and describe.
c) Provide empirical or institutional evidence to support your rating. b) On a scale of 1 – 5, where 1 is “no, not at all,” 3 is “somewhat/average,” and 5 is “yes, very much so,” do you believe this strategy could/does support student success?
1 NO
2
3
4
5 YES
d) Do you believe this area requires improvement? 1 NO 5
YES e) If yes, what could be done to improve the effectiveness of this area?

Educational Policy Institute Institutional Student Retention Assessment
Financial Aid III-6
Table 3. Financial Aid Policy & Practice Please answer the following questions and elaborate through the supplementary questions.
1 NO
2
3
4
5 YES
NA
15. Our financial aid staff are well trained in the area of financial aid. 1 NO
2
3
4
5 YES NA
16. Our financial aid staff are well trained to serve a diverse set of people, including students and parents.
1 NO
2
3
4
5 YES NA
17. Financial aid information is communicated to students and their families in a timely and appropriate manner.
1 NO
2
3
4
5 YES NA
18. The location, hours, and counseling procedures for the financial aid office are well articulated and disseminated.
1 NO
2
3
4
5 YES NA
19. The services provided by a private lender, guarantor, or external company to students are effective.
1 NO
2
3
4
5 YES NA
20. Our policies and practices are well articulated to all other departments, faculty, and staff throughout the campus.
1 NO
2
3
4
5 YES NA
21. Deadlines and procedures for submitting applications for each financial aid program are well articulated and disseminated.
1 NO
2
3
4
5 YES NA
22. The schools policy on how aid is packaged is fair for all students, especially those who have financial need.
1 NO
2
3
4
5 YES NA
23. Our process for appealing financial aid decisions is well articulated and disseminated.
1 NO
2
3
4
5 YES NA
24. We review our financial aid policies as they serve and impact students on a regularly scheduled basis.
1 NO
2
3
4
5 YES NA
25. Financial aid policy is centralized and made at the administrative level for our campus.
1 NO
2
3
4
5 YES NA
26. The financial aid staff and leadership are key participants in the development of campus aid policy.
1 NO
2
3
4
5 YES NA
A4. ASSESSMENT & EVALUATION The financial aid program should regularly conduct evaluations of its quality to determine whether and to what degree its stated mission and goals are being met. (Miller, 2001) For each of the upcoming questions, please answer these supplementary questions. The online system will bring these up automatically. a) Please elaborate and describe.
c) Provide empirical or institutional evidence to support your rating. b) On a scale of 1 – 5, where 1 is “no, not at all,” 3 is “somewhat/average,” and 5 is “yes, very much so,” do you believe this strategy could/does support student success?
1 NO
2
3
4
5 YES
d) Do you believe this area requires improvement? 1 NO 5
YES e) If yes, what could be done to improve the effectiveness of this area? Table 4. Financial Aid Assessment & Evaluation Please answer the following questions and elaborate through the supplementary questions.
1 NO
2
3
4
5 YES
NA
27. We regularly conduct systematic evaluations to determine whether and to what degree the stated mission and goals and objectives are being met. This
1 NO
2
3
4
5 YES NA

Educational Policy Institute Institutional Student Retention Assessment
Financial Aid III-7
includes annual audits of the financial aid office (Miller, 2001)
28. We have a clearly articulated assessment plan. 1
NO 2
3
4
5 YES NA
29. We employ a sufficient range of measures to ensure objectivity and comprehensiveness. (Miller, 2001)
1 NO
2
3
4
5 YES NA
30. We collect feedback from students and other affected constituencies about activities and strategies related to financial aid. (Miller, 2001)
1 NO
2
3
4
5 YES NA
31. We conduct analyses to determine the impact of financial aid awards on student success, retention, and persistence
1 NO
2
3
4
5 YES NA
32. We use the results of these evaluations to revise and improve services. (Miller, 2001)
1 NO
2
3
4
5 YES NA
33. Please describe below your institution’s assessment/evaluation plan for financial aid. 34. Describe how you assess the effectiveness of financial aid packaging strategy.

Educational Policy Institute Institutional Student Retention Assessment
Financial Aid III-8
PART B: STUDENT EMPLOYMENT PROGRAMS Student employment programs may include work-study programs (federal, state, institutional), assistantships, summer employment, and other institutional programs or activities that employ students on or off campus. These programs can be an important part of a student’s college education . . . providing students with money, field experience, and, perhaps most important, network capabilities for future employment and research possibilities. (Swail, 2003)
B1. STRENGTHS & WEAKNESSES
35. Please describe below your institution’s main strategies/practices in this area.
Strategy 1
(ADD button) 36. Please describe below the strategies/practices that you believe have most effectively supported the
learning/development/success of students.
Success Strategy 1
Description of Strategy
Evidence of Success
(ADD button) 37. Please describe the challenges or areas of weakness of which you are aware along with potential solutions or
strategies to ameliorate these issues.
Challenge 1
Evidence
Solution Strategy
(ADD button)

Educational Policy Institute Institutional Student Retention Assessment
Financial Aid III-9
B2. PROGRAM CONSIDERATIONS For each of the upcoming questions, please answer these supplementary questions. The online system will bring these up automatically. a) Please elaborate and describe.
c) Provide empirical or institutional evidence to support your rating. b) On a scale of 1 – 5, where 1 is “no, not at all,” 3 is “somewhat/average,” and 5 is “yes, very much so,” do you believe this strategy could/does support student success?
1 NO
2
3
4
5 YES
d) Do you believe this area requires improvement? 1 NO 5
YES e) If yes, what could be done to improve the effectiveness of this area? Table 5. Student Employment Programs Please answer the following questions and elaborate through the supplementary questions.
1 NO
2
3
4
5 YES
NA
38. We clearly and accurately communicate procedures and deadlines for submitting applications for student employment programs.
1 NO
2
3
4
5 YES NA
39. We offer undergraduate employment opportunities in all academic departments. (Swail, 2003)
1 NO
2
3
4
5 YES NA
40. We restrict student employment opportunities to 15-25 hours per week for full-time undergraduates. (Swail, 2003)
1 NO
2
3
4
5 YES NA
41. We partner with local-area organizations to create enriching student employment opportunities for undergraduates.
1 NO
2
3
4
5 YES NA
42. We work to provide as much on-campus employment opportunities as possible to help students integrate and persist on campus. (Swail, 2003)
1 NO
2
3
4
5 YES NA

Educational Policy Institute Institutional Student Retention Assessment
Financial Aid III-10
PART C: FINANCIAL AID COUNSELING Financial aid counseling is the foundation for grants, loans, and work-study programs. Counseling allows campuses to reach out to families and students and offer a variety of avenues to finance college attendance. College financing is arguably one of the most important and costly endeavors a family may make, and financial aid staff must be cognizant of the burden these decisions place on families and provide excellent support for them during the decision-making process.” (Swail, 2003, p. 95)
C1. STRENGTHS & WEAKNESSES 43. Please describe below your institution’s main strategies/practices in this area.
Strategy 1
(ADD button) 44. Please describe below the strategies/practices that you believe have most effectively supported the
learning/development/success of students.
Success Strategy 1
Description of Strategy
Evidence of Success
(ADD button) 45. Please describe the challenges or areas of weakness of which you are aware along with potential solutions or
strategies to ameliorate these issues.
Challenge 1
Evidence
Solution Strategy
(ADD button)

Educational Policy Institute Institutional Student Retention Assessment
Financial Aid III-11
C2. PROGRAM CONSIDERATIONS For each of the upcoming questions, please answer these supplementary questions. The online system will bring these up automatically. a) Please elaborate and describe.
c) Provide empirical or institutional evidence to support your rating. b) On a scale of 1 – 5, where 1 is “no, not at all,” 3 is “somewhat/average,” and 5 is “yes, very much so,” do you believe this strategy could/does support student success?
1 NO
2
3
4
5 YES
d) Do you believe this area requires improvement? 1 NO 5
YES e) If yes, what could be done to improve the effectiveness of this area? Table 6. Financial Aid Counseling Please answer the following questions and elaborate through the supplementary questions.
1 NO
2
3
4
5 YES
NA
46. Our prospective students are well aware of our financial aid counseling services.
1 NO
2
3
4
5 YES NA
47. We ensure that our feeder high school and/or community college counselors are well aware of our financial counseling services. (Miller, 2001)
1 NO
2
3
4
5 YES NA
48. We effectively inform our feeder high school and/or community college counselors on how their students can locate and use our financial aid counseling services.
1 NO
2
3
4
5 YES
49. We provide an effective array of financial aid counseling services to all students, including distance learners, students at satellite campuses, part-time students, etc. (Miller, 2001)
1 NO
2
3
4
5 YES NA
50. We offer helpful and productive financial aid counseling using a variety of techniques appropriate to meet students’ needs, which may include individual, group, peer, computer, and video. (Miller, 2001)
1 NO
2
3
4
5 YES NA
51. Our financial aid counseling staff is well trained to respond to the unique needs of traditionally underserved and special student populations.
1 NO
2
3
4
5 YES NA
52. We provide useful financial literacy classes and counseling of sufficient quality to engage and enlighten students in these areas.
1 NO
2
3
4
5 YES NA
53. We provide accurate and easy to read information about our institution’s financing options to prospective students and their families. (Swail, 2003)
1 NO
2
3
4
5 YES NA
54. We effectively refer students and their families to additional sources of information. (Swail, 2003)
1 NO
2
3
4
5 YES NA
55. We ensure that prospective students and families receive information about financial aid prior to the cut-off dates for institutional and/or state aid. (Swail, 2003)
1 NO
2
3
4
5 YES NA
56. We successfully collaborate with financial management professionals to offer financial management seminars to students and families on an ongoing basis. (Swail, 2003)
1 NO
2
3
4
5 YES NA
57. We provide practical debt counseling services for students. 1 NO
2
3
4
5 YES NA

Educational Policy Institute Institutional Student Retention Assessment
Financial Aid III-12
PART D: GRANT & LOAN PROGRAMS
D1. STRENGTHS & WEAKNESSES 58. Please describe below your institution’s main strategies/practices in this area.
Strategy 1
(ADD button) 59. Please describe below the strategies/practices that you believe have most effectively supported the
learning/development/success of students.
Success Strategy 1
Description of Strategy
Evidence of Success
(ADD button) 60. Please describe the challenges or areas of weakness of which you are aware along with potential solutions or
strategies to ameliorate these issues.
Challenge 1
Evidence
Solution Strategy
(ADD button)

Educational Policy Institute Institutional Student Retention Assessment
Financial Aid III-13
D2. PROGRAM CONSIDERATIONS For each of the upcoming questions, please answer these supplementary questions. The online system will bring these up automatically. a) Please elaborate and describe.
c) Provide empirical or institutional evidence to support your rating. b) On a scale of 1 – 5, where 1 is “no, not at all,” 3 is “somewhat/average,” and 5 is “yes, very much so,” do you believe this strategy could/does support student success?
1 NO
2
3
4
5 YES
d) Do you believe this area requires improvement? 1 NO 5
YES e) If yes, what could be done to improve the effectiveness of this area? Table 7. Financial Aid Grants & Loans Please answer the following questions and elaborate through the supplementary questions.
1 NO
2
3
4
5 YES
NA
61. We clearly and accurately communicate procedures and deadlines for submitting applications for grants and loans.
1 NO
2
3
4
5 YES NA
62. We maximize the availability of need-based aid vs. merit-based aid. 1 NO
2
3
4
5 YES NA
63. We seek and secure additional sources of grant aid through the private sector. (Swail, 2003)
1 NO
2
3
4
5 YES NA
64. We ensure that funds are available to provide emergency grants and/or loans to students as required. (Swail, 2003)
1 NO
2
3
4
5 YES NA
65. We provide valuable counseling on a regular basis (e.g., semester; annual) to students about their financial obligations. (Swail, 2003)
1 NO
2
3
4
5 YES NA
66. We provide valuable counseling on a regular basis (e.g., semester; annual) to families about their financial obligations. (Swail, 2003)
1 NO
2
3
4
5 YES NA
67. We educate students about the potential importance and role of loans in pursuing their education and career goals. (Swail, 2003)
1 NO
2
3
4
5 YES NA
68. We streamline bureaucracy and forms (within our authority) to simplify the loan application process. (Swail, 2003)
1 NO
2
3
4
5 YES NA
69. We integrate mandatory career development with student borrowing. (Swail, 2003)
1 NO
2
3
4
5 YES NA
70. We offer/provide private-market loans to students in collaboration with a bank or financial agency.
1 NO
2
3
4
5 YES NA

Educational Policy Institute Institutional Student Retention Assessment
Financial Aid III-14
SOURCES Miller, Theodore K., (2001). The CAS Book of Professional Standards for Higher Education 2001. Washington, DC: Council for the Advancement of Standards in Higher Education. National Association of Student Financial Aid Administrators. (1999). Statement of Ethical Principles. Retrieved April 23, 2006, from: www.nasfaa.org/annualpubs/NEthical599.html. Swail, Watson S., Redd, Kenneth E., & Perna, Laura W. (2003). Retaining Minority Students in Higher Education: A Framework for Success. ASHE-ERIC Higher Education Report: Vol. 30, No. 2. San Francisco, CA: Wiley Periodicals, Inc. US Department of Education, Federal Student Aid. (2006). Funding Education Beyond High School: The Guide to Federal Student Aid. Retrieved April 23, 2006, from: http://studentaid.ed.gov/students/publications/student_guide/2006-2007/index.html.
Educational Policy Institute Institutional Student Retention Assessment
Part II: The Institutional Student Retention Assessment IV-1
Section IV: Student Services

Educational Policy Institute Institutional Student Retention Assessment
Student Services IV-2
TABLE OF CONTENTS
SECTION IV. Student Services .......................................................................................................................... 4 Instructions ....................................................................................................................................................... 4
PART A. Strategic Framework ........................................................................................................................... 5 A1. Mission ....................................................................................................................................................... 5 A2. Goals & Objectives .................................................................................................................................... 6 A3. Policy & Practice ........................................................................................................................................ 6 A4. Assessment & Evaluation .......................................................................................................................... 7
PART B: Housing & Residential Life Program ................................................................................................. 9 B1. Strengths & Weaknesses ........................................................................................................................... 9 B2. On- and Off-Campus Residential Facilities ................................................................................................ 9 B3. Residential Activities for Students ............................................................................................................ 11 B4. Food Services .......................................................................................................................................... 12
PART C. Commuter Student Services ............................................................................................................ 13 C1. Strengths & Weaknesses ........................................................................................................................ 13 C2. Student Transportation ............................................................................................................................ 13 C3. Access to Campus Information, Services, and Processes ....................................................................... 14 C4. Provision of Adequate Free-Time Facilities on Campus .......................................................................... 15 C5. Provision of Academic and Co-Curricular Programs ................................................................................ 15
PART D. Counseling Services ......................................................................................................................... 17 D1. Strengths & Weaknesses ........................................................................................................................ 17 D2. Counseling Outreach and Consultation for the Campus Community ....................................................... 18
PART E: Campus Activities & Climate ............................................................................................................ 20 E1. Strengths & Weaknesses ......................................................................................................................... 20 E2. Campus Activities .................................................................................................................................... 21 E3. Campus Climate ...................................................................................................................................... 22 E4. Campus Safety ........................................................................................................................................ 22
PART F: Student Health ................................................................................................................................... 24 F1. Strengths & Weaknesses ......................................................................................................................... 24 F2. Health Support Activities & Facilities ........................................................................................................ 25
SOURCES CITED .............................................................................................................................................. 26

Educational Policy Institute Institutional Student Retention Assessment
Student Services IV-3
Table of Tables
Table 1. Student Services Mission........................................................................................................................ 5 Table 2. Student Services Goals and Objectives .................................................................................................. 6 Table 3. Student Services Policy & Practice ......................................................................................................... 6 Table 4. Student Services Assessment & Evaluation ........................................................................................... 7 Table 5. Student Services Residential Facilities ................................................................................................... 9 Table 6. Student Services Residential Activities ................................................................................................. 11 Table 7. Student Services Food Services ........................................................................................................... 12 Table 8. Student Services Transportation ........................................................................................................... 13 Table 9. Student Services Campus Information & Services ............................................................................... 14 Table 10. Student Services Free-Time Facilities ................................................................................................ 15 Table 11. Student Services Academic and Co-Curricular Programs .................................................................. 15 Table 12. Student Services Counseling Outreach .............................................................................................. 18 Table 13. Student Services Campus Activities ................................................................................................... 21 Table 14. Student Services Campus Climate ..................................................................................................... 22 Table 15. Student Services Campus Safety ....................................................................................................... 22 Table 16. Student Services Health Support ........................................................................................................ 25

Educational Policy Institute Institutional Student Retention Assessment
Student Services IV-4
SECTION IV. STUDENT SERVICES “. . . students’ “social integration” with the institution is an important factor in their ability to persist. The role of the student services office has evolved to deal with many of the issues facing students on campus. The atmosphere and climate of the [campus], reflected by how the institution treats and supports students and by the positive nature of peer relations on campus, is important to the self-esteem and confidence a student generates.” (Swail, 2003, p. 107)
INSTRUCTIONS This assessment provides your institution with an overview of what is already in place. We strongly recommend that you print each assessment section [link to printable assessment section] and use it as a discussion agenda with your team prior to entering data. Part of your team’s work will be to collect the required information as part of the assessment process. [add more detailed instructions about saving data, etc.]

Educational Policy Institute Institutional Student Retention Assessment
Student Services IV-5
PART A. STRATEGIC FRAMEWORK A1. MISSION Student services are an integral part of the educational purpose of the institution. Its mission must include the provision of student-centered activities and services that address the needs of an institution’s students, supports their learning and development, and contributes to their success at the institution. Its mission statement should be consistent with the mission and goals of the institution and with the Professional Standards for Higher Education as established by the Council for the Advancement of Standards in Higher Education or an appropriate accrediting agency. 1. We have a mission statement for our student services. __ Yes __ No If yes, please enter below your current mission statement for your student services and respond to the following statements. Table 1. Student Services Mission 1
NO 2
3
4
5 YES N/A
2. Our mission statement is consistent with the mission and goals of our institution. (Miller, 2001)
1 NO
2
3
4
5 YES NA
3. Our mission statement is consistent with standards created by other professional organizations, including accrediting organizations (e.g., the Professional Standards for Higher Education by the Council for the Advancement of Standards in Higher Education; NASFAA, NACAN, AACRAO, etc.).
1 NO
2
3
4
5 YES NA
4. Our mission statement focuses on student success. 1 NO
2
3
4
5 YES NA
5. Our mission is actively used to guide policy development and practical application.
1 NO
2
3
4
5 YES NA
6. Our staff is cognizant of the mission statement. 1 NO
2
3
4
5 YES NA
7. We disseminate, implement, and regularly review our mission statement. (Miller, 2001)
1 NO
2
3
4
5 YES NA

Educational Policy Institute Institutional Student Retention Assessment
Student Services IV-6
A2. GOALS & OBJECTIVES 8. We have goals and objectives for our student services program. __ Yes __ No If yes, please enter below the goals and objectives of your financial aid program/department and respond to the following statements.
Goal 1 (ADD Button)
Objective 1 (ADD Button)
Table 2. Student Services Goals and Objectives 1
NO 2
3
4
5 YES
NA
9. Our goals and objectives are consistent with our mission statement for financial aid.
1 NO
2
3
4
5 YES NA
10. Our goals and objectives are consistent with standards created by other professional organizations, including accrediting organizations (e.g., the Professional Standards for Higher Education by the Council for the Advancement of Standards in Higher Education; NASFAA, NACAN, AACRAO, etc.).
1 NO
2
3
4
5 YES NA
11. We disseminate, implement, and regularly review our goals and objectives. (Miller, 2001)
1 NO
2
3
4
5 YES NA
12. Our goals and objectives focus on student success. 1 NO
2
3
4
5 YES NA
13. Our goals and objectives are actively used to guide policy development and practical application.
1 NO
2
3
4
5 YES NA
14. Our staff is cognizant of the goals and objectives. 1 NO
2
3
4
5 YES NA
A3. POLICY & PRACTICE For each of the upcoming questions, please answer these supplementary questions. The online system will bring these up automatically. a) Please elaborate and describe.
c) Provide empirical or institutional evidence to support your rating. b) On a scale of 1 – 5, where 1 is “no, not at all,” 3 is “somewhat/average,” and 5 is “yes, very much so,” do you believe this strategy could/does support student success?
1 NO
2
3
4
5 YES
d) Do you believe this area requires improvement? 1 NO 5
YES e) If yes, what could be done to improve the effectiveness of this area? Table 3. Student Services Policy & Practice Please answer the following questions and elaborate through the supplementary questions.
1 NO
2
3
4
5 YES
NA
15. Our student services staff is well trained in the various areas of their 1 2 3 4 5 NA

Educational Policy Institute Institutional Student Retention Assessment
Student Services IV-7
discipline (e.g., housing, transportation, safety). NO YES 16. Our student services staff is well trained to serve a diverse set of people,
including students and parents. 1
NO 2
3
4
5 YES NA
17. Student services information is communicated to students and their families in a timely and appropriate manner.
1 NO
2
3
4
5 YES NA
18. The location, hours, and counseling procedures for the student services are well articulated and disseminated.
1 NO
2
3
4
5 YES NA
19. Our policies and practices are well articulated to all other departments, faculty, and staff throughout the campus.
1 NO
2
3
4
5 YES NA
20. Our student services policies are shared with and easily and clearly understood by prospective students and their families. (The Admissions Profession, 1995)
1 NO
2
3
4
5 YES NA
21. Our student services policies are shared with and easily and clearly understood by high school and/or community college counselors, faculty, other personnel, and the general public. (The Admissions Profession, 1995)
1 NO
2
3
4
5 YES NA
22. Our student services policies were cooperatively developed by staff, administrators, and faculty. (The Admissions Profession, 1995)
1 NO
2
3
4
5 YES NA
23. Our student services policies are consistent with statements of good practices articulated by relevant and appropriate professional associations.
1 NO
2
3
4
5 YES NA
24. Our student services policies emphasize the protection of the best interests of all students as a primary concern in the recruitment and admissions process.
1 NO
2
3
4
5 YES NA
25. Our student services policies promote and provide equal educational access to all students interested in and capable of pursuing an education at our institution. (The Admissions Profession, 1995)
1 NO
2
3
4
5 YES NA
26. We review our student services policies as they serve and impact students on a regularly scheduled basis.
1 NO
2
3
4
5 YES NA
A4. ASSESSMENT & EVALUATION For each of the upcoming questions, please answer these supplementary questions. The online system will bring these up automatically. a) Please elaborate and describe.
c) Provide empirical or institutional evidence to support your rating. b) On a scale of 1 – 5, where 1 is “no, not at all,” 3 is “somewhat/average,” and 5 is “yes, very much so,” do you believe this strategy could/does support student success?
1 NO
2
3
4
5 YES
d) Do you believe this area requires improvement? 1 NO 5
YES e) If yes, what could be done to improve the effectiveness of this area? Table 4. Student Services Assessment & Evaluation Please answer the following questions and elaborate through the supplementary questions.
1 NO
2
3
4
5 YES
NA
27. We regularly conduct systematic evaluations to determine whether and to what degree the stated mission and goals and objectives are being met. This includes annual audits of the student services office(s). (Miller, 2001)
1 NO
2
3
4
5 YES NA
28. We have a clearly articulated assessment plan. 1
NO 2
3
4
5 YES NA
29. We employ a sufficient range of measures to ensure objectivity and 1 2 3 4 5 NA
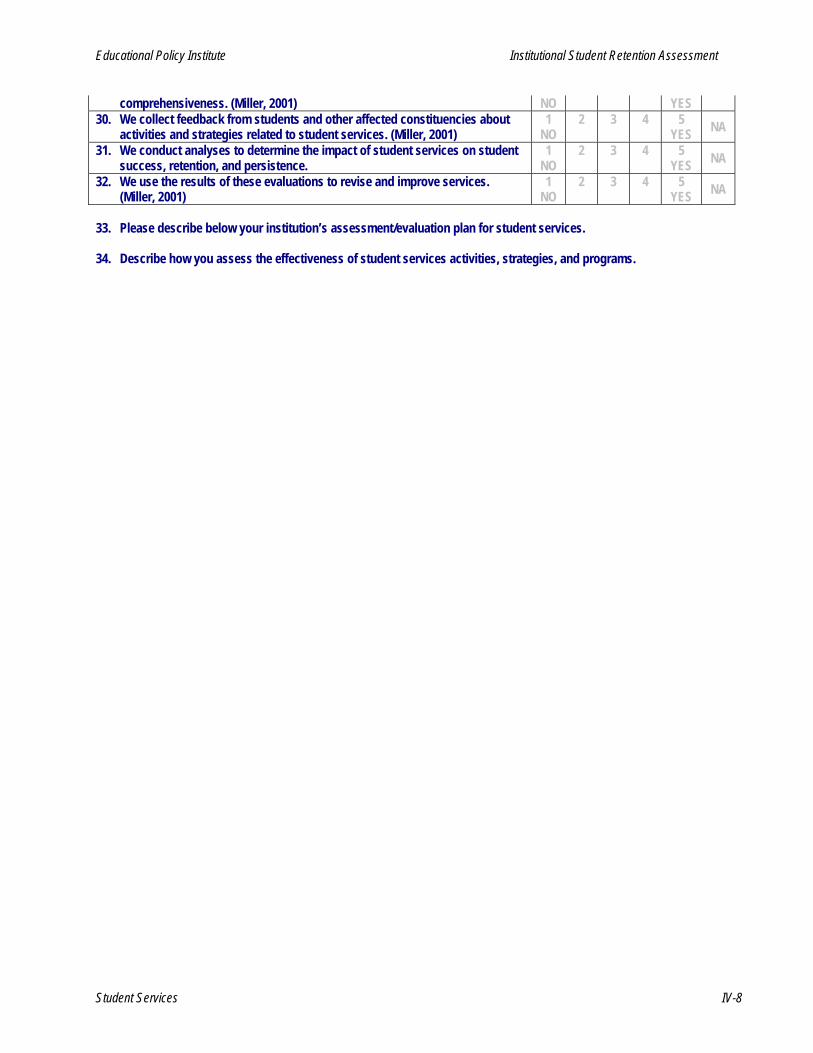
Educational Policy Institute Institutional Student Retention Assessment
Student Services IV-8
comprehensiveness. (Miller, 2001) NO YES 30. We collect feedback from students and other affected constituencies about
activities and strategies related to student services. (Miller, 2001) 1
NO 2
3
4
5 YES NA
31. We conduct analyses to determine the impact of student services on student success, retention, and persistence.
1 NO
2
3
4
5 YES NA
32. We use the results of these evaluations to revise and improve services. (Miller, 2001)
1 NO
2
3
4
5 YES NA
33. Please describe below your institution’s assessment/evaluation plan for student services. 34. Describe how you assess the effectiveness of student services activities, strategies, and programs.

Educational Policy Institute Institutional Student Retention Assessment
Student Services IV-9
PART B: HOUSING & RESIDENTIAL LIFE PROGRAM B1. STRENGTHS & WEAKNESSES
35. Please describe below your institution’s main strategies/practices in this area.
Strategy 1
(ADD button) 36. Please describe below the strategies/practices that you believe have most effectively supported the
learning/development/success of students.
Success Strategy 1
Description of Strategy
Evidence of Success
(ADD button) 37. Please describe the challenges or areas of weakness of which you are aware along with potential solutions or
strategies to ameliorate these issues.
Challenge 1
Evidence
Solution Strategy
(ADD button)
B2. ON- AND OFF-CAMPUS RESIDENTIAL FACILITIES For each of the upcoming questions, please answer these supplementary questions. The online system will bring these up automatically. a) Please elaborate and describe.
c) Provide empirical or institutional evidence to support your rating. b) On a scale of 1 – 5, where 1 is “no, not at all,” 3 is “somewhat/average,” and 5 is “yes, very much so,” do you believe this strategy could/does support student success?
1 NO
2
3
4
5 YES
d) Do you believe this area requires improvement? 1 NO 5
YES e) If yes, what could be done to improve the effectiveness of this area? Table 5. Student Services Residential Facilities Please answer the following questions and elaborate through the supplementary questions.
1 NO
2
3
4
5 YES
NA
38. Facilities meet or exceed our students’ expectations for personal comfort, 1 2 3 4 5 NA

Educational Policy Institute Institutional Student Retention Assessment
Student Services IV-10
safety, and security. NO YES 39. Facilities are maintained at the optimal levels of cleanliness, repair, and
décor. (Miller, 2001) 1
NO 2
3
4
5 YES NA
40. Facilities are appropriate to accommodate program goals and objectives. (Miller, 2001)
1 NO
2
3
4
5 YES NA
41. Facilities are conducive to independent and group study. (Miller, 2001; Kuh, et. al., 2005)
1 NO
2
3
4
5 YES NA
42. Facilities are conducive to social activities. (Miller, 2001; Kuh, et. al., 2005) 1 NO
2
3
4
5 YES NA
43. Facilities provide appropriate number of residential spaces to accommodate, in order of priority, freshmen and other undergraduates. (Swail, et. al., 2003; Kuh, et. al., 2005)
1 NO
2
3
4
5 YES NA
44. Facilities are adequately furnished to accommodate all assigned occupants. (Miller, 2001; Kuh, et. al., 2005)
1 NO
2
3
4
5 YES NA
45. Our on-campus housing facilities make accommodations for students with disabilities.
1 NO
2
3
4
5 YES NA
46. We provide theme-based housing facilities for students with special interests (e.g., international hall; business hall).
1 NO
2
3
4
5 YES NA
47. Facilities are reasonably priced. (Miller, 2001; Swail, et. al., 2003) 1 NO
2
3
4
5 YES NA
48. Students living on campus have 24-hour access to staff. 1 NO
2
3
4
5 YES NA
49. We provide referrals to qualified off-campus housing opportunities for students.
1 NO
2
3
4
5 YES NA
50. For students interested in off-campus housing, we provide information about leases and landlord/tenant law, and similar services. (Miller, 2001)
1 NO
2
3
4
5 YES NA
51. Off-campus housing services provide services to support students’ social integration with campus life. (Swail, 2003)
1 NO
2
3
4
5 YES NA
52. Our housing staff are adequately trained to deal with residential and off-campus student issues.
1 NO
2
3
4
5 YES NA

Educational Policy Institute Institutional Student Retention Assessment
Student Services IV-11
B3. RESIDENTIAL ACTIVITIES FOR STUDENTS For each of the upcoming questions, please answer these supplementary questions. The online system will bring these up automatically. a) Please elaborate and describe.
c) Provide empirical or institutional evidence to support your rating. b) On a scale of 1 – 5, where 1 is “no, not at all,” 3 is “somewhat/average,” and 5 is “yes, very much so,” do you believe this strategy could/does support student success?
1 NO
2
3
4
5 YES
d) Do you believe this area requires improvement? 1 NO 5
YES e) If yes, what could be done to improve the effectiveness of this area? Table 6. Student Services Residential Activities Please answer the following questions and elaborate through the supplementary questions.
1 NO
2
3
4
5 YES
NA
53. Activities are provided that increase students’ abilities to understand and manage personal health, finances, and time. (Miller, 2001)
1 NO
2
3
4
5 YES NA
54. Activities are provided that facilitate cooperative living with others. (Miller, 2001)
1 NO
2
3
4
5 YES NA
55. Activities are provided that improve students’ interpersonal relationships and communication skills. (Miller, 2001)
1 NO
2
3
4
5 YES NA
56. Activities are provided that promote and demonstrate responsible social behavior to students, including respecting similarities and differences among others. (Miller, 2001)
1 NO
2
3
4
5 YES NA
57. Activities are provided to educate students on residential safety, security, and emergency precautions and procedures and encourage them to assume responsibility for the safety and security of themselves and their peers. (Miller, 2001)
1 NO
2
3
4
5 YES NA
58. Activities are provided to introduce and orient students to residential facilities, services, staff members and functions, policies and procedures, and community norms and expectations. (Miller, 2001)
1 NO
2
3
4
5 YES NA
59. Activities are provided that develop students’ leadership skills. (Miller, 2001) 1 NO
2
3
4
5 YES NA
60. Activities are provided that assist students in exploring and managing leisure time. (Miller, 2001)
1 NO
2
3
4
5 YES NA
61. Activities are provided that promote and demonstrate a proper understanding of the results of alcohol and other drug use and abuse. (Miller, 2001)
1 NO
2
3
4
5 YES NA
62. A variety of appropriate social, educational, recreational, cultural, and community service programs are planned for students living in residence. (Miller, 2001)
1 NO
2
3
4
5 YES NA
63. Students are actively encouraged to participate in institutional and residence hall programs, activities, groups, and organizations. (Miller, 2001)
1 NO
2
3
4
5 YES NA
64. Individual and group counseling support is made available to students while in residence. (Miller, 2001)
1 NO
2
3
4
5 YES NA
65. We ensure through our policies, programs, and practices that our residences are learning communities, providing an environment conducive to educational pursuits. (Kuh, et. al., 2005; Miller, 2001)
1 NO
2
3
4
5 YES NA
66. Individual and group academic advising is made available to students while in the residence hall. (Miller, 2001; Kuh, et. al., 2005)
1 NO
2
3
4
5 YES NA
67. Academic support activities, such as study/learning strategies, research skills, and time management workshops and study groups, are provided to students in our housing facilities. (Miller, 2001)
1 NO
2
3
4
5 YES NA
68. We provide information on local transportation schedules and availability to 1 2 3 4 5 NA

Educational Policy Institute Institutional Student Retention Assessment
Student Services IV-12
on-campus residential students. NO YES 69. We provide information about activities outside of the campus so students
can integrate into the community. 1
NO 2
3
4
5 YES NA
B4. FOOD SERVICES For each of the upcoming questions, please answer these supplementary questions. The online system will bring these up automatically. a) Please elaborate and describe.
c) Provide empirical or institutional evidence to support your rating. b) On a scale of 1 – 5, where 1 is “no, not at all,” 3 is “somewhat/average,” and 5 is “yes, very much so,” do you believe this strategy could/does support student success?
1 NO
2
3
4
5 YES
d) Do you believe this area requires improvement? 1 NO 5
YES e) If yes, what could be done to improve the effectiveness of this area? Table 7. Student Services Food Services Please answer the following questions and elaborate through the supplementary questions.
1 NO
2
3
4
5 YES
NA
70. Our staff plans menus that provide optimal nutrition and variety and are appetizing to students. (Miller, 2001)
1 NO
2
3
4
5 YES NA
71. We ensure that affordable and flexible meal plans are available to students. (Swail, 2003)
1 NO
2
3
4
5 YES NA
72. In planning menus, we pay attention to students’ varied schedules, cultural differences, and special dietary needs. (Miller, 2001)
1 NO
2
3
4
5 YES NA
73. We ensure adequate seating to accommodate all students using our food services facilities. (Miller, 2001)
1 NO
2
3
4
5 YES NA
74. Our food services staff is customer-oriented. (Miller, 2001) 1 NO
2
3
4
5 YES NA
75. We provide resource materials that educate students about nutrition. (Miller, 2001)
1 NO
2
3
4
5 YES NA
76. Our food services sub-contracted to or partnered with an outside firm/organization are effective.
1 NO
2
3
4
5 YES NA
77. We have sufficient control over the menus, activities, and schedules used by the sub-contractor.
1 NO
2
3
4
5 YES NA

Educational Policy Institute Institutional Student Retention Assessment
Student Services IV-13
PART C. COMMUTER STUDENT SERVICES
C1. STRENGTHS & WEAKNESSES
78. Please describe below your institution’s main strategies/practices in this area.
Strategy 1
(ADD button) 79. Please describe below the strategies/practices that you believe have most effectively supported the
learning/development/success of students.
Success Strategy 1
Description of Strategy
Evidence of Success
(ADD button) 80. Please describe the challenges or areas of weakness of which you are aware along with potential solutions or
strategies to ameliorate these issues.
Challenge 1
Evidence
Solution Strategy
(ADD button)
C2. STUDENT TRANSPORTATION For each of the upcoming questions, please answer these supplementary questions. The online system will bring these up automatically. a) Please elaborate and describe.
c) Provide empirical or institutional evidence to support your rating. b) On a scale of 1 – 5, where 1 is “no, not at all,” 3 is “somewhat/average,” and 5 is “yes, very much so,” do you believe this strategy could/does support student success?
1 NO
2
3
4
5 YES
d) Do you believe this area requires improvement? 1 NO 5
YES e) If yes, what could be done to improve the effectiveness of this area? Table 8. Student Services Transportation Please answer the following questions and elaborate through the supplementary questions.
1 NO
2
3
4
5 YES
NA
81. We maintain a liaison or a partnership with the local area transit system to ensure adequate transportation links with the local community. (Swail, 2003).
1 NO
2
3
4
5 YES NA

Educational Policy Institute Institutional Student Retention Assessment
Student Services IV-14
82. We provide local area transit information to students. (Miller, 2001) 1 NO
2
3
4
5 YES NA
83. We provide or facilitate services to assist students with transportation needs, such as car pools, intra-campus transit (dependent on campus size), and transport between the campus and the local community (if local area transit system does not exist or is insufficient). (Miller, 2001)
1 NO
2
3
4
5 YES NA
84. We provide adequate parking for all commuter students. 1 NO
2
3
4
5 YES NA
85. Our parking facilities are safe and well-lighted at night, with emergency contact systems available to students (e.g., alarms, telephones, etc.)
1 NO
2
3
4
5 YES NA
86. We provide parking emergency services, such as jumper cables, towing service, and road aid in institutionally-controlled parking areas. (Miller, 2001)
1 NO
2
3
4
5 YES NA
87. Our walkways and bike paths on campus are well lighted at night to promote safety.
1 NO
2
3
4
5 YES NA
88. We provide electricity in our parking lots so students can plug in their car block heaters in winter (northern institutions only).
1 NO
2
3
4
5 YES NA
C3. ACCESS TO CAMPUS INFORMATION, SERVICES, AND PROCESSES For each of the upcoming questions, please answer these supplementary questions. The online system will bring these up automatically. a) Please elaborate and describe.
c) Provide empirical or institutional evidence to support your rating. b) On a scale of 1 – 5, where 1 is “no, not at all,” 3 is “somewhat/average,” and 5 is “yes, very much so,” do you believe this strategy could/does support student success?
1 NO
2
3
4
5 YES
d) Do you believe this area requires improvement? 1 NO 5
YES e) If yes, what could be done to improve the effectiveness of this area? Table 9. Student Services Campus Information & Services Please answer the following questions and elaborate through the supplementary questions.
1 NO
2
3
4
5 YES
NA
89. We disseminate information about campus services, programs, and current events in a variety of formats easily accessed by commuter students, including calendars, campus and local newspapers and radio stations, fliers, telephone hotlines, and digital media, including our institution’s website. (Miller, 2001)
1 NO
2
3
4
5 YES NA
90. All students can talk to a live human being at our institution when needed. 1 NO
2
3
4
5 YES NA
91. We provide access to processes such as course registration and advising via internet and telephone as well as in traditional modes. (Miller, 2001)
1 NO
2
3
4
5 YES NA
92. An appropriate level of student services is provided at night and on the weekend if classes are held during those time periods.
1 NO
2
3
4
5 YES NA
93. An appropriate level of student services is provided on satellite campuses at night and on the weekend if classes are held during those time periods.
1 NO
2
3
4
5 YES NA

Educational Policy Institute Institutional Student Retention Assessment
Student Services IV-15
C4. PROVISION OF ADEQUATE FREE-TIME FACILITIES ON CAMPUS For each of the upcoming questions, please answer these supplementary questions. The online system will bring these up automatically. a) Please elaborate and describe.
c) Provide empirical or institutional evidence to support your rating. b) On a scale of 1 – 5, where 1 is “no, not at all,” 3 is “somewhat/average,” and 5 is “yes, very much so,” do you believe this strategy could/does support student success?
1 NO
2
3
4
5 YES
d) Do you believe this area requires improvement? 1 NO 5
YES e) If yes, what could be done to improve the effectiveness of this area? Table 10. Student Services Free-Time Facilities Please answer the following questions and elaborate through the supplementary questions.
1 NO
2
3
4
5 YES
NA
94. We provide comfortable free-time spaces, such as recreational, study, and lounge space, in classroom, college union, and student center buildings. (Miller, 2001)
1 NO
2
3
4
5 YES NA
95. We provide individual lockers for commuter students. (Miller, 2001) 1 NO
2
3
4
5 YES NA
96. We provide computer work stations for commuter students. (Miller, 2001) 1 NO
2
3
4
5 YES NA
97. We provide wireless internet in our free-time spaces on campus. 1 NO
2
3
4
5 YES NA
C5. PROVISION OF ACADEMIC AND CO-CURRICULAR PROGRAMS For each of the upcoming questions, please answer these supplementary questions. The online system will bring these up automatically. a) Please elaborate and describe.
c) Provide empirical or institutional evidence to support your rating. b) On a scale of 1 – 5, do you believe this strategy could/does support student success?
1 NO
2
3
4
5 YES
d) Do you believe this area requires improvement? 1 NO 5
YES
e) If yes, what could be done to improve the effectiveness of this area? Table 11. Student Services Academic and Co-Curricular Programs Please answer the following questions and elaborate through the supplementary questions.
1 NO
2
3
4
5 YES
NA
98. We offer academic classes in a variety of time slots, such as weekends and Friday-Saturday course combinations, to permit flexible scheduling by students. (Swail, 2003) [For respondent to consider: are class schedules perceived by students as flexible and meeting with their needs?]
1 NO
2
3
4
5 YES NA
99. We utilize distance-learning technologies and practices to broaden and support student participation and allow increased flexibility of course schedules. (Swail, 2003)
1 NO
2
3
4
5 YES NA
100. We offer co-curricular programs that are accessible to the commuter student, such as daytime social and cultural activities; activities located in areas off campus that are densely populated by students; and family-oriented
1 NO
2
3
4
5 YES NA
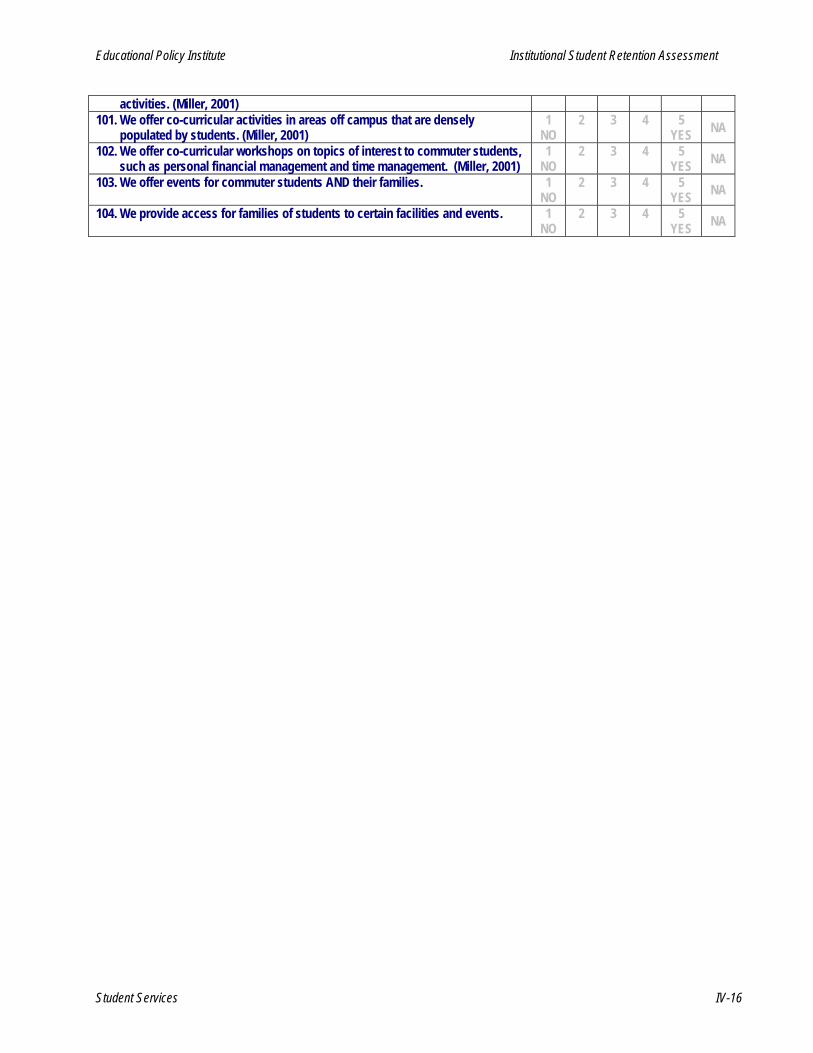
Educational Policy Institute Institutional Student Retention Assessment
Student Services IV-16
activities. (Miller, 2001) 101. We offer co-curricular activities in areas off campus that are densely
populated by students. (Miller, 2001) 1
NO 2
3
4
5 YES NA
102. We offer co-curricular workshops on topics of interest to commuter students, such as personal financial management and time management. (Miller, 2001)
1 NO
2
3
4
5 YES NA
103. We offer events for commuter students AND their families. 1 NO
2
3
4
5 YES NA
104. We provide access for families of students to certain facilities and events. 1 NO
2
3
4
5 YES NA

Educational Policy Institute Institutional Student Retention Assessment
Student Services IV-17
PART D. COUNSELING SERVICES D1. STRENGTHS & WEAKNESSES
105. Please describe below your institution’s main strategies/practices in this area.
Strategy 1
(ADD button) 106. Please describe below the strategies/practices that you believe have most effectively supported the
learning/development/success of students.
Success Strategy 1
Description of Strategy
Evidence of Success
(ADD button) 107. Please describe the challenges or areas of weakness of which you are aware along with potential solutions or
strategies to ameliorate these issues.
Challenge 1
Evidence
Solution Strategy
(ADD button)

Educational Policy Institute Institutional Student Retention Assessment
Student Services IV-18
D2. COUNSELING OUTREACH AND CONSULTATION FOR THE CAMPUS COMMUNITY Counseling services should be based on theories and knowledge of learning and human development. It should reflect the developmental and demographic profiles of the student population and be responsive to the special needs of individuals. (Miller, 2001) For each of the upcoming questions, please answer these supplementary questions. The online system will bring these up automatically. a) Please elaborate and describe.
c) Provide empirical or institutional evidence to support your rating. b) On a scale of 1 – 5, where 1 is “no, not at all,” 3 is “somewhat/average,” and 5 is “yes, very much so,” do you believe this strategy could/does support student success?
1 NO
2
3
4
5 YES
d) Do you believe this area requires improvement? 1 NO 5
YES
e) If yes, what could be done to improve the effectiveness of this area? Table 12. Student Services Counseling Outreach Please answer the following questions and elaborate through the supplementary questions.
1 NO
2
3
4
5 YES
NA
108. We orient all students, family, staff, and faculty on services offered and how students can locate and utilize counseling services. (Voorhees, 2004)
1 NO
2
3
4
5 YES NA
109. Our counseling staff provides effective consultation for students, family, faculty, and staff on request. (Miller, 2001)
1 NO
2
3
4
5 YES NA
110. Students, family, faculty, and staff utilize our consultation services. 1 NO
2
3
4
5 YES NA
111. Our counseling staff has established relationships and close cooperation with all on-campus academic departments, services, and organizations that work directly with students. (Miller, 2001)
1 NO
2
3
4
5 YES NA
112. Our counseling staff has established relationships and close cooperation with all student organizations and groups. (Miller, 2001)
1 NO
2
3
4
5 YES NA
113. Our counseling staff “plays an active role in interpreting and, when appropriate, advocating for addressing the needs of students to administration, faculty and staff of the institution.” (Miller, 2001, p. 102)
1 NO
2
3
4
5 YES NA
114. Counseling staff provide inservice professional development for faculty, staff, and student staff members. (Miller, 2001)
1 NO
2
3
4
5 YES NA
115. Counseling staff lead seminars and workshops for students on personal, social, educational, and career issues and topics.
1 NO
2
3
4
5 YES NA
116. Our students are well aware of our counseling services. (Miller, 2001) 1 NO
2
3
4
5 YES NA
117. We offer counseling using a variety of techniques appropriate to meet students’ needs, such as individual, group, peer, computer, and video session as necessary. (Miller, 2001)
1 NO
2
3
4
5 YES NA
118. We offer enhanced counseling services for freshmen to provide students with the information, tools, and support they need during their initial year. (Kuh, et. al., 2005)
1 NO
2
3
4
5 YES NA
119. We refer students to community agencies as appropriate. 1 NO
2
3
4
5 YES NA
120. Our counseling staff have established relationships and close cooperation with community agencies and mental health providers.
1 NO
2
3
4
5 YES NA
121. Our counseling staff is effectively trained to respond to the unique needs of traditionally underserved and special student populations. (Miller, 2001)
1 NO
2
3
4
5 YES NA
122. Our counseling staff engages in professional development to help them 1 2 3 4 5 NA

Educational Policy Institute Institutional Student Retention Assessment
Student Services IV-19
remain current with practices and strategies to assist students. NO YES

Educational Policy Institute Institutional Student Retention Assessment
Student Services IV-20
PART E: CAMPUS ACTIVITIES & CLIMATE E1. STRENGTHS & WEAKNESSES
123. Please describe below your institution’s main strategies/practices in this area.
Strategy 1
(ADD button) 124. Please describe below the strategies/practices that you believe have most effectively supported the
learning/development/success of students.
Success Strategy 1
Description of Strategy
Evidence of Success
(ADD button) 125. Please describe the challenges or areas of weakness of which you are aware along with potential solutions or
strategies to ameliorate these issues.
Challenge 1
Evidence
Solution Strategy
(ADD button)

Educational Policy Institute Institutional Student Retention Assessment
Student Services IV-21
E2. CAMPUS ACTIVITIES For each of the upcoming questions, please answer these supplementary questions. The online system will bring these up automatically. a) Please elaborate and describe.
c) Provide empirical or institutional evidence to support your rating. b) On a scale of 1 – 5, where 1 is “no, not at all,” 3 is “somewhat/average,” and 5 is “yes, very much so,” do you believe this strategy could/does support student success?
1 NO
2
3
4
5 YES
d) Do you believe this area requires improvement? 1 NO 5
YES e) If yes, what could be done to improve the effectiveness of this area? Table 13. Student Services Campus Activities Please answer the following questions and elaborate through the supplementary questions.
1 NO
2
3
4
5 YES
NA
126. Our campus activities foster meaningful interactions between students and members of the faculty, administration, and staff. (Miller, 2001)
1 NO
2
3
4
5 YES NA
127. Our campus activities are planned and implemented collaboratively by students, professional staff, and faculty. (Miller, 2001)
1 NO
2
3
4
5 YES NA
128. Our campus activities encourage non-classroom opportunities for faculty-student interaction. (Swail, 2003)
1 NO
2
3
4
5 YES NA
129. Our campus activities are based on valid indicators of student needs and interests, such as the results of needs assessment surveys, research findings, professional literature, and the judgments of professionals. (Miller, 2001)
1 NO
2
3
4
5 YES NA
130. Our campus activities are broad in scope and inclusive of all educational domains for student learning and development. (Miller, 2001)
1 NO
2
3
4
5 YES NA
131. We ensure that admission fees for any fee-based activities are maintained at levels that encourage wide-spread student attendance at events. (Miller, 2001)
1 NO
2
3
4
5 YES NA
132. Our activities reinforce classroom instruction and complement academic learning through collaboration with academic departments. (Miller, 2001)
1 NO
2
3
4
5 YES NA
133. Our activities offer instruction and experience in social skills and social interactions. (Miller, 2001)
1 NO
2
3
4
5 YES NA
134. Our activities provide opportunities for individual participation in group membership and leadership. (Miller, 2001)
1 NO
2
3
4
5 YES NA
135. Our activities develop citizenship through participation in campus and community affairs. (Miller, 2001)
1 NO
2
3
4
5 YES NA
136. Our activities foster campus and community inter-group participation in common concerns and interests. (Miller, 2001)
1 NO
2
3
4
5 YES NA
137. Our activities promote physical well-being. (Miller, 2001) 1 NO
2
3
4
5 YES NA
138. Our activities stimulate the cultural, intellectual, and social life of the campus community. (Miller, 2001)
1 NO
2
3
4
5 YES NA
139. Our activities promote understanding of people of diverse backgrounds. (Miller, 2001)
1 NO
2
3
4
5 YES NA
140. Our activities raise awareness about and address the needs of women, persons with disabilities, and other special populations. (Miller, 2001)
1 NO
2
3
4
5 YES NA
141. Our activities develop and disseminate activities calendars, organizational directories, student handbooks, and other materials on public events. (Miller, 2001)
1 NO
2
3
4
5 YES NA

Educational Policy Institute Institutional Student Retention Assessment
Student Services IV-22
E3. CAMPUS CLIMATE For each of the upcoming questions, please answer these supplementary questions. The online system will bring these up automatically. a) Please elaborate and describe.
c) Provide empirical or institutional evidence to support your rating. b) On a scale of 1 – 5, where 1 is “no, not at all,” 3 is “somewhat/average,” and 5 is “yes, very much so,” do you believe this strategy could/does support student success?
1 NO
2
3
4
5 YES
d) Do you believe this area requires improvement? 1 NO 5
YES e) If yes, what could be done to improve the effectiveness of this area? Table 14. Student Services Campus Climate Please answer the following questions and elaborate through the supplementary questions.
1 NO
2
3
4
5 YES
NA
142. We use the unique qualities of our campus location and physical setting as a place to stage unique learning and social opportunities. (Kuh, et. al., 2005)
1 NO
2
3
4
5 YES NA
143. We use our campus’s architectural and natural setting to express our institutional history, ideals, or values and to advance our students’ sense of connection with the institution. (Kuh, et. al., 2005)
1 NO
2
3
4
5 YES NA
144. The interior spaces of our buildings, classrooms, residences, and other campus structures are intimate in scale. (Kuh, et. al., 2005; Woodard, Mallory, and DeLuca, 2001)
1 NO
2
3
4
5 YES NA
145. Our campus setting provides quiet, personal spaces, such as wooded areas, courtyards, and nooks, offering places for students to reflect on what they are learning. (Kuh, et. al., 2005)
1 NO
2
3
4
5 YES NA
146. Our campus’s facilities include gathering places that encourage student-faculty interaction, group study, and collaborative work. (Kuh, et. al., 2005)
1 NO
2
3
4
5 YES NA
147. We have a published policy statement related to providing and supporting a pluralistic environment for students by promoting diversity and multiculturalism through a variety of strategies such as activities, programs, curricula, and communications. (Swail, 2003)
1 NO
2
3
4
5 YES NA
E4. CAMPUS SAFETY For each of the upcoming questions, please answer these supplementary questions. The online system will bring these up automatically. a) Please elaborate and describe.
c) Provide empirical or institutional evidence to support your rating. b) On a scale of 1 – 5, where 1 is “no, not at all,” 3 is “somewhat/average,” and 5 is “yes, very much so,” do you believe this strategy could/does support student success?
1 NO
2
3
4
5 YES
d) Do you believe this area requires improvement? 1 NO 5
YES e) If yes, what could be done to improve the effectiveness of this area? Table 15. Student Services Campus Safety Please answer the following questions and elaborate through the supplementary questions.
1 NO
2
3
4
5 YES
NA
148. We ensure that our campus is well lighted at night for evening classes, activities, and residential students.
1 NO
2
3
4
5 YES NA
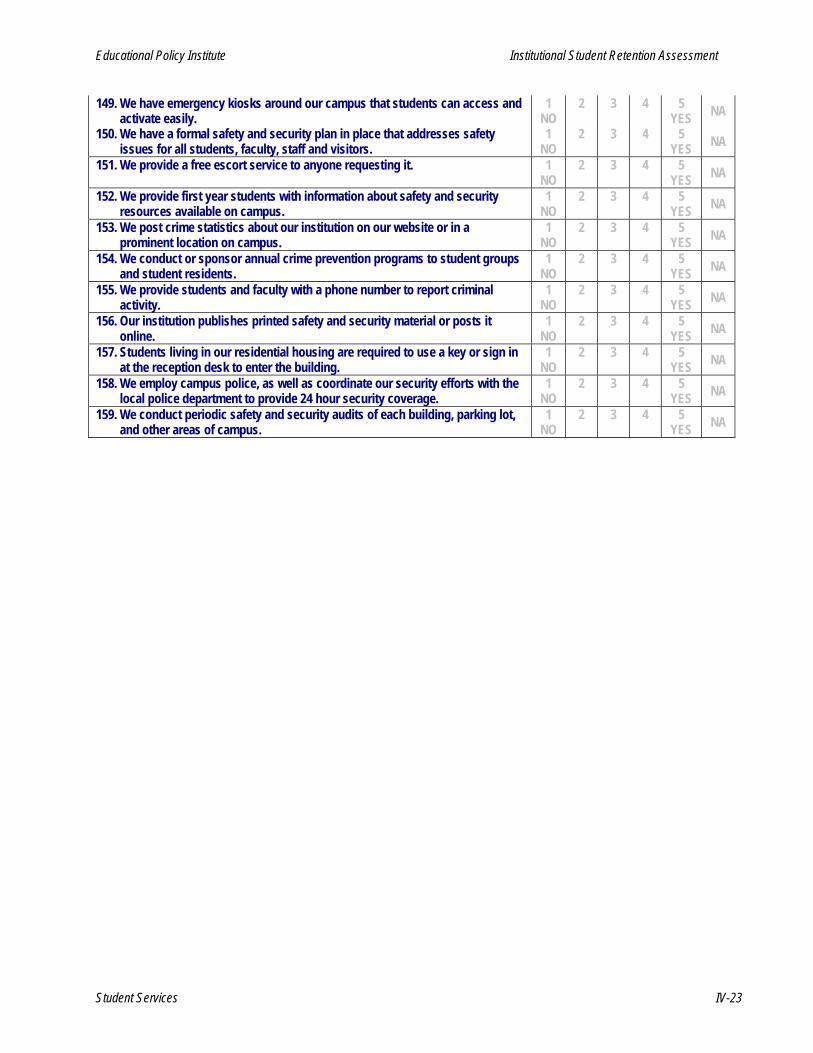
Educational Policy Institute Institutional Student Retention Assessment
Student Services IV-23
149. We have emergency kiosks around our campus that students can access and activate easily.
1 NO
2
3
4
5 YES NA
150. We have a formal safety and security plan in place that addresses safety issues for all students, faculty, staff and visitors.
1 NO
2
3
4
5 YES NA
151. We provide a free escort service to anyone requesting it. 1 NO
2
3
4
5 YES NA
152. We provide first year students with information about safety and security resources available on campus.
1 NO
2
3
4
5 YES NA
153. We post crime statistics about our institution on our website or in a prominent location on campus.
1 NO
2
3
4
5 YES NA
154. We conduct or sponsor annual crime prevention programs to student groups and student residents.
1 NO
2
3
4
5 YES NA
155. We provide students and faculty with a phone number to report criminal activity.
1 NO
2
3
4
5 YES NA
156. Our institution publishes printed safety and security material or posts it online.
1 NO
2
3
4
5 YES NA
157. Students living in our residential housing are required to use a key or sign in at the reception desk to enter the building.
1 NO
2
3
4
5 YES NA
158. We employ campus police, as well as coordinate our security efforts with the local police department to provide 24 hour security coverage.
1 NO
2
3
4
5 YES NA
159. We conduct periodic safety and security audits of each building, parking lot, and other areas of campus.
1 NO
2
3
4
5 YES NA

Educational Policy Institute Institutional Student Retention Assessment
Student Services IV-24
PART F: STUDENT HEALTH F1. STRENGTHS & WEAKNESSES
160. Please describe below your institution’s main strategies/practices in this area.
Strategy 1
(ADD button) 161. Please describe below the strategies/practices that you believe have most effectively supported the
learning/development/success of students.
Success Strategy 1
Description of Strategy
Evidence of Success
(ADD button) 162. Please describe the challenges or areas of weakness of which you are aware along with potential solutions or
strategies to ameliorate these issues.
Challenge 1
Evidence
Solution Strategy
(ADD button)

Educational Policy Institute Institutional Student Retention Assessment
Student Services IV-25
F2. HEALTH SUPPORT ACTIVITIES & FACILITIES For each of the upcoming questions, please answer these supplementary questions. The online system will bring these up automatically. a) Please elaborate and describe.
c) Provide empirical or institutional evidence to support your rating. b) On a scale of 1 – 5, where 1 is “no, not at all,” 3 is “somewhat/average,” and 5 is “yes, very much so,” do you believe this strategy could/does support student success?
1 NO
2
3
4
5 YES
d) Do you believe this area requires improvement? 1 NO 5
YES e) If yes, what could be done to improve the effectiveness of this area? Table 16. Student Services Health Support Please answer the following questions and elaborate through the supplementary questions.
1 NO
2
3
4
5 YES
NA
163. We have a student health committee to provide guidance and suggestions to the institution.
1 NO
2
3
4
5 YES NA
164. We have health insurance available to students. 165. We ensure that our health insurance is as affordable as possible for students. 166. We have on-campus medical facilities, or access to community medical
facilities, for students. 167. We have a health shop or store on campus where students can buy
medication and other health supplies. 168. We provide health alerts to students via email and other means to notify them
of timely health issues. 169. We provide special classes and workshops to help students deal with
addictions, such as smoking, alcohol, and drugs. 170. We provide psychological services through our health plan. 171. We provide immunizations for students.

Educational Policy Institute Institutional Student Retention Assessment
Student Services IV-26
SOURCES CITED Kuh, George D., Kinzie, Jillian, Schuh, John H., Whitt, Elizabeth J., and Associates. (2005). Student Success in College: Creating Conditions that Matter. Washington, D.C.: Jossey-Bass. Miller, Theodore K., (2001). The CAS Book of Professional Standards for Higher Education 2001. Washington, DC: Council for the Advancement of Standards in Higher Education. Swail, Watson S., Redd, Kenneth E., & Perna, Laura W. (2003). Retaining Minority Students in Higher Education: A Framework for Success. ASHE-ERIC Higher Education Report: Vol. 30, No. 2. San Francisco, CA: Wiley Periodicals, Inc. Voorhees, Richard. (2004). Framework: Retention Audit. Paper prepared for the Educational Policy Institute. Stafford, VA. Woodard, Dudley B., Mallory, Sherry L., & De Luca, Anne M. (2001). “Retention and Institutional Effort: A Self-Study Framework.” The NASPA Journal, Vol. 39: No. 1, Article 4. Retrieved May 2, 2006, from: http://publications.naspa.org/naspajournal/vol39/iss1/art4.

Educational Policy Institute Institutional Student Retention Assessment
Part II: The Institutional Student Retention Assessment V-1
Section V: Academic Services

Educational Policy Institute Institutional Student Retention Assessment
Academic Services V-2
TABLE OF CONTENTS
SECTION V: Academic Services ........................................................................................................................ 4 Instructions ....................................................................................................................................................... 4
PART A: Strategic Framework ........................................................................................................................... 5 A1. Mission ....................................................................................................................................................... 5 A2. Goals & Objectives .................................................................................................................................... 5 A3. Policy & Practice ........................................................................................................................................ 6 A4. Assessment and Evaluation ....................................................................................................................... 7
PART B: Academic Advising Services ............................................................................................................. 8 B1. Strengths & Weaknesses ........................................................................................................................... 8 B2. Structure and Organization of the Academic Advising Program ................................................................ 9 B3. Information Dissemination Through Academic Advising .......................................................................... 10
PART C: Bridge Programs ............................................................................................................................... 12 C1. Strengths & Weaknesses......................................................................................................................... 12 C2. Bridge Program ........................................................................................................................................ 13
PART D: Pre-College Programs ....................................................................................................................... 14 D1. Strengths & Weaknesses......................................................................................................................... 14 D2. Pre-College Program ............................................................................................................................... 15
PART E: Experiential and Research Opportunities ....................................................................................... 17 E1. Strengths & Weaknesses ......................................................................................................................... 17 E2. Experiential and Research Opportunities for Students............................................................................. 18
PART F: Supplementary Instruction Programs .............................................................................................. 19 F1. Strengths & Weaknesses ......................................................................................................................... 19 F2. Learning Assistance Program .................................................................................................................. 20 F3. Supplemental Instruction Program ........................................................................................................... 21 F4. Mentoring and/or Tutoring Program ......................................................................................................... 22
Sources Cited ................................................................................................................................................... 23

Educational Policy Institute Institutional Student Retention Assessment
Academic Services V-3
Table of Tables Table 1. Academic Services Mission .................................................................................................................... 5 Table 2. Academic Services Goals & Objectives .................................................................................................. 5 Table 3. Academic Services Policy & Practice ..................................................................................................... 6 Table 4. Academic Services Assessment and Evaluation .................................................................................... 7 Table 5. Academic Services Structure and Organization ...................................................................................... 9 Table 6. Academic Services Information Dissemination ..................................................................................... 10 Table 7. Academic Services Bridge Program ..................................................................................................... 13 Table 8. Academic Services Pre-College Program ............................................................................................. 15 Table 9. Academic Services Experiential Programs ........................................................................................... 18 Table 10. Academic Services Learning Assistance Program ............................................................................. 20 Table 11. Academic Services Supplemental Instruction ..................................................................................... 21 Table 12. Academic Services Mentoring/Tutoring Programs .............................................................................. 22

Educational Policy Institute Institutional Student Retention Assessment
Academic Services V-4
SECTION V: ACADEMIC SERVICES Academic services, which include pre-college and bridge programs, academic advising, and various forms of supplementary instruction, including tutoring, mentoring, and supplemental instruction, support students in achieving their potential as learners. Some students could not succeed in higher education without this type of support.
INSTRUCTIONS This assessment provides your institution with an overview of what is already in place. We strongly recommend that you print each assessment section [link to printable assessment section] and use it as a discussion agenda with your team prior to entering data. Part of your team’s work will be to collect the required information as part of the assessment process. [add more detailed instructions about saving data, etc.] IMPORTANT: Because of the diversity of within and among institutions, it may be useful to have separate campus departments or colleges complete components of this section. Again, as stated in the introduction to this tool, the Institutional Student Retention Assessment (ISRA) is only useful if the institution makes it useful. Use it as you see fit. If you desire to have six separate units, whether they be departments or colleges, so be it. Make it work for you.

Educational Policy Institute Institutional Student Retention Assessment
Academic Services V-5
PART A: STRATEGIC FRAMEWORK
A1. MISSION The mission of an institution’s academic services is to assist students in reaching their full potential as learners through support programs and services. 1. We have a mission statement for our institution’s academic services. __ Yes __ No If yes, please enter below your current mission statement for academic services and respond to the following statements: Table 1. Academic Services Mission 1
NO 2
3
4
5 YES NA
2. Our mission statement is consistent with the mission and goals of our institution. (Miller, 2001)
1 NO
2
3
4
5 YES NA
3. Our mission statement is consistent with standards created by other professional organizations, including accrediting organizations. (e.g., the Professional Standards for Higher Education by the Council for the Advancement of Standards in Higher Education; NASFAA, NACAN, AACRAO, etc.).
1 NO
2
3
4
5 YES NA
4. Our mission statement focuses on student success. 1 NO
2
3
4
5 YES NA
5. Our mission is actively used to guide policy development and practical application.
1 NO
2
3
4
5 YES NA
6. Our staff is cognizant of the mission statement. 1 NO
2
3
4
5 YES NA
7. We disseminate, implement, and regularly review our mission statement. (Miller, 2001)
1 NO
2
3
4
5 YES NA
A2. GOALS & OBJECTIVES 8. We have goals and objectives for our academic services program/department(s). __ Yes __ No If yes, please enter below the goals and objectives of your academic services program/department(s).
Goal 1 (ADD Button)
Objective 1 (ADD Button)
If yes, please respond to the following statements: Table 2. Academic Services Goals & Objectives 1
NO 2
3
4
5 YES NA
9. Our goals and objectives are consistent with our mission statement for academic services.
1 NO
2
3
4
5 YES NA
10. Our goals and objectives are consistent with standards created by other professional organizations, including accrediting organizations. (e.g., the Professional Standards for Higher Education by the Council for the Advancement of Standards in Higher Education.
1 NO
2
3
4
5 YES NA

Educational Policy Institute Institutional Student Retention Assessment
Academic Services V-6
11. We disseminate, implement, and regularly review our goals and objectives. (Miller, 2001)
1 NO
2
3
4
5 YES NA
12. Our goals and objectives focus on student success. 1 NO
2
3
4
5 YES NA
13. Our goals and objectives are actively used to guide policy development and practical application.
1 NO
2
3
4
5 YES NA
14. Our staff is cognizant of the goals and objectives. 1 NO
2
3
4
5 YES NA
A3. POLICY & PRACTICE
For each of the upcoming questions, please answer these supplementary questions. The online system will bring these up automatically. a) Please elaborate and describe. c) Provide empirical or institutional evidence to support your rating. b) On a scale of 1 – 5, where 1 is “no, not at all,” 3 is “somewhat/average,” and 5 is “yes, very much so,” do you believe this strategy could/does support student success?
1 NO
2
3
4
5 YES
d) Do you believe this area requires improvement? 1 NO 5
YES e) If yes, what could be done to improve the effectiveness of this area? Table 3. Academic Services Policy & Practice Please answer the following questions and elaborate through the supplementary questions.
1 NO
2
3
4
5 YES NA
15. Our academic services staff is well trained in their content/specialty areas. 1 NO
2
3
4
5 YES NA
16. Our academic services staff is well trained to serve a diverse set of people, including students and parents.
1 NO
2
3
4
5 YES NA
17. Our academic services policies are shared with and easily and clearly understood by prospective students and their families. (The Admissions Profession, 1995)
1 NO
2
3
4
5 YES NA
18. Our academic services policies are shared with and easily and clearly understood by high school and/or community college coaches, faculty, other personnel, and the general public. (The Admissions Profession, 1995)
1 NO
2
3
4
5 YES NA
19. Our academic services policies are well articulated to all other departments, faculty, and staff throughout the campus
1 NO
2
3
4
5 YES NA
20. Our academic services policies were cooperatively developed by staff, administrators, and faculty. (The Admissions Profession, 1995)
1 NO
2
3
4
5 YES NA
21. Our academic services policies are consistent with statements of good practices articulated by relevant and appropriate professional associations.
1 NO
2
3
4
5 YES NA
22. Our academic services policies emphasize the protection of the best interests of all students as a primary concern in the academic services process.
1 NO
2
3
4
5 YES NA
23. Our academic services policies promote and provide equal educational access to all students interested in and capable of pursuing an education at our institution. (The Admissions Profession, 1995)
1 NO
2
3
4
5 YES NA
24. Our academic services policies emphasize the promotion of student development and achievement, for example, by assisting students in developing exploration, decision-making, and goal-setting skills needed to facilitate their educational development.
1 NO
2
3
4
5 YES NA
25. We review our academic services policies as they serve and impact students on a regularly scheduled basis.
1 NO
2
3
4
5 YES NA

Educational Policy Institute Institutional Student Retention Assessment
Academic Services V-7
26. Academic services policies are centralized and made at the administrative level for our campus.
1 NO
2
3
4
5 YES NA
27. We have a federal student support services (SSS) grant/program at our college.
1 NO
2
3
4
5 YES NA
28. Our SSS program is integrated into our campus and the SSS director and staff are instrumental in the design and facilitation of student support services
1 NO
2
3
4
5 YES NA
A4. ASSESSMENT AND EVALUATION The academic services program should regularly conduct evaluations of its quality to determine whether and to what degree its stated mission and goals are being met. (Miller, 2001) Table 4. Academic Services Assessment and Evaluation Please answer the following questions and elaborate through the supplementary questions.
1 NO
2
3
4
5 YES NA
29. We regularly conduct systematic qualitative and quantitative evaluations to determine whether and to what degree the stated mission and goals and objectives are being met. (Miller, 2001) __ Yes __ No
1 NO
2
3
4
5 YES NA
30. We employ a sufficient range of measures to ensure objectivity and comprehensiveness. (Miller, 2001)
1 NO
2
3
4
5 YES NA
31. We collect feedback from students and other affected constituencies about activities and strategies related to academic services. (Miller, 2001)
1 NO
2
3
4
5 YES NA
32. We use the results of these evaluations to revise and improve services. (Miller, 2001)
1 NO
2
3
4
5 YES NA
33. Please describe below your institution’s evaluation design for this program area. 34. Describe how you assess the effectiveness of your academic services strategies.

Educational Policy Institute Institutional Student Retention Assessment
Academic Services V-8
PART B: Academic Advising Services Academic advising is a developmental process which assists students in the clarification of their life/career goals and in the development of educational plans for the realization of these goals. It is a decision-making process by which students realize their maximum educational potential through communication and information exchanges with an advisor; it is ongoing, multifaceted, and the responsibility of both student and advisor. The advisor serves as a facilitator of communication, a coordinator of learning experiences through course and career planning and academic progress review, and an agent of referral to other campus agencies as necessary. (Crockett, 1987) B1. STRENGTHS & WEAKNESSES 35. Please describe below your institution’s main strategies/practices in this area.
Strategy 1
(ADD button) 36. Please describe below the strategies/practices that you believe have most effectively supported the
learning/development/success of students.
Success Strategy 1
Description of Strategy
Evidence of Success
(ADD button) 37. Please describe the challenges or areas of weakness of which you are aware along with potential solutions or
strategies to ameliorate these issues.
Challenge 1
Evidence
Solution Strategy
(ADD button)

Educational Policy Institute Institutional Student Retention Assessment
Academic Services V-9
B2. STRUCTURE AND ORGANIZATION OF THE ACADEMIC ADVISING PROGRAM For each of the upcoming questions, please answer these supplementary questions. The online system will bring these up automatically. a) Please elaborate and describe. c) Provide empirical or institutional evidence to support your rating. b) On a scale of 1 – 5, where 1 is “no, not at all,” 3 is “somewhat/average,” and 5 is “yes, very much so,” do you believe this strategy could/does support student success?
1 NO
2
3
4
5 YES
d) Do you believe this area requires improvement? 1 NO 5
YES e) If yes, what could be done to improve the effectiveness of this area? Table 5. Academic Services Structure and Organization Please answer the following questions and elaborate through the supplementary questions.
1 NO
2
3
4
5 YES NA
38. Each student is assigned an academic advisor for the duration of his or her studies at our institution.
1 NO
2
3
4
5 YES NA
39. Students are required to meet with their academic advisors on a regularly scheduled basis.
1 NO
2
3
4
5 YES NA
40. We encourage students to talk with advisors at times other than registration advising.
1 NO
2
3
4
5 YES NA
41. We use an “early warning system” to identify students at academic risk. (Kuh, et. al., 2005 )
1 NO
2
3
4
5 YES NA
42. We have an advising center at our institution that all departments and colleges use.
1 NO
2
3
4
5 YES NA
43. Academic advisors offer conferences in a format convenient to the student (i.e. in person, by telephone, on-line). (Miller, 2005)
1 NO
2
3
4
5 YES NA
44. We offer advising conferences in a format (individually or in groups) best suited to meet the needs of the student(s). (Miller, 2005)
1 NO
2
3
4
5 YES NA
45. Our advisors collect, review, and use available data about students’ academic and educational needs, performance, and aspirations. (Miller, 2005)
1 NO
2
3
4
5 YES NA
46. We ensure that academic advising caseloads are consistent with the time required for the effective performance of this activity. (Miller, 2005)
1 NO
2
3
4
5 YES NA
47. We provide the same services to distance learners as we do to students on campus, commuter students, and students enrolled at satellite campuses. (Miller 2005)
1 NO
2
3
4
5 YES NA
48. We provide an orientation to all students, staff, and faculty about how students can locate and utilize advising services on a regular basis. (Voorhees, 2004)
1 NO
2
3
4
5 YES NA
49. Our advisors receive ongoing professional development that provides them with the skills to advise appropriately and professionally, and to a diverse student population. (Swail, 2003)
1 NO
2
3
4
5 YES NA
50. We offer our advisors compensation for their time and effort (financially or other).
1 NO
2
3
4
5 YES NA
51. We offer enhanced advising services by specially selected and trained advisors for freshmen to provide these students with the information, tools, and support they need during this critical year. (Kuh, Kinzie, Schuh, et. al., 2005)
1 NO
2
3
4
5 YES NA
52. Special advising services are available and assigned for undeclared/undecided students and provided by professional advisors or faculty trained to work with this population.
1 NO
2
3
4
5 YES NA
53. We conduct extensive and frequent monitoring and advising services for students who are “undeclared” or of a similar status for academic difficulty and attrition as well as for those who are in academic difficulty.
1 NO
2
3
4
5 YES NA

Educational Policy Institute Institutional Student Retention Assessment
Academic Services V-10
B3. INFORMATION DISSEMINATION THROUGH ACADEMIC ADVISING For each of the upcoming questions, please answer these supplementary questions. The online system will bring these up automatically. a) Please elaborate and describe. c) Provide empirical or institutional evidence to support your rating. b) On a scale of 1 – 5, where 1 is “no, not at all,” 3 is “somewhat/average,” and 5 is “yes, very much so,” do you believe this strategy could/does support student success?
1 NO
2
3
4
5 YES
d) Do you believe this area requires improvement? 1 NO 5
YES e) If yes, what could be done to improve the effectiveness of this area? Table 6. Academic Services Information Dissemination Please answer the following questions and elaborate through the supplementary questions.
1 NO
2
3
4
5 YES NA
54. Our academic advising program provides information regarding the mission and goals of our institution.
1 NO
2
3
4
5 YES NA
55. Our academic advising program provides information about the aims and meaning of higher education, disciplinary and interdisciplinary study, and the nature of scholarly work. (Pennsylvania State University, undated)
1 NO
2
3
4
5 YES NA
56. Our academic advising program provides information concerning the academic expectations for students and the reasons for academic requirements. (Pennsylvania State University, undated)
1 NO
2
3
4
5 YES NA
57. We communicate to students the role expectations for advisors and students in their advising relationship.
1 NO
2
3
4
5 YES NA
58. We provide advice and consultation about general education, degree programs, and current course offerings. (Miller, 2005)
1 NO
2
3
4
5 YES NA
59. We provide advice and consultation about our institution’s academic policies and regulations in regards to general education and majors. (Miller, 2005)
1 NO
2
3
4
5 YES NA
60. We advise students on the registration process, including course scheduling. (Pennsylvania State University, undated)
1 NO
2
3
4
5 YES NA
61. We provide advice and consultation about our institution’s administrative policies and regulations, including registration and financial aid. (Miller, 2005)
1 NO
2
3
4
5 YES NA
62. Our advisors are well-versed in the requirements, course structures and schedules, and policies regarding graduation. (Miller, 2005)
1 NO
2
3
4
5 YES NA
63. We advise students on the relationship between courses, programs, and occupations. (Pennsylvania State University, undated)
1 NO
2
3
4
5 YES NA
64. We provide students with information on extracurricular activities, such as internships and student organizations.
1 NO
2
3
4
5 YES NA
65. We assist students in assessing their interests and abilities, examining their educational goals, and developing short-term plans to meet those goals. (Miller, 2005)
1 NO
2
3
4
5 YES NA
66. We advise students on term-by-term program planning and their relationship to long term goals.
1 NO
2
3
4
5 YES NA
67. We advise students on the selection of specific courses and their relationship to long term goals. (Pennsylvania State University, undated)
1 NO
2
3
4
5 YES NA
68. We advise students about educational and professional objectives suited to the student's expressed abilities and interests. (Pennsylvania State University, undated)
1 NO
2
3
4
5 YES NA
69. We assist students in assessing their interests and abilities, examining their educational goals, and developing long-term plans to meet those goals.
1 NO
2
3
4
5 YES NA

Educational Policy Institute Institutional Student Retention Assessment
Academic Services V-11
(Miller, 2005) 70. We perform a degree audit for each student after a specified number of
credits have been earned or after a specified period of attendance. (Voorhees, 2004)
1 NO
2
3
4
5 YES NA
71. We support students in the development of a written, formal plan/program of study early in their career at our institution. (Voorhees, 2004)
1 NO
2
3
4
5 YES NA
72. We advise students on learning opportunities, such as research opportunities, study groups, mentoring, tutoring, internships, and work-study.
1 NO
2
3
4
5 YES NA
73. We refer students as needed to additional campus services and resources and/or to external agencies. (Miller, 2005)
1 NO
2
3
4
5 YES NA
74. We provide career exploration opportunities for students through our academic services.
1 NO
2
3
4
5 YES NA

Educational Policy Institute Institutional Student Retention Assessment
Academic Services V-12
PART C: BRIDGE PROGRAMS Bridge programs are usually held during the summer prior to matriculation for students whose academic weaknesses could place them "at risk" if they were permitted to enter the institution without such assistance. Bridge programs acculturate new students to the many facets of campus life, including culture, academic expectations, supplementary programs, etc., for the purpose of improving student success. Institutions should focus on developing academic transition or bridge programs between senior year in high school and the freshman year in college. On-campus intervention programs offered during the summer, including opportunities to become acclimated to the campus, work through some freshman problems before the first critical semester begins, receive academic support in areas of weakness, and become accustomed to the pace associated with college-level academic learning. (Swail, 2003; Kuh, et. al., 2005) C1. STRENGTHS & WEAKNESSES 75. Please describe below your institution’s main strategies/practices in this area.
Strategy 1
(ADD button) 76. Please describe below the strategies/practices that you believe have most effectively supported the
learning/development/success of students.
Success Strategy 1
Description of Strategy
Evidence of Success
(ADD button) 77. Please describe the challenges or areas of weakness of which you are aware along with potential solutions or
strategies to ameliorate these issues.
Challenge 1
Evidence
Solution Strategy
(ADD button)

Educational Policy Institute Institutional Student Retention Assessment
Academic Services V-13
C2. BRIDGE PROGRAM For each of the upcoming questions, please answer these supplementary questions. The online system will bring these up automatically. a) Please elaborate and describe. c) Provide empirical or institutional evidence to support your rating. b) On a scale of 1 – 5, where 1 is “no, not at all,” 3 is “somewhat/average,” and 5 is “yes, very much so,” do you believe this strategy could/does support student success?
1 NO
2
3
4
5 YES
d) Do you believe this area requires improvement? 1 NO 5
YES e) If yes, what could be done to improve the effectiveness of this area? Table 7. Academic Services Bridge Program Please answer the following questions and elaborate through the supplementary questions.
1 NO
2
3
4
5 YES NA
78. Our bridge programs acculturate students to our institutional mission, values, and culture.
1 NO
2
3
4
5 YES NA
79. Our bridge programs acculturate students to the aims and meaning of higher education and the nature of scholarly work.
1 NO
2
3
4
5 YES NA
80. Our bridge programs orient students to academic expectations and requirements and codes of conduct. (Miller, 2005; Kuh, et. al., 2005)
1 NO
2
3
4
5 YES NA
81. Our bridge programs orient students to campus resources and co-curricular opportunities.
1 NO
2
3
4
5 YES NA
82. Our bridge programs curriculum includes comprehensive social and academic developmental skills as well as enhancement and enrichment activities.
1 NO
2
3
4
5 YES NA
83. We monitor student progress in our bridge programs. (Swail, 2003) 1 NO
2
3
4
5 YES NA
84. We provide on-campus residency to students during bridge program participation. (Swail, 2003)
1 NO
2
3
4
5 YES NA

Educational Policy Institute Institutional Student Retention Assessment
Academic Services V-14
PART D: PRE-COLLEGE PROGRAMS Designed to motivate and prepare high school students for postsecondary education, pre-college programs provide an opportunity for the campus to work actively with elementary and secondary students, particularly those at risk or under-represented. They provide a range of services including, but not limited to, academic support, mentoring, college planning, financial aid information, and opportunities for parental involvement. Pre-college programs encourage and assist students who are traditionally under-represented in higher education because of income, family legacy, disability, or other relevant federal, state, provincial, or institutional criteria, in preparing for and entering college. (Miller, 2001) D1. STRENGTHS & WEAKNESSES 85. Please describe below your institution’s main strategies/practices in this area.
Strategy 1
(ADD button) 86. Please describe below the strategies/practices that you believe have most effectively supported the
learning/development/success of students.
Success Strategy 1
Description of Strategy
Evidence of Success
(ADD button) 87. Please describe the challenges or areas of weakness of which you are aware along with potential solutions or
strategies to ameliorate these issues.
Challenge 1
Evidence
Solution Strategy
(ADD button)

Educational Policy Institute Institutional Student Retention Assessment
Academic Services V-15
D2. PRE-COLLEGE PROGRAM For each of the upcoming questions, please answer these supplementary questions. The online system will bring these up automatically. a) Please elaborate and describe. c) Provide empirical or institutional evidence to support your rating. b) On a scale of 1 – 5, where 1 is “no, not at all,” 3 is “somewhat/average,” and 5 is “yes, very much so,” do you believe this strategy could/does support student success?
1 NO
2
3
4
5 YES
d) Do you believe this area requires improvement? 1 NO 5
YES e) If yes, what could be done to improve the effectiveness of this area? Table 8. Academic Services Pre-College Program Please answer the following questions and elaborate through the supplementary questions.
1 NO
2
3
4
5 YES NA
88. We maintain active partnerships with local schools and/or school systems. 1 NO
2
3
4
5 YES NA
89. We collect information from K-12 students regarding their interests in postsecondary education. (College Readiness for All Toolbox, undated)
1 NO
2
3
4
5 YES NA
90. We use a tracking system for participating students that includes goal-setting and assessment of progress toward goals and progress through postsecondary education. (College Readiness for All Toolbox, undated; Swail, 2003)
1 NO
2
3
4
5 YES NA
91. We assess the basic academic skills of all program participants. 1 NO
2
3
4
5 YES NA
92. We offer remedial programs in response to the assessed needs of program participants, with an emphasis on core skills and knowledge required for college success, such as reading, mathematics and quantitative reasoning, writing, critical thinking, problem solving, and study skills.
1 NO
2
3
4
5 YES NA
93. We employ a variety of strategies for delivering instruction, such as the use of instructional media such as print, video, audio, computers, and skills laboratories.
1 NO
2
3
4
5 YES NA
94. We provide flexibility for participants by offering remedial programs at various times (after-school, Saturday mornings) and locations (schools, community centers).
1 NO
2
3
4
5 YES NA
95. We require that all pre-college program participants utilize or work within the guidelines of our advising/coaching services.
1 NO
2
3
4
5 YES NA
96. We offer coaching and advising using a variety of techniques appropriate to meet students’ needs, including individual, group, peer, computer, and video session as necessary.
1 NO
2
3
4
5 YES NA
97. Our coaching services offer a mix of services appropriate to the needs of our student population.
1 NO
2
3
4
5 YES NA
98. Our coaching staff is effectively trained to respond to the unique needs of traditionally underserved and special student populations.
1 NO
2
3
4
5 YES NA
99. Our coaching/advising program provides information about the aims, nature, and benefits of higher education, as well as information about the postsecondary selection and admission process and financial aid.
1 NO
2
3
4
5 YES NA
100. Coaching services refers students to resources within their community when it cannot provide the expertise or service required.
1 NO
2
3
4
5 YES NA
101. We provide mentoring services to program participants, utilizing successful college students and/or graduates.
1 NO
2
3
4
5 YES NA
102. Mentors reinforce the real-life benefits of studying hard, staying in school, and attending postsecondary institutions.
1 NO
2
3
4
5 YES NA
103. Mentors provide social and personal support to program participants, such 1 2 3 4 5 NA

Educational Policy Institute Institutional Student Retention Assessment
Academic Services V-16
as guidance, assistance in resolving personal conflicts and problems, and friendship.
NO YES
104. We provide other forms of social support, such as opportunities to build leadership skills, including community service.
1 NO
2
3
4
5 YES NA
105. We support the social development of program participants using a variety of approaches, such as group activities and cultural outings.
1 NO
2
3
4
5 YES NA
106. We involve the parents, caregivers, and/or family of participants in the pre-college program in an effort to increase their knowledge of preparing their children for college.
1 NO
2
3
4
5 YES NA
107. We offer professional development to all program personnel (mentors, instructors, administrators, etc.) to increase the effectiveness of the program.
1 NO
2
3
4
5 YES NA
108. We offer professional development to teachers at participants’ schools to extend the impact of the pre-college program.
1 NO
2
3
4
5 YES NA
109. We offer effective professional development to instructors to develop their teaching ability.
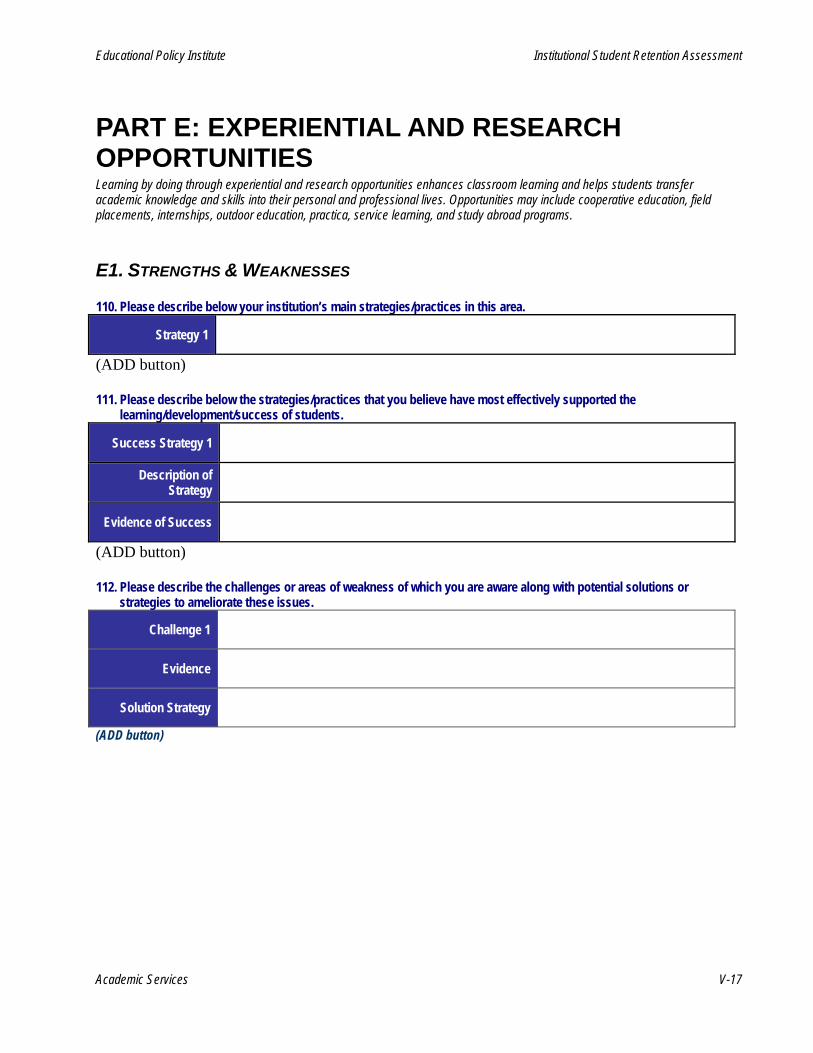
Educational Policy Institute Institutional Student Retention Assessment
Academic Services V-17
PART E: EXPERIENTIAL AND RESEARCH OPPORTUNITIES Learning by doing through experiential and research opportunities enhances classroom learning and helps students transfer academic knowledge and skills into their personal and professional lives. Opportunities may include cooperative education, field placements, internships, outdoor education, practica, service learning, and study abroad programs. E1. STRENGTHS & WEAKNESSES 110. Please describe below your institution’s main strategies/practices in this area.
Strategy 1
(ADD button) 111. Please describe below the strategies/practices that you believe have most effectively supported the
learning/development/success of students.
Success Strategy 1
Description of Strategy
Evidence of Success
(ADD button) 112. Please describe the challenges or areas of weakness of which you are aware along with potential solutions or
strategies to ameliorate these issues.
Challenge 1
Evidence
Solution Strategy
(ADD button)

Educational Policy Institute Institutional Student Retention Assessment
Academic Services V-18
E2. EXPERIENTIAL AND RESEARCH OPPORTUNITIES FOR STUDENTS For each of the upcoming questions, please answer these supplementary questions. The online system will bring these up automatically. a) Please elaborate and describe. c) Provide empirical or institutional evidence to support your rating. b) On a scale of 1 – 5, where 1 is “no, not at all,” 3 is “somewhat/average,” and 5 is “yes, very much so,” do you believe this strategy could/does support student success?
1 NO
2
3
4
5 YES
d) Do you believe this area requires improvement? 1 NO 5
YES e) If yes, what could be done to improve the effectiveness of this area? Table 9. Academic Services Experiential Programs Please answer the following questions and elaborate through the supplementary questions.
1 NO
2
3
4
5 YES
NA
113. We encourage and/or require students to participate in on- or off-campus experiential activities, such as service learning, internships, practica, and field placements, so that students gain experience in applying what they are learning to real-life situations. (Kuh, et. al., 2005; Swail, 2003)
1 NO
2
3
4
5 YES NA
114. Information on experiential opportunities is openly posted and accessible to students.
1 NO
2
3
4
5 YES NA
115. We offer international and study abroad experiences throughout the curriculum. (Kuh, et. al., 2005)
1 NO
2
3
4
5 YES NA
116. We recognize student scholarship by providing opportunities for students to present their research or creative projects. (Kuh, et. al., 2005)
1 NO
2
3
4
5 YES NA
117. We strongly encourage the development of faculty-student research projects outside of course program requirements. (Swail, 2003)
1 NO
2
3
4
5 YES NA
118. Our faculty regularly integrates experiential and research activities into course curricula. (Swail, 2003)
1 NO
2
3
4
5 YES NA
119. We identify and/or provide grant opportunities to faculty to support classroom research with student involvement. (Swail, 2003)
1 NO
2
3
4
5 YES NA
120. We collaborate regularly with business and industry to provide in-class presentations and experiments. (Swail, 2003)
1 NO
2
3
4
5 YES NA
121. We maintain formal partnerships with industry to provide experiential and research opportunities for our students and faculty. (Swail, 2003)
1 NO
2
3
4
5 YES NA
122. We ensure that the contributions of students to research projects are recognized appropriately (e.g. recognized as a co-author or collaborator in a formal sense).
1 NO
2
3
4
5 YES NA

Educational Policy Institute Institutional Student Retention Assessment
Academic Services V-19
PART F: SUPPLEMENTARY INSTRUCTION PROGRAMS The [supplementary instruction] program must promote learning and development in students through assessing and teaching the cognitive and affective skills and strategies necessary for achieving academic and personal learning goals. (Miller, 2001, p. 165) F1. STRENGTHS & WEAKNESSES 123. Please describe below your institution’s main strategies/practices in this area.
Strategy 1
(ADD button) 124. Please describe below the strategies/practices that you believe have most effectively supported the
learning/development/success of students.
Success Strategy 1
Description of Strategy
Evidence of Success
(ADD button) 125. Please describe the challenges or areas of weakness of which you are aware along with potential solutions or
strategies to ameliorate these issues.
Challenge 1
Evidence
Solution Strategy
(ADD button)

Educational Policy Institute Institutional Student Retention Assessment
Academic Services V-20
F2. LEARNING ASSISTANCE PROGRAM For each of the upcoming questions, please answer these supplementary questions. The online system will bring these up automatically. a) Please elaborate and describe. c) Provide empirical or institutional evidence to support your rating. b) On a scale of 1 – 5, where 1 is “no, not at all,” 3 is “somewhat/average,” and 5 is “yes, very much so,” do you believe this strategy could/does support student success?
1 NO
2
3
4
5 YES
d) Do you believe this area requires improvement? 1 NO 5
YES e) If yes, what could be done to improve the effectiveness of this area? Table 10. Academic Services Learning Assistance Program Please answer the following questions and elaborate through the supplementary questions.
1 NO
2
3
4
5 YES
NA
126. We have a policy of assessing the basic skills of entering students, and this assessment is supported by a policy requiring placement of students into appropriate remedial classes or learning experiences. (Voorhees, 2004)
1 NO
2
3
4
5 YES NA
127. Our learning assistance program provides instruction for the development of reading, mathematics and quantitative reasoning, writing, critical thinking, problem solving, and study skills. (Miller, 2001)
1 NO
2
3
4
5 YES NA
128. We employ a variety of strategies for delivering instruction, such as the use of instructional media, including print, video, audio, computers, and skills laboratories. (Miller, 2001)
1 NO
2
3
4
5 YES NA
129. We provide flexibility for students by offering our remedial classes at various times as well as on the main campus, satellite campuses, and through distance learning. (Miller, 2001; Voorhees, 2004)
1 NO
2
3
4
5 YES NA
130. Our learning assistance program provides systematic feedback to students concerning their progress. (Miller, 2001)
1 NO
2
3
4
5 YES NA
131. Our learning assistance program teaches self-feedback methods utilizing self-monitoring strategies. (Miller, 2001)
1 NO
2
3
4
5 YES NA
132. Our learning assistance program gives students practice in applying and transferring skills and strategies learned in the program to academic tasks across the curriculum. (Miller, 2001)
1 NO
2
3
4
5 YES NA
133. We regularly communicate information about our learning assistance program to staff, faculty, and administrators. (Miller, 2001)
1 NO
2
3
4
5 YES NA
134. Our learning assistance program refers students to appropriate campus and community resources for assistance with issues that are beyond the expertise of its staff. (Miller, 2001)
1 NO
2
3
4
5 YES NA

Educational Policy Institute Institutional Student Retention Assessment
Academic Services V-21
F3. SUPPLEMENTAL INSTRUCTION PROGRAM For each of the upcoming questions, please answer these supplementary questions. The online system will bring these up automatically. a) Please elaborate and describe. c) Provide empirical or institutional evidence to support your rating. b) On a scale of 1 – 5, where 1 is “no, not at all,” 3 is “somewhat/average,” and 5 is “yes, very much so,” do you believe this strategy could/does support student success?
1 NO
2
3
4
5 YES
d) Do you believe this area requires improvement? 1 NO 5
YES e) If yes, what could be done to improve the effectiveness of this area? Table 11. Academic Services Supplemental Instruction Please answer the following questions and elaborate through the supplementary questions.
1 NO
2
3
4
5 YES
NA
135. We have a procedure in place to identify at-risk courses in which a sizeable number of students have difficulty in meeting academic requirements. (Arendale, 1994)
1 NO
2
3
4
5 YES NA
136. Our supplemental instruction is attached directly to at-risk courses. (Arendale, 1994)
1 NO
2
3
4
5 YES NA
137. We are proactive in offering supplemental instruction, offering it to students enrolled in a high-risk course the first week of the semester. (Arendale, 1994)
1 NO
2
3
4
5 YES NA
138. Our supplemental instruction integrates course content with effective learning and teaching strategies. (Arendale, 1994)
1 NO
2
3
4
5 YES NA
139. Our supplemental instruction sessions utilize peer study groups. (Arendale, 1994; Swail, 2003)
1 NO
2
3
4
5 YES NA
140. Our supplemental instruction leaders provide useful feedback from students to course instructors. (Arendale, 1994)
1 NO
2
3
4
5 YES NA
141. We deliver supplemental instruction for both on-site and distance learning courses.
1 NO
2
3
4
5 YES NA
142. We provide flexibility by scheduling supplemental instruction at times convenient to participating students. (Arendale, 1994)
1 NO
2
3
4
5 YES NA
143. We recruit supplemental instruction leaders through consultation with faculty. (Arendale, 1994)
1 NO
2
3
4
5 YES NA
144. We have a high-level training program for supplemental instruction leaders that includes strategies such as mock supplemental instruction session participation and a review of issues and activities including session supervision, leadership training, collaborative strategies, data collection and analysis. (Arendale, 1994)
1 NO
2
3
4
5 YES NA
145. Our supplemental instruction program refers students to appropriate campus and community resources for assistance with issues that are beyond the expertise of its staff. (Miller, 2001)
1 NO
2
3
4
5 YES NA

Educational Policy Institute Institutional Student Retention Assessment
Academic Services V-22
F4. MENTORING AND/OR TUTORING PROGRAM For each of the upcoming questions, please answer these supplementary questions. The online system will bring these up automatically. a) Please elaborate and describe. c) Provide empirical or institutional evidence to support your rating. b) On a scale of 1 – 5, where 1 is “no, not at all,” 3 is “somewhat/average,” and 5 is “yes, very much so,” do you believe this strategy could/does support student success?
1 NO
2
3
4
5 YES
d) Do you believe this area requires improvement? 1 NO 5
YES e) If yes, what could be done to improve the effectiveness of this area? Table 12. Academic Services Mentoring/Tutoring Programs Please answer the following questions and elaborate through the supplementary questions.
1 NO
2
3
4
5 YES
NA
146. We have a recruitment strategy for mentors or tutors in place that includes an accurate portrayal of the expectations and benefits of the position and incentives for participation. (US Department of Education, 1998; Swail, 2003)
1 NO
2
3
4
5 YES NA
147. We recruit faculty and staff, as well as exemplary students (e.g. teaching assistants, research assistants, and exemplary undergraduates) to serve as mentors or tutors. (Swail, 2003)
1 NO
2
3
4
5 YES NA
148. We encourage alumni to participate as mentors and/or tutors. 1 NO
2
3
4
5 YES NA
149. We have a thorough screening process for potential tutors or mentors in place, which may include a formal application, interview, reference checks, and review of suitability criteria that relate to the needs of the target student population. (US Department of Education, 1998)
1 NO
2
3
4
5 YES NA
150. We have a training program for mentors or tutors that may include an orientation to the program, skills development (as appropriate), cultural sensitivity training, and addressing issues of confidentiality. (US Department of Education, 1998)
1 NO
2
3
4
5 YES NA
151. We use a matching strategy that may include a commitment to consistency, appropriate criteria for matches (e.g. gender, ethnicity, language requirements, life experience, academic major), signed statement of understanding, pre-match social activities, and team-building activities at the time of the first meeting. (US Department of Education, 1998; Swail, 2003; Kuh, et. al., 2005)
1 NO
2
3
4
5 YES NA
152. We deliver tutoring and mentoring services in a variety of formats, such as face-to-face, by telephone, and via the Internet.
1 NO
2
3
4
5 YES NA
153. We have a monitoring system in place that may include consistent, scheduled meetings with staff, mentors or tutors, and participants; a tracking system for ongoing assessment; written records; and a process for managing grievances. (US Department of Education, 1998)
1 NO
2
3
4
5 YES NA
154. We have a support, recognition, and retention component that may include ongoing peer support groups for tutors/mentors and participants; ongoing training; relevant issue discussion and information dissemination; and social gatherings. (US Department of Education, 1998)
1 NO
2
3
4
5 YES NA
155. We regularly communicate information about our tutoring or mentoring program to staff, faculty, and administrators.
1 NO
2
3
4
5 YES NA
156. Our tutoring or mentoring program refers students to appropriate campus and community resources for assistance with issues that are beyond the expertise of its staff.
1 NO
2
3
4
5 YES NA
Educational Policy Institute Institutional Student Retention Assessment
Academic Services V-23
SOURCES CITED Arendale, D. (1994). “Understanding the Supplemental Instruction model.” In D. C. Martin, & D. Arendale (Eds.), Supplemental Instruction: Increasing achievement and retention. San Francisco, CA: Jossey-Bass, Inc. Retrieved April 20, 2006, from: http://www.doso.wayne.edu/SASS/Tinto%20Articles/Supplemental%20Instruction%20(SI)%20Model.pdf. College Readiness for All Toolbox. (undated). How Schools and Outreach Programs Can Work Together. Retrieved April 20, 2006, from: http://www.pathwaystocollege.net/collegereadiness/toolbox/imp_together.asp. Crockett, David S. Crockett, Ed.(1987). Advising Skills, Techniques and Resources: A Compilation of Materials Related to the Organization and Delivery of Advising Services. Iowa City, Iowa . ACT Corporation. Guskey, Thomas R. (2000). Evaluating Professional Development. Thousand Oaks, Ca.: Corwin Press. Jager-Hyman, Joie. (2004). Pre-College Outreach Programs for Low-Income Students: A Literature Review. Retrieved on April 21, 2006, from: http://www.ed.gov/about/bdscomm/list/acsfa/precoll.doc. Miller, Theodore K. (2005). Academic Advising: Miller Standards and Guidelines. Washington, DC: Council for the Advancement of Standards in Higher Education. Retrieved April 18, 2006, from: http://www.nacada.ksu.edu/Clearinghouse/Research_Related/MillerStandardsForAdvising.pdf.
Nutt, Charlie. (2004). “Assessing Student Learning in Academic Advising.” Academic Advising Today - Quarterly Newsletter (Vol. 27, No. 4). Retrieved April 18, 2006, from: http://www.nacada.ksu.edu/AAT/NW27_4.htm#6.
Pennsylvania State University, Center for Excellence in Academic Advising. (undated). Components of Academic Advising. Retrieved April 18, 2006, from: http://www.psu.edu/dus/cfe/rolcompn.htm. Swail, Watson S., Redd, Kenneth E., & Perna, Laura W. (2003). Retaining Minority Students in Higher Education: A Framework for Success. ASHE-ERIC Higher Education Report: Vol. 30, No. 2. San Francisco, CA: Wiley Periodicals, Inc. UNESCO. (2002). The Role of Student Affairs and Services in Higher Education: A Practical Manual for Developing, Implementing and Assessing Student Affairs Programmes and Services. Paris, France: United Nations Educational, Scientific and Cultural Organization (UNESCO). Retrieved April 18, 2006, from: http://www.nacada.ksu.edu/Clearinghouse/AdvisingIssues/UNESCO.htm. US Department of Education. (1998). Yes, You Can: A Guide for Establishing Mentoring Programs to Prepare Youth for College. Retrieved April 20, 2006, from: www.ed.gov/pubs/YesYouCan/sect3-checklist.html. Voorhees, Richard. (2004). Framework: Retention Audit. Paper prepared for the Educational Policy Institute. Stafford, VA.
Educational Policy Institute Institutional Student Retention Assessment
Part II: The Institutional Student Retention Assessment VI-1
Section VI: Teaching & Learning

Educational Policy Institute Institutional Student Retention Assessment
Teaching & Learning VI-2
TABLE OF CONTENTS SECTION VI: Teaching & Learning .................................................................................................................... 3
Introduction .................................................................................................................................................... 3
PART A. Strategic Framework ........................................................................................................................... 4 A1. Mission .................................................................................................................................................... 4 A2. Goals & Objectives .................................................................................................................................. 4 A3. Policy & Practice ...................................................................................................................................... 5 A4. Assessment and Evaluation ..................................................................................................................... 6
PART B: Curriculum Development & Revision ................................................................................................ 8 B1. Strengths & Weaknesses ......................................................................................................................... 8 B2. Program Considerations .......................................................................................................................... 9
PART C: Instructional Strategies .................................................................................................................... 11 C1. Strengths & Weaknesses ...................................................................................................................... 11 C2. Program Considerations ........................................................................................................................ 12
PART D: Assessment Strategies ..................................................................................................................... 14 D1. Strengths & Weaknesses ...................................................................................................................... 14 D2. Program Considerations ........................................................................................................................ 15
SOURCES CITED .............................................................................................................................................. 16
Table of Tables Table 1. Teaching & Learning Mission .................................................................................................................. 4 Table 2. Teaching & Learning Goals & Objectives ............................................................................................... 4 Table 3. Teaching & Learning Policy & Practice ................................................................................................... 5 Table 4. Teaching & Learning Assessment & Evaluation ..................................................................................... 6 Table 5. Teaching & Learning Curriculum Development ...................................................................................... 9 Table 6. Teaching & Learning Instructional Strategies ....................................................................................... 12 Table 7. Teaching & Learning Assessment Strategies ....................................................................................... 15

Educational Policy Institute Institutional Student Retention Assessment
Teaching & Learning VI-3
SECTION VI: TEACHING & LEARNING The quality of students’ academic experience is an important factor in their ability to persist. Quality learning experiences are characterized by enriched student-faculty contact, cooperation among students, active learning, opportunities for feedback, the communication of high expectations, an emphasis on time on task, and a respect for diverse talents and ways of learning. When combined with an institutional commitment to an integrated process of curriculum review and the use of multifaceted assessment strategies, the potential of students to succeed is greatly enhanced. (Woodard, Mallory, & DeLuca, 2001; Cross, 1998; Chickering & Gamson, 1999; Swail, 2003)
INTRODUCTION Each institutional team’s approach to this section will be unique, since very few institutions have an office or unit charged with responsibility for an institution’s overall curriculum and instructional and classroom assessment strategies. Consider if your ‘target’ is the entire campus, individual programs, or the institution’s general education program, then decide who on your campus should be involved in this type of review. For example, if you intend to review curriculum, teaching, and learning on a campus-wide basis, recruit stakeholders representing the full range of academic divisions or programs on your campus. This assessment provides your institution with an overview of what is already in place. We strongly recommend that you print each assessment section [link to printable assessment section] and use it as a discussion agenda with your team prior to entering data. Part of your team’s work will be to collect the required information as part of the assessment process. [add more detailed instructions about saving data, etc.]
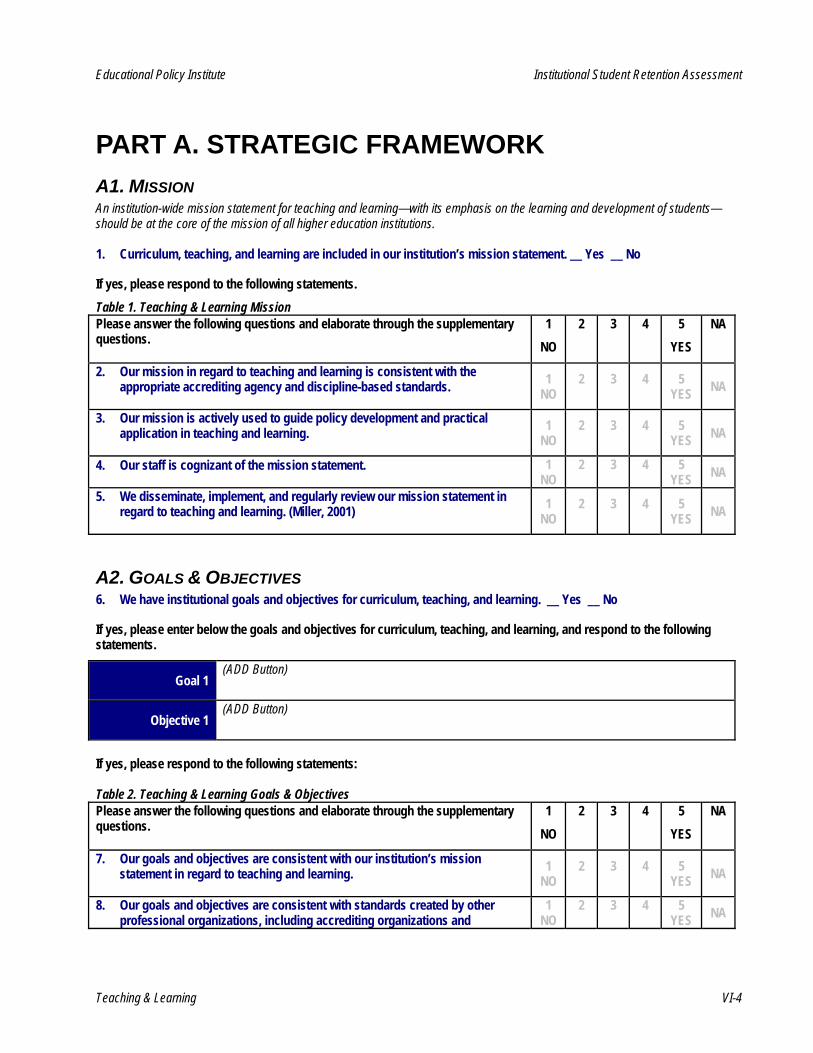
Educational Policy Institute Institutional Student Retention Assessment
Teaching & Learning VI-4
PART A. STRATEGIC FRAMEWORK A1. MISSION An institution-wide mission statement for teaching and learning—with its emphasis on the learning and development of students—should be at the core of the mission of all higher education institutions. 1. Curriculum, teaching, and learning are included in our institution’s mission statement. __ Yes __ No
If yes, please respond to the following statements. Table 1. Teaching & Learning Mission Please answer the following questions and elaborate through the supplementary questions.
1 NO
2
3
4
5 YES
NA
2. Our mission in regard to teaching and learning is consistent with the appropriate accrediting agency and discipline-based standards. 1
NO 2
3
4
5 YES NA
3. Our mission is actively used to guide policy development and practical application in teaching and learning. 1
NO 2
3
4
5 YES NA
4. Our staff is cognizant of the mission statement. 1 NO
2
3
4
5 YES NA
5. We disseminate, implement, and regularly review our mission statement in regard to teaching and learning. (Miller, 2001) 1
NO 2
3
4
5 YES NA
A2. GOALS & OBJECTIVES 6. We have institutional goals and objectives for curriculum, teaching, and learning. __ Yes __ No
If yes, please enter below the goals and objectives for curriculum, teaching, and learning, and respond to the following statements.
Goal 1 (ADD Button)
Objective 1 (ADD Button)
If yes, please respond to the following statements: Table 2. Teaching & Learning Goals & Objectives Please answer the following questions and elaborate through the supplementary questions.
1 NO
2
3
4
5 YES
NA
7. Our goals and objectives are consistent with our institution’s mission statement in regard to teaching and learning. 1
NO 2
3
4
5 YES NA
8. Our goals and objectives are consistent with standards created by other professional organizations, including accrediting organizations and
1 NO
2
3
4
5 YES NA

Educational Policy Institute Institutional Student Retention Assessment
Teaching & Learning VI-5
discipline-base organizations.
9. We disseminate, implement, and regularly review our goals and objectives. (Miller, 2001) 1
NO 2
3
4
5 YES NA
10. Our goals and objectives focus on student success. 1 NO
2
3
4
5 YES NA
11. Our goals and objectives are actively used to guide policy development and practical application. 1
NO 2
3
4
5 YES NA
12. Our staff is cognizant of the goals and objectives. 1 NO
2
3
4
5 YES NA
A3. POLICY & PRACTICE For each of the upcoming questions, please answer these supplementary questions. The online system will bring these up automatically. a) Please elaborate and describe.
c) Provide empirical or institutional evidence to support your rating. b) On a scale of 1 – 5, where 1 is “no, not at all,” 3 is “somewhat/average,” and 5 is “yes, very much so,” do you believe this strategy could/does support student success?
1
NO
2
3
4
5
YES
d) Do you believe this area requires improvement? 1 NO 5
YES
e) If yes, what could be done to improve the effectiveness of this area? Table 3. Teaching & Learning Policy & Practice Please answer the following questions and elaborate through the supplementary questions.
1 NO
2
3
4
5 YES
NA
13. Our faculty, including teaching assistants, is well trained in curriculum, teaching, and assessment strategies strongly correlated to student success. 1
NO 2
3
4
5 YES NA
14. Our faculty, including teaching assistants, is well trained to engage and teach a diverse set of students. 1
NO 2
3
4
5 YES NA
15. Our policies and practices in regard to curriculum, teaching, and learning include criteria for the appointment, supervision, and review of teaching effectiveness for faculty.
1 NO
2
3
4
5 YES NA
16. Our policies and practices in regard to curriculum, teaching, and learning include criteria for the appointment, supervision, and review of teaching effectiveness for part-time, adjunct, and other faculty consistent with those for full-time faculty.
1 NO
2
3
4
5 YES NA
17. Our policies and practices in regard to curriculum, teaching, and learning are well articulated to faculty and departments throughout the campus. 1
NO 2
3
4
5 YES NA
18. Our policies and practices in regard to curriculum, teaching, and learning are shared with and easily and clearly understood by prospective students and
1 NO
2
3
4
5 YES NA

Educational Policy Institute Institutional Student Retention Assessment
Teaching & Learning VI-6
their families.
19. Our policies and practices in regard to curriculum, teaching, and learning are shared with and easily and clearly understood by high school and/or community college counselors, faculty, other personnel, and the general public.
1 NO
2
3
4
5 YES NA
20. Our policies and practices in regard to curriculum, teaching, and learning are consistent with statements of good practices articulated by relevant and appropriate accrediting agencies and/or professional or discipline-based organizations.
1 NO
2
3
4
5 YES NA
21. Our policies and practices in regard to curriculum, teaching, and learning emphasize student development and success as their primary concerns. 1
NO 2
3
4
5 YES NA
22. We regularly review our policies and practices in regard to curriculum, teaching, and learning as they serve and impact students on a regularly scheduled basis.
1 NO
2
3
4
5 YES NA
23. We work with local schools and/or school systems to ensure alignment of admission requirements and school curriculum and activities. ( College Readiness for All Toolbox, undated)
24. Our policies and practices in regard to curriculum, teaching, and learning were cooperatively developed by faculty, staff, and administrators. 1
NO 2
3
4
5 YES NA
25. Policies addressing curriculum, teaching, and learning are centralized and made at the administrative level for our campus. 1
NO 2
3
4
5 YES NA
A4. ASSESSMENT AND EVALUATION Table 4. Teaching & Learning Assessment & Evaluation 1
NO 2
3
4
5 YES
NA
26. Our policies outline procedures and criteria for evaluation of instruction. 27. We regularly conduct systematic evaluations to determine whether and to
what degree the stated goals and objectives related to curriculum, teaching, and learning are being met.
1 NO
2
3
4
5 YES NA
28. We have a clearly articulated assessment plan. 1 NO
2
3
4
5 YES NA
29. We employ a sufficient range of measures to ensure objectivity and comprehensiveness. (Miller, 2001) 1
NO 2
3
4
5 YES NA
30. We collect feedback from students and other affected constituencies about activities and strategies related to curriculum, teaching, and learning. 1
NO 2
3
4
5 YES NA
31. We conduct analyses to determine the impact of curriculum and teaching on student success, retention, and persistence. 1
NO 2
3
4
5 YES NA

Educational Policy Institute Institutional Student Retention Assessment
Teaching & Learning VI-7
32. We review the results of these evaluations and use them to revise and improve curriculum, teaching, and assessment. (Miller, 2001) 1
NO 2
3
4
5 YES NA
33. Please describe below your institution’s evaluation plan for curriculum and instruction.
34. Describe how you assess the effectiveness of curricula.
35. Describe how you assess the effectiveness of instruction.
36. Describe how you assess student learning.

Educational Policy Institute Institutional Student Retention Assessment
Teaching & Learning VI-8
PART B: CURRICULUM DEVELOPMENT & REVISION “Learning and teaching are the heart of [a postsecondary institution]. In the community of learning, all students—whether they are enrolled in a degree program or a single course—engage in the opportunities and resources of the campus and the [institution] as a whole. Faculty members achieve their highest capabilities as their work to advance knowledge and creative achievement also inspires their teaching. Students benefit in immeasurable ways from this inspiration. In turn, students learn from one another and teach their teachers, challenging them constantly to experiment with the content and method of their courses. These interactions among students and teachers make great [institutions’] communities of learning where all participate in the excitement of discovery.” (Indiana University, 1996, p. 6)
B1. STRENGTHS & WEAKNESSES 37. Please describe below your institution’s main strategies/practices in this area.
Strategy 1
(ADD button) 38. Please describe below the strategies/practices that you believe have most effectively supported the
learning/development/success of students.
Success Strategy 1
Description of Strategy
Evidence of Success
(ADD button) 39. Please describe the challenges or areas of weakness of which you are aware along with potential solutions or
strategies to ameliorate these issues.
Challenge 1
Evidence
Solution Strategy
(ADD button)

Educational Policy Institute Institutional Student Retention Assessment
Teaching & Learning VI-9
B2. PROGRAM CONSIDERATIONS For each of the upcoming questions, please answer these supplementary questions. The online system will bring these up automatically. a) Please elaborate and describe.
c) Provide empirical or institutional evidence to support your rating. b) On a scale of 1 – 5, where 1 is “no, not at all,” 3 is “somewhat/average,” and 5 is “yes, very much so,” do you believe this strategy could/does support student success?
1
NO
2
3
4
5
YES
d) Do you believe this area requires improvement? 1 NO 5
YES e) If yes, what could be done to improve the effectiveness of this area? Table 5. Teaching & Learning Curriculum Development Please answer the following questions and elaborate through the supplementary questions.
1 NO
2
3
4
5 YES
NA
40. Our review of curricula tests for consistency with the institution’s mission, values, goals, and objectives. 1
NO 2
3
4
5 YES NA
41. We design curricula with interdisciplinary and real-world emphasis to stimulate student interest and understanding. (Swail, 2003) 1
NO 2
3
4
5 YES NA
42. We work with local and regional school districts to align competencies for first year coursework with appropriate exit standards for K-12 schools. (Voorhees, 2004)
1 NO
2
3
4
5 YES NA
43. We have developed a continuous review process of curricula utilizing faculty, students, and outside consultation. (Swail, 2003) 1
NO 2
3
4
5 YES NA
44. The faculty and other professionals responsible for curriculum review are academically prepared and qualified for this task. 1
NO 2
3
4
5 YES NA
45. Our curriculum review process involves a comprehensive review and analysis of relevant documents and data, such as graduate transcripts, syllabi, and course audits. (Kramer & LaMar, 2000)
1 NO
2
3
4
5 YES NA
46. Our curriculum review process involves reviewing results from the institution’s implemented outcomes assessment plan. 1
NO 2
3
4
5 YES NA
47. Our curriculum review process involves the development and use of curriculum maps. 1
NO 2
3
4
5 YES NA
48. We ensure that program and course goals are stated in terms of student learning outcomes. 1
NO 2
3
4
5 YES NA
49. We ensure that program curricula are relevant to student goals, interests, and career aspirations. 1
NO 2
3
4
5 YES NA
50. We have established high, yet attainable, learning outcomes or performance standards for our students. (Chickering & Gamson, 1999; Kuh, et. al., 2005; Woodard, Mallory, & DeLuca, 2001)
1 NO
2
3
4
5 YES NA
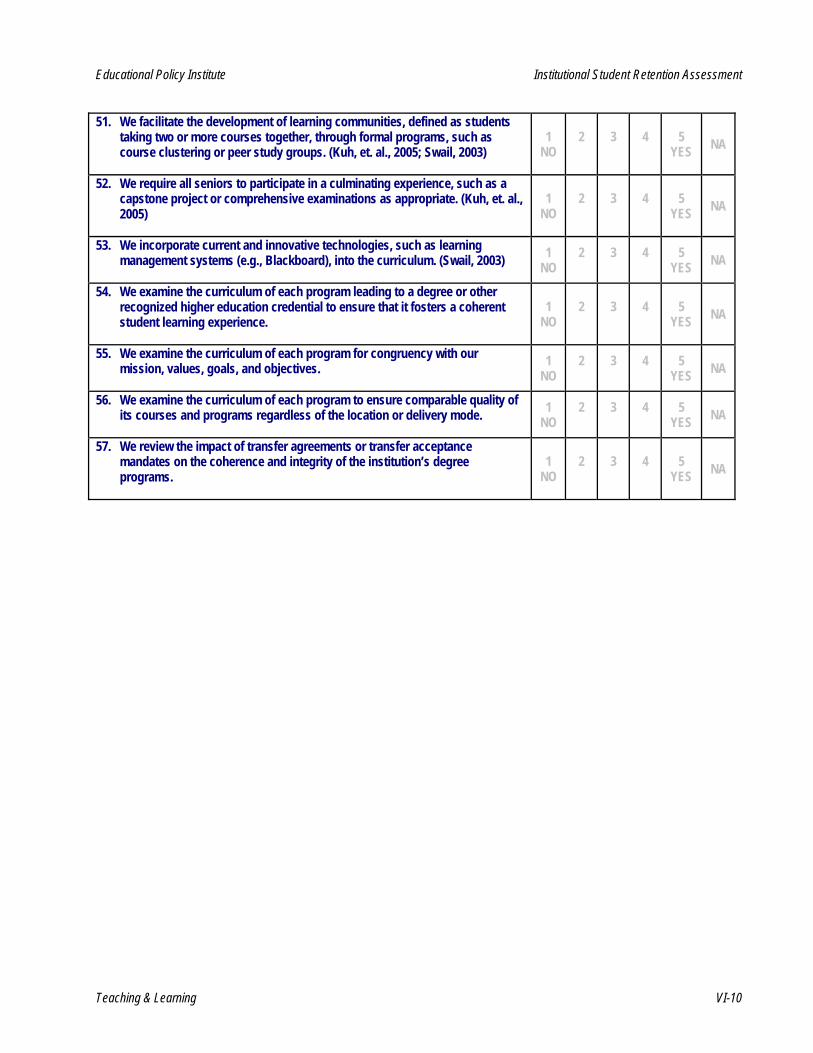
Educational Policy Institute Institutional Student Retention Assessment
Teaching & Learning VI-10
51. We facilitate the development of learning communities, defined as students taking two or more courses together, through formal programs, such as course clustering or peer study groups. (Kuh, et. al., 2005; Swail, 2003)
1 NO
2
3
4
5 YES NA
52. We require all seniors to participate in a culminating experience, such as a capstone project or comprehensive examinations as appropriate. (Kuh, et. al., 2005)
1 NO
2
3
4
5 YES NA
53. We incorporate current and innovative technologies, such as learning management systems (e.g., Blackboard), into the curriculum. (Swail, 2003) 1
NO 2
3
4
5 YES NA
54. We examine the curriculum of each program leading to a degree or other recognized higher education credential to ensure that it fosters a coherent student learning experience.
1 NO
2
3
4
5 YES NA
55. We examine the curriculum of each program for congruency with our mission, values, goals, and objectives. 1
NO 2
3
4
5 YES NA
56. We examine the curriculum of each program to ensure comparable quality of its courses and programs regardless of the location or delivery mode. 1
NO 2
3
4
5 YES NA
57. We review the impact of transfer agreements or transfer acceptance mandates on the coherence and integrity of the institution’s degree programs.
1 NO
2
3
4
5 YES NA

Educational Policy Institute Institutional Student Retention Assessment
Teaching & Learning VI-11
PART C: INSTRUCTIONAL STRATEGIES Good practice in undergraduate education encourages student-faculty contact, cooperation among student, and active learning; emphasizes prompt feedback and adequate time on task; and communicates high expectations to students. It also provides an academic environment in which diverse ways of learning are respected. (Chickering & Gamson, 1999)
C1. STRENGTHS & WEAKNESSES
58. Please describe below your institution’s main strategies/practices in this area.
Strategy 1
(ADD button) 59. Please describe below the strategies/practices that you believe have most effectively supported the
learning/development/success of students.
Success Strategy 1
Description of Strategy
Evidence of Success
(ADD button) 60. Please describe the challenges or areas of weakness of which you are aware along with potential solutions or
strategies to ameliorate these issues.
Challenge 1
Evidence
Solution Strategy
(ADD button)

Educational Policy Institute Institutional Student Retention Assessment
Teaching & Learning VI-12
C2. PROGRAM CONSIDERATIONS For each of the upcoming questions, please answer these supplementary questions. The online system will bring these up automatically. a) Please elaborate and describe.
c) Provide empirical or institutional evidence to support your rating. b) On a scale of 1 – 5, where 1 is “no, not at all,” 3 is “somewhat/average,” and 5 is “yes, very much so,” do you believe this strategy could/does support student success?
1
NO
2
3
4
5
YES
d) Do you believe this area requires improvement? 1 NO 5
YES e) If yes, what could be done to improve the effectiveness of this area? Table 6. Teaching & Learning Instructional Strategies Please answer the following questions and elaborate through the supplementary questions.
1 NO
2
3
4
5 YES
NA
61. Our faculty communicates to students the high, yet achievable, learning outcomes or expectations for courses. 1
NO 2
3
4
5 YES NA
62. Our faculty provides adequate time on task for students to learn the knowledge, skills, and/or abilities imparted by each course. 1
NO 2
3
4
5 YES NA
63. Our faculty provides sufficient information for students to learn the knowledge, skills, and/or abilities imparted by each course. 1
NO 2
3
4
5 YES NA
64. Our faculty recognizes and understands the diverse learning styles of their students. (Woodard, Mallory, & Deluca, 2001) 1
NO 2
3
4
5 YES NA
65. Our faculty uses diverse instructional strategies, such as discussion, reflective activities, and small group assignments, in response to the diverse learning styles of its students. (Woodard, Mallory, & Deluca, 2001)
1 NO
2
3
4
5 YES NA
66. Our faculty use instructional strategies that facilitate active learning, such as discussion, reflective activities, research and application activities, student presentations, debate, et cetera. (Chickering & Gamson, 1999; Kuh, et. al., 2005; Swail, 2003; Woodard, Mallory, & DeLuca, 2001)
1 NO
2
3
4
5 YES NA
67. Our faculty give students multiple opportunities to exercise higher order communication (written & verbal), critical thinking, and problem-solving skills. (Woodard, Mallory, & Deluca, 2001)
1 NO
2
3
4
5 YES NA
68. Our faculty use instructional strategies that facilitate learning from peers, such as group projects, study groups, learning communities, and peer tutoring. (Kuh, et. al., 2005; Swail, 2003; Woodard, Mallory, & DeLuca, 2001)
1 NO
2
3
4
5 YES NA
69. Our faculty provides students with the opportunity to synthesize knowledge and skills learned in the context of a single problem or setting (e.g. short- and long-term research; application assignment). (Swail, 2003; Woodard, Mallory, & DeLuca, 2001)
1 NO
2
3
4
5 YES NA
70. Our faculty uses educational technologies to complement instruction. (Swail, 1 2 3 4 5 NA

Educational Policy Institute Institutional Student Retention Assessment
Teaching & Learning VI-13
2003) NO YES
71. Our faculty helps students learn how to effectively manage time by underscoring the importance of regular work, steady application, self-pacing, and scheduling. (Woodard, Mallory, & DeLuca, 2001)
1 NO
2
3
4
5 YES NA
72. Our faculty interacts frequently with students outside of the classroom, including formal interactions, such as academic advising, and/or informal interactions, including attending campus events and activities, such as symposia, guest lectures, et cetera. (Kuh, et. al., 2005; Swail, 2003; Woodard, Mallory, & DeLuca, 2001)
1 NO
2
3
4
5 YES NA
73. We provide Supplemental Instruction in support of students enrolled in high-risk course. (Swail, 2003) 1
NO 2
3
4
5 YES NA
Educational Policy Institute Institutional Student Retention Assessment
Teaching & Learning VI-14
PART D: ASSESSMENT STRATEGIES “Campuses should design and implement new multifaceted assessment techniques that regard the integrity of human learning and understanding. Teaching and learning practices that require students to evaluate, synthesize, analyze, and create also require new methods of assessing students’ progress.” (Swail, 2003, p. 107)
D1. STRENGTHS & WEAKNESSES
74. Please describe below your institution’s main strategies/practices in this area.
Strategy 1
(ADD button) 75. Please describe below the strategies/practices that you believe have most effectively supported the
learning/development/success of students.
Success Strategy 1
Description of Strategy
Evidence of Success
(ADD button) 76. Please describe the challenges or areas of weakness of which you are aware along with potential solutions or
strategies to ameliorate these issues.
Challenge 1
Evidence
Solution Strategy
(ADD button)

Educational Policy Institute Institutional Student Retention Assessment
Teaching & Learning VI-15
D2. PROGRAM CONSIDERATIONS For each of the upcoming questions, please answer these supplementary questions. The online system will bring these up automatically. a) Please elaborate and describe.
c) Provide empirical or institutional evidence to support your rating. b) On a scale of 1 – 5, where 1 is “no, not at all,” 3 is “somewhat/average,” and 5 is “yes, very much so,” do you believe this strategy could/does support student success?
1
NO
2
3
4
5
YES
d) Do you believe this area requires improvement? 1 NO 5
YES
e) If yes, what could be done to improve the effectiveness of this area? Table 7. Teaching & Learning Assessment Strategies Please answer the following questions and elaborate through the supplementary questions.
1 NO
2
3
4
5 YES
NA
77. We have established high, yet attainable, performance standards for our students. (Chickering & Gamson, 1999; Kuh, et. al., 2005; Woodard, Mallory, & DeLuca, 2001)
1 NO
2
3
4
5 YES NA
78. Our faculty employs an appropriate mix of assessment strategies, including alternative assessment strategies such as project- and portfolio-based assessments, that require students to utilize diverse cognitive skills (e.g. standard question/answer tests; lab assignments; observation; portfolios; interviews; peer evaluation). (KUH, ET. AL., 2005; SWAIL, 2003)
1 NO
2
3
4
5 YES NA
79. Our faculty performs frequent testing and assessment to monitor student progress and provide immediate, corrective, and supportive feedback on their performance. (SWAIL, 2003; WOODARD, MALLORY, & DELUCA, 2001)
1 NO
2
3
4
5 YES NA
80. Our faculty and academic advisors work together to provide an early warning system to identify and support students at academic risk. (KUH, ET. AL., 2005; SWAIL, 2003)
1 NO
2
3
4
5 YES NA
81. We employ a digital monitoring system for instant trend analyses of student’s achievement as determined by assessment tools. (SWAIL, 2003) 1
NO 2
3
4
5 YES NA
82. Our faculty receives training on assessment strategies, including alternative assessment techniques such as project- and portfolio-based assessments. 1
NO 2
3
4
5 YES NA

Educational Policy Institute Institutional Student Retention Assessment
Teaching & Learning VI-16
SOURCES CITED Association of American Colleges & Universities. (2002). Greater Expectations: A New Vision for Learning as a Nation Goes to College. Report of the Greater Expectations National Panel. Washington, DC. Retrieved May 8, 2006, from: http://www.greaterexpectations.org/. Chickering, Arthur W., Gamson, Zelda F. (1999). “Development and Adaptations of the Seven Principles for Good Practice in Undergraduate Education.” New Directions for Teaching and Learning (No. 80): 75-81. Cross, Patricia K. (1998). What Do We Know about Students’ Learning and How Do We Know It? Paper presented at the Annual Meeting of the American Association for Higher Education. Retrieved April 25, 2006, from: http://www.eric.ed.gov/ERICDocs/data/ericdocs2/content_storage_01/0000000b/80/23/5f/ce.pdf. Indiana University. (1996). The Strategic Directions Charter: Becoming America’s New Public University. Retrieved April 23, 2006, from: http://www.eric.ed.gov/ERICDocs/data/ericdocs2/content_storage_01/0000000b/80/23/20/b8.pdf. Kramer, Arthur, LaMar, Ansley W. (2000). Restructuring the General Studies Program at a Public Urban University: Assessment, Evaluation, and Implementation. Paper presented at the Annual Forum of the Association for Institutional Research (40th, Cincinnati, Oh., May 21-23, 2000). Retrieved May 2, 2006, from: http://www.eric.ed.gov/ERICDocs/data/ericdocs2/content_storage_01/0000000b/80/22/fb/67.pdf. Kuh, George D., Kinzie, Jillian, Schuh, John H., Whitt, Elizabeth J., and Associates. (2005). Student Success in College: Creating Conditions that Matter. Washington, D.C.: Jossey-Bass. Miller, Theodore K., (2001). The CAS Book of Professional Standards for Higher Education 2001. Washington, DC: Council for the Advancement of Standards in Higher Education. Swail, Watson S., Redd, Kenneth E., & Perna, Laura W. (2003). Retaining Minority Students in Higher Education: A Framework for Success. ASHE-ERIC Higher Education Report: Vol. 30, No. 2. San Francisco, CA: Wiley Periodicals, Inc. Voorhees, Richard. (2004). Framework: Retention Audit. Paper prepared for the Educational Policy Institute. Stafford, VA. Woodard, Jr., Dudley B., Mallory, Sherry L., & DeLuca, Anne M. (2001). “Retention and Institutional Effort: A Self-Study Framework.” NASPA Journal, Vol. 39, No. 1, pp. 53-83.