Embed Size (px)
Citation preview

RESEARCH ARTICLE
The effect of anthropogenic and natural factors on the prevalenceof physicochemical parameters of water and bacterial water qualityindicators along the river Białka, southern Poland
Anna Bojarczuk1 & Łukasz Jelonkiewicz1 & Anna Lenart-Boroń2
Received: 31 July 2017 /Accepted: 2 January 2018 /Published online: 30 January 2018# The Author(s) 2018. This article is an open access publication
AbstractThis study was aimed to determine the anthropogenic and natural factors affecting spatial and temporal changes in the physico-chemical parameters and bacterial indicators of water quality in the river Białka. The impact of intensive development of thetourist infrastructure on the quality of river water and the potential health threats to tourists was also assessed.Water samples werecollected over a period of 2.5 years, once per each month in four sites along the river. Temperature, electrolytic conductivity, pH,and water level were measured onsite; flow rate data were acquired from the Institute of Meteorology and Water Management;chemical analyses allowed to determine the amount of fourteen ions, while microbiological indicators included total andthermotolerant coliforms, total and thermotolerant Escherichia coli, and mesophilic and psychrophilic bacteria. The combinationof hydrological, hydrochemical, and microbiological methods generated large amount of data, which were processed by multi-variate statistical analysis. A downstream cumulative effect was observed in the contamination of the river water. Fecal coliformsand E. coli were detected in all sites, suggesting the source of fecal contamination even in the protected areas. Intensivedevelopment of a ski resort and the related infrastructure, together with the need to accommodate numerous tourists in theexamined region, has an evident environmental impact. The resulting deterioration of water quality poses health risks to tourists,as water from the Białka river is used for a variety of purposes, including as a raw drinking water or for artificial snowing of skislopes. The seasonal changes in the physicochemical parameters mainly result from varying natural factors that shape the waterquality in the studied region. The differences in the number of analyzedmicroorganisms result from seasonal variation in touristicactivity and are affected mostly by point sources of sewage inflow.
Keywords Bacterial indicators . Physicochemical parameters . River Białka .Water quality
Introduction
Water resources in Poland are very diverse—both spatiallyand temporally, but in general, Poland in comparison withother European countries is classified as having very limitedwater resources (Orlińska-Woźniak et al. 2013). One of the
most important problems of water management in Poland isnot the lack of water in general, but the lack of water in theright place and of adequate quality. Water quality is among themost important factors affecting health and safety of its usersand the suitability for its utilization in various aspects (Lenart-Boroń et al. 2017b). The insufficient quality results from anincreasing pollution of surface water, mostly in rivers,resulting from discharge of municipal and industrial sewageand surface runoff carrying large amounts of fertilizers fromagricultural fields (Pawełek 2015).
Mountain areas are among the most important and mostvaluable areas in the world. They are characterized by a hugebiodiversity, but they are also very sensitive to natural andanthropogenic changes. Thirty-two percent of protected areasin the world are located in the mountains. Almost half of theworld’s population is dependent on mountain areas. The
Responsible editor: Philippe Garrigues
* Anna Lenart-Boroń[email protected]
1 Department of Hydrology, Institute of Geography and SpatialManagement, Jagiellonian University in Cracow, Gronostajowa 7,30-387 Cracow, Poland
2 Department of Microbiology, University of Agriculture in Cracow,Mickiewicza Ave. 24/28, 30-059 Cracow, Poland
Environmental Science and Pollution Research (2018) 25:10102–10114https://doi.org/10.1007/s11356-018-1212-2
mountains are called Bwater towers,^ because they supplynearly half of the world’s population with water (Viviroliet al. 2003; Korner and Ohsawa 2005). The continuous devel-opment of tourism in mountain areas, especially winter tour-ism and the development of ski resorts, affects the naturalenvironment (Tsuyuzaki 1994; Kangas et al. 2009). It is oftenemphasized that one of the most important aspects is the im-pact of tourism on resources and quality of water. Ski resorts,in addition to water intake for artificial snowing, also deterio-rate the quality of water in rivers and streams due to the con-tamination with nutrients, bacteria, and other microorganismsby treated and untreated human waste (Pickering et al. 2003;Kangas et al. 2009; Wemple et al. 2007). Also in connectionwith the progressive global warming, the demand for water forsnowing of ski slopes increases. The largest water intake in skiresorts occurs at the beginning (for the so-called base snow-making) and at the end of the winter period (to extend theskiing season) (Vanham 2011).
In most cases, the quality of water in catchments is subjectto both temporal and spatial changes and—depending on thespecificity of the catchment or region—these changes are theresult of various combinations of natural and/or anthropogenicfactors (Lenart-Boroń et al. 2016a, 2017b; Ouattara et al.2011; Huang et al. 2014). Natural factors include geologicalstructure, seasonal differences in runoff volumes, weatherconditions, water levels and flows, land cover, and the grow-ing cycle (Bartram and Ballance 1996). Among anthropogen-ic factors, one can mention land use, which in turn affects thetype, number and location of point, and non-point sources ofpollution (USEPA 2015). In the case of the studied region, i.e.,the Bukowina Tatrzańska municipality and the Tatra poviat,the water resources are mainly affected by the specificity ofthe area, where tourism has recently undergone very intensivedevelopment (Krąż 2012a). According to Janczy (2015), theTatra poviat has more than 23,000 accommodation places andthe annual number of guests exceeds 2.2 million. This gener-ates numerous point sources of pollution, such as discharge ofsewage from an ineffectively operating municipal sewagetreatment plant and plenty of small illegal discharge sites fromhouseholds (Lenart-Boroń et al. 2016a). Also the quantity ofwater is affected by the expansion of winter tourism, as itgenerates increased consumption of water resources. This isdue to the large numbers of tourists visiting the region duringthe so-called Bhigh ski season,^ resulting in increased use ofwater for living purposes, but also due to the fact that in orderto improve the conditions on the ski slopes, the ski stations usesnow cannons for artificial snowing. The standard snow can-nons may take more than 1400 m3/h of water, and there areeight ski stations in the Bukowina Tatrzańska municipalitythat use such ways of extending ski season (Krąż 2012b).The above described problems are currently observed world-wide, as mountain hiking and winter tourism have becomeone of the most important economic sectors in various
mountain areas, in different regions of the world (Rixenet al. 2003). This is because the tourism and outdoor recreationare among the forms of intensive land use, with ski resortinfrastructure being one of the main factors causing environ-mental degradation in various mountain regions of the world(Kangas et al. 2009).
Having regard to the above listed aspects, identificationof phenomena affecting the quality of water in the catch-ment and understanding of the prevailing factors determin-ing water quality is not only important for the sake ofnatural environment, but it is also a difficult task.Applying a range of tools might improve our understand-ing of mechanisms affecting the quality of water in ecosys-tems that are sensitive to various factors, including bothnatural and man-induced disturbances, such as the moun-tain rivers (Esposito et al. 2016). The quality of water ingeneral is the combination of the number of microorgan-isms, concentrations of chemical compounds, and physicalproperties; therefore, interdisciplinary studies provide thebest effects in this respect. Combining hydrochemical test-ing with microbiological analyses of water can be a usefultool enabling multivariate analysis of obtained results, andit has proved useful in a number of studies on aquaticecosystems, including high-alpine spring waters in Italy(Esposito et al. 2016), groundwater of the Mamora basinin Morocco (Kabbour and Zouhri 2005), or groundwater ofthe Merdja plain in Algeria (Fehdi et al. 2016). Harclerodeet al. (2013) successfully combined a geographical ap-proach with microbiological and chemical analyses of wa-ter to track the point and non-point sources of contamina-tion with E. coli in Texas. Bhandari et al. (2017), on theother hand, conducted an analysis taking into considerationa number of water quality-affecting factors, including theamount of heavy metals, E. coli concentration and land usein a watershed of Brays Bayou (Texas) to track the changesin the land use and water pollution of an economicallyimportant river. Also in Poland, a combination of methods,i.e., physical, microbiological, hydrological, and meteoro-logical allowed for obtaining a large set of data that weresubjected to multivariate statistical analysis. This enabledtracking the factors affecting spatiotemporal changes in anumber of water quality indicators, to assess the gradientof pollution along a river and to determine the cumulativeeffect of urban pollution (Glińska-Lewczuk et al. 2016).
In this s tudy, a combinat ion of hydrological ,hydrochemical, and microbiological data was used to identifyfactors determining the spatial and temporal changes in thephysicochemical parameters and the prevalence of bacterialindicators of water quality in a mountain ski resort based onthe example of the river Białka, southern Poland. Another aimwas the attempt to assess the impact of the development of amountain resort on the quality of water in the Białka river andthe possible health risks for tourists.
Environ Sci Pollut Res (2018) 25:10102–10114 10103

Material and methods
Study site
The study was conducted in the catchment of the Białkariver within the Tatra Mountains and Podhale in theBukowina Tatrzańska municipality. This area is amongthe most attractive tourist destinations in Poland. Thestudied river flows from the southern part of theTatras—the highest mountain range in Poland. Southernpart of the river catchment is the protected area (TatraNational Park and Natura 2000) and has undergone onlysmall anthropogenic transformation (more than 60% ofthe area is covered by forests). Ski tourism is a very im-portant branch of business in the studied area. Due tohighly developed ski infrastructure and tourist accommo-dation, the considered region is characterized not only bya high-water demand for municipal purposes and for arti-ficial snowing of ski slopes, but also by large amounts ofproduced wastewater. Unfortunately, only 49.8% of theBukowina Tatrzańska municipality citizens use the localsewage treatment plant (CSO 2013). This results in anumber of illegal sewage discharge sites to the nearbyriver, Białka, and its tributaries. In addition to that, thenumber of the municipality residents increases severaltimes in the winter touristic season, resulting in the sew-age treatment plant overload and decreased effectivenessof its operation (Lenart-Boroń et al. 2016a).
Field methods
The samples were collected from January 2013 to June 2015in four sites along the river Białka. The location of the sam-pling sites is shown in Fig. 1. Site no. 1 (TNP) is situated onthe border of the Tatra National Park. Site no. 2 (Before STP)is situated a few hundred meters upstream of the sewage dis-charge from the sewage treatment plant of the BukowinaTatrzańska municipality. Site no. 3 (Intake) is the place ofwater intake for artificial snowing of one of the largest skistations in Poland (Kotelnica Białczańska) and is locateddownstream of the sewage discharge from the mentionedtreatment plant. Site no. 4 (Trybsz) is situated at the borderof the Bukowina Tatrzańska municipality.
Water temperature (T), electrolytic conductivity(EC25 °C), pH, and water level (H) were measured onsite(Lenart-Boroń et al. 2016c). Water samples were collectedeach month to 1000 ml sterile polypropylene bottles for theassessment of chemical composition and into 500 ml poly-ethylene bottles for microbiological analyses. Dataconcerning flow rate in the Białka river were acquired fromthe Institute of Meteorology and Water Management—National Research Institute.
Laboratory methods
Chemical composition of water was determined at the labora-tory of the Institute of Geography and Spatial Management ofthe Jagiellonian University in Cracow. After filtration of waterwith 0.45 μm a syringe filter, the chemical composition wasdetermined with ion chromatography using a combined sys-tem of two ion chromatographs DIONEX ICS-2000 and anautosampler AS-4 (Lenart-Boroń et al. 2016c). Water miner-alization (TDS) was calculated as a sum of the detected ions.Statistical analysis was based on the parameters: T, EC, pH,TDS, and nitrogen and phosphorus compounds (NH4
+, NO3−,
NO2−, PO4
3−).In microbiological analyses, bacterial indicators of water
quality were enumerated with membrane filtration (total andthermotolerant coliforms and Escherichia coli) and serial di-lution methods (mesophilic and psychrophilic bacteria), asdescribed by Lenart-Boroń et al. 2016c.
Statistical analysis
Principal Component Analysis (PCA) was employed todetermine the relationship between the microbiological
Fig. 1 Study area and the location of the sampling sites
10104 Environ Sci Pollut Res (2018) 25:10102–10114

indicators and the chemical quality parameters, andamount of water, as well as to explain the natural andanthropogenic processes that affect these parameters.PCA was calculated for each of the study sites based onthe following variables: the numbers of total and fecal(thermotolerant) coliforms, total and fecal E. coli, andmesophilic and psychrophilic bacteria, as well as T, pH,TDS, the concentration of NH4
+, NO3−, NO2
−, PO43−ions,
and a flow rate (Q). The number of the most importantfactors was determined based on the Kaiser criterion andexplained by the factor of variance above 10%. Analysisof variance (ANOVA) and a post hoc Scheffe test for p =0.95 were used to determine the significance of differ-ences in the examined parameters between the study sitesand seasons of the year. Spearman’s rank correlation co-efficients were calculated in order to determine whetherthere are relationships between microbiological indicators,physicochemical parameters of water, and a flow rate.Statistical calculations were conducted in STATISTICA12.5 software (StatSoft, USA).
Results
Basic characteristics of water parameters
Table 1 shows basic statistical characteristics and coefficientof variation (CV) for microbiological and physicochemicalparameters of water and flow rate in the study sites. Totalcoliforms are the predominant group of bacteria in water,and E. coli (both total and thermotolerant groups) are the leastnumerous. Water pH is mostly alkaline and TDS—low (max.251.3 mg/L). Among the nitrogen compounds, nitrates havethe highest concentrations and nitrites—the lowest. The con-centrations of PO4
3−ions in the studied sites are very low anddo not exceed 0.5 mg/L. Coefficients of variability for micro-biological indicators, as well as nitrogen and phosphorus com-pounds, are very high, which indicates large fluctuations invalues of these characteristics during the study period. Anincrease in the mean values of microbiological and physico-chemical characteristics of water along the course of the rivercan be noticed.
Table 1 Basic statistical characteristics of microbiological indicators, physicochemical parameters, and water flow rates in the studied sites. Number ofcollected samples throughout the study is n = 32
Site TNP (No 1) Before STP (No 2) Intake (No 3) Trybsz (No 4)
Feature Unit Mean(Min–Max)
CV(%)
Mean(Min–Max)
CV(%)
Mean(Min–Max)
CV(%)
Mean(Min–Max)
CV(%)
Q m3/s 1.29(0.48–17.50)
123 3.17(1.46–14.43)
70 3.34(1.54–15.19)
70 5.21(1.51–29.60)
87
Total coliforms CFU/100 ml 1(0–31,000)
559 243(0–95,000)
309 1060(0–78,100)
241 820(12–54,300)
214
Total E. coli 0(0–50)
341 0(0–80,000)
512 36(0–20,000)
241 40(0–39,100)
240
Fecal coliforms 0(0–39)
340 21(0–22,000)
250 6(0–30,100)
243 620(0–37,200)
205
Fecal E. coli 0(0–39)
420 0(0–7000)
280 0(0–25,390)
279 30(0–24,000)
259
Mesophilic bacteria CFU/ml 15(0–47,000)
443 125(0–3100)
160 530(10–14,510)
183 398(15–27,500)
239
Psychrophilic bacteria 73(0–13,800)
308 378(0–24,600)
252 925(0–42,600)
218 1180(19–312,000)
449
T °C 4.9(3.1–11.0)
42 5.1(0.0–14.7)
76 4.9(0.1–15.0)
78 5.3(0.0–16.0)
82
pH pH 7.76(6.81–8.40)
5 8.00(6.94–8.30)
4 7.99(7.13–8.46)
4 7.99(7.10–9.19)
5
EC μS/cm 123.5(58.2–290.6)
44 323.3(126.6–300.0)
21 220.2(133.7–306.0)
22 233.4(142.3–322.7)
21
TDS mg/L 91.3(42.2–219.8)
45 183.6(96.1–235.6)
20 178.3(100.9–241.6)
20 187.7(108.3–251.3)
19
NH4+ 0.0068
(0.0001–0.6383)258 0.0135
(0.0001–0.0715)94 0.0402
(0.0001–0.4216)131 0.0389
(0.0001–0.5855)141
NO3− 2.077
(0.001–4.921)36 2.526
(1.512–5.488)37 2.529
(0.001–5.014)40 2.927
(1.284–5.566)38
NO2− 0.0008
(0.0008–0.1076)288 0.0008
(0.0008–0.5513)492 0.0008
(0.0008–0.3188)322 0.0008
(0.0008–0.2777)191
PO43− 0.0033
(0.0013–0.4321)280 0.0033
(0.0007–0.1458)251 0.0033
(0.0022–0.4904)193 0.0033
(0.0026–0.4904)201
Environ Sci Pollut Res (2018) 25:10102–10114 10105

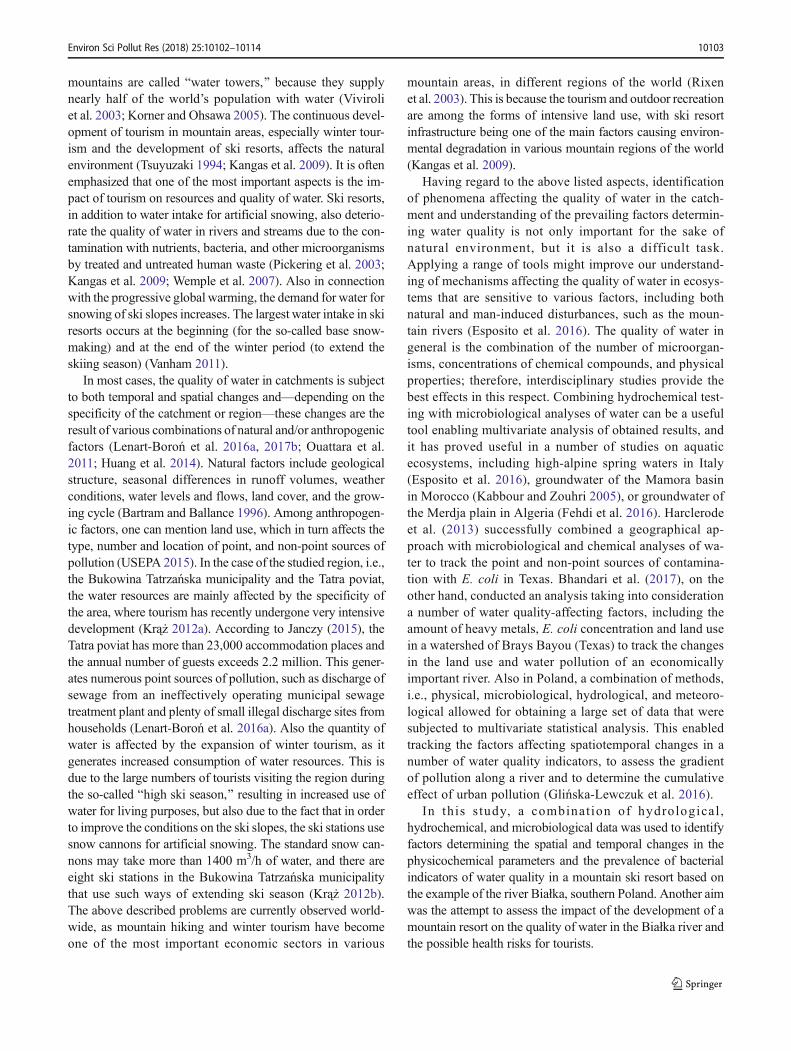
Spatial heterogeneity
The results of Spearman’s correlation analysis are presented inTable 2. The majority of statistically significant relationshipsbetween the numbers of microbiological indicators of waterquality, physicochemical parameters, and flow rate werefound at the site TNP, while the site Before STP has thesmallest number of such relationships. In the sites BeforeSTP and Trybsz, there are generally no statistically significantrelationships between microbiological and physicochemicalcharacteristics of water. The flow rate is usually negativelycorrelated with physicochemical parameters of water. The on-ly exception is the positive relationship between Q and watertemperature. The impact of the flow rate on the number ofmicroorganisms in water is visible in the TNP (significantpositive relationship with total E. coli and fecal coliforms)and Before STP (significant positive relationship with fecalcoliforms and mesophilic bacteria).
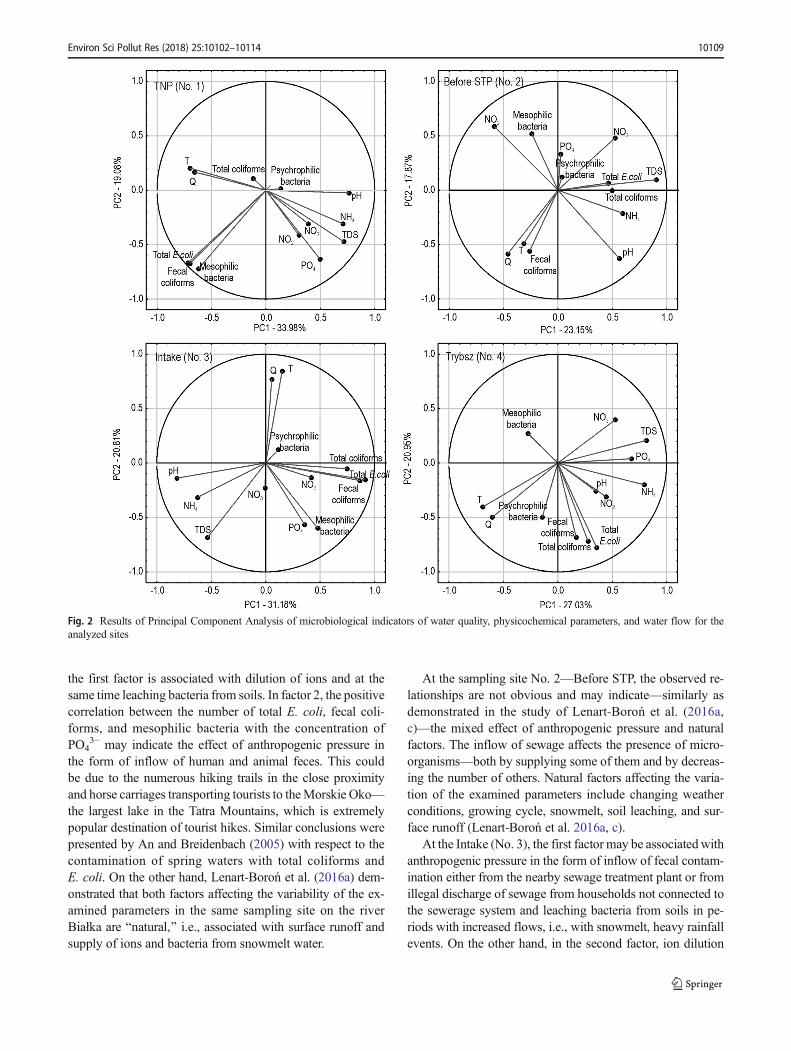
Principal Component Analysis showed that the first twofactors explain in total from 41.0% (Before STP) to 53.1%(TNP) of variation. The PCA results obtained for the siteTNP showed that factor 1 explains 34% and factor 2—19.1% of variation (Fig. 2.). Factor 1 indicates a negativerelationship between Q, T, total E.coli, fecal coliforms,mesophilic bacteria and pH, TDS, and PO4
3−. In this factor,the higher the flow and water temperature, the more bacteria,but lower mineralization and concentrations of NH4
+ andPO4
3−. On the other hand, factor 2 shows a positive correlationbetween the number of bacteria (total E. coli, fecal coliforms,mesophilic bacteria) and TDS, NO2
−, and PO43−. Thus, the
more bacteria, the higher concentrations of NO2−, PO4
3−, andTDS.
In the site Before STP, factor 1 explains 23.1% ofvariance and factor 2—17.9%. This factor represents apositive relationship between total coliforms, totalE. coli and pH, TDS, NH4
+, and NO3−, i.e., the more
coliforms and E. coli, the higher pH, water mineraliza-tion, and higher concentrations of ammonium and nitratesin water. Factor 2 shows a negative relationship betweenfecal coliforms, Q, pH, T and mesophilic bacteria, NO3
−,and NO2
−. In this relationship, the more fecal coliforms,higher flow, pH and water temperature, the lower con-centrations of NO3
− and NO2−, and less mesophilic
bacteria.At the Intake factor 1 explains 31.2% of variance and
factor 2—20.8%. In factor 1, there is a negative relationbetween the microbiological indicators of water qualityand NO2
− with pH, TDS, and NH4+. Thus, the more bac-
teria and nitrites in water, the lower pH, TDS, and NH4+.
Factor 2 also shows a negative relation between Q, T andmesophilic bacteria, TDS, and PO4
3−. It shows that thehigher water flow and temperature, the less mesophilicbacteria, smaller TDS, and lower concentrations of PO4
3−.
In the site, Trybsz factor 1 explains 27% while factor 2–21% of variance. In factor 1, we can observe a negative cor-relation between Q, T and TDS, and the concentration of ni-trogen and phosphorus compounds. This means that the lowerflow and temperature of water, the higher concentrations ofnutrients. Factor 2 represents a positive correlation betweenmicrobiological indicators of water quality and flow and tem-perature, i.e., the higher flow, the higher water temperatureand more bacteria (total and fecal coliforms, total E. coli andpsychrophilic bacteria) in water.
Analysis of variance (ANOVA) showed that in terms ofwater temperature and the number of microorganisms, thedifferences between individual sites are not statistically signif-icant. Only in the case of fecal coliforms, there are significantdifferences between the sites TNP and Trybsz. The site TNPdiffers significantly from the remaining sampling sites in thecase of Q, pH, EC, and TDS values. Waters in the TNP differsignificantly from the site Trybsz in the concentrations ofNH4
+ and NO3−. On the other hand, the site Before STP dif-
fers significantly from Trybsz in the concentrations of NO2−
and PO43−. Waters in the TNP are characterized by significant-
ly lower values of Q, pH, EC, and TDS from the other sam-pling sites. In the case of the concentrations of nitrogen com-pounds (NH4
+ and NO3−)—they are significantly lower in the
TNP than in Trybsz.
Seasonal variability
There are no significant differences in the number of micro-organisms, water pH, and the concentration of NO2
− betweenseasons of the year. In the case of Q, EC, TDS, NH4
+, NO3−—
these values differ significantly in winter from the remainingseasons. Water temperature in each season varies significantlyand in the case of PO4
3− concentration—there are significantdifferences between spring and winter. ANOVA showed thatthe values of physicochemical characteristics during winterare significantly higher than in the other seasons, while thewater flow rate—significantly lower.
Based on Fig. 3, it can be stated that there is a clear seasonalvariability of microbiological indicators of water quality,physicochemical characteristics, and water flow rate. The low-est flow rates occur in winter and autumn, the highest—inspring, and this observation is clear in the case of all samplingsites. The variability in the number of E. coli in water corre-sponds with the flow rate and in the months when the flow rateis higher, also the number of E. coli increases. However, highlevels of bacteria in water also occur in winter. It should benoted that the number of E. coli is very variable in particularmonths, from year to year, indicated by the large interquartilerange. Similarly, as in the case of total E. coli, increased num-ber of fecal coliforms can be observed in months with higherflow rates in the river Białka. Only in the sampling sites Intake(No.3) and Trybsz (No.4), greater number of fecal coliforms
10106 Environ Sci Pollut Res (2018) 25:10102–10114
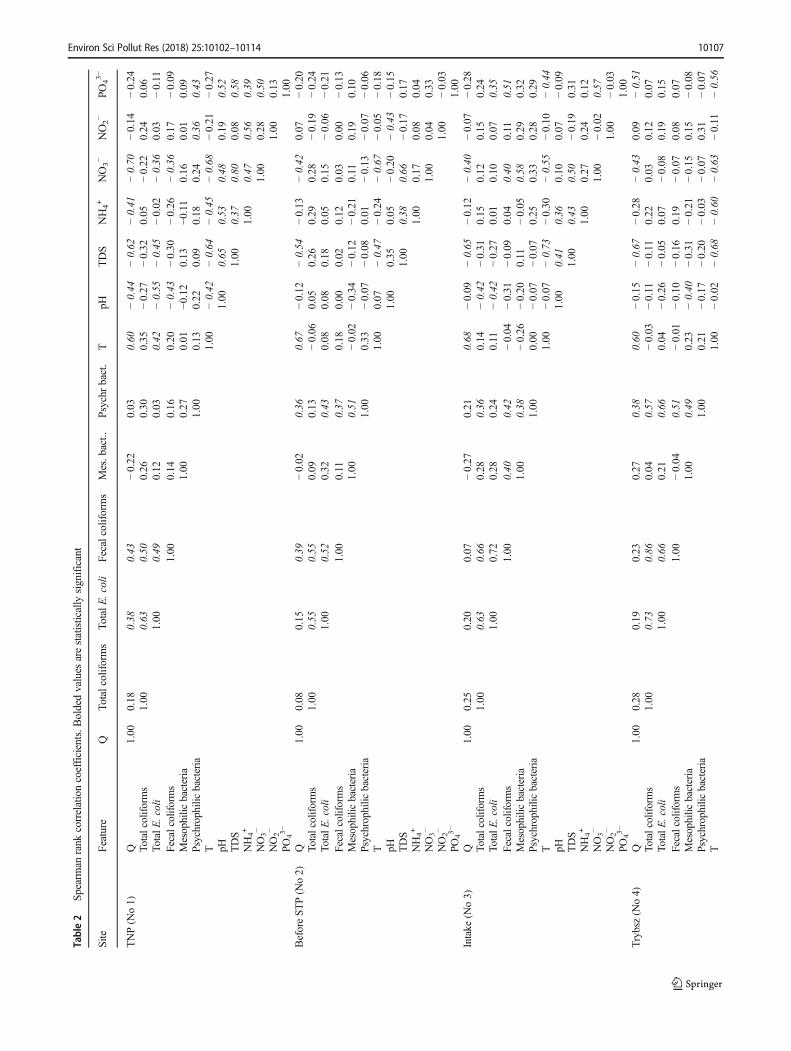
Table2
Spearm
anrank
correlationcoefficients.B
oldedvalues
arestatistically
significant
Site
Feature
QTo
talcoliforms
TotalE
.coli
Fecalcoliforms
Mes.bact..
Psychr
bact.
TpH
TDS
NH4+
NO3−
NO2−
PO43−
TNP(N
o1)
Q1.00
0.18
0.38
0.43
−0.22
0.03
0.60
−0.44
−0.62
−0.41
−0.70
−0.14
−0.24
Totalcoliforms
1.00
0.63
0.50
0.26
0.30
0.35
−0.27
−0.32
0.05
−0.22
0.24
0.06
TotalE
.coli
1.00
0.49
0.12
0.03
0.42
−0.55
−0.45
−0.02
−0.36
0.03
−0.11
Fecalcoliforms
1.00
0.14
0.16
0.20
−0.43
−0.30
−0.26
−0.36
0.17
−0.09
Mesophilic
bacteria
1.00
0.27
0.01
−0.12
0.13
−0.11
0.16
0.01
0.09
Psychrophilic
bacteria
1.00
0.13
0.22
0.09
0.18
0.24
0.36
0.43
T1.00
−0.42
−0.64
−0.45
−0.68
−0.21
−0.27
pH1.00
0.65
0.53
0.48
0.19
0.52
TDS
1.00
0.37
0.80
0.08
0.58
NH4+
1.00
0.47
0.56
0.39
NO3−
1.00
0.28
0.50
NO2−
1.00
0.13
PO43−
1.00
BeforeST
P(N
o2)
Q1.00
0.08
0.15
0.39
−0.02
0.36
0.67
−0.12
−0.54
−0.13
−0.42
0.07
−0.20
Totalcoliforms
1.00
0.55
0.55
0.09
0.13
−0.06
0.05
0.26
0.29
0.28
−0.19
−0.24
TotalE
.coli
1.00
0.52
0.32
0.43
0.08
0.08
0.18
0.05
0.15
−0.06
−0.21
Fecalcoliforms
1.00
0.11
0.37
0.18
0.00
0.02
0.12
0.03
0.00
−0.13
Mesophilic
bacteria
1.00
0.51
−0.02
−0.34
−0.12
−0.21
0.11
0.19
0.10
Psychrophilic
bacteria
1.00
0.33
−0.07
−0.08
0.01
−0.13
−0.07
−0.06
T1.00
0.07
−0.47
−0.24
−0.67
−0.05
−0.18
pH1.00
0.35
0.05
−0.20
−0.43
−0.15
TDS
1.00
0.38
0.66
−0.17
0.17
NH4+
1.00
0.17
0.08
0.04
NO3−
1.00
0.04
0.33
NO2−
1.00
−0.03
PO43−
1.00
Intake
(No3)
Q1.00
0.25
0.20
0.07
−0.27
0.21
0.68
−0.09
−0.65
−0.12
−0.40
−0.07
−0.28
Totalcoliforms
1.00
0.63
0.66
0.28
0.36
0.14
−0.42
−0.31
0.15
0.12
0.15
0.24
TotalE
.coli
1.00
0.72
0.28
0.24
0.11
−0.42
−0.27
0.01
0.10
0.07
0.35
Fecalcoliforms
1.00
0.40
0.42
−0.04
−0.31
−0.09
0.04
0.40
0.11
0.51
Mesophilic
bacteria
1.00
0.38
−0.26
−0.20
0.11
−0.05
0.58
0.29
0.32
Psychrophilic
bacteria
1.00
0.00
−0.07
−0.07
0.25
0.33
0.28
0.29
T1.00
−0.07
−0.73
−0.30
−0.55
−0.10
−0.44
pH1.00
0.41
0.36
0.10
0.07
−0.09
TDS
1.00
0.43
0.50
−0.19
0.31
NH4+
1.00
0.27
0.24
0.12
NO3−
1.00
−0.02
0.57
NO2−
1.00
−0.03
PO43−
1.00
Trybsz(N
o4)
Q1.00
0.28
0.19
0.23
0.27
0.38
0.60
−0.15
−0.67
−0.28
−0.43
0.09
−0.51
Totalcoliforms
1.00
0.73
0.86
0.04
0.57
−0.03
−0.11
−0.11
0.22
0.03
0.12
0.07
TotalE
.coli
1.00
0.66
0.21
0.66
0.04
−0.26
−0.05
0.07
−0.08
0.19
0.15
Fecalcoliforms
1.00
−0.04
0.51
−0.01
−0.10
−0.16
0.19
−0.07
0.08
0.07
Mesophilic
bacteria
1.00
0.49
0.23
−0.40
−0.31
−0.21
−0.15
0.15
−0.08
Psychrophilic
bacteria
1.00
0.21
−0.17
−0.20
−0.03
−0.07
0.31
−0.07
T1.00
−0.02
−0.68
−0.60
−0.63
−0.11
−0.56
Environ Sci Pollut Res (2018) 25:10102–10114 10107
was observed also in the winter months (February, March).Interquartile range indicates that the number of fecal coliformsin water can differ significantly between individual years.Water temperature is characterized by a very clear seasonality,and it refers to the climatic conditions of the study area. AlsoTDS refers to the flow rate, but the higher the flow, the lowerthe TDS values. High values of TDS in the winter months andthe lowest during the spring snowmelt period are clearly vis-ible. On the other hand, in most sampling sites, the concentra-tions of NO3
− are the highest in the beginning of snowmelt,then drop sharply to remain at low levels during the growingseason (spring, summer, and early autumn).
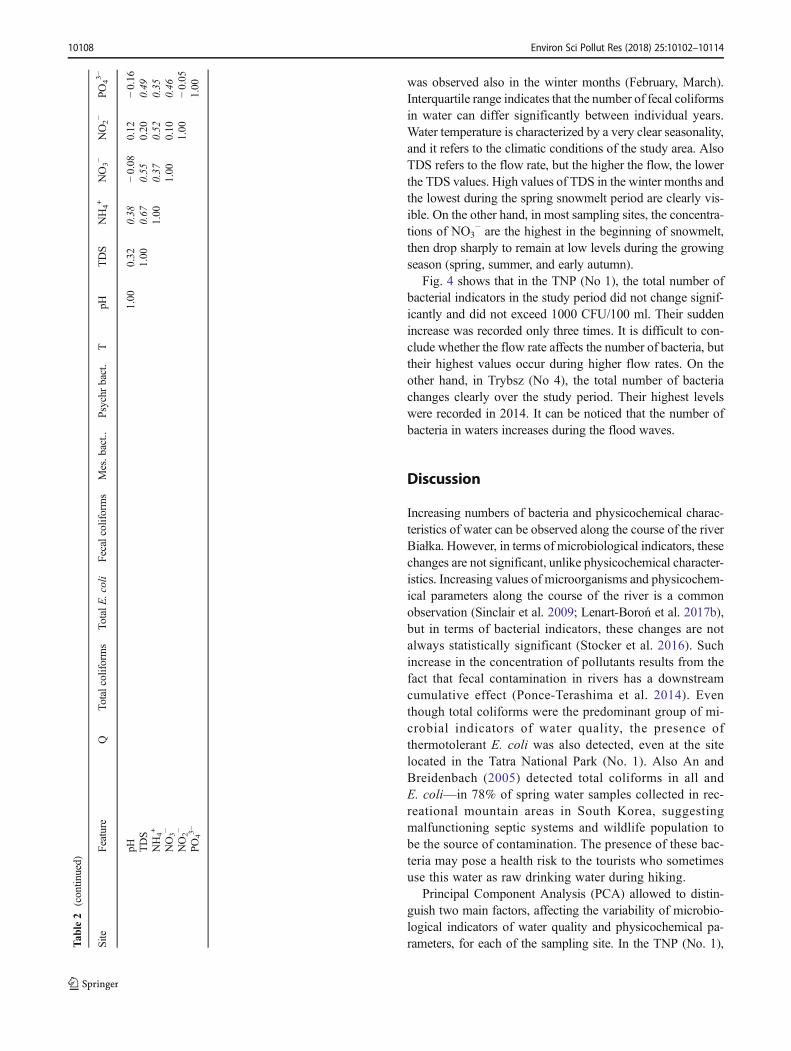
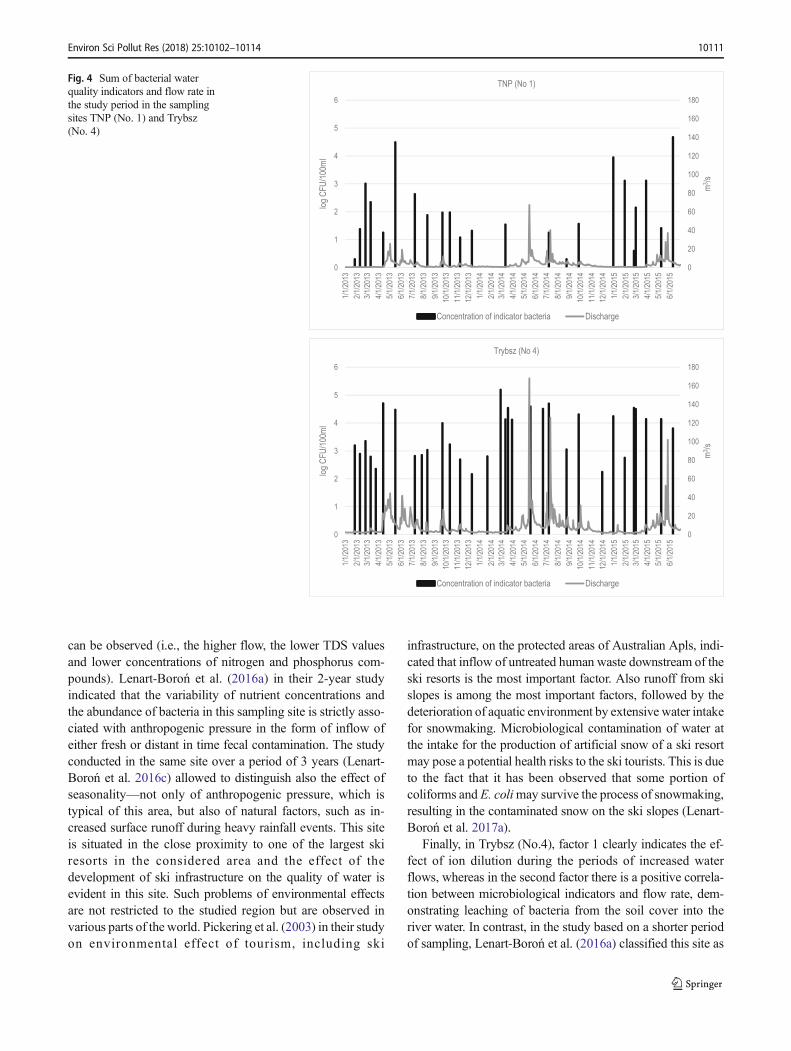
Fig. 4 shows that in the TNP (No 1), the total number ofbacterial indicators in the study period did not change signif-icantly and did not exceed 1000 CFU/100 ml. Their suddenincrease was recorded only three times. It is difficult to con-clude whether the flow rate affects the number of bacteria, buttheir highest values occur during higher flow rates. On theother hand, in Trybsz (No 4), the total number of bacteriachanges clearly over the study period. Their highest levelswere recorded in 2014. It can be noticed that the number ofbacteria in waters increases during the flood waves.
Discussion
Increasing numbers of bacteria and physicochemical charac-teristics of water can be observed along the course of the riverBiałka. However, in terms of microbiological indicators, thesechanges are not significant, unlike physicochemical character-istics. Increasing values of microorganisms and physicochem-ical parameters along the course of the river is a commonobservation (Sinclair et al. 2009; Lenart-Boroń et al. 2017b),but in terms of bacterial indicators, these changes are notalways statistically significant (Stocker et al. 2016). Suchincrease in the concentration of pollutants results from thefact that fecal contamination in rivers has a downstreamcumulative effect (Ponce-Terashima et al. 2014). Eventhough total coliforms were the predominant group of mi-crobial indicators of water quality, the presence ofthermotolerant E. coli was also detected, even at the sitelocated in the Tatra National Park (No. 1). Also An andBreidenbach (2005) detected total coliforms in all andE. coli—in 78% of spring water samples collected in rec-reational mountain areas in South Korea, suggestingmalfunctioning septic systems and wildlife population tobe the source of contamination. The presence of these bac-teria may pose a health risk to the tourists who sometimesuse this water as raw drinking water during hiking.
Principal Component Analysis (PCA) allowed to distin-guish two main factors, affecting the variability of microbio-logical indicators of water quality and physicochemical pa-rameters, for each of the sampling site. In the TNP (No. 1),T
able2
(contin
ued)
Site
Feature
QTo
talcoliforms
TotalE
.coli
Fecalcoliforms
Mes.bact..
Psychr
bact.
TpH
TDS
NH4+
NO3−
NO2−
PO43−
pH1.00
0.32
0.38
−0.08
0.12
−0.16
TDS
1.00
0.67
0.55
0.20
0.49
NH4+
1.00
0.37
0.52
0.35
NO3−
1.00
0.10
0.46
NO2−
1.00
−0.05
PO43−
1.00
10108 Environ Sci Pollut Res (2018) 25:10102–10114
the first factor is associated with dilution of ions and at thesame time leaching bacteria from soils. In factor 2, the positivecorrelation between the number of total E. coli, fecal coli-forms, and mesophilic bacteria with the concentration ofPO4
3− may indicate the effect of anthropogenic pressure inthe form of inflow of human and animal feces. This couldbe due to the numerous hiking trails in the close proximityand horse carriages transporting tourists to theMorskie Oko—the largest lake in the Tatra Mountains, which is extremelypopular destination of tourist hikes. Similar conclusions werepresented by An and Breidenbach (2005) with respect to thecontamination of spring waters with total coliforms andE. coli. On the other hand, Lenart-Boroń et al. (2016a) dem-onstrated that both factors affecting the variability of the ex-amined parameters in the same sampling site on the riverBiałka are Bnatural,^ i.e., associated with surface runoff andsupply of ions and bacteria from snowmelt water.
At the sampling site No. 2—Before STP, the observed re-lationships are not obvious and may indicate—similarly asdemonstrated in the study of Lenart-Boroń et al. (2016a,c)—the mixed effect of anthropogenic pressure and naturalfactors. The inflow of sewage affects the presence of micro-organisms—both by supplying some of them and by decreas-ing the number of others. Natural factors affecting the varia-tion of the examined parameters include changing weatherconditions, growing cycle, snowmelt, soil leaching, and sur-face runoff (Lenart-Boroń et al. 2016a, c).
At the Intake (No. 3), the first factor may be associated withanthropogenic pressure in the form of inflow of fecal contam-ination either from the nearby sewage treatment plant or fromillegal discharge of sewage from households not connected tothe sewerage system and leaching bacteria from soils in pe-riods with increased flows, i.e., with snowmelt, heavy rainfallevents. On the other hand, in the second factor, ion dilution
Fig. 2 Results of Principal Component Analysis of microbiological indicators of water quality, physicochemical parameters, and water flow for theanalyzed sites
Environ Sci Pollut Res (2018) 25:10102–10114 10109

Fig. 3 Variation in the number of microorganisms, physicochemical characteristics of water, and flow rate during the year in the analyzed sampling sites
10110 Environ Sci Pollut Res (2018) 25:10102–10114
can be observed (i.e., the higher flow, the lower TDS valuesand lower concentrations of nitrogen and phosphorus com-pounds). Lenart-Boroń et al. (2016a) in their 2-year studyindicated that the variability of nutrient concentrations andthe abundance of bacteria in this sampling site is strictly asso-ciated with anthropogenic pressure in the form of inflow ofeither fresh or distant in time fecal contamination. The studyconducted in the same site over a period of 3 years (Lenart-Boroń et al. 2016c) allowed to distinguish also the effect ofseasonality—not only of anthropogenic pressure, which istypical of this area, but also of natural factors, such as in-creased surface runoff during heavy rainfall events. This siteis situated in the close proximity to one of the largest skiresorts in the considered area and the effect of thedevelopment of ski infrastructure on the quality of water isevident in this site. Such problems of environmental effectsare not restricted to the studied region but are observed invarious parts of the world. Pickering et al. (2003) in their studyon environmental effect of tourism, including ski
infrastructure, on the protected areas of Australian Apls, indi-cated that inflow of untreated human waste downstream of theski resorts is the most important factor. Also runoff from skislopes is among the most important factors, followed by thedeterioration of aquatic environment by extensive water intakefor snowmaking. Microbiological contamination of water atthe intake for the production of artificial snow of a ski resortmay pose a potential health risks to the ski tourists. This is dueto the fact that it has been observed that some portion ofcoliforms and E. colimay survive the process of snowmaking,resulting in the contaminated snow on the ski slopes (Lenart-Boroń et al. 2017a).
Finally, in Trybsz (No.4), factor 1 clearly indicates the ef-fect of ion dilution during the periods of increased waterflows, whereas in the second factor there is a positive correla-tion between microbiological indicators and flow rate, dem-onstrating leaching of bacteria from the soil cover into theriver water. In contrast, in the study based on a shorter periodof sampling, Lenart-Boroń et al. (2016a) classified this site as
0
20
40
60
80
100
120
140
160
180
0
1
2
3
4
5
6
1/1/20
132/1
/2013
3/1/20
134/1
/2013
5/1/20
136/1
/2013
7/1/20
138/1
/2013
9/1/20
1310
/1/20
1311
/1/20
1312
/1/20
131/1
/2014
2/1/20
143/1
/2014
4/1/20
145/1
/2014
6/1/20
147/1
/2014
8/1/20
149/1
/2014
10/1/
2014
11/1/
2014
12/1/
2014
1/1/20
152/1
/2015
3/1/20
154/1
/2015
5/1/20
156/1
/2015
m3 /s
log C
FU/10
0ml
TNP (No 1)
Concentration of indicator bacteria Discharge
0
20
40
60
80
100
120
140
160
180
0
1
2
3
4
5
6
1/1/20
132/1
/2013
3/1/20
134/1
/2013
5/1/20
136/1
/2013
7/1/20
138/1
/2013
9/1/20
1310
/1/20
1311
/1/20
1312
/1/20
131/1
/2014
2/1/20
143/1
/2014
4/1/20
145/1
/2014
6/1/20
147/1
/2014
8/1/20
149/1
/2014
10/1/
2014
11/1/
2014
12/1/
2014
1/1/20
152/1
/2015
3/1/20
154/1
/2015
5/1/20
156/1
/2015
m3 /s
log C
FU/10
0ml
Trybsz (No 4)
Concentration of indicator bacteria Discharge
Fig. 4 Sum of bacterial waterquality indicators and flow rate inthe study period in the samplingsites TNP (No. 1) and Trybsz(No. 4)
Environ Sci Pollut Res (2018) 25:10102–10114 10111

the one affected only by anthropogenic factors, such as theinflow of sewage. In the 3-year study, Lenart-Boroń et al.(2016b) observed the effect of both groups of factors—anthro-pogenic related to the municipal sewage inflow and naturalassociated with the seasonal changes, mostly in water temper-ature, which in turn affects the number of some bacterialgroups. This site is situated downstream of the small town,Białka Tatrzańska, which is visited by huge numbers of tour-ists both during summer holidays and over the winter Bhighski season,^ i.e., from late December to early March. Duringwinter holidays, there are often not enough places to accom-modate all tourists visiting the area. All this results in a hugeenvironmental impact of tourism and tourist-related infra-structure on the quality of water in this site. This includes bothdischarge of insufficiently treated sewage from the local treat-ment plant, inflow of untreated sewage from privateguesthouses, and runoff from ski slopes or roads, as well asmodification of the aquatic conditions by drawing of water forsnowmaking in numerous ski resorts located not only in theBiałka Tatrzańska town, but also upstream. Similar group ofenvironmental impacts are observed in the Australian Alps(Pickering et al. 2003), in the boreal forest zone of Finland(Kangas et al. 2009) or South Korea (An and Breidenbach2005).
The annual changes in physicochemical characteristics ofthe Białka river waters are clear and statistically significant.The occurrence of seasonal changes in the chemical compo-sition of water highly depends on natural factors, such ashydrological and climatic conditions or biological activity ofthe catchment (Żelazny and Siwek 2012). In contrast, bacterialindicators of fecal contamination of water do not show statis-tically significant seasonal differences in the study area. AlsoFrenzel and Couvillion (2002) found, based on an example of14 streams in Alaska, that there were no statistically signifi-cant differences in the concentration of bacteria. However,many studies demonstrated that the concentration of bacterialindicators shows seasonal variability (Edwards et al. 1997). Inthe case of the studied region, the prevalence of bacterial in-dicators of water quality changes throughout the year, butthese changes result from the seasonal variation in the touristicactivity in the area, which can vary from year to year. Thenumber of bacteria in waters is affected by point and non-point sources of sewage inflow occurring in the study area(Lenart-Boroń et al. 2016a), and they are crucial in shapingthe microbiological quality of water. The number of touristsvisiting the area directly affects the river contamination, as itaffects the amount of sewage produced and both—reachingthe municipal treatment plant and illegally discharged directlyinto the river Białka (Lenart-Boroń et al. 2016a). The fact thatthe number of bacterial indicators in the selected sites of theriver Białka is strongly affected by point sources of pollution,such as sewage discharge from the municipal treatment plantand illegal connections from private households, results in
significant diurnal variations in the amount of pollutantsreaching water of Białka (Lenart-Boroń et al. 2016b). Thismeans that the time of the day when the samples are collectedcan significantly affect the obtained results, indicating thatmore thorough monitoring, i.e., based on more frequently col-lected samples, would produce more reliable results. Also—depending on the atmospheric conditions, the amount of sew-age (both treated from the treatment plant and untreated fromhouseholds) reaches the river, whose resources can be reduceddue to the production of artificial snow to improve the condi-tions in the local ski stations (Krąż 2012b). The amount ofwater in the mountain river, such as Białka, can also changesignificantly during extreme weather conditions, such asfloods. This is because of their high energy; mountain water-courses are highly vulnerable to environmental changes af-fecting their channels and catchments. Floods in mountainrivers are favored by the typically steep channel gradientsand can be generated by various atmospheric events (Stoffelet al. 2016). Thus, in the studied area, it would be valuable toconduct detailed analyses of isolated events, such as floodwaves.
Most studies show a positive correlation between thenumber of bacteria and flow rate values (Edwards et al.1997; Sinclair et al. 2009). However, our studies indicatethat this relationship is very weak. Nevertheless, it shouldbe emphasized that the higher numbers of bacteria wererecorded in waters during the high-water level than duringlow-water level periods. In contrast to microbiological in-dicators, physicochemical characteristics of water clearlydepend on the flow rates. The higher the water flow, thelower EC, TDS, and NO3
− concentrations. During floodwaves, river waters are diluted with low-mineralized pre-cipitation waters or snowmelt waters. In the case of nitro-gen compounds, their concentrations are clearly affectedby the biological activity of the catchment. This is becauseduring the growing period, nitrogen is assimilated byplants and the concentrations of its compounds are signif-icantly lower, which is confirmed by other studies(Gardner and McGlynn 2009; Halliday et al. 2013). Inturn, higher concentrations of nitrogen compounds are ob-served in autumn and winter, when the biological activityis definitely lower. On the other hand, the highest concen-trations occur mostly in the initial snowmelt stage. Thenthe nitrogen compounds are leached out from the snowcover and soil (Johannessen and Henriksen 1978; Holkoet al. 2006).
Conclusions
This study showed that the considered region has a num-ber of point and non-point sources of pollution, resultingfrom the specificity of the area, i.e., intensively
10112 Environ Sci Pollut Res (2018) 25:10102–10114
developing tourism, especially winter tourism. This af-fects the dynamics of parameters influencing the qualityof water. What remains constant is the microbiologicalpollution of water, which causes potential health risks totourists, as water in the studied area is used for a widerange of recreational purposes.
It was shown that the development of ski infrastructureand—in more general terms—infrastructure related tomountain tourism negatively affects the quality of riverwater in the examined catchment. The impact of the pointand non-point sources of pollution increases along thecourse of the river. The most downstream situated sam-pling site is subjected to a wide range of factors thatdeteriorate the water quality. The problems observed inthe discussed catchment are common to other regions ofthe world, as the negative impact of mountain tourism,including ski infrastructure, is a common issue, reportedin different countries.
Seasonal changes in the studied parameters were moreclearly visible in the case of physicochemical parameters rath-er than for microbiological indicators of water quality. Alongthe studied river, the temporal changes in the number of bac-teria are affected by point and non-point sources of pollution.In such cases, inflow of pollutants is also subject to temporalfluctuations, but their pattern is not that obvious as in the caseof strictly seasonal changes.
Our study also showed the relationship between thewater flow rate and the concentration of the analyzed fac-tors. Again, this relationship is more evident in the case ofphysicochemical parameters than for microbial indicators.This demonstrates that the amount of bacteria in water ismore associated with inflow of sewage (whose even smallamounts may contain high concentrations of pollutants)rather than with non-point sources, such as surface runoffor snowmelt water. In order to more precisely identify therelation between concentrations of nutrients and flow rate,it would be worth conducting a detailed study of isolatedevents, such as flood waves.
Acknowledgements The authors would like to thank PhD MirosławŻelazny for his help in obtaining research funds and MSc JustynaPrajsnar for her help with water sampling and filtering.
Funding information This study was partly funded by the measures ofthe project BHydrochemical and hydrological monitoring in sub-catchments of the Białka river in the Kotelnica region,^ No. K/KDU/000297 and by the statutory measures of the University of Agriculturein Kraków within a grant No. BM 4149/2014.
Open Access This article is distributed under the terms of the CreativeCommons At t r ibut ion 4 .0 In te rna t ional License (h t tp : / /creativecommons.org/licenses/by/4.0/), which permits unrestricted use,distribution, and reproduction in any medium, provided you give appro-priate credit to the original author(s) and the source, provide a link to theCreative Commons license, and indicate if changes were made.
References
An Y-J, Breidenbach GP (2005) Monitoring E. coli and total coliforms innatural spring water as related to recerational mountain areas.Environ Monit Assess 102(1–3):131–137. https://doi.org/10.1007/s10661-005-4691-9
Bartram J, Ballance R (1996) Water quality monitoring—a practicalguide to the design and implementation of freshwater quality studiesand monitoring programmes. UNEP/WHO
Bhandari S, Sridhar BBM,Wilson BL (2017) Effect of land cover chang-es on the sediment and water quality characteristics of Brays Bayouwatershed. Water Air Soil Pollut 228(9). https://doi.org/10.1007/s11270-017-3538-7.
Central Statistical Office CSO (2013) http://stat.gov.pl/bdl/app/strona.html?p_name=indeks. Accessed May 18th 2017
Edwards DR, Coyne MS, Daniel TC, Vendrell PF, Murdoch JF, MoorePA Jr (1997) Indicator bacteria concentrations of two NorthwestArkansas stream in relation to flow and season. Trans ASAE40(1):103–109. https://doi.org/10.13031/2013.21254
Esposito A, Engel M, Ciccazzo S, Daprá L, Penna D, Comiti F, Zerbe S,Brusetti L (2016) Spatial and temporal variability of bacterial com-munities in high alpine water spring sediments. Res Microbiol167(4):325–333. https://doi.org/10.1016/j.resmic.2015.12.006
Fehdi C, Rouabhia A, Mechai A, Debabza M, Abla K, Voudouris K(2016) Hydrochemical and microbiological quality of groundwaterin the Merdja area, Tébessa, north-east of Algeria. Appl Water Sci6(1):47–55. https://doi.org/10.1007/s13201-014-0209-3
Frenzel SA, Couvillion CS (2002) Fecal-indicator bacteria in streamsalong a gradient of residential development. J Am Water ResourAssoc 38(1):265–273. https://doi.org/10.1111/j.1752-1688.2002.tb01550.x
Gardner KK, McGlynn BL (2009) Seasonality in spatial variability andinfluence of land use/land cover and watershed characteristics onstream water nitrate concentrations in a developing watershed inthe Rocky Mountain West. Water Resour Res 45(W08411):1–14
Glińska-Lewczuk K, Gołaś I, Koc J, Gotkowska-Płachta A, Harnisz M,Rochwerger A (2016) The impact of urban areas on the water qual-ity gradient along a lowland river. Environ Monit Assess 188(11):624. https://doi.org/10.1007/s10661-016-5638-z
Halliday SJ, Skeffington RA, Wade AJ, Neal C, Reynolds B, Norris D,Kirchner JW (2013) Upland streamwater nitrate dynamics acrossdecadal to sub-daily timescales: a case study of Plynlimon, Wales.Biogeosciences 10(12):8013–8038. https://doi.org/10.5194/bg-10-8013-2013
Harclerode CL, Gentry TJ, Aitkenhead-Peterson JA (2013) A geograph-ical approach to tracking Escherichia Coli and other water qualityconstituents in a Texas coastal plains watershed. Environ MonitAssess 185(6):4659–4678. https://doi.org/10.1007/s10661-012-2895-3
Holko L, Kostka Z, Lichner L, Pis V (2006) Variation of nitrates in runofffrom mountain and rural areas. Biologia (Bratisl) 61(Suppl. 19):270–274
Huang J, Huang Y, Zhang Z (2014) Coupled effects of natural and an-thropogenic controls on seasonal and spatial variations of river waterquality during baseflow in a coastal watershed of southeast China.PLoS One 9(3):e91528. https://doi.org/10.1371/journal.pone.0091528
Janczy M (2015) Tourist movement in the lesser Poland voivodeship.Statistical Office in Kraków. http://krakow.stat.gov.pl/download/gfx/krakow/pl/defaultaktualnosci/745/2/11/1/2015_sygnalna_03_turystyka_2014.docx. Accessed august 15th 2017
Johannessen M, Henriksen A (1978) Chemistry of snow meltwater:changes in concentration during melting. Water Resour Res 14(4):615–619. https://doi.org/10.1029/WR014i004p00615
Environ Sci Pollut Res (2018) 25:10102–10114 10113
Kabbour BB, Zouhri L (2005) Hydrochemical and bacteriological fea-tures of the groundwater: southern border of the Rharb basin(Morocco). Hydrol Sci 50(6):1137–1149
Kangas K, Tolvanen A, Kalkaja T, Siikamaki P (2009) Ecological im-pacts of revegetation and management practices of ski slopes innorthern Finland. Environ Manag 44(3):408–419. https://doi.org/10.1007/s00267-009-9336-2
Korner C, Ohsawa M (2005) Mountain system (in:) ecosystem and hu-man well-being: curent state and trends. Island Press, Washington,Covelo, London, pp 681–716
Krąż P (2012a) Anthropogenic hazards to the Białka Valley natural envi-ronment. Geogr Pap 128:45–54 (in Polish)
Krąż P (2012b) Landscape management problems in the Białka Valley.Probl Landsc Ecol 33:229–234 (in Polish)
Lenart-BorońA,Wolanin A, Jelonkiewicz Ł, Chmielewska-Błotnicka D,Żelazny M (2016a) Spatiotemporal variability in microbiologicalwater quality of the Białka river and its relation to the selectedphysicochemical parameters of water. Water Air Soil Pollut227(1). https://doi.org/10.1007/s11270-015-2725-7
Lenart-Boroń A, Prajsnar J, Krzesiwo K, Wolanin A, Jelonkiewicz Ł,Jelonkiewicz E, ŻelaznyM (2016b) Diurnal variation in the selectedindicators of water contamination in the Białka river affected by asewage treatment plant discharge. Fresenius Environ Bull 25(12):5271–5279
Lenart-BorońA,Wolanin A, Jelonkiewicz Ł, Żelazny M (2016c) Factorsand mechanisms affecting seasonal changes in the prevalence ofmicrobiological indicators of water quality and nutrient concentra-tions in waters of the Białka river catchment, southern Poland.WaterAir Soil Pollut 227(9). https://doi.org/10.1007/s11270-016-2931-y
Lenart-Boroń A, Prajsnar J, Boroń P (2017a) Survival and antibioticresistance of bacteria in artificial snow produced from contaminatedwater. Water Environ Res 89(12):2059–2069. https://doi.org/10.2175/106143017X14902968254917
Lenart-Boroń A, Wolanin A, Jelonkiewicz E, Żelazny M (2017b) Theeffect of anthropogenic pressure shown by microbiological andchemical water quality indicators on the main rivers of Podhale,southern Poland. Environ Sci Pollut Res 24(14):12938–12948.https://doi.org/10.1007/s11356-017-8826-7
Orlińska-Woźniak P, Wilk P, Gębala J (2013) Water availability in refer-ence to water needs in Poland. Meteorol Hydrol Water Manag 1(1):45–50
Ouattara NK, Passerat J, Servais P (2011) Faecal contamination of waterand sediment in the rivers of the Scheldt drainage network. EnvironMonit Assess 183(1-4):243–257. https://doi.org/10.1007/s10661-011-1918-9
Pawełek J (2015) Water management in Poland in view of water supplyand sewage disposal infrastructure development. Infrastructure EcolRural Areas 2(2):367–376 (in Polish)
Pickering CM, Harrington J, Worboys G (2003) Environmental impactsof tourism on the Australian alps protected areas. Mt Res Dev 23(3):247–254.
Ponce-Terashima R, Koskey AM, Reis MG, McLellan SL, Blanton RE(2014) Sources and distribution of surface water fecal contaminationand prevalence of schistosomiasis in a Brazilian village. PLoS NeglTrop Dis 8(10):e3186. https://doi.org/10.1371/journal.pntd.0003186
Rixen C, Stoeckli V, AmmannW (2003) Does artificial snow productionaffect soil and vegetation of ski pistes? A review. Perspect Plant Ecol5(4):219–230. https://doi.org/10.1078/1433-8319-00036
Sinclair A, Hebb D, Jamieson R, Gordon R, Benedict K, Fuller K,Stratton GW, Madani A (2009) Growing season surface water load-ing of fecal indicator organisms within a rural watershed. Water Res43(5):1199–1206. https://doi.org/10.1016/j.watres.2008.12.006
Stocker MD, Rodriguez-Valentin JG, Pachepsky YA, Shelton DR (2016)Spatial and temporal variation of fecal indicator organism in twocreeks in Beltsville, Maryland. Water Qual Res J Can 51(2):167–179. https://doi.org/10.2166/wqrjc.2016.044
Stoffel M, Wyżga B, Marston RA (2016) Floods in mountain environ-ments: a synthesis. Geomorphology 272:1–9. https://doi.org/10.1016/j.geomorph.2016.07.008
Tsuyuzaki S (1994) Environmental deterioration resulting from ski-resortconstrucion in Japan. Environ Conserv 21(2):121–125. https://doi.org/10.1017/S0376892900024541
USEPA (2015)Water: monitoring and analysis. http://water.epa.gov/type/rsl/monitoring/vms511.cfm. Accessed 17 June 2017
Vanham D (2011) Integrated water resources management in AlpineRegions: development and application of methodologies for theanalysis of present and future conditions. University Press, Insbruck
Viviroli D, Weingartner R, Messerli B (2003) Assessing the hydrologicalsignificance of the world’s mountains. Mt Res Dev 23(1):32–40.
Wemple B, Shanley J, Denner J, Ross D, Mills K (2007) Hydrology andwater quality in two mountain basins of the northestern US:assessing baseline conditions and effects of ski area development.Hydrol Process 21(12):1639–1650. https://doi.org/10.1002/hyp.6700
Żelazny M, Siwek JP (2012) Determinants of seasonal changes instreamwater chemistry in small catchments with different land uses:case study from Poland’s Carpathian foothills. Pol J Environ Stud21(3):791–804
10114 Environ Sci Pollut Res (2018) 25:10102–10114