Embed Size (px)
Citation preview

C.P. No. 505 (19,502) (19,502)
A.R.C. Technical Report A.R.C. Technical Report
MINISTRY OF AVIATION
AEl?ONAUTlCAl RESEARCH COU/‘/Ck
CURRENT PAPERS
The Effect of Bend Outlet Conditions on the
Pressure Losses in Bent Circular Pipes
BY
Moira E. Martin and E. C. Deverson
Dept. of Engineering, Cambridge University
LONDON: HER MAJESTY’S STATIONERY OFFICE
1960
FIVE SHILLINGS NET

C.P. X0. 505
The Xfi'ect of Bend Outlet Conditions in the Pressure Ilosses in Gent C;ircular Pipes
Moira E, Aartin and E. C. Dcverson University of Ca;mbridze
Depart;llcn'c of Eqineering
Sum;naQ --
In an experiment made with a three-coil helical pipe a value was found for the bend deflection corresponding to a complete oscillation of the secondary circulation. Proi: this result a bend radius may be determined for a given pipe diameter such that certain secondary flow conditions are attained at the outlet OS a bend of given deflection. R 2" pipe bent on a radius to produce maximum secondary circulation at the outlet of a 30 de;-; bend was used for further experS.lnents. The build up of pressure losses in both the?end itself and in the transition re;,ion downstrcan fro,n the lend wal; investigated for three values of the bend deflection. Si,ni.Iar calculations were made for
flow in a helical pipe at approximateljr the same Xeynolds numlber. The efi ect of varying the downstrealn transition length was also considered,
Introduction L-II.-*e.c^---Y --
Pressure losses in pipe bends have been measured by a number of investigators and widely varyiq results have been reported (Sray 1945). This is probably due not merely to tlneir use of differing inlet velocity distributions mxt also to the cond-Ltions at the outlet of the pipe.
In a theoretic:& discussion of flow in bent pipe s ila5thorne ( 1951) shows that the secondary circulati.on which appears in bands is of an oscillatory nature vtith a perioil -proportional to &d/Z9 dlere d is the diameter of the pipe a& R is the radius of the bend, 3ecause of increasing frictional effects in the bend the secondary Sot, is subject to large daqinrl;, and, provided that the bend deflection is large enough, thcrc will be a region of fully developed curved ilow after perhaps one or two complete periods. In such a region the velocity profile is si.Clar throucllout, but what that profile is like will depend on the geometry of the bend and the deflection at which fully developed curved ilsi;! is attained, A theory for laminar flow in the fully developed curved flow re;;ion was first presented by Dean (1~27)~ who described the pressure losses in terms of a paraineter dependin only on the ratio d/a: and the iioyn.Ads number, The relevance of this paraileter hr*s been confirmed by the experiments of ddler (1934) and
White (192@' ,, and in a recent contribution to the theory made by &rua (1355). It does not however describe the flow when turbulent conditions are obtained, nor has a method yet been su,, ~,~~estzd Yor extending the theory to these more practizal case:;, in a system for which thers is no such region of fully developed curved flow the conditicns in the downstream transition region will vary with the phase of the secondary flow oscillations attained at the bend outlet; this in turn being determined by the geoiactv of the bend and the inlet conditions. Furthe-nmorf.2 the "stilling lcngth'P - i.e., the transition len&'n in v,hich a sy,nmetric velocity is recovered - may well be in excess of' sixty diaileters, whereas pipe-flo?;J tests are frequently made G.th comparatively short transition lon~ths. Or eV3il no transition length at all. Xith such a large r,;nze of possible outlct conditions it is clear that any sort of correlation betvrecn the rcsulks of different eqcrinenters is likely to be veq difficult.

-2-
The first group of experiments reported here was designed to study the important effect on the build up of pressure losses of the vaiue of the secondary circulation at the bend outlet. A three-coil helical pipe was used first to determine the bend deflection corresponding to a complete oscillation of the secondary circulation. Using this reBu.lt a ratio of d/R may be calculated to give a maximum value of the secondary circulation at the outlet of a bend of, say 30°. The same value of a/k will produce zero secondary circulation at a deflection of 60", and a small circulation in the opposite direction at 70°. Three such systems were used to investigate the difference in the build up of pressure losses in both the bend itself and in the downstream transition region. The results are compared with losses calculated for the helical pipe in which (of course) there is a region of fully developed curved flow. All the tests were made at approximately the same Reynolds number with approximately the same inlet vslocity profiles, and in each case the downstream transition length was sufficient for a nearly symmetrical velocity distribution to be attained at the pipe outlet.
The second aspect of the problem considered is the effect caused by varying the downstream transition length. Except for one test made on the helical pipe attention here was confined to the 2" pipe with the 70' bend, using six different transition lengths between 62 diameters and zero.
Flow in Bent Circular Pipes
In a given system consisting of a circular pipe of diameter d, bent on a circular arc of radius R, with a length of straight pipe of the same diameter downstream of the bend, three flow regions may be distinguished. Firstly there is the inlet transition region in which the inertia forces are more important than those due to viscosity. The main effect here is the generation of a component of vorticity e in the direction of flow. Using an inviscid fluid theory Hawthorne (1955) shows how, nhen the inlet velocity profile is linear, to a first approximation the effect of the secondary flow is to rotate the entire streamline pattern about the axis of the pipe. Having previously made this assumption Hawthorne (1951) showed that the nature of the secondary flow is oscillatory, the angular displacement a being given approximately by the equation:
d d?a - e-v = cos a . . . (I) R d#2
where $ is the bend deflection.
Horlock (1955) considered the secondary flow as a perturbation on the main potential flow and, with a linear velocity profile, established the first order result that E is uniform over any plane cross-section of the pipe and is a, function of @ only. The circumferential velocity is then given by:
v = +d . . . (2)
The analysis may be extended to more general pipe flows where the inlet velocity profile is symmetric,1 about the pipe axis if it is assumed that the pipe be divided into two halves by the plane of the bend and that in each half E; is replaced by a mean vorticity grn whose product with
the cross-sectional area of the pipe gives the total circulation. Then
E;m +Si hl
J
* -- = -2 igrad - i cos a -- *** (3) q 0 i pi $
where h, p, and q are the stagnation pressure, density and velocity respectively.
Also/

-4-
Determination of Pr~sure Losses -.
Consider a system in which the bend deflection is $I and the downstream transition length is 4.
The overall losses in the system may be calculated from the difference between the values of total pressure at bend inlet and pipe outlet. A mass averaged stagnation pressure H may be defined by the intcgrsl
4 -d/2 2n H = w-.-m
J i nq$ 0 hqr dr de
0
where r and 0 are polar co-ordinates in the cross-section of the pipe
h is the stagnation pressure at the q is the velocity at the point (r,
oint (r, 0) 0 P
4 is the mean velocity.
At the bend inlet, assuming that the straight entry segment is long enough to ensure fully developed turbulent flow there, the velocity profile is symmetrical about the pipe axis and therefore h is independent of 0. 8 s d/2
hqr dr
At the pipe outlet a surface traverse may be made which will give h = h(r) 0). A numerical value for HO may therefore be determined.
The mean overall loss is then tfzf”(! l
$P%.
With the straight part of the pipe is associated a friction coefficient hs given by:
AP d 1 = ---- . -
S $pq2 x
where Ap is the pressure differeme measured over a length x. Then, the loss in a length of straight pipe equivalent to the length of the given system = hs($ R/d + e/d>.
Two loss coefficients may then be defined:
An excess loss coefficient & = Total pressure loss -"-.w"'.."'-'--"' Mean dynamic head
Total pressure loss in equivalent length of straight - ---w-s '--'""-""""'-"---~---------------------- &~e, IvIean dynamic head
And a loss ratio coeffioient Zr =
Total pressure loss '--"'--'-7-'-- I---------------------I'---.- ?o?ai-pressurc loss in equivalent length of straight pipe
HI-HO hs a;r; = w--m- - -- 6% + 4)
$G2 d
Pressure/

-5-
Pressure losses may also be estimated over parts of the system separately. In a region of fully developed curved flow tine inlet and outlet velocity profiles are similar, hence the total pressure loss is constant across the cross-section of the pipe, If HcI and IicO are tine values of H at
inlet and outlet to this region respectively and if hcI and hcO are the
values of h at the corresponding cross -sections for the same values of r and 0,
2X qhcIr dr d8 - qhcOr dr d8
HcI - HcO = -.,.--...a---- qr dr dO
= hcI - hcO,
Downstream of a cross-section and the static pressure loss. defined above since H through the region.
the bend the static pressure becomes constant over actual total pressure loss here will be cqua.1 to the This value may differ slightly from the mean loss depends on the velocity profile and this is changing
For the bend transition region as a whole a mean loss may be estimated equal to the overall loss minus the losses in the other regions. A more detailed determination of the build up of pressure losses in this region however requires the making of total head traverses in several planes at each cross-section, and this technique must also be applied for information about the losses in the immediate vicinity of the bend outlet. An alternative method when only comparative results are necdcd is to define at each cross-section a mean static prc 'ssure calculated from readings taken at a number of points on the pipe wall.
Let 0 be measured from the radius directed towards the bend centre and let p = p (0.2) be the sL batic prcssure on the wall, where z is the distance in diameters from the bend inlet. Then associated with the cross-section z = constant a mean pressure may be defined by the equation:-
I 2n d i4d = 1;; o J p(z.0) - dO. l ** (5)
2
Also useful for comparative purposes, such as arc wanted in the second group of experiments described below, p(zl) - p(s) for constant 0.
arc the actual static pressure differences
Loss in Availability
The availability corresponding to a state of a system for which its energy is E, its volume V and its entropy S is given by
(E + p,V - ToS) - (E. + p V - ToSo) 0 0
where p o and.T o denote respectively the prc ssurc and temperature of the
surrounding atnosphcre and E o, V. and So denote rcspcctivcly the energy,
volume and entropy of the system in the dead state: that is the state in which there is no possibility of obtaining v;ork from the system, the surrounding atmosphere, or from interaction between the tT;;o. (Kcenan (1949)).
Consider/

-6-
Consider a steady stream of fluid cntcring a pipe with velocity U.
The energy e per unit mass is given by: e = u + ;; I? where u is the internal enorgy per unit mass. But i = u + pV where i is the cnthalpy. :. The availability per unit mass becomes
(i - ToS c $ v") - (i. - ToSo)
If the subscript 1 refers to conditions at entry, and the subscript 2 to those at outlet, and if it is assumed that U is constant down the pipe, the loss of availability per unit mass between entry and outlet is:
p = (il - $ ) - To(Sl - S,)
s-s For an ideal, polytropic gas pV = RT and pVy = A cxp ---2 where A
C V
is a constant. From these equations it may be shown that
i = -y- RT y-1
and %- s, --y--- = log CPJPs > f Y log (V&J
V
sz- s 1 = R log (P,/P,) - cp lee; <T/T,)
If further me assume that the change from state ? to state 2 takes place adiabatically, di = o and there will be no change of temperature along the pipe.
Hence p = BT0 10~ (P,/P~)
Writing pi = pdc + p,
Pz t: p2e + po where p,e and p2e arc the pressures in excess of
atmospheric prcssurc at states 1 and 2 rcspectivcly. p2e small compared with p,
For values of pie and
PI ' (P -- 2 “-
Pz PO
ie + p,) (1 - %)
P* - '2e P.5 h 1 + 2s ------ = -j + -2
PO PO
where p, is the static pressure difference bctnoen states 1 and 2 and
be., . . . (6)
Let subscripts b and s refer respeotivoly to a bent pipe and to an equivalent length of straight pipe.
me/

where
-7-
The excess loss of availability coefficient A@ is defined by
A0 = 'b -% s-----m = --
RTO
- (ps)s j
PO cpo = 7-1; HP4
Compressibility effects have bcLn ignored in equation (6) by the negltict second order terms. This is certainly justifiable in the present tests where u n- 100 ft./set.
of
ulation
~eriacnts with a helical wipe -----l-z-w
The pipe used in these tests KLS made of steel and had an approximately circular cross -section with a nominal diameter of 1,9". It consisted of a three-coil halioal section bent on a mean radius of 9.5”, to which were flanged pieces of straight pipe made of similar ma'icrisl forming an entry scgnent 7’ 5” long and ‘an outlet length of 9' 3". Holes were drilled in the pipe at a point 6 " before the commencement of the bend and then at &5O intervals in the first complete turn oi" the helix; also at various points near the end of the bend and in the straight section downstream of it. Total head traverses mere made across the ctintre line of the pipe in the plane of the bend only: for these a pitot tube of 0.043" outside diameter was used.
Traverses were made at fifteen points along the pipe and the corresponding total head profiles are shown in Pig.1. The location of the pipe mall is indicated for each traverse since, due to flattening in the bend, the diameter of the pipe varies between 1.30" and 1.66" there.
It will be noticed that the profiles after 360° and 1045’ arc very nearly similar, from which it may be deduced that fully dcvelopcd curved flow is attained in the bend at a deflection of about 3GO”.
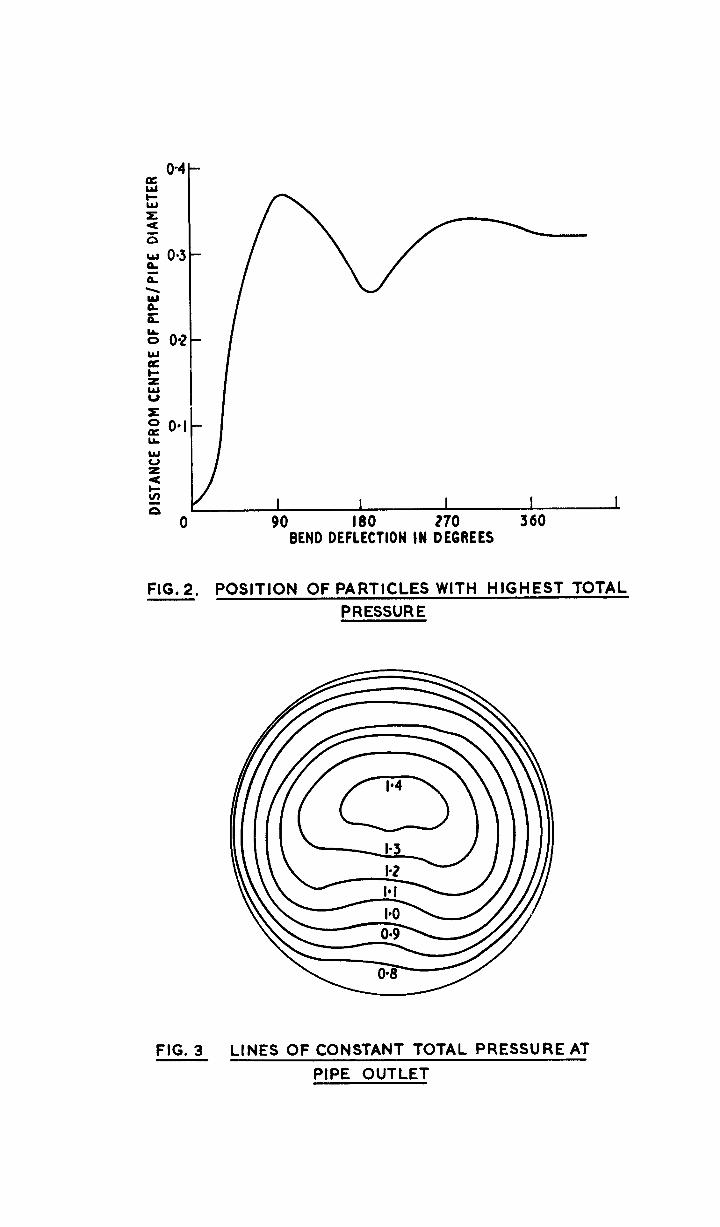
The position of the particle of highest total pressure determines to a first approximation the angle of displacement of the fluid in the bend. Fig.2 shows the oscillatory nature of this angle CI and gives the value of the bend deflection for a complete oscillation of the secondary circulation as 195”. The oscillation is apparently conpletolJr damped after about two periods. Writing the period of oscillation as 2~l3v%fi this gives an experimental value of B = 1.21 compared with tne thcorctical value of 1.18. Comparison may also be made with the experimental results of Squire (19%) who, operating at a Reynolds number of 3 x IO', obtained a value of 1.16 < B < 1.45.
Of particular note is the remarkable change of total head profile at PO0 defkction: thzrc is can apparent "caving in" on the inner side of the bend which occurs shortly before the direction of the secondary circulation is reversed. Such a clogging effect is observed by Eichcnberger (1952) ia his experiments with a 8" x 8" curved duct. It occurs again here - though to a ve1y much smaller extent - irrmcdistely downstream of the end of the bend. With both points arc associated positions of approximately maximum displacement of the particle: of highest total pressure.
For the determination of HO, defined above, a surface traverse was
made at the pipe outlet, the result of which is shoivn in Fig.3.
Static/
-8-
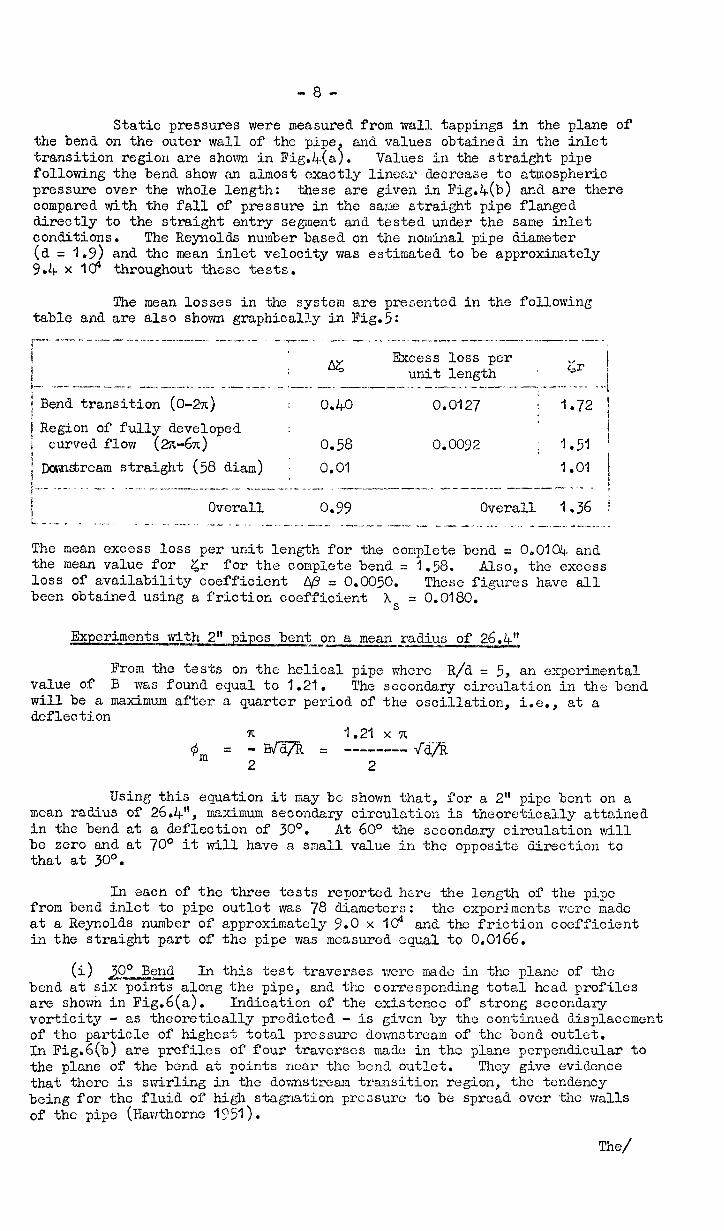
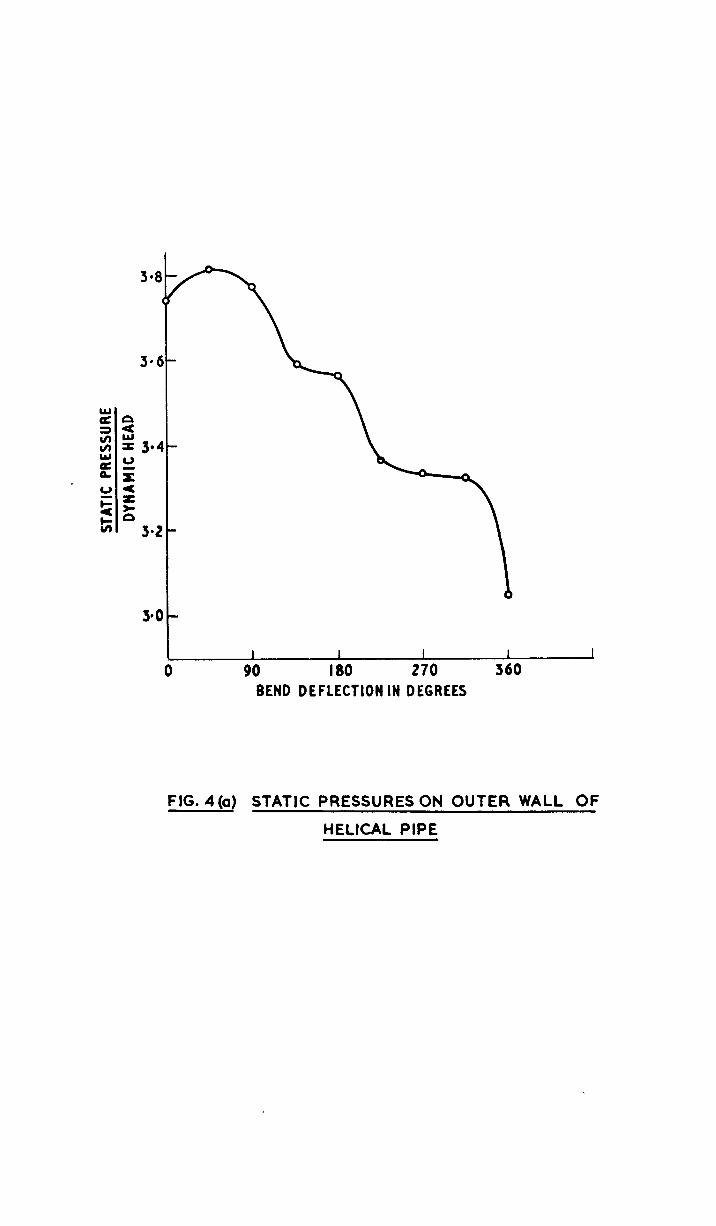
Static pressures were measured from wall tappings in the plane of the bend on the outer wall of the pipe
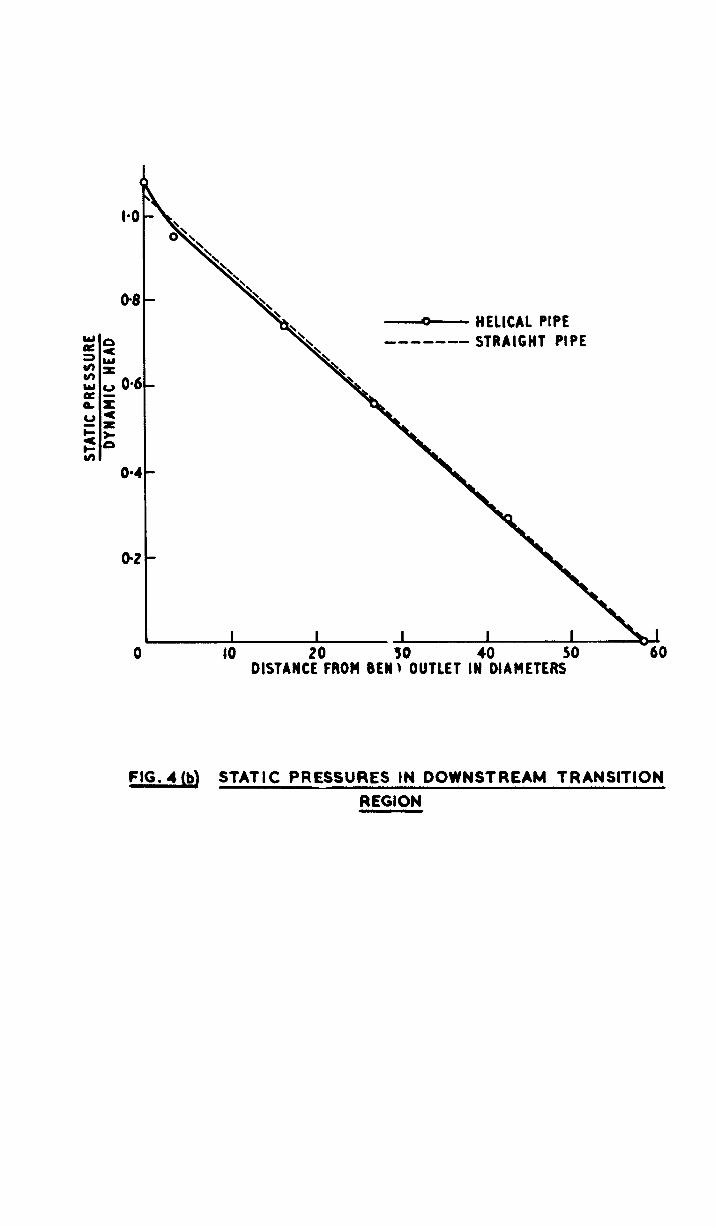
) and values obtained in the inlet
transition region are shown in Fi&+(a . Values in the straight pipe following the bend show an almost exactly linear decrease to atmospheric pressure over the whole length: these are given in Fig.&(b) and are there compared with the fall of pressure in the same straight pipe flanged directly to the straight entry segment and tested under the same inlet conditions. The Reynolds number based on the nominal pipe diameter (d = 1.9) and the mean inlet velocity was estimated to be approximately 9.4. x Id throughout these tests.
The mean losses in the system are presented in the following table and are also shown graphically in Fig.5:
! “ - - - . - , . “ ” - . - - ^ - - . - , _ , . - _ -L .___,____._ m m . . . . - . . - -“q-w- . _ . . . - . . . -_ . ._ __ . . - . - - “ . . “_~-^l-“-- ______.___I._. “ -__-“- *_.__.
i Excess loss per i K unit length Zr !
i i-. .,.v- ---I --.- --.__l-.____ ^~-- _.-___-_ - *_-__ -___ ---_ .___-_.- _.̂ --_.-_1 _-I -I--..- -- ..---,.- --.. ----. . . . 1 Bend transition (0-27~)
t 0.40
i
0.0127 j 1.72 1 Region of fully developed i
i curved flow 0.58 I
(a-6x) 0.0092 ; 1.51 ! i W&ream straight (58 diam) : 0.01 1.01 j i -..- _ -. -. -_ _ f .- _-. -_ _._.---__-_-_- - -_ _-_- -I _--__ _-.. .-~_-------. ..a-. II..___ w--e -...^---I - - -- i
Overall 0.99 Overall 1.36 i i . . . - - . - . . . . . r . . . . . . -_ “ . _ . . ^ . . _ I “ . - , . . _ - . . - . . “ . . . I - _ - ^. I ._.*__._ . -_ - . - . _- “_,ll-” ~. I . l - - .~ . . 1 ” . - I _ . . - . - . - - . - ~ “ “ - .
The mean excess loss per unit length for the complete bend = 0,0104- and the mean value for zr for the complete bend = 1.58. Also, the excess loss of availability coefficient a/3 = 0.0050. These figures have all been obtained using a friction coefficient hs = 0.0180.
Experiments with 2" pipes bent on a meanradius of 26.4"
From the tests on the helical pipe where R/d = 5, an experimental value of B was found equal to 1.21. The secondary circulation in the bend will be a maximum after a quarter period of the oscillation, i.e., at a deflection
Using this equation it may bo shown that, for a 2” pipe bent on a man radius of 26.4-l!, maximum secondary circulation is theoretically attained in the bend at a deflection of 30°. At 60~ the secondary circulation till be zero and at 70' it will have a small value in the opposite direction to that at 30'.
In each of the three tests reported here the length of the pipe from bend inlet to pipe outlet was 78 diameters: the experiments v:C:re m&s at a Reynolds number of approximately 9.0 x I@ and tnc friction coefficient in the straight part of the pipe was measured equal to 0.0166.
(i) 30" Bend In this test traverses were made in the plane of the bend at six points along the pipe, are shown in F&b(a).
and the corresponding total head profiles Indication of the existence of strong secondary
vorticity - as theoretically predicted - is given by the continued displacement of the particle of highest In Fig.G(b)
total pressure dovmstrcam of the bend outlet. are profiles of four traverses mado in the plane Rerpendicular to
the plane of the bend at points near the bend outlet. They give evidence that there is swirling in the dovmstream transition region, the tendency being for the fluid of high stagnation pressure to be spread over the malls of the pipe (Hawthorne 1?51).

-P-
The mean losses in thz system were calculated as follows:- :,e---. ."-II " I. I_ _.I .I ^_^.._._**.111 " ."" " . ..- I ,--_ _-"_..l"_l .* ..,I LI ._II_ ."".,l"." _l_ll ." - 111_1_-_- "I.--I. .-I - *---.,-..(
t Excess loss i i
i
AC 1 per unit length ijr i --I--".-- ---_-* I --I .- .-_ _.______ .__ II-- .-- I -1~ - 1. - - -- .:--- .--__" _ - .-."--- .--- -.. .- * _-- _._-_.- " _, i
j Bend (O-300) : 0.04 0.0052 1.36 1
; Downstream (I) (0-26 d&m.) i 0.15 ) I 11 I
(2) (26-44 dism.) i 0,053 :
1 11 (3) (44-71 dism.) : 0.06 : i
l.y.+ j
0.0042 1.30 1
f”--”
1.13 1 I --_-_.~ ---I --- _-_.-_ __^ -_ ._.,” -...- _ __-__ -__--_ _ _-., _- __..--l -.--- I--.- --I- --...--*--1--.- -- --_. - _-I-. I._.- .j
Overall 0.34 Overall 1
1.26 I j I ^ “ ” - _ - - _ . . - - . - . I “ . , 1 - - _ . I . _.~” . I ^ . _ . - - . . . . ” _._ ____ _ . ,_ . . I . . . _ - . _ I I _ . . . - I . . 1.1 I 1.1. - . I
with an excess of availability coefficient &3 = 0.05~16.
Overall losses are calculated from total pressure losses but otherwise the figures above arc based on static pressure readings. These were taken at points on th e wall in both the plane of the bend and in the plane perpendicular to it. Compared with the change between two cross-
sections in the mean total pressure Hb,) - II( and moan static prcssurc
F(zi) - p(z2), the local total pressure difference h(r, zL) - h(,-, z2)
(mcssurcd in the plane of the bend) gives a very low estimate of the pressure loss in the downstream transition region, This ifould be expected to occur in a section where there is swirling for, while high velocity fluid near the walls of the pipe is a source of increased loss, the spread of such fluid to the "inside" wall (0 = 0) will rcducc th.e total pressure drop there. It is rcmal*kable that even with 71 diameters of straight pipe after the bend the total head profile at outlet is not exactly symmetrical.
(ii) 60' Bend --- Total head profiles for this system arc shown in Eig.7. The displacement of the particle of highost total pressure appears to be approximately stationary at the bend outlet, as expected, but the change of profile on the inside of the pipe is most marked a short distance downstream. The outlet profile after a transition region of 64 diameters is seen to be still some way from being symmetrical. Mcsn losses calculated as before give: ;.-- .---- I_I_ _" _ ._.., .- -.. .- I . . . .I _.I I_ , .I "_ 1 .-. . , _" _-I _._ .. ..'I .-II .i' i Excess loss i... . ̂ I .” I.- --“..I-... _..- .I-- . . . . . . _.
AZ ; per unit length g:r ;
! :-I_.. “. _._ “~ _...__,, _ _, . . __, _ I_ :... ___” . /
i Bend (0 - 60~) 0.17 i 0.0124
i Downstream (?) (O-19 dian.)
1.74 i 0.10 4 1.30 ;
! t1 I (2) (19-37 diam.) _ 0.09 ; { 0.0036 1.29 ! i I .--...-.- _I- “. 1.11 -- ._-1--.--_1 .I _--- (3) (37-64 dim > 0 04 I -..-.I-.- -_ -____ ._t __*__ ___ -... ,.-.__- _____ _“__, _ ! Overall 0.40
1.09 ;
I . _I __ . I.._ _ .” - . .I - .- - .., _ . . - .- _ ap= 0.001 y
Since the secondary circulation is theoretically zero no effort was made to locate swirling in that region.
. - . - * . - - ” I . . . -_--_-“_I . . - r l-,
Overall 1.31 i
I . . . - ^ . _ , I . ” __*I_ . I
at the bend outlet
(iii) 70' Bend (See Pig.8). ___u" I- The direction of the secondary vorticity is now reversed before the bend outlet and an immediate rccovcry tov:srds a symmetrical profile is apparent in the downstream transition region. Pressure losscc here arc given by:

AZ Excess loss
per unit length ---. _ ^ _--__ -.--.- I_ -- .-.- ----.---“---- .I -1 .--.------.--I..___ _ . ..I _I -_. .--- _---_-,_-
i Bend (O"-70") 0.22 0.0136 t
j Downstream (I) ( O-17 diam.)
1.82 1
0.12 > 1
i II (2) (17-35 diam.) 0.07
j 0.0039
-t&-3 j
1.23 i
11 (3) (35-62 diam.) 0.05 > 1.11 i i -_- ". - .- -- - - - _ -.- I -- -._ _____ "".sm- _ _ II "--"" ---- -- _- ---_- . .._. . ..^_ _ _ . ..~"-- .--_. ._ -- .._.-__._-- / Ovcrsll 0.46 Overall 1.35 i ,. ""1 I ___" ._ -... __" -_ ". -. "̂ .-- .-. ."_ ., -I_. I _ .̂_. .I -__ -_I-. ._II ._~ -.... ". ----- -.. . . 1 _/
np = 0.0021.
Values of the rate of change of Ms with distance are plotted in Fig.9 against distance from the bend inlet. These are compared thcrc with the corresponding build up of pressure losses in the other tests, including those made with the helical pipe.
Measurements of mean static pressures in the downstream transition length are presented for comparison in Fig.10, together with the corresponding inlet static pressures.
Effect of the Downstream Transition Length - -------I---
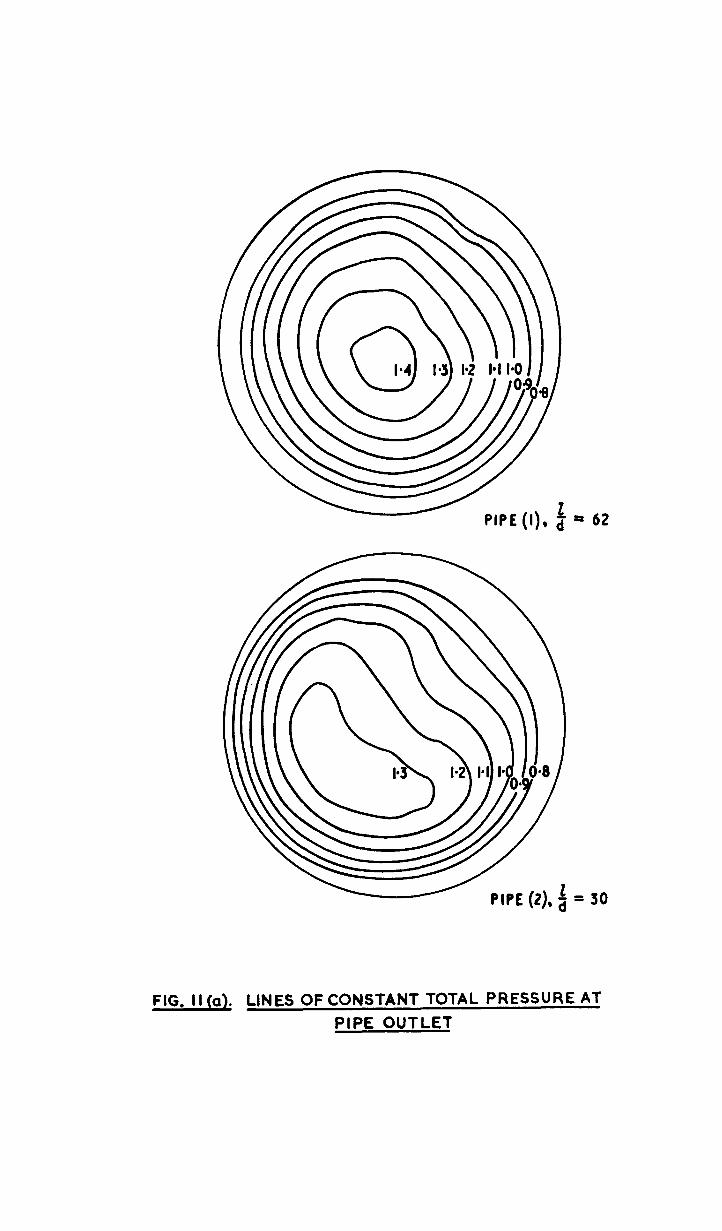
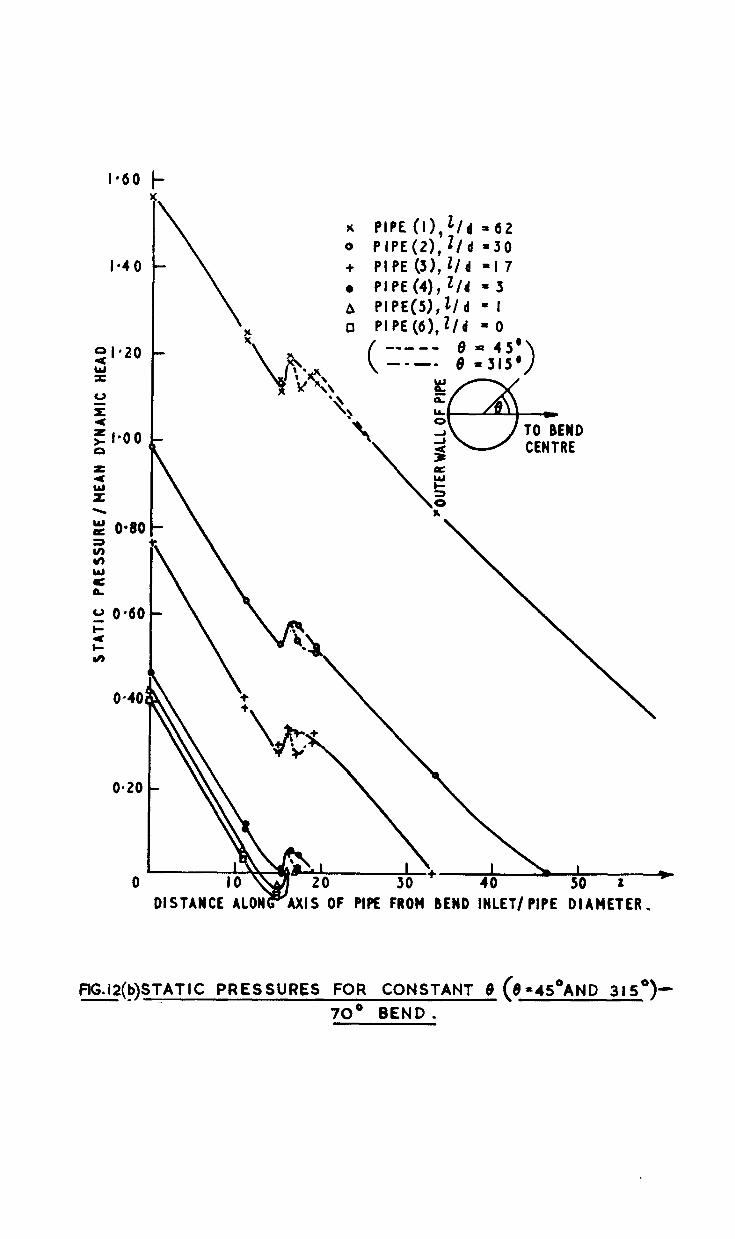
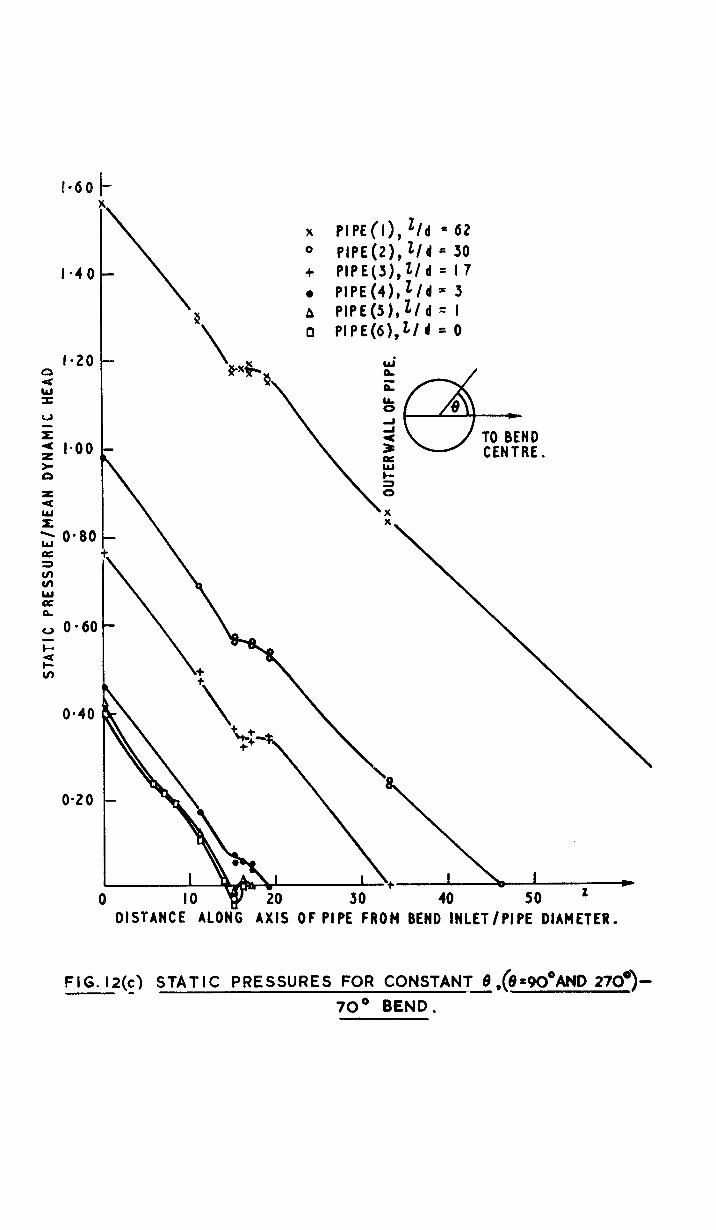
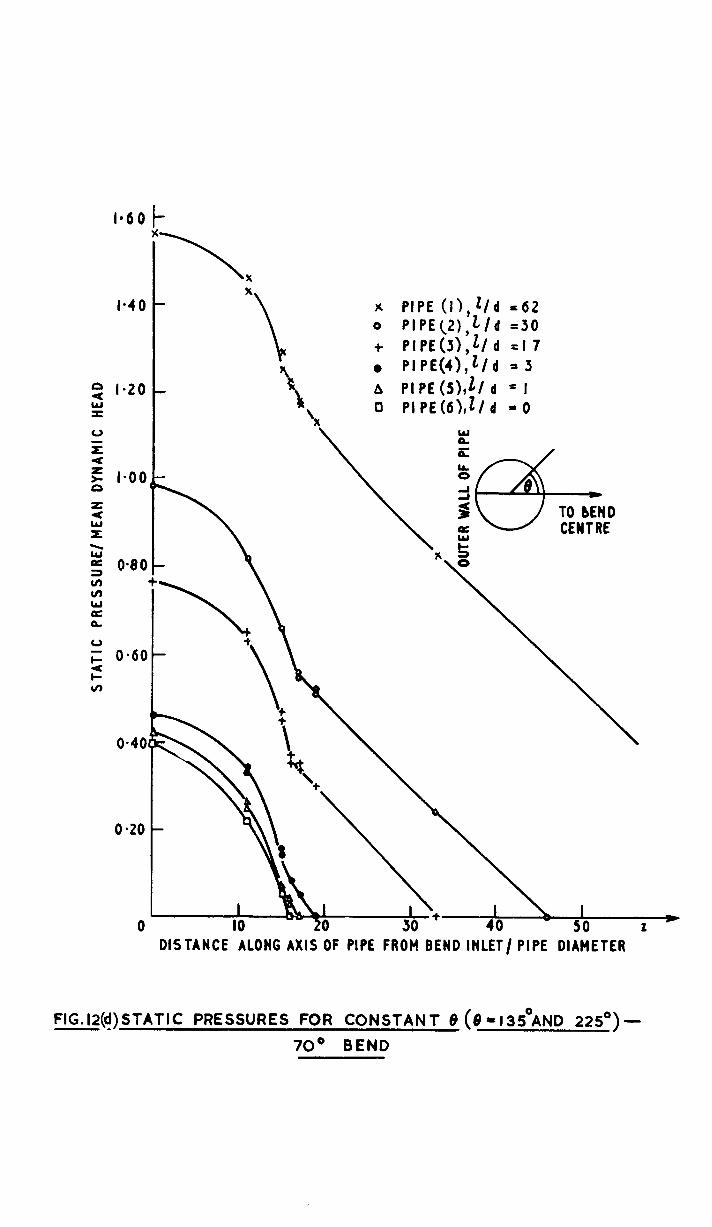
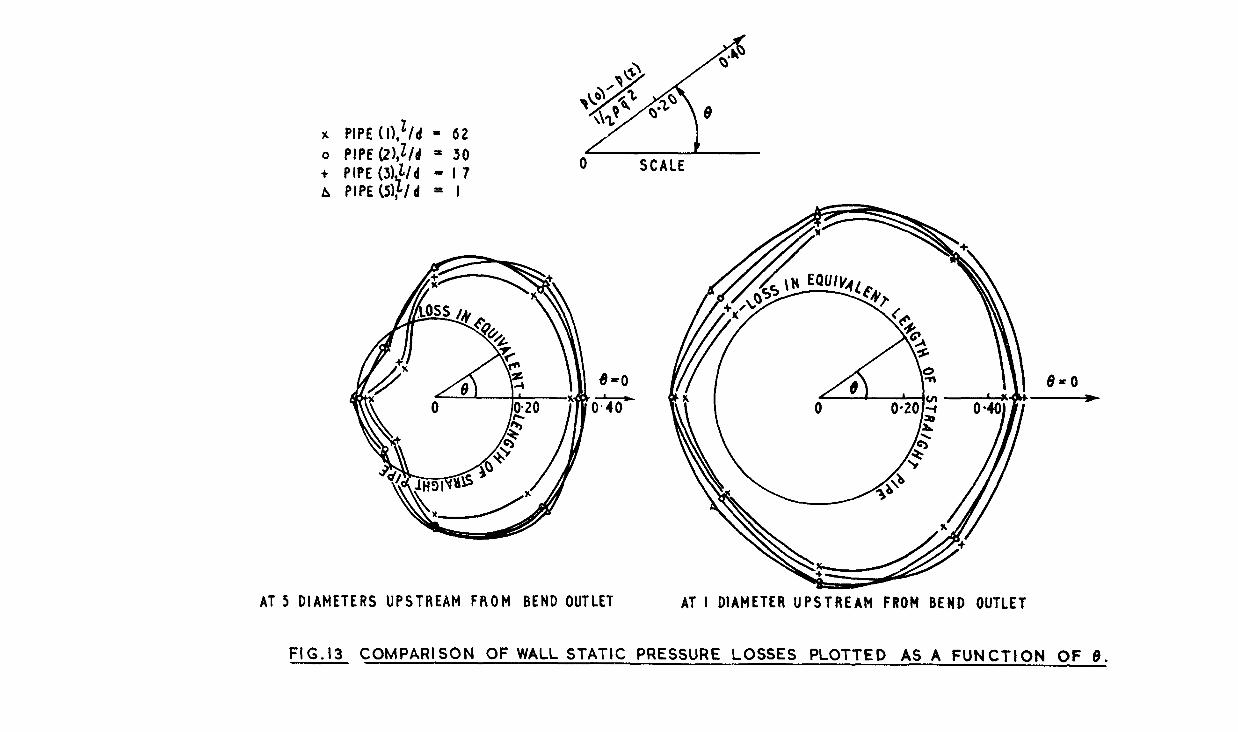
The 2" pipe with the 70° bend described above YKM also used to study the effect on the pressure losses of a variation in downstrL,nm transition length. The original pipe had a transition length of 62 diameters and this VT;LS gradually cut back (in 5 stages) until only ,thc bcncl its&f was left. Holes for measuring static prcssurcs were made in the pipe wall at a number of cross-sections in the neighbourhood of the bend outlet and downstream from it: in all eight holes were drilled at each cross-section at 45" intervals around the pcrimcter. Special care was taken to ensure that inlet conditions were as near as possible identical for each system, the Reynolds number throughout being calculated approximately equal to 8.6 x I@. Total pressure traverses made in each case at the pipe outlet are shol-m in Fig.11. From each of these the mean dynamic head was calculated and a corresponding value found for the mean overall loss: this procedure constituted a check on the overall static pressure loss - it being assumed that the static pressure was constant over the inlet cross-section. Figs.l2(a)-(d) record the wall static pressures PM, z, t/d)/-;pT for constant 8, and Fig.1 3 the same results at tv;o different vslucs of z with the pressures plotted radially as functions of 0.
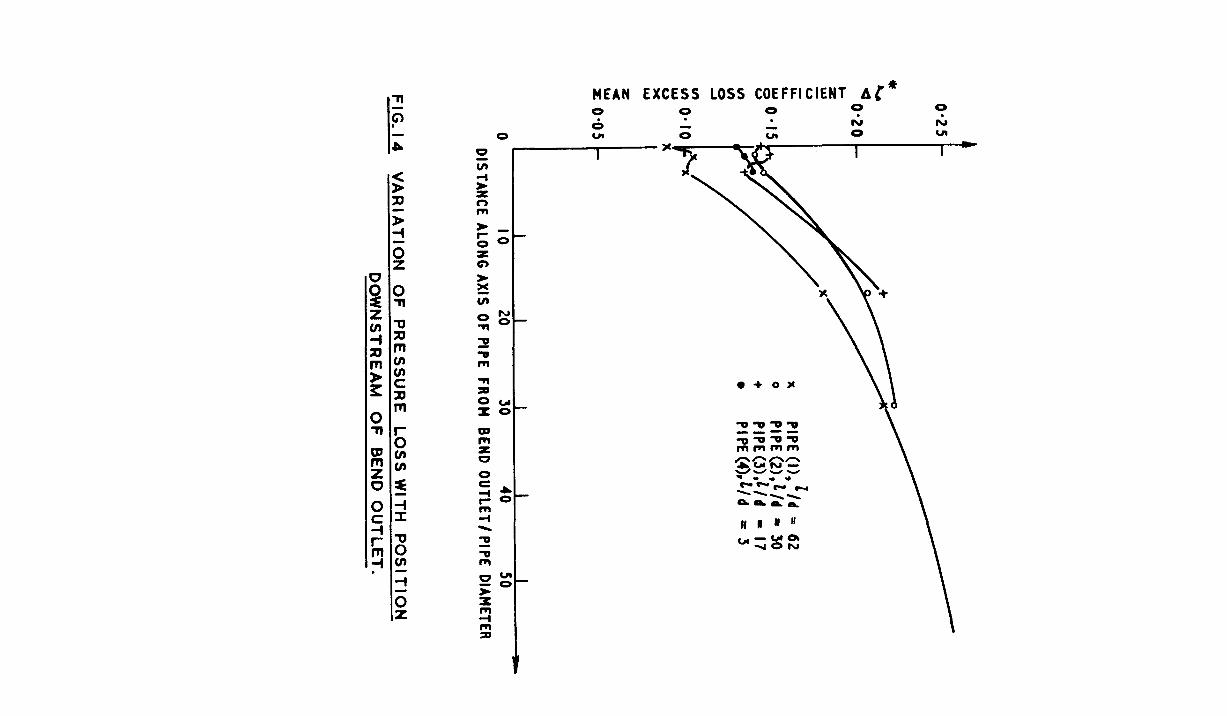
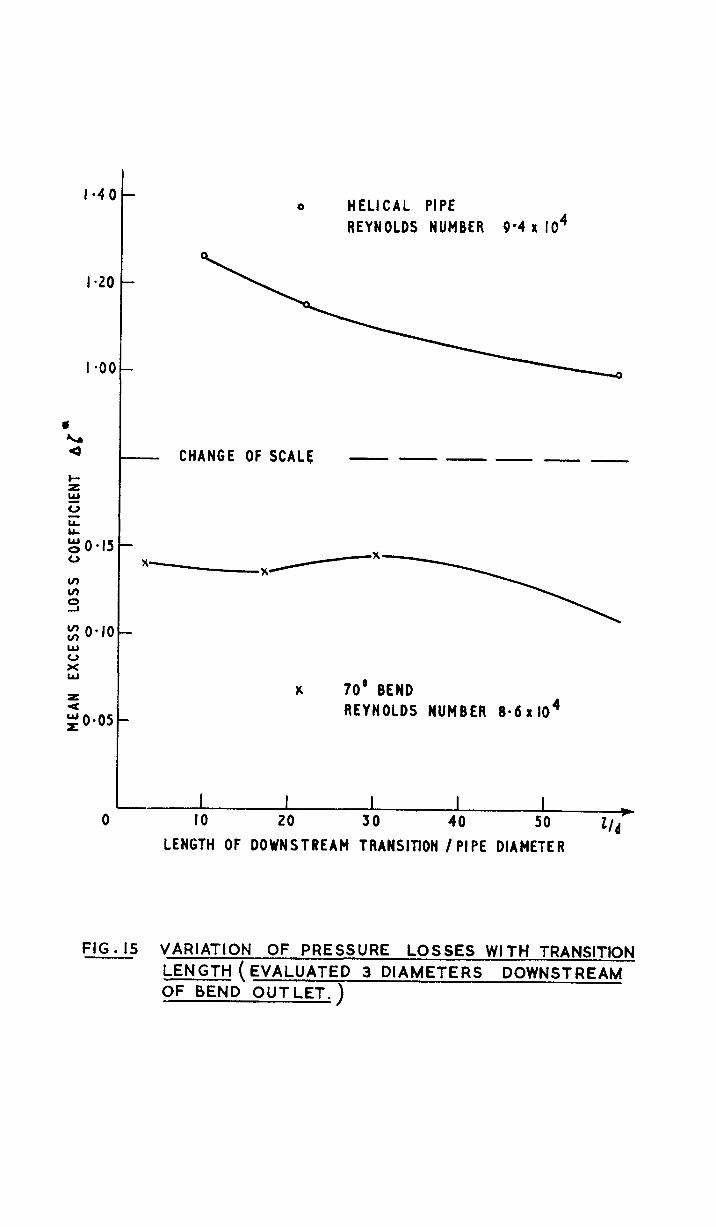
The mean static pressure, defined above by equation (5), was used to determine the mean excess loss coefficient AZ>! at any cross-section. Values of this cccfficicnt are given in Fig.lI+ for different values of z and e/d: in particular the variation of a* with 4/d at a point 3 diameters downstream from the bend outlet is presented in Fig.15 and compared there with some results obtained with the helical pipe operating at a slightly higher Reynolds number.
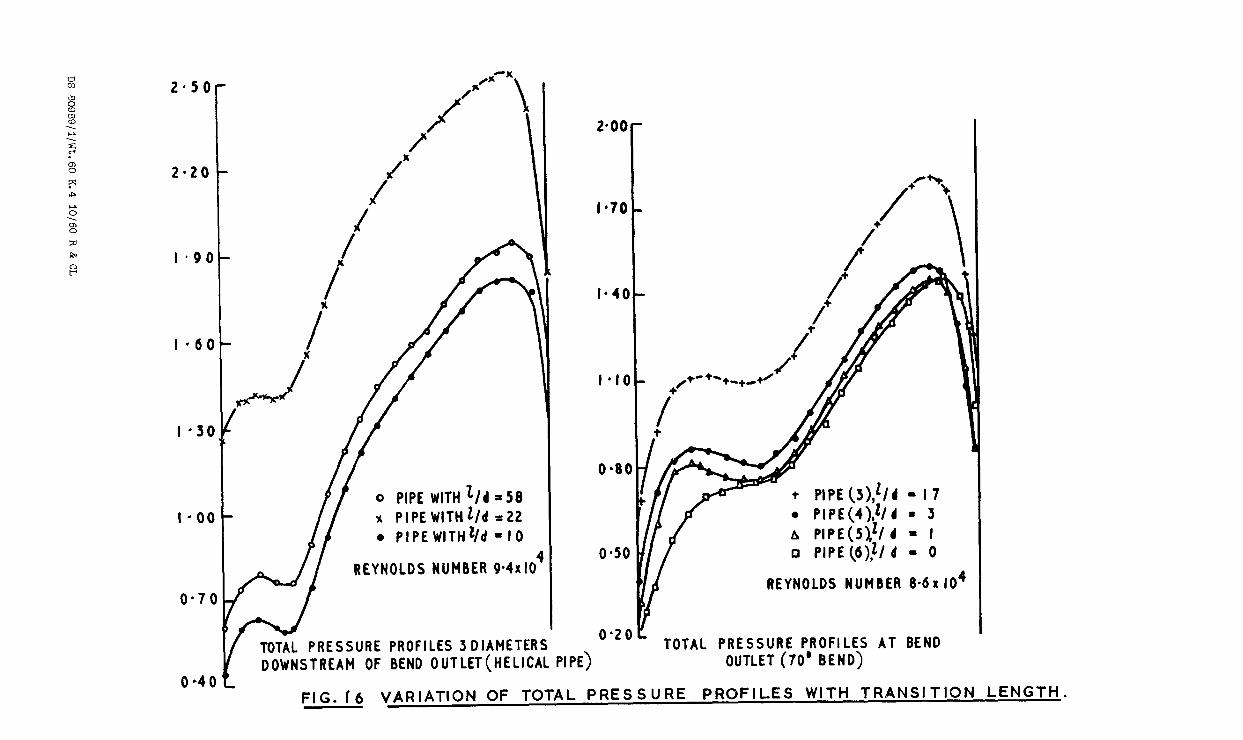
Total pressure traverses mere made at the bend outlet for the 70° bend and at 3 diameters downstream from the helical pipe. Compared in Fig.16 are profiles in the plane of the bend showing their variation nith downstream transition length. It will be observed that changes occur on the inside of the bend, where, as the transition length decreases, the total pressure maximum becomes more pronounced. This effect is not observed, however, at the open end of the pipe when the transition length is zero: here there is no pressure maximum at all, but on the outside there is an increased displacement of the particle of highest total pressure.
The hydrogen sulphide technique nay be more useful in tne investigation of tJ?o-dimensional phenomena for, in a series of tests carried
out/
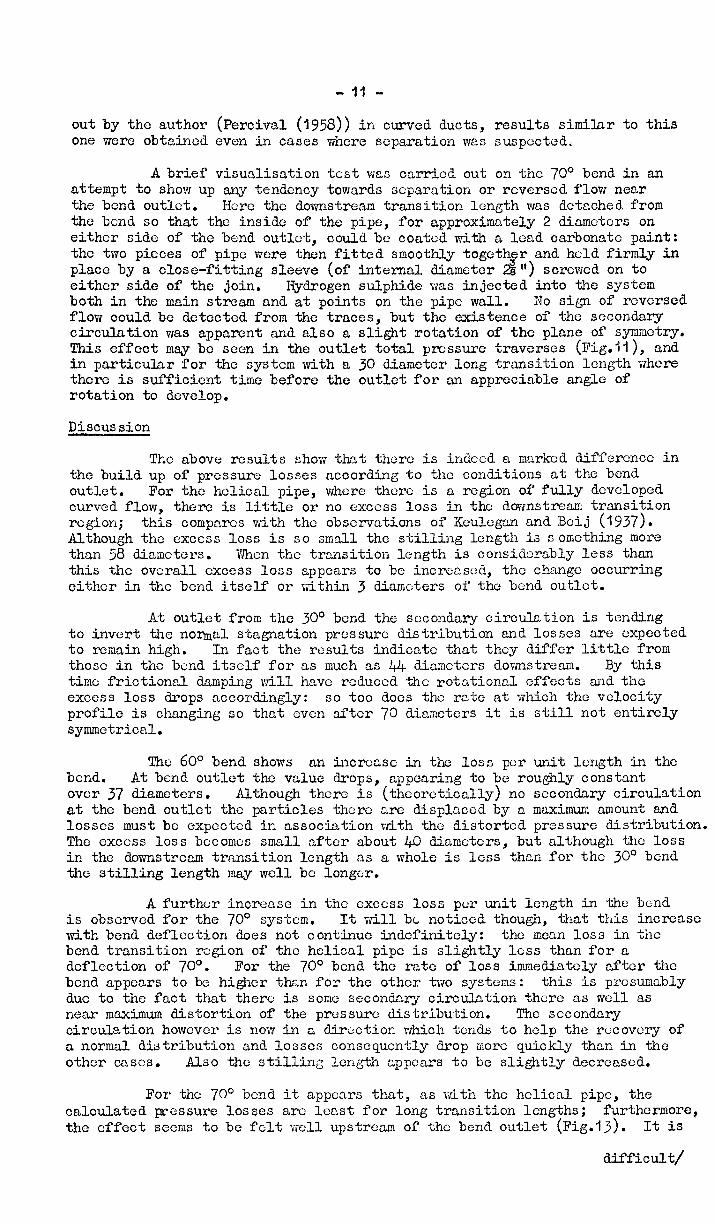
-11 -
out by the author (Percival (1958)) in curved ducts, results similar to this one were obtained even in cases where separation was suspected
A brief visualisation test was carried out on the 70° bend in an attempt to show up any tendency towards separation or rcverscd flow near the bend outlet. Hcrc the downstream transition length was detached from the bend so that the inside of the pipe, for approximately 2 diameters on either side of the bend outlet, could be coated with a lead carbonate paint: the two pieces of pipe were then fitted smoothly together and held firmly in place by a close-fitting sleeve (of internal diameter d'*) sorcned on to either side of the join. Hydrogen sulphide was injected into the system both in the main stream and at points on the pipe wall. No sign of reversed flow could be detected from the traces, but the existence of the secondary circulation was apparent and also a slight rotation of the plane of symmetry. This effect may bc seen in the outlet total pressure traverses (Fig.ll), and in particular for the system with a 30 diameter long transition length where thore is sufficient time before the outlet for an appreciable angle of rotation to develop.
Discussion
The above results show that there is indeed a marked difference in the build up of pressure losses according to the conditions at the bend outlet. For the helical pipe, where there is a region of fully developed curved flow, there is little or no excess loss in the downstream transition region; this compares with the observations of Keulegan and Bcij (1937). Although the excess loss is so small the stilling length is something more than 58 diameters. When the transition length is considerably less than this the overall excess loss appears to be increased, the change occurring either in the bend itself or within 3 diameters of the bend outlet.
At outlet from the 30' bend the secondary circulation is tending to invert the normal stagnation pressure distribution and losses are expected to remain high. In fact the results indicate that they differ little from those in the bend itself for as much as & diameters downstream. By this time frictional damping will have reduced the rotational effects and the excess loss drops accordingly: so too does the rate at which the velocity profile is changing so that even after 70 diameters it is still not entirely symmetrical.
The 60" bend shows an increase in the loss per unit length in the bend. At bend outlet the value drops, appearing to be roughly constant over 37 diameters. Although there is (theoretically) no secondary circulation at the bend outlet the particles there are displaced by a maximum amount and losses must be expected in association with the distorted pressure distribution. The excess loss bccomcs small after about 4-0 diameters, but although the loss in the downstream transition length as a whole is less than for the 30' bend the stilling length may well bc longer.
A further increase in the excess loss per unit length in the bend is observed for the 70° system. It will bc noticed though, that this increase with bend deflection does not continue indcfinitcly: the mean loss in the bend transition region of the helical pipe is slightly less than for a deflection of 70°. For the 70' bend the rate of loss immediately after the bend appears to be higher than for the other two systems: this is presumably due to the fact that there is some secondary circulation there as well as near maximum distortion of the pressure distribution. The secondary circulation however is now in a direction which tends to help the recovery of a normal distribution and losses consequently drop more quickly than in the other cases. Also the stilling length appears to be slightly decreased.
For the 70' bend it appears that, as with the helical pipe, the calculated pressure losses arc least for long transition lengths; furthermore, the effect seems to be felt well upstream of the bend outlet (Fig.13). It is
difficult/
- 12 -
difficult to assess the accuracy of the present results but the inlet static pressures check ncll with the total pressure differences, and the other readings, besides being reasonably consistent among themselves, arc only used for comparative purposes. In the ligh t of this it would certainly seem that the recorded increase is significant.
The changes occurrin, p in these tests v:ith variable transition length are clearly extremely complex. The problem is csscntially a three- dimensional one, and the approximate theory outlined above cannot give information on pressure differences when its assumptions imply that these arc negligible. Szh assumptions are reasonable in the early stages of the bend, but can hardly be expected to apply at the bend outlet.
Some observations can be made from the expcrimcntal results, however. Firstly there is the existence of a region immediately upstream of the bend outlet in which there is an adverse prcssuro gradient. In every system this region extends over at least a quarter of the circunfcrence of the pipe wall but for the shortest transition lengths (zero and 1 diameter it appears to have spread to more than half. This adverse pressure gradient probably indicates a partial choking of the pipe just as if the flow had been scpnratcd from the wall. If choking is also associated with the d<velopmont of a pressure maximum on the inside of the bend the changes in the total pressure profiles at the bend outlet (Fig.16) also point to a vziation (with transition length) in the cxtcnt and position of the region of "separation".
It is noticeable that almost immediately after the bend wall static pressures become independent of 0, (though this does not mean that static pressures are necessarily constant over the whole cross-section). For long transition lengths it may be assumed that the exit pressure is uniform and atmospheric; a pressure variation may however exist at the outlet when 4 is small. Consider the displacement of the particle of highest total pressure at the cross-section z = cl/d for two systems
with transition lene;ths dl and C2 (di -c 82). h greater displacement
in the pipe with the shorter transition length suggests there may be a reduction in the value of the axial velocity when outlet conditions are imposed. The variation of transition length must then cause changes in the pressure distribution in the pipe, with even the possibility of altering the value of the "constant" B and with it the period of the secondar-J oscillation.
Then also there is the question of the rotation of the plane of symmetry. This may perhaps be connected with the consistently ion static pressure reading at 0 = 45', 1 diameter downstream from th,: bend outlet: if a region of "separation" exists, it is plausible to suppose that, due to imperfections in the pipe, the region will favour one side of the plane of symmetry rather than the other - (compare, for example, the separation from the walls of a diffuser).
These phenomena are clearly interconnected and are likely as well to depend on the secondary flow conditions attained at the bend outlet.
Conclusion __I_y___
In assessing pressure losses in a bent circular pipe bo-l;n bend outlet conditions and pipe outlet conditions are important as well as the inlet velocity profile. LOSS coefficients depend on some parameter which varies with the phase of the secondary circulation at the bend outlet, Also there is a contribution to the loss in the do;vnstrcam transition region of a given system not merely associated with the value of the secondary circulation at the bend outlet but also the displacement of the fluid particles there. Due in part, perhaps, to changes in displaccncnt but more particularly to choking effects in the pipe an increase in the loss coefficient is observed as the downstream transition length is shortened. For purposes of correlation therefore it would seem to be necessary to have transition lengths of 60 diameters or more.

Author(d --
Adler, M. 1934
Barua, S. N. 1955
Dean, W. R. 1927
Gray, S. 1945
Eichenberger, Ii. P. 1952
Hawthorne, W. R.
Hawthorne, W. R.
1951
1955
Horlock, J. H. 1955
Keenan, J. II.
Keulcgan, E. II. and Beij, K. H.
Percival, P, M. E. (ned Martin)
Squire, H. B.
‘194-Y Thermodynamics, Chapter XVII.
1937 Journal Rcs. Nat. Bur. Standards .s 89.
1955
1954.
White C, M, -1929
Notation -ill-s-
- 13 -
Zeitschr. f. angew Math, u Mech., Vol.14, p-257.
"Some nroblems of rotating fluids". Cambridge University Ph.D. Thesis D A.R.C.17,212.
"Flow through curved pipes". Phil. Mag. Vo1.7, p.208.
Power Jets Reports No.R.1104.
Shear flow in bends. MOI,T. Gas Turbine Lab. Report No.2, O,N,R. Contr. N5 ori 07848.
Proc. Roy. Sot. A 206 371~. --9
Aerofoil theory: Chapter Iii. Flow in curved ducts. Part I. Flov; in gradual bends. A.R.C.l7,807.
"Some experiments on the secondary flow in pipe bends". Proc. Roy. Sot. A, Vo1.234, p-335.
"Some problems in the rotational flow of fluids". Cambridge University Ph.D. Thesis,
Unpublished A.R.C, Report (16,601). "No-kc on secondary flow in a curved circular pipe".
"Streamline flow through curved pipes". Proc. Roy. Sot. A, Vo1.123, p.645.
A Constant, in equation of state.
B Constant associated with pu'riod of secondary oscillation,
d Pipe diameter.
E Energy.
Energy per unit mass.
Mean stagnation pressure over cross-section.
Stagnation prcs SUi'e.
Enthalpy.
Downstream transition length.
P/
- 14 -
P
F(z)
AP
r c
r
S
T
U
um U
V
V
X
Z
a
Zr
8
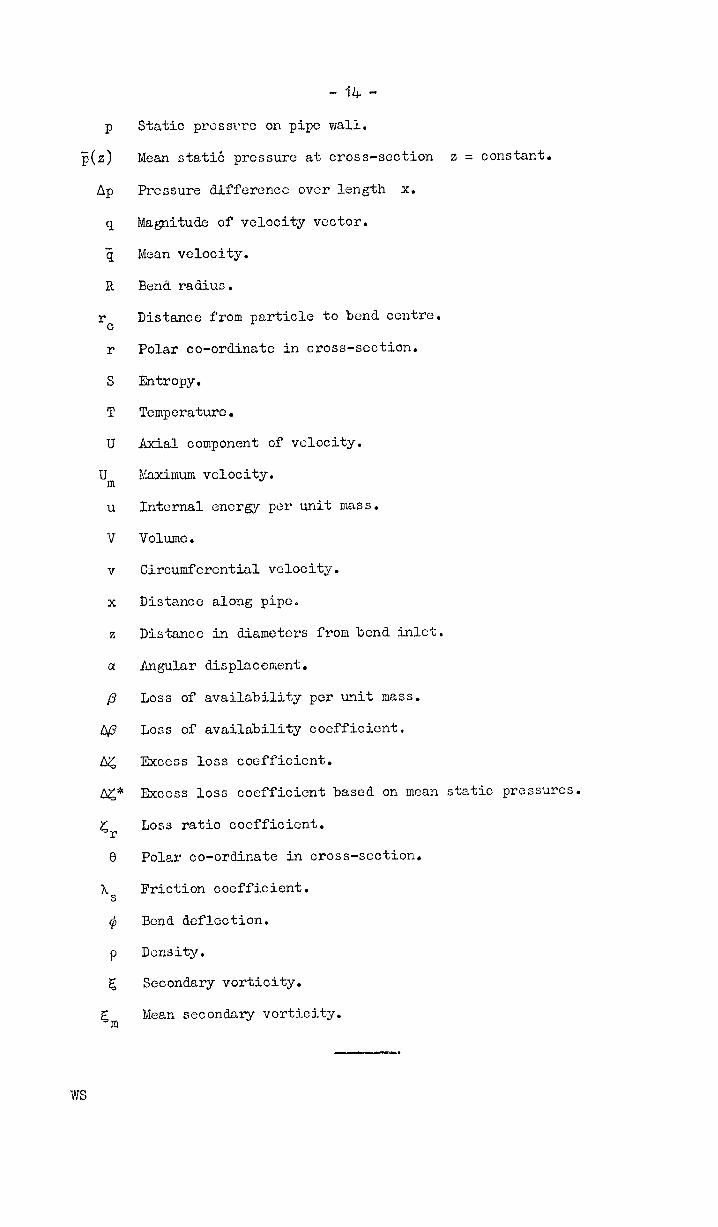
Static pressl~re on pipe wall.
Mean statii: pressure at cross-section z = constant.
Pressure dhfferencc over length x.
Magnitude of velocity vector.
Mean velocity.
Bend radius.
Distance from particle to bend centre.
Polar co-ordinate in cross-section.
Entropy.
Temperature.
Axial component of velocity.
Naximum velocity.
Internal energy per unit mass.
Volume.
Circumfcrcntial velocity.
Distance along pipe.
Distance in diameters from bend inlet.
Angular displscement.
Loss of availability per unit mass.
Loss of availability coefficient.
Excess loss coefficient.
Ekcess loss coefficient based on mean static pressures.
Loss ratio cocfficicnt.
Polar co-ordinate in cross-section.
Friction coefficient.
Bend deflection.
Density.
Secondary vorticity.
Mean secondary vorticity.

FIG, I. TOTAL HEAD PROFILES ACROSS t OF PIPE IN PLANE
OF BEND HELICAL PIPE
BEND DEFLECTION IN DEGREES
FIG.2. POSITION OF PARTICLES WITH HIGHEST TOTAL PRESSURE
FIG. 3 LINES OF CONSTANT TOTAL PRESSURE AT
PIPE OUTLET
3.0 -
7. I I I I I 0 90 I80 270 360
BEND DEFLECTION IN DEGREES
FIG. 4(a) STATIC PRESSURES ON OUTER WALL OF
HELICAL PIPE
- HELICAL PIPE ------- STRAIGHT PIPE
i-
I-
O 10 50 D,sT*Wc~°FRobl BE”:“o”TIET IrLrmAS
60
FIG. 4 (b) STATIC PRESSURES IN DOWNSTREAM TRANSITION
REGION

0 I
4, 0
v i,
7 9 0 0
2 v l?l313ljJ303 SC01 %33X3
0

NOMINAL PIPE DIAMETER 2’ 4 NOMINAL PIPE DIAMETER 2”
FIG. 6 (a) TOTAL HEAD PROFILES ACROSS t OF PIPE FIG.6(bl TOTAL HEAD PROFILES IN PLANE lr TO
IN PLANE OF BEND. 30° BEND PLANE OF BEND. 30’ BEND

60’ BEND
NOMINAL PIPE DIAMETER 2” 0’
FIG.7. TOTAL HEAD PROFILES ACROSS t OF PIPE IN PLANE OFBEND
70’ BEND e a A 5 5 x
NOMINAL PIPE DIAMETER 2* z
l
FIG. 8. TOTAL HEAD PROFILES ACROSS 8 OF PIPE IN PLANE OF BEND

HELICAL PIPE
60' BEND
I I I
0 20 40 60 80 too -DISTANCE ALONG AXIS OF PIPE FROM BEND INLET/ PIPE DIAMETER= t
FIG. 9. PRESSURE LOSSES IN DIFFERENT SYSTEMS

STATIC PRESSURE/ DYNAMIC HEAD
- PIPE (2). $ = 30
= 62
LINES OF CONSTANT TOTAL PRESSURE AT FIG. II (a).
PIPE OUTLET
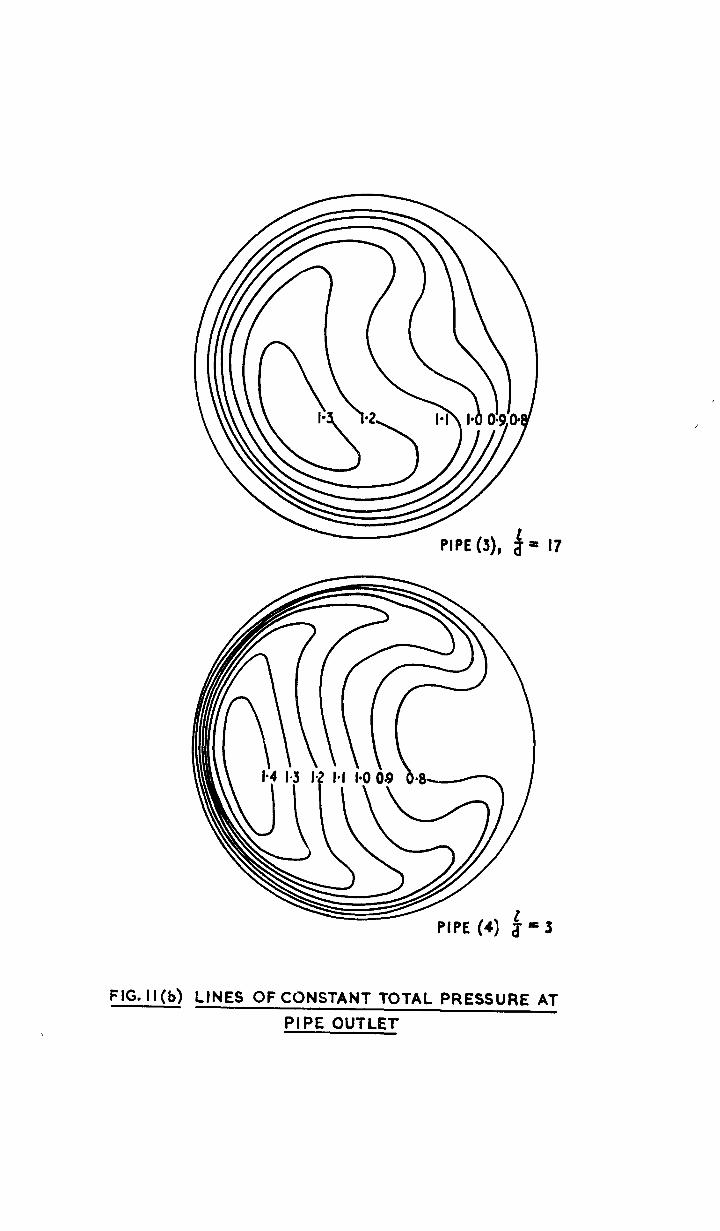
FIG. II(b) LINES OF CONSTANT TOTAL PRESSURE AT
PIPE OUTLET
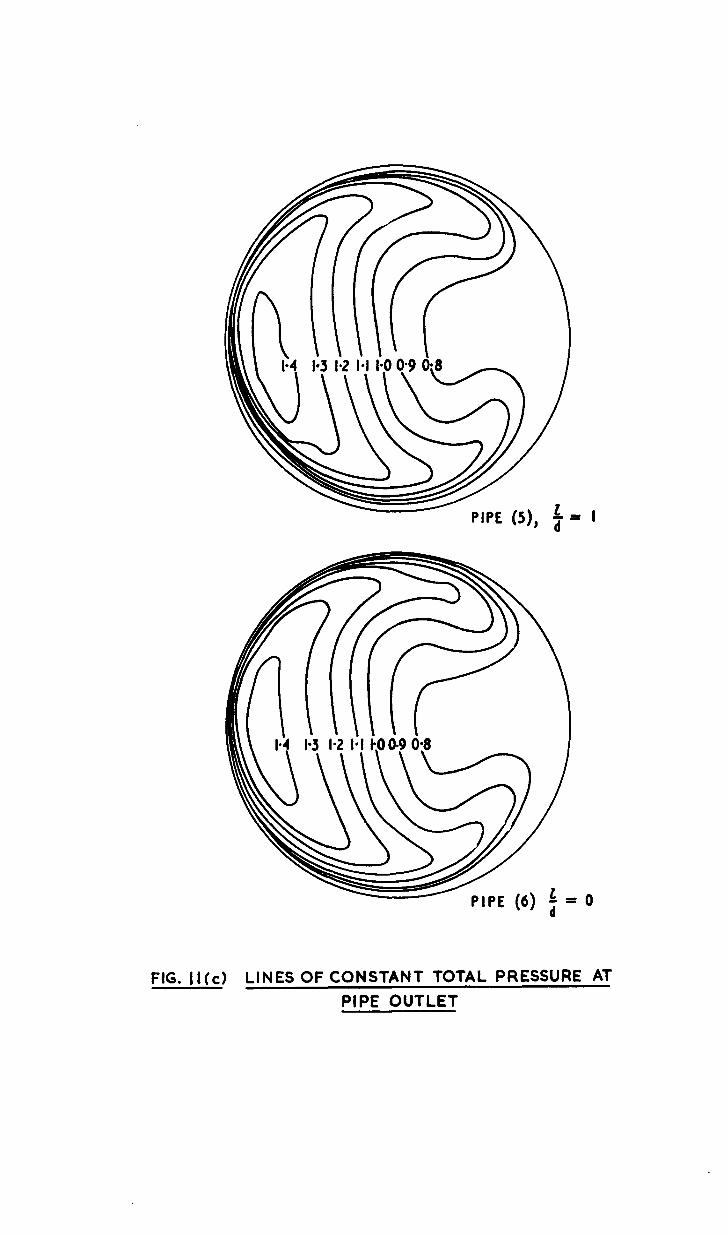
FIG. IJ(c) LINES OFCONSTANT TOTAL PRESSURE AT
PIPE OUTLET

x PIPE(I), ‘l2 = 62 0 PIPE(Z), z/2 = 30 + PIPE (3), 02 = I7 0 PIPE(4), z/2 = 3 b PIPE(5),V2 = I o PIPE(6),2/2 = 0
B.-w
FlG.l2(5) STATIC PRESSURES FOR CONSTANT 19,(6-O AND 1800)-
70’ BEND.
\
-\
K PIPE (i),'/d =62 0 PIPE(Z),~/d -30 + PIPE (3),1/d -I 7
PIPE (4), z/d = 3 : PlPE(5),t/d - I o PIPE@,f/d = 0
DISTANCE A ,LON?%XlS OF PIPE FROM BEND INLET/ PIPE DIAHFT-
FlG&?(b)STATIC PRESSURES FOR CONSTANT 6 (8145’AND 31 So)- -- - 70° BEND.
\
x PIPE(l), ‘/d = 62 O PIPE(Z), t/d = 30
m + PIPE(S),z/d = I7 l PIPE(4),hd= 3
P b PIPE@)& d = I
\
o PIPE(6),t/d = 0
t*kp J Q
\
K ts i
DISTANCE ALONG AXIS OF PIPE FROM BEND INLET/PIPE DIAMETER.
FIG. l2(9 STATIC PRESSURES FOR CONSTANT~,(8=9O*AND 2700)-
7o” BEND.
K PIPE (1),2/d =62 o PIPE(Z),L/d =30 + PIPE(J),l/ d =I 7 0 PI PE(S),z/ d = 3 A PIPE (5hh d = I
\ 0 PIPE(6)h d - 0
\ \ CENTRE
DISTANCE ALONG AXIS OF PIPE FROM BEND INLET/ PIPE DIAMETER
FIG.l2(d)STATIC PRESSURES FOR CONSTANT 8 (6=13S”AND 22S”)- -- 7o” BEND
x PIPE ( I),‘/d = 62
o PIPE (Z&d = 50 t PIPE (3)t/d - I 7 A PIPE (5$/d = I
0 SCALE
AT 5 DIAMETERS UPSTREAM FROM BEND OUTLET AT I DIAMETER UPSTREAM FROM BEND OUTLET
FIG.13 COMPARISON OF WALL STATIC PRESSURE LOSSES PLOTTED AS A FUNCTION OF 0.
MEAN EXCESS LOSS COEFFICIENT A&* 0 0 0 0 0 . cs . .
0 ul z z &
cn u
I %
l +or
vvvv -m-w vvvv mmmm
0 HELICAL PIPE REYNOLDS NUMBER 9-4 x IO4
I r, Q CHANGE OF SCALC - - - - - -
x 70' BEND REYNOLDS NUMBER 8.6 x IO4
L- I I I I I - 0 IO 20 30 40 50 l/d
LENGTH OF DOWNSTREAM TRANSlTlON /PIPE DIAMETER
FIG. I5 VARIATION OF PRESSURE LOSSES WITH TRANSITION LENGTH (EVALUATED 3 DIAMETERS DOWNSTREAM OF BEND OUTLET.)
2*50
2*20
I *go
I l 60
I l 30
I-00
O-70
0 *4 0
0 PIPE WITH 2/d =58 0 PIPE WITH 2/d =58 x PlPEWlTHl/d t22 x PlPEWlTHl/d =22 . PIPE WlTHt/d -IO l PIPE WlTHt/d -IO
REYNOLDS NUMBER 9*4x10’ kdl REYNOLDS NUMBER 9-4~10’
f TOTAL PRESSURE PROFILES SDIAMETERS 0’20 P
TOTAL PRESSURE PROFILES AT BEND DOWNSTREAM OF BEND OUTLET(HELICAL PIPE) OUTLET (70’ BEND)
. FIG. (6 VARIATION OF TOTAL PRESSURE PROFILES WITH TRANSITION LENGTH.
0*5
+ PIPE (S),‘/d - I7 . PIPE(4),lId - 3 A PIPE(5~z/ d - I o PIPE (6),z/ d - 0
REYNOLDS NUMBER

C.P. No. 505 (19,502)
A.R.C. Technical Report
@ crown copyright 1960
Printed and published by HER MAJESTY’S STATIONERY OFFICE
To be purchased from York House, Kingsway, London w.c.2
423 Oxford Street, London w.1 13~ Castle Street, Edinburgh 2
109 St. Mary Street, Cardiff 39 King Street, Manchester 2
50 Fairfax Street, Bristol 1 2 Edmund Street, Birmingham 3
80 Chichester Street, Belfast 1 or through any bookseller
Printed in Enghmd
S.O. Code No. 23-9012-5
C.P. No. 505