Embed Size (px)
Citation preview

THE EFFECT OF CAPITAL STRUCTURE ON FINANCIAL PERFORMANCE OF
SMALL AND MEDIUM ENTERPRISES IN DAIRY SECTOR
IN KIAMBU COUNTY
BY
MAINA GEOFFREY KARANJA
D63/64364/2013
A RESEARCH PROJECT SUBMITTED IN PARTIAL FULFILMENT OF THE
REQUIREMENT OF THE DEGREE OF MASTER OF
SCIENCE IN FINANCE UNIVERSITY OF NAIROBI
OCTOBER, 2014

ii
DECLARATION
I declare that this research project is my original work and has not been submitted in any other
institution of higher learning.
MAINA GEOFFREY KARANJA
REG No: D63/64364/2013
Signature: ________________________ Date: _________________________
This research project has been presented for examination with my approval as the University
Supervisor
CYRUS IRAYA
Signature: ________________________ Date: _________________________

iii
ACKNOWLEDGEMENT
First and Foremost, I would like to express my sincere gratitude to my supervisor Cyrus Iraya for
giving me the required guidelines, support and assistance all the way till I was through with the
project. Without their constructive critiques and their recommendations, this thesis would not
have been the same.
I would also wish to thank my family for their moral support, encouragement and understanding
during those times when I was not available for them while working on this project.
Last but not the least special thanks go to management of University of Nairobi for availing
current books and reference materials throughout the period of study. I salute you all.

iv
DEDICATION
To my family
Your unconditional love, support and encouragement has been guaranteed throughout the entire
period of study.
My friends
Your emotional and moral support has been steadfast. May God bless you.

v
ABSTRACT
The purpose of this study was to establish the effect of capital structure on financial performance
of small and medium enterprises in dairy sector in Kiambu County. The SMEs in Kiambu have
undergone tremendous growth over the last four years. Despite the undeniable importance of
capital structure, its effect on financial performance is not always obvious since there are
reported cases of reverse causality between capital structure and financial performance.
The causal research design was used to carry out this study. The population of study was all the
71 dairy SMEs in Kiambu County as at 31st December 2013. Probability sampling techniques
was employed in this research to select a sample of 50 (70%). The study used secondary data
from the SMEs annual reports and newsletters. The study used multivariate regression and
correlation analysis for data analysis and results presented in tables. The independent variable
was capital structure (debt equity ratio; debt asset ratio and liquidity) while dependent variable
was dairy SMEs financial performance (ROA).The results indicate that Debt equity ratio was
significant at 5% level of significance (0.009). The estimate of coefficient value for Debt equity
ratio was -0.179; Debt asset ratio was significant at 5% level of significance (0.006) with
estimate of coefficient value of 0.195 whereas liquidity ratio was significant at 5% level of
significance (0.01) with coefficient value of 0.012 which indicates that the three factors are
predictors of financial performance of small and medium enterprises in dairy sector in Kiambu
County. The study recommended that the SMEs to use more of equity in financing its operations
and firms to ensure there is adequate current asset for them to remain liquid at all times.

vi
TABLE OF CONTENT
DECLARATION........................................................................................................................... ii
ACKNOWLEDGEMENT ........................................................................................................... iii
DEDICATION.............................................................................................................................. iv
ABSTRACT ................................................................................................................................... v
TABLE OF CONTENT ............................................................................................................... vi
LIST OF TABLES ..................................................................................................................... viii
LIST OF ABBREVIATION........................................................................................................ ix
CHAPTER ONE ........................................................................................................................... 1
INTRODUCTION......................................................................................................................... 1
1.1 Background of the Study ....................................................................................................... 1
1.1.1 Capital Structure ............................................................................................................. 1
1.1.2 Financial Performance .................................................................................................... 4
1.1.3 Capital Structure and Performance ................................................................................. 4
1.1.4 SMEs in Dairy Sector in Kiambu County ...................................................................... 5
1.2 Research Problem .................................................................................................................. 7
1.3 Research Objective ................................................................................................................ 8
1.4 Value of the Study ................................................................................................................. 8
CHAPTER TWO ........................................................................................................................ 10
LITERATURE REVIEW .......................................................................................................... 10
2.1 Introduction ......................................................................................................................... 10
2.2 Theoretical Review ............................................................................................................. 10
2.2.1 Pecking Order Theory .................................................................................................. 10
2.2.2 Trade-Off Theory ......................................................................................................... 11
2.2.3 Agency Theory ............................................................................................................. 12
2.3 Determinant of Financial Performance in SMEs ................................................................ 13
2.3.1 Leverage ....................................................................................................................... 13
2.3.2 Liquidity ....................................................................................................................... 14

vii
2.3.3 Cash Flow ..................................................................................................................... 15
2.4 Empirical Review ................................................................................................................ 16
2.5 Summary of Literature Review ........................................................................................... 21
CHAPTER THREE .................................................................................................................... 23
RESEARCH METHODOLOGY .............................................................................................. 23
3.1 Introduction ......................................................................................................................... 23
3.2 Research Design .................................................................................................................. 23
3.3 Population of the Study ....................................................................................................... 24
3.4 Sample and Sampling Design ............................................................................................. 24
3.5 Data Collection .................................................................................................................... 25
3.6 Data Analysis ...................................................................................................................... 25
CHAPTER FOUR ....................................................................................................................... 28
DATA ANALYSIS, RESULTS AND DISCUSSIONS ............................................................ 28
4.1 Introductions........................................................................................................................ 28
4.2 Descriptive Analysis ........................................................................................................... 28
4.3 Correlation Analysis ............................................................................................................ 29
4.4 Regression ........................................................................................................................... 30
4.5 Discussions of Findings ...................................................................................................... 33
CHAPTER FIVE ........................................................................................................................ 35
SUMMARY, CONCLUSION AND RECOMMENDATIONS .............................................. 35
5.1 Introduction ......................................................................................................................... 35
5.2 Summary of Findings .......................................................................................................... 35
5.3 Conclusion and Recommendations ..................................................................................... 36
5.4 Suggestions for Further Research ....................................................................................... 39
5.5 Limitations of the Study ...................................................................................................... 40
REFERENCES ............................................................................................................................ 42
APPENDICES ............................................................................................................................. 49
Appendix I: Data Collection Form ............................................................................................ 49
Appendix II: Data Summary ..................................................................................................... 50
Appendix III: List of SMEs in Kiambu County ........................................................................ 52

viii
LIST OF TABLES
Table 3.1: Calculation of capital structure and financial performance ratio ................................ 26
Table 4.1: Response rate .............................................................................................................. 28
Table 4.2: Mean of Ratios ............................................................................................................ 29
Table 4.3: Correlations ................................................................................................................. 30
Table 4.4: Regression Model Summary ....................................................................................... 31
Table 4.5: Analysis of Variances ................................................................................................. 31
Table 4.6: Regression Coefficient ................................................................................................ 33

ix
LIST OF ABBREVIATION
EBIT Earnings before interest and tax
EPS Earning per share
IFC International Finance Corporation
IO Institutional Investors
PIO Public initial offer
ROA Return on Asset
SMES Small and Medium Enterprises
1
CHAPTER ONE
INTRODUCTION
1.1 Background of the Study
Firms hire agents to manage their business professionally. However, this agency can be costly
when the manager expands the firm through acquisition that reduces its share price, pursues his
own interest, or he attempts to maximize shareholder value but he is unlucky. In effect, the
agency costs of outside ownership equal the lost value from professional managers maximizing
their own utility, rather than the value of the firm as noted by Williams (2007); Harris and Raviv
(2000).
Theories suggest that the choice of capital structure may help mitigate this agency cost. Under
the agency costs hypothesis, a high leverage or a low equity/asset ratio reduces agency costs of
outside equity and increases firm value by constraining or encouraging managers to act more in
the interests of shareholders (Grossman and Hart, 2002).
1.1.1 Capital Structure
The capital structure of a firm refers to a mix of debt and equity which a firm deems as
appropriate to enhance its operations (Friend, 2008). Capital structure is therefore composition of
long-term liabilities, specific short-term liabilities like bank notes, common equity, and preferred
equity which make up the funds with which a business firm finances its operations and its
growth. The capital structure of a business firm is essentially the right side of its balance sheet.
Capital structure, broadly, is composed of the firm's debt and equity. There are considerations by
management and the stakeholders over what mix of debt and equity to use with the following
questions arising: should more debt financing be used in order to earn a higher return? Should
more equity financing be used to avoid the risk of debt and bankruptcy?

2
Capital structure is deemed to have an impact on a firm performance against the position held by
Modigliani and Miller in their seminal work of 2008. Modigliani and Miller (2008) argue on the
basis of the following assumptions; existence of perfect capital market; homogenous
expectations; absence of taxes; and no transaction cost, that, capital structure is irrelevant to the
value of a firm. This position has been supported by Hamada (2009), and Stiglitz
(2004).Consequently, studies by Jensen and Meckling (2006) and Jensen (2006) have debunked
the assertion made by Modigliani and Miller. Theories on capital structure point out that high
leverage or low equity/asset ratio reduces agency cost of outside equity and thus increases firm
value by compelling managers to act more in the interest of shareholders (Berger and Bonaccorsi
di Patti, 2006). Debt and equity are the two major classes of liabilities, with debt holders and
equity holders representing the two types of investors in the firm. Each of these is associated
with different levels of risk, benefits, and control. While debt holders exert lower control, they
earn a fixed rate of return and are protected by contractual obligations with respect to their
investment. Equity holders are the residual claimants, bearing most of the risk, and,
correspondingly, have greater control over decisions (Amit and Schoemaker, 2003).
Capital structure is one of the most important decisions made by financial managers. The mix
can have an effect on the overall cost of capital of a business and hence its value. The firms‟
managers have a responsibility to the firms and to the shareholders, that is; to minimize cost and
maximize the shareholder‟s wealth. Capital structure is an effective tool used to minimize the
cost of capital. Institutional investors have considerable experience in collecting and interpreting
information on firms‟ performance. Agency theory suggests that an optimal capital structure and
ownership structure can minimize agency costs (Jensen and Meckling, 2006; Jensen, 2006).
Thus, a relationship between capital structure and ownership structure is expected to be found in

3
the relevant data. Empirical studies in this field find mixed results. Chaganti and Damanpour
(2001), Grier and Zychowicz (2004),Bathala et al. (2004) and Crutchley and Jensen (2006) find a
negative relationship between institutional ownership and leverage. On the other hand, Leland
and Pyle (2007), Berger et al. (2007) and Chen and Steiner (2009) show that managerial
ownership and leverage are positively related. In addition, Tong and Ning (2004) claim that
firms with high leverage ratios provide a negative signal that the firm faces a future of financial
difficulties. Therefore, institutional investors prefer firms with low leverage ratios.
The capital structure variable used is the leverage measure: total debt divided by total assets
(LEV). Two variables are used to capture the ownership structure: the first is the natural
logarithm of the number of shares owned by Institutional Investors (IO), and the second is the
percentage of institutional ownership from the subscribed shares (PIO) (Tong and Ning, 2004).
These indices are therefore an absolute (size) measure and a proportion measure, respectively.
Leverage results from the use of fixed-cost assets or funds to magnify returns to the firm‟s
owners. Generally, increases in leverage result in increased return and risk, whereas decreases in
leverage result in decreased return and risk.
The amount of leverage in the firm‟s capital structure the mix of long-term debt and equity
maintained by the firm can significantly affect its value by affecting return and risk. Unlike some
causes of risk, management has almost complete control over the risk introduced through the use
of leverage. Because of its effect on value, the financial manager must understand how to
measure and evaluate leverage, particularly when making capital structure decisions. The three
basic types of leverage can best be defined with reference to the firm‟s income statement
Operating leverage is concerned with the relationship between the firm‟s sales revenue and its

4
earnings before interest and taxes, or EBIT. (EBIT is a descriptive label for operating
profits.)Financial leverage is concerned with the relationship between the firm‟s EBIT and its
common stock earnings per share (EPS).Total leverage is concerned with the relationship
between the firm‟s sales revenue and EPS(Amit and Schoemaker, 2003).
1.1.2 Financial Performance
Financial performance is a subjective measure of how well a firm can use its current assets from
its primary mode of business and operations and generate revenues for the business (Baxter,
2007). Financial performance is an indication of the financial health over a given period of time
for a firm, and can be used to compare similar firms across the same industry or to compare
industries or sectors in aggregation to en able a business make decision on how it can improve on
the prevailing situation or sustain a desirable position (Berger, Oliver & Pua, 2007).
There are many different ways to measure financial performance, but all measures should be
taken in aggregation. Line items such as revenue from operations, operating income or cash flow
from operations can be used, as well as total unit sales. Furthermore, the analyst or investor may
wish to look deeper into financial statements and seek out margin growth rates or any declining
debt (Brush, Bromiley & Hendrickx, 2000).
1.1.3 Capital Structure and Performance
Capital structure and its influence on the firm financial performance and overall value has been
remained an issue of great attention amongst financial scholars since the decisive research of
(Modigliani & Miller, 1958) arguing that under perfect market setting capital structure doesn‟t
influence in valuing the firm. This proposition explains that value of firm is measured by real
assets not, the mode they are financed.

5
Eldomiaty and Azim (2008) argue that there is a positive relationship between capital structure
and financial performance. (Hadlock and James (2002) also support the argument. Fama and
French (2008) reported that there is a negative relationship. Capital structure is said to be closely
link to the financial performance (Zeitun and Tian, 2007). Jensen and Meckling (2006) posited
that high leverage may initiate clashes between managers and shareholders due to selection of
investment either equity, debt or hybrid (Myers, 2007).The risk they want to take (Jensen and
Meckling, 2006, Williams, 2007), circumstances due to which firm might be liquidated (Harris
and Raviv, 2010), and the dividend policy (Stulz, 2010). Verifiable predictions of such type of
models is that the raise in leverage should decline agency costs of ownership and debt holders
thus improving business performance, everything else remained the same as before. However,
when the leverage is relatively high to a certain limit, leads to an increase in debt and it will
increase cost of debt, including an increase cost of bankruptcy or financial distress due to
conflicts between equity holders and bondholders. To make distinction between these two
sources of agency costs empirically is very difficult.
1.1.4 SMEs in Dairy Sector in Kiambu County
Commercial dairying was introduced into Kenya in the early twentieth century, but indigenous
Kenyans were not involved in it until the mid-1950s. After independence, most dairy cattle were
transferred to the indigenous people, marking the beginning of smallholder domination of the
dairy industry. Dairy‟s main role in Kenya‟s economy is its contribution to the livelihoods of the
many people engaged throughout the value chain and to the nutritional well-being of many rural
communities (Muriuki, 2011). There are many players in the dairy sector: those offering services
and inputs; industry facilitators and development partners; and the users of services/inputs.
Smallholder dairy farmers who are more than 1 million smallholders dominate the industry at the

6
production level (GOK, 2005). Data from the ministry of livestock development (2010) provides
that dairy cattle contribute 70 percent of total milk production and almost all marketed
production. The dairy herd grew by a very modest 9 percent over the nine years from 1998 to
2007, at an annual rate of only 0.96 percent. The average national dairy cattle herd is composed
of 50 percent cows, 10 percent heifers of over one year, 11 percent heifers of less than one year,
17 percent bulls and bull calves, and 12 percent steers. Camels and local (meat) goats, and to a
very small extent sheep, are important in the ASALs. Camels are particularly important in North
Eastern Kenya and bordering areas, where a large community of Somali and related ethnicity are
more familiar with camel milk.
The precarious employment situation in Kenya has given rise to public policies that aim at giving
small and medium-sized enterprises (SMEs) in dairy sector a better access to finance. Dairy
SMEs face difficulties in raising this much-needed finance due to information asymmetry and
other inefficiencies in loan markets. Inevitably, this has a serious impact on their capital
structure.
Access to finance tops the list of constraints faced by dairy SMEs everywhere. Because of the
high transaction costs and inability of dairy SMEs to provide collateral banks require, dairy
SMEs find themselves starved for funds at all stages of their development ranging from start-up
to expansion and growth (Beyene,2002). In Kenya, it is leasing that has bridged the current
financing gap experienced by SMEs by providing commercial and industrial equipment as it
focuses on the lessee‟s ability to generate cash flow from the business operations to service the
lease repayments rather than on the balance sheet or past credit history (Kisaame,
2007;International Finance Corporation(IFC), 2007). The terms of a given lease contract

7
constitute a lease structure and these include: length of the lease term, operating costs, lease
rentals, reviews and incentives.
1.2 Research Problem
Capital structure is an important factor by which a business can increase its performance at its
optimum level if the SME uses it in an effective and efficient way. Capital structure is related to
the ability of the business to meet the needs of its stakeholders (Boodhoo, 2009). The past one
decade or so has witnessed significant transformations in capital structures of businesses
(Gomez, 2005).
Dairy SMEs are important to almost all economies in the world, especially to those in developing
countries with major employment and income distribution challenges (Omore et al, 2012).
According to Elimuti and Kathawala (2009) dairy SMEs contribute to output and to the creation
of “decent” jobs; on the dynamic front they are a nursery for the larger firms of the future, are the
next (and important) step up for expanding micro enterprises, they contribute directly and often
significantly to aggregate savings and investment, and they are involved in the development of
appropriate technology. Dairy SMEs are a vital part of the economies and a large percentage of
these SMEs failures are attributed to inadequate or inappropriate capital structure.
The studies do not provided information on the relationship between capital structures and
performance of SMEs in developing countries. The unresolved question is whether the various
theories and studies are useful in understanding the relationship between capital structure and
performance of SMEs in the developing countries and in this case, on Kenyan dairy sector.
In Africa, there are a few studies on the relationship between capital structure and SMEs
performance. While Abor (2005) looked at the effect of capital structure on profitability of listed

8
firms in Nigeria, Kamau (2013) carried out a study to investigate the relationship between capital
structure and financial performance of errand service SMEs in Nairobi County. Boateng (2004)
looked at the determinants of capital structure in international joint ventures. However, none of
these studies have looked at the relationship between capital structure and performance of SMES
and especially on dairy sector which sometimes are affected adversely by the financial crises as
well as macro-economic factors. This constitutes knowledge gap in the dairy sector that this
study sought to address. This provided the rationale for this proposed study which sought to
answer the following question: What is the relationship between capital structure and the
financial performance of SMEs in dairy sector in Kiambu County?
1.3 Research Objective
To establish the effect of capital structure on financial performance of dairy SMEs in Kiambu
County
1.4 Value of the Study
The study is of significance to the following groups specifically Board of directors, Stakeholders
and investors and finally to a theoretical critique. It benefits the Board of Directors of dairy
SMEs in evaluating the way their organizations are governed and in identifying areas where
corrective action may be necessary. This study is important in critiquing the various theories on
financial performance by supporting or showing whether they don‟t hold
The corporations knows that transparent disclosure of its organizational and management
structure as well as other aspects of its corporate governance helps stakeholders to assess the
quality of the management and assists investors in their investment decisions. On the other hand,

9
investors can now understand and demand solid principles of good corporate governance as key
to maintenance of their trust.

10
CHAPTER TWO
LITERATURE REVIEW
2.1 Introduction
This chapter discusses the theoretical review, empirical review, conceptualization and the
research gaps. The theoretical review discusses the theories related to the study while the
empirical review looks at literature derived from various research works by other researchers.
Lastly, this chapter offer a summary in regard to this sections discussed.
2.2 Theoretical Review
The three major competing theories; the pecking-order, trade-off, and agency theories have
emerged as best explanations for the determinants of capital structure decision. However, several
studies have shown that only the pecking-order and trade-off theories are more relevant for
privately held firms that do not issue publicly traded securities. Therefore this study will also
focus on investigating whether the pecking-order or the trade-off theories better explains the
capital structure of dairy SMEs.
2.2.1 Pecking Order Theory
The pecking-order theory by Myers and Majluf (2000) relies upon the concept of asymmetric
information between insiders (managers) and outsiders (investors), which guides managers in
their preference for raising funds. According to this theory, firms prefer funding from sources
with the lowest degrees of asymmetric information because the cost of borrowing rises with this
metric. The Pecking order theory (also referred to as the information asymmetry theory), states
that firms prefer to finance new investment, first internally generated finances, i.e. retained
earnings, then with debt, and finally with an issue of new equity. Myers argues that an optimal

11
capital structure is difficult to define as equity appears at the top and the bottom of the „pecking
order‟. A firm that has access to market financing information would mean therefore that it is in
a better position to finance its capital expenditure at a low cost and conveniently therefore
acquiring desirable capital structure.
2.2.2 Trade-Off Theory
In the trade-off theory firms weigh the costs of borrowing against the benefits of debt financing.
The cost of borrowing includes interest payments and bankruptcy cost. The benefit of debt
financing includes the tax deductibility of interest payments and the discipline instilled on the
management. The trade-off theory says that the value of the firm is equal to the value of
unlevered firm plus the value of side effects, which include the tax shield and the expected costs
due to financial distress (Brigham & Ehrhardt, 2005). When a firm has zero or low levels of debt
financing, the possibility of bankruptcy is low and immaterial. Baxter (2007) argued that the
extensive use of debt increases the chances of bankruptcy of which creditors demand extra risk
premium. He suggested that firms should not use debt beyond the point where the cost of debt
becomes larger than the tax advantage. As debt financing increases, the expected bankruptcy-
related costs increases and reduces the tax benefits of the debt.
According to the trade-off theory the optimal capital structure is the point where the marginal tax
shelter benefit is equal to marginal bankruptcy-related costs. Therefore, firms would prefer debt
over equity up to the point where the probability of financial distress and where bankruptcy costs
starts to be important. Bas, Muradoglu and Phylaktis (2009) suggested that this theory could be
applicable for large firms which are more likely able to generate high profits. But for small firms,
because they are less likely to have high profits, they may not have an option to choose debt
financing for the tax shields advantage (Pettit & Singer, 2005).

12
2.2.3 Agency Theory
Agency theory focuses on the behavioral relationship between the owners (principals) and those
others (agents) who are engaged by the owners to perform tasks on behalf of the principal.
Managers may resist high level of leverage if they feel that it places their jobs and income at risk.
On the other hand shareholders, who can diversify away any company specific risks, prefer
riskier projects. Neilson, (2004) suggests that management might pass up positive net present
value projects when these benefits accrue primarily to bondholders. Other agency conflicts
between bondholders and shareholders include asset substitution and claim dilution (Smith and
Warner, 2009).
Financing and corporate policy decisions can offer incentive to the various claimants that will
minimize value-reducing behavior and hence reduce agency costs. In particular, the selection of
management ownership, leverage, and dividends can mitigate agency costs arising from the
firm's "nexus of contracts" Crutchley and Hansen, (2009). Jensen and Meckling (2006) suggested
that management can increase its share of ownership in the firm and align its interests with those
of shareholders, resulting in a "convergence of interests" between shareholders and managers.
This "convergence of interests" between shareholders and management reduces the agency costs
because managers are motivated to follow value-maximizing behavior. However, by increasing
their equity share in the firm, management reduces the diversification of their personal portfolio.
Alternatively, a firm can reduce the agency costs by increasing its reliance on debt financing.
This reduces the need for equity financing, and therefore, avoids the associated agency costs.
However, a corporation's ability to increasingly rely on debt financing is limited due to higher
agency costs of debt resulting from the chance of the firm falling into financial distress. In
addition to financial distress costs, claims of new debt holders are likely to dilute the claim of

13
existing shareholders, and therefore require higher rates of return that are reflected in the firm's
higher cost of capital.
2.3 Determinant of Financial Performance in SMEs
Leverage, liquidity, and cash flow measures deal with the financial structure of an organization
and the ability of the organization to pay its liabilities in a timely fashion. Each of the three
categories of measures relate to a separate component of this aspect of company performance.
Leverage measures describe the financial structure of the organization and include such measures
as debt to equity, debt to total assets, and times interest earned. Liquidity measures describe the
ability of the organization to convert assets into cash and include such measures as current ratio,
quick ratio, and the interval measure. Finally, cash flow measures describe the amount of cash an
organization generated and the sources of that cash, relative to organization‟s demands for cash
and include such measures as cash flow to equity and cash flow to assets.
2.3.1 Leverage
Leverage measures deal with the financial structure of the organization. Financial leverage can
be defined as the degree to which operating assets are financed with debt versus equity (Penman,
2001). Debt obligations generally require mandatory calls on the firm‟s cash through the
payment of interest and repayment of principal on a periodic basis. Common equity, on the other
hand, does not have a mandatory call on cash either for period returns to capital providers or for
retirement of equity holders‟ capital investment in the firm. Thus, debt holders receive a fixed
payment while equity holders receive the residual after all other claimants have been satisfied.
Accordingly, if a firm is able to earn profits in excess of the cost of borrowed capital, the spread
of those profits in excess of the cost of the borrowed capital become additional profits for the

14
equity holders. If a firm is unable to earn profits in excess of the cost of its borrowed capital, the
equity holders take a loss to the extent of that spread while the debt holders continue to earn a
return. The greater the ratio of capital provided by debt to the capital provided by equity, the
higher the potential gains and losses for equity holders. This relationship is often referred to as
the risk-reward tradeoff. The greater a firm‟s leverage, the greater the bankruptcy risk in poor
times, and conversely, the greater the profits in good times, for equity capital providers.
Brush, Bromiley, & Hendrickx (2009), found that the strategic choices available to managers
may be limited in highly leveraged firms because of the inability to raise additional debt capital
or by being forced to use more costly equity capital. As a consequence, leverage may be used as
a control variable in strategic management studies (Hoskisson, Hitt, Johnson & Moesel, 2003).
2.3.2 Liquidity
Liquidity refers to the ability of a firm to meet its financial obligations in a timely manner. In
essence, the assets owned by a company are liquid if they can quickly and cheaply be converted
to cash (Brealey, et al., 2001). The critical performance issue relative to liquidity is whether the
organization has or is developing enough readily accessible capital to continue to operate.
Accordingly, liquidity measures represent one aspect of a dimension of overall organizational
performance, but are not sufficient measures by themselves to represent the entire construct.
Liquidity can be measured in both absolute and percentage terms. An example of an absolute
measure of organizational liquidity is working capital, or the excess of current assets over current
liabilities. Another absolute measure of liquidity is the interval measure, which represents the
length of time the organization can continue to operate using its liquid assets, without making
15
any further sales. Examples of percentage measures of liquidity include change in working
capital, current ratio, and quick ratio.
One critical weakness of liquidity measures calculated from financial statements is that they do
not include the organization‟s ready access to capital through existing lines of credit and other
revolving debt agreements. Since loans usually have a higher cost of capital than can be earned
on short term investments, prudent business practice would be to use all surplus cash to reduce
short-term interest bearing liabilities, so long as the capital can be quickly replaced under
existing borrowing arrangements. The access to capital under existing borrowing agreements
provides an organization with extra liquidity that is not reported in the organization‟s financial
statements, thereby underreporting the actual liquidity of the organization.
2.3.3 Cash Flow
Cash flow is not only critical for meeting current obligations but is also a measure of the firm‟s
ability to actually pay a return to resource providers. Ultimately, the availability of cash payouts
to resource providers determines the financial benefit, or value, that they realize from an
organization. Typical business valuation methods are based upon projected available cash flows
and the timing of the cash payouts to investors (Copeland, et al., 2000; West and Jones, 2009).
Cash flow is the numerator used in determining the current value of an organization.
Accordingly, it is appropriate to measure cash flow available to investors as a component of
organizational performance. The pertinent issue for researchers is over what time should cash
flow be measured, since the sources and uses of cash can vary significantly year-to-year based
upon growth rates and investment opportunities.

16
Brealey (2001) posited that some of the cash flow measures include net cash flow from
operations, cash flow as a percentage of capital stock (cash flow return on equity), operating cash
flows as a percentage of total assets (cash flow return on assets), and the growth rate of operating
cash flows. Each of these measures deals with the cash available to the organization to meet its
calls on capital for investment and financing activities.
2.4 Empirical Review
Bhaduri (2002) carried out a case study on European poultry states where he explored the impact
of business risk on capital structure he found that business risk is a key factor that can affect the
capital structure of the firm. His study concluded that since debt involves a commitment of
periodic payment, highly leveraged firms are prone to financial distress costs. Therefore, firms
with volatile incomes are likely to be less leveraged. Thus there is a negative relationship
between business risk and capital structure. Institutional investors tend to invest in firms with
low business risks because firms with high volatility in their returns are likely to have a high
probability to default and to become bankrupt. Therefore, a negative relationship is expected
between firm‟s business risk and the firm‟s institutional ownership.
Myers and Majluf (2004) carried out a study on the impact of asymmetric information on firm‟s
choice for source of funds the study was a descriptive one where 342 agribusiness firms in
Canada were sampled, the study found that in the presence of asymmetric information, a firm
would prefer internal finance over other sources of funds, but would issue debt if internal finance
was exhausted, the least attractive alternative for the firm would be to issue new equity,
profitable firms are likely to have more retained earnings. Donaldson, (2001) carried out a study
on the relationship between leverage and past profitability in Canadian consultancy firms where

17
a sample of 235 firms was used. The study revealed that a negative relationship is expected
between leverage and past profitability. The study therefore concluded that that investors will
prefer to invest in profitable firms. This is because the more profitable the firm is, the lower the
likelihood of default and of having to face financial difficulties and bankruptcy. Therefore, a
positive relationship is expected between profitability and institutional ownership.
Hovakimian et al. (2004) carried out a study to investigate the effect of growth potential of dairy
firms to investors in UK where 312 firms were involved, using exploratory research design he
found that high growth dairy firms bring more capital gains to institutional investors than lower
growth ones, agency problems are likely to be more severe for growing firms, because they are
more flexible in their choice of future investments. Thus, the expected growth rate should be
negatively related to long-term leverage. Moreover, firms with high-growth opportunities
provide a positive signal about the firm‟s future performance. Hence institutional investors prefer
to invest in high-growth firms rather than lower ones. He concluded that this is because
institutional investors, as taxpayers, would prefer to invest in capital-gain stocks to delay tax
payments and to avoid double taxation. Thus, a firm‟s growth opportunities are considered to be
a positive signal for institutional investors.
Rajan and Zingales (2005) in their study of firms in G-7 countries to determine whether size of a
business is a factor in determining capital structure where 21 businesses in each category for
small and big were used as the sample of the study to compare the results from the two groups
observed that large firms tend to be more diversified and, therefore, have lower probability of
default. Rajan and Zingales‟ argument is consistent with the predictions of the trade-off theory
which suggests that large firms should borrow more because these firms are more diversified,

18
less prone to bankruptcy, and have relatively lower bankruptcy costs. Furthermore, large firms
also have lower agency costs of debt, for example, relatively lower monitoring costs because of
less volatile cash flow and easy access to capital markets. These findings concluded that there is
a positive relationship between the firm size and leverage. On the other hand, the pecking order
theory suggests a negative relationship between firm size and the debt ratio, because the issue of
information asymmetry is less severe for large firms. Owing to this, large firms should borrow
less due to their ability to issue informational sensitive securities like equity. Empirical findings
on this issue are still mixed. Wald (2009) has shown a significant positive relationship between
size and leverage for firms in the USA, the UK, and Japan and an insignificant negative
relationship for firms in Germany and a positive relationship for firms in France. Chen (2004)
has shown a significant negative relationship between size and long-term leverage for firms in
China.
John and Williams (2005) and Miller and Rock (2005) carried out a study to assess the role of
corporate reputation in entering equity market by service industries where explorative was
employed with 231 questionnaires and a response rate of 45% the study found that a firms with a
reputation for paying a constant stream of dividends face less asymmetric information when
entering the equity market. Thus, if dividend payments represent a signal of sound financial
health and hence of higher debt-issuing capacity, one would expect a positive relationship
between dividend payments and leverage. In addition, firms with a reputation for paying a stream
of dividends will be monitored by the capital market. Institutional ownership may act as
alternative monitoring device, and so this will reduce the need for capital markets as external
monitoring system. The study concluded that there is a positive relationship between dividend

19
payments and institutional ownership. However, the existence of institutional ownership
mitigates the need for dividends to signal good performance.
Myers and Rajan (2008) carried out an exploratory research to assess the impact of agency cost
on liquidity in German banking sector. The study revealed that there is a negative relationship
when agency costs are high outside creditors limit the amount of debt financing available to the
company. Thus, a negative relationship between debt and liquidity would be expected. Similarly,
the effect of asset liquidity is an ambiguous signal to institutional investors. A high liquidity ratio
may be considered to be a negative signal because it indicates that the firm faces problems
regarding opportunities for its long-term investment decisions. Hence a high liquidity ratio may
be considered to be a negative signal for institutional investors. However, a high liquidity ratio
may be considered to be a positive signal from the firm, because it indicates that the firm can
easily pay its obligations and hence faces lower risk of default. Thus, high liquidity would be a
positive signal for institutional investors.
Ebaid (2009) carried out a study to investigate the impact of choice of capital structure on the
performance of firms in Egypt. Performance was measured using ROE, ROA, and gross profit
margin. Capital structure was measured by short-term debt to asset ratio, long-term debt to asset
ratio, and total debt to total assets. Multiple regression analysis was applied to estimate the
relationship between the leverage level and performance. The study indicated that capital
structure has little to no impact on a firm‟s performance. These results are inconsistent with other
empirical studies such as Hadlock and James (2002) and Ghosh et al. (2000), which revealed a
positive relationship between financial leverage and choice of capital structure. Other studies
revealed a negative relationship such as Berger and Bonaccorsi di Patti (2006), Gleason et al.
(2000) and Simerly and Li (2000) whereby lower equity capital ratio is associated with higher

20
firm performance. The contradicting results give room for introducing additional variables in
new studies.
In a study to examine the impact of capital structure on the performance of pharceutical
industries in Kenya, Adekunle (2009) used debt ratio to proxy capital structure while return on
asset and return on equity were used as measures of firms‟ performance. The study used the
Ordinary Least Squares method of estimation. The result of the study indicated that debt ratio has
a significant negative impact on the firm‟s financial measures of performance. The study,
however, did not consider other financing decisions in the analysis, including the mediating
effect of internal cash flow available.
Kaumbuthu (2011) carried out a study to determine the relationship between capital structure and
return on equity for industrial and allied sectors in the Nairobi Securities Exchange during the
period 2004 to 2008. Capital structure was proxy by debt equity ratio while performance focused
on return on equity. The study applied regression analysis and found a negative relationship
between debt equity ratio and ROE. The study focused on only one sector of the companies
listed in Nairobi Securities Exchange and paid attention to only one aspect of financing
decisions. The results of the study, therefore, may not be generalized to the other sectors. The
present thesis covered all non-financial companies listed on the Nairobi Securities Exchange to
determine the effects of financing decisions on firm financial performance.
Saeedi and Mahmoodi (2011) examined the relationship between capital structure and
performance of listed firms in the Tehran Stock Exchange. According to the study market
measures of performance are positively related to capital structure and whereas ROA is
positively related to capital structure, no significant relationship exists between ROE and capital

21
structure. The findings by Saeedi and Mahmoodi (2011) indicate that financial leverage may
affect different measures of performance in different ways.
2.5 Summary of Literature Review
This chapter looked at the theoretical review and empirical review. In theoretical review, the
researcher looked at the theories which act as the foundation of the study. The study paid
emphasis on the trade-off theory, agency and pecking order since they best explain the capital
structure and ownership as determinants for firm performance. One of the major contribution
from the theories is that high leverage or low equity/asset ratio reduces agency cost of outside
equity and thus increases firm value by compelling managers to act more in the interest of
shareholders, (Berger and Bonaccorsi di Patti, 2006); this therefore means that capital structure is
deemed to have an impact on a firm performance.
The empirical review looked at determinants of capital structure; SMEs performance and capital
structure. From the study; the researcher can conclude there is empirical evidence of the
existence of relationship between capital structure and firm performance. Kaumbuthu (2011),
Saeedi and Mahmoodi (2011), Ebaid (2009) and Adekunle (2009) are among those who
recognize such a relationship between capital structure and financial performance exist.
There are many reports from the field of the capital structure about the importance of the
industry to a firm‟s financial structure: Berger, Oliver, and Pua (2007), Chen (2004). However,
most researchers routinely control for the industry or include dummy variables in order to test
how firm characteristics affect the firm‟s financial structure. However, this approach does not
tell us clearly how and why the industry affects the firm‟s financial structure variations across

22
firms within a given sector. This approach also does not show if there is any significant
relationship between capital structure and financial performance of small businesses.
With contribution of Modigliani and Miller in 1958, capital structure has attained an important
place in finance field. The path breaking contribution has stimulated subsequent researchers to
put emphasis on this topic. Therefore, other theories and researches have been revealed and
many aspects have been included to capital structure studies so far. However, it has always been
controversial topic and the consensus has not been reached yet. Nevertheless, there are many
important theories and hypotheses, which explain and investigate this topic very well such as
agency cost theory, trade-off theory and pecking order theory. When we reviewed the literature
and extended our understanding of these theories and hypotheses, we found that the relationship
between capital structure and firm performance is interesting aspect and worthwhile to research.
Therefore, we started an extensive literature review and found a research gap, which is the
relationship between capital structure and a firm's financial performance from the perspective of
capital structure empirical review in Kenya SMEs which in this case is the firms in dairy sector.

23
CHAPTER THREE
RESEARCH METHODOLOGY
3.1 Introduction
This chapter sets out various stages and phases that were followed in completing the study. It
involves a blueprint for the collection, measurement and analysis of data. In this stage, most
decisions about how research was executed and how respondents were approached, as well as
when, where and how the research was completed. Therefore in this section the research
identified the procedures and techniques that were used in the collection, processing and analysis
of data. Specifically the following subsections were included; research design, target population,
sampling design, data collection instruments, data collection procedures and finally data analysis.
3.2 Research Design
The causal research design was used to carry out this study. According to Cooper and Schindler
(2006), a causal study is designed to establish the influence of one variable(s) on another
variable(s) which depicts causation. Causal research is typically structured with a clearly stated
objective of discovering associations and causal relationships among different variables. This
design is perceived to be suited to this study in that it involves collection, verification, and
synthesis of evidence to establish facts that defend or refute a hypothesis. This design involved
use of secondary sources of data. Secondary data was derived from sources such as official
records, reports, archives, and financial statements.
The historical records can add important contextual background required to more fully
understand and interpret the research problem. This design is further useful in that there is
no possibility of researcher-subject interaction that could affect the findings. Historical sources

24
can also be used over and over to study different research problems or to replicate a previous
study (Cooper and Schindler, 2006).
3.3 Population of the Study
Kothari (2004) defines study population as the sum total of elements about which inferences are
to be made. Thus the group made up of all possible observations of a characteristic of interest is
the population, while a collection of observations presenting only a portion of that population is a
sample (Denscombe, 2008). According to Kenya dairy board (2014), there is an estimated 71
registered dairy SME‟s involved in dairy production in Kiambu county. Therefore the study
targeted 71 dairy SMEs in Kiambu County in the ten constituencies in Kiambu county:
Githunguri Constituency, Kiambaa Constituency,Kabete Constituency,Limuru Constituency,Lari
Constituency,Gatundu North constituency,Gatundu South constituency, Ruiru Constituency ,
Thika East Constituency and Thika West Constituency . The study targets this area because of
the recent commercialization of dairy farming to be a business like any other in the country.
3.4 Sample and Sampling Design
Probability sampling techniques was employed in this research to select a sample of 50 (70%)
enterprises from the population of 71 SMEs in Kiambu County. The specific technique employed
was stratified random sampling, which enabled all the enterprises in all the categories to get
equal chances of being included in the sample (Singleton et al., 1988). Stratified random
sampling involves subdividing the population into mutually exclusive segments called strata,
based on the categories of one or a combination of relevant variables. Simple random samples
are then drawn from each stratum, and these sub samples are combined to form a complete

25
stratified sample (Singleton et al., 1988). The size of a sub sample depends on the size (quantity)
of the category.
Considering the population of 71 SMEs for this study, it was divided into ten (10) categories of
the constituencies in Kiambu County to include all dairy SMEs in Kiambu County. Probability
sampling was then used where each stratum will be multiplied by the sampling probability of
70% to obtain sub samples depending on their sizes.
3.5 Data Collection
This study made use of secondary data. Secondary data was obtained from the firms‟ annual
reports. This was for a five year period, that is, from the year 2009 to 2013. The data mainly
comprised the financial statements. A letter of introduction stating the purpose of the study was
sent to the firms‟ managers. In addition, the researcher made telephone calls to the respective
respondents to further explain the purpose of the study and request for the financial statements.
The researcher also reviewed organization Newsletters where possible to obtain secondary
information on capital structure of these firms.
3.6 Data Analysis
The relationship between the dependent variable and the independent variables are determined
by regression model. Variables data was analyzed using Statistical Package for Social Sciences
(SPSS). A multiple regression model was used to determine the effects of the capital structure
on the financial performance of dairy SMEs and the relative effects of equity financing and debt
financing on financial performance.
26
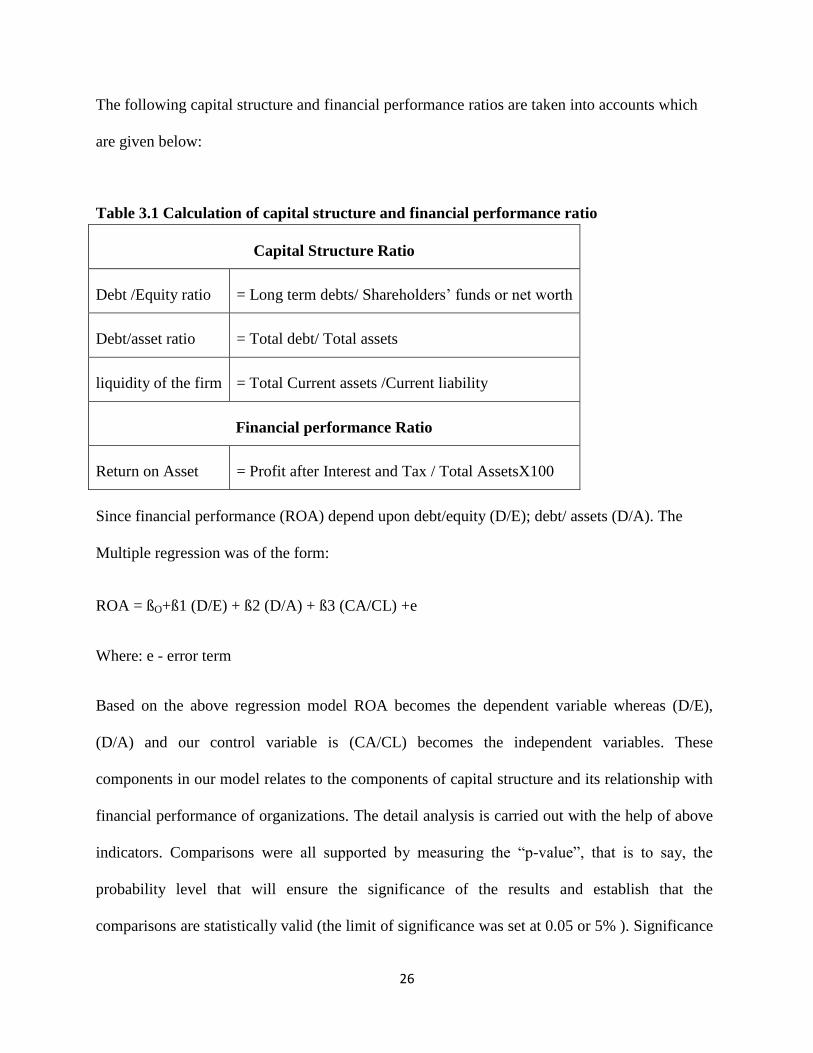
The following capital structure and financial performance ratios are taken into accounts which
are given below:
Table 3.1 Calculation of capital structure and financial performance ratio
Capital Structure Ratio
Debt /Equity ratio = Long term debts/ Shareholders‟ funds or net worth
Debt/asset ratio = Total debt/ Total assets
liquidity of the firm = Total Current assets /Current liability
Financial performance Ratio
Return on Asset = Profit after Interest and Tax / Total AssetsX100
Since financial performance (ROA) depend upon debt/equity (D/E); debt/ assets (D/A). The
Multiple regression was of the form:
ROA = ßO+ß1 (D/E) + ß2 (D/A) + ß3 (CA/CL) +e
Where: e - error term
Based on the above regression model ROA becomes the dependent variable whereas (D/E),
(D/A) and our control variable is (CA/CL) becomes the independent variables. These
components in our model relates to the components of capital structure and its relationship with
financial performance of organizations. The detail analysis is carried out with the help of above
indicators. Comparisons were all supported by measuring the “p-value”, that is to say, the
probability level that will ensure the significance of the results and establish that the
comparisons are statistically valid (the limit of significance was set at 0.05 or 5% ). Significance

27
of capital structure variables as predictors of financial performance was tested using the t-test.
The significance of the overall model in explaining performance through the independent
variables was measured through the f-test. The analyzed data was then presented using tables
ßO= Constant
ß1…………ß3= Coefficient of the independent variable
(D/E)=Debt /Equity ratio
(D/A)=Debt/asset ratio
(CA/CL) = liquidity of the firm

28
CHAPTER FOUR
DATA ANALYSIS, RESULTS AND DISCUSSIONS
4.1 Introductions
This chapter presents the analysis of data, findings from the study and discussion of the
findings. Section 4.2 presents descriptive analysis; section 4.3 correlation analysis; Section 4.4
presents multiple regression analysis whereas section 4.5 presents chapter summary.
4.2 Descriptive Analysis
The study sought to collect and analyze consolidated data from the 50 of small and
medium enterprises in dairy sector in Kiambu county. Secondary data obtained from reports
published by the organization Newsletters. The dependent variable, return on investment was
used as a proxy to measure financial performance of small and medium enterprises in dairy
sector in Kiambu county obtained by telephone calls made to firms‟ managers.
4.2.1 Response Rate
The study realized a response rate of 100% from the SMEs requested to submit their financial
statement. This was made a reality as a result of the researcher following up on the financial
managers in the SMEs in provide the required data.
Table 4.1 Response rate
Response Frequency Percent (%)
Responded 50 50
Not responded 0 -
Total 50 100
4.2.2 Mean of Ratios

29
The study aimed at establishing the mean of the ratios in the study. The study revealed that the
mean ratio of debt equity to be 1.132, that of debt asset, to be 2.094 liquidity to be1.168 whereas
that of return on investment was 0.089. The results are as shown in the table below.
Table 4.2: Mean of Ratios
N Mean Std. Deviation
debt equity 50 1.132 .665
debt asset 50 2.094 .725
liquidity 50 1.168 .580
return on investment 50 .089 .338
4.3 Correlation Analysis
A partial correlation analysis using Karl Pearson correlation coefficient was performed. A
negative coefficient indicated a negative relationship between the variables correlated; in which
case an increase in one variable would result into a decrease in the other variable and vice versa.
A positive coefficient on the other hand indicates a positive relationship in the variables;
meaning that changes in the variables move together. An increase in one variable would
therefore result into an increase in the other variable and vice versa.
The measures were constructed using summated scales from both the independent and dependent
variables. As cited in Cooper and Schindler (2000) the correlation coefficient value (r) range
from 0.10 to 0.29 is considered weak, from 0.30 to 0.49 is considered medium and from 0.50 to
1.0 is considered strong. However, according to Field (2005), correlation coefficient should not
go beyond 0.8, to avoid multicollinearity. Since the highest correlation coefficient is 0.635 which
is less than 0.8, there is no multicollinearity problem in this research. Table 4.1 shows the
correlation analysis.

30
Table 4.3: Correlations
Debt equity Debt asset liquidity ROA
Debt equity 1
Debt asset .635
1
Liquidity 0.578
.127
1
ROA -.604
.206
.432
1
Correlation is significant at the 0.05 level.
Results in table 4.11, on Pearson correlation coefficient revealed that Debt equity has significant
positive relationship with Debt asset (r = 0.635, p< 0.05), Liquidity (r = 0.578, p < 0.05) and
ROA negative (r = - 0.604, p< 0.05) respectively. This implies that increases in debt equity will
lead to decline in ROA whereas more of debt increases more cash to a business and makes the
firm more liquid hence positive relationship. Debt asset has a significant positive relationship
with liquidity (r =0.127, p < 0.05) and ROA (r = 0.206, p< 0.05). Liquidity and ROA (r = 0.
0.432, p < 0.05).
4.4 Regression
A regression analysis between the dependent variable and the independent variables was
carried out where liquidity of the firm, debt equity ratio and debt asset ratio were the independent
variables while the dependent variable was return on investment . Table 4.1 indicate that the
r-squared for the model was 0.263, which indicates that the independent variables can be

31
used to explain about 26% of the variation in financial performance of small and medium
enterprises in dairy sector in Kiambu County.
Table 4.4: Regression Model Summary
Model R R Square Adjusted R Square
Std. Error of the
Estimate
1 .513a .263 .216 .2999282422
a. Predictors: (Constant), liquidity of the firm, debt equity ratio, debt asset ratio
Results in table 4.2 give the analysis of variances in the regression model. These results
indicate that the model had an f-ratio of 5.600 which was significant at 0.2% level of
significance. This result indicates that the overall regression model is statistically significant and
is useful for prediction purposes at 5% significance level. This further indicates that the
independent variables (liquidity of the firm, debt equity ratio and debt asset ratio) used are
statistically significant in predicting financial performance of small and medium enterprises in
dairy sector in Kiambu county.
Table 4.5: Analysis of Variances
Model Sum of Squares df Mean Square F Sig.
1 Regression 1.511 3 .504 5.600 .002a
Residual 4.228 47 .090
Total 5.739 50
a. Predictors: (Constant), liquidity of the firm, debt equity ratio, debt asset ratio
b. Dependent Variable: return on investment

32
Results in table 4.3 below present the test of the statistical significance of the independent
variables in the model. This provides the estimates of independent variables, their standard
error and the t-ratios. The table also provides the statistical significance of each independent
variable in the regression model. The results indicate that Debt equity ratio had a t-ratio value of
-2.716. This t-ratio is significant at 5% level of significance (0.009) which indicates that
Debt equity ratio is a significant predictor of financial performance of small and medium
enterprises in dairy sector in Kiambu county. The estimate of coefficient value for Debt equity
ratio is -0.179 which indicates that financial performance of small and medium enterprises in
dairy sector in Kiambu County is negatively influenced by debt equity ratio.
The results indicate that the t-ratio for Debt asset ratio of a firm was 2.886. This t-ratio is
significant at 5% level of significance (0.006) which indicates that debt asset ratio is a
significant predictor of financial performance of small and medium enterprises in dairy sector
in Kiambu county. The estimate coefficient value for debt asset ratio is 0.195 which indicates
that financial performance of small and medium enterprises in dairy sector in Kiambu County is
positively influenced by Debt asset ratio.
The results indicate that the t-ratio for liquidity ratio was 2.740. This t-ratio is significant at
5% level of significance (0.01) which indicates that liquidity ratio is a significant predictor
of financial performance of small and medium enterprises in dairy sector in Kiambu county. The
estimate coefficient value for liquidity ratio is 0.012 which indicates that financial performance
of small and medium enterprises in dairy sector in Kiambu County is positively influenced by
liquidity ratio.

33
Table 4.6: Regression Coefficient
Model
Unstandardized
Coefficients
Standardized
Coefficients
t Sig. B Std. Error Beta
1 (Constant) .907 .232 3.908 .000
debt equity ratio -.179 .066 -.351 -2.716 .009
Debt asset ratio .195 .067 .420 2.886 .006
liquidity of the
firm
.012 .086 .021 2.740 .01
a. Dependent Variable: return on investment
The multiple regression models becomes
ROA = 0.907-0.179 (D/E) + 0.195 (D/A) +0.012 (CA/CL) +e
4.5 Discussions of Findings
The chapter carried out inferential analysis to establish the relationship between capital structure
and financial performance. Study results indicated that the independent variables of capital
structure (liquidity of the firm, debt equity ratio, debt asset ratio) explain and can predict
financial performance of small and medium enterprises in dairy sector in Kiambu County. These
variables could explain about 26% of that financial performance of small and medium
enterprises in dairy sector in Kiambu County.
Similar findings were posited by Adekunle (2009) in a study to examine the impact of capital
structure on the performance of pharceutical industries in Kenya, the study used debt ratio to
proxy capital structure while return on asset and return on equity were used as measures of firms‟

34
performance. The study used the Ordinary Least Squares method of estimation. The result of the
study indicated that debt ratio has a significant negative impact on the firm‟s financial measures
of performance.
Kaumbuthu (2011) in his study to determine the relationship between capital structure and return
on equity for industrial and allied sectors in the Nairobi Securities Exchange during the period
2004 to 2008 supports our findings. Capital structure was proxy by debt equity ratio while
performance focused on return on equity. The study applied regression analysis and found a
negative relationship between debt equity ratio and ROE. The study focused on only one sector
of the companies listed in Nairobi Securities Exchange and paid attention to only one aspect of
financing decisions. The results of the study, therefore, may not be generalized to the other
sectors. The present thesis covered all non-financial companies listed on the Nairobi Securities
Exchange to determine the effects of financing decisions on firm financial performance.

35
CHAPTER FIVE
SUMMARY, CONCLUSION AND RECOMMENDATIONS
5.1 Introduction
In this chapter, the researcher presents the summary, conclusions and the recommendations made
from the study findings. In section 5.2, summary of findings are presented. Section 5.3 presents
conclusions and recommendations made from the study findings while section 5.4 presents
suggestion for further research. Section 5.5 presents limitations faced while carrying out the
study.
5.2 Summary of Findings
The study sought to collect capital structure data of 50 small and medium enterprises in dairy
industry in Kiambu County. Data analysis was through descriptive analysis and multiple linear
regression analysis.
The study had a response rate of 100% coming from researcher‟s efforts to gather all necessary
information. The mean of the ratios ie debt equity ratios, liquidity ratio, debt asset ratio were
greater than whereas return on asset ratio remained lesser than one. This indicated that the
SMEs in Kiambu county were funded mainly through debt and lesser through equity; the results
also shows that the SMEs have more assets than current liabilities as seen by a high liquidity
ratio; the debt asset ratio was as well more than one indicating that the SMEs have mainly
acquired their asset through debt.
The study confirmed that there was correlation between the variables in the study though the
results confirmed that there was no multicollinearity between the variables themselves.

36
Study results indicated that the capital structure components (debt equity, total asset ratio and
liquidity ratio) could explain 26% of the financial performance of small and medium enterprises
in dairy industry in Kiambu County. The coefficient for Debt equity ratio was significant at 0.05
with a coefficient of -0.179 which indicates that financial performance of small and medium
enterprises in dairy sector in Kiambu County is negatively influenced by debt equity ratio. The
coefficient for debt asset ratio was 0.195 and significant at 0.05 which indicates that financial
performance of small and medium enterprises in dairy sector in Kiambu County is positively
influenced by Debt asset ratio. The coefficient for liquidity ratio is 0.012 which indicates that
financial performance of small and medium enterprises in dairy sector in Kiambu County is
positively influenced by liquidity ratio.
5.3 Conclusion and Recommendations
The study concludes that capital structure has a significant impact on the financial performance
(ROA) of small and medium enterprises in dairy sector in Kiambu County. In this case therefore
from the independent variables involved in the study debt equity has a negative impact on the
performance of SMEs in dairy sector in Kiambu County having more in terms of debt than
equity stocks in the capital structure of the firm will cause a negative performance of these
SMEs. The study as well concludes that firms that are liquid enough (have more current asset
than current liability) will experience positive performance. Findings by Eldomiaty and Azim
(2008) support our conclusions when they argue that there is a positive relationship between
capital structure and financial performance. Hadlock and James (2002) also support the
argument. Zeitun and Tian (2007) is similarly of the opinion that Capital structure is closely
linked to the financial performance.

37
The study from the findings and conclusions recommend that; SMEs in dairy sector in Kiambu
county should ensure that they finance their businesses projects and operations more through
seeking for finance through the issue of shares to ensure that they have more of equity than debt
since firms that have more equity than debt in financing experience positive financial
performance. The SMEs should as well ensure that they invest the debt they take in acquiring
assets for the companies since assets such as securities and stocks has positive impact on the
performance on SMEs. The dairy SMEs should also ensure that they have more current asset
that current liability at all times because firms that are more liquid faces less financial
challenges hence better performance.
Ogebe, Ogebe and Alewi (2013) in their study which sought to investigate the impact of capital
structure on firm performance in Nigeria from 2000 to 2010, considered the impact of some key
macroeconomic variables (gross domestic product and inflation) on firm performance. The
traditional theory of capital structure was employed to determine the significance of leverage and
macroeconomic variables on firm‟s performance. The study made a comparative analysis of the
selected firms which are classified into highly and lowly geared firms setting a leverage
threshold of above 10% as being highly geared.
A static panel analysis was used to achieve the objectives of the study. Using fixed effect
regression estimation model, a relationship was established between performance (proxied by
return on investment) and leverage of the firms over a period of ten years. The results provide
strong evidence in support of the traditional theory of capital structure which asserts that
leverage is a significant determinant of firms‟ performance. A significant negative relationship is
established between leverage and performance. From the findings, they strongly recommended
that firms should use more of equity than debt in financing their business activities, this is

38
because in spite of the fact that the value of a business can be enhanced with debt capital, it gets
to a point that it becomes detrimental. Each firm should establish with the aid of professional
financial managers, that particular debt-equity mix that maximizes its value and minimizes its
weighted average cost of capital.
Hanh (2009) in their research which provides the first analysis of the relationship between farm
financial exposure and technical efficiency in the Pangasius farming in An Giang province, in
the Mekong Delta of Vietnam. A nonparametric DEA approach was been applied to estimate
technical and scale efficiency scores of 61 Pangasius farms in An Giang province in the year
2008. The mean technical efficiencies under assumption of constant returns to scale and variable
returns to scale and scale efficiency were measured to be 0.595, 1.058 and 0.58 respectively. The
decomposition of the technical efficiency measure shows that scale inefficiency is the primary
cause of technical inefficiency in the case of Pangasius farming as about 92% of the sample
Pangasius farms exhibits increasing returns to scale (IRS). Then, estimated technical efficiency
(TE) scores under assumption of variable returns to scale are used in a regression analysis to
investigate the relationship between the efficiency measures and different farm characteristics,
including financial considerations.
Research results suggest that technical efficiency is influenced by investment level of farms as
well as by farm operator‟s experience. The farms are invested more will be more efficient. The
experience measured as the years of operator in farming Pangasius also suggests that the farmers
having more experience may have better decisions in farm operating and more efficient in using
inputs, thus, their farms are more efficient. Technical efficiency is positively influenced by the
debt-to-asset ratio and also by the debt-to-equity ratio. The other factors (age and education

39
levels of the houshlod head) are found to have no effects on the technical efficiency in the
sample farms.
Lazaridis and Tryfonidis (2006) carried out a study on whether liquidity is important in company
performance and its influence on its profitability of listed companies in the Athens stock
exchange. The main goal of this study was to recognize the liquidity impact on profitability in
the listed companies. The paper consists of two sections. First part encloses the research
expectations, while second section is related to empirical hypothesis verifications. The empirical
results provide the basis to conclude about the existence of liquidity impact on profitability in
polish listed these companies. In the research over the liquidity profitability relationship in these
listed companies the proxies to measure profitability were: return on assets and return on equity.
Since the sales scale is one of the indications of company profitability, the return on sale ratio
was used also as one of the profitability proxies. The results of the study on liquidity impact on
profitability in polish listed IT companies proved the existence of statistically significant positive
relationship between liquidity and profitability.
5.4 Suggestions for Further Research
As this study has considered only capital structure and its relationship with performance of
SMEs in dairy sector another study should be done on the other factors that have impact on the
financial performance of SMEs in dairy sector this is from the fact that capital structure could
predict only 26% of the financial performance in dairy SMEs sector for-instance a study on the
impact of adoption of technology and its effects on the financial performance of dairy SMEs in
Kiambu County to see if the model can help predict the performance better.

40
Another study on the effect of capital structure on return on equity would also be useful in
Kiambu County to see how this area of financial performance is affected by capital structure.
A similar study should be done in other counties in Kenya where there are dairy SMEs in order
to generalize findings. A comparison will in this case enable the researcher to justify his
findings based on the observation from the other counties.
Finally a study should be conducted where a larger sample is used in this case to see if the
model summary could be affected and see its reliability in prediction of performance of small
and medium enterprises in Kenya especially in dairy sector.
5.5 Limitations of the Study
SMEs profit after tax and exceptional items figures were only available on an annual basis.
Regression was therefore based on the annual figures even though current assets and current
liabilities were available on monthly basis. Availability of the data on a quarterly or monthly
basis would have provided more precision in the regression results.
Some of The SMEs had poor records for financial statements where some of the data was not
readily available and could only be estimated by the financial managers this created a room for
the manipulation of data under analysis.
Some of the respondents (financial managers) could hide some data for fear of information
reaching the competitors and therefore could give only financial figure that were estimates, the
figure estimates in this case could affect the study findings .
Some of the organization had not used recent accounting standards in presenting their data
whereby they had not classified their financial details into the required financial standards for

41
instance it was challenging to ascertain the current assets due to some firms lacking cash flow
statements.
Some of the SMEs had as well had reported losses in some financial years therefore becoming
hard to come up with return on asset ratio in some instances. This was a limitation indeed
because the researcher relied on return on asset ratio as his measure of financial performance
which was a key variable in the study.

42
REFERENCES
Abor, J. (2005). The Effect of Capital Structure on Profitability: An Empirical analysis of Listed
Firms in Ghana. Journal of Risk Finance, 6(4): 38-47.
Adekunle, P. (2009), Determinants of capital structure: empirical evidence from the Czech
Republic, Czech Journal of Economics and Finance, 54, (7): 2-21.
Amit, P and Schoemaker, E. (2003), Managerial entrenchment and capital structure decisions,
Journal of Finance, 52, (1): 11-38.
Bas, T., Muradoglu G., &Phylaktis, K. (2009). Determinants of Capital Structure in Emerging
Markets.Cass Business School. Retrived on June 3, 2010 from
http://www.fmpm.ch/docs/13th/papers/C2a.pdf.
Baxter, N. (2007). Leverage, risk of ruin and the cost of capital. The Journal of Finance, 22.
(3): 395-403.
Berger and di Patti. (2002). Capital Structure and Firm Performance: A New Approach to
Testing Agency Theory and an Application to the Banking Industry. Feds Paper.
Berger, A.N., Bonaccorsi di Patti, E. (2006), Capital structure and firm performance: a new
approach to testing agency theory and an application to the banking industry, Journal of
Banking & Finance, 30 (4): 65-102.
Berger, T.J., Oliver, B.R. and Pua, S.L.H. (2007), On the relation between ownership
structure and capital structure, Accounting and Finance, 42, (6): 1-26.
Bhaduri, S. (2002), Determinants of corporate borrowing: some evidence from the Indian
corporate structure, Journal of Economic and Finance, 26,(8): 2-15.
Brealey, R. A., Myers, S. C., & Marcus, A. J. (2001).Fundamentals of Corporate Finance (3rd
ed.). New York: McGraw-Hill.
43
Brigham, E. F. andEhrhardt ,M. C. (2004. Financial Management: Theory and Practice,11th
Edition, South-Western College Publishers, New York.
Brush, C., Bromiley, P., &Hendrickx, M. (2000). The free cash flow hypothesis for sales growth
and firm performance. Strategic Management Journal, 21,(4): 455-472.
Chaganti, R. and Damanpour, F. (2001), Institutional ownership, capital structure and firm
performance, Strategic Management Journal, 12, (4): 79-93.
Chen, C. and Steiner, T. (2009). Managerial ownership and agency conflicts: a nonlinear
simultaneous equation analysis of managerial ownership, risk taking, debt policy, and
dividend policy, Journal of Financial Review,34, (1)19-36.
Chen, J.J. (2004). Determinants of capital structure of Chinese-listed companies, Journal of
Business Research, 57(13): 41-51.
Cooper, D. R., Schindler, P. S., & Sun, J. (2006). Business research methods.
Copeland, T., Koller, T., & Murrin, J. (2000).Valuation: Measuring and Managing the Value of
Companies (Third ed.). New York: John Wiley & Sons, Inc.
Crutchley, C., and R. S. Hansen (2009).A Test of the Agency Theory of Managerial Ownership,
Corporate Leverage, and Corporate Dividends.Financial management journal,23 (6):36
46.
Crutchley, C.E. and Jensen, M.R.H. (2006), Changes in corporate debt policy: information
asymmetry and agency factors, journal of Managerial Finance, 22, (7): 1-16.
Denscombe, M. (2008). Communities of practice a research paradigm for the mixed methods
approach. Journal of mixed methods research, 2(3), 270-283.
Ebaid, E. I. (2009). The impact of capital-structure choice on firm performance: empirical
evidence from Egypt. The Journal of Risk Finance, 10(5): 477-487.

44
Elimuti, L. and Kathawala, R. (2009). Dividend Policy and the earned/contributed capital mix: a
test of the life-cycle theory. Journal of Financial Economics, 81(9): 227-254.
Farma,E. & French, K.(2002).Testing Trade off and Pecking Predictions about Dividends and
Debt, Review of financial studies, 15(7): 1-33.
Friend, I. and J. Hasbrouck, (2008), Determinants of Capital Structure,in Research in Finance
Greenwich, CT. Jai Press, Inc.
Georgantopoulos, A. G., & Tsamis, A. (2013). Assessing the Efficiency of Commercial Banks in
Greece During the Financial Crisis: A Linear Approach in Conjunction with Financial
Analysis. Journal of Money, Investment and Banking, (28), 31-46.
Gomez,, L.J. (2005). Principles of Managerial Finance.(7th
Edition).New York:Harper Collins
College Publishers.
Grier, A. and Zychowicz, S. (2004). The Debt-Equity Choice.The Journal of Financial and
Quantitative Analysis, 36, (1): 1-24.
Grossman, S.J. and Hart, O. (2002), Corporate financial structure and managerial incentives, in
McCall, J. The Economics of Information and Uncertainty, University of Chicago
Press, Chicago, IL.
Hadlock, C. and James, C. (2002). Do banks provide financial slack? Journal of Finance,
57,(9):34-20.
Hamada,S. (2009)Interrelationships between Capital Structure and Financial Performance, Firm
Size and Growth: Comparison of industrial sector in KSE: European Journal of Business
and Management, 4(15): 148-157.

45
Hanh, B. L. T. (2009). Impact of financial variables on the production efficiency of Pangasius
farms in An Giang province, Vietnam.
Harris, A..andRaviv, H. (2010).Determinants of target capital structure: The case of dual debt
and equity issues', Journal of Financial Economics, 71,(3): 517-40.
Harris, M. and Raviv, A (2000). Capital structure and the informational role of debt. Journal of
Finance, 45, (1): 321-349.
Hoskisson, R. E., Hitt, M. A., Johnson, R. A., &Moesel, D. D. (2003). Construct validity of an
objective (entropy) categorical measure of diversification strategy. StrategicManagement
Journal, 14, (3): 215-235.
Hovakimian, A., Opler, T. and Titman, S. (2004).The Debt-Equity Choice.The Journal of
Financial and Quantitative Analysis, 36, (1): 1-24.
Jensen MC, Meckling W (2006). Theory of the firm: managerial behavior, agency costs, and
capital structure. Journal of Finance and Economics, 3, (1): 305-360.
Jensen, M. C (2006). Agency costs of free cash flow and corporate finance and takeovers. Jounal
of Economics Review, 7 (6): 323-339.
John, K. and Williams, J. (2005), Dividends, dilution, and taxes: a signaling equilibrium The
Journal of Finance, 40, (10): 53-70.
Kaumbuthu,A.J. (2011) The relationship between capital structure and financial performance: a
study of firms listed under industrial and allied sector at the NSE,(MBA Dissertation,
university of Nairobi ,2011).Retrieved from http://erepository.uonbi.ac.ke.
Kerlinger, F. N., & Lee, H. B. (2000).Foundations of behavioral research (4th ed.). Fort Worth,
TX: Harcourt.

46
Kothari, C. (2008). Pretesting in questionnaire design: The impact of respondent characteristics
on error detection.Journal of the Market Research Society, 36 (10): 295–314.
Kothari, C. (2008). Pretesting in questionnaire design: The impact of respondent characteristics
on error detection.Journal of the Market Research Society, 36 (10): 295–314.
Lazaridis, I., & Tryfonidis, D. (2006). Relationship between working capital management and
profitability of listed companies in the Athens stock exchange. Journal of financial
management and analysis, 19(1).
Leland, H.E. and Pyle, D.H. (2007), Informational asymmetries, financial structure, and
financial intermediation, The Journal of Finance, 32(3): 71-87.
Miller, M.H. and Kevin, R. (2005), Dividend policy under asymmetric information, The
Journal of Finance, 40(10): 31-51.
Modigliani, F. and Miller, M.H. (2003).The cost of capital, corporation finance and the theory of
Investment. American Economic Review, 48 (2): 61-97.
Modigliani, F. and Miller, M. (2008), The cost of capital, corporate finance and the theory of
investment, American Economic Review, 48,(2): 61-97.
Mugenda, M.,O. andMugenda, G., A (2003) »Research Methods: Quantitative And Qualitative
Approaches. Laba graphics services.
Myers, S.C. (2004). The capital structure puzzle.Journal of Finance and Economics, 39, (6):
575-592.
Myers, S.C. (2007), The determinants of corporate borrowing, Journal of Financial
Economics,5(1): 47-75.

47
Myers, S.C. and Majluf, N.S., (2004). Corporate financing and investment decisions when firms
have information that investors do not have‟, Journal of Financial Economics, 13(7):
187-221.
Myers, S.C. and Rajan, R.G. (2008), The paradox of liquidity, Quarterly Journal of
Economics, 113(7): 33-71.
Myers, S.C.,(2004). The capital structure puzzle, Journal of Finance, 34(8): 575-592.
Nachmias F, &Nachmias,D. (2008). Research Methods in the Social Sciences.Worth
Publishers.
Ogebe, P. O., Ogebe, J. O., & Alewi, K. (2013). Capital Structure and Firms‟ Performance in
Nigeria. Available at SSRN 2266916.
Penman, S. H. (2001).Financial Statement Analysis and Security Valuation. New York:
McGraw-Hill.
Pettit, R. and Singer, R. (2005). Small business finance: a research agenda, Financial
Management, 7 (6): 47-60.
Rajan, R.G. and Zingales, L. (2005), What do we know about capital structure? Some evidence
from international data, Journal of Finance, 50(14): 21-60.
Saeedi ,A. andMahmoodi,I. (2011). Capital Structure and Firm Performance: Evidence from
Iranian Companies. International Research Journal of Finance and Economics, 70(7):
20-29.
Simerly ,R. and Li, M. (2000). Environmental Dynamism, Financial Leverage and
Performance: A Theoretical Integration and an Empirical Test. Strategic
ManagementJournal, 21(10): 31-49.
Stiglitz, J. (2002), On irrelevance of corporate financial policy, American Economic Review,
64 (6): 851-66.

48
Stiglitz, R (2004). Managerial discretion and optimal financing policies.Journal of Finance and
Economics, 20(12): 3- 27.
Titman, S. (2004), The determinants of capital structure choice, Journal of Finance,43(2): 1
19.
Tong, S. and Ning, Y. (2004), Does capital structure affect institutional investor choices?,
TheJournal of Investing, 28(4): 53-66.
West, T. L.& Jones, D. J. (2009).Handbook of Business Valuation (2nd ed.). New York: John
Wiley & Sons.
Williams, O.E. (2007). Corporate Finance and Corporate Governance; Journal of. Finance,43
(3): 567-591.
Zeitun, R. andTian, G. (2007). Capital Structure and Corporate Performance: Evidence From
Jordan. Australasian Accounting Business and Finance Journal, 1(7): 40-53.

49
APPENDICES
Appendix I: Data Collection Form
2009 2010 2011 2012 2013
Shareholders‟ funds or net worth
Long term debts
Total debt
Total assets
Current Asset
Current liability
Profit After interest and tax
Thank you for your Participation

50
Appendix II: Data Summary
Debt/asset
ratio liquidity of the firm
Return on
Investment
0.50097 0.396371831 1.818041635 0.528788732
0.205837 0.944056 2.531382528 0.972930296
3.996308 1.374752 1.011154011 0.836461784
1.151855 3.427662 0.812370459 0.018040591
0.730069 2.416265 2.183157221 0.048493976
0.487322 3.206589 0.812112732 0.030342436
1.097243 1.360505 0.72535945 0.92065698
0.931853 3.008023 0.658570056 0.605430528
1.019509 1.462268 1.110315405 0.848814862
1.050613 3.456862 0.990641509 0.183272523
0.656939 1.502917 1.869356659 0.806644775
1.042357 2.598852 0.704012714 0.734215124
1.945786 1.910377 0.792882958 0.686289233
0.412013 1.436770 1.670400943 0.097517334
1.341257 2.390098 1.296674446 0.381000251
0.386408 2.467861 0.371518296 0.531518625
1.566045 2.363492 0.970877018 0.37224158
1.392752 2.392079 0.897974083 0.059647428
2.299235 2.465068 0.596734818 0.043542435
0.872652 1.486058 2.661598188 0.902644231
0.796888 1.955661 0.569219331 0.801266825
2.135846 2.592409 0.483695652 0.219197138
2.314701 1.568856 2.331835687 0.116609059
0.467236 1.288796 1.824800532 0.066945774
1.495585 2.747194 0.624901319 0.034774609
1.630957 1.509057 0.814423303 0.836444993
0.623959 1.341294 2.351510067 0.061225124
1.640342 2.084728 0.580391161 0.049239949
0.865362 1.471465 2.147682119 0.394692144
0.817378 1.654892 1.699347984 0.070303327
0.792095 2.954229 0.558734742 0.020098644
1.160028 3.170920 0.80518732 0.353868613
0.996652 1.461898 1.331349206 0.53524065
0.674536 1.997224 1.489239598 0.349356396
0.728307 2.456976 1.055997455 0.271720969
0.471145 2.309244 1.050015929 0.573084014
1.12598 1.998066 1.25596817 0.424708727
0.807005 1.713579 1.175201016 0.743269992
0.519851 1.555381 0.843371315 0.180314171

51
2.199868 2.555720 1.335791459 0.047537949
0.625386 1.066802 0.787098245 0.032384548
1.772203 3.204680 1.318325581 0.819723018
1.451992 1.735200 0.869506117 0.227525721
0.861455 3.321983 0.843335224 0.192067989
0.680237 1.310849 1.296674636 0.712887007
1.116464 1.949170 0.828358209 0.017782251
1.244888 2.988844 1.305684807 0.924623116
0.823629 2.598427 0.779661017 0.062521504
1.383195 1.538775 1.036394349 0.385468916
1.355303 2.469292 0.475647293 0.051986994

52
Appendix III: List of SMEs in Kiambu County
1. Kanunga dairy farmers
2. Muchatha dairy farmers
3. Boma dairy farmers
4. Wangige dairy farmers
5. Ruaka dairy farmers
6. Githunguri dairy farmers
7. Katisuru dairy farmers
8. Kahawa dairy farmers
9. Lower kabete dairy farmers
10. Githobokoini dairy farmers
11. Gituamba dairy farmers
12. Mangu dairy farmers
13. Kiamwangi dairy farmers
14. Kiganjo dairy farmers
15. Ndarangu dairy farmers
16. Githurai kimbo dairy farmers
17. Kamenu dairy farmers
18. Kinoo dairy farmers
19. Githiga dairy farmers
20. Ikinu dairy farmers
21. Ngewa dairy farmers
22. Komothai dairy farmers
23. Kabete dairy farmers
24. Gitaru dairy farmers
25. Muguga dairy farmers
26. Nyadhuna dairy farmers
27. Kabete dairy farmers
28. Uthiru dairy farmers
29. Karuri dairy farmers
30. Ngecha Tigoni dairy farmers
31. Ruiru dairy farmers
32. Ndururumo dairy farmers
33. Riabai dairy farmers
34. Gatuanyaga dairy farmers
35. Juja dairy farmers
36. Kalimoni dairy farmers
37. Gatuanyaga dairy farmers
38. Kinale dairy farmers
39. Kijabe dairy farmers
40. Nyanduma dairy farmers
41. Kamburu dairy farmers
42. Lari/Kirenga dairy farmers
43. Murera dairy farmers
44. Theta dairy farmers
45. Juja dairy farmers
46. Witeithie dairy farmers
47. Karai dairy farmers
48. Nachu dairy farmers
49. Sigona dairy farmers
50. Bibirioni dairy farmers
51. Ndeiya dairy farmers
52. Gatongora dairy farmers
53. Kiuu dairy farmers
54. Mwihoko 1 dairy farmers
55. Ting‟ang‟a dairy farmers
56. Ndumberi 3 dairy farmers
57. Ndenderu dairy farmers
58. Kihara dairy farmers
59. Cianda dairy farmers
60. Gitothua dairy farmers
61. Mang‟u dairy farmers
62. Ndarugo dairy farmers
63. Ngenda dairy farmers 64. Githurai Kimbo dairy farmers
65. Gitothua dairy farmers 66. Murera dairy farmers 67. Majengo dairy farmers 68. Kiganda dairy farmers 69. Komu dairy farmers
70. Mugumoini dairy farmers 71. Chania dairy farmers