Embed Size (px)
Citation preview

NBER WORKING PAPER SERIES
THE EFFECT OF CIVILIAN CASUALTIES IN AFGHANISTAN AND IRAQ
Luke N. CondraJoseph H. Felter
Radha K. IyengarJacob N. Shapiro
Working Paper 16152http://www.nber.org/papers/w16152
NATIONAL BUREAU OF ECONOMIC RESEARCH1050 Massachusetts Avenue
Cambridge, MA 02138July 2010
The authors thank Eli Berman, Ethan Bueno de Mesquita, Lee Ewing, Brian Fishman, Jason Lyall,Kyle Pizzey, and David Siegel for helpful comments and assistance with data. Condra acknowledgesfinancial support from Stanford University‘s School of Humanities and Sciences Graduate ResearchOpportunity Fund. We acknowledge financial support from grant #FA9550-09-1-0314 from the AirForce Office of Scientific Research. The views expressed are the authors' and in no way reflect thoseof their universities, the Department of Defense, the International Security Assistance Force, or theNational Bureau of Economic Research.
NBER working papers are circulated for discussion and comment purposes. They have not been peer-reviewed or been subject to the review by the NBER Board of Directors that accompanies officialNBER publications.
© 2010 by Luke N. Condra, Joseph H. Felter, Radha K. Iyengar, and Jacob N. Shapiro. All rights reserved.Short sections of text, not to exceed two paragraphs, may be quoted without explicit permission providedthat full credit, including © notice, is given to the source.

The Effect of Civilian Casualties in Afghanistan and IraqLuke N. Condra, Joseph H. Felter, Radha K. Iyengar, and Jacob N. ShapiroNBER Working Paper No. 16152July 2010, Revised October 2010JEL No. F51,F52,H56,J22,K42,O53
ABSTRACT
A central question in intrastate conflicts is how insurgents are able to mobilize supporters to participatein violent and risky activities. A common explanation is that violence committed by counterinsurgentforces mobilizes certain segments of the population through a range of mechanisms. We study theeffects of civilian casualties in Iraq and Afghanistan to quantify the effect of such casualties on subsequentinsurgent violence. By comparing uniquely detailed micro-data along temporal, spatial, and genderdimensions we can distinguish short-run 'information' and 'capacity' effects from the longer run 'propaganda'and 'revenge' effects. In Afghanistan we find strong evidence that local exposure to civilian casualtiescaused by international forces leads to increased insurgent violence over the long-run, what we termthe 'revenge' effect. Matching districts with similar past trends in violence shows that counterinsurgent-generatedcivilian casualties from a typical incident are responsible for 1 additional violent incident in an averagesized district in the following 6 weeks and lead to increased violence over the next 6 months. Thereis no evidence that out-of-area events—errant air strikes for example—lead to increased violence,nor is there evidence of short run effects, thus ruling out the propaganda, information, and capacitymechanisms. Critically, we find no evidence of a similar reaction to civilian casualties in Iraq, suggestingthe constraints on insurgent production of violence may be quite conflict-specific. Our results implythat minimizing harm to civilians may indeed help counterinsurgent forces in Afghanistan to reduceinsurgent recruitment.
Luke N. CondraStanford UniversityDepartment of Political ScienceEncina Hall West, Room 100616 Serra StreetStanford, CA [email protected]
Joseph H. FelterHoover Institution434 Galvez MallStanford UniversityStanford, CA [email protected]
Radha K. IyengarLondon School of EconomicsDepartment of EconomicsHoughton StLondonWC2A 2AEUnited Kingdomand [email protected]
Jacob N. ShapiroWoodrow Wilson School of Public Policyand International AffairsPrinceton UniversityRobertson HallPrinceton, NJ [email protected]

2 of 85
Introduction
Civilian casualties are a tragic reality of counter-insurgency campaigns. Recent policy debates
have arisen about the degree of risk commanders of counterinsurgency forces should assume in
an effort to protect civilians from harm. The discussion on the impact of civilian casualties has
also fed the growing concern that counterinsurgent forces bear the cost for civilian casualties
even when they are caused by insurgent groups.2 These debates center on an empirical question:
do higher civilian casualties increase insurgent violence? If they do, then in addition to moral
and legal concerns, there may be military strategic value in reducing civilian casualties.
Underlying both issues is a set of theories as to how insurgents are able to mobilize the
population and produce violence. The most common is that violence committed by
counterinsurgent forces generates resentment and antipathy that enable political violence by
angering the population and encouraging insurgent recruitment. This hypotheses merits testing as
there is no a priori reason to expect violence against civilians would have an angering effect, as
opposed to intimidating the population into quiescence (Birtle 2008).
Understanding which factors enable insurgent groups to motivate people to fight is
critical on two fronts. First, quantifying the relationship between civilian causalities and violence
is necessary in developing policies governing the use of force. For example, often when
planning military operations, commanders are forced to choose how much risk their own troops
should accept in an effort to avert civilian injury or death. Second, civilian casualties make it
possible to identify the role different factors play in mobilizing support for insurgent violence,
2 In Afghanistan, the conventional wisdom on this question is summed up by the chief spokesman for the International Security Assistance Force (ISAF), U.S. Army Colonel Wayne Shanks: “When the Taliban blow up a bunch of people, you don't see a lot of protest. But when we screw up and accidentally kill somebody, you get riots in the streets.” Quoted in Wood (2010).

3 of 85
which can inform debates about how the international community can best help provide security,
development, and governance in conflict environments.
This study analyzes the impact of civilian casualties on insurgent violence in the conflict
in Afghanistan using micro-level, geocoded data on civilian casualties and violence between
International Security Assistance Force (ISAF) units and insurgents. We use a series of analytic
comparisons to distinguish between four prominent theories on the how civilian casualties may
affect violence: revenge, propoganda, population-provided information, and insurgent group
capacity. Separating out levels of future violence from long-run trends (using a 3-month period
moving average) allows us to distinguish the short-run ‘information’ and ‘capacity’ effects from
the longer run ‘‘propaganda’ and ‘revenge’ effects. Examining differences in the impact of
events that kill women and children from those that kill men allows us to separate the
‘information’ and ‘capacity’ effects. Studying how local responses to nearby civilian casualties
differ from local response to civilians casualties in other parts of the country helps disentangle
the ‘propoganda’ and ‘revenge’ effects.
To conduct our analysis, we linked ISAF reports on violent incidents in Afghanistan with
civilian casualty data from the ISAF Civilian Casualty Tracking Cell (CCTC) aggregated to the
district bi-month level.3 Overall there is a positive relationship between civilian casualties and
levels of future violence in an area. Using a matched sample, we find that if the average ISAF-
caused incident, which resulted in 2 civilian casualties, was eliminated, then in an average-sized
district there would be 6 fewer violent incidents between ISAF and insurgents (i.e., SIGACTs)
over the next 6 weeks. The relationship is somewhat asymmetric, larger for ISAF than insurgent,
3 Incident data from the from the ISAF Combined Information Data Network Exchange (CIDNE) database include unclassified fields such as date, time, location, and type of attack.

4 of 85
but weakly positive regardless of which side – ISAF or insurgents – is responsible for the civilian
casualties.
While we find a robust relationship between civilian casualties and long-run trends in
IED incidents, there is little evidence of a short-run effect, suggesting the information and
capacity mechanisms are not substantial drivers of the response to civilian casualties in
Afghanistan. Instead, the data are consistent with the claim that civilian casualties are affecting
future violence through increased recruitment into insurgent groups after a civilian casualty
incident. Local exposure to violence from ISAF appears to be the primary driver of this effect.
Given the frequent comparisons made between Iraq and Afghanistan and the importance
of externally validating our results, we conduct a parallel analysis on civilian casualty and
violence data from Iraq. The differences between the consequences of civilian casualties across
these conflicts provide valuable inferential insight into the processes underlying the production
of violence by insurgents. In Iraq, we find no evidence that civilian casualties affect long-run
trends in violence. Considered alongside Condra and Shapiro’s (2010) finding that civilian
casualties in Iraq have a short-run, symmetric effect, this suggests that insurgents face
fundamentally different constraints in these two conflicts. In Iraq, the evidence suggests
insurgents face an information constraint: when Coalition forces kill civilians and people respond
by sharing less information with counterinsurgents, there is a short-run increase in violence. In
Afghanistan, the evidence suggests insurgents face a labor constraint: when ISAF units kill
civilians, this increases the number of willing combatants, leading to an increase in insurgent
attacks.
The remainder of the paper proceeds as follows. Section one outlines the mechanisms
that have been identified for connections between civilian casualties and insurgency in

5 of 85
Afghanistan. Section two describes our data on insurgency and civilian casualties in Afghanistan.
Section three analyzes the Afghanistan data in detail, providing short-term and long-term results.
Section four replicates the empirical approach on data from Iraq, showing that the dynamics of
the two conflicts are quite different, at least in the long run, and suggesting possible reasons for
the disparity in the results. Section five concludes by detailing the implications of our findings
for research and ongoing policy debates.
1. MECHANISMS LINKING CIVILIAN CASUALTIES AND INSURGENT VIOLENCE
Anecdotally, civilian casualties are routinely associated with higher Taliban recruitment and
violence.4 Some commanders and those responsible for formulating rules of engagement (ROE)
feel that reducing harm to civilians during battlefield operations, while risky, is nevertheless
necessary for purposes of gaining the support of the local population. Despite the current support
for the need to limit violence against civilians, there has been relatively little systematic analysis
on how civilian casualties influence insurgent violence.
To frame the discussion suppose that insurgents’ production of violence at any point in
time requires two inputs: labor, l, and organizational capital, , which captures a range of factors
including monetary resources, weaponry, and organizational infrastructure. The production of
violence is restricted by the ability of counterinsurgents to attack the group, destroying a portion
of its production. Counterinsurgents capacity to attack is a function of their force levels as a
proportion of the total population, f, and the amount of tactically-relevant information—the
location of weapons caches, identities of insurgents, and the like—shared by the population, i.
The more information is shared, the more efficiently counterinsurgents can capture/kill
4 See, e.g., Nadery and Humayoon (2008).

6 of 85
insurgents and defend their installations. Assuming insurgents produce at capacity, total violence
produced in any period can be represented with the following Cobb-Douglas production function
1 ,
where , with i =1 implying that all tactically relevant information is shared.5
It is trivially apparent that actions which increase l by enhancing insurgent recruiting will
increase violence. Actions which decrease —killing key leaders or raiding weapons caches—
will decrease violence, and that actions which increase (decrease) i will decrease (increase)
violence. What is more interesting is the effect of force size on violence. As f gets large, the
increase in violence from a positive shock to insurgent labor or capacity gets smaller, ,
0, while the decrease in violence from an increase in information, ,
0, gets larger. The implication is that, on average, we should expect insurgent
violence in Afghanistan to be more sensitive to labor or capacity shocks than in Iraq, where force
levels were much higher. Symmetrically, we should expect insurgent violence in Iraq to be much
more sensitive to shocks to information provision.
The existing policy and academic literatures identify three mechanisms by which civilian
casualties and violence would influence violence in this simple setting. We term these effects:
“revenge”, “propaganda”, and “information” effects. A fourth mechanism that has not been
much discussed complicates efforts to study the issue, what we call the “capacity” effect. We
discuss each of these in turn.
First, civilians might be driven to participate in violence, increasing l, after
Coalition/ISAF civilian casualties out of a desire to avenge specific harm to family, friends, or
5 See Hanson, Iyengar, and Monten (2009) for an explicit analysis of insurgent substitution between capital and labor in the production of violence. For the comparative statics that interest us what matters is that insurgents are at the production frontier before the shock, and so that regardless of the reallocation following a negative labor or capital shock, there will be less violence.
f ,i [0,1]

7 of 85
neighbors; what we call the ‘revenge effect’. Notice that this mechanism encompasses arguments
that the social traditions of the Pashtun ethnic group, which dominates the Taliban and other
Islamic extremist groups in the Afghanistan-Pakistan border region, are a key factor in
supporting the insurgency. Johnson and Mason (2008) argue, for example, that the Pashtun social
code (Pashtunwali) places a high value on personal revenge. “If a Pashtun man is dishonored, he
must avenge that dishonor “or he will lose face and social status to the point of becoming an
outcast” (Johnson and Mason 2008, 63).6 If this is correct, then any revenge effect should be
both (1) concentrated in Pashtun areas where social norms create strong incentives and (2) highly
localized. Stepping away from our stylized model, we also expect the revenge mechanism to lead
to increasing long-run trends in violence as it takes some time to integrate new fighters into
insurgent units.
Second, we could see heightened violence in areas that sustain civilian casualties if
casualties make people angrier and more easily recruited by insurgent groups, what we call the
‘propaganda effect’. This commonly cited concern matches the conventional wisdom among
journalists, soldiers, and policymakers that civilian casualties are used by insurgent groups as a
recruitment tool.7 During his June 2009 testimony before the U.S. Senate Armed Services
Committee prior to being confirmed as Commander of ISAF and US Forces in Afghanistan,
General Stanley McChrystal talked about how civilian casualties affect popular perception and
behavior. “I would emphasize that how we conduct operations is vital to success….This is a
6 See also Gutman (2010): “To a great extent, though, the Taliban remain motivated by revenge. The massacre in 2001 of hundreds, perhaps thousands, of Taliban detainees at the hands of an Uzbek warlord in northern Afghanistan still motivates Taliban to fight. ‘That massacre was the base or foundation for all the fighting that is now going on,’ [Vahid] Mojdeh [former Taliban foreign ministry official] said. The senior ISAF general agreed the massacre was ‘absolutely’ a recruiting tool for the Taliban. ‘Those kinds of things thicken the hatred and cause more people to join.’” 7 For example, Michael O’Hanlon, of the Brookings Institution, says, “It is certainly the consensus view among NATO intelligence that the inadvertent killing of civilians is one of the two or three things, along with corruption and favoritism perhaps, that most help the Taliban in recruiting.” Quoted in Pleming (2010).

8 of 85
struggle for the support of the Afghan people. Our willingness to operate in ways that minimize
casualties or damage, even when doing so makes our task more difficult, is essential to our
credibility.”8 U.S. Secretary of Defense, Robert Gates, expressed the same opinion before
Congress. “But I will tell you that I believe that the civilian casualties are doing us enormous
harm in Afghanistan, and we have got to do better in terms of avoiding casualties. And I say that
knowing full well that the Taliban mingle among the people, use them as barriers. But when we
go ahead and attack, we play right into their hands.”9
The propaganda mechanism differs from the revenge one in that it does not require local
exposure to civilian casualties in order to boost insurgent recruitment. Instead, recruitment
increases because civilian casualties create a feeling of antipathy toward the national government
and Coalition/ISAF forces, which promotes involvement in insurgent organizations. Thus the
propaganda mechanism suggests civilian casualties even outside the immediate neighborhood
should lead to increased insurgent violence.
Third, civilian casualties might affect levels of future violence if casualties affect the
level of civilian cooperation with ISAF and government units, i, what we term the ‘information
effect’. Insurgent operations such as planting IEDs, setting ambushes, and training inevitably
reveal information to non-combatants. This information is key for counterinsurgents as
government forces and their allies have an overwhelming advantage in combat power but often
lack information about insurgents’ identity and whereabouts. When ISAF forces kill civilians,
the local population may be angered or perceive a greater threat to their physical security from
ISAF and consequently share less information with them. In contrast, when insurgents kill
8 Congress, Senate, Committee on Armed Services, Hearing to Consider Nominations, 111th Cong., 1st sess., 2 June 2009, 11. 9 Congress, Senate, Committee on Armed Services, Hearing to Receive Testimony on the Challenges Facing the Department of Defense, 111th Cong., 1st sess., 27 January 2009, 21.
9 of 85
civilians, the local population may choose to share more information with US forces, meaning
insurgents are less able to produce violence in subsequent periods.10 The information
mechanism suggests we should see a short-run, symmetric reaction to civilian casualties as
information on insurgents’ whereabouts and weapons caches can have an immediate impact on
violence by enabling raids that substantially reduce insurgent capabilities.
Fourth, there may be a mechanical correlation between civilian casualties and insurgent
capacity, c, what we term the ‘capacity effect’. If ISAF soldiers are more likely to employ force
in ways that have a high potential to cause civilian casualties when the target is particularly
valuable from a counterinsurgency perspective (as their rules of engagement suggest they
should), then we should see ISAF-generated casualties associated with a drop in insurgent
violence, at least in the short term (which we will define as two weeks or less).11 We would
expect this capacity effect to be relatively short-term as a successful attack on a high-value target
should result in an immediate loss of organizational capacity for insurgents. In the long-run
(which we will define as between 2 and 3 months), insurgent capacity can be replenished as
leadership and supplies are replaced, confining the capacity effect to the short-run. The capacity
effect can thus be thought of as impacting the short-run ability of insurgent groups to plan and
execute specific activities but, assuming some ability to reallocate men and materiel across
districts, will not affect the long-run output of the groups.
In this study we present a series of comparisons between different models to distinguish
these four theories. Table 1 presents some basic expectations for each mechanism: revenge,
propaganda, information, and capacity. We test these expectations in several ways: comparing
short-run fluctuations with long-run trends; comparing the effects within an area to those in
10 See Condra and Shapiro (2010) for more complete discussion of this argument. 11 In the longer term insurgents might be able to move additional weapons and personnel into an area to make up some portion of the lost capacity.

10 of 85
neighboring areas; and comparing the effect between men and women. By analyzing data at
different levels of temporal aggregation we separate the short-run ‘information’ and ‘capacity’
effects from the longer run ‘recruiting’ and ‘propaganda’ effects. By examining differences in
the impact of events that kill women and children from those that kill men, we resolve the
‘information’ and ‘capacity’ effects. By studying how local responses to local violence against
civilians differ from local response to violence against civilians in other parts of the country we
separate the ‘recruiting’ from the ‘propaganda’ effects.
[INSERT TABLE 1 ABOUT HERE.]
2. DATA AND DESCRIPTIVE STATISTICS FROM AFGHANISTAN
2.1 Data Summary
The data on civilian casualties we use were collected by ISAF’s Civilian Casualty Tracking Cell
(CCTC). When ISAF units are involved in incidents in which civilians are wounded or killed, the
unit makes a series of reports on the specifics of the incident to ISAF HQ.12 The CCTC reviews
these reports and collects data on civilian casualties that occur at the hands of insurgents and
ISAF forces. The CCTC data are culled of any casualties involving people with ambiguous
combatant status under the Law of Armed Conflict, including Afghan government personnel,
12 When an event involving a civilian casualty event occurs, the patrol unit submits a First Information Report (FIR) within 4 hours of the event via radio to the Regional Command. The unit submits a Second Information Report (SIR) within 24 hours of the incident. The SIR contains more information about the incident than was included in the FIR, including any media assessment, the cause(s) of the incident, whether key leaders were engaged or solatia (compensation) was paid, etc. If the incident resulted in wounded civilians, the incident reporting is concluded at this point (though, if civilians involved in the incident later die, the incident is re-opened). If the incident resulted in civilian death, another report is submitted within 72 hours called an Investigation Information Report (IRR). This final incident report is sent to the Legal Adviser at ISAF HQ who makes recommendations to COM-ISAF on any further steps that should be taken to address the situation.

11 of 85
interpreters, security guards, and contractors. The CCTC cross-checks its data against media
reports for completeness.
These data include the perpetrator (ISAF, insurgents, other, or unknown), the type of
weapons used by ISAF and insurgents, the nationality of any ISAF units involved, and the
number of killed and wounded in three categories, men, women, and children. We aggregate
these data to the district-bimonth level from January 2009 through March 2010.13 These data
contain 4,077 civilian casualties from 2,118 incidents, 10 percent of which involve women and
children.
In that 15 month period there were 10.5 confirmed civilian casualties per day on average.
While most of the civilian casualties are caused by insurgents, an equal number of women or
children are killed by both insurgents and ISAF. This means that as a proportion of all civilian
casualties, ISAF kills or injures more women and/or children.14
As a measure of combat occurring between ISAF units and insurgents we use incident
reports submitted by ISAF forces, commonly known as ‘significant activity’ or SIGACT reports.
Unclassified data on 24,937 separate incidents drawn from the ISAF Joint Command (IJC)
CIDNE Database provide the location, date, time of incidents in various categories which we
combine into six major categories: direct fire, indirect fire, IED explosions, IEDs found and
cleared, IED hoaxes, and premature detonations. We analyzed the impact of civilian casualties
on the sum of all these categories and also focus in on just the direct fire and IED attacks (this
latter category is the sum of IED explosions, IEDs found and cleared, and IED hoaxes), as they
13 Although data on civilian casualties was collected by the Civilian Casualty Tracking Cell since about September 2007, between September 2007 and June 2008 there is data only on Afghan civilians killed by ISAF. Injuries and not-ISAF-generated-civilian casualties are not included. Beginning in July 2008 the CCTC tracks non-ISAF and injuries but the data consistency and fidelity are not verifiable until about January 2009. 14 This can be at least partially explained by the fact that insurgents live and operate among the population which greatly increases the risk to civilians during counterinsurgency operations.

12 of 85
make up the vast majority of the incidents. We created a bimonthly panel dataset at the district-
level using these incident data over the period for which we have corresponding data on civilian
casualties (January 2009 through March 2010).
To facilitate cross-district comparisons we scaled the counts of civilian casualties and
total incidents by the population multiplied by 1000. Scaling by population is not trivial in the
Afghan context where there has not been a population census in nearly 30 years. There are
generally three available data sources for population: the Afghan Central Statistics Office (CSO)
estimates based on surveys and a village census, the Gridded Population of the World (GPW)
data, and the LandScan population data. We determined the LandScan data were the most
reliable as they are gridded at a higher resolution than GPW and the CSO population data do not
include population on villages larger than 5,000. The LandScan data (2008) comprise worldwide
population estimates for every cell of a 30" X 30" latitude/longitude grid. Population counts are
apportioned to each grid cell based on an algorithm which takes into account proximity to roads,
slope, land cover, nighttime illumination, and other information.15
2.2 Descriptive Statistics
As a starting point we examined how civilian casualties and insurgent violence are distributed
across space in Afghanistan; and what kind of weapons were used in incidents which result in
civilian casualties.
Both combat and civilian casualties tend to be concentrated in specific districts, mostly in
the Regional Command East and Regional Command South areas as illustrated in the map in
Figure 1. This map combines two important sets of data. The districts are color coded on a
sliding scale according to the number of SIGACTs reported (per 1000 people). The size of the 15 Full details on the LandScan population data are available at http://www.ornl.gov/sci/landscan/.

13 of 85
circle in each district reflects the number of civilians killed or wounded (per 1000 people) during
the period under study. As expected, in most cases the most violent districts are also those that
report the highest number of civilian casualties. This is likely because these areas are where there
is the most combat and the greatest troop presence. There are, however, areas in the east of the
country with high levels of combat and low civilian casualties and areas south of Kabul, near
Khost and Jalalabad, with high civilian casualties and low levels of combat.
[INSERT FIGURE 1 ABOUT HERE]
Figure 1 does not show the degree of variation in the number and the nature of civilian
casualties over time. Time trends in standardized units are shown in Figure 2. This scaling
highlights the fact that there is much greater week-to-week fluctuation in civilian casualties than
in insurgent violence. This degree of volatility suggests that the number of civilians killed or
injured in any given week is quasi-random with respect to long-run trends in violence. As Figure
2 shows, this is more likely to be true for the lower levels of ISAF-generated civilian casualties
than the more persistent, higher level of insurgent caused civilian casualties.
This difference in volatility between insurgent attacks and civilian casualty levels forms
the basis of our causal identification strategy. The key assumption is that within a short to
medium time span of a civilian casualty, conditional on other determinants of long-run trends,
the change in violence is due to the causal effect of civilian casualties. The volatility of the
civilian casualties’ time series makes the causal interpretation of estimates from a simple linear
specification reasonable. If the number of individuals killed depends largely on a stochastic
process uncorrelated with other determinants of violent activity—once we control adequately for
factors affecting the long-run trends in insurgent violence—then a first-difference or lag-
dependent variable specification can identify the effect of civilian casualties on security and

14 of 85
stability, as measured by SIGACTs. The validity of this identifying assumption is easily assessed
with a “placebo test” that places the lead of civilian casualties on the RHS.16
[INSERT FIGURE 2 ABOUT HERE]
It is important to note that the vast majority of ISAF recorded civilian casualties are
generated by insurgents, although such a distinction may not matter in terms of public perception
or support. From January 2009 through March 2010, over 86 percent of civilian casualties were
perpetrated by insurgents. In addition, there is an order of magnitude more casualties of men than
of women and children.
Figure 3 breaks down the trends in attacks and civilian casualties for 9 prominent
majority-Pashtun provinces. There is no obvious correlation between civilian casualties and
attacks. In Kandahar, there appears to be an increase in both time-series in the middle of our data
(Fall 2009). In Khost, by contrast, a number of months with significant numbers of civilian
casualties in Spring and Summer 2009 do not appear to have changed the long-term trends in
violence. Breaking the data down in this way suggests that as we move to lower levels of
geographic aggregation, we are more likely to be able to get solid identification from the random
component of the civilian casualty time-series.
[INSERT FIGURE 3 ABOUT HERE]
Figure 4 shows the rough distribution of civilian casualties by event type and party
responsible for males and women and children. Most civilian casualties for which insurgents are
responsible are generated by IED attacks (60 %), with the other two predominant forms of
violence being indirect fire (IDF) and direct fire (DF). Civilian casualties generated by ISAF
forces, on the other hand, are more evenly distributed. Direct fire accounts for 21 percent of
women and children casualties and indirect fire accounts for 35 percent. Escalation of force 16 We present the results of this test for our core specifications in Appendix Tables 4 and 5.

15 of 85
(EOF) accounts for 11 percent.17 Despite the negative publicity they receive, air strikes account
for only about 6 percent of casualties, a little less than a third that of road and traffic incidents,
which account for over 16 percent of casualties of women or children.
Because we wish to compare Iraq and Afghanistan, we also include Table 2 which
provides descriptive statistics for the core variables in Iraq and Afghanistan. There are two
important things to note here. First, the insurgency was roughly twice as violent on a per-capita
basis in Iraq. In both countries insurgent violence was highly concentrated but the overall
intensity was substantially higher in Iraq. Second, the risk to civilians from combat in Iraq quite
different than it is in Afghanistan. Coalition forces killed roughly the same number of civilians
per attack in Afghanistan, about one in every 40 attacks. However, insurgents kill roughly four
times as many civilians per attack in Afghanistan, roughly one in every 4 attacks in Afghanistan
vs. one in every 20 attacks in Iraq.18
[INSERT TABLE 2 ABOUT HERE.]
3. WHAT WE KNOW FROM AFGHANISTAN
We begin analyzing the relationship between civilian casualties and insurgent violence in
Afghanistan by using the substantial randomness in the number of civilians killed to estimate the
impact of violence against civilians. We then turn to a more sophisticated matching approach to
capture the sources of unobserved heterogeneity in motivations to mistreat civilians.
17 “Escalation of Force” incidents typically involve ambiguous situations when convoys or checkpoints are approached by unknown vehicles or individuals on foot. In such situations, there are a series of steps soldiers are trained to take to make the person stop if they are deemed to be a threat. The steps involve verbal and visual warnings, non-lethal force, and then finally lethal actions. 18 Note these comparisons exclude the sectarian violence in Iraq.

16 of 85
3.1 Estimating a Short-Run relationship between Civilian Casualties and Violence
Our initial estimation studies the relationship between total incidents (SIGACTs) and civilian
casualties caused by either ISAF or insurgents. The unit of analysis is a district bi-month. In
Table 3, we predict the relationship between total incidents in a given period and civilian
casualties from the previous 4 periods (8 weeks). The estimation relies on an event-study design
where the number of women and children killed at time t is assumed to be uncorrelated with
violence in period t+1 when controlling for district and month-year fixed effects as well as the
level of violence in period t. We estimate the following model:
∑ ∑ (1)
In equation (1), SIGACT is the total number of incidents per 1000 people in a district at
time t, and similarly for IED attacks and direct fire attacks in columns (3) and (5) respectively.
IEDs are a particularly relevant category of violent incident for our analysis. Unlike other
categories, IEDs are initiated almost completely by insurgents; the only ISAF behavior that
contributes to them is the frequency of patrols. Direct fire incidents, by contrast, can occur either
because insurgents initiate contact or because ISAF forces are engaged in raids and offensive
actions. IED attacks therefore represent the cleanest measure we have of how insurgent violence
responds to civilian casualties.
The core specification includes current and 4 lagged periods of civilian casualties
separated into ISAF responsible civilian casualties (CivCasISAF) and insurgent responsible
civilian casualties (CivCasINS). We include district fixed effects ( ) and month-year fixed effects
( ), as well. This approach is designed to test whether the cumulative impact of civilian
casualties on insurgent violence is positive.
[INSERT TABLE 3 ABOUT HERE]

17 of 85
At first glance in this specification we find a positive effect on violence for ISAF and
insurgent responsible civilian casualties, though the effect is clearly stronger for insurgent-
caused casualties. To formally test whether past civilian casualties affect current violence we
conduct a joint significance test on the sum of the lagged coefficients. We can reject the null of a
jointly zero impact of past ISAF-caused civilian casualties on current violence at the 95%
confidence level for IED attacks, and for insurgent-caused civilian casualties we can reject the
null for total SIGACTs.
Recall that the identification strategy relies on properly specifying the long-run
determinants of violence. Therefore, a concern with this core specification is that if increased
civilian casualty rates are associated with trends in levels of combat that change over time, say as
insurgents and counterinsurgents move their forces to different areas for military advantage, then
the fixed effect will not fully control for future determinants of combat. A simple dependent
variable lag may be inappropriate to control for underlying trends in violence as it will control
for both the long-run trend in violence and the short-term fluctuations. Because the primary
potential weakness in the identifying assumption comes from the long-run trend, we include a 3-
period (6 week) lagged moving average in columns (2), (4), and (6). The three period moving
average is estimated as . Including this moving average of violent
incidents in the fixed effects specification controls for long-run trends in violence, thus allowing
us to identify the variation generated by short-run, high frequency events. If our results are being
generated by the impact of civilian casualties on the short-run variation in violence, including the
lagged moving average should not alter our results.
Columns (2), (4), and (6) of table 3 show that controlling for the moving average
eliminates any significant positive effect of past civilian casualties on insurgent violence. The

18 of 85
joint test on the sum of the lagged civilian casualty coefficients is insignificant in all the models
once we include the lagged moving average of insurgent violence. This is consistent with civilian
casualties operating on more long-run trends, rather than short-run effects. This is more
consistent with the long-run mechanism such as propaganda or revenge, rather than the
mechanisms we would expect to affect short-run fluctuations such as information or capacity.
Once we control for the lagged moving average, the core model passes a “placebo” test
so that the lead of civilian casualties for ISAF-generated casualties does not predict violence.19
However, the lead of insurgent-generated civilian casualties does predict violence which
suggests we should still be concerned with reverse-causality for results that relate future violence
to insurgent triggered incidents. We have greater confidence in the relationship for ISAF-
initiated events.
In interpreting these results it is useful to recall that our identifying assumption is that
realized level of civilian casualties has a substantial random component after we control for the
systematic component that is driven by levels of combat. Figure 2 certainly suggests this
assumption is correct but a more formal way to assess it is to compare how much of the variance
in different kinds of violence is accounted for by our core controls.20 If our identifying
assumption is met, then we would expect district fixed effects, month fixed effects, and the
lagged moving average of attacks to explain a great deal of the variance in attacks, a small
amount of the variance in the number of civilian casualty incidents, and an even smaller amount
of the variance in the number of civilian casualties. Table 4 shows the proportion of variance in
key variables explained by different controls. It is quite clear that variables which control for a
substantial portion of the variance in the intensity of combat explain very little of the variance in
19 Appendix table 4, column 1 presents results for ISAF-generated casualties and column 2 for insurgent generated casualties. 20 We thank Eli Berman for suggesting this diagnostic.

19 of 85
the number of civilian casualty incidents and even less of the variance in levels of civilian
casualties.
[INSERT TABLE 4 ABOUT HERE]
3.2 Estimating a Long-Run relationship between Civilian Casualties and Violence
As described above, civilian casualties may affect two different components of violence: long-
run trends and/or short-run fluctuations. Table 2 shows that the long-run trends in violence,
estimated by the 3-period moving average, are not substantially less volatile then the period-to-
period rate. Any ability to predict long-run trends is therefore unlikely to be an artifact of their
reduced volatility. The distinction between short-term fluctuations and long-term trends is,
however, valuable for distinguishing mechanisms through which civilian casualties may affect
insurgent violence.
In particular, the long-run trends are more likely influenced by recruitment and
population disaffection than more rapid changes in information and intelligence. Given this
assumption, we estimate the relationship between civilian casualties and proxies for long-run
trends and short-run fluctuations. To measure long-run trends, we estimate a three-period (six-
week) moving average. We then estimate the relationship of current and lagged civilian
casualties on the future 3-period moving average, . Table 5
presents the results from regressions with the lead moving average of different kinds of violent
incidents as dependent variables.21
[INSERT TABLE 5 ABOUT HERE]
21 All regressions in table 5 contain the spatial lag of the dependent variable to control for spatial auto-correlation.

20 of 85
ISAF-generated civilian casualties predict an increase in violence for the following 2
months, and this effect is driven largely by IED attacks, as shown in column 5. We prefer the
IED specification because we hypothesize that IED incidents are a cleaner measure of insurgent
imitated violence, while other forms of attack can be responsive to ISAF activities. The results in
column (5) suggest that ISAF-generated civilian casualties are associated with a substantively
and statistically large increase in attacks. An incident which results in 10 civilian casualties will
generate about 1 additional IED attack in the following 2 months. The effect for insurgent
activity dependent civilian casualties is much weaker and not jointly significant.
We can also test if the volatility of the insurgent attacks time series is affected by civilian
casualties. To do this, we estimated the effect of civilian casualties on the mean 3-period
absolute deviation of insurgent attacks. To do this, we estimated the absolute deviation for three
periods: for n= 1, 2, 3. We then used mean absolute deviation over three
periods as the dependent variable: . The results for all violent
incidents are presented in column (2) and the results for IED attacks are presented in column (6).
Again we focused on IED attacks which appear largely unaffected by civilian casualties. In
general, the coefficients are both small in magnitude and insignificant.
The results from Table 3 and Table 5 present a consistent story; civilian casualties do not
appear to affect the short-run fluctuations in violence but do impact the long-run trends. This
relationship largely rules out the short-run mechanisms of information and capacity. Because
these short-run effects are expected to operate in opposite directions for ISAF-generated civilian
casualties—the information mechanism predicts ISAF-generated casualties predict increased
violence and the capacity mechanism predicts the opposite—we tested the extent to which
reaction to ISAF-generated casualties differs by the gender of the civilians killed or injured. The

21 of 85
underlying assumption for these opposing effects is that the capacity effect should be more
pronounced when ISAF soldiers kill male civilians and the revenge effect should be more
pronounced when ISAF soldiers kill women and children. We find no significant short-run effect
when controlling for the lagged moving average regardless of the gender or age of the civilian
casualty. 22
It appears that the two long-run mechanisms, propaganda and revenge, are more
consistent with the data. We can distinguish these as the revenge mechanism relies on personal
exposure to violence whereas the propaganda effect depends only on violence against a relevant
peer group, implying the relationship between violent incidents and civilian casualties in
surrounding districts is informative. If the effect of civilian casualties is to increase violence via
increased ability to recruit, then the relationship between civilian casualties and violence should
spill over to nearby districts. On the other hand, if the increase in violence after a civilian
casualty is driven by locality-specific motivations for revenge, it should be more localized. The
impact of the spatial lag of civilian casualties is presented in columns (3) and (7) for all violent
incidents and IED incidents respectively. Clearly the positive impact of ISAF-caused casualties
is being driven by local exposure to violence.
This is supported by analysis comparing Pashtun and non-Pashtun areas. As Table 2
shows, Pashtun and mixed areas appear to have much more combat and much higher rates of
civilian casualties. Table 6 presents the results by Pashtun and non-Pashtun areas. In particular, it
appears the anti-ISAF reaction is driven almost entirely by behavior in Pashtun areas.23 The
analysis indicates that the neighboring districts effect is much smaller than the in-district one
when ISAF is responsible for civilian casualties. This is consistent with a strong revenge
22 Results by gender are presented in Appendix Table 3. 23 This result is consistent with Johnson and Mason’s (2008) argument about the centrality of Pashtun social norms in creating strong incentives for taking up arms to avenge civilian casualties caused by international forces.

22 of 85
mechanism in which ISAF-generated civilian casualties increase participation and support for
insurgent activity because of personal loss or exposure to violence. If revenge is the motivating
factor, we expect a null result on the spatial lag, since revenge is triggered when family and
friends are killed – which is most likely to occur within one’s own district, not in neighboring
areas.
While it appears that insurgent-caused civilian casualties in neighboring districts might
also have a weak effect on violent incidents in a district, the effect is substantively and
statistically small and out-of-district insurgent-generated civilian casualties fail the “placebo
test”.
In summary, the relationship between civilian casualties and violent incidents in
Afghanistan is characterized by three important facts:
(1) There is a positive relationship between civilian casualties and levels of future violence in
an area and that relationship is much stronger for ISAF-caused civilian casualties.
(2) Civilian casualties affect the long-run trends in violence, not short-term fluctuations.
(3) The relationship between civilian casualties and violence does not appear to spill over
district boundaries.
We do not find evidence of significant short run effects, casting doubt on the possibility that
either the information or the capacity mechanisms are driving behavior. Instead, the data are
consistent with the claim that civilian casualties are affecting future violence primarily through
the revenge mechanism.24
3.3 Matched Sample Estimates of the Relationship between Civilian Casualties and Violence
24 Appendix Tables 1-8 present more complete results of the model specifications and robustness checks for Afghanistan discussed in this section.

23 of 85
An alternative approach to estimating the causal effect of civilian casualties on subsequent
violence is to compare outcomes across district/bi-months that are matched on factors
influencing the propensity of both sides to kill civilians. In previous sections we showed that
civilian casualties predict the long-run trends in violence, but we could not rule out reverse-
causality for insurgent-generated casualties. If it is the case the trends in violence predict the
propensity of both sides to harm civilian casualties, but the realized level is largely random, then
if we match on those long-run trends we can treat the particular occurrence of civilian casualties
as quasi-random, potentially providing a more robust solution to omitted variable bias than the
parametric approach applied above. Many of the factors which affect both violence and civilian
casualties are unobservable but are likely captured in the long-run trends in violence over past
weeks, the history of violence through time t in district i. If we look at the set of units that
experienced similar levels of violence in the past—say t-6 through t—during similar time
periods—quarters—and are of similar ethnic mix—Pashtun, mixed, or non-Pashtun, then we
expect ISAF and insurgent forces operating in those districts/bi-months to face similar incentives
regarding the use of force and level of care taken to avoid civilian casualties.
This expectation suggests a simple analytical path: 25 (1) use a matching algorithm to
identify district/bi-months with similar histories; (2) within each stratum use a simple bivariate
regression model to estimate the relationship between the number of civilians killed today and
the average rate of attacks in the next 3 periods (the same long-run trend analyzed above); and
(3) take the average of these results weighting by the size of the strata. The resulting estimate
provides the average treatment effect for district/bi-months that experience any history of
violence represented in the set of strata used at step (2).
25 Condra and Shapiro (2010) apply this approach to studying the impact of civilian casualties on insurgent violence in Iraq.

24 of 85
We matched district/bi-months using the Coarsened Exact Matching (CEM) algorithm
implemented in the cem package for Stata (Iacus, King, and Porro 2008). The procedure is
simple. First, we coarsen the data on each matching variable so that it falls into meaningful bins,
just as one would when constructing a histogram. Second, perform exact matching on the
coarsened data so that all district/bi-months with roughly the same history are placed in a
common stratum. This procedure has a variety of desirable properties relative to more
commonly-used methods such as propensity score matching, including reduced model
dependence and ease of use for matching on continuous variables.26 Our matching solution uses
current incidents per 1,000 population, the lagged moving average of incidents in the previous
three periods, three lags of that moving average, the quarter, and the district ethnicity. For
current incidents and the lags we use the 10th, 33rd, 66th, and 90th percentiles of the variables as
the cut-points between bins. The intuition for this choice is that places with very high or very low
violence are fundamentally different than areas with moderate levels of violence.27 For ethnicity
we code districts as Pashtun if greater than 66% of their area is coded as Pashtun, as non-Pashtun
if greater than 66% of their area is a single non-Pashtun ethnicity, and as mixed otherwise.
This analytical approach is justified by the assumption that matching long-run trends in
past insurgent violence, ethnicity, and time effectively controls for characteristics impacting the
propensity of actors to kill civilians. The results are summarized in Figure 5 which plots the
marginal effect of civilian casualties in period 0 on the 3-week moving average of incidents in
periods t to t+2. The x-axis in each plot is the number of weeks before or after the period in
which civilian casualties occur, period t. The y-axis in the top plot is the average marginal effect 26 See Iacus, King, and Porro (2008) for a detailed comparison of CEM to other matching techniques. 27 The challenge in doing this matching is to coarsen the data so that in matched strata there is zero contemporaneous correlation (or close to it) between insurgent attacks and civilian killings—i.e. within matched strata civilian killings are uncorrelated with insurgent violence—without matching so finely that there are too few district/bi-months in each history. Full replication code available from the authors.

25 of 85
of ISAF civilian killings in time 0 on the moving average of SIGACTs/1000 population. The y-
axis in the bottom plot is the average marginal effect of insurgent civilian killings for the same
sample. We estimate the mean of the marginal effects for each strata, weighting by strata size
and providing the 95% confidence interval around the mean.28
[INSERT FIGURE 5 ABOUT HERE]
If our procedure matched effectively and there is no causal impact of past insurgent
attacks against Coalition forces on current civilian casualties within matched strata, then these
differences will be close to zero through period t and will then spike up (or down) for at least one
period after week t reflecting the effect of killing civilians. These plots confirm that our matching
exercise effectively controls for selection on unobservable characteristics. Greater violence
against civilians by ISAF predicted higher levels of attacks, while greater violence by insurgents
has no such effect. These plots also show that the effect of ISAF caused casualties is enduring,
peaking 14 weeks after the event. This validates our hypothesis that civilian casualties by ISAF
forces predict greater violence through a long-run effect. The effect of insurgent- caused civilian
casualties is statistically insignificant.29 As we would expect from table 6, this result is driven
almost entirely by Pashtun areas. Appendix figure A1 shows the same matching solution for
Pashtun areas, the pattern is almost the same as for the entire country.
28 Appendix Table 9 provides estimates and confidence intervals for this matching exercise. 29 Results of the average marginal effect of killing one additional civilian are show in the appendix. The coefficient for period t-2, for example, captures the correlation within matched strata between civilian casualties in time t-2 and the average of SIGACTs over period t-2, t-1, and t. That this average is statistically indistinguishable from zero until period t helps to verify that this approach controls appropriately for contemporaneous correlation and reverse causality.

26 of 85
Two facts stand out from this matching exercise. First, we can confirm our previous
findings that ISAF-generated casualties have a statistically significant effect on the long-run
trend in civilian casualties. In the entire country we find a significant positive treatment such that
each civilian per 1,000 population killed by ISAF predicts an additional 0.03 attacks per 1,000
people in the next 6-week period. The average ISAF-generated incident resulted in 2 civilian
casualties. Thus, in an average-sized district of 83,000 people this amounts to 1 additional
SIGACT over the next 6 weeks. Parametric estimates of the lead moving average of SIGACTs
are consistent with these estimates: an additional civilian casualty accounts for 0.03 to 0.08 more
IED attacks per 1,000 in the population. Second, there is no evidence that insurgent-generated
civilian casualties affect the number of attacks. Insurgent-generated civilian casualties’ estimates
are more subject to reverse-causality concerns: they fail a placebo test even with spatial lags of
the dependent variable included.30 To the extent that this matching approach controls for
underlying trends in insurgent activity that may be otherwise omitted in the fixed effects
approaches, we should be a bit more skeptical about the positive finding on insurgent-caused
casualties in Table 3 (models 1 and 3).
4. CIVILIAN CASUALTIES AND INSURGENT VIOLENCE IN IRAQ
Any intensive study of micro-data from one conflict raises issues of external validity. While
there are many important differences between the two conflicts, Iraq provides a useful outside
comparison to Afghanistan. There are three important reasons to compare insurgent behavior in
Iraq and Afghanistan. First, many policy makers and strategists base policy and planning in
Afghanistan on the lessons learned in Iraq. A similar analysis of Iraq can shed light on whether
the patterns that we observe in Afghanistan are particular to that conflict or whether they 30 See Appendix Table 4 for results from placebo tests.

27 of 85
represent a more general trend of behavior in these types of insurgencies. Second, the
comparison can shed light on whether there are Afghanistan-specific factors driving the results in
section 3. If these underlying mechanisms are dominant in Afghanistan, Iraq provides a natural
falsification check for these theories. Third, while the conflicts in Afghanistan and Iraq have
some similarities, the insurgencies’ operating environments differ dramatically. In Iraq, the
insurgency operated in an urban environment and faced relatively high counterinsurgent force
levels, compared to Afghanistan where the insurgency operates in a largely-rural environment.
To the extent that civilian casualties affect insurgents’ labor supply or the flow of information to
counterinsurgents, we should their effects to vary substantially across these conflicts.31
We therefore replicated the analysis above on data from the war in Iraq. Figure 6
provides some basic intuition for the difference between the conflicts. The most striking
difference is that while risks to civilians from insurgents are roughly similar in Sunni areas of
Iraq and Pashtun areas of Afghanistan, the risk to civilians from Coalition forces is substantially
higher in Iraq than the risk from ISAF units in Afghanistan. This could lead to different
dynamics as could the vastly greater scale of civilian casualties in Iraq. Additionally, the time
series for Iraq is much longer, almost five years as opposed to just 15 months for Afghanistan.
In contrast to Afghanistan, it appears that there is little to no long-run effect of civilian
casualties on violence in Iraq. At the district/bi-month level there is no consistent relationship
between civilian casualties and violence. To the extent that civilian casualties in Iraq affect
insurgent violence they do so on a week-to-week level, impacting short-term fluctuations. As
Condra and Shapiro (2010) argue, that pattern is most consistent with the information
mechanism whereby the local population withholds (shares) information on insurgents when
Coalition forces (insurgents) are responsible for civilian casualties. 31 For more detailed discussion of insurgent group structure and empirical evidence, see Iyengar and Monten (2009).

28 of 85
4.1 Data on Civilian Casualties and Violence in Iraq
The civilian casualty data for Iraq come from Iraq Body Count (IBC), a non-profit organization
dedicated to tracking civilian casualties using media reports, as well as hospital, morgue and
other figures.32 These data capture 18,474 incidents in which civilians were killed that can be
accurately geo-located to the district level, accounting for 59,245 civilian deaths. We divided
these casualties into four categories: (1) Insurgent killings of civilians in the course of attacking
Coalition or Iraqi government targets; (2) Coalition killings of civilians; (3) Sectarian killings
which capture all killing that are reported as being conducted by an organization representing an
ethnic group that did not occur in the context of attacks on Coalition or Iraqi forces; and (4)
Unknown killings which capture all other violence, including much of the ethnic cleansing, and
reprisal killings, To replicate the Afghanistan results we use only categories (1) and (2) which
most closely match the coding rules used by the Afghan data collected by the Civilian Casualties
Tracking Cell (CCTC).
Unlike the data from Afghanistan, the Iraq data do not include reliable information on the
gender or age of the victims. We could not separately control for the impact of incidents that kill
men from that of incidents that kill women and children. Thus, while we can use the Iraq data to
do a first-order check for the external validity of our Afghanistan results, we cannot replicate the
full analysis.
Since the data from Iraq are based on press reporting, they are subject to biases which are
not as much of a concern for the Afghanistan data. The first concern is that there is likely to be
23 See http://www.iraqbodycount.org/. The data we use were produced through a multi-year collaboration with IBC
and contain several improvements on the publicly available IBC data including more consistent geo-coding. See Condra and Shapiro (2010) for more details.

29 of 85
enormous noise associated with attributing casualties across these categories and that such
measurement error would be non-random with respect to violence, posing significant problems
for our analysis. To check for such a possibility, we investigated whether the percent of civilian
casualties (both the number of casualties and the number of casualty-related incidents) in the
“unknown” category is a function of incidents of violence. Once we control for the sectarian
composition of the area, or when we introduce district and time fixed effects, there is no
significant relationship between unknown casualty events and violence between insurgents and
Coalition forces. This approach and finding indicates that our attempt to code civilian casualties
is not contaminated by systematic measurement error.
The second concern is that the probability an incident is excluded from our analysis
because it lacks the information necessary to match it to a district location may be correlated
with violence. If reporters avoid high-violence areas, for example, then districts with high levels
of violence would have more missing data. By contrast, if the desire for a good story (or other
career concerns) pushed reporters to cover the most dangerous places, we might see the opposite
bias. Because our data include 2,612 incidents for which the governorate is known but the
district is not, we are able test for this possibility by analyzing whether the proportion of
incidents at the governorate level that cannot be attributed to a specific district correlates with
levels of violence. There is no significant relationship between levels of insurgent violence and
the proportion of incidents that cannot be resolved to the district level.
Our measure of attacks against Coalition and Iraqi government forces is based on
193,264 ‘significant activity’ (SIGACT) reports by Coalition forces that capture a wide variety
of information about “…executed enemy attacks targeted against coalition, Iraqi Security Forces
(ISF), civilians, Iraqi infrastructure and government organizations” occurring from February

30 of 85
2004 through December 2008. Unclassified fields were drawn from the Multi-National Forces
Iraq SIGACTS III Database and provide the location, date, time, and type of attack incidents but
do not include any information pertaining to the Coalition Force units involved, Coalition Force
casualties or battle damage incurred. Moreover, they exclude coalition-initiated events where no
one returned fire, such as indirect fire attacks not triggered by initiating insurgent attacks. We
filter the data to remove attacks we can positively identify as being directed at civilians or other
insurgent groups, leaving us with a sample of 168,730 attack incidents.
For this study we created bimonthly data from February 4, 2004 through December 31,
2008. Descriptive statistics of key variables for all of Iraq across this time period and by ethnic
group are presented in Table 2.
4.2 Estimating a Relationship between Civilian Casualties and Violence
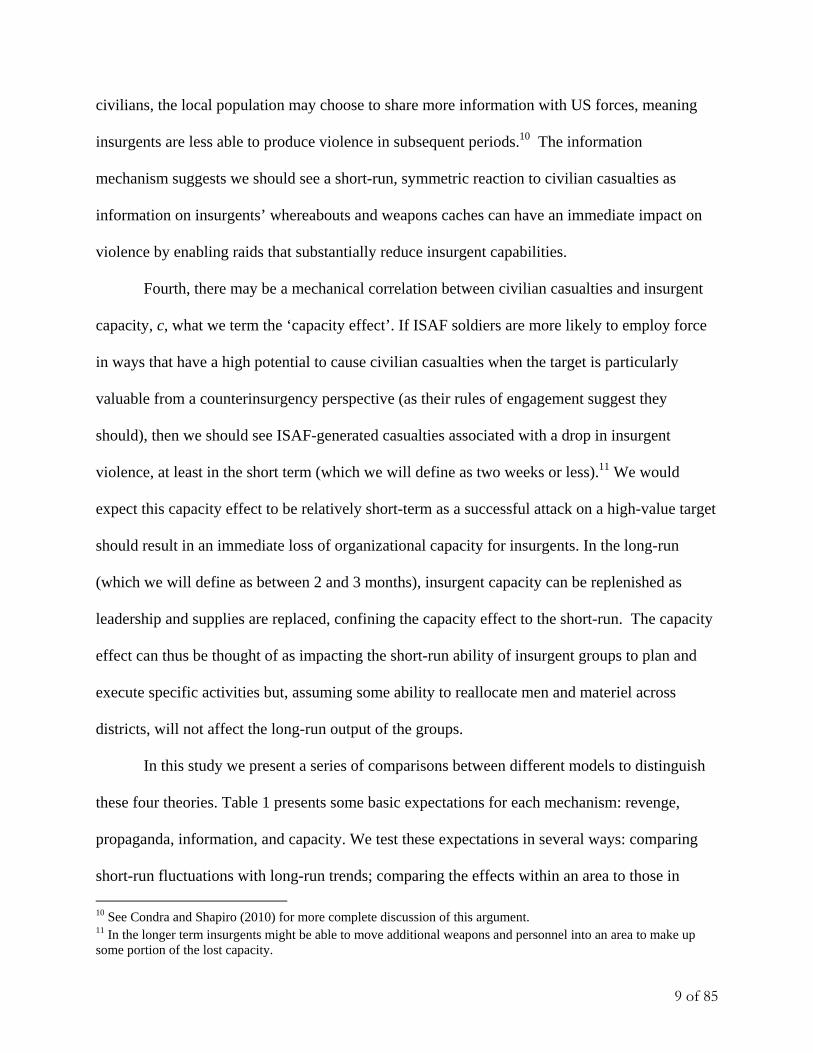
We replicated the short-run Afghanistan results with data from Iraq in Table 7 and the long-run
results in Table 8. In neither case do we find any significant effect of civilian casualties on
violent incidents.33 Appendix figure A2 present the results of applying the matching approach
described above to data from Iraq. The pre-treatment match for Coalition-caused casualties is
poor and, if anything, the Iraq data provide evidence of a capacity effect in that Coalition-caused
casualties appear to predict a long-run decrease in insurgent attacks.
These results contrast with the findings of Condra and Shapiro (2010), who find civilian
casualties have a robust week-to-week impact on insurgent violence. Analyzing a weekly time-
series for Iraq, they find that Coalition-caused casualties predict increased violence, with each
death predicting approximately 0.038 additional attacks in the following week per 100,000
33 Appendix Tables 10-17 present more complete results of the model specifications and robustness checks for Iraq discussed in this section.

31 of 85
population. The effect is especially strong for Sunni areas where a median Coalition-caused
incident resulted in 2 civilian deaths, so that for an average Sunni district in Iraq – which has
146,365 residents – an average Coalition-caused incident results in roughly 0.63 extra attacks on
Coalition forces in the subsequent week. Condra and Shapiro (2010) also found the reactions are
symmetric: insurgent-caused civilian casualties lead to fewer insurgent attacks. An average
insurgent-caused incident involves 3.7 civilian deaths, meaning that it predicts roughly 0.43
fewer insurgent attacks on Coalition forces in the next week in an average district of roughly
277,238 people.
The disparity between the two sets of Iraq results is due to the fact that Condra and
Shapiro (2010) analyze the effects of casualties on violence on a weekly basis, while in this
study we replicate the models from Afghanistan at the bimonthly level.34 The differences
between these conflicts are quite stark. In Afghanistan we find robust evidence of a local revenge
effect against ISAF forces. In Iraq, there is no such effect. Instead, there is strong evidence in the
weekly time series of an information effect. In the context of the simple model we started with in
section 1, the fact that force levels were much higher in Iraq would suggest that violence in
Afghanistan should be more sensitive to labor shocks—e.g. increased recruiting due to local
exposure to civilian casualties—while violence in Iraq should be much more sensitive to
information shocks—e.g. individuals making decisions about sharing information on the margins
based on both sides’ mistreatment of civilians.
34 The results presented here apply specifications most appropriate for the Afghan data to the Iraq case. Condra and Shapiro’s (2010) results replicate with the bimonthly data, albeit with less precision (likely due to smaller sample).

32 of 85
5. Conclusions
A central question in intrastate conflicts is how insurgents are able to mobilize supporters to
participate in violent and risky activities. An often cited mechanism is that violence committed
by counterinsurgent forces, such as ISAF in Afghanistan or Coalition forces in Iraq, generates
resentment and anger that increase both passive and active support for insurgent groups. There
are also important policy reasons to consider the relationship between civilian casualties and
violence. In 2010 Afghan and Western counterinsurgents are being asked to accept high levels of
personal risk, and some are dying for it, on the theory that doing so will be militarily
advantageous in the long-run. Both policymakers and military commanders must determine the
degree of risk they are willing to accept in order to reduce civilian casualties. A better
understanding of the extent to which such casualties increase future violence can inform efforts
to balance short-term versus long-term trade-off in terms of violence and risk when determining
standards and practices for rules of engagement.
This study contributes to the existing literature on this issue in four ways. First, we use
fixed effects and a more nuanced matching strategy to estimate the causal effect of civilian
casualties on violence. We find that if the average ISAF-caused incident (which resulted in 2
civilian casualties) was eliminated, then in an average-sized Afghan district there would be 1
fewer insurgent attack over the next 6 weeks. This evidence supports the hypothesis that in order
to reduce violence to ISAF soldiers, units should seek to minimize civilian casualties during
operations.
Second, we find evidence that the civilian response to casualties in Afghanistan is
asymmetric with respect to the armed actor responsible. If civilians were willing and able to
respond in a way that punished the armed actor responsible for civilian casualties, we would

33 of 85
expect that ISAF-generated casualties would meet with higher subsequent violence, while
insurgent-generated casualties would lead to fewer attacks—perhaps through the sharing of more
intelligence with the ISAF counterinsurgency forces. Instead, violence changes only when ISAF
is responsible for the casualties, indicating an asymmetric burden on the ISAF soldiers.
Third, we attempt to systematically distinguish between four theories that explain the
relationships we observe between civilian casualties and insurgent violence: information,
capacity, recruitment, and revenge. Our approach uses differing levels of temporal aggregation
as well as analyzing the geospatial effect of violence to find evidence consistent with particular
theories. Given the long-run effect in Afghanistan and weak evidence of geospatial spillovers,
the effects in Afghanistan appear consistent with a revenge effect, rather than propaganda,
capacity, or information effects.
Fourth, we test the external validity of our findings by conducting the same analysis on
the conflict in Iraq where previous research has shown there is a symmetric, short-run reaction to
civilian casualties. The evidence shows that the conflicts in Afghanistan and Iraq are different in
how civilian casualties affect the ability of insurgents to produce violence. In Afghanistan, we
find strong evidence of a revenge effect. In Iraq, we do not find this effect. This highlights two
important differences in these insurgencies. The insurgency in Afghanistan is rural and faced
relatively low counterinsurgent force levels while that in Iraq was urban and faced a strong
counterinsurgent presence. We suspect that the greater population density in Iraq made insurgent
activity easier to observe and, combined with higher counterinsurgent force levels, increased
insurgents’ reliance on the general populations’ reluctance to cooperate with counterinsurgents.
In Afghanistan, the more dispersed population and lower counterinsurgent force levels indicate
that the supply of insurgents is much more likely to be a major constraint.

34 of 85
Overall, the empirical evidence from Afghanistan sheds light on the way in which
insurgent groups operate. In particular, it appears that while in high population-density, urban
conflicts (such as Iraq) information flows are a critical component to counterinsurgency
operations, in more rural insurgencies the most salient factor is the availability of fighters. To the
extent that counterinsurgent forces engage in unpopular and aggressive operations that generate
specific local grievances, they are likely to facilitate increased recruitment and support for
insurgent groups. Thus, the counterinsurgent force faces an asymmetric problem. In responding
to such a situation, military leaders face the task of balancing population protection with
restrictions on their own operations. Minimizing counterinsurgents’ harm to civilians appears to
minimize the recruiting potential of insurgent forces. Thus, on a long-term basis the goal of
reducing civilian casualties is not necessarily in conflict with the objective of protecting the lives
of international forces.

35 of 85
REFERENCES
Birtle, Andrew J. 2008. “Persuasion and Coercion in Counterinsurgency Warfare.” Military Review (July-August): 45-53.
Condra, Luke N. and Jacob N. Shapiro. “Who Takes the Blame? The Strategic Effects of Collateral Damage.” Working Paper. Stanford University and Princeton University. March 19, 2010.
Department of the Army. “Counterinsurgency Field Manual No. 3-24.” December 15, 2006. Gutman, Roy. “We’ve met the enemy in Afghanistan, and he’s changed.” McClatchy
Newspapers (March 14, 2010). Available from: http://www.mcclatchydc.com/2010/03/14/90083/weve-met-the-enemy-in-afghanistan.html. Accessed April 29, 2010.
Hanson, Matthew, Radha Iyengar, and Jonathan Monten, “The Impact of Reconstruction Spending on the Labor Market for Insurgents,” Working Paper, 2009.
Iacus, Stefano M., Gary King, and Giuseppe Porro. 2008. “Matching for Causal Inference Without Balance Checking.” Available at http://gking.harvard.edu/files/cem.pdf.
Iyengar, Radha and Jonathan Monten. 2009. “Is There an ‘Emboldenment’ Effect? Evidence from the Insurgency in Iraq.” NBER Working Paper 13839.
Johnson, Thomas H. and M. Chris Mason. “No Sign Until the Burst of Fire.” International Security 32, no. 4 (Spring 2008): 41-77.
LandScan Global Population Database. 2008. Oak Ridge, TN: Oak Ridge National Laboratory. Available at http://www.ornl.gov/landscan/.
Nadery, Nader and Haseeb Humayoon. “Peace Under Friendly Fire.” New York Times (October 4, 2008): WK11.
Pleming, Sue. “Civilian Deaths Complicate Afghan Mission.” Reuters (February 22, 2010). Available from: http://www.alertnet.org/thenews/newsdesk/N22211525.htm. Accessed April 29, 2010.
U.S. Congress. Senate. Committee on Armed Services. Hearing to Consider the Nominations of Admiral James G. Stavridis; Lieutenant General Douglas M. Fraser; and Lieutenant General Stanley A. McChrystal. 111th Cong., 1st sess., 2 June 2009. Transcript available from: http://armed-services.senate.gov/Transcripts/2009/06%20June/09-36%20-%206-2-09.pdf. Accessed April 29, 2010.
U.S. Congress. Senate. Committee on Armed Services. Hearing to Receive Testimony on the Challenges Facing the Department of Defense. 111th Cong., 1st sess., 27 January 2009. Transcript available from: http://armed-services.senate.gov/Transcripts/2009/01%20January/A%20Full%20Committee/09-02%20-%201-27-09.pdf. Accessed April 29, 2010.
Wood, David. “Taliban Causes Most Civilian Deaths, but U.S. Gets the Blame.” Politics Daily (January 15, 2010). Available from: http://www.politicsdaily.com/2010/01/15/taliban-cause-most-civilian-deaths-but-u-s-gets-the-blame/. Accessed April 1, 2010.

36 of 85
Figure 1. Civilian Casualties and Violent Events, Jan 2009-March 2010
Notes: Estimates of Civilian Casualties and SIGACTs scaled per 1000 in the population based on LandScan population estimates. Civilian casualties’ estimates based on data from the Civilian Casualties Tracking Cell, International Security Assistance Forces (ISAF) headquarters. Violent Events based on data on significant actions (SIGACTs) against ISAF. SIGACTs include direct fire, indirect fire, improvised explosive device explosions, improvised explosive devices found and cleared, improvised explosive device hoaxes, and premature detonations.

37 of 85
Figure 2. Deviations from mean in Civilian Casualties and Violent Events
Notes: Estimates of Civilian Casualties and SIGACTs scaled per 1000 in the population based on LandScan population estimates. Civilian casualties estimates based on data from the Civilian Casualties Tracking Cell, International Security Assistance Forces (ISAF) headquarters. Violent Events based on data on significant actions (SIGACTs) against ISAF. SIGACTs include direct fire, indirect fire, improvised explosive device explosions, improvised explosive devices found and cleared, improvised explosive device hoaxes, and premature detonations.

38 of 85
Figure 3. Incidents and Civilian Casualties in Key Provinces
Notes: Estimates of Civilian Casualties and SIGACTs scaled per 1000 in the population based on LandScan population estimates. Civilian casualties estimates based on data from the Civilian Casualties Tracking Cell, International Security Assistance Forces (ISAF) headquarters. Violent Events based on data on significant actions (SIGACTs) against ISAF. SIGACTs include direct fire, indirect fire, improvised explosive device explosions, improvised explosive devices found and cleared, improvised explosive device hoaxes, and premature detonations.

39 of 85
Figure 4. Sources of Civilian Casualties for Women and Children vs. Men
Notes: Civilian casualties estimates based on data from the Civilian Casualties Tracking Cell, International Security Assistance Forces (ISAF) headquarters. Event type based on description available in first incident report provided to ISAF by military sources. Categories include direct fire (DF), Escalation of Force (EOF), Indirect Fire (IDF), Road and Traffic Accidents, Air Strikes, and Improvised Explosive Devices (IED). Descriptions available not in these categories were assigned to “other” categories. Events with no description were assigned to “unknown” category.

40 of 85

41 of 85
Figure 5. Estimates of the effect of Civilian Casualties on Violent Incidents from Matched Sample
Notes: Matched on SIGACTs/1,000 population in period t, three-period lagged moving average of SIGACTs in t through t-3, ethnicity and quarter, this created 2,135 strata of which 1,723 had three or more district/bi-months. 148 of 902 district/bi-months with civilian casualties had no matching unit without civilian casualties. Multivariate L1 distance for match = 0.746. Estimates of Civilian Casualties and SIGACTs scaled per 1000 in the population based on LandScan population estimates. Strata with greater than 200 district/bi-months dropped. Civilian casualties estimates based on data from the Civilian Casualties Tracking Cell, International Security Assistance Forces (ISAF) headquarters. District classification based on National Geospatial Agency (NGA) shape files on ethnic areas in Afghanistan. Violent Events based on data on significant actions (SIGACTs) against ISAF. SIGACTs include direct fire, indirect fire, improvised explosive device explosions. Excludes improvised explosive devices found and cleared, improvised explosive device hoaxes, and premature detonations.

42 of 85
Figure 6. Iraq versus Afghanistan Civilian Casualties by Ethnic Area.
District classification based on National Geospatial Agency (NGA) shape files on ethnic areas in Afghanistan. Districts classified as Pashtun if more than 66% of their area fall into regions NGA defines as Pashtun, as non-Pashtun if more than 66% of their area falls into regions NGA defines as one specific non-Pashtun ethnicity, and mixed otherwise.

43 of 85
Table 1: Mechanisms and Expected Relationships Mechanisms Party
Responsible Short-Run Long-Run
Total Men Women Total Men WomenPanel A: In Area Revenge ISAF + + + + + + Insurgents – – – – – – Propaganda ISAF 0 0 0 + + + Insurgents 0 0 0 – – – Information ISAF + + + 0 0 0 Insurgents – – – 0 0 0 Capacity ISAF – – 0 0 0 0 Insurgents 0 0 0 0 0 0 Panel B: Out-Area
Short-Run Long-Run Total Men Women Total Men Women
Revenge ISAF 0 0 0 0 0 0 Insurgents 0 0 0 0 0 0 Recruitment ISAF 0 0 0 + + + Insurgents 0 0 0 – – – Information ISAF + + + 0 0 0 Insurgents – – – 0 0 0 Capacity ISAF 0 0 0 0 0 0 Insurgents 0 0 0 0 0 0

44 of 85
Table 2. Events per 100,000 population per district/bimonth for Afghanistan and Iraq
Variable Observations Mean Std. Dev. Observations Mean Std. Dev.
Afghanistan (Jan. 2009 – Mar. 2010) Iraq (Feb. 2004 – Dec. 2008)
Entire Country Entire Country
Insurgent Attacks 12672 2.87 8.93 13312 5.26 15.06
Civilians Killed (Coalition)
12672 0.07 0.89 13312 0.14 2.28
Civilians Killed (Insurgents)
12672 0.50 5.13 13312 0.25 1.78
Pashtun Districts (n=137) Sunni Districts (n=14)
Insurgent Attacks 4521 4.87 10.30 1792 17.38 22.84
Civilians Killed (Coalition)
4521 0.13 1.32 1792 0.69 6.73
Civilians Killed (Insurgents)
4521 0.94 7.63 1792 0.94 4.23
Mixed Districts (n=68) Mixed Districts (n=28)
Insurgent Attacks 2244 4.11 10.30 3584 9.66 20.79
Civilians Killed (Coalition)
2244 0.09 0.90 3584 0.10 0.73
Civilians Killed (Insurgents)
2244 0.54 3.49 3584 0.36 1.43
Non-Pashtun Districts (n=179) Shiite and Kurdish Districts (n=62)
Insurgent Attacks 5907 0.87 6.49 7936 0.55 1.83
Civilians Killed (Coalition)
5907 0.01 0.19 7936 0.03 0.42
Civilians Killed (Insurgents)
5907 0.14 2.66 7936 0.03 0.45
Notes: All figures are per 100,000 population. Insurgent attacks for Afghanistan are from ISAF CIDNE database. Civilian casualty estimates for Afghanistan are from ISAF Civilian Casualties Tracking Cell. Insurgent attacks for Iraq are from MNF-I SIGACT-III database. Civilian casualty estimates for Iraq are from Iraq Body Count. Insurgent attacks include direct fire, indirect fire, improvised explosive device explosions, improvised explosive devices found and cleared, improvised explosive device hoaxes, and premature detonations. District classification for Afghanistan calculated from National Geospatial Intelligence Agency Afghanistan Ethnic Map (2007). District calculations for Iraq are based on December 2005 election results. Population figures are from LandScan (2008). Afghanistan results nclude 384 districts with more than 1 insurgent attack in period under study. Iraq results include all districts.

45 of 85
Table 3. Linear Regression Estimates of SIGACTs on Civilian Casualties (Afghanistan)
(1) (2) (3) (4) (5) (6)
Dependent Variable SIGACTs per 1000 IEDs per 1000 Direct Fire per 1000
(mean) 0.0226 0.0072 0.0097 Panel A: ISAF Generated Civilian Casualties Civilian casualties at t 0.342** 0.120 0.147* 0.0727 0.178* 0.0483 (0.16) (0.11) (0.076) (0.058) (0.091) (0.072) Civilian casualties at t-1 0.144 -0.0665 0.0400 -0.0365 0.0621 -0.0409 (0.11) (0.084) (0.047) (0.034) (0.069) (0.064) Civilian casualties at t-2 0.255* 0.0997 0.128* 0.0698 0.0966 0.0326 (0.13) (0.14) (0.068) (0.069) (0.10) (0.12) Civilian casualties at t-3 0.0240 -0.168* 0.131** 0.0645 -0.0318 -0.120* (0.12) (0.098) (0.061) (0.047) (0.087) (0.065) Civilian casualties at t-4 0.199 0.0379 0.0994** 0.0224 0.0723 0.0114 (0.17) (0.12) (0.048) (0.046) (0.14) (0.086)
Joint F-test of lags 1.44 -0.34 2.57 1.34 0.62 -0.55 (p-value) (0.15) (0.73) (0.01) (0.18) (0.53) (0.59) Panel B: Insurgent Generated Civilian Casualties Civilian casualties at t 0.123*** 0.0978** 0.0551** 0.0484* 0.0502*** 0.0357** (0.044) (0.039) (0.027) (0.025) (0.017) (0.015) Civilian casualties at t-1 0.0992** 0.0550* 0.0242 0.0102 0.0440* 0.0236 (0.040) (0.033) (0.015) (0.013) (0.026) (0.023) Civilian casualties at t-2 0.0602 -0.00128 0.0162* -0.000554 0.0400 0.0112 (0.042) (0.026) (0.0094) (0.0055) (0.033) (0.025) Civilian casualties at t-3 0.0763** 0.0130 0.0190* 0.00103 0.0467** 0.0169** (0.032) (0.011) (0.011) (0.0062) (0.021) (0.0078) Civilian casualties at t-4 0.0386 -0.0154 0.0132 0.00169 0.0212 -0.00837 (0.024) (0.015) (0.0088) (0.0052) (0.015) (0.0090)
Joint F-test of lags 2.11 0.97 1.84 0.63 1.68 0.93 (p-value) (0.04) (0.33) (0.07) (0.53) (0.09) (0.35) 3-Period Moving Average N Y N Y N Y Observations 31104 31104 31104 31104 31104 31104 R-squared 0.50 0.64 0.36 0.46 0.42 0.58

46 of 85
Notes: The Dependent variable is significant actions, IED incidents or Direct Fire incidents per 1000 in the population respectively. Robust standard errors, clustered at the district level are reported in parentheses. All specifications include district and month-year fixed effect. Estimates which are significant at the 0.05 (0.10, 0.01) level are marked with ** (*, ***). Moving average estimates are 3-period (6 week) previous week linear estimate of the moving average of the dependent variable. Estimates of Civilian Casualties and SIGACTs scaled per 1000 in the population based on LandScan population estimates. Civilian casualties estimates based on data from the Civilian Casualties Tracking Cell, International Security Assistance Forces (ISAF) headquarters. Violent Events based on data on significant actions (SIGACTs) against ISAF. SIGACTs include direct fire, indirect fire, improvised explosive device explosions, improvised explosive devices found and cleared, improvised explosive device hoaxes, and premature detonations.

47 of 85
Table 4. Proportion of Variance Explained by Different Controls Dependent Variable
ISAF-caused Casualties per 1,000
ISAF-caused Incidents per 1,000
Insurgent-caused Casualties per 1,000
Insurgent-caused Incidents per 1,000
SIGACTs per 1,000
Controls: District FE 0.0246 0.0280 0.0220 0.0393 0.4627 Controls: District and Month FE 0.0285 0.0330 0.0293 0.0594 0.4829 Controls: District and Month FE Lagged 3-Period Moving Average (SIGACTs/1000) 0.0314 0.0369 0.0308 0.0650 0.6347 Controls: District and Month FE Lagged 3-Period Moving Average (SIGACTs/1000) Lagged DV 0.0320 0.0370 0.0315 0.0667 0.6582 Notes: All figures are per 1,000 population. Insurgent attacks for Afghanistan are from ISAF CIDNE database. Civilian casualty estimates for Afghanistan are from ISAF Civilian Casualties Tracking Cell. Insurgent attacks include direct fire, indirect fire, improvised explosive device explosions, improvised explosive devices found and cleared, improvised explosive device hoaxes, and premature detonations.

48 of 85
Table 5. Linear Regression Estimates of Moving Average or Mean Absolute Deviation of SIGACTs on Civilian Casualties (Afghanistan)
(1) (2) (3) (4) (5) (6) (7) (8)
SIGACTs per 1000 IEDs per 1000 Civilian Casualty Location In-District Out-of-District In-District Out-of-District DV: SIGACTs Lead MA Lead MAD Lead MA Lead MAD Lead MA Lead MAD Lead MA Lead MAD
Panel A: ISAF Generated Civilian Casualties Civilian casualties at t -0.0140 0.0197 -0.00732 -0.00939 0.0288 0.0242 -0.00396 -0.000741 (0.088) (0.022) (0.030) (0.011) (0.041) -0.024 (0.017) (0.0073) Civilian casualties at t-1 -0.00375 0.0571 0.0386 0.0148 0.0415 0.0394 0.00904 0.0120* (0.10) (0.036) (0.030) (0.016) (0.039) -0.026 (0.016) (0.0069) Civilian casualties at t-2 -0.0710 -0.0175 0.0301 0.0194 0.0320 0.0169 0.00846 -0.000710 (0.099) (0.042) (0.034) (0.016) (0.029) -0.024 (0.019) (0.0080) Civilian casualties at t-3 0.0133 -0.00412 0.0369 0.00823 0.0896** 0.0522 0.0215 -0.00324 (0.10) (0.022) (0.038) (0.012) (0.037) -0.037 (0.018) (0.0065) Civilian casualties at t-4 -0.00197 -0.0140 -0.00959 -0.0209 0.0753** 0.0375 0.0217 -0.00332 (0.081) (0.024) (0.033) (0.013) (0.034) -0.037 (0.016) (0.0056)
Joint F-test of lags -0.20 0.26 0.90 0.57 2.13 1.25 1.00 0.27 (p-value) (0.84) (0.80) (0.37) (0.57) (0.03) (0.21) (0.32) (0.79)
Panel B: Insurgent Generated Civilian Casualties Civilian casualties at t 0.0545 0.0152* 0.00579 -0.00148 0.0109 0.00284 0.00390* 0.000495 (0.034) (0.0078) (0.0042) (0.0021) (0.0074) -0.0052 (0.0024) (0.0013) Civilian casualties at t-1 0.0227 0.00474 0.00702* -0.000736 0.00114 -0.00354 0.00394** 0.000896 (0.025) (0.0072) (0.0041) (0.0018) (0.0058) -0.0031 (0.0019) (0.0011) Civilian casualties at t-2 0.00924 0.0101 0.00752** -0.000386 0.00321 0.00328 0.00318 0.000798 (0.011) (0.0082) (0.0035) (0.0016) (0.0056) -0.0047 (0.0020) (0.0014) Civilian casualties at t-3 -0.00459 0.00115 0.00176 -0.00112 0.00210 0.00297 0.00182 0.00154* (0.012) (0.0055) (0.0032) (0.0014) (0.0052) -0.0047 (0.0018) (0.00092) Civilian casualties at t-4 -0.0127 -0.000388 0.000574 0.00255 0.00454 0.00265 0.00258 0.00240* (0.016) (0.0076) (0.0035) (0.0027) (0.0042) -0.0047 (0.0024) (0.0014)
Joint F-test of lags 0.49 0.86 1.63 0.07 0.64 0.37 1.76 1.81 (p-value) (0.62) (0.39) (0.10) (0.94) (0.52) (0.71) (0.08) (0.07) Observations 30696 29928 30692 29924 30696 29928 30692 29924 R-squared 0.66 0.47 0.66 0.47 0.58 0.41 0.58 0.40

49 of 85
Notes: The Dependent variable is significant actions, IED incidents or Direct Fire incidents per 1000 in the population respectively. Robust standard errors, clustered at the district level are reported in parentheses. All specifications include district and month-year fixed effect. Estimates which are significant at the 0.05 (0.10, 0.01) level are marked with ** (*, ***). Moving average estimates are 3-period (6 week) previous week linear estimate of the moving average of the dependent variable. All regressions include the spatial lag of the DV. Spatial lags are estimated as the average dependent variable value for all adjacent districts. Estimates of Civilian Casualties and SIGACTs scaled per 1000 in the population based on LandScan population estimates. Civilian casualties estimates based on data from the Civilian Casualties Tracking Cell, International Security Assistance Forces (ISAF) headquarters. Violent Events based on data on significant actions (SIGACTs) against ISAF. SIGACTs include direct fire, indirect fire, improvised explosive device explosions, improvised explosive devices found and cleared, improvised explosive device hoaxes, and premature detonations.

50 of 85
Table 6. Linear Regression Estimates of Moving Average of IEDs on Civilian Casualties in Pashtun vs. Non-Pashtun Areas (Afghanistan)
(1) (2) (3) (4) (5) (6) (7) (8) DV: IED(t) FE FE FE FE MA MA MA MA In District In District In District In District In District In District In District In District Pashtun Non- Pashtun Pashtun Non- Pashtun Pashtun Non- Pashtun Pashtun Non- Pashtun Panel A: ISAF Generated Civilian Casualties Civilian casualties at t 0.134* 0.109 0.0741 -0.0736 0.0394 0.0488 0.0253 0.00871 (0.077) (0.14) (0.059) (0.18) (0.043) (0.066) (0.042) (0.065) Civilian casualties at t-1 0.0135 0.216 -0.0544 0.114 0.0485 -0.128 0.0426 -0.117 (0.044) (0.23) (0.033) (0.19) (0.043) (0.11) (0.040) (0.096) Civilian casualties at t-2 0.127* 0.0526 0.0797 -0.0674 0.0481 -0.183 0.0374 -0.179 (0.069) (0.062) (0.070) (0.11) (0.029) (0.12) (0.028) (0.12) Civilian casualties at t-3 0.130** -0.0196 0.0693 -0.0589 0.106*** -0.0384 0.0900** -0.0233 (0.063) (0.044) (0.049) (0.058) (0.036) (0.050) (0.037) (0.049) Civilian casualties at t-4 0.0897* -0.0658 0.0197 -0.0982 0.0908*** 0.0512 0.0716** 0.0510 (0.050) (0.091) (0.047) (0.12) (0.034) (0.10) (0.033) (0.11) Joint F-test of lags 0.36 0.18 0.11 -0.11 0.29 -0.30 0.24 -0.27 Significance (p-value) (0.019) (0.40) (0.21) (0.54) (0.012) (0.16) (0.035) (0.15) Panel B: Insurgent Generated Civilian Casualties Civilian casualties at t 0.0309* 0.170*** 0.0256* 0.167** 0.0129 0.0133 0.0102 0.00776 (0.017) (0.065) (0.014) (0.067) (0.0096) (0.014) (0.0083) (0.014) Civilian casualties at t-1 0.0228 0.0172 0.0141 -0.00887 0.00644 -0.00895 0.00364 -0.0154 (0.017) (0.024) (0.014) (0.016) (0.0067) (0.012) (0.0062) (0.011) Civilian casualties at t-2 0.0125 0.0170 0.000595 -0.00857 0.00762 -0.0117 0.00614 -0.0167 (0.010) (0.016) (0.0052) (0.012) (0.0052) (0.012) (0.0049) (0.010) Civilian casualties at t-3 0.0169 0.0108 0.00411 -0.0165 0.00729 -0.0152 0.00465 -0.0167** (0.012) (0.013) (0.0060) (0.013) (0.0054) (0.0099) (0.0048) (0.0079) Civilian casualties at t-4 0.0109 0.00578 0.00103 -0.000388 0.00647 0.00421 0.00437 0.000549 (0.0100) (0.0090) (0.0061) (0.0040) (0.0050) (0.0084) (0.0048) (0.0086) Joint F-test of lags 0.063 0.05 0.020 -0.034 0.028 -0.032 0.019 -0.048 Significance (p-value) (0.15) (0.38) (0.32) (0.31) (0.13) (0.40) (0.24) (0.15) Lagged MA No No Yes Yes Yes Yes Yes Yes Spatial Lag No No No No No No Yes Yes Observations 13932 17172 13932 17172 13760 16960 13760 16936

51 of 85
R-squared 0.33 0.32 0.44 0.37 0.54 0.47 0.56 0.49 Notes: The dependent variable is IED incidents per 1000 in the population respectively. Robust standard errors, clustered at the district level, are reported in parentheses. All specifications include district and month-year fixed effect. Estimates which are significant at the 0.05 (0.10, 0.01) level are marked with ** (*, ***). Moving average estimates are 3-period (6 week) previous week linear estimate of the moving average of the dependent variable. All regressions include the spatial lag of the DV. Spatial lags are estimated as the average dependent variable value for all adjacent districts. Estimates of Civilian Casualties and SIGACTs scaled per 1000 in the population based on LandScan population estimates. Civilian casualties estimates based on data from the Civilian Casualties Tracking Cell, International Security Assistance Forces (ISAF) headquarters. Violent Events based on data on significant actions (SIGACTs) against ISAF. SIGACTs include direct fire, indirect fire, improvised explosive device explosions, improvised explosive devices found and cleared, improvised explosive device hoaxes, and premature detonations. District classification based on National Geospatial Agency (NGA) shape files on ethnic areas in Afghanistan, districts classified as Pashtun if more than 50% of their area fall into areas NGA defines as Pashtun.
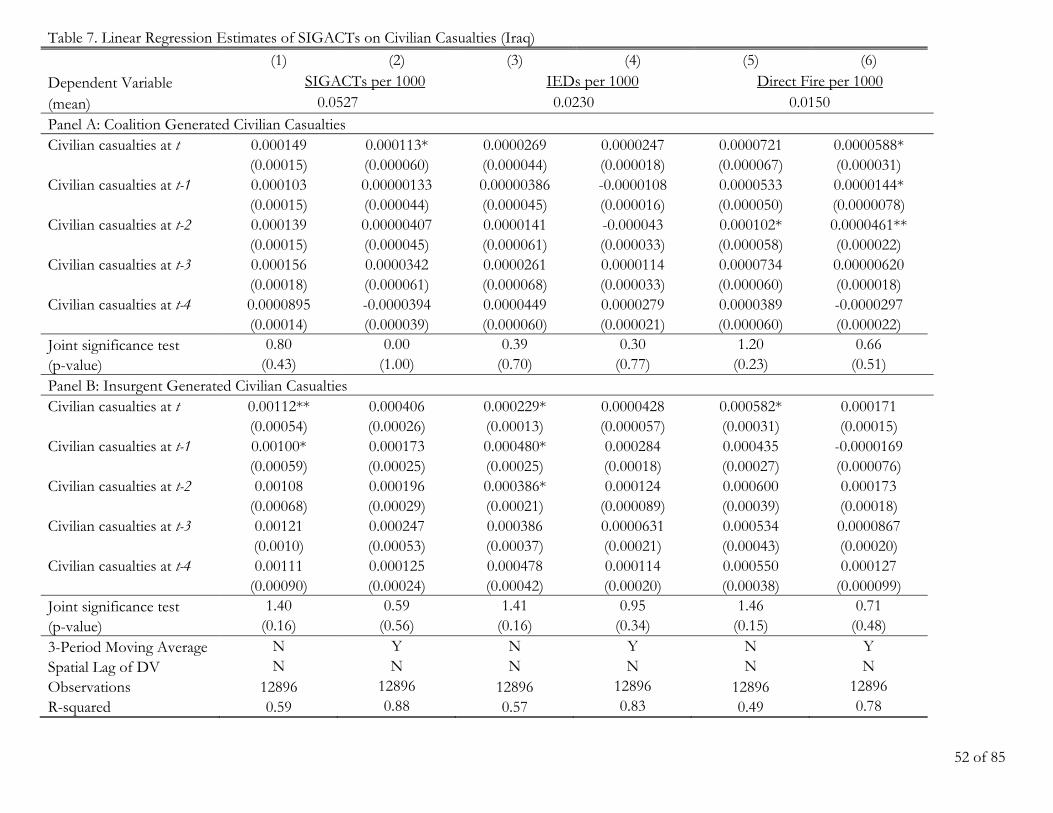
52 of 85
Table 7. Linear Regression Estimates of SIGACTs on Civilian Casualties (Iraq)
(1) (2) (3) (4) (5) (6)
Dependent Variable SIGACTs per 1000 IEDs per 1000 Direct Fire per 1000
(mean) 0.0527 0.0230 0.0150 Panel A: Coalition Generated Civilian Casualties Civilian casualties at t 0.000149 0.000113* 0.0000269 0.0000247 0.0000721 0.0000588* (0.00015) (0.000060) (0.000044) (0.000018) (0.000067) (0.000031) Civilian casualties at t-1 0.000103 0.00000133 0.00000386 -0.0000108 0.0000533 0.0000144* (0.00015) (0.000044) (0.000045) (0.000016) (0.000050) (0.0000078) Civilian casualties at t-2 0.000139 0.00000407 0.0000141 -0.000043 0.000102* 0.0000461** (0.00015) (0.000045) (0.000061) (0.000033) (0.000058) (0.000022) Civilian casualties at t-3 0.000156 0.0000342 0.0000261 0.0000114 0.0000734 0.00000620 (0.00018) (0.000061) (0.000068) (0.000033) (0.000060) (0.000018) Civilian casualties at t-4 0.0000895 -0.0000394 0.0000449 0.0000279 0.0000389 -0.0000297 (0.00014) (0.000039) (0.000060) (0.000021) (0.000060) (0.000022) Joint significance test 0.80 0.00 0.39 0.30 1.20 0.66 (p-value) (0.43) (1.00) (0.70) (0.77) (0.23) (0.51) Panel B: Insurgent Generated Civilian Casualties Civilian casualties at t 0.00112** 0.000406 0.000229* 0.0000428 0.000582* 0.000171 (0.00054) (0.00026) (0.00013) (0.000057) (0.00031) (0.00015) Civilian casualties at t-1 0.00100* 0.000173 0.000480* 0.000284 0.000435 -0.0000169 (0.00059) (0.00025) (0.00025) (0.00018) (0.00027) (0.000076) Civilian casualties at t-2 0.00108 0.000196 0.000386* 0.000124 0.000600 0.000173 (0.00068) (0.00029) (0.00021) (0.000089) (0.00039) (0.00018) Civilian casualties at t-3 0.00121 0.000247 0.000386 0.0000631 0.000534 0.0000867 (0.0010) (0.00053) (0.00037) (0.00021) (0.00043) (0.00020) Civilian casualties at t-4 0.00111 0.000125 0.000478 0.000114 0.000550 0.000127 (0.00090) (0.00024) (0.00042) (0.00020) (0.00038) (0.000099) Joint significance test 1.40 0.59 1.41 0.95 1.46 0.71 (p-value) (0.16) (0.56) (0.16) (0.34) (0.15) (0.48) 3-Period Moving Average N Y N Y N Y Spatial Lag of DV N N N N N N Observations 12896 12896 12896 12896 12896 12896 R-squared 0.59 0.88 0.57 0.83 0.49 0.78

53 of 85
Notes: Estimates of Civilian Casualties and SIGACTs scaled per 1000 in the population based on World Food Program population estimates. Scaling per 100,000 to make coefficients appropriately sized does not change results. All specifications include district and month-year fixed effect. Robust standard errors, clustered at the district level, are reported in parentheses. Estimates which are significant at the 0.05 (0.10, 0.01) level are marked with ** (*, ***). Civilian casualties estimates based on data from Iraq Body Count. Violent incidents based on data on significant actions (SIGACTs) from the Multi-National Forces Iraq (MNF-I) SIGACT-III database. SIGACTs include direct fire, indirect fire, improvised explosive device explosions, improvised explosive devices found and cleared, improvised explosive device hoaxes, and premature detonations.

54 of 85
Table 8. Linear Regression Estimates of SIGACTs on Civilian Casualties (Iraq)
(1) (2) (3) (4) (5) (6) DV: SIGACTs SIGACTs (t) SIGACTs (t) Lead MA Lead MA Lead MAD Lead MAD Coalition Generated Civilian Casualties Civilian casualties at t 0.000149 0.000113* 0.000100 0.000100 0.0000373 0.0000371 (0.00015) (0.000060) (0.000069) (0.000070) (0.000027) (0.000028) Civilian casualties at t-1 0.000103 0.00000133 0.0000295 0.0000315 0.0000207 0.0000216 (0.00015) (0.000044) (0.000065) (0.000067) (0.000014) (0.000014) Civilian casualties at t-2 0.000139 0.00000407 -0.00000747 -0.00000505 0.0000336 0.0000346 (0.00015) (0.000045) (0.000072) (0.000073) (0.000023) (0.000024) Civilian casualties at t-3 0.000156 0.0000342 0.000000169 0.00000152 0.0000298 0.0000303 (0.00018) (0.000061) (0.000067) (0.000067) (0.000031) (0.000031) Civilian casualties at t-4 0.0000895 -0.0000394 0.00000388 0.00000625 0.0000281 0.0000292 (0.00014) (0.000039) (0.000065) (0.000066) (0.000033) (0.000033) Joint significance test 0.80 0.000 0.10 0.13 1.15 1.48 (p-value) (0.43) (1.00) (0.92) (0.90) (0.25) (0.24) Insurgent Generated Civilian Casualties Civilian casualties at t 0.00112** 0.000406 0.000490 0.000502 0.000232 0.000237 (0.00054) (0.00026) (0.00057) (0.00057) (0.00018) (0.00018) Civilian casualties at t-1 0.00100* 0.000173 0.000439 0.000455 0.000149 0.000156 (0.00059) (0.00025) (0.00063) (0.00063) (0.00012) (0.00012) Civilian casualties at t-2 0.00108 0.000196 0.000317 0.000336 -0.0000348 -0.0000269 (0.00068) (0.00029) (0.00058) (0.00058) (0.000046) (0.000046) Civilian casualties at t-3 0.00121 0.000247 0.000204 0.000221 -0.000000570 0.00000631 (0.0010) (0.00053) (0.00044) (0.00044) (0.000053) (0.000054) Civilian casualties at t-4 0.00111 0.000125 0.000222 0.000244 0.000143 0.000152 (0.00090) (0.00024) (0.00021) (0.00022) (0.00012) (0.00012) Joint significance test 1.40 0.59 0.64 0.67 1.04 1.14 (p-value) (0.16) (0.56) (0.52) (0.50) (0.30) (0.26) 3-Period Moving Average N Y Y Y Y Y Spatial Lag of DV N N N Y N Y Observations 12896 12896 12792 12792 12584 12584 R-squared 0.59 0.88 0.85 0.85 0.60 0.61

55 of 85
Notes: Estimates of Civilian Casualties and SIGACTs scaled per 1000 in the population based on World Food Program population estimates. All specifications include district and month-year fixed effect. Scaling per 100,000 to make coefficients appropriately sized does not change results. Robust standard errors, clustered at the district level, are reported in parentheses. Estimates which are significant at the 0.05 (0.10, 0.01) level are marked with ** (*, ***). Civilian casualties estimates based on data from Iraq Body Count. Violent incidents based on data on significant actions (SIGACTs) from the Multi-National Forces Iraq (MNF-I) SIGACT-III database. SIGACTs include direct fire, indirect fire, improvised explosive device explosions, improvised explosive devices found and cleared, improvised explosive device hoaxes, and premature detonations.

56 of 85
Appendix Table 1. Linear Regression Estimates of IEDs on Civilian Casualties (Afghanistan)
(1) (2) (3) (4) (5) (6) DV: IEDs (t) Base Model Lagged MA Lead MA Lead MA Lead MAD Lead MAD ISAF Generated Civilian Casualties Civilian casualties at t 0.147* 0.0727 0.0463 0.0506*** 0.0290 0.0134*** (0.076) (0.058) (0.042) (0.0064) (0.024) (0.0038) Civilian casualties at t-1 0.0400 -0.0365 0.0484 0.0288 0.0432 0.0242 (0.047) (0.034) (0.042) (0.041) (0.027) (0.024) Civilian casualties at t-2 0.128* 0.0698 0.0438 0.0415 0.0226 0.0394 (0.068) (0.069) (0.030) (0.039) (0.024) (0.026) Civilian casualties at t-3 0.131** 0.0645 0.106*** 0.0320 0.0564 0.0169 (0.061) (0.047) (0.036) (0.029) (0.037) (0.024) Civilian casualties at t-4 0.0994** 0.0224 0.0958*** 0.0896** 0.0424 0.0522 (0.048) (0.046) (0.035) (0.037) (0.036) (0.037) Joint F-test 2.57 1.34 2.56 2.13 1.41 1.25 (p-value) (0.01) (0.18) (0.01) (0.03) (0.16) (0.21) Insurgent Generated Civilian Casualties Civilian casualties at t 0.0551** 0.0484* 0.0147* 0.0753** 0.00387 0.0375 (0.027) (0.025) (0.0086) (0.034) (0.0054) (0.037) Civilian casualties at t-1 0.0242 0.0102 0.00508 0.0109 -0.00250 0.00284 (0.015) (0.013) (0.0063) (0.0074) (0.0031) (0.0052) Civilian casualties at t-2 0.0162* -0.000554 0.00570 0.00114 0.00393 -0.00354 (0.0094) (0.0055) (0.0057) (0.0058) (0.0045) (0.0031) Civilian casualties at t-3 0.0190* 0.00103 0.00494 0.00321 0.00370 0.00328 (0.011) (0.0062) (0.0058) (0.0056) (0.0047) (0.0047) Civilian casualties at t-4 0.0132 0.00169 0.00744* 0.00210 0.00343 0.00297 (0.0088) (0.0052) (0.0043) (0.0052) (0.0046) (0.0047) Joint F-test 1.84 0.63 1.23 0.64 0.61 0.37 (p-value) (0.07) (0.53) (0.22) (0.52) (0.54) (0.71) Spatial Lag of Dependent Variable N N N Y N Y Observations 31104 31104 30720 30696 29952 29928 R-squared 0.36 0.46 0.56 0.58 0.40 0.41 Note: All models include district and month fixed effects. Where included, coefficients for moving average, mean absolute deviation, and spatial lag of the dependent variable not shown. Robust standard errors, clustered on district, in parentheses. *** p<0.01, ** p<0.05, * p<0.1.

57 of 85
Appendix Table 2. Linear Regression Estimates of Direct Fire on Civilian Casualties (Afghanistan)
(1) (2) (3) (4) (5) (6) DV: Direct Fire (t) Base Model Lagged MA Lead MA Lead MA Lead MAD Lead MAD ISAF Generated Civilian Casualties Civilian casualties at t 0.0427** -0.00571 0.0140 0.0412*** -0.00582 0.00911 (0.021) (0.013) (0.014) (0.015) (0.0074) (0.0059) Civilian casualties at t-1 0.0149 -0.0258 0.0346** 0.00193 0.00980 -0.00866 (0.020) (0.017) (0.017) (0.014) (0.0096) (0.0079) Civilian casualties at t-2 0.0464* 0.0276 0.0464** 0.0292* 0.0127 0.00744 (0.025) (0.024) (0.021) (0.017) (0.0089) (0.0099) Civilian casualties at t-3 0.0691** 0.0397* 0.0408* 0.0370* 0.00154 0.00906 (0.029) (0.022) (0.024) (0.020) (0.0066) (0.0094) Civilian casualties at t-4 0.0997** 0.0489 0.00537 0.0320 -0.0174* -0.000251 (0.045) (0.034) (0.020) (0.023) (0.0091) (0.0069) Joint F-test 0.62 -0.55 -0.41 -0.70 -0.87 -1.06 (p-value) (0.53) (0.59) (0.68) (0.49) (0.39) (0.29) Insurgent Generated Civilian Casualties Civilian casualties at t 0.0146** 0.00828** 0.00501 -0.00783 -0.000710 -0.0201** (0.0069) (0.0041) (0.0031) (0.020) (0.0011) (0.0095) Civilian casualties at t-1 0.0110** 0.00331 0.00478 0.00173 -0.000755 -0.00147 (0.0054) (0.0027) (0.0032) (0.0022) (0.0013) (0.0011) Civilian casualties at t-2 0.00191 -0.00620* 0.00560** 0.00225 -0.000504 -0.00130 (0.0033) (0.0032) (0.0028) (0.0026) (0.0011) (0.0013) Civilian casualties at t-3 0.0113** 0.00462 0.00496** 0.00430* -0.000154 -0.000793 (0.0046) (0.0029) (0.0021) (0.0023) (0.0010) (0.0011) Civilian casualties at t-4 0.0142*** 0.00763** 0.00428* 0.00212 0.00195 -0.000761 (0.0051) (0.0030) (0.0023) (0.0021) (0.0013) (0.0011) Joint F-test 1.68 0.93 1.56 1.30 2.21 2.19 (p-value) (0.09) (0.35) (0.12) (0.20) (0.03) (0.03) Spatial Lag of Dependent Variable N N N Y N Y Observations 31076 31076 30692 30692 29924 29924 R-squared 0.42 0.58 0.58 0.59 0.43 0.43 Note: All models include district and month fixed effects. Where included, coefficients for moving average, mean absolute deviation, and spatial lag of the dependent variable not shown. Robust standard errors, clustered on district, in parentheses. *** p<0.01, ** p<0.05, * p<0.1

58 of 85
Appendix Table 3. Linear Regression Estimates of SIGACTs on Civilian Casualties by Gender (Afghanistan)
(1) (2) (3) (4) (5) (6) (7) (8)
Men Women
IED per 1000 In-District Lead MA
In-District Lead MAD
Out-of-District
MA
Out-of-District MAD
In-District Lead MA
In-District Lead MAD
Out-of-District MA
Out-of-District MAD
Panel A: ISAF Generated Civilian Casualties Civilian casualties at t 0.0499 0.0134 0.00555 -0.00147 0.186 0.163*** 0.0827 0.0460*** (0.032) (0.015) (0.017) (0.0082) (0.13) (0.062) (0.063) (0.018) Civilian casualties at t-1 0.0818** 0.0334* 0.0388* 0.0175** 0.155 0.123** 0.0451 0.0343 (0.034) (0.018) (0.020) (0.0079) (0.12) (0.060) (0.052) (0.023) Civilian casualties at t-2 0.0748* 0.00901 0.0346 0.00538 0.0131 0.0371 -0.0423 -0.0279 (0.039) (0.019) (0.023) (0.0093) (0.065) (0.047) (0.035) (0.020) Civilian casualties at t-3 0.119** 0.0292 0.0491** 0.00220 0.219*** 0.240** -0.00872 -0.00766 (0.055) (0.021) (0.023) (0.0089) (0.073) (0.093) (0.031) (0.018) Civilian casualties at t-4 0.0982* 0.00772 0.0388* -0.00592 0.272*** 0.254*** 0.0690** 0.0392** (0.055) (0.019) (0.023) (0.0074) (0.042) (0.093) (0.030) (0.019) Joint F-test 2.22 1.27 1.95 0.81 2.73 2.43 0.58 0.62 (p-value) (0.03) (0.21) (0.05) (0.42) (0.01) (0.02) (0.56) (0.54)
Panel B: Insurgent Generated Civilian Casualties Civilian casualties at t 0.0124 0.00327 0.00529** 0.000765 0.0580 0.0272 0.0677** 0.0258** (0.0083) (0.0055) (0.0026) (0.0012) (0.071) (0.035) (0.029) (0.012) Civilian casualties at t-1 0.00692 -0.00148 0.00682*** 0.00174* 0.0569 0.00207 0.0473** 0.0212* (0.0073) (0.0034) (0.0024) (0.0011) (0.072) (0.032) (0.022) (0.011) Civilian casualties at t-2 0.0113** 0.00630 0.00679*** 0.00193 0.0686 0.0113 0.00265 0.00543 (0.0050) (0.0040) (0.0022) (0.0014) (0.069) (0.028) (0.018) (0.012) Civilian casualties at t-3 0.0105** 0.00590 0.00513** 0.00248*** 0.0596 0.00625 0.00239 0.0120 (0.0048) (0.0040) (0.0022) (0.00088) (0.062) (0.025) (0.017) (0.013) Civilian casualties at t-4 0.00886** 0.00417 0.00644** 0.00388** 0.114 0.0353 0.00313 -0.00664 (0.0045) (0.0043) (0.0030) (0.0015) (0.079) (0.032) (0.021) (0.012) Joint F-test 1.97 1.21 2.91 3.13 1.11 0.54 0.90 0.96 (p-value) (0.05) (0.23) (0.00) (0.00) (0.27) (0.59) (0.37) (0.34) Observations 30696 29928 30692 29924 30696 29928 30692 29924 R-squared 0.53 0.39 0.53 0.39 0.53 0.39 0.53 0.39 Note: All models include district and month fixed effects and spatial lag of IED attacks. Robust standard errors, clustered on district, in parentheses. *** p<0.01, ** p<0.05, * p<0.1. All specifications include district and month-year fixed effect.

59 of 85
Appendix Table 4: Placebo Tests for Main Tables 3 and 4, Linear Regression Estimates of All SIGACTs on Leads of Civilian Casualties (Afghanistan)
(1) (2) (3) (4) (5) (6) DV: SIGACTs (t) SIGACTs (t) SIGACTs (t) Lead MA Lead MA Lead MAD Lead MAD ISAF Generated Civilian Casualties Civilian casualties at t 0.317*** 0.0923 0.0882 0.0427*** 0.0236 0.00586** (0.11) (0.11) (0.093) (0.010) (0.031) (0.0027) Civilian casualties at t+1 0.278** 0.0204 0.125* 0.0626 0.0527 0.0201 (0.13) (0.082) (0.064) (0.092) (0.046) (0.030) Civilian casualties at t+2 0.336* 0.0772 0.0810 0.0970 0.00903 0.0488 (0.18) (0.14) (0.073) (0.063) (0.037) (0.046) Civilian casualties at t+3 0.402** 0.133 0.157* 0.0450 0.0755 0.00408 (0.16) (0.11) (0.093) (0.074) (0.054) (0.037) Civilian casualties at t+4 0.371** 0.101 0.172 0.123 0.0210 0.0708 (0.15) (0.084) (0.10) (0.090) (0.047) (0.053) Joint F-test 2.69 1.51 1.91 1.45 1.05 0.93 (p-value) (0.01) (0.13) (0.06) (0.15) (0.29) (0.35) Insurgent Generated Civilian Casualties Civilian casualties at t 0.127*** 0.100** 0.0659* 0.127 0.0157** 0.0149 (0.047) (0.040) (0.037) (0.099) (0.0076) (0.046) Civilian casualties at t+1 0.0646*** 0.0443*** 0.0854** 0.0577* 0.0336** 0.0145* (0.022) (0.016) (0.039) (0.034) (0.013) (0.0075) Civilian casualties at t+2 0.0212 -0.00125 0.0825** 0.0773** 0.0305* 0.0325** (0.016) (0.014) (0.032) (0.036) (0.016) (0.013) Civilian casualties at t+3 0.0353*** 0.0112 0.0529** 0.0749** 0.0233** 0.0295* (0.012) (0.0073) (0.023) (0.029) (0.011) (0.015) Civilian casualties at t+4 0.0331** 0.0143 0.0268** 0.0481** 0.00755 0.0226** (0.013) (0.010) (0.011) (0.021) (0.0050) (0.011) Joint F-test 2.92 2.42 2.47 2.44 2.30 2.27 (p-value) (0.004) (0.02) (0.01) (0.02) (0.02) (0.02) Lagged MA of DV N Y Y Y Y Y Spatial Lag of Dependent Variable N N N Y N Y Observations 31104 30720 30720 30696 30720 30696 R-squared 0.51 0.65 0.68 0.69 0.47 0.47 Note: All models include district and month fixed effects. Where included, coefficients for moving average, mean absolute deviation, and spatial lag of the dependent variable not shown. Robust standard errors, clustered on district, in parentheses. *** p<0.01, ** p<0.05, * p<0.1.

60 of 85
Appendix Table 4: Placebo Tests for Main Tables 3 and 4: Linear Regression Estimates of IEDs on Leads of Civilian Casualties (Afghanistan)
(1) (2) (3) (4) (5) (6) DV: IEDs (t) Base Model Lagged MA Lead MA Lead MA Lead MAD Lead MAD ISAF Generated Civilian Casualties Civilian casualties at t 0.125** 0.0585 0.0890* 0.0469*** 0.0281 0.0131*** (0.052) (0.037) (0.047) (0.0057) (0.029) (0.0035) Civilian casualties at t+1 0.156*** 0.0777* 0.0616 0.0751* 0.0352 0.0242 (0.057) (0.044) (0.040) (0.044) (0.024) (0.028) Civilian casualties at t+2 0.112** 0.0339 0.0517 0.0444 0.0293 0.0303 (0.056) (0.047) (0.038) (0.036) (0.020) (0.023) Civilian casualties at t+3 0.126** 0.0428* 0.0808* 0.0366 0.0321 0.0250 (0.056) (0.026) (0.045) (0.036) (0.025) (0.020) Civilian casualties at t+4 0.173** 0.0901 0.0771** 0.0646 0.0220 0.0276 (0.081) (0.056) (0.037) (0.043) (0.016) (0.024) Joint F-test 2.65 2.46 1.89 1.57 1.63 1.41 (p-value) (0.01) (0.01) (0.06) (0.11) (0.10) (0.16) Insurgent Generated Civilian Casualties Civilian casualties at t 0.0564** 0.0497* 0.0164* 0.0595* 0.00345 0.0171 (0.028) (0.026) (0.0090) (0.033) (0.0051) (0.017) Civilian casualties at t+1 0.0152 0.00841 0.0288** 0.0126 0.0175* 0.00240 (0.0099) (0.0073) (0.013) (0.0079) (0.011) (0.0050) Civilian casualties at t+2 0.00917 0.00132 0.0258** 0.0246** 0.0167 0.0163 (0.0063) (0.0044) (0.013) (0.012) (0.010) (0.010) Civilian casualties at t+3 0.0133** 0.00507 0.0199** 0.0215* 0.0137 0.0155 (0.0060) (0.0036) (0.0100) (0.012) (0.0092) (0.010) Civilian casualties at t+4 0.0117 0.00356 0.00615 0.0171* 0.00121 0.0129 (0.0076) (0.0045) (0.0038) (0.0092) (0.0027) (0.0090) Joint F-test 1.91 1.68 2.17 1.97 1.65 1.57 (p-value) (0.06) (0.09) (0.03) (0.05) (0.10) (0.12) Spatial Lag of Dependent Variable Observations 31104 30720 30720 30696 30720 30696 R-squared 0.36 0.48 0.59 0.61 0.41 0.41 Note: All models include district and month fixed effects. Where included, coefficients for moving average, mean absolute deviation, and spatial lag of the dependent variable not shown. Robust standard errors, clustered on district, in parentheses. *** p<0.01, ** p<0.05, * p<0.1.

61 of 85
Appendix Table 5. Placebo Tests for Main Tables 3 and 4: Linear Regression Estimates of Direct Fire on Leads of Civilian Casualties (Afghanistan)
(1) (2) (3) (4) (5) (6) DV: Direct Fire (t) Base Model Lagged MA Lead MA Lead MA Lead MAD Lead MAD ISAF Generated Civilian Casualties Civilian casualties at t 0.164** 0.0201 -0.00412 0.0375** -0.000974 0.00874 (0.073) (0.083) (0.054) (0.015) (0.032) (0.0054) Civilian casualties at t+1 0.0801 -0.0681 0.0409 -0.0144 0.0329 -0.00337 (0.082) (0.076) (0.037) (0.054) (0.028) (0.032) Civilian casualties at t+2 0.194 0.0523 0.0128 0.0331 -0.0397 0.0310 (0.14) (0.10) (0.054) (0.036) (0.031) (0.028) Civilian casualties at t+3 0.306** 0.174 0.0786 -0.00517 0.0439 -0.0439 (0.14) (0.11) (0.055) (0.057) (0.045) (0.032) Civilian casualties at t+4 0.125 -0.0211 0.108 0.0611 0.0366 0.0398 (0.092) (0.051) (0.080) (0.052) (0.047) (0.044) Joint F-test 1.94 0.88 1.47 1.14 0.67 0.56 (p-value) (0.05) (0.38) (0.14) (0.03) (0.50) (0.58) Insurgent Generated Civilian Casualties Civilian casualties at t 0.0518*** 0.0359** 0.0353 0.0912 0.00803 0.0326 (0.018) (0.015) (0.028) (0.078) (0.0060) (0.046) Civilian casualties at t+1 0.0404*** 0.0286*** 0.0385 0.0320 0.0141 0.00725 (0.0100) (0.0076) (0.025) (0.026) (0.0090) (0.0056) Civilian casualties at t+2 0.00644 -0.00719 0.0368** 0.0353 0.00867 0.0133 (0.0078) (0.0089) (0.018) (0.024) (0.011) (0.0085) Civilian casualties at t+3 0.0240*** 0.0101*** 0.0229** 0.0344** 0.0107** 0.00811 (0.0076) (0.0037) (0.010) (0.016) (0.0045) (0.011) Civilian casualties at t+4 0.0236** 0.0148* 0.0172*** 0.0213** 0.00591*** 0.0104** (0.0096) (0.0077) (0.0052) (0.0094) (0.0022) (0.0043) Joint F-test 3.51 3.14 2.07 2.09 1.61 1.60 (p-value) (0.00) (0.00) (0.04) (0.04) (0.11) (0.11) Spatial Lag of Dependent Variable Observations 31104 30720 30720 30696 30720 30696 R-squared 0.42 0.59 0.61 0.61 0.43 0.43 Note: All models include district and month fixed effects. Where included, coefficients for moving average, mean absolute deviation, and spatial lag of the dependent variable not shown. Robust standard errors, clustered on district, in parentheses. *** p<0.01, ** p<0.05, * p<0.1.

62 of 85
Appendix Table 6. Linear Regression Estimates of SIGACTs on Civilian Casualties, Including Spatial Lags for Civilian Casualty Variables (Afghanistan)
(1) (2) (3) (4) (5) (6) DV: SIGACTs (t) Base Model Lagged MA Lead MA Lead MA Lead MAD Lead MAD ISAF Generated Civilian Casualties Civilian casualties at t (spatial lag) 0.114** 0.0120 0.0209 0.0488*** -0.00526 0.00688** (0.045) (0.029) (0.030) (0.011) (0.011) (0.0032) Civilian casualties at t-1 (spatial lag) 0.0379 -0.0559** 0.0481 -0.00732 0.0181 -0.00939 (0.033) (0.028) (0.031) (0.030) (0.015) (0.011) Civilian casualties at t-2 (spatial lag) 0.103** 0.0473 0.0557* 0.0386 0.0257* 0.0148 (0.045) (0.042) (0.034) (0.030) (0.014) (0.016) Civilian casualties at t-3 (spatial lag) 0.100** 0.0325 0.0587 0.0301 0.0110 0.0194 (0.045) (0.034) (0.038) (0.034) (0.011) (0.016) Civilian casualties at t-4 (spatial lag) 0.184*** 0.0862* 0.0209 0.0369 -0.0170 0.00823 (0.064) (0.052) (0.034) (0.038) (0.013) (0.012) Joint F-test 0.426 0.110 0.183 0.0960 0.0378 0.0216 (p-value) (0.003) (0.120) (0.092) (0.368) (0.273) (0.568) Insurgent Generated Civilian Casualties Civilian casualties at t (spatial lag) 0.0334*** 0.0162** 0.0161*** -0.00959 0.0000395 -0.0209 (0.011) (0.0068) (0.0056) (0.033) (0.0021) (0.013) Civilian casualties at t-1 (spatial lag) 0.0290*** 0.00951* 0.0144*** 0.00579 0.000267 -0.00148 (0.0087) (0.0052) (0.0051) (0.0042) (0.0018) (0.0021) Civilian casualties at t-2 (spatial lag) 0.0165** -0.00245 0.0119*** 0.00702* 0.000232 -0.000736 (0.0072) (0.0049) (0.0042) (0.0041) (0.0017) (0.0018) Civilian casualties at t-3 (spatial lag) 0.0268*** 0.00899** 0.00849** 0.00752** -0.000206 -0.000386 (0.0072) (0.0045) (0.0034) (0.0035) (0.0014) (0.0016) Civilian casualties at t-4 (spatial lag) 0.0298*** 0.0118*** 0.00684* 0.00176 0.00345 -0.00112 (0.0072) (0.0043) (0.0041) (0.0032) (0.0027) (0.0014) Joint F-test 0.102 0.0279 0.0417 0.0169 0.00375 0.000308 (p-value) (0.000) (0.004) (0.003) (0.104) (0.376) (0.942) Spatial Lag of Dependent Variable Observations 31076 31076 30692 30692 29924 29924 R-squared 0.50 0.64 0.65 0.66 0.47 0.47 Note: All models include district and month fixed effects. Where included, coefficients for moving average, mean absolute deviation, and spatial lag of the dependent variable not shown. Robust standard errors, clustered on district, in parentheses. *** p<0.01, ** p<0.05, * p<0.1.

63 of 85
Appendix Table 7: Linear Regression Estimates of IEDs on Civilian Casualties, Including Spatial Lags for Civilian Casualty Variables (Afghanistan)
(1) (2) (3) (4) (5) (6) DV: IEDs (t) Base Model Lagged MA Lead MA Lead MA Lead MAD Lead MAD ISAF Generated Civilian Casualties Civilian casualties at t (spatial lag) 0.0713*** 0.0319* 0.00968 0.0486*** 0.00292 0.0132*** (0.024) (0.019) (0.017) (0.0061) (0.0077) (0.0035) Civilian casualties at t-1 (spatial lag) 0.0314* -0.00751 0.0129 -0.00396 0.0143** -0.000741 (0.017) (0.015) (0.017) (0.017) (0.0072) (0.0073) Civilian casualties at t-2 (spatial lag) 0.0401* 0.0114 0.0188 0.00904 0.00422 0.0120* (0.021) (0.021) (0.019) (0.016) (0.0073) (0.0069) Civilian casualties at t-3 (spatial lag) 0.0376 0.0100 0.0380** 0.00846 0.00102 -0.000710 (0.024) (0.021) (0.019) (0.019) (0.0060) (0.0080) Civilian casualties at t-4 (spatial lag) 0.0788*** 0.0453** 0.0361** 0.0215 0.000342 -0.00324 (0.023) (0.021) (0.017) (0.018) (0.0058) (0.0065) Joint F-test 0.188 0.0593 0.106 0.0607 0.0199 0.00469 (p-value) (0.002) (0.117) (0.084) (0.317) (0.241) (0.788) Insurgent Generated Civilian Casualties Civilian casualties at t (spatial lag) 0.0139*** 0.00611** 0.00919*** 0.0217 0.00198 -0.00332 (0.0043) (0.0031) (0.0026) (0.016) (0.0015) (0.0056) Civilian casualties at t-1 (spatial lag) 0.0164*** 0.00862*** 0.00706*** 0.00390* 0.00170 0.000495 (0.0042) (0.0030) (0.0021) (0.0024) (0.0012) (0.0013) Civilian casualties at t-2 (spatial lag) 0.0119** 0.00434 0.00600*** 0.00394** 0.00156 0.000896 (0.0048) (0.0034) (0.0021) (0.0019) (0.0015) (0.0011) Civilian casualties at t-3 (spatial lag) 0.0136*** 0.00627*** 0.00504*** 0.00318 0.00238** 0.000798 (0.0031) (0.0022) (0.0019) (0.0020) (0.00099) (0.0014) Civilian casualties at t-4 (spatial lag) 0.0113*** 0.00349 0.00526* 0.00182 0.00312** 0.00154* (0.0031) (0.0023) (0.0027) (0.0018) (0.0014) (0.00092) Joint F-test 0.0531 0.0227 0.0234 0.0115 0.00875 0.00563 (p-value) (0.000) (0.000) (0.001) (0.079) (0.015) (0.072) Spatial Lag of Dependent Variable Observations 31076 31076 30692 30692 29924 29924 R-squared 0.36 0.46 0.56 0.58 0.40 0.40 Note: All models include district and month fixed effects. Where included, coefficients for moving average, mean absolute deviation, and spatial lag of the dependent variable not shown. Robust standard errors, clustered on district, in parentheses. *** p<0.01, ** p<0.05, * p<0.1.

64 of 85
Appendix Table 8: Linear Regression Estimates of Direct Fire on Civilian Casualties, Including Spatial Lags for Civilian Casualty Variables (Afghanistan)
(1) (2) (3) (4) (5) (6) DV: Direct Fire (t) Base Model Lagged MA Lead MA Lead MA Lead MAD Lead MAD ISAF Generated Civilian Casualties Civilian casualties at t (spatial lag) 0.0427** -0.00571 0.0140 0.0412*** -0.00582 0.00911 (0.021) (0.013) (0.014) (0.015) (0.0074) (0.0059) Civilian casualties at t-1 (spatial lag) 0.0149 -0.0258 0.0346** 0.00193 0.00980 -0.00866 (0.020) (0.017) (0.017) (0.014) (0.0096) (0.0079) Civilian casualties at t-2 (spatial lag) 0.0464* 0.0276 0.0464** 0.0292* 0.0127 0.00744 (0.025) (0.024) (0.021) (0.017) (0.0089) (0.0099) Civilian casualties at t-3 (spatial lag) 0.0691** 0.0397* 0.0408* 0.0370* 0.00154 0.00906 (0.029) (0.022) (0.024) (0.020) (0.0066) (0.0094) Civilian casualties at t-4 (spatial lag) 0.0997** 0.0489 0.00537 0.0320 -0.0174* -0.000251 (0.045) (0.034) (0.020) (0.023) (0.0091) (0.0069) Joint F-test 0.230 0.0905 0.127 0.0903 0.00657 -0.00383 (p-value) (0.011) (0.036) (0.063) (0.172) (0.794) (0.887) Insurgent Generated Civilian Casualties Civilian casualties at t (spatial lag) 0.0146** 0.00828** 0.00501 -0.00783 -0.000710 -0.0201** (0.0069) (0.0041) (0.0031) (0.020) (0.0011) (0.0095) Civilian casualties at t-1 (spatial lag) 0.0110** 0.00331 0.00478 0.00173 -0.000755 -0.00147 (0.0054) (0.0027) (0.0032) (0.0022) (0.0013) (0.0011) Civilian casualties at t-2 (spatial lag) 0.00191 -0.00620* 0.00560** 0.00225 -0.000504 -0.00130 (0.0033) (0.0032) (0.0028) (0.0026) (0.0011) (0.0013) Civilian casualties at t-3 (spatial lag) 0.0113** 0.00462 0.00496** 0.00430* -0.000154 -0.000793 (0.0046) (0.0029) (0.0021) (0.0023) (0.0010) (0.0011) Civilian casualties at t-4 (spatial lag) 0.0142*** 0.00763** 0.00428* 0.00212 0.00195 -0.000761 (0.0051) (0.0030) (0.0023) (0.0021) (0.0013) (0.0011) Joint F-test 0.0385 0.00935 0.0196 0.0103 0.000540 -0.00150 (p-value) (0.017) (0.139) (0.022) (0.134) (0.873) (0.670) Spatial Lag of Dependent Variable Observations 31076 31076 30692 30692 29924 29924 R-squared 0.42 0.58 0.58 0.59 0.43 0.43 Note: All models include district and month fixed effects. Where included, coefficients for moving average, mean absolute deviation, and spatial lag of the dependent variable not shown. Robust standard errors, clustered on district, in parentheses. *** p<0.01, ** p<0.05, * p<0.01.

65 of 85
Appendix Table 9: Matching Estimate of Impact of ISAF or Insurgent Killings in period t on lead moving average of SIGACTs/1,000 (Afghanistan)
DV = 3-period lead moving average, SIGACTs/1,000 from period t
(1)
t-2
(2)
t-1
(3) t
(4)
t +1
(5)
t +2
Panel A: Effect of ISAF-caused civilian casualties
Marginal Effects -0.019 -0.006 0.031 0.083 0.097
[-0.04– 0.000] [-0.02 – 0.01] [0.01 – 0.06] [0.05 – 0.11] [0.06 – 0.13] N of Matched District Weeks 5337 5337 5337 5327 5291
Panel B: Effect of insurgent-caused civilian casualties
Marginal Effects
0.035 0.052 0.035 0.020 0.004
[0.02 – 0.05] [0.04 – 0.07] [0.02 – 0.05] [-0.00 – 0.04] [-0.02 – 0.03] N of Matched District Weeks
5337 5337 5337 5327 5291
Results significant at 95% level in two-tailed test in bold with 95% confidence intervals in brackets. Matched on SIGACTs/1,000 population in period t, three-period lagged moving average of SIGACTs in t through t-3, ethnicity and quarter, this created 2,135 strata of which 1,723 had three or more district/bi-months. 148 of 902 district/bi-months with civilian casualties had no matching unit without civilian casualties. Multivariate L1 distance for match = 0.746. Estimates of Civilian Casualties and SIGACTs scaled per 1000 in the population based on LandScan population estimates. Strata with greater than 200 district/bi-months dropped. Civilian casualties estimates based on data from the Civilian Casualties Tracking Cell, International Security Assistance Forces (ISAF) headquarters. District classification based on National Geospatial Agency (NGA) shape files on ethnic areas in Afghanistan. Violent Events based on data on significant actions (SIGACTs) against ISAF. SIGACTs include direct fire, indirect fire, improvised explosive device explosions. Excludes improvised explosive devices found and cleared, improvised explosive device hoaxes, and premature detonations.

66 of 85
Appendix Table 10. Linear Regression Estimates of IEDs on Civilian Casualties (Iraq)
(1) (2) (3) (4) (5) (6) DV: IEDs (t) Base Model Lagged MA Lead MA Lead MA Lead MAD Lead MAD Coalition Generated Civilian Casualties Civilian casualties at t 0.0000269 0.0000247 0.0000112 0.0000105 0.0000117 0.0000113 (0.000044) (0.000018) (0.000027) (0.000027) (0.000010) (0.000010) Civilian casualties at t-1 0.00000386 -0.0000108 0.00000935 0.00000915 0.0000123 0.0000122 (0.000045) (0.000016) (0.000035) (0.000035) (0.0000085) (0.0000088) Civilian casualties at t-2 0.0000141 -0.00000431 0.0000208 0.0000206 0.0000238 0.0000237 (0.000061) (0.000033) (0.000040) (0.000040) (0.000023) (0.000023) Civilian casualties at t-3 0.0000261 0.0000114 0.0000286 0.0000279 0.0000196 0.0000193 (0.000068) (0.000033) (0.000033) (0.000032) (0.000020) (0.000020) Civilian casualties at t-4 0.0000449 0.0000279 0.0000297 0.0000291 0.0000205 0.0000201 (0.000060) (0.000021) (0.000023) (0.000024) (0.000015) (0.000016) Joint F-test 8.90e-05 2.43e-05 8.84e-05 8.66e-05 7.62e-05 7.53e-05 (p-value) (0.696) (0.766) (0.498) (0.509) (0.246) (0.254) Insurgent Generated Civilian Casualties Civilian casualties at t 0.000229* 0.0000428 0.000258 0.000263 0.000141* 0.000143* (0.00013) (0.000057) (0.00022) (0.00022) (0.000082) (0.000082) Civilian casualties at t-1 0.000480* 0.000284 0.000260 0.000264 0.0000977* 0.0000998* (0.00025) (0.00018) (0.00026) (0.00026) (0.000056) (0.000057) Civilian casualties at t-2 0.000386* 0.000124 0.000153 0.000160 0.00000424 0.00000777 (0.00021) (0.000089) (0.00024) (0.00024) (0.000035) (0.000036) Civilian casualties at t-3 0.000386 0.0000631 0.0000870 0.0000962 0.00000427 0.00000850 (0.00037) (0.00021) (0.00020) (0.00020) (0.000037) (0.000037) Civilian casualties at t-4 0.000478 0.000114 0.0000614 0.0000731 0.0000223 0.0000278 (0.00042) (0.00020) (0.000084) (0.000085) (0.000021) (0.000021) Joint F-test 0.00173 0.000585 0.000561 0.000593 0.000123 0.000144 (p-value) (0.160) (0.343) (0.458) (0.435) (0.297) (0.255) Spatial Lag of Dependent Variable N N N Y N Y Observations 12896 12896 12792 12792 12584 12584 R-squared 0.57 0.83 0.83 0.83 0.60 0.61 Note: All models include district and month fixed effects. Where included, coefficients for moving average, mean absolute deviation, and spatial lag of the dependent variable not shown. Robust standard errors, clustered on district, in parentheses. *** p<0.01, ** p<0.05, * p<0.1

67 of 85
Appendix Table 11. Linear Regression Estimates of Direct Fire on Civilian Casualties (Iraq)
(1) (2) (3) (4) (5) (6) DV: Direct Fire (t) Base Model Lagged MA Lead MA Lead MA Lead MAD Lead MAD Coalition Generated Civilian Casualties Civilian casualties at t 0.0000721 0.0000588* 0.0000657** 0.0000652** 0.0000310* 0.0000307* (0.000067) (0.000031) (0.000025) (0.000026) (0.000016) (0.000016) Civilian casualties at t-1 0.0000533 0.0000144* 0.0000372 0.0000384 0.0000244*** 0.0000250*** (0.000050) (0.0000078) (0.000026) (0.000027) (0.0000060) (0.0000062) Civilian casualties at t-2 0.000102* 0.0000461** 0.00000661 0.00000822 0.0000151 0.0000158 (0.000058) (0.000022) (0.000034) (0.000034) (0.0000097) (0.0000097) Civilian casualties at t-3 0.0000734 0.00000620 0.00000169 0.00000298 0.0000116 0.0000122 (0.000060) (0.000018) (0.000042) (0.000042) (0.000017) (0.000016) Civilian casualties at t-4 0.0000389 -0.0000297 0.00000497 0.00000687 0.00000937 0.0000103 (0.000060) (0.000022) (0.000050) (0.000050) (0.000014) (0.000014) Joint F-test 0.000268 3.70e-05 5.05e-05 5.65e-05 6.04e-05 6.33e-05 (p-value) (0.232) (0.511) (0.736) (0.708) (0.173) (0.155) Insurgent Generated Civilian Casualties Civilian casualties at t 0.000582* 0.000171 0.000212 0.000220 0.0000497 0.0000535 (0.00031) (0.00015) (0.00027) (0.00027) (0.000078) (0.000079) Civilian casualties at t-1 0.000435 -0.0000169 0.000223 0.000234 0.0000268 0.0000318 (0.00027) (0.000076) (0.00029) (0.00029) (0.000045) (0.000045) Civilian casualties at t-2 0.000600 0.000173 0.000196 0.000207 -0.0000105 -0.00000551 (0.00039) (0.00018) (0.00027) (0.00027) (0.000020) (0.000020) Civilian casualties at t-3 0.000534 0.0000867 0.000216 0.000225 0.0000142 0.0000184 (0.00043) (0.00020) (0.00026) (0.00026) (0.000040) (0.000040) Civilian casualties at t-4 0.000550 0.000127 0.000208 0.000219 0.0000649 0.0000700 (0.00038) (0.000099) (0.00020) (0.00021) (0.000086) (0.000087) Joint F-test 0.00212 0.000370 0.000844 0.000885 9.54e-05 0.000115 (p-value) (0.147) (0.479) (0.408) (0.391) (0.574) (0.506) Spatial Lag of Dependent Variable N N N Y N Y Observations 12896 12896 12792 12792 12584 12584 R-squared 0.49 0.78 0.72 0.72 0.57 0.58 Note: All models include district and month fixed effects. Where included, coefficients for moving average, mean absolute deviation, and spatial lag of the dependent variable not shown. Robust standard errors, clustered on district, in parentheses. *** p<0.01, ** p<0.05, * p<0.1

68 of 85
Appendix Table 12. Placebo Tests for Main Table 6: Linear Regression Estimates of All SIGACTs on Leads of Civilian Casualties (Iraq)
(1) (2) (3) (4) (5) (6) DV: SIGACTs (t) Base Model Lagged MA Lead MA Lead MA Lead MAD Lead MAD Coalition Generated Civilian Casualties Civilian casualties at t 0.000173 0.000107** 0.0000868 0.0000867 0.0000320 0.0000320 (0.00015) (0.000051) (0.000064) (0.000065) (0.000027) (0.000028) Civilian casualties at t+1 0.000188 0.000174*** 0.000123** 0.000123** 0.0000586 0.0000586 (0.00013) (0.000035) (0.000058) (0.000059) (0.000036) (0.000037) Civilian casualties at t+2 0.0000343 0.0000417 0.000155*** 0.000156*** 0.0000424** 0.0000429** (0.00013) (0.000034) (0.000059) (0.000059) (0.000020) (0.000021) Civilian casualties at t+3 -0.0000333 -0.00000905 0.000134** 0.000135** 0.0000499*** 0.0000503*** (0.00012) (0.000030) (0.000061) (0.000062) (0.000014) (0.000015) Civilian casualties at t+4 -0.0000153 0.0000294 0.000121 0.000123 0.000113*** 0.000114*** (0.00013) (0.00011) (0.00010) (0.00010) (0.000012) (0.000012) Joint F-test 0.000174 0.000236 0.000534 0.000539 0.000264 0.000266 (p-value) (0.733) (0.140) (0.043) (0.044) (0.000) (0.000) Insurgent Generated Civilian Casualties Civilian casualties at t 0.00116* 0.000414 0.000469 0.000483 0.000198 0.000204 (0.00060) (0.00029) (0.00059) (0.00060) (0.00016) (0.00016) Civilian casualties at t+1 0.000809** 0.00000878 0.000403 0.000417 0.000203 0.000209 (0.00039) (0.00018) (0.00039) (0.00040) (0.00016) (0.00016) Civilian casualties at t+2 0.000828* 0.0000682 0.000346 0.000360 0.000187 0.000193 (0.00042) (0.00017) (0.00033) (0.00034) (0.00014) (0.00014) Civilian casualties at t+3 0.000895* 0.000170 0.000309 0.000323 0.000189 0.000195 (0.00047) (0.00022) (0.00030) (0.00030) (0.00012) (0.00012) Civilian casualties at t+4 0.000903** 0.000268 0.000239 0.000252 0.000111* 0.000117* (0.00044) (0.00026) (0.00027) (0.00027) (0.000064) (0.000065) Joint F-test 0.00344 0.000515 0.00130 0.00135 0.000690 0.000714 (p-value) (0.039) (0.417) (0.305) (0.290) (0.132) (0.122) Spatial Lag of Dependent Variable N N N Y N Y Observations 12896 12792 12792 12792 12792 12792 R-squared 0.59 0.88 0.85 0.85 0.60 0.61 Note: All models include district and month fixed effects. Where included, coefficients for moving average, mean absolute deviation, and spatial lag of the dependent variable not shown. Robust standard errors, clustered on district, in parentheses. *** p<0.01, ** p<0.05, * p<0.1

69 of 85
Appendix Table 13. Placebo Tests for Appendix Table 10: Linear Regression Estimates of IEDs on Leads of Civilian Casualties (Iraq)
(1) (2) (3) (4) (5) (6) DV: IEDs (t) Base Model Lagged MA Lead MA Lead MA Lead MAD Lead MAD Coalition Generated Civilian Casualties Civilian casualties at t 0.0000329 0.0000241 0.0000128 0.0000122 0.0000128 0.0000124 (0.000044) (0.000016) (0.000027) (0.000027) (0.000011) (0.000011) Civilian casualties at t+1 0.0000262 0.0000225** 0.0000139 0.0000130 0.0000200 0.0000196 (0.000043) (0.000010) (0.000018) (0.000019) (0.000014) (0.000015) Civilian casualties at t+2 0.00000153 -0.000000776 0.0000190 0.0000190 0.0000129 0.0000129 (0.000047) (0.000013) (0.000015) (0.000015) (0.0000087) (0.0000088) Civilian casualties at t+3 -0.000000467 0.00000448 0.0000215 0.0000220 0.0000136*** 0.0000139*** (0.000049) (0.000018) (0.000017) (0.000017) (0.0000050) (0.0000050) Civilian casualties at t+4 -0.00000223 0.0000104 0.0000163 0.0000172 0.0000149** 0.0000153** (0.000047) (0.000039) (0.000039) (0.000039) (0.0000072) (0.0000072) Joint F-test 2.50e-05 3.65e-05 7.07e-05 7.12e-05 6.15e-05 6.17e-05 (p-value) (0.892) (0.539) (0.355) (0.360) (0.057) (0.060) Insurgent Generated Civilian Casualties Civilian casualties at t 0.000262* 0.0000570 0.000248 0.000254 0.000126 0.000129 (0.00015) (0.000067) (0.00023) (0.00024) (0.000078) (0.000079) Civilian casualties at t+1 0.000194 -0.0000186 0.000201 0.000209 0.0000659 0.0000696 (0.00014) (0.00010) (0.00014) (0.00014) (0.000071) (0.000072) Civilian casualties at t+2 0.000266* 0.0000682 0.000144 0.000150 0.0000881 0.0000912 (0.00016) (0.000090) (0.00012) (0.00012) (0.000057) (0.000057) Civilian casualties at t+3 0.000283** 0.0000948 0.0000647 0.0000712 0.0000813** 0.0000845** (0.00013) (0.000067) (0.000093) (0.000094) (0.000034) (0.000035) Civilian casualties at t+4 0.000191 0.00000234 0.0000529 0.0000632 0.0000368* 0.0000420* (0.00015) (0.000099) (0.000087) (0.000089) (0.000022) (0.000024) Joint F-test 0.000934 0.000147 0.000463 0.000493 0.000272 0.000287 (p-value) (0.070) (0.505) (0.249) (0.224) (0.110) (0.098) Spatial Lag of Dependent Variable N N N Y N Y Observations 12896 12792 12792 12792 12792 12792 R-squared 0.57 0.83 0.83 0.83 0.60 0.61 Note: All models include district and month fixed effects. Where included, coefficients for moving average, mean absolute deviation, and spatial lag of the dependent variable not shown. Robust standard errors, clustered on district, in parentheses. *** p<0.01, ** p<0.05, * p<0.1

70 of 85
Appendix Table 14. Placebo Tests for Appendix Table 11: Linear Regression Estimates of Direct Fire on Leads of Civilian Casualties (Iraq)
(1) (2) (3) (4) (5) (6) Dependent Variable: Direct Fire (t) Base Model Lagged MA Lead MA Lead MA Lead MAD Lead MAD Coalition Generated Civilian Casualties Civilian casualties at t 0.0000835 0.0000573** 0.0000657** 0.0000623*** 0.0000296* 0.0000294* (0.000066) (0.000027) (0.000025) (0.000024) (0.000016) (0.000016) Civilian casualties at t+1 0.0000678 0.0000562*** 0.0000372 0.0000717*** 0.0000265 0.0000267 (0.000053) (0.000020) (0.000026) (0.000025) (0.000018) (0.000018) Civilian casualties at t+2 0.0000174 0.0000106 0.00000661 0.0000622** 0.0000167** 0.0000172** (0.000054) (0.000019) (0.000034) (0.000029) (0.0000080) (0.0000082) Civilian casualties at t+3 -0.00000856 -0.0000114 0.00000169 0.0000448 0.0000180** 0.0000182** (0.000045) (0.000011) (0.000042) (0.000033) (0.0000078) (0.0000079) Civilian casualties at t+4 0.00000816 0.0000229 0.00000497 0.0000386 0.0000318*** 0.0000323*** (0.000060) (0.000058) (0.000050) (0.000053) (0.0000079) (0.0000080) Joint F-test 8.48e-05 7.84e-05 0.000214 0.000217 9.31e-05 9.45e-05 (p-value) (0.683) (0.344) (0.106) (0.106) (0.006) (0.007) Insurgent Generated Civilian Casualties Civilian casualties at t 0.000573* 0.000160 0.000212 0.000208 0.0000294 0.0000338 (0.00032) (0.00015) (0.00027) (0.00027) (0.000071) (0.000071) Civilian casualties at t+1 0.000523** 0.000108 0.000223 0.000226 0.000123 0.000127 (0.00026) (0.00012) (0.00029) (0.00023) (0.00011) (0.00011) Civilian casualties at t+2 0.000509** 0.000154 0.000196 0.000251 0.000121 0.000125 (0.00025) (0.00011) (0.00027) (0.00021) (0.000084) (0.000085) Civilian casualties at t+3 0.000455** 0.000130 0.000216 0.000300 0.0000992 0.000102 (0.00022) (0.000092) (0.00026) (0.00020) (0.000066) (0.000066) Civilian casualties at t+4 0.000487** 0.000229* 0.000208 0.000293* 0.0000687 0.0000705* (0.00021) (0.00013) (0.00020) (0.00017) (0.000042) (0.000042) Joint F-test 0.00197 0.000621 0.00104 0.00107 0.000412 0.000425 (p-value) (0.032) (0.117) (0.192) (0.183) (0.163) (0.151) Spatial Lag of Dependent Variable N N N Y N Y Observations 12896 12792 12792 12792 12792 12792 R-squared 0.49 0.78 0.72 0.72 0.58 0.58 Note: All models include district and month fixed effects. Where included, coefficients for moving average, mean absolute deviation, and spatial lag of the dependent variable not shown. Robust standard errors, clustered on district, in parentheses. *** p<0.01, ** p<0.05, * p<0.1

71 of 85
Appendix Table 15: Linear Regression Estimates of SIGACTs on Civilian Casualties, Including Spatial Lags for Civilian Casualty Variables (Iraq)
(1) (2) (3) (4) (5) (6) Dependent Variable: SIGACTs (t) Base Model Lagged MA Lead MA Lead MA Lead MAD Lead MAD Coalition Generated Civilian Casualties Civilian casualties at t (spatial lag) -0.0000302 0.000102** 0.0000134 0.0000122 0.00000150 0.00000106 (0.000061) (0.000045) (0.000022) (0.000021) (0.0000089) (0.0000087) Civilian casualties at t-1 (spatial lag) -0.000110 -0.0000414** -0.0000359 -0.0000338 0.00000122 0.00000224 (0.000083) (0.000021) (0.000022) (0.000021) (0.0000072) (0.0000067) Civilian casualties at t-2 (spatial lag) -0.0000921 -0.0000398** -0.0000483** -0.0000463** -0.00000319 -0.00000222 (0.000074) (0.000020) (0.000021) (0.000020) (0.0000060) (0.0000053) Civilian casualties at t-3 (spatial lag) -0.0000902 -0.0000217 -0.0000346** -0.0000335** -0.00000513 -0.00000457 (0.000079) (0.000018) (0.000017) (0.000017) (0.0000045) (0.0000043) Civilian casualties at t-4 (spatial lag) -0.0000941 -0.0000167 -0.0000218** -0.0000197** -0.000000911 0.000000110 (0.000062) (0.000013) (0.0000094) (0.0000088) (0.0000063) (0.0000067) Joint F-test -0.000386 -0.000120 -0.000141 -0.000133 -8.01e-06 -4.44e06 (p-value) (0.194) (0.019) (0.034) (0.034) (0.528) (0.688) Insurgent Generated Civilian Casualties Civilian casualties at t (spatial lag) 0.000584** 0.0000534 -0.0000199 -0.0000557 -0.00000806 -0.0000241 (0.00026) (0.000047) (0.000096) (0.00010) (0.000029) (0.000037) Civilian casualties at t-1 (spatial lag) 0.000453** -0.0000457 -0.00000480 -0.0000299 0.0000189 0.00000788 (0.00020) (0.000083) (0.00011) (0.00012) (0.000027) (0.000028) Civilian casualties at t-2 (spatial lag) 0.000393** -0.0000570 0.0000117 -0.0000107 -0.0000137 -0.0000234 (0.00019) (0.00011) (0.00011) (0.00012) (0.000021) (0.000020) Civilian casualties at t-3 (spatial lag) 0.000375* -0.0000374 -0.0000148 -0.0000325 -0.0000229 -0.0000305 (0.00020) (0.000089) (0.00013) (0.00013) (0.000019) (0.000019) Civilian casualties at t-4 (spatial lag) 0.000432** 0.0000809 -0.0000152 -0.0000331 -0.0000430** -0.0000506*** (0.00017) (0.00011) (0.00014) (0.00014) (0.000018) (0.000019) Joint F-test 0.00165 -5.91e-05 -2.30e-05 -0.000106 -6.07e-05 -9.66e-05 (p-value) (0.023) (0.811) (0.958) (0.811) (0.265) (0.092) Spatial Lag of Dependent Variable N N N Y N Y Observations 12896 12896 12792 12792 12584 12584 R-squared 0.59 0.88 0.85 0.85 0.60 0.61 Note: All models include district and month fixed effects. Where included, coefficients for moving average, mean absolute deviation, and spatial lag of the dependent variable not shown. Robust standard errors, clustered on district, in parentheses. *** p<0.01, ** p<0.05, * p<0.1

72 of 85
Appendix Table 16. Linear Regression Estimates of IEDs on Civilian Casualties, Including Spatial Lags for Civilian Casualty Variables (Iraq)
(1) (2) (3) (4) (5) (6) Dependent Variable: IEDs (t) Base Model Lagged MA Lead MA Lead MA Lead MAD Lead MAD Coalition Generated Civilian Casualties Civilian casualties at t (spatial lag) -0.0000291 0.0000257 0.00000828 0.00000818 -0.00000201 -0.00000201 (0.000037) (0.000025) (0.0000093) (0.0000092) (0.0000046) (0.0000045) Civilian casualties at t-1 (spatial lag) -0.0000511 -0.0000200** -0.00000481 -0.00000294 0.00000169 0.00000266 (0.000040) (0.0000096) (0.0000067) (0.0000064) (0.0000034) (0.0000034) Civilian casualties at t-2 (spatial lag) -0.0000349 -0.00000772 -0.00000373 -0.00000134 -0.000000780 0.000000448 (0.000032) (0.0000076) (0.0000084) (0.0000082) (0.0000028) (0.0000026) Civilian casualties at t-3 (spatial lag) -0.0000280 0.00000414 -0.00000275 -0.00000104 -0.00000459 -0.00000370 (0.000032) (0.0000060) (0.0000077) (0.0000077) (0.0000033) (0.0000030) Civilian casualties at t-4 (spatial lag) -0.0000239 0.00000416 -0.00000713 -0.00000682 -0.00000393 -0.00000373 (0.000024) (0.000015) (0.0000059) (0.0000056) (0.0000024) (0.0000024) Joint F-test -0.000138 -1.94e-05 -1.84e-05 -1.12e-05 -7.61e-06 -4.31e-06 (p-value) (0.274) (0.278) (0.486) (0.632) (0.377) (0.574) Insurgent Generated Civilian Casualties Civilian casualties at t (spatial lag) 0.000162* 0.0000146 -0.0000215 -0.0000315 -0.0000222 -0.0000271 (0.000084) (0.000027) (0.000050) (0.000052) (0.000023) (0.000025) Civilian casualties at t-1 (spatial lag) 0.000125* 0.00000447 0.0000158 0.00000513 -0.00000102 -0.00000620 (0.000072) (0.000044) (0.000057) (0.000059) (0.000019) (0.000020) Civilian casualties at t-2 (spatial lag) 0.0000906 -0.0000212 0.0000423 0.0000370 0.00000499 0.00000252 (0.000082) (0.000055) (0.000058) (0.000059) (0.0000093) (0.0000094) Civilian casualties at t-3 (spatial lag) 0.000100 -0.0000114 0.0000172 0.0000145 0.00000244 0.00000130 (0.000084) (0.000052) (0.000054) (0.000054) (0.0000088) (0.0000085) Civilian casualties at t-4 (spatial lag) 0.000162** 0.0000680 0.0000116 0.00000414 -0.0000183 -0.0000219 (0.000074) (0.000042) (0.000050) (0.000051) (0.000014) (0.000014) Joint F-test 0.000478 3.99e-05 8.69e-05 6.07e-05 -1.19e-05 -2.42e-05 (p-value) (0.101) (0.764) (0.661) (0.763) (0.752) (0.538) Spatial Lag of Dependent Variable N N N Y N Y Observations 12896 12896 12792 12792 12584 12584 R-squared 0.57 0.83 0.83 0.83 0.60 0.61 Note: All models include district and month fixed effects. Where included, coefficients for moving average, mean absolute deviation, and spatial lag of the dependent variable not shown. Robust standard errors, clustered on district, in parentheses. *** p<0.01, ** p<0.05, * p<0.1

73 of 85
Appendix Table 17. Linear Regression Estimates of Direct Fire on Civilian Casualties, Including Spatial Lags for Civilian Casualty Variables (Iraq)
(1) (2) (3) (4) (5) (6) DV: Direct Fire (t) Base Model Lagged MA Lead MA Lead MA Lead MAD Lead MAD Coalition Generated Civilian Casualties Civilian casualties at t (spatial lag) 0.0000235 0.0000531*** 0.000000186 -0.00000138 0.00000146 0.000000716 (0.000014) (0.000017) (0.0000086) (0.0000087) (0.0000035) (0.0000035) Civilian casualties at t-1 (spatial lag) -0.0000189 -0.0000130 -0.0000207* -0.0000207* -0.00000393 -0.00000388 (0.000021) (0.0000087) (0.000012) (0.000012) (0.0000037) (0.0000035) Civilian casualties at t-2 (spatial lag) -0.0000283 -0.0000297*** -0.0000287** -0.0000292** -0.00000616* -0.00000635** (0.000020) (0.0000098) (0.000014) (0.000014) (0.0000034) (0.0000032) Civilian casualties at t-3 (spatial lag) -0.0000195 -0.0000130 -0.0000269** -0.0000271** -0.00000394 -0.00000396 (0.000023) (0.000010) (0.000014) (0.000013) (0.0000033) (0.0000032) Civilian casualties at t-4 (spatial lag) -0.0000310 -0.0000137* -0.0000144** -0.0000130** -0.00000293 -0.00000213 (0.000023) (0.0000074) (0.0000067) (0.0000061) (0.0000029) (0.0000028) Joint F-test -9.77e-05 -6.94e05 -9.08e-05 -9.00e-05 -1.70e-05 -1.63e-05 (p-value) (0.258) (0.030) (0.049) (0.044) (0.163) (0.150) Insurgent Generated Civilian Casualties Civilian casualties at t (spatial lag) 0.000199** 0.0000341 0.0000270 0.00000322 0.00000924 -0.00000296 (0.000088) (0.000021) (0.000021) (0.000025) (0.0000089) (0.000011) Civilian casualties at t-1 (spatial lag) 0.000165** 0.0000111 0.0000211 0.00000443 0.00000280 -0.00000561 (0.000075) (0.000025) (0.000025) (0.000026) (0.0000088) (0.0000088) Civilian casualties at t-2 (spatial lag) 0.000134** -0.00000535 0.0000177 0.00000300 -0.0000119 -0.0000192 (0.000063) (0.000041) (0.000037) (0.000036) (0.000011) (0.000012) Civilian casualties at t-3 (spatial lag) 0.000131** -0.00000229 0.0000124 0.00000171 -0.0000263** -0.0000316*** (0.000060) (0.000029) (0.000052) (0.000050) (0.000011) (0.000011) Civilian casualties at t-4 (spatial lag) 0.000113* 0.00000477 0.0000324 0.0000228 -0.0000121 -0.0000168 (0.000059) (0.000033) (0.000066) (0.000064) (0.000012) (0.000012) Joint F-test 0.000543 8.20e-06 8.37e-05 3.19e-05 -4.74e-05 -7.32e-05 (p-value) (0.024) (0.886) (0.601) (0.835) (0.071) (0.011) Spatial Lag of Dependent Variable N N N Y N Y Observations 12896 12896 12792 12792 12584 12584 R-squared 0.48 0.78 0.72 0.72 0.57 0.58 Note: All models include district and month fixed effects. Where included, coefficients for moving average, mean absolute deviation, and spatial lag of the dependent variable not shown. Robust standard errors, clustered on district, in parentheses. *** p<0.01, ** p<0.05, * p<0.01

74 of 85
Appendix Table 18. Linear Regression Estimates of Mean Absolute Deviation of IEDs on Civilian Casualties in Pashtun vs. Non-Pashtun Areas (Afghanistan)
(1) (2) (3) (4) DV IED(t) MAD MAD MAD MAD In District In District In District In District Pashtun Non- Pashtun Pashtun Non-Pashtun Panel A: ISAF Generated Civilian Casualties Civilian casualties at t 0.0263 0.0299 0.0235 0.00273 (0.025) (0.048) (0.025) (0.040) Civilian casualties at t-1 0.0416 0.000943 0.0394 0.00600 (0.029) (0.031) (0.028) (0.031) Civilian casualties at t-2 0.0222 -0.0457 0.0186 -0.0539 (0.025) (0.035) (0.025) (0.037) Civilian casualties at t-3 0.0565 0.0110 0.0538 0.0229 (0.039) (0.064) (0.039) (0.068) Civilian casualties at t-4 0.0433 -0.0263 0.0400 -0.0254 (0.037) (0.059) (0.038) (0.060) Joint Test for 0.16 -0.060 0.15 -0.050 Significance (p-value) (0.18) (0.64) (0.22) (0.69) Panel B: Insurgent Generated Civilian Casualties Civilian casualties at t 0.00450 -0.00372 0.00397 -0.00763 (0.0062) (0.0089) (0.0060) (0.010) Civilian casualties at t-1 -0.00128 -0.0124* -0.00182 -0.0168** (0.0031) (0.0075) (0.0030) (0.0075) Civilian casualties at t-2 0.00619 -0.0116 0.00591 -0.0150** (0.0040) (0.0080) (0.0041) (0.0074) Civilian casualties at t-3 0.00644 -0.0138* 0.00596 -0.0149** (0.0043) (0.0073) (0.0043) (0.0058) Civilian casualties at t-4 0.00533 -0.0101* 0.00494 -0.0128** (0.0046) (0.0058) (0.0046) (0.0063) Joint Test for 0.017 -0.048 0.015 -0.060 Significance (p-value) (0.17) (0.084) (0.21) (0.023) Lagged MA Yes Yes Yes Yes Spatial Lag No No Yes Yes Observations 13416 16536 13416 16512

75 of 85
R-squared 0.36 0.26 0.37 0.28 Notes: The dependent variable is IED incidents per 1000 in the population respectively. Robust standard errors, clustered at the district level, are reported in parentheses. All specifications include district and month-year fixed effect. Estimates which are significant at the 0.05 (0.10, 0.01) level are marked with ** (*, ***). Moving average estimates are 3-period (6 week) previous week linear estimate of the moving average of the dependent variable. All regressions include the spatial lag of the DV. Spatial lags are estimated as the average dependent variable value for all adjacent districts. Estimates of Civilian Casualties and SIGACTs scaled per 1000 in the population based on LandScan population estimates. Civilian casualties estimates based on data from the Civilian Casualties Tracking Cell, International Security Assistance Forces (ISAF) headquarters. Violent Events based on data on significant actions (SIGACTs) against ISAF. SIGACTs include direct fire, indirect fire, improvised explosive device explosions, improvised explosive devices found and cleared, improvised explosive device hoaxes, and premature detonations. District classification based on National Geospatial Agency (NGA) shape files on ethnic areas in Afghanistan, districts classified as Pashtun if more than 50% of their area fall into areas NGA defines as Pashtun.

76 of 85
Appendix Table 19. Linear Regression Estimates of IEDs on Interaction of Civilian Casualties with Pashtun Areas (Afghanistan)
(1) (2) (3) (4) (5) (6)
DV: IED(t) FE FE MA MA MAD MAD
In District In District In District In District In District In District
Panel A: ISAF Generated Civilian Casualties Civilian casualties at t 0.0726 -0.148 0.00424 -0.0376 0.0223 0.0123 (0.14) (0.18) (0.059) (0.058) (0.052) (0.047) Civilian casualties at t-1 0.177 0.0619 -0.166* -0.144* -0.00972 -0.00513 (0.24) (0.21) (0.091) (0.079) (0.029) (0.030) Civilian casualties at t-2 0.00750 -0.130 -0.228** -0.213** -0.0585** -0.0595** (0.059) (0.10) (0.10) (0.098) (0.028) (0.030) Civilian casualties at t-3 -0.0511 -0.0871* -0.0874* -0.0586 0.000256 0.00814 (0.041) (0.046) (0.051) (0.047) (0.063) (0.064) Civilian casualties at t-4 -0.123 -0.141 0.00202 0.0118 -0.0386 -0.0355 (0.097) (0.13) (0.097) (0.10) (0.056) (0.057) Joint Test for 0.46 -0.30 -0.48 -0.40 -0.11 -0.092 Significance (p-value) (0.97) (0.034) (0.005) (0.004) (0.35) (0.42) Pashtun Dummy X 0.0786 0.229 0.0428 0.0681 0.00620 0.0116 Civilian casualties at t (0.16) (0.18) (0.071) (0.069) (0.059) (0.054) Pashtun Dummy X -0.149 -0.110 0.222** 0.192** 0.0551 0.0465 Civilian casualties at t-1 (0.24) (0.21) (0.099) (0.087) (0.041) (0.041) Pashtun Dummy X 0.132 0.215* 0.283*** 0.255** 0.0837** 0.0788** Civilian casualties at t-2 (0.092) (0.12) (0.11) (0.10) (0.037) (0.039) Pashtun Dummy X 0.190** 0.159** 0.200*** 0.153** 0.0581 0.0456 Civilian casualties at t-3 (0.077) (0.066) (0.063) (0.060) (0.074) (0.075) Pashtun Dummy X 0.231** 0.168 0.0968 0.0649 0.0837 0.0752 Civilian casualties at t-4 (0.11) (0.14) (0.10) (0.11) (0.067) (0.069) Joint Test for 0.35 0.45 0.56 0.48 0.20 0.18 Significance (p-value) (0.29) (0.071) (0.001) (0.005) (0.33) (0.39) Panel B: Insurgent Generated Civilian Casualties Civilian casualties at t 0.164** 0.164** 0.00986 0.00383 -0.00440 -0.00594 (0.067) (0.068) (0.013) (0.014) (0.0092) (0.0093) Civilian casualties at t-1 0.0115 -0.0196 -0.0158 -0.0225* -0.0133 -0.0149* (0.023) (0.021) (0.016) (0.013) (0.0094) (0.0086) Civilian casualties at t-2 0.00995 -0.0201 -0.0191 -0.0238* -0.0127 -0.0138 (0.015) (0.019) (0.016) (0.013) (0.0100) (0.0091) Civilian casualties at t-3 0.00458 -0.0281 -0.0219 -0.0222* -0.0149 -0.0149* (0.013) (0.018) (0.015) (0.012) (0.0092) (0.0082) Civilian casualties at t-4 -0.0000376 -0.00478 0.00104 -0.00268 -0.0106* -0.0116* (0.0084) (0.0043) (0.0093) (0.0093) (0.0062) (0.0061) Joint Test for 0.026 -0.073 -0.056 -0.071 -0.051 -0.055 Significance (p-value) (0.63) (0.18) (0.31) (0.11) (0.066) (0.075) Pashtun Dummy X -0.128* -0.136** 0.00560 0.00818 0.00953 0.0101 Civilian casualties at t (0.069) (0.069) (0.017) (0.016) (0.011) (0.011) Pashtun Dummy X 0.0156 0.0356 0.0246 0.0278* 0.0125 0.0132

77 of 85
Civilian casualties at t-1 (0.029) (0.026) (0.017) (0.014) (0.0099) (0.0089) Pashtun Dummy X 0.00750 0.0228 0.0290* 0.0315** 0.0194* 0.0199** Civilian casualties at t-2 (0.019) (0.020) (0.017) (0.014) (0.011) (0.0097) Pashtun Dummy X 0.0173 0.0343* 0.0314* 0.0283** 0.0216** 0.0209** Civilian casualties at t-3 (0.018) (0.019) (0.016) (0.012) (0.010) (0.0090) Pashtun Dummy X 0.0159 0.00782 0.00725 0.00820 0.0162** 0.0165** Civilian casualties at t-4 (0.014) (0.0075) (0.011) (0.011) (0.0076) (0.0075) Joint Test for -0.080 -0.058 0.069 0.073 0.060 0.061 Significance (p-value) (0.35) (0.23) (0.20) (0.12) (0.066) (0.043) Pashtun Dummy 0 0 0 0 0 0 (0) (0) (0) (0) (0) (0) Lagged MA No Yes Yes Yes Yes Yes Spatial Lag No No No Yes No Yes Observations 31104 31104 30720 30696 29952 29928 R-squared 0.36 0.46 0.56 0.58 0.40 0.41 Notes: The dependent variable is IED incidents per 1000 in the population respectively. Robust standard errors, clustered at the district level, are reported in parentheses. All specifications include district and month-year fixed effect. Estimates which are significant at the 0.05 (0.10, 0.01) level are marked with ** (*, ***). Moving average estimates are 3-period (6 week) previous week linear estimate of the moving average of the dependent variable. All regressions include the spatial lag of the DV. Spatial lags are estimated as the average dependent variable value for all adjacent districts. Estimates of Civilian Casualties and SIGACTs scaled per 1000 in the population based on LandScan population estimates. Civilian casualties estimates based on data from the Civilian Casualties Tracking Cell, International Security Assistance Forces (ISAF) headquarters. Violent Events based on data on significant actions (SIGACTs) against ISAF. SIGACTs include direct fire, indirect fire, improvised explosive device explosions, improvised explosive devices found and cleared, improvised explosive device hoaxes, and premature detonations. District classification based on National Geospatial Agency (NGA) shape files on ethnic areas in Afghanistan, districts classified as Pashtun if more than 50% of their area fall into areas NGA defines as Pashtun.

78 of 85
Appendix Table 20. Linear Regression Estimates of SIGACTs* on Interaction of Civilian Casualties with Pashtun Areas (Afghanistan)
(1) (2) (3) (4) (5) (6)
DV: SIGACT(t)* FE FE MA MA MAD MAD
In District In District In District In District In District In District
Panel A: ISAF Generated Civilian Casualties Civilian casualties at t 1.457*** 0.669*** 0.253 0.181 0.359 0.348 (0.51) (0.25) (0.27) (0.25) (0.24) (0.24) Civilian casualties at t-1 0.512 -0.182 -0.514 -0.467 0.00879 0.0152 (0.79) (0.68) (0.45) (0.44) (0.20) (0.20) Civilian casualties at t-2 0.0613 -0.497 -0.187 -0.196 -0.319* -0.324* (0.56) (0.65) (0.46) (0.44) (0.18) (0.18) Civilian casualties at t-3 -0.0678 -0.466 0.325 0.312 -0.0626 -0.0647 (0.56) (0.47) (0.56) (0.54) (0.22) (0.22) Civilian casualties at t-4 0.275 0.0454 1.022 0.965 0.141 0.132 (0.48) (0.30) (0.70) (0.65) (0.20) (0.20) Joint Test for 0.78 -1.10 0.65 0.61 -0.23 -0.24 Significance (p-value) (0.65) (0.32) (0.71) (0.71) (0.68) (0.68) Pashtun Dummy X -1.270** -0.617** -0.265 -0.210 -0.369 -0.361 Civilian casualties at t (0.53) (0.27) (0.27) (0.25) (0.24) (0.24) Pashtun Dummy X -0.429 0.149 0.517 0.459 0.00802 -0.00172 Civilian casualties at t-1 (0.80) (0.68) (0.46) (0.45) (0.21) (0.21) Pashtun Dummy X 0.129 0.606 0.144 0.126 0.293 0.292 Civilian casualties at t-2 (0.57) (0.66) (0.47) (0.45) (0.18) (0.18) Pashtun Dummy X 0.0215 0.296 -0.317 -0.338 0.0403 0.0370 Civilian casualties at t-3 (0.57) (0.48) (0.57) (0.55) (0.22) (0.22) Pashtun Dummy X -0.139 -0.00681 -1.043 -1.025 -0.183 -0.180 Civilian casualties at t-4 (0.51) (0.32) (0.70) (0.66) (0.20) (0.20) Joint Test for -1.82 -0.18 -1.11 -1.11 -0.53 -0.51 Significance (p-value) (0.31) (0.87) (0.48) (0.45) (0.32) (0.34) Panel B: Insurgent Generated Civilian Casualties Civilian casualties at t 0.408** 0.363** 0.232 0.222 0.0290 0.0275 (0.16) (0.14) (0.23) (0.23) (0.043) (0.042) Civilian casualties at t-1 0.319 0.195 0.108 0.106 0.0146 0.0144 (0.26) (0.22) (0.15) (0.15) (0.051) (0.051) Civilian casualties at t-2 0.240 0.0649 -0.0121 -0.00877 0.00757 0.00819 (0.24) (0.16) (0.046) (0.047) (0.054) (0.054) Civilian casualties at t-3 0.193 -0.00899 -0.0833* -0.0777* -0.0163 -0.0155 (0.17) (0.046) (0.047) (0.044) (0.019) (0.020) Civilian casualties at t-4 0.112 -0.0511 -0.0898 -0.0933 -0.0365 -0.0373 (0.089) (0.061) (0.081) (0.078) (0.030) (0.029) Joint Test for 0.86 0.20 -0.077 -0.073 -0.031 -0.030 Significance (p-value) (0.26) (0.58) (0.46) (0.48) (0.76) (0.76) Pashtun Dummy X -0.347** -0.319** -0.204 -0.201 -0.0194 -0.0189 Civilian casualties at t (0.16) (0.14) (0.23) (0.23) (0.043) (0.043) Pashtun Dummy X -0.270 -0.170 -0.0953 -0.0993 -0.0104 -0.0112

79 of 85
Civilian casualties at t-1 (0.27) (0.22) (0.15) (0.15) (0.051) (0.051) Pashtun Dummy X -0.216 -0.0735 0.0258 0.0198 0.00191 0.000820 Civilian casualties at t-2 (0.24) (0.16) (0.044) (0.045) (0.054) (0.055) Pashtun Dummy X -0.150 0.0218 0.0951* 0.0849* 0.0218 0.0203 Civilian casualties at t-3 (0.17) (0.046) (0.049) (0.045) (0.020) (0.020) Pashtun Dummy X -0.0948 0.0420 0.0999 0.0985 0.0459 0.0459 Civilian casualties at t-4 (0.091) (0.063) (0.083) (0.079) (0.030) (0.029) Joint Test for -0.86 -0.42 -0.10 -0.12 0.038 0.036 Significance (p-value) (0.20) (0.20) (0.69) (0.66) (0.65) (0.67) Pashtun Dummy 0 0 0 0 0 0 (0) (0) (0) (0) (0) (0) Lagged MA No Yes Yes Yes Yes Yes Spatial Lag No No No Yes No Yes Observations 31104 31104 30720 30696 29952 29928 R-squared 0.49 0.62 0.63 0.63 0.46 0.46 Notes: *The dependent variable is SIGACTs (minus IED hoaxes and IEDs found and cleared) per 1000 in the population. Robust standard errors, clustered at the district level, are reported in parentheses. All specifications include district and month-year fixed effect. Estimates which are significant at the 0.05 (0.10, 0.01) level are marked with ** (*, ***). Moving average estimates are 3-period (6 week) previous week linear estimate of the moving average of the dependent variable. All regressions include the spatial lag of the DV. Spatial lags are estimated as the average dependent variable value for all adjacent districts. Estimates of Civilian Casualties and SIGACTs scaled per 1000 in the population based on LandScan population estimates. Civilian casualties estimates based on data from the Civilian Casualties Tracking Cell, International Security Assistance Forces (ISAF) headquarters. Violent Events based on data on significant actions (SIGACTs) against ISAF. District classification based on National Geospatial Agency (NGA) shape files on ethnic areas in Afghanistan, districts classified as Pashtun if more than 50% of their area fall into areas NGA defines as Pashtun.

80 of 85
Appendix Table 21. Linear Regression Estimates of Moving Average of SIGACTs* on Civilian Casualties in Pashtun vs. Non-Pashtun Areas (Afghanistan)
(1) (2) (3) (4) (5) (6) (7) (8) DV: IED(t) FE FE FE FE MA MA MA MA In District In District In District In District In District In District In District In District Pashtun Non- Pashtun Pashtun Non- Pashtun Pashtun Non- Pashtun Pashtun Non- Pashtun Panel A: ISAF Generated Civilian Casualties Civilian casualties at t 0.166 1.503*** 0.0481 0.656*** ‐0.0303 0.378 ‐0.0423 0.291
(0.12) (0.51) (0.091) (0.24) (0.076) (0.29) (0.078) (0.24)
Civilian casualties at t-1 0.0640 0.565 ‐0.0359 ‐0.181 ‐0.0153 ‐0.385 ‐0.0215 ‐0.352
(0.087) (0.80) (0.075) (0.67) (0.093) (0.44) (0.094) (0.43)
Civilian casualties at t-2 0.175 0.124 0.106 ‐0.485 ‐0.0563 ‐0.0711 ‐0.0776 ‐0.0956
(0.13) (0.55) (0.13) (0.65) (0.096) (0.47) (0.097) (0.45)
Civilian casualties at t-3 ‐0.0545 ‐0.0271 ‐0.165* ‐0.460 ‐0.00970 0.465 ‐0.0360 0.433
(0.12) (0.57) (0.093) (0.47) (0.098) (0.57) (0.10) (0.54)
Civilian casualties at t-4 0.112 0.363 0.0332 0.0836 ‐0.0381 1.129 ‐0.0680 1.055
(0.16) (0.48) (0.11) (0.29) (0.069) (0.71) (0.074) (0.65)
Joint Test for 0.30 1.02 -0.062 -1.04 -0.12 1.14 -0.20 1.04 Significance (p-value) (0.47) (0.56) (0.82) (0.33) (0.70) (0.52) (0.52) (0.54) Panel B: Insurgent Generated Civilian Casualties Civilian casualties at t 0.0538*** 0.417*** 0.0426*** 0.365** 0.0228*** 0.244 0.0187** 0.232
(0.018) (0.16) (0.015) (0.14) (0.0087) (0.24) (0.0078) (0.23)
Civilian casualties at t-1 0.0425*** 0.328 0.0238 0.193 0.00772 0.131 0.00364 0.126
(0.015) (0.27) (0.017) (0.22) (0.010) (0.17) (0.0088) (0.16)
Civilian casualties at t-2 0.0163 0.251 ‐0.0102 0.0636 0.00811 0.0192 0.00672 0.0187
(0.018) (0.25) (0.014) (0.16) (0.0071) (0.067) (0.0065) (0.065)
Civilian casualties at t-3 0.0355** 0.202 0.0113 ‐0.0122 0.00663 ‐0.0504** 0.00363 ‐0.0485**
(0.014) (0.18) (0.0092) (0.046) (0.0074) (0.020) (0.0079) (0.019)
Civilian casualties at t-4 0.00980 0.120 ‐0.0106 ‐0.0536 0.00599 ‐0.0629 0.00257 ‐0.0697
(0.015) (0.091) (0.012) (0.060) (0.0064) (0.050) (0.0073) (0.053)
Joint Test for 0.10 0.90 0.014 0.19 0.028 0.037 0.017 0.026 Significance (p-value) (0.018) (0.24) (0.48) (0.60) (0.21) (0.84) (0.44) (0.88) Lagged MA No No Yes Yes Yes Yes Yes Yes Spatial Lag No No No No No No Yes Yes Observations 13932 17172 13932 17172 13760 16960 13760 16936
R-squared 0.52 0.33 0.63 0.53 0.69 0.40 0.70 0.41

81 of 85
Notes: *The dependent variable is SIGACTs (minus IED hoaxes and IEDs found and cleared) per 1000 in the population. Robust standard errors, clustered at the district level, are reported in parentheses. All specifications include district and month-year fixed effect. Estimates which are significant at the 0.05 (0.10, 0.01) level are marked with ** (*, ***). Moving average estimates are 3-period (6 week) previous week linear estimate of the moving average of the dependent variable. All regressions include the spatial lag of the DV. Spatial lags are estimated as the average dependent variable value for all adjacent districts. Estimates of Civilian Casualties and SIGACTs scaled per 1000 in the population based on LandScan population estimates. Civilian casualties estimates based on data from the Civilian Casualties Tracking Cell, International Security Assistance Forces (ISAF) headquarters. Violent Events based on data on significant actions (SIGACTs) against ISAF. District classification based on National Geospatial Agency (NGA) shape files on ethnic areas in Afghanistan, districts classified as Pashtun if more than 50% of their area fall into areas NGA defines as Pashtun.
82 of 85
Appendix Table 22. Linear Regression Estimates of Mean Absolute Deviation of SIGACTs* on Civilian Casualties in Pashtun vs. Non-Pashtun Areas (Afghanistan)
(1) (2) (3) (4) DV: IED(t) MAD MAD MAD MAD In District In District In District In District Pashtun Non- Pashtun Pashtun Non-Pashtun Panel A: ISAF Generated Civilian Casualties Civilian casualties at t -0.00846 0.341 -0.0110 0.330 (0.029) (0.22) (0.028) (0.22) Civilian casualties at t-1 0.0159 0.00113 0.0133 0.00351 (0.050) (0.21) (0.050) (0.21) Civilian casualties at t-2 -0.0257 -0.324* -0.0318 -0.332* (0.048) (0.19) (0.046) (0.19) Civilian casualties at t-3 -0.0203 -0.0629 -0.0252 -0.0672 (0.023) (0.22) (0.022) (0.23) Civilian casualties at t-4 -0.0412*** 0.146 -0.0466*** 0.137 (0.015) (0.20) (0.016) (0.21) Joint Test for -0.071 -0.24 -0.090 -0.26 Significance (p-value) (0.50) (0.68) (0.38) (0.67) Panel B: Insurgent Generated Civilian Casualties Civilian casualties at t 0.00955** 0.0282 0.00869** 0.0267 (0.0037) (0.043) (0.0038) (0.042) Civilian casualties at t-1 0.00426 0.0122 0.00345 0.0116 (0.0028) (0.051) (0.0027) (0.050) Civilian casualties at t-2 0.00971*** 0.00470 0.00944*** 0.00465 (0.0032) (0.054) (0.0032) (0.054) Civilian casualties at t-3 0.00574 -0.0197 0.00519 -0.0197 (0.0038) (0.018) (0.0040) (0.018) Civilian casualties at t-4 0.00957*** -0.0395 0.00892*** -0.0406 (0.0033) (0.031) (0.0034) (0.032) Joint Test for 0.029 -0.042 0.027 -0.044 Significance (p-value) (0.002) (0.66) (0.003) (0.64) Lagged MA Yes Yes Yes Yes Spatial Lag No No Yes Yes Observations 13416 16536 13416 16512 R-squared 0.46 0.35 0.46 0.35

83 of 85
Notes: *The dependent variable is SIGACTs (minus IED hoaxes and IEDs found and cleared) per 1000 in the population. Robust standard errors, clustered at the district level, are reported in parentheses. All specifications include district and month-year fixed effect. Estimates which are significant at the 0.05 (0.10, 0.01) level are marked with ** (*, ***). Moving average estimates are 3-period (6 week) previous week linear estimate of the moving average of the dependent variable. All regressions include the spatial lag of the DV. Spatial lags are estimated as the average dependent variable value for all adjacent districts. Estimates of Civilian Casualties and SIGACTs scaled per 1000 in the population based on LandScan population estimates. Civilian casualties estimates based on data from the Civilian Casualties Tracking Cell, International Security Assistance Forces (ISAF) headquarters. Violent Events based on data on significant actions (SIGACTs) against ISAF. District classification based on National Geospatial Agency (NGA) shape files on ethnic areas in Afghanistan, districts classified as Pashtun if more than 50% of their area fall into areas NGA defines as Pashtun.

84 of 85
Appendix Figure A1. Estimates of the effect of Civilian Casualties on Violent Incidents from Matched Sample for Pashtun Areas
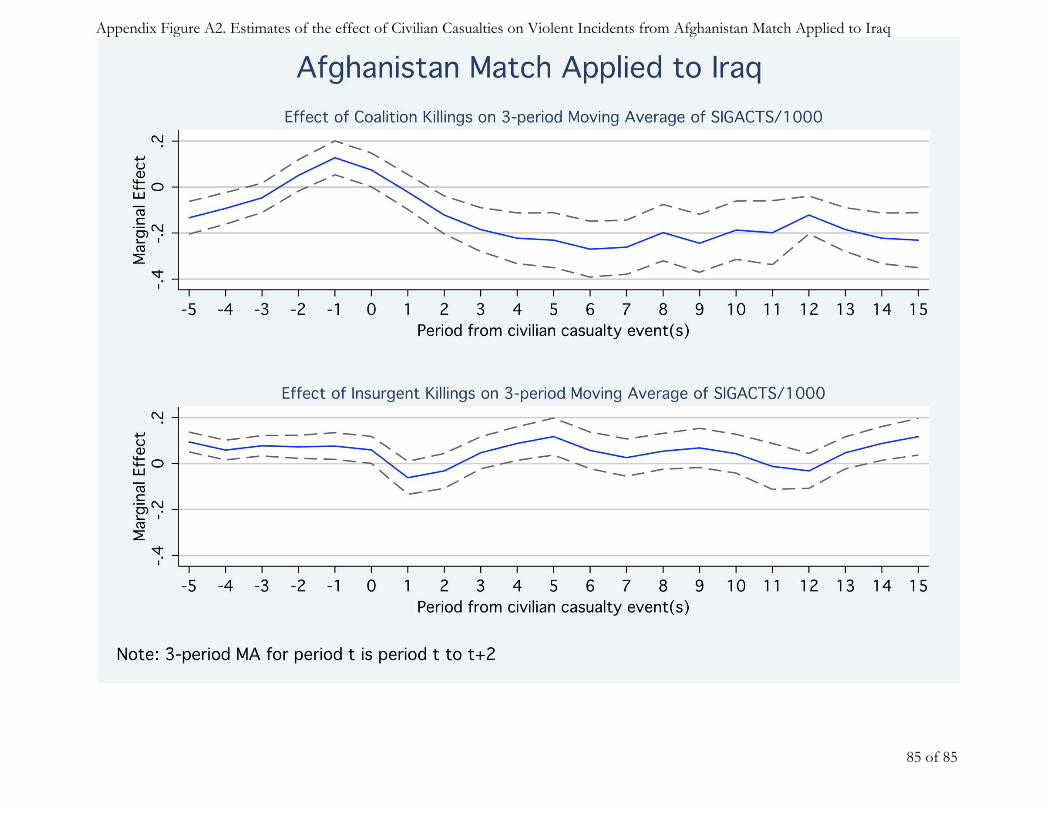
85 of 85
Appendix Figure A2. Estimates of the effect of Civilian Casualties on Violent Incidents from Afghanistan Match Applied to Iraq