Embed Size (px)
Citation preview

THE EFFECT OF DEBT MANAGEMENT TOOLS ON REVENUE COLLECTION
AT KENYA REVENUE AUTHORITY
JESANG CHEROGONY
D63/79912/2012
A RESEARCH PROPOSAL SUBMITTED TO THE DEPARTMENT OF BUSINESS IN
THE SCHOOL OF BUSINESS IN PARTIAL FULFILMENT OF THE REQUIREMENTS
FOR THE AWARD OF THE DEGREE OF MASTER OF FINANCE OF UNIVERSITY OF
NAIROBI.
OCTOBER, 2013

ii
DECLARATION
This research project is my original work and has not been submitted for award of a degree in
any other university.
Sign:……………………… Date:……………………………
Jesang Cherogony
Reg no. D63/79912/2012
This research project has been submitted for examination with my approval as the university
supervisor
Sign:………………………… Date:…………………………….
Dr. J. Aduda

iii
DEDICATION
This research project is dedicated to my mother Beatrice Cherogony who has always
encouraged me and instilled in me the virtues like honesty, perseverance and resilience. To
my siblings- Rotich, Jeptoo, Kandie, Jerop, Godwin and Jebet- who inspire me to do even
more.

iv
ACKNOWLEDGEMENT
I would like to thank the people who gave me continuous support, encouragement and
guidance throughout the period of writing this research project. First of all, I deeply
appreciate my supervisor Dr. Josiah Aduda who guided and instructed me throughout this
research project. I also thank my moderator Mr. Mirie Mwangi who gave me valuable
direction to improve on this research project.
I thank my friends and colleagues for their support and understanding as I spend much time
in working on the research. I am also thankful to my family who endured my absence on
weekend and nights and some of the family functions as I undertook the writing of this
research project.
Above all, I give thanks to the Almighty God who gives strength, favour and honour to all
His children.

v
ABSRACT
Taxation is the key source of revenue that the government of Kenya uses to provide public
goods and services to its citizenry. Over the last decade the tax revenue has been growing
steadily. Despite this growth the tax gap (as a result of underreporting, underpaying or non-
paying of taxes due) has continued to grow. It is important for the revenue agency to ensure
that taxes are paid on time and that debt is recovered in order to increase on revenue
collection. Where the tax debts are not followed up and collected the taxpayers may not
believe that the government will collect overdue taxes and this may cause them to be less
motivated to pay it. This will in the long-run have a negatively effect on revenue base. The
objective of the study was to establish the effect of debt management tools on revenue
collection at Kenya Revenue Authority. To achieve this secondary data was used and it was
analysed using descriptive analysis, correlation analysis and regression analysis. The findings
show that there was a positive relationship between revenue collected and GDP and debt
collected and a negative relationship between revenue collection and rate of inflation. It was
further found that GDP was statistically significant in the regression model while debt
collected and rate of inflation were not statistically significant. Though debt collection is not
a strong determinant to revenue collection it was concluded that use of effective tools would
reduce debt portfolio and that following up on unpaid taxes will foster equity and encourage
compliance amongst taxpayers.

vi
TABLE OF CONTENTS
DECLARATION...................................................................................................................... ii
DEDICATION........................................................................................................................ iii
ACKNOWLEDGEMENT ...................................................................................................... iv
ABSRACT ................................................................................................................................ v
LIST OF TABLES .................................................................................................................. ix
LIST OF ABBREVIATIONS ................................................................................................. x
CHAPTER ONE ...................................................................................................................... 1
INTRODUCTION.................................................................................................................... 1
1.1Background of the Study ................................................................................................... 1
1.1.1 Debt Management Tools ........................................................................................... 4
1.1.2 Revenue Collection.................................................................................................... 4
1.1.3 Effects of Debt Management Tools and Revenue Collection ................................... 5
1.1.4 Kenya Revenue Authority ......................................................................................... 7
1.2 Research Problem ............................................................................................................. 8
1.3 Objectives of the Study .................................................................................................... 9
1.4 Value of the Study ............................................................................................................ 9
CHAPTER TWO ................................................................................................................... 10
LITERATURE REVIEW ..................................................................................................... 10
2.1 Introduction .................................................................................................................... 10
2.2 Theoretical Review ........................................................................................................ 10
2.2.1 Resource-based Theory ........................................................................................... 10
2.2.2 Stakeholders Theory ................................................................................................ 10
2.2.3 Asymmetrical Information Theory .......................................................................... 11
2.3 Debt Management Tools ................................................................................................ 12
2.3.1 Notice and Demand for Payment............................................................................. 12
2.3.2 Issue of Agency Notices .......................................................................................... 12
2.3.3 Recovery of Tax by Distraint .................................................................................. 12
vii
2.3.4 Collection of Tax by Suit ......................................................................................... 13
2.3.5 Security on Property & Security Bond .................................................................... 13
2.4 Empirical Review ........................................................................................................... 13
2.5 Summary of the Literature Review ................................................................................ 18
CHAPTER THREE ............................................................................................................... 20
RESEARCH METHODOLOGY ......................................................................................... 20
3.1 Introduction .................................................................................................................... 20
3.2 Research Design ............................................................................................................. 20
3.3 Data Collection ............................................................................................................... 20
3.4 Data Analysis ................................................................................................................. 20
3.4.1 Analytical Model ..................................................................................................... 21
CHAPTER FOUR .................................................................................................................. 22
DATA ANALYSIS AND PRESENTATION OF FINDINGS ............................................ 22
4.1 Introduction .................................................................................................................... 22
4.2 Data Presentation............................................................................................................ 22
4.2.1 Descriptive Statistics ............................................................................................... 22
4.2.2 Correlation Analysis ................................................................................................ 22
4.2.3 Regression Analysis ................................................................................................ 23
4.2.4 Debt collected and Revenue collected ..................................................................... 25
4.2.5 Debt Collected, Debt Written off and Year End Debt balances .............................. 26
4.3 Summary and Interpretation of the Findings.................................................................. 26
CHAPTER FIVE ................................................................................................................... 29
SUMMARY, CONCLUSION AND RECOMMENDATIONS ......................................... 29
5.1 Summary ........................................................................................................................ 29
5.2 Conclusion ...................................................................................................................... 30
5.3 Policy Recommendations ............................................................................................... 30
5.4 Limitation of the Study .................................................................................................. 31

viii
5.5 Suggestion for further studies ........................................................................................ 32
REFERENCES ....................................................................................................................... 33
APPENDICES ........................................................................................................................ 36
APPENDIX I: Secondary Data Collected ............................................................................ 36
APPENDIX II: Letter of Introduction .................................................................................. 37
APENDIX III: Authorisation Letter to Collect Data from KRA ......................................... 38

ix
LIST OF TABLES
Table 4.1 Descriptive analysis of variables………………………………………………....22
Table 4.2: Pearson correlation coefficient………………………………………………......23
Table 4.3: Model Summary………………………………………………………………....23
Table 4.4: Anova…………………………………………………………………………....24
Table 4.5: Regression Coefficients…………………………………………………………..24
Table 4.6: Debt collected versus revenue collected…………………………………………25
Table 4.6: Table showing the percentages of debt collected, written off against year end debt
balances …………………………………………………………………………………….26

x
LIST OF ABBREVIATIONS
EACCMA- East African Community Customs Management Act
GAO- Government Accountability Office
GDP- Gross Domestic Product
HRMC- Her Majesty’s Revenue and Customs-United kingdom
IRS- Internal Revenue Service
IT- Information Technology
ITMS- Integrated Tax Management System
KNBS- Kenya National Bureau of Statistics
KRA- Kenya Revenue Authority
NAO- National Audit Office
OECD- Organisation for Economic Co-operation and Development
SPSS- Statistical Package for Social Sciences
TMP- Tax Modernization Programme
VAT- Value Added Tax

1
CHAPTER ONE
INTRODUCTION
1.1Background of the Study
Tax revenue refers to compulsory transfers to the central government for public purposes.
Certain compulsory transfers such as fines, penalties, and most social security contributions
are excluded. Taxation is the key source of revenue that the government of Kenya uses to
provide public services to its citizenry. Over the last decade tax performance in Kenya has
significantly improved in nominal terms averaging about 24% of the size of the economy
(Mutua, 2012). This has enabled the government to finance 96% of the budget. Despite the
growth in revenue performance the tax gap has continued to grow. The tax gap is a
combination—underreporting, underpaying or non-paying of declared taxes resulting to a tax
debt, and non-filing of required tax returns altogether.
Tax debt is tax that has become due but has not yet been paid. Tax debt comprises of
principal tax payable, penalties and interest. Any penalty and interest charged becomes tax
due and payable. Tax debt comes about where a taxpayer has self-assessed himself but has
failed to pay, additional assessment has been made by the commissioner on income that was
not declared by the taxpayer on earlier self-assessment or estimated assessment is made
where the taxpayer had not made a self-assessment and taxes payable remain undisputed and
unpaid after 30 days after the issues of assessment notice. Tax debt may also come about as a
result of poor data entry resulting to ledger error hence reporting of wrong debts in the
system. The tax debt needs to be validated and collected and for this reason debt management
strategies have to be put in place by a revenue agency.
The good revenue performance has been attributed to the Tax Modernization Programme
(TMP) that have been undertaken by Kenya Revenue Authority (KRA) from the 1980’s to
date. The programme was meant to reform the tax system. According to Karingi et al (2005),
the success of this reform package depended on the realisation of a set of objectives among
them raising revenue levels from 22 to 28 percent of GDP, improving economic efficiency of
the tax system by lowering and rationalizing tax rates, and enhancing greater reliance on self-
assessment systems supported by selective audit, improving administrative efficiency through
computerization and audit capacity and establishing tax policy analysis capacity to implement

2
organisational reforms. The tax reforms as we can see has not in any way looked into the
administrative capacity of KRA, for instance, in terms of tax debt collection, rather its
emphasis has all been on widening the tax base and increasing revenue while not putting in
place proper modern mechanism to ensure that taxes are all collected as and when they fall
due. This is evidenced by large tax arrears presently at KRA (estimated 100B). This shows
that tax administration still needs to be enhanced to reduce tax arrears and therefore increase
tax collection.
According to Annette (2007) California and other states with growing revenue needs can no
longer ignore growing uncollected use tax. Failure to collect use tax violates the principles of
equity and neutrality. The use tax is a longstanding tax and better collection techniques can
avoid the need to create new taxes or raise tax rates of other taxes. While the use tax has been
around since the 1930s in most states, few people are aware of it which obviously leads to
low compliance. California and other states have recently improved collection practices, but
more work is needed.
Some forms of taxpayer assistance are counterproductive and should be avoided. In an effort
to help taxpayers cope with the crisis, some countries are considering the implementation of
tax amnesties, moratoria on auditing taxpayers, and other similar measures. International
experience has shown that such measures are not effective tools for improving revenue
collection and create perverse incentives for currently compliant taxpayers to stop complying
with the tax laws (Baer & LeBorgne, 2008).
Unlike private businesses, a tax authority does not choose its clients based on their credit-
worthiness. All taxpayers are rated the same and the law in force concerning tax collection
applies equally to all of them. Therefore, it cannot charge higher interest rates or refuse to
extend credit based on a poor credit rating of a tax payer. However, a tax authority does have
legislative abilities that private organizations do not have, such as the ability to garnish a
debtor’s source of income to collect taxes owing, without a court order.
Debt collection strategies involves developing a strong collection unit with clearly defined,
documented and consistent policies and procedures that guide staff through the collection
process and instruct them on how to respond to a particular matter (Wambugu, 2012). There
is need to address staff training needs especially of the debt management staff. They should

3
know the law governing the collection of tax debt, be familiar with the tax debt management
manual and the KRA’s service charter so as not to infringe into the taxpayers’ right and at the
same time ensure the collection tax debt in a legal way.
Timely collection of overdue accounts is important, because it is the final element in taxpayer
compliance. If taxpayers do not believe the government will collect overdue taxes, they may
be less motivated to pay. Not paying debts will have a negative effect on revenue base over
time (Canada, 2013).
Debt collection faces challenges during economic crisis. According to Brondon (2009) when
credit is tight or unavailable, credit-constrained taxpayers may be tempted to use tax evasion
as an alternative source of finance for their operations. For example, businesses may fail to
remit to the government the taxes they have withheld from their customers (value-added
tax—VAT) or employees (payroll taxes). Taxpayers who face severe economic stress—such
as the risk of bankruptcy—may perceive the downside risks of tax evasion (penalties) to be
minimal compared with the potential upside gains (avoiding bankruptcy). During such times
the debt collection strategies that maybe applied should not push the taxpayer to close his
business which would result into loosing tax revenue altogether. The tax collector may opt to
work out a tax payment plan that is favourable to the business or defer the debt to a later date
till the taxpayer is able to pay.
A cost-benefit analysis should be undertaken when selecting a debt management strategy to
use at any time. In following an optimal collection policy the firm should compare the cost
and benefits. The optimal credit policy will maximize the profit (revenue) and will consistent
with the objective of maximizing the value of the firm (Wambugu, 2012).
Ultimately for government departments, reducing the volume of debt that moves into
impairment and accelerating its recovery will reduce write-offs and release funds for frontline
services. By determining an accurate valuation of departmental debt alongside the ability to
effectively monitor the performance of both internal and external debt collection and
recovery processes, the government can optimise activities accordingly (SAS, 2012).

4
1.1.1 Debt Management Tools
Debt management tools are tools used undertaken to accelerate the collection of delinquent
debt. Debt management strategies are the collection strategies which are organized plans of
action incorporating the various collection tools to be used by an agency, an individual or a
company to recover debt.
Each agency or company should establish and implement effective collection tools that suit
the agency’s programs and needs. Collection tools must meet all statutory requirements set
out by the agency or company in its credit policy. A collection strategy will facilitate debt
collection by providing a systematic, uniform method for collecting accounts (Financial
Management Services).
Early intervention approach to compliance and debt management issues is important. Use of
information technology (IT) assist in profiling of taxpayer and timely identification of tax
debtors for early intervention. It is also important to use appropriate strategies during
economic crisis. This is because the rate of defaulting is high and the forceful enforcement
strategy may not be taken well by the tax debtor.
1.1.2 Revenue Collection
Governments, both of the developed and developing countries, require revenue to finance
their expenditures. The government revenue consists of tax and non-tax revenues. Taxes are
levied on persons either on their incomes or on consumption of taxable items- goods and/or
services. Non-tax revenue consists of foreign aid, revenue from state-owned enterprises, fees
on licences and other services offered by the government, fines among other sources.
Successful collection operations are using data and technology to drive collections at reduced
costs per dollar collected, and demonstrate significant increases in revenues without increases
in staff. They are deploying best practices and tools in key areas such as data gathering,
decision analytics, automated involuntary enforcement, self-service and call management.
Many government entities have a wealth of data that can enhance collection activities. This
includes employer data, information from checks previously received, bank account numbers
from electronic debit and refund transactions, and addresses from drivers’ licenses and even
utility bills. Governments able to centrally warehouse data from many different organizations
(including state and local governments) have a much more complete view of the debtor.

5
Automating involuntary collection efforts is another powerful tool. While many agencies
have the authority to levy and garnish debtors, the process is cumbersome and often
ineffective. Government collection organizations typically can access data regarding a
debtor’s bank accounts through previous tax returns, prior payments to or from the debtor,
financial institution data matches, interest reporting from banks and other data sources. In
addition, employment information often is obtained through employer withholding forms and
relationships with other government agencies. This data sharing is a key to automating
involuntary activities (London & Hamilton, 2013).
In a perfect world, financial institutions and collection agencies would know which debtors
would pay, which accounts would become delinquent, how long they would be delinquent
and the most effective way to contact the delinquent debtors. This would allow collections
management to determine how to best allocate resources to maximize the amount collected
while minimizing collection expense. Collections management could increase unit yields and
decrease time and financial resources wasted on those accounts that would not be impacted
regardless of the treatment (Davey, 2009).
Governments have agencies or departments responsible with collecting government revenue
from individuals and companies. For instance in Kenya, Kenya Revenue Authority (KRA) is
mandated to collected taxes for the government under the various Acts (KRA Act, Cap 469).
The tax collected includes current taxes and tax arrears. Over the years the revenue collected
by the authority has increase, for instance Kshs. 122B in 1995/96 to Kshs. 840B in 2012/13,
accounting for about 96% of ordinary government revenue ( KRA Financial Statement, 1996-
2013)
1.1.3 Effects of Debt Management Tools and Revenue Collection
Improving tax collection requires mechanisms for voluntary tax payment and coercing
payment by non-complying taxpayers. It requires adequate withholding systems, an
appropriate penalty structure, use of audits and provision of incentives linked to tax recovery,
and taxpayer’s incentives for prompt payment (Moyi & Ronge, 2006).
The level of debt is driven by the economic climate, tax policy, and debtors’ behaviour, as
well as by the tax agency’s efforts to assess and collect taxes in a timely manner. Though a
big proportion of revenue is collected on time, some revenue remains unpaid. There is need

6
to profile the debtors, identify them and find an appropriate strategy to recover the debt in a
timely manner. Therefore, the earlier a debt is detected and collection strategies instituted, the
lower the amount of delinquent debt and this enhances the government revenue.
Tax agencies should, therefore, consider liberalizing the use of payment arrangements to
assist distressed taxpayers, but firm enforcement action should be taken against businesses
that have the capacity to pay their taxes but refuse to do so. Instalment arrangements provide
an important tool for collecting tax revenue from cash-strapped taxpayers. The tax laws in
many countries include provisions that allow financially distressed taxpayers, under certain
conditions, to pay their tax liabilities in instalments. The instalments typically span one to
two years during which time interest accrues but late payment penalties are usually waived.
Such arrangements help promote compliance because they allow the tax agency to bring a tax
debt quickly under control and usually require the taxpayer to stay current with all future tax
payments; failure to do so results in the plan’s termination and severe collection actions.
Good debt collection practices are even more important during a crisis. This is because the
window for collecting tax debts may close more quickly in a recession, when taxpayers’
cash-flow problems worsen and bankruptcies increase. In this situation, it is essential for tax
agencies to (1) ensure early detection of tax arrears and establish appropriate time standards
for follow-up, (2) maintain the quality and timeliness of tax arrears data, (3) target
enforcement efforts on recoverable arrears—usually by focusing on the most recent and
largest arrears first, (4) leverage the telephone context center to place outgoing debt
collection calls, (5) write off arrears deemed unrecoverable, (6) implement proper
organizational and staffing arrangements for collection enforcement, including a greater
organizational focus for large tax debts, and (7) be vested with a full set of enforcement
powers (Brondon, 2009).
In financial year 2004/05 the Ministry of Finance announced a tax amnesty which realised
Kshs. 4.8B (KRA. Financial statements, 2004). Baer and LeBorgne (2008, p. 5) define a tax
amnesty to be “a limited-time offer by the government to a specified group of taxpayers to
pay a defined amount, in exchange for forgiveness of a tax liability (including interest and
penalties), relating to a previous tax period(s), as well as freedom from legal prosecution.”
These temporary programs allow taxpayers who have previously evaded taxation to
voluntarily remit unpaid taxes without incurring all the sanctions that failure of timely
payment would ordinarily incur. If collected through enforcement action, taxpayers with
7
these liabilities would owe the tax plus various penalties and interest on the unpaid amount
and might also be subject to felony prosecution. By participating in the amnesty, taxpayers
can avoid certain program-specified consequences (Mikesell & Ross, 2012). The amnesty
was to enable KRA to reduce on debt and to bring in more tax payers into the tax net.
1.1.4 Kenya Revenue Authority
The Kenya Revenue Authority (KRA) was established by an Act of Parliament, Chapter 469
of the laws of Kenya, which became effective on July 1, 1995. The Authority is responsible
for assessing, collecting and accounting for all revenues in accordance with specific laws,
advising the Minister for Finance on matters relating to revenue administration and
performing such other functions in relation to revenue as the Minister may direct. In fulfilling
its mandate, KRA administers 17 revenue Acts, with the key ones (in terms of revenue
importance) being the Value Added Tax (VAT) Act (Cap. 476), the East African Community
Customs Management Act (EACCMA), the Income Tax Act (Cap. 470), the Customs and
Excise Act (excise provisions) (Cap. 472) and the Traffic Act (Cap. 403).
The Kenya Revenue Authority is the predominant government revenue collection agency
accounting for over 96% of Government Ordinary revenues. KRA fifth corporate plan
undertakes to revamp its debt strategy with the objective of reducing debt annually by 22%.
Initiatives will include; consolidating debt management in one department, data cleaning, a
focus on collecting debt arising from court cases and efforts to have uncollectible debt
removed from the books.
In terms of revenue collection and other support functions, the Authority is divided into the
following Departments: Customs Services Department, Domestic Taxes Department, Road
Transport Department, Support Services Department and Investigations & Enforcement
Department. Each Department is headed by a Commissioner. KRA also has seven service
Departments that enhance its operational efficiency. These are as follows: Human Resources
Department, Finance Department, Board Corporate Services & Administration Department,
Internal Audit Department, Information & Communication Technology Department,
Research & Corporate Planning Department and Marketing & Communication.
8
1.2 Research Problem
The main source of government revenue is tax. Though, the level of revenue of tax collected
has been increasing since inception of KRA, the tax debt level continues to grow as the
taxpayers continue to be non-compliant. The non-compliance is encouraged by poor
management of revenue collection. Also it has been motivated by taxpayer’s illiteracy level
and ignorance on online return filing which has led to unnecessary debts due to wrong data
entries. Wambugu (2012) argues that in many authorities taxpayers have become debtors
having progressed through the system as non-payers, encouraged by lax management and
political interferences.
The authority has intensified its debt management programme over the years. In financial
years; 2001/02 a debt of Kshs. 12B (7% of tax collected) was realised, 2002/03 Kshs. 18.6B
of debt was collected, and improvement of 55% over the previous year, 2003/04 Kshs. 19.1B
was collected attributed to development of a debt management system and in 2004/05 the
debt collected was Kshs. 13B, this show a decline from previous years collections ( KRA
Financial Statement, 1996-2013).
Some research studies have been done that relate to this study. However, no study has been
done on the impact of the debt management tools on revenue collection at KRA. Kariuki
(2011) did a research on effects of debt collection strategies on the financial performance of
companies at the Nairobi Securities Exchange. The study found that there is no significant
relation between debt collection management and market performance and no significant
relationship between bad debts and any of the variables tested in the regression model.
Ogolla (2012) did a research on “debt recovery as an operational strategy used in NIC Bank
to manage non-performing loans portfolio.” It was noted that the operational strategies
employed by NIC bank were effective and should be emulated by other banking institutions
to reduce the growth of the NPL portfolio. Wambugu (2012) did a research on the effect of
debt collection strategies on financial performance of local authorities in Kenya. The study
found that the subcontracting of the debt collection to third parties and the enforcement
strategies had a positive relationship with the level of debts while pro-active debt collection
strategies and the use of internal debt collection units were found to have a negative
relationship with the level of debt collection in the councils.

9
Several studies have been done in KRA in many areas but none has been done on the effects
of debt management tools on revenue collection despite the fact that the KRA Fourth and
Fifth corporate plans have mentioned the importance of enhancing the debt management
strategies and there being a growth of tax debt every year. Therefore, there exists a gap that
this study sought to find the effect of debt management strategies on revenue collection at
KRA. The research sought to answer the following questions: what is the effect of debt
management tools on revenue collection at Kenya Revenue Authority KRA?
1.3 Objective of the Study
The objective of the study to establish the effect of debt management tools on revenue
collection at Kenya Revenue Authority.
1.4 Value of the Study
The findings of this study will be useful to various groups. Firstly, it will be useful to the
management of KRA and the debt management staff as they will be able to know the effect
of the debt management tools on revenue collection.
Secondly, the study will be useful to the government and other policy makers. They will use
the finding of the study to make changes and/or improvement on the laws governing debt
recovery.
Thirdly, the finding of this study will contribute to the existing body of knowledge. This may
an area of interest for other researchers and academicians seeking to explore this area of
study and may also form a basis for further studies.
10
CHAPTER TWO
LITERATURE REVIEW
2.1 Introduction
Every scientific study begins with the researcher examining reports of previous studies
related to the topic of interest. Without this step, researchers cannot expect to construct and
integrated, comprehensive picture of the world. They cannot achieve the progress that comes
from building on the efforts of others. Also, investigators working in isolation are doomed to
repeat the mistakes made by their predecessors (Cooper, 1998).
This chapter will include the review theories guiding the study, review of empirical studies,
review of general literature, theoretical framework and conclusion.
2.2 Theoretical Review
2.2.1 Resource-based Theory
The resource-based theory as a basis for competitive advantage of a firm lies primarily in the
application of the bundle of valuable interchangeable and intangible, tangible resources at the
firm’s disposal. To transform a short-run competitive advantage into a sustained competitive
advantage requires that these resources are heterogeneous in nature and not perfectly mobile.
Effectively this translates into valuable resources that are neither perfectly imitable nor
substitutable without great effort. If these conditions hold, the firm’s bundle of resources can
assist the firm sustaining above average returns (Priem & Butler, 2001).
The key points proposed by this theory include the identification of firm’s potential key
resources, evaluate whether the resources fulfil the following criteria and care for and protect
resource that possess these evaluations, because doing so can improve organisational
performance. The theory gives more weight to the firm’s proactive choices. Although
environmental opportunities and threats are important considerations, a firm’s unique
resource comprises the key variables that allow it to develop and sustain a competitive
strategic advantage (Rugman & Verbeke, 2002).
2.2.2 Stakeholders Theory
According to this theory by (Freeman, 1988), corporation have stakeholders, that is, any
group or individual who can affect or is affected by the corporation. The stakeholders may
include the shareholders, stakeholders (Freeman, 1988). employees, suppliers, customers,
11
government and the community. Because of the involvement of these various groups in a
corporation the role of the management is to maximize the wealth of the
Therefore, an organisation is required to carry out its mandate with all stakeholders in mind.
Any action taken in achieving the goals and objects of the organisation should be aligned
towards maximizing shareholders’ wealth.
2.2.3 Asymmetrical Information Theory
This theory was first introduced by George Akerlof (1970) and further developed by Michael
Spence (1973) and Joseph Stiglitz (1975). Akerlof in his paper “The Market for "Lemons":
Quality Uncertainty and the Market Mechanism” develops asymmetric information with the
example case of automobile market. His basic argument is that in many markets the buyer
uses some market statistic to measure the value of a class of goods. Thus the buyer sees the
average of the whole market while the seller has more intimate knowledge of a specific item.
Akerlof argues that this information asymmetry gives the seller an incentive to sell goods of
less than the average market quality. Michael Spence continues the ideas of George A.
Akerlof in his 1973 paper “Job Market Signaling”. He uses the job market as an example in
his paper. He models hiring employees as uncertain investment in that the capabilities of the
employee are not know and even after employment the capabilities will take time to be
known as the employee goes through learning and training. The employee gets hired because
of the signal relayed to employer at time of selection. Spence likens job hiring with a lottery.
Joseph Stiglitz in his 1975 paper “The Theory of ’Screening,’ Education, and the Distribution
of Income” explore whether screening could be used by the seller (employer) to screen the
applicants (potential employees) into categories that reflect their productivity or some other
capability. By screening then the qualities will be to know a correct placement or increase in
wage (Auronen, 2003).
(Auronen, 2003) enumerates that it is empirically clear that people possess different
information. The information they possess affects their behavior in many situations. Consider
buying goods, for example, the seller adjusts the price of an item based on her knowledge of
the prices of similar items on the market and the condition of the item among other factors.
The buyer similarly can have information about the prices of similar items in the market. But
what he probably does not have is the same depth of information about the quality of the item
as its seller. There is clearly an information asymmetry between the two parties at issue.

12
The information available to the revenue authority about a taxpayer may not be correct or
may give not be true picture of the situation. A debtor may be in a position to pay the tax debt
in full but enters into an agreement to pay over a longer period of time because of failure to
properly screen them of improper signal given by the debtor.
2.3 Debt Management Tools
There are a number tools that can be applied in the management of debt. This tools ensures
that tax due is collected as soon as possible and in full. The tools should be applied gradually,
that is start with the friendlier tools as you progress to the more forceful ones.
2.3.1 Notice and Demand for Payment
When a debt has be confirmed to be valid, debt management officer seeks approval from the
manager to raise a demand notice. This notice indicates the amount a debtor owes the
authority. A settlement plan may be entered into; this is an arrangement to pay tax over a
period of time agreed upon, and the debt is hence collected (Domestic Taxes Department,
2006).
2.3.2 Issue of Agency Notices
This is one of the involuntary enforcement tools. This is a notice issued after a period given
in demand has elapsed and the debtor has not responded. It is issued to a third party who may
be owing money to the debtor. If the agent has no money owing to the debtor he has to
respond in 7 days otherwise if 30 days lapses then taxes will be recovered from the agent.
(Domestic Taxes Department, 2006; Income Tax Act, 2010)
2.3.3 Recovery of Tax by Distraint
This enforcement provision is most efficient where the defaulting taxpayer is known to be in
possession of distrainable goods. This is appropriate where the debtor is uncooperative after
being contacted, is a perpetual defaulter, the tax debt is fairly large, agency notice has failed
to yield any taxes, possibility of bankruptcy and threats of the taxpayer leaving the country.
Commissioner may, instead of suing for the tax, recover it by distress, and for that purpose
may by order under his hand authorize an officer to execute distress upon the goods and
chattels of the person from whom the tax is recoverable and that officer may, at the cost of
the person from whom the tax is recoverable, employ such servants or agents as he may think
necessary to assist him in the execution of the distress. Where full or part is not collected
through distress then it shall be recovered through suit and where the tax debt is recovered
after the issue of an order under this section and before the execution of distress, any costs

13
and expenses incurred by the Commissioner prior to the payment of the tax shall be deemed
to be a debt due and payable to the Government by the person in respect of whom the order
was issued (Domestic Taxes Department, 2006; Income Tax Act, 2010)
2.3.4 Collection of Tax by Suit
This is employed when all other strategies have been applied without satisfactory results.
The conditions for pursuing debt through law suits are outlined in the Income tax Act and the
customs and excise Act (Domestic Taxes Department, 2006). According to the Income Tax
Act (2010), where payment of tax has not been made on or before the due date; or a notice
which has been served on a person about to leave Kenya without paying tax due has not been
complied with, the tax due by that person may be sued for and recovered as a debt due to the
Government in a court of competent jurisdiction by the Commissioner in his official name.
In a suit under this section 101 of the Act, the production of a certificate signed by the
Commissioner giving the name and address of the person concerned and the amount of tax
due and payable by him shall be sufficient evidence that the amount of tax is due and payable
by that person.
2.3.5 Security on Property & Security Bond
Where a person being the owner of a land or building fails to make payment of tax due by
him on or before due date or fails to comply with the notice served on him under section 98
of Income Tax Act, the commissioner may notify that person in writing of his intention to
apply to the Registrar of Lands to the subject of security for the tax amount specified in the
notice (Domestic Taxes Department, 2006; Income Tax Act, 2010).
2.4 Empirical Review
There are some empirical studies on debt collection management. However, most studies
done in Kenya have focused on working capital management, credit selection and analysis,
and trade credit theories. Some of the empirical studies are discussed in the section.
The United States Government Accountability Office- GAO (1996;2008) reviewed the
Internal Revenue Service’s (IRS) tax debt collection practices. It found that every year IRS
successfully collects over a trillion dollars in taxes owed the government, yet at the same time
tens of billions more remain unpaid. This was attributed by lack of reliable and accurate
information on the nature of the debt and the effectiveness of IRS collection tools; old debts
that are uncollectable as the debts are untraceable, deceased, and defunct corporations;

14
antiqued computer hence need for modernisation and use of out-dated collection processes.
The data on debt from 2002 to 2008 was collected and analysed. They analysed yield of each
collection tool applied and changes in debt inventory. GAO has identified material
weaknesses in IRS’s controls over unpaid tax assessments and collections partly due to the
lack of agency wide cost-benefit data and related performance measures. Although IRS has
made some progress on these weaknesses, progress has not been sufficient to resolve them.
Dohrmann & Pinshaw (2009) did an in-depth research on direct taxes at federal tax
administrations in a diverse set of 13 countries: Australia, Belgium, Brazil, Canada, Chile,
Denmark, France, Ireland, Norway, South Africa, Spain, Sweden and the United States.
They found that the more important drivers of collection performance are demand
management, taxpayer segmentation, streamlined debt-settling operations and performance
tracking. The high performing tax administrations determine the probability of default based
on the taxpayer’s ability and willingness to pay. Effective segmentation, combined with early
validation of debt, ensures resources allocated to cases that will yield the highest returns;
dynamic risk scoring enables tax administrations regularly to re-prioritize and reallocate
resources to cases with higher-risk profiles. Segmentation is used to determine contact
strategy. Top performing tax administrations offer taxpayers flexible instalment agreements
based on an assessment of their financial situation, occasionally negotiating interest payments
and penalties. They also found that the top performers in collections rigorously track the
performance of the entire collections unit as well as individuals, against the most critical
measures. They communicate these results to staff, and adjust and improve their operations
accordingly. (Hira, 2011) concurs that segmented approach is important as it ensures that
focus on groups of taxpayers is correct as clearly different segments of the market and
industry will have different idiosyncrasies.
Tax arrears tend to rise sharply during an economic downturn. According Brondon (2009)
this is because when credit is tight or unavailable, credit-constrained taxpayers may be
tempted to use tax evasion as an alternative source of finance for their operations. For
example, businesses may fail to remit to the government the taxes they have withheld from
their customers (value-added tax—VAT) or employees (payroll taxes). Also, taxpayers who
face severe economic stress—such as the risk of bankruptcy—may perceive the downside
risks of tax evasion (penalties) to be minimal compared with the potential upside gains

15
(avoiding bankruptcy). Indeed it can be shown, for instance, that if the bankruptcy costs are
large enough, this effect—gambling for resurrection by becoming less tax compliant—can
outweigh the progressivity consideration noted above. Further OECD (2013) indicates in its
research that in the aftermath of the global economic crisis there has been upwards growth in
the overall incidence of tax debts written off as uncollectible; applying the ratio “tax debts
written off/value of year-beginning tax debt outstanding”, the average ratio across OECD
countries rose from around 19% in 2007 to just over 25% in 2009, and eased only marginally
in 2010 and 2011.
Kariuki (2011) found that there is a great emphasis on credit screening and debt collection by
large Kenyan firms, where also 80% of the credit activity and staff is. Most companies do not
outsource credit activities due to the sensitivity required in dealing with customers and wish
to retain flexibility in credit extension and collection matters. He also observed that legal debt
recovery is difficult due to poor court systems, corruption and long court hearings. However,
with the on-going judicial reforms, firm may look into ways of dealing with perpetual bad
debtors through the legal process available. Arbitration is also becoming an important dispute
resolution mechanism because it is cheaper than going to court, takes a shorter time, and does
not severely impair good customer relationships since the arbitrator is mutually agreed upon
by the both parties in a commercial disagreement.
In a study by Kilonzo (2012) on the effects of tax amnesty on revenue growth in Kenya, he
found that there was negative association between revenue growth, inflation and tax amnesty
and a positive relationship between tax revenue growth and gross domestic product (GDP).
The results indicated that amnesty by itself does not have a positive effect on revenue growth.
Governments have been granting amnesty to its citizens in order to encourage them to be
compliant. The taxpayers in most cases are exempted from paying penalties and interests
accrued over the time they were non-compliant.
A study undertaken by the UK NAO (Comptroller and National Audit Office, 2012) noted
that during 2009-10 Her Majesty’s Revenue and Customs-United kingdom (HMRC) began to
implement a revised debt management strategy which aimed to target collection activities
more effectively to increase the likelihood of recovery, improve the speed of collection, and
reduce costs. The strategy was also to help prevent taxpayers getting into debt by supporting
16
them better before their tax liabilities became overdue and communicating more effectively
with them so that any queries were resolved and debt paid without needing multiple contact.
To implement this revised approach the Department aimed to improve its debt collection
processes through: 1) a campaigns-based approach; 2) better understanding of taxpayer
behaviour; 3) developing its channels of customer contact, particularly by telephone; 4)
improving its information systems; and 5) improving the quality of its information on debt
balances. The NAO noted that HMRC has made progress in a number of areas in
implementing its revised debt management strategy, particularly in rolling out its campaigns-
based approach. Previously the directorate used a standard debt collection process for all
debts, sending automated debt reminders initially, following up with telephone calls, in
writing and through visits. The directorate used this approach regardless of the type of debt,
with limited differentiation by value and risk of non-payment. In contrast, a campaign is an
individually designed, time-limited set of actions taken for a particular tax stream’s debts. It
involves segmenting debts into groups, such as by value and behaviour of groups of
taxpayers, and tailoring collection activities to each group. NAO also noted that HMRC had
increased its use of new payment methods (e.g debit and credit cards), introduced a new
penalty regime to better align penalties across the major taxes, increased accessibility to
payment arrangements, substantially increased the capacity of its debt management telephone
centre, and expanded its out-of-hours calls to different target groups.
In a research done by Wambugu (2012) it was found that local authorities consider
employing a mix of aggressive debt management strategies and third party agencies to collect
their taxes. Further the findings indicated that a local authority should have internal debt
collection strategies which should be up to date since the market will always develop
mechanism to evade paying rates and levies. Effective internal collection strategies
supplement the efforts by the third party that has been outsourced.
Ogolla (2012) did a study on Debt recovery as an Operational Strategy used by NIC Bank to
Manage Non-performing Loans Portfolio. She collected primary data using semi-structured
questionnaires answered by the staff in the debt department in the various branches of the
bank. The study supported the three strategies employed by the bank in managing the loan
book through operational strategies. These strategies are: legal strategies, debt portfolio
management and relationship management. It also revealed that the bank has put in place
17
various measures to ensure loans don’t go bad and before they go bad, enough efforts have
been put in place to seek early recovery and in effect reducing the exposure even if it means
getting a small part of the loan and writing off the accumulated interest.
Chambers & Curatola (2012) conducted a behavioral experiment to see if a taxpayer who is
given the opportunity to pay estimated federal income taxes monthly (instead of quarterly)
will do so, and also whether they are less delinquent than those in the control group, who paid
estimated federal income taxes quarterly. Their results indicated that when respondents were
explicitly offered the opportunity to make monthly rather than only quarterly payments, the
majority of the respondents opted to make monthly prepayments at least once. Additionally,
those with an explicit option to pay as often as monthly rather than quarterly had significantly
fewer dollars of delinquency. Paying more frequently could alleviate some budgeting
pressures for the self-employed and result in fewer delinquencies to be collected at the federal
level.
An audit by Michigan office on Tax Compliance Bureau reported that the Discovery and Tax
Enforcement Division did not sufficiently pursue taxpayer with potential tax deficiencies.
Their Law authorizes the Department of Treasury to determine and notify the taxpayer of a
tax liability based on examination of a tax return, a payment, or an audit (McTavish, 2013).
The lapse by an authority in following up the already defaulting taxpayers leads to growth in
tax debt that would have otherwise been contained in early stages of their discovery.
The collector-general for Canada Revenue Authority observes that Information Technology
(IT) can be used to consolidate all information of the taxpayer. A key feature of their
approach to compliance and debt management is early intervention by Revenue staff when
payment and compliance problems arise. Sophisticated Revenue I.T. systems have been
developed and refined to assist them in the timely identification of cases for direct
intervention relating to either payment or return compliance. The riskiest cases are targeted
first but there is a structured programme in place to ensure that all cases that are non-
compliant in any form are examined and subject to appropriate intervention. Problem cases
are assigned to an individual caseworker, within a specific highly skilled team and that
caseworker and team will determine the appropriate action needed in each case. The key

18
deliverable from the caseworker’s intervention is to bring the case to full compliance in the
shortest timeframe possible (Canada, 2013).
In a study by OECD (2013) internationally comparative data on aspects of tax systems and
their administration in 52 advanced and emerging economies over a seven year period (2005
to 2011) was provided. The information was obtained from a survey of revenue bodies, 34
OECD and18 non OECD countries. In applying the benchmark ratio “undisputed tax debt as
a share of net revenue collections” for 2011 as a broad indicator of the relative magnitude of
the debt inventory 13 revenue bodies had a ratio < 5%; 9 revenue bodies had a ratio between
5 and 10%; 15 revenue bodies had a ratio between 10-20%; 9 revenue bodies had a ratio over
20% (the highest over 60%); and 7 reported no data. Looking at movements between end-
2007 and end-2010 period, using the same benchmark ratio as a broad indicator of payment
compliance/collection effectiveness 25 revenue bodies display an increasing ratio; 7 revenue
bodies display a declining ratio; and for 20 revenue bodies there were insufficient data to
ascertain the movement. Looking at the benchmark ratio “tax debts written off/value of year-
end tax outstanding” over seven years to gauge the relative magnitude of tax debts written
off, on average, revealed 9 revenue bodies generally had a ratio less than 10%; 9 revenue
bodies generally had a ratio in the range 10-20%; 7 revenue bodies generally had a ratio in
the range 20-40%; 3 revenue bodies generally had a ratio over 40%; and for 24 revenue
bodies, there were insufficient data to compute this ratio and its trend or the computed ratios
fluctuate widely with no discernible trend evident. There were gaps in survey responses for
latter years (i.e. 2010 and 2011) which suggests weaknesses in the management information
systems used for debt collection for many revenue bodies; for example, almost one third of
revenue bodies were unable to report the amount of tax collected resulting from enforced debt
collection activities, while around 40% failed to report the number of debtors/cases on hand
at year-end 2011.
2.5 Summary of the Literature Review
Tax debt is an important aspect when it comes to revenue collection. Just like in private
businesses, the tax agencies should take collection of debt seriously in order to foster a good
image to the population that the taxation of a country if fair and equitable. This will
encourage compliance to the tax laws in place and enhance revenue performance. Hence this
will enable the government to finance its annual budget.

19
There is need to analyse the strategies put in place by KRA in collecting tax debt and find out
how efficient they are. The information needed to manage debt needs to be up to date. This
will enhance collection of delinquent accounts using appropriate collection tools and even
write-off tax debts which have been rendered unrecoverable due to various reasons. Writing-
off of unrecoverable tax debt will reduce on the tax debt level reported at year end, giving the
correct picture of the tax debt liability owed to the government by the taxpayers. The use of
IT in managing debt is important. This will enable the authority to have a better way to
follow up on debt and knowing its debtors. In this view and from the literature review, the
study will establish the effect of debt management tools on revenue collection at KRA.

20
CHAPTER THREE
RESEARCH METHODOLOGY
3.1 Introduction
The method section of a research study describes the procedures that have been followed in
conducting the study (Mugenda & Mugenda, 1999). This chapter includes research design,
data collection methods and data analysis.
3.2 Research Design
Research design is the conceptual structure within which research is conducted; it constitutes
the blue print for the collection, measurement and analysis of data. Descriptive design studies
are those studies which are concerned with describing the characteristics of a particular
individual or a group (Kothari, 2004). It is conducted to demonstrate the association or
relationship between variable under study. In this study, descriptive research design has been
chosen so as to investigate the effect of debt management tools on the revenue collection at
KRA.
3.3 Data Collection
The study used secondary data. Secondary data is information obtained from research
articles, books, or casual interviews (Mugenda & Mugenda, 1999). This information was
obtained from the monthly, quarterly and yearly reports of the debt sections of KRA and
Research and Corporate Planning department, the KRA financial statement reports and
statistical bulletins from KRA, World Bank and Kenya Bureau of Statistics (KNBS). The
data used was collected from 2003 to 2013.
3.4 Data Analysis
The data collected was descriptively analyzed using Statistical Package for Social Sciences
(SPSS). The descriptive statistical tools helped in describing the data and the extent the
various debt management tools were used. The data was then analyzed through percentages,
measures of central tendency and standard deviation. The regression and correlation analysis
was also carried out. The generated quantitative reports were presented through tabulations
and graphs.
The research studied the effect of debt management tools used by KRA on revenue
collection. A regression model was used in this study. The model was used to analyse the
effects of debt collection on revenue by KRA. The revenue collection is the dependent
21
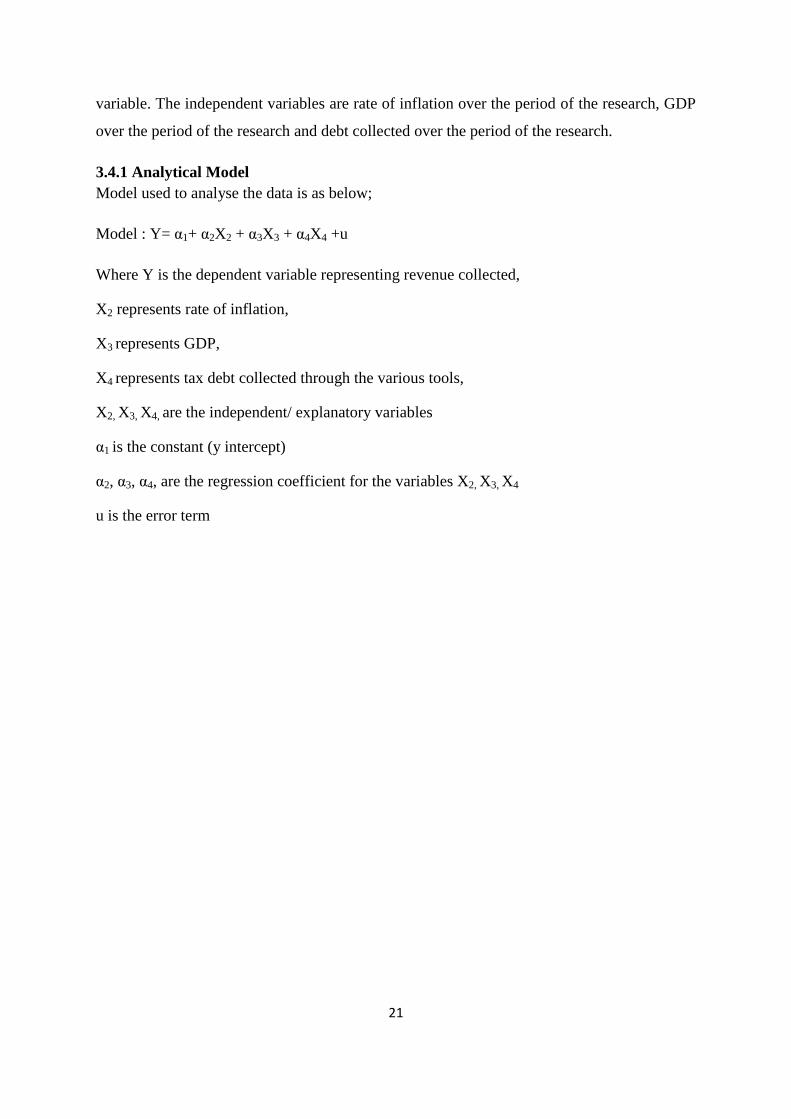
variable. The independent variables are rate of inflation over the period of the research, GDP
over the period of the research and debt collected over the period of the research.
3.4.1 Analytical Model
Model used to analyse the data is as below;
Model : Y= α1+ α2X2 + α3X3 + α4X4 +u
Where Y is the dependent variable representing revenue collected,
X2 represents rate of inflation,
X3 represents GDP,
X4 represents tax debt collected through the various tools,
X2, X3, X4, are the independent/ explanatory variables
α1 is the constant (y intercept)
α2, α3, α4, are the regression coefficient for the variables X2, X3, X4
u is the error term
22
CHAPTER FOUR
DATA ANALYSIS AND PRESENTATION OF FINDINGS
4.1 Introduction
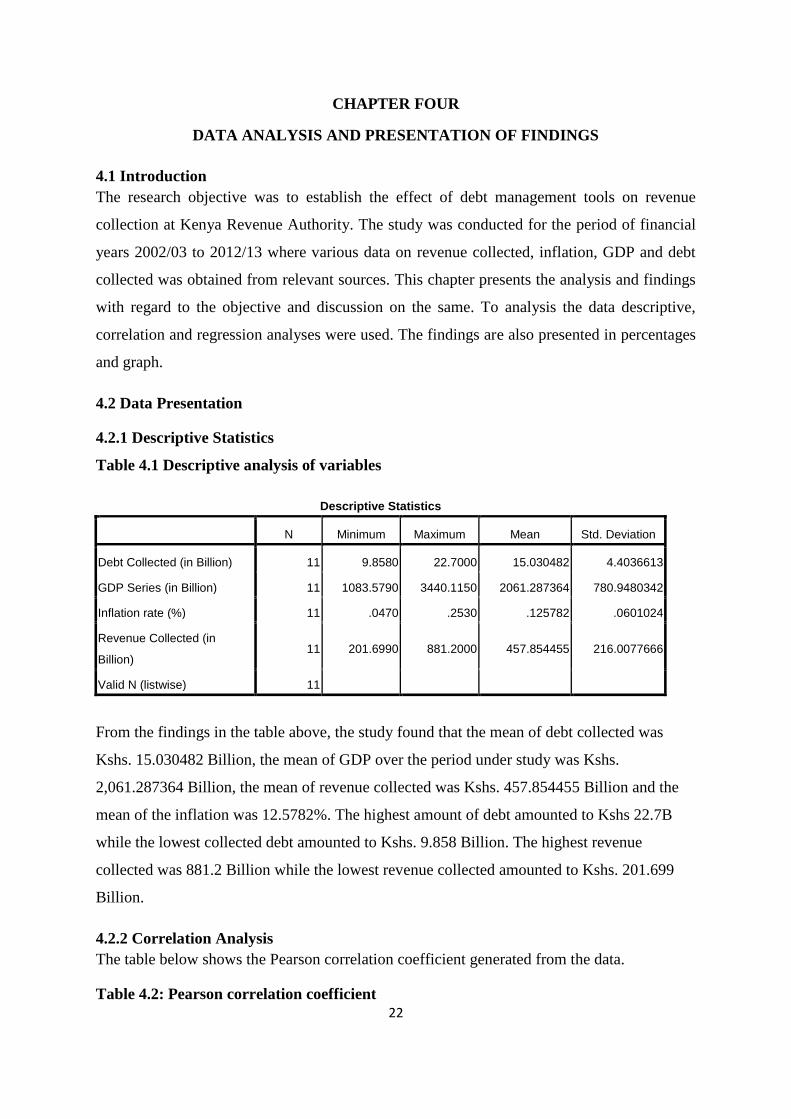
The research objective was to establish the effect of debt management tools on revenue
collection at Kenya Revenue Authority. The study was conducted for the period of financial
years 2002/03 to 2012/13 where various data on revenue collected, inflation, GDP and debt
collected was obtained from relevant sources. This chapter presents the analysis and findings
with regard to the objective and discussion on the same. To analysis the data descriptive,
correlation and regression analyses were used. The findings are also presented in percentages
and graph.
4.2 Data Presentation
4.2.1 Descriptive Statistics
Table 4.1 Descriptive analysis of variables
Descriptive Statistics
N Minimum Maximum Mean Std. Deviation
Debt Collected (in Billion) 11 9.8580 22.7000 15.030482 4.4036613
GDP Series (in Billion) 11 1083.5790 3440.1150 2061.287364 780.9480342
Inflation rate (%) 11 .0470 .2530 .125782 .0601024
Revenue Collected (in
Billion) 11 201.6990 881.2000 457.854455 216.0077666
Valid N (listwise) 11
From the findings in the table above, the study found that the mean of debt collected was
Kshs. 15.030482 Billion, the mean of GDP over the period under study was Kshs.
2,061.287364 Billion, the mean of revenue collected was Kshs. 457.854455 Billion and the
mean of the inflation was 12.5782%. The highest amount of debt amounted to Kshs 22.7B
while the lowest collected debt amounted to Kshs. 9.858 Billion. The highest revenue
collected was 881.2 Billion while the lowest revenue collected amounted to Kshs. 201.699
Billion.
4.2.2 Correlation Analysis
The table below shows the Pearson correlation coefficient generated from the data.
Table 4.2: Pearson correlation coefficient

23
Correlations
Debt Collected (in
Billion)
GDP Series (in
Billion)
Inflation
rate
Revenue Collected
(in Billion)
Debt Collected (in Billion) Pearson Correlation 1 .000 -.123 .053
Sig. (2-tailed) 1.000 .719 .877
N 11 11 11 11
GDP Series (in Billion) Pearson Correlation .000 1 -.053 .995**
Sig. (2-tailed) 1.000 .877 .000
N 11 11 11 11
Inflation rate Pearson Correlation -.123 -.053 1 -.071
Sig. (2-tailed) .719 .877 .836
N 11 11 11 11
Revenue Collected (in Billion) Pearson Correlation .053 .995** -.071 1
Sig. (2-tailed) .877 .000 .836
N 11 11 11 11
**. Correlation is significant at the 0.01 level (2-tailed).
A correlation coefficient, denoted by r, enables one to quantify the strength of the linear
relationship between ranked or numerical variables. This coefficient takes the values between
-1 and +1 (Saunders, Lewis , & Thornhill, 2009). There is no statistically significant
relationship between debt collected and revenue collected (r= 0.053, p>0.01) and the
relationship between rate of inflation and revenue collected (r= -0.071, p>0.01). However,
there is a statistically strong positive relationship between revenue collected and GDP (r=
0.995, p< 0.01).
4.2.3 Regression Analysis
Table 4.3: Model Summary
Model Summary
Model R R Square
Adjusted R
Square
Std. Error of the
Estimate
1 .997a .993 .991 20.9660075
a. Predictors: (Constant), Inflation rate, GDP Series ((in Billion), Debt
Collected (in Billion)
24
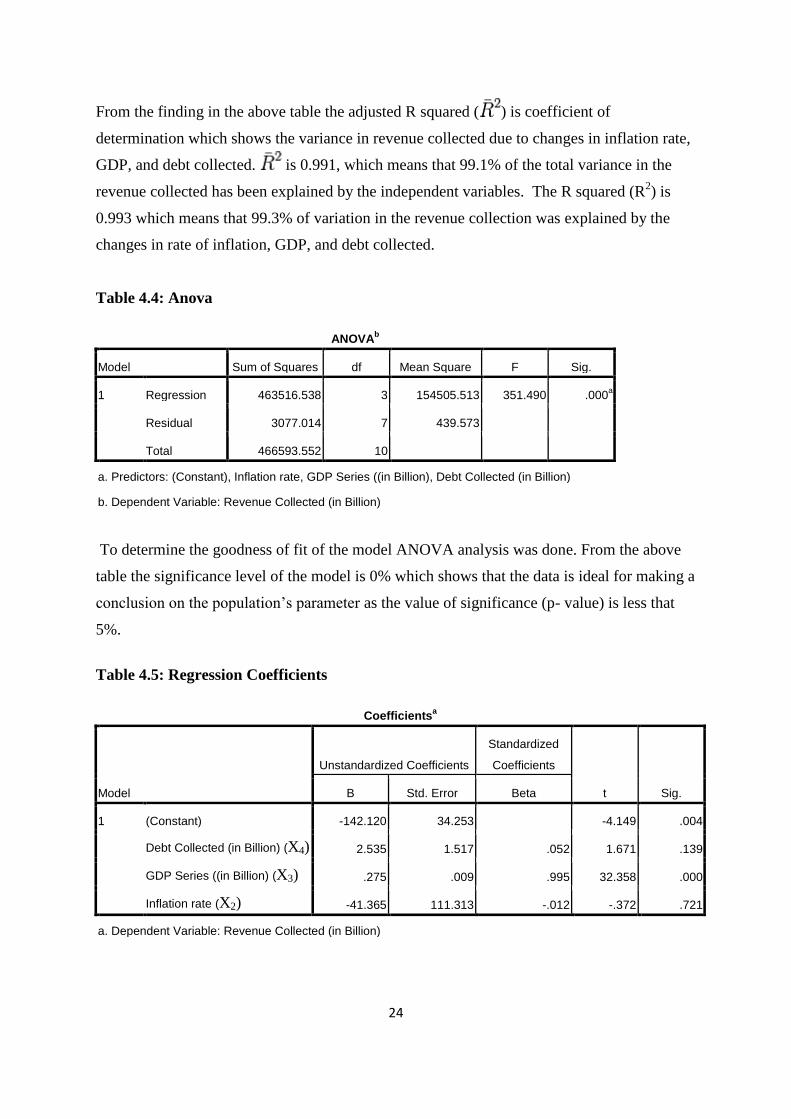
From the finding in the above table the adjusted R squared ( ) is coefficient of
determination which shows the variance in revenue collected due to changes in inflation rate,
GDP, and debt collected. is 0.991, which means that 99.1% of the total variance in the
revenue collected has been explained by the independent variables. The R squared (R2) is
0.993 which means that 99.3% of variation in the revenue collection was explained by the
changes in rate of inflation, GDP, and debt collected.
Table 4.4: Anova
ANOVAb
Model Sum of Squares df Mean Square F Sig.
1 Regression 463516.538 3 154505.513 351.490 .000a
Residual 3077.014 7 439.573
Total 466593.552 10
a. Predictors: (Constant), Inflation rate, GDP Series ((in Billion), Debt Collected (in Billion)
b. Dependent Variable: Revenue Collected (in Billion)
To determine the goodness of fit of the model ANOVA analysis was done. From the above
table the significance level of the model is 0% which shows that the data is ideal for making a
conclusion on the population’s parameter as the value of significance (p- value) is less that
5%.
Table 4.5: Regression Coefficients
Coefficientsa
Model
Unstandardized Coefficients
Standardized
Coefficients
t Sig. B Std. Error Beta
1 (Constant) -142.120 34.253 -4.149 .004
Debt Collected (in Billion) (X4) 2.535 1.517 .052 1.671 .139
GDP Series ((in Billion) (X3) .275 .009 .995 32.358 .000
Inflation rate (X2) -41.365 111.313 -.012 -.372 .721
a. Dependent Variable: Revenue Collected (in Billion)

25
From the findings the following regression model was established;
Y= -142.12 - 41.365X2 + 0.275X3 + 2.535X4
From the findings of the regression analysis, it was found that holding inflation rate, GDP
and debt collected at constant zero the revenue collected would be -142.120 Billion. The
model further reveals that a unit increase in rate of inflation would lead to a decrease in
revenue collected by a factor of -42.365, a unit increase in GDP would lead to an increase in
revenue collected by a factor 0.275 and a unit increase in debt collected would lead to an
increase in revenue collected by a factor of 2.535. The finding indicate that the y- intercept
and GDP are statistically significant at 5% level of confidence while debt collected and
inflation rate are statistically insignificant at 5% level of significance.
4.2.4 Debt collected and Revenue collected
Table 4.6: Debt collected versus revenue collected
Financial Year Revenue Collected (in Billion) Debt collected (in Billion) Debt/Revenue
2002/03 201.699 18.600 9%
2003/04 229.276 19.121 8%
2004/05 274.252 13.000 5%
2005/06 297.703 10.098 3%
2006/07 360.191 13.212 4%
2007/08 433.915 22.700 5%
2008/09 481.300 9.858 2%
2009/10 534.600 5.001 1%
2010/11 634.903 12.995 2%
2011/12 707.360 17.011 2%
2012/13 881.200 18.739 2%
The findings in the table above shows the percentage of debt collected against the revenue
collected for each financial year. It shows that percentage of debt collected against the
revenue collected has been decreasing over the years from 9% in 2002/03 to 2% in 2012/13
financial years. In the financial year 2007/08 the debt collected was inclusive of 15 Billion
paid by the treasury to facilitate the restructuring of Telkom Kenya. This shows that the
amount of debt collected decrease for some periods but increased in the last three years but
not at the rate of growth in revenue collection. There was a sharp drop of debt collected in the
26
financial years 2008/09 and 2009/10 where debt collected was Kshs. 9.858 Billion and Kshs.
5.001 Billion respectively.
4.2.5 Debt Collected, Debt Written off and Year End Debt balances
Table 4.7: Table showing the percentages of debt collected, written off against year end debt
balances
Financial Year Debt collected/ Debt balance Debt witten off/Debt Balance
2007/08 16% 22%
2008/09 10% 41%
2009/10 6% 44%
2010/11 15% 43%
2011/12 16% 32%
2012/13 16% 57%
AVERAGE 13% 39%
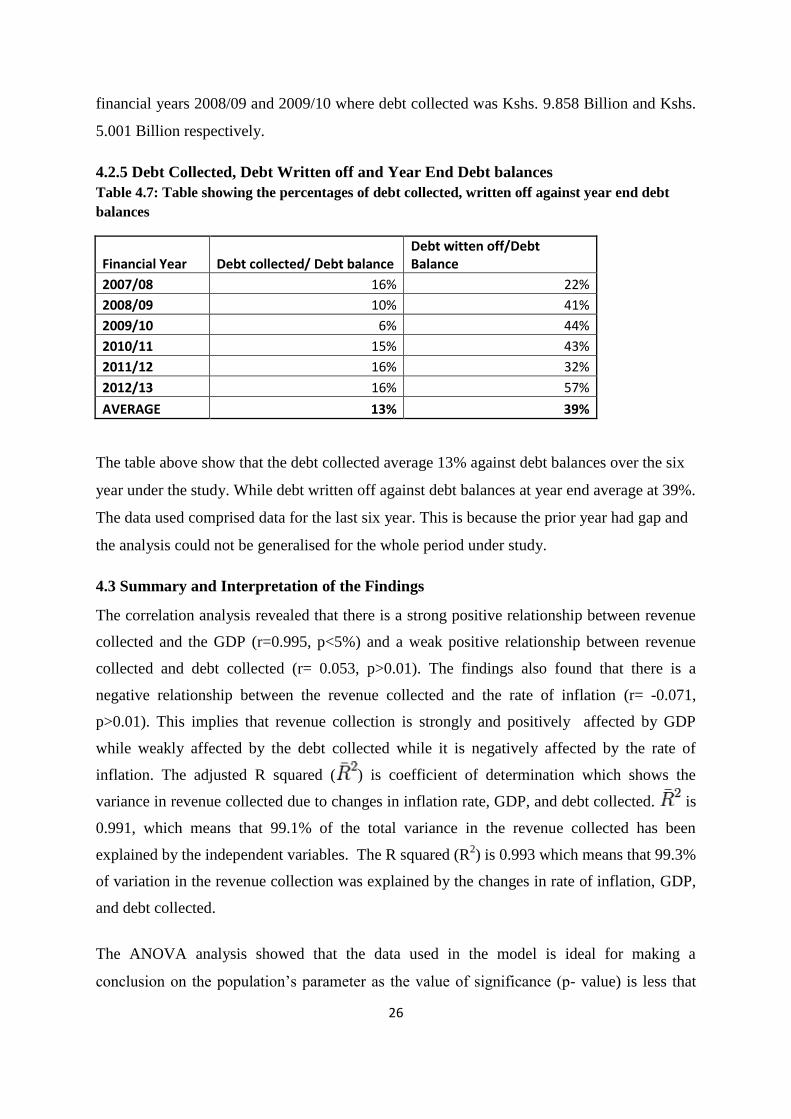
The table above show that the debt collected average 13% against debt balances over the six
year under the study. While debt written off against debt balances at year end average at 39%.
The data used comprised data for the last six year. This is because the prior year had gap and
the analysis could not be generalised for the whole period under study.
4.3 Summary and Interpretation of the Findings
The correlation analysis revealed that there is a strong positive relationship between revenue
collected and the GDP (r=0.995, p<5%) and a weak positive relationship between revenue
collected and debt collected (r= 0.053, p>0.01). The findings also found that there is a
negative relationship between the revenue collected and the rate of inflation (r= -0.071,
p>0.01). This implies that revenue collection is strongly and positively affected by GDP
while weakly affected by the debt collected while it is negatively affected by the rate of
inflation. The adjusted R squared ( ) is coefficient of determination which shows the
variance in revenue collected due to changes in inflation rate, GDP, and debt collected. is
0.991, which means that 99.1% of the total variance in the revenue collected has been
explained by the independent variables. The R squared (R2) is 0.993 which means that 99.3%
of variation in the revenue collection was explained by the changes in rate of inflation, GDP,
and debt collected.
The ANOVA analysis showed that the data used in the model is ideal for making a
conclusion on the population’s parameter as the value of significance (p- value) is less that
27
5%. The p- values of the regression coefficient were determined and it revealed that the
constant and GDP were statistically significant at 5% level of confidence with the p < 5%.
The debt collected and the rate of inflation were not statistically significant at 5% level of
significance with p > 5%. This shows that revenue collected is strongly associated with the
constant and GDP while it is weakly associated with the debt collected and rate of inflation.
From the findings the following regression model was established;
Y= -142.12 - 41.365X2 + 0.275X3 + 2.535X4
This model revealed that if the rate of inflation, GDP and debt collected are zero then the
revenue collected would be Kshs. -142.12, if rate of inflation increased by a unit then the
revenue collected would decrease by a factor -41.365, if GDP increased by a unit then the
revenue collected would increase by a factor 0.275 and if debt collected increased by a unit
then the revenue collected would increase by a factor 2.535.
The findings also show that the debt collection has not been keeping pace with the overall
revenue mobilization by KRA. This is shown where the revenue collected has been growing
over the years covered by the study while the debt collected has either been decreasing or
increasing only marginally over the years under the study.
The findings also found that the average debt collected against debt balances at year is 13%.
This shows that the debt is not being efficiently collected using the tools available. The
average debt written-off against debt balances at year end is 39%. This shows that there is a
chance that the debt being reduced is out of waivers or ledger cleaning.
Kariuki (2011) found that there was no significant relationship between the debt collection
strategies on the financial performance of companies at the Nairobi Securities Exchange. The
study also found that there is no significant relationship between debt collection management
and market performance and no significant relationship between bad debt and any of the
variables tested in the regression model.
Brondon (2009) indicated that tax arrears tend to rise while payments reduce during
economic downturn. This can be seen for the financial years 2008/09 and 2009/10 where debt
collected was Kshs. 9.858 Billion and Kshs. 5.001 Billion respectively. McTavish (2013) saw
that the Michigan Office on Tax Compliance Bureau did not sufficiently pursue taxpayers

28
with potential tax deficiency. This lapse by the authority lends to growth in tax debt that
would be contained at an early stage.
Implementation of proper debt management strategy aimed to target collection activities
more effectively to increase the likelihood of recovery, improve the speed of collection, and
reduce cost is important. This will prevent taxpayers getting into debt by supporting them
before their tax liabilities become overdue and communicating more effectively
(Comptroller and National Audit Office, 2012).

29
CHAPTER FIVE
SUMMARY, CONCLUSION AND RECOMMENDATIONS
5.1 Summary
The objective of the research study was to establish the effect of debt management tools on
revenue collection at Kenya Revenue Authority. Descriptive, correlation and regression
analyses were used.
From the descriptive analysis of the various variables, the study found that the mean of debt
collected was Kshs. 15.030482 Billion, the mean of GDP over the period under study was
Kshs. 2,061.287364 Billion, the mean of revenue collected was Kshs. 457.854455 Billion and
the mean of the inflation was 12.5782%. From the correlation analysis, the study found that
there is a positive relationship between revenue collected and GDP and debt collected and a
negative relationship between the revenue collected and rate of inflation. The relationship
between revenue collected and GDP was found to be statistically significant at significance
level of 0.01. The regression analysis was carried out to establish the association between the
revenue collected and the independent variables rate of inflation, GDP and debt collected. it
was found that there was a positive association between revenue collected and GP and debt
collected while there was a negative association between revenue collection and rate of
inflation. The significance of the model was determined and the processed data, which is the
population parameters, had a significance level of 0%. This shows that the data is ideal for
making a conclusion on the population’s parameters. The following regression model was
established;
Y= -142.12 - 41.365X2 + 0.275X3 + 2.535X4
The model summary found that the value adjusted R squared ( ) is 0.991, which means that
99.1% of the total variance in the revenue collected has been explained by the independent
variables. The R squared (R2) is 0.993 which means that 99.3% of variation in the revenue
collection was explained by the changes in rate of inflation, GDP, and debt collected.
From the finding above, debt collected versus revenue collected, it was found that the ratio of
debt collected to revenue collected has been decreasing over the years under the study. This
shows that the debt collection has not been growing as compared to the growth of revenue
over the years. It was also found that the average debt collected against debt balances at year

30
is 13%. This shows that the debt is not being efficiently collected using the tools available.
The average debt written-off against debt balances at year end is 39%. This shows that there
is a chance that the debt being reduced is out of waivers or ledger cleaning.
5.2 Conclusion
From the results of the findings it can be concluded that debt management and collection in
itself does not strongly affect revenue collection. It was found that there was a weak positive
relationship between revenue collected and debt collected. Though debt collection contributes
to the revenue collection by KRA, debt is not a major factor that drives revenue collection.
GDP greatly affect the revenue collected as there is a strong positive relationship between
revenue collected and GDP. Therefore, revenue collected is affected strongly by the growth
in economy. From the finding the rate of inflation in the economy affected revenue collection
negatively albeit their weak relationship. Though debt collection is not a strong determinant
of revenue collection it is important that the authority uses effective tools to manage debt and
this will reduce debt portfolio and that following up on unpaid taxes will foster equity and
encourage compliance amongst taxpayers.
It has been noted that the revenue collected has been growing steadily in the years under
study while the debt collected is not growing. The growth in revenue collection is attributed
to the Tax Reforms and Modernisation (TRM) being carried on at KRA. The TRM has only
focused on growing tax bases while not looking at improving debt collection. Therefore, the
authority should modernise the debt management function by employing debt management
systems and move from manual system.
To deter non-compliance the authority should improve on debt collection. This will change
the attitude the taxpayers maybe having concerning effectiveness of the authority in
collection tax in that if the taxpayers do not believe that the government will collect overdue
taxes, they may be less motivated to pay. This will hence have a negative effect on revenue
base over time.
5.3 Policy Recommendations
The study makes a few policy recommendations that may be effected by the key decision
makers. There is need for KRA to install a debt management system. This will ensure that
data on debt outstanding, debt collected, uncollectable debt and debt write-off are up to date
and reliable. Also establish a data base with sufficient details about the debtors such us the

31
telephone, mail and physical addresses in order to fast track the collection of the debt
outstanding especially from the unreachable debtors. With enhanced debt collection tax
compliance will increase and taxpayer will pay their tax promptly to avoid being followed up
with punitive consequences on unpaid taxes.
The reforms on tax filing going on is encouraging with the introduction of online filing using
ITMS and the latest improved system called iTax. This will go a long way to ensure data
capture is accurate as it will be captured by the taxpayers. However, there is need for the
authority to sensitize the taxpayers on the advantages of online filing, educate the taxpayers
on how to use the system and put in place mechanism to help the taxpayers to embrace the
new technology.
There is need for the treasury to fast track waivers processing to enable the KRA reduce its
debt portfolio accordingly. Where the waiver has been denied then the authority will be
better place to follow up with that debt soon rather than later and where it has been granted
then the debt can be written off from the system and update its debt portfolio.
The society in general is ignorant about their tax laws, hence there is need for KRA to
simplify the tax system and make it easy for the taxpayers to know their tax obligations and
honour them accordingly. This will avoid cases of debt arising out of audit as the taxpayer is
assessed on what he was ignorant about.
5.4 Limitation of the Study
The study used secondary data sourced from KRA Statistical publication, the World Bank
data bank, and from the revenue departments. The study was limited to the degree of
precision though the data was sourced from reliable sources. There was lack of uniformity in
how the various departments maintain their data hence the research could not analyse in
detail the debt collected through the various tools put in place and see what tools were more
effective.
There are other factors that affect the revenue collected each year and not only the ones
presented in the model. For example, factors like taxpayers’ behaviour and taxpayer
education have an effect on how the taxpayers comply with the tax laws including honouring
their debt obligations. This is not quantifiable to be included in the model used above.

32
During data collection it was found that the operations in all the debt departments were done
manually. There is not debt management system in place. This increases the chances of errors
in the data produced by these departments.
There was time limitation to carry out the study which necessitated the use of secondary data.
The primary data may provide more information that would give better information on debt
management tools and the factors that affects their efficiency.
5.5 Suggestion for further studies
There is on-going organisational restructuring at KRA and part of it includes the restructuring
of the debt units to form a Centralised Debt Management Unit that will deal with the
corporate debt. They are in the process of profiling the debtors and collecting as much data as
they can on the taxpayer. A research may be carried out to establish the effect of
centralisation of debt unit on debt collection.
There is growth in adoption of online filing in the recent past by the taxpayers. This is
envisaged to reduce on wrongful debt and enhance compliance. A research may be done to
establish the impact of online filing on debt portfolio and revenue collection.
A government may declare tax amnesty as it deems appropriate. A study may be done to
investigate the effect of amnesty in reducing debt portfolio and increasing revenue collected.
An exploration study on possible future trends on debt collection if KRA, through the
parliament, introduced third party debt collector.

33
REFERENCES
Annette, N. (2007). California’s Use Tax Collection Challenges And Possible Remedies. California Tax
Lawyer, accessed through http://taxation.calbar.ca.gov/Taxation/Publications.aspx#07fall.
Auronen, L. (2003). Asymmetric Information: Theory and Applications. Seminar in Strategy and
International Business.
Baer, K., & LeBorgne, E. (2008). Tax Amnesties: Theory, Trends, and Some Alternatives. Washington:
International Monetary Fund.
Brondon, J. (2009). Collecting Taxes During an Economic Crisis: Challenges and Policy Options. IMF
Staff Position Note.
Canada, A. G. (2013). 2013 Spring Report of the Auditor General of Canada: Status Report on
Collecting Tax Debts. Canada Revenue Agency;, accessed from http://www.oag-
bvg.gc.ca/internet/English/parl_oag_201304_03_e_38188.html.
Chambers, V., & Curatola, A. P. (2012). Could Increasing the Frequency of Estimated Tax Payments
Decrease Delinquency Rates Among the Self-Employed?, in Toby Stock (ed.). In T. Stock,
Advances in Taxation (Volume 20) (pp. pp 1-28). Emerald Group Publishing Limited.
Comptroller and National Audit Office. (2012). HM Revenue and Customs Annual Report and
Accounts 2011-12,. London: HM Revenue and Customs.
Cooper, H. (1998). Synthesizing Research: A Guide for Literature Review 3rd ED. Carlifonia, USA: Sage
Publications, Inc.
Davey, D. (2009). Collecting More for Less: A Strategic Predictive Analytics is Key to Growing
Collections and Reducing cost. A First Data White Paper.
Dohrmann, T., & Pinshaw, G. (2009). The Road to Improved Compliance: A McKinsey benchmarking
study of tax administration- 2008-2009. McKinsey.
Domestic Taxes Department. (2006). Operational Manual: Compliance and Debt Management (1st
ED). KRA.
Financial Management Services. (n.d.). Deliquent Debt Collection. In Debt Management Services
Collection of Delinquent Nontax Debt. Washington D.C: Financial Management Services,
accessed through www.fms.treas.gov/debt/MFR/chapter6.pdf.
Freeman, R. E. (1988). Perspectives In Business Ethics Size 3E: A stakeholder Theory of the Modern
Corporation.
GAO. (1996). Tax Administration: IRS Tax Debt Collection Practices, Statement of Lynda D. Willis,
Director, Tax Policy and Administration Issues,. General Government Division.
GAO. (2008). Tax Debt Collection: IRS Has a Complex Process to Attempt to Collect Billions of Dollars
in Unpaid Tax Debts, Highlights of GAO-08-728, a report to the. U.S Senate.

34
Hira, N. (2011, June 7). The Difficulty of Collecting Revenue: Article published in. The Financial
Journal of The Standard Newspaper.
Income Tax Act (CAP 470), (2010).
Karingi, S., Wanjala, B., Nyamunga, J., Okello, A., Pambah, E., & Nyakang'o, E. (2005). Tax Reform
Experience in Kenya, KIPPRA Working Paper No. 13. Nairobi: Kenya Institute of Public Policy
Research and Analysis.
Kariuki, A. M. (2011). Effect of Debt Collection Management on Financial Performance of Listed
Companies at Nairobi Stocks Exchange. University of Nairobi: Unpublished MBA Project.
Kilonzo, T. M. (2012). Effect of Tax Amnesty on Revenue growth in Kenya. University of Nairobi:
Unpublished MBA Project.
Kothari, C. R. (2004). Research Methodology: Methods and Techniques, 2nd Ed. New Delhi: New Age
International (P) Ltd., Publishers.
KRA Financial Statement. (1996-2013).
London, T., & Hamilton, B. (2013). The Next Generation of Government Debt Collection Practices.
CGI.
McTavish, T. H. (2013). Performance Audit of the Tax Compliance Bureau . Michigan: Department of
treasury, Assessed at http://audgen.michigan.gov.
Mikesell, J. L., & Ross, J. M. (2012, September). Fast Money? The Contribution of State Tax
Amnesties to Public Revenue Systems. National Tax Journal 65(3), pp. 529-562.
Moyi, E., & Ronge, E. (2006). Taxation and Tax Modernization in Kenya: A Diagnosis of Performance
and Options for Further Reform. Nairobi: Institute of Economic Affairs.
Mugenda, O. M., & Mugenda, A. G. (1999). Research Methods: Quantitative and Qualitative
Approaches. Nairobi: ACTS Press.
Mutua, J. N. (2012). A Citizen's Handbook on Taxation in Kenya. Nairobi: Kenya Institute of Economic
Affairs.
OECD. (2013). Tax Administration 2013: Comparative Information on OECD and Other Advanced and
Emerging Economies. OECD Publishing, http://dx.doi.org/10.1787/9789264200814-en.
Ogolla, B. A. (2012). Debt Recovery as an Operational Strategy Used in NIC Bank to Manage Non-
performing Loans Portfolio. University of Nairobi: Unpublished MBA Project.
Priem, A. M., & Butler, J. E. (2001). Is the Resource-Based Theory a Useful Perspective for Strategic
Management Research? Academy of Management Review: 26, (1), pp, 22-40.
Rugman, A. M., & Verbeke, A. (2002). Edith Penrose’s Contribution to the Resource-Based Biews of
Strategic Management . Strategic Management Journal; 23, pp 769-780.

35
Saunders, M., Lewis , P., & Thornhill, A. (2009). Research Methods for Business Students; 5th ED.
England: Pearson Education Limited.
SAS . (2012). Reforming government debt management and collection. United Kingdom: SAS Institute
Inc.
Wambugu, M. K. (2012). The Effect of Debt Collection Strategies on Financial Performance of Local
Authorities in Kenya. University of Nairobi: Unpublished MBA Project.
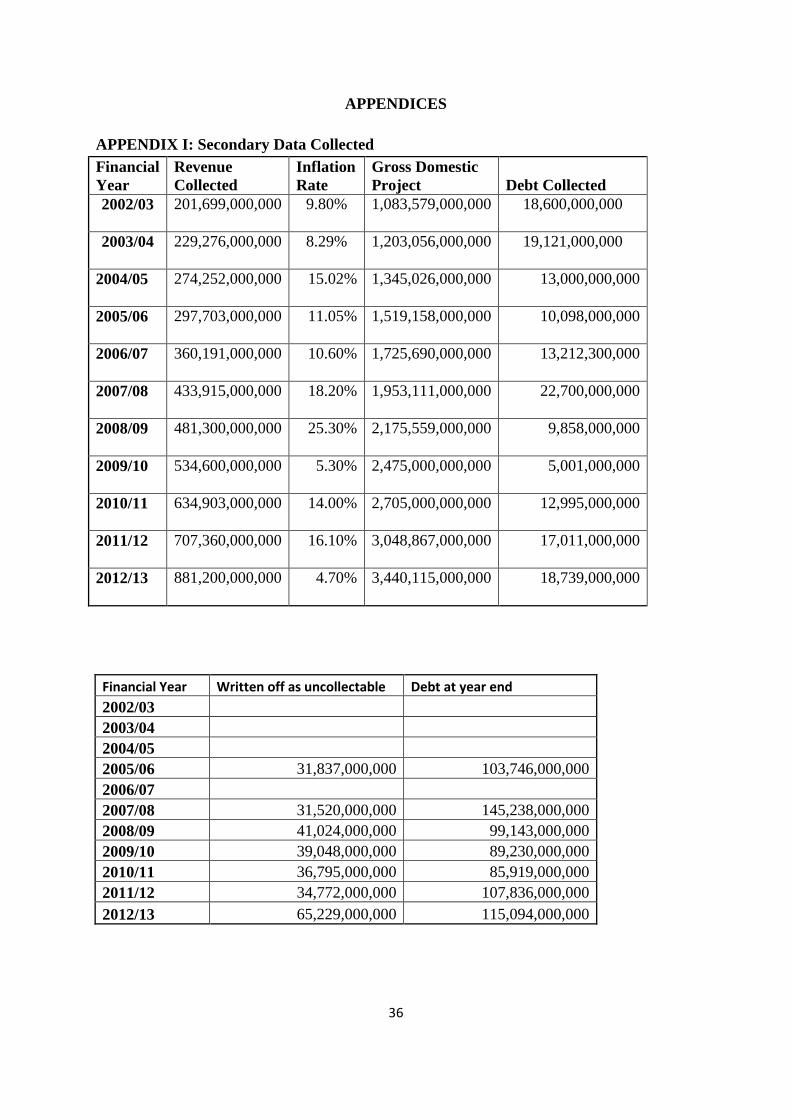
36
APPENDICES
APPENDIX I: Secondary Data Collected
Financial
Year
Revenue
Collected
Inflation
Rate
Gross Domestic
Project Debt Collected
2002/03
201,699,000,000
9.80%
1,083,579,000,000
18,600,000,000
2003/04
229,276,000,000
8.29%
1,203,056,000,000
19,121,000,000
2004/05
274,252,000,000
15.02%
1,345,026,000,000
13,000,000,000
2005/06
297,703,000,000
11.05%
1,519,158,000,000
10,098,000,000
2006/07
360,191,000,000
10.60%
1,725,690,000,000
13,212,300,000
2007/08
433,915,000,000
18.20%
1,953,111,000,000
22,700,000,000
2008/09
481,300,000,000
25.30%
2,175,559,000,000
9,858,000,000
2009/10
534,600,000,000
5.30%
2,475,000,000,000
5,001,000,000
2010/11
634,903,000,000
14.00%
2,705,000,000,000
12,995,000,000
2011/12
707,360,000,000
16.10%
3,048,867,000,000
17,011,000,000
2012/13
881,200,000,000
4.70%
3,440,115,000,000
18,739,000,000
Financial Year Written off as uncollectable Debt at year end
2002/03
2003/04
2004/05
2005/06 31,837,000,000 103,746,000,000
2006/07
2007/08 31,520,000,000 145,238,000,000
2008/09 41,024,000,000 99,143,000,000
2009/10 39,048,000,000 89,230,000,000
2010/11 36,795,000,000 85,919,000,000
2011/12 34,772,000,000 107,836,000,000
2012/13 65,229,000,000 115,094,000,000

37
APPENDIX II: Letter of Introduction
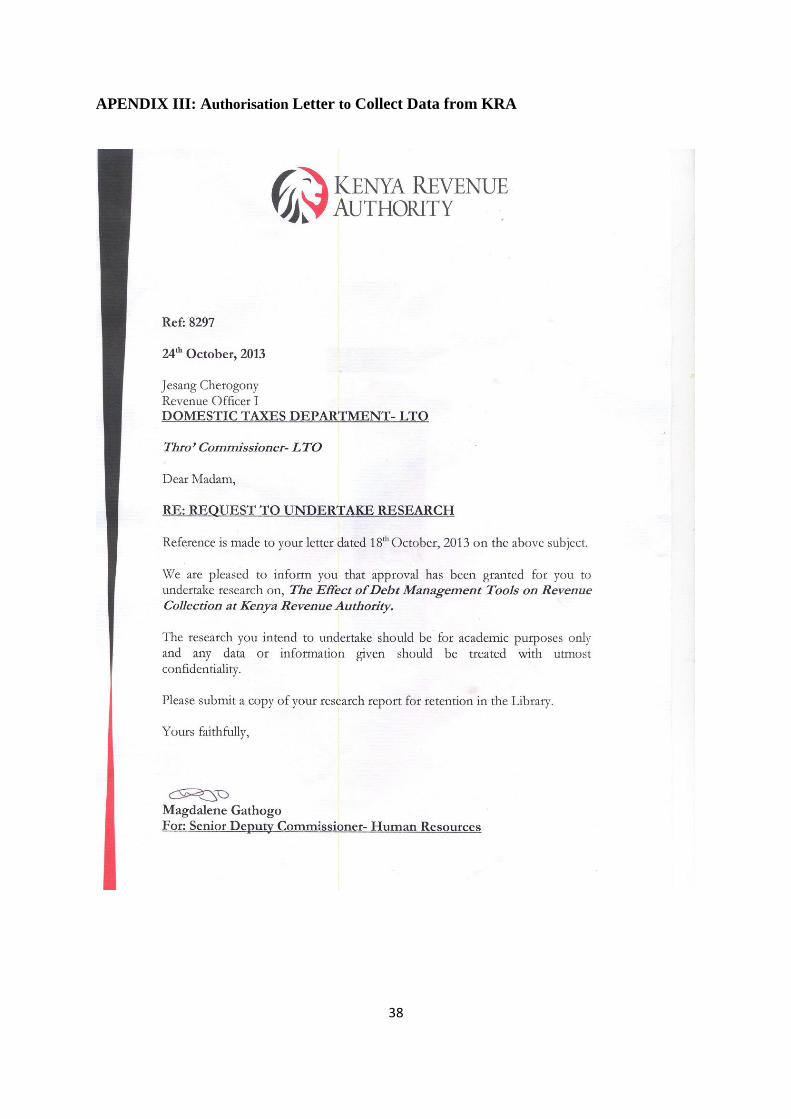
38
APENDIX III: Authorisation Letter to Collect Data from KRA