Embed Size (px)
Citation preview

The effect of inadequate access to healthcare services
on emergency room visits in Australia
Nerina Vecchio and Nicholas Rohde
No. 2017-08
Copyright © 2017 by the author(s). No part of this paper may be reproduced in any form, or stored in a retrieval system, without
prior permission of the author(s).
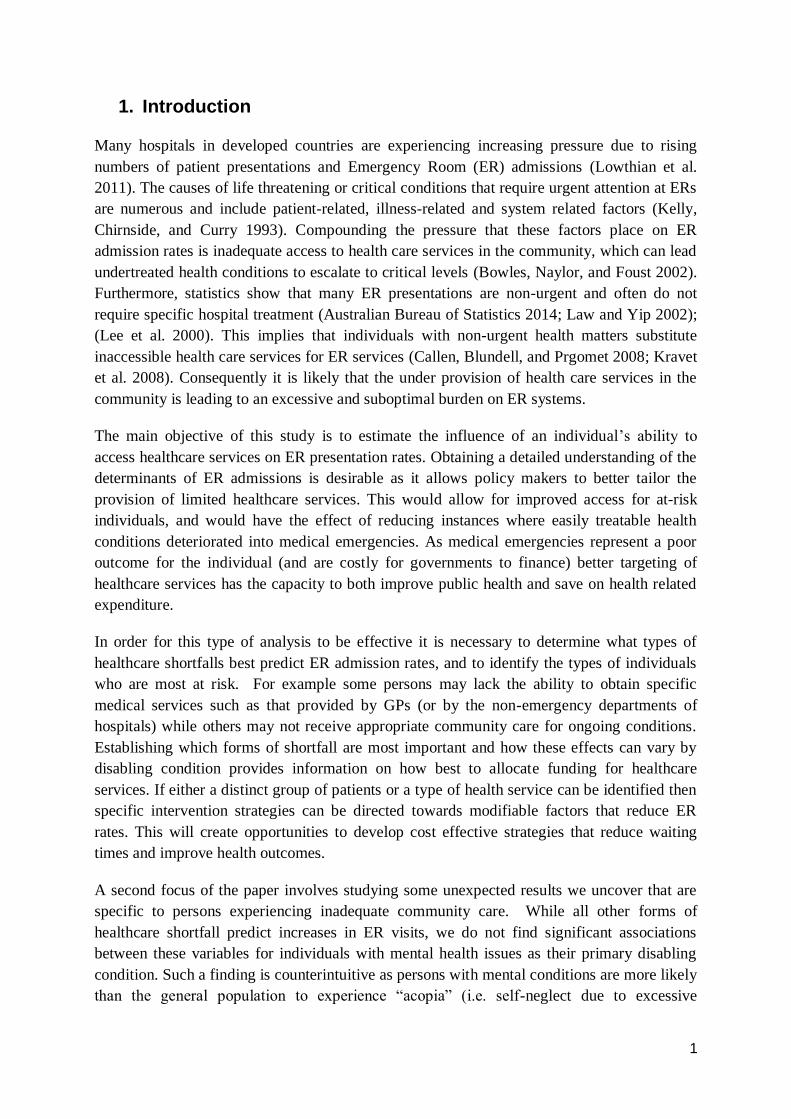
The effect of inadequate access to healthcare
services on emergency room visits in Australia
Nerina Vecchio and Nicholas Rohde
Abstract
Objective: To estimate the influence of inadequate access to healthcare services on the rate of
Emergency Room (ER) hospital visits in Australia.
Method: We take micro-data on different types of healthcare shortfalls from the 2012
Australian Survey of Disability, Aging and Carers, and employ Propensity Score Matching
(PSM) techniques to identify their effects on ER visits.
Findings: We find that shortfalls in access to various medical services increases ER visits for
individuals with mental and physical conditions by about the same degree. Conversely,
inadequate community care services significantly predict ER visits for individuals with
physical conditions, but not for persons with mental conditions. A number of robustness
checks and diagnostics tests are presented which confirm that our modelling assumptions are
not violated and that our results are insensitive to the choice of matching algorithms.
Conclusions: Unless an individual is in physical rather than mental distress, crisis ER
treatment is less often sought or unavailable. Greater attention needs to be given to providing
more flexible and appropriate access to health care services in the community setting.
Key words: Emergency room visits, Healthcare access shortfalls, Propensity score matching
JEL Codes: I10
1
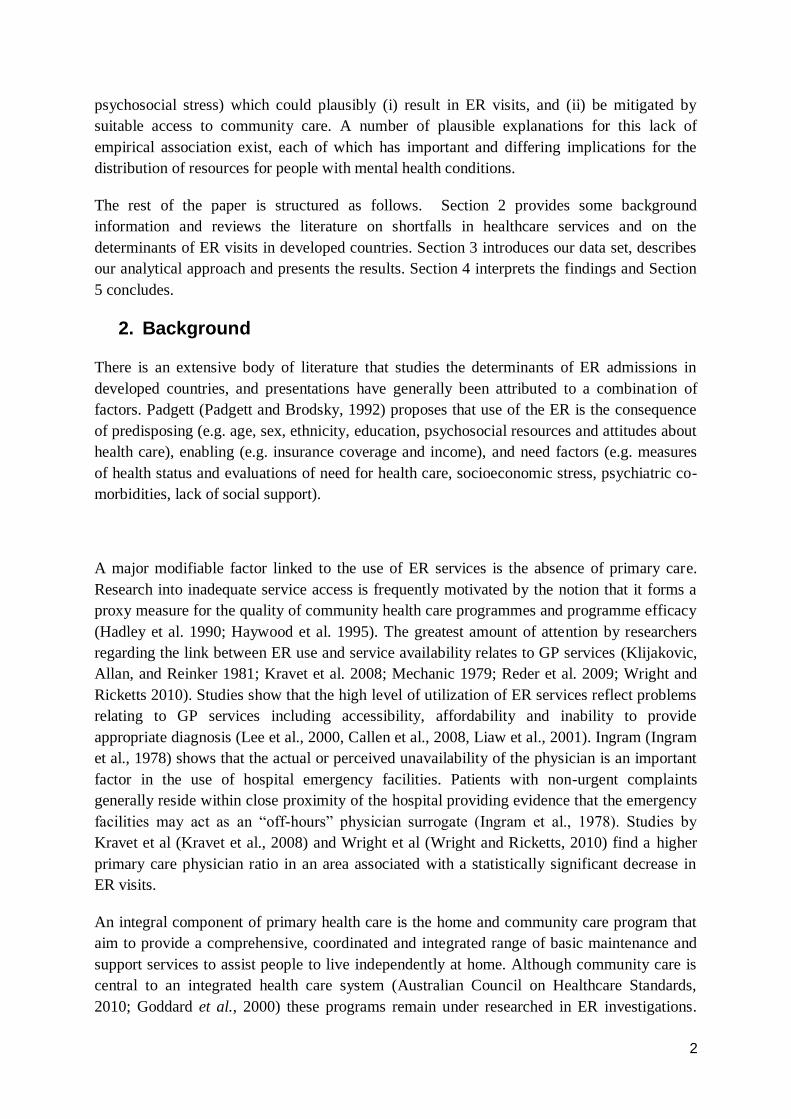
1. Introduction
Many hospitals in developed countries are experiencing increasing pressure due to rising
numbers of patient presentations and Emergency Room (ER) admissions (Lowthian et al.
2011). The causes of life threatening or critical conditions that require urgent attention at ERs
are numerous and include patient-related, illness-related and system related factors (Kelly,
Chirnside, and Curry 1993). Compounding the pressure that these factors place on ER
admission rates is inadequate access to health care services in the community, which can lead
undertreated health conditions to escalate to critical levels (Bowles, Naylor, and Foust 2002).
Furthermore, statistics show that many ER presentations are non-urgent and often do not
require specific hospital treatment (Australian Bureau of Statistics 2014; Law and Yip 2002);
(Lee et al. 2000). This implies that individuals with non-urgent health matters substitute
inaccessible health care services for ER services (Callen, Blundell, and Prgomet 2008; Kravet
et al. 2008). Consequently it is likely that the under provision of health care services in the
community is leading to an excessive and suboptimal burden on ER systems.
The main objective of this study is to estimate the influence of an individual’s ability to
access healthcare services on ER presentation rates. Obtaining a detailed understanding of the
determinants of ER admissions is desirable as it allows policy makers to better tailor the
provision of limited healthcare services. This would allow for improved access for at-risk
individuals, and would have the effect of reducing instances where easily treatable health
conditions deteriorated into medical emergencies. As medical emergencies represent a poor
outcome for the individual (and are costly for governments to finance) better targeting of
healthcare services has the capacity to both improve public health and save on health related
expenditure.
In order for this type of analysis to be effective it is necessary to determine what types of
healthcare shortfalls best predict ER admission rates, and to identify the types of individuals
who are most at risk. For example some persons may lack the ability to obtain specific
medical services such as that provided by GPs (or by the non-emergency departments of
hospitals) while others may not receive appropriate community care for ongoing conditions.
Establishing which forms of shortfall are most important and how these effects can vary by
disabling condition provides information on how best to allocate funding for healthcare
services. If either a distinct group of patients or a type of health service can be identified then
specific intervention strategies can be directed towards modifiable factors that reduce ER
rates. This will create opportunities to develop cost effective strategies that reduce waiting
times and improve health outcomes.
A second focus of the paper involves studying some unexpected results we uncover that are
specific to persons experiencing inadequate community care. While all other forms of
healthcare shortfall predict increases in ER visits, we do not find significant associations
between these variables for individuals with mental health issues as their primary disabling
condition. Such a finding is counterintuitive as persons with mental conditions are more likely
than the general population to experience “acopia” (i.e. self-neglect due to excessive
2
psychosocial stress) which could plausibly (i) result in ER visits, and (ii) be mitigated by
suitable access to community care. A number of plausible explanations for this lack of
empirical association exist, each of which has important and differing implications for the
distribution of resources for people with mental health conditions.
The rest of the paper is structured as follows. Section 2 provides some background
information and reviews the literature on shortfalls in healthcare services and on the
determinants of ER visits in developed countries. Section 3 introduces our data set, describes
our analytical approach and presents the results. Section 4 interprets the findings and Section
5 concludes.
2. Background
There is an extensive body of literature that studies the determinants of ER admissions in
developed countries, and presentations have generally been attributed to a combination of
factors. Padgett (Padgett and Brodsky, 1992) proposes that use of the ER is the consequence
of predisposing (e.g. age, sex, ethnicity, education, psychosocial resources and attitudes about
health care), enabling (e.g. insurance coverage and income), and need factors (e.g. measures
of health status and evaluations of need for health care, socioeconomic stress, psychiatric co-
morbidities, lack of social support).
A major modifiable factor linked to the use of ER services is the absence of primary care.
Research into inadequate service access is frequently motivated by the notion that it forms a
proxy measure for the quality of community health care programmes and programme efficacy
(Hadley et al. 1990; Haywood et al. 1995). The greatest amount of attention by researchers
regarding the link between ER use and service availability relates to GP services (Klijakovic,
Allan, and Reinker 1981; Kravet et al. 2008; Mechanic 1979; Reder et al. 2009; Wright and
Ricketts 2010). Studies show that the high level of utilization of ER services reflect problems
relating to GP services including accessibility, affordability and inability to provide
appropriate diagnosis (Lee et al., 2000, Callen et al., 2008, Liaw et al., 2001). Ingram (Ingram
et al., 1978) shows that the actual or perceived unavailability of the physician is an important
factor in the use of hospital emergency facilities. Patients with non-urgent complaints
generally reside within close proximity of the hospital providing evidence that the emergency
facilities may act as an “off-hours” physician surrogate (Ingram et al., 1978). Studies by
Kravet et al (Kravet et al., 2008) and Wright et al (Wright and Ricketts, 2010) find a higher
primary care physician ratio in an area associated with a statistically significant decrease in
ER visits.
An integral component of primary health care is the home and community care program that
aim to provide a comprehensive, coordinated and integrated range of basic maintenance and
support services to assist people to live independently at home. Although community care is
central to an integrated health care system (Australian Council on Healthcare Standards,
2010; Goddard et al., 2000) these programs remain under researched in ER investigations.
3
This is primarily due to limited information that has encouraged researchers to focus on GP
services (Klijakovic et al., 1981; Kravet et al., 2008; Mechanic, 1979; Reder et al., 2009;
Wright and Ricketts, 2010).
Appropriate access to healthcare services are an integral part of Western health care systems.
Given the increasing integration of health care programs, an investigation of ER use that
explores a range of health care services (rather than GP services alone) is warranted. There
are numerous ways to categorize the forms that these may take, and for simplicity in this
study we stratify by community care services such home nursing and allied health support or
personal assistance, and external expert medical services such as those provided by GPs or by
the non-emergency facilities at hospitals. Furthermore, investigations consistently report the
inaccessibility of health care services among people experiencing mental health conditions
(2013; Holmes 2014; Vecchio, Stevens, and Cybinski 2008). This difference in access to
health care resources can play an influential role in ER presentations. Yet studies typically do
not control for major categories of health conditions (see Tang et al., 2014).
3. Methods and Results
Data
Data for our study come from the 2012 wave of the Survey of Disability, Aging and Carers
(Australian Bureau of Statistics 2012). This is a large, nationally representative micro-data set
compiled by the Australian Bureau of Statistics that records observations on a wide variety of
questions related to various aspects of health and social behaviour. Despite the size of the
survey (there are almost around 80,000 individuals surveyed and several thousand questions
asked in the latest edition) it has not been widely used in applied work. Due to data
limitations relating to service delivery, the sample was confined to main recipients of care
aged 20 years and over, residing in the community.
Our main variable of interest is a dummy variable indicating whether or not an individual has
visited a hospital for emergency treatment in the previous 12 months. This variable includes
both self-visits and those initiated by healthcare providers, such as visits via the ambulance
service. Although it is possible to construct count data on the number of ER visits, since the
data is mostly characterized by zeros and ones (i.e. most people have either no visits or only
one) we simplify by only recording the presence of one or more ER visits.
In order to contrast the effects on ER visits of different types of healthcare shortfalls, we take
a basket of four indicators that capture alternative facets of exposure – organised services that
assist with daily activities, organised services that assist with health conditions, GP services
and hospital services. Organised services that assist with health conditions perform tasks such
as: foot care, taking medication, administering injections, dressing wounds, using medical
machinery, manipulating muscles or limbs. Organised services that assist with daily activities
perform one or more of the following tasks: cognition or emotion, communication, health
care, housework, meal preparation, mobility, paperwork, property maintenance, self-care,
transport. These organised services are performed in the community, primarily in the home.
4
An individual experiences a shortfall if they report a perceived need for access to more of a
particular type of service. Our variables all take the form of dummies and inadequacy is
defined by the individual relative to their perceived need. Each is therefore reliant upon self-
assessments and the usual caveats about subjective measurements in health therefore apply.
We argue however that since there are both objective and subjective barriers that can limit
healthcare access, self-assessments make the most appropriate method for summarising
accessibility.
In addition we take a large number of control variables that can account for extraneous factors
that can explain differences in ER visits. The choice of variables are based on a widely used
behavioural model of health services utilization developed by Andersen and Newman
(Andersen and Newman 1973) and refined by Padgett to apply specifically to the use of the
ER (Padgett and Brodsky 1992). These variables include age, gender, income, education level
and marital status of the individual, location, measures of population density and dummies
that can account for the presence and severity of a medical condition. Lastly as we wish to
differentiate between the effects of these shortfalls on mental and physical conditions we also
take observations on the form of the main disabling condition of an individual. Missing and
non-conforming data are dropped which leaves us with a final sample of approximately
12,000 individual observations.
Methods
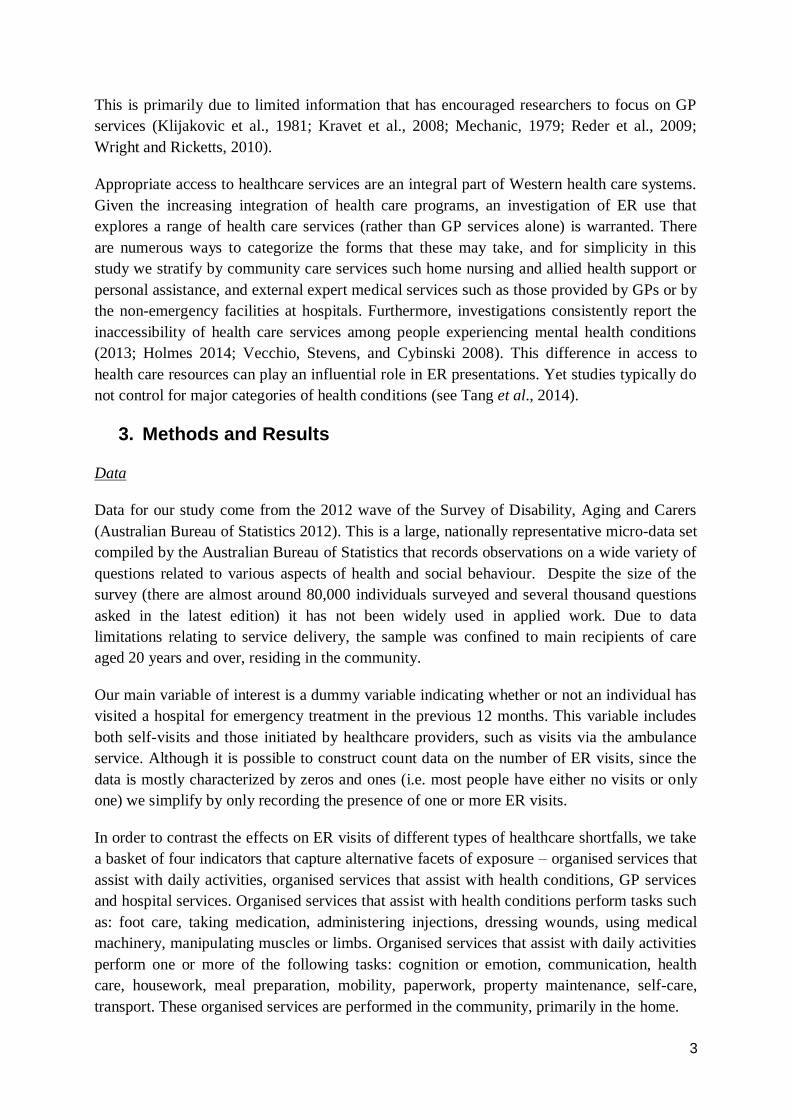
To analyse the effects of healthcare shortfalls on ER visits we begin with a simple description
of the data. Table 1 gives the visit rates (calculated as average proportion of people who visit
the ER per year) for persons who did and did not receive adequate healthcare services, and the
results are stratified by condition. The first row of Table 1 gives baseline rates for individuals
who have no need for care or experience adequate healthcare. These persons experienced
suitable care within the community and had ER visit rates of about 21% to 23% per year. For
individuals with a health condition that is inadequately addressed the rates are much higher
(33%). The first two columns under ‘Help with Activities’ show the visit rates for persons
lacking sufficient community care are about 10% higher than the baseline group, with slightly
greater estimates when the shortfall in care is for an individual with a physical condition
compared to a mental condition. For individuals with limited access to medical services the
admission rates increase more. Specifically, persons lacking adequate access to a GP have
rates 11-14% higher than this baseline while persons unable to obtain adequate access to
hospital services had more than double the raw probability of admission of the baseline group.
5
Table 1. Raw Differences in Emergency Room Rates by Healthcare Services -
Population Subgroups
Help With Activities Help with Health
conditions
–GP services –Hospital services
PH MH PH MH PH MH PH MH
Adequate 0.209 0.226 0.216 0.229 0.213 0.226 0.223 0.229
Inadequate 0.328 0.331 0.339 0.326 0.327 0.366 0.547 0.508
Difference 0.119*** 0.105*** 0.123*** 0.097*** 0.114*** 0.140*** 0.324*** 0.279***
Note: Each column gives the ER visit rates for individuals with and without adequate healthcare. Hypothesis tests on
differences are conducted with t-statistics and robust standard errors. *, ** and *** denote 10%, 5% and 1% significance
respectively. PH and MH denote shortfalls in health care services for persons with physical and mental conditions.
Despite their clarity, the absolute differences in visit rates given above cannot be interpreted
as the causal effect of shortfalls in healthcare services as individuals who are exposed to these
shortfalls may differ systematically from those who are not. Indeed it is plausible that persons
who miss out on adequate health services may have different propensities to require
emergency care than those whose care is adequate, aside from the direct effect generated by
the gap in medical attention. For this reason there is a need to control for the presence of
potentially confounding factors that may explain ER visits. We employ two alternative
methods for controlling for these factors. The first are regression models which are attractive
in their simplicity, and are convenient in that they highlight the relationships between all the
covariates and the dependent variable. The second set of methods use Propensity Score
Matching (PSM) techniques to try to identify the causal effects of our variables of interest.
We consider the regression models first. Let 𝑦 denote an indicator variable that is equal to one
if an individual makes an emergency visit within a 12 month period, and let 𝐷 denote a
dummy that identifies individuals who experienced a shortfall in access to healthcare. A
simple method for estimating the effect of 𝐷 on 𝑦 while controlling for covariate matrix 𝑋 is
to estimate the linear probability model
𝑦 = 𝑋𝛽 + 𝛿𝐷 + 휀
where 𝛿 measures the difference in average rates of admission attributable to 𝐷 . This
specification is appropriate for estimating 𝛿 (although not for prediction) and we prefer it to
other models such as logits or probits as the linear specification estimates the effect of each
shortfall as a constant averaged over the sample, which eases interpretation considerably. If a
non-linear binary choice model was used we would have to calculate the effect as experienced
by a representative individual rather than the full sample. Estimated parameter values are
given in Table 2, while inference is performed with White (White 1980) heteroskedastic
standard errors.
6
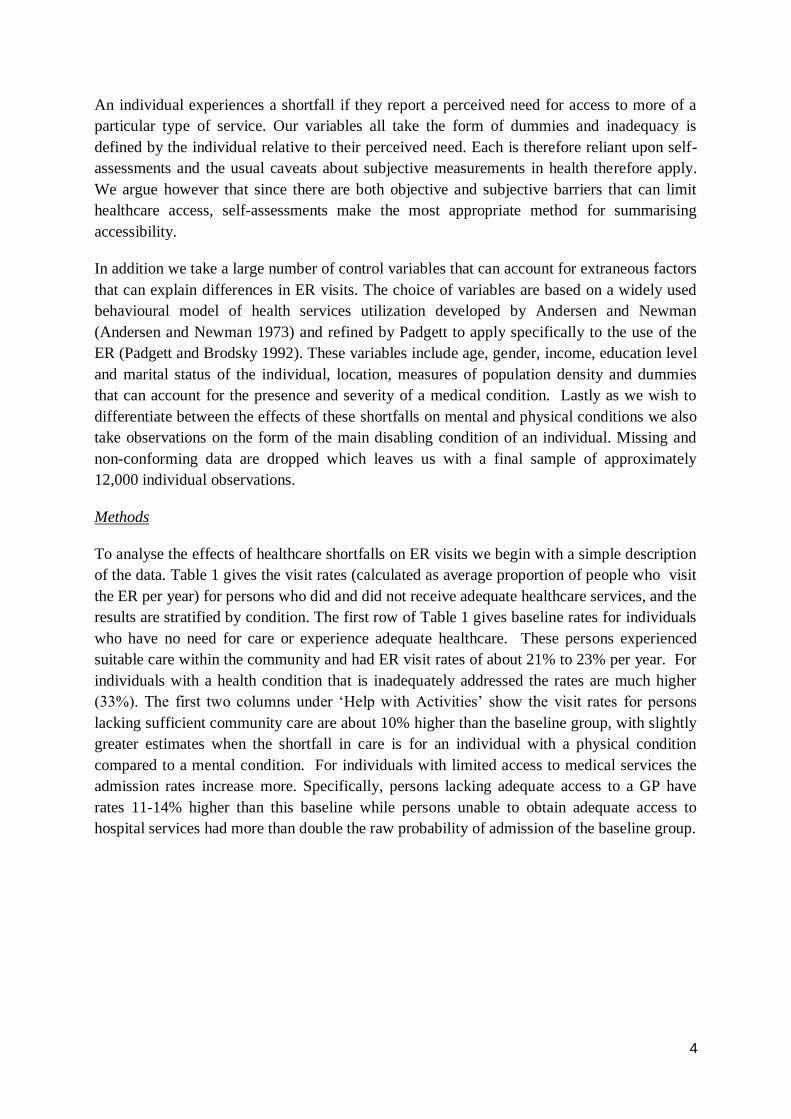
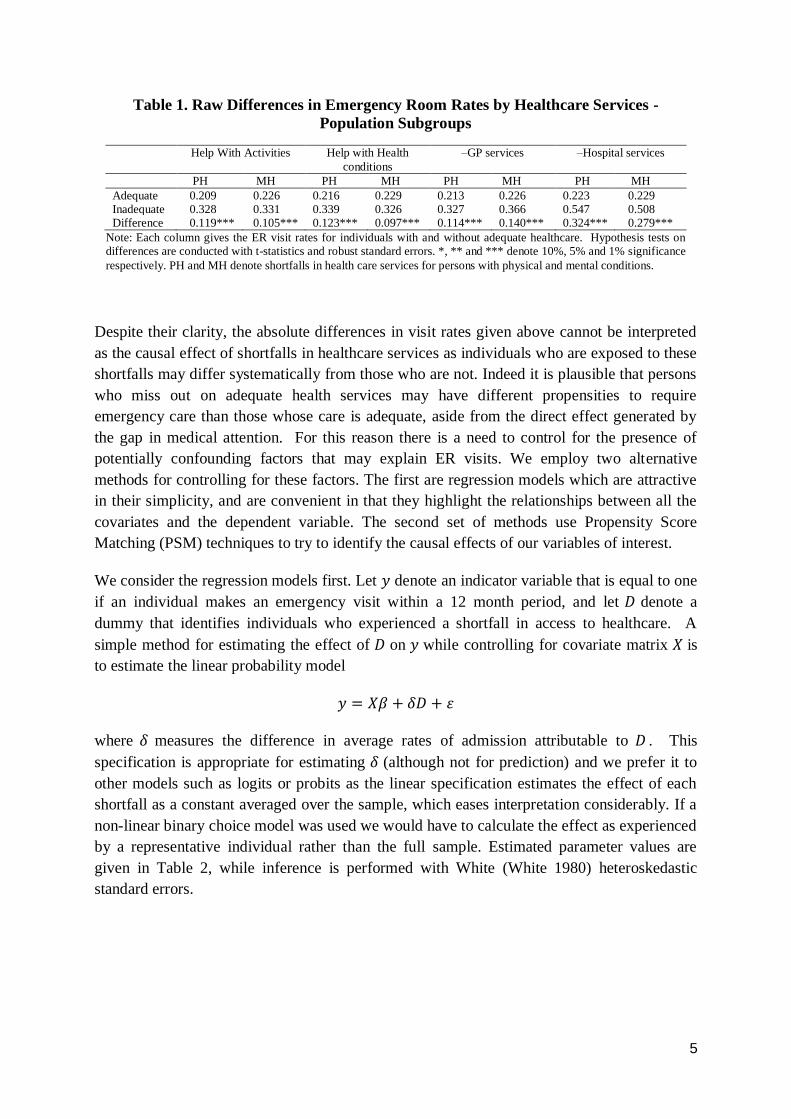
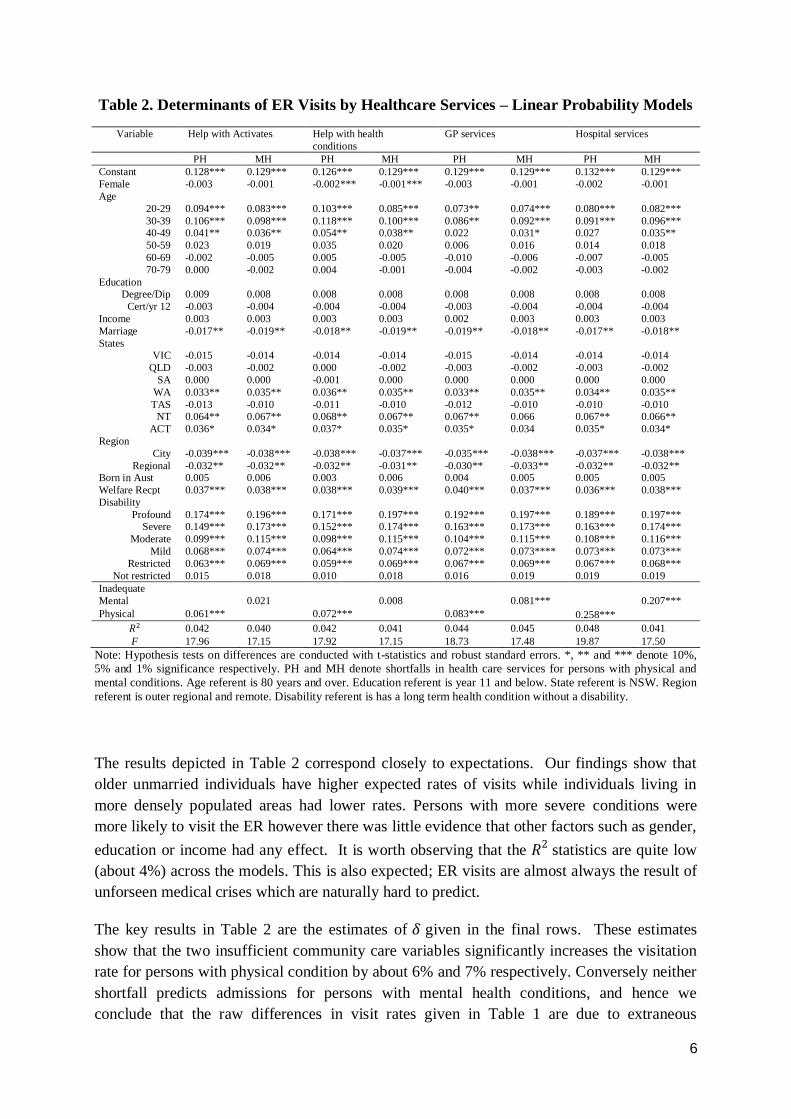
Table 2. Determinants of ER Visits by Healthcare Services – Linear Probability Models
Variable Help with Activates Help with health
conditions
GP services Hospital services
PH MH PH MH PH MH PH MH
Constant 0.128*** 0.129*** 0.126*** 0.129*** 0.129*** 0.129*** 0.132*** 0.129***
Female -0.003 -0.001 -0.002*** -0.001*** -0.003 -0.001 -0.002 -0.001
Age
20-29 0.094*** 0.083*** 0.103*** 0.085*** 0.073** 0.074*** 0.080*** 0.082***
30-39 0.106*** 0.098*** 0.118*** 0.100*** 0.086** 0.092*** 0.091*** 0.096*** 40-49 0.041** 0.036** 0.054** 0.038** 0.022 0.031* 0.027 0.035**
50-59 0.023 0.019 0.035 0.020 0.006 0.016 0.014 0.018
60-69 -0.002 -0.005 0.005 -0.005 -0.010 -0.006 -0.007 -0.005
70-79 0.000 -0.002 0.004 -0.001 -0.004 -0.002 -0.003 -0.002
Education Degree/Dip 0.009 0.008 0.008 0.008 0.008 0.008 0.008 0.008
Cert/yr 12 -0.003 -0.004 -0.004 -0.004 -0.003 -0.004 -0.004 -0.004
Income 0.003 0.003 0.003 0.003 0.002 0.003 0.003 0.003
Marriage -0.017** -0.019** -0.018** -0.019** -0.019** -0.018** -0.017** -0.018**
States VIC -0.015 -0.014 -0.014 -0.014 -0.015 -0.014 -0.014 -0.014
QLD -0.003 -0.002 0.000 -0.002 -0.003 -0.002 -0.003 -0.002
SA 0.000 0.000 -0.001 0.000 0.000 0.000 0.000 0.000
WA 0.033** 0.035** 0.036** 0.035** 0.033** 0.035** 0.034** 0.035**
TAS -0.013 -0.010 -0.011 -0.010 -0.012 -0.010 -0.010 -0.010 NT 0.064** 0.067** 0.068** 0.067** 0.067** 0.066 0.067** 0.066**
ACT 0.036* 0.034* 0.037* 0.035* 0.035* 0.034 0.035* 0.034*
Region
City -0.039*** -0.038*** -0.038*** -0.037*** -0.035*** -0.038*** -0.037*** -0.038***
Regional -0.032** -0.032** -0.032** -0.031** -0.030** -0.033** -0.032** -0.032** Born in Aust 0.005 0.006 0.003 0.006 0.004 0.005 0.005 0.005
Welfare Recpt 0.037*** 0.038*** 0.038*** 0.039*** 0.040*** 0.037*** 0.036*** 0.038***
Disability
Profound 0.174*** 0.196*** 0.171*** 0.197*** 0.192*** 0.197*** 0.189*** 0.197*** Severe 0.149*** 0.173*** 0.152*** 0.174*** 0.163*** 0.173*** 0.163*** 0.174***
Moderate 0.099*** 0.115*** 0.098*** 0.115*** 0.104*** 0.115*** 0.108*** 0.116***
Mild 0.068*** 0.074*** 0.064*** 0.074*** 0.072*** 0.073**** 0.073*** 0.073***
Restricted 0.063*** 0.069*** 0.059*** 0.069*** 0.067*** 0.069*** 0.067*** 0.068***
Not restricted 0.015 0.018 0.010 0.018 0.016 0.019 0.019 0.019
Inadequate
Mental 0.021 0.008 0.081*** 0.207***
Physical 0.061*** 0.072*** 0.083*** 0.258***
𝑅2 0.042 0.040 0.042 0.041 0.044 0.045 0.048 0.041
F 17.96 17.15 17.92 17.15 18.73 17.48 19.87 17.50
Note: Hypothesis tests on differences are conducted with t-statistics and robust standard errors. *, ** and *** denote 10%,
5% and 1% significance respectively. PH and MH denote shortfalls in health care services for persons with physical and
mental conditions. Age referent is 80 years and over. Education referent is year 11 and below. State referent is NSW. Region
referent is outer regional and remote. Disability referent is has a long term health condition without a disability.
The results depicted in Table 2 correspond closely to expectations. Our findings show that
older unmarried individuals have higher expected rates of visits while individuals living in
more densely populated areas had lower rates. Persons with more severe conditions were
more likely to visit the ER however there was little evidence that other factors such as gender,
education or income had any effect. It is worth observing that the 𝑅2 statistics are quite low
(about 4%) across the models. This is also expected; ER visits are almost always the result of
unforseen medical crises which are naturally hard to predict.
The key results in Table 2 are the estimates of 𝛿 given in the final rows. These estimates
show that the two insufficient community care variables significantly increases the visitation
rate for persons with physical condition by about 6% and 7% respectively. Conversely neither
shortfall predicts admissions for persons with mental health conditions, and hence we
conclude that the raw differences in visit rates given in Table 1 are due to extraneous
7
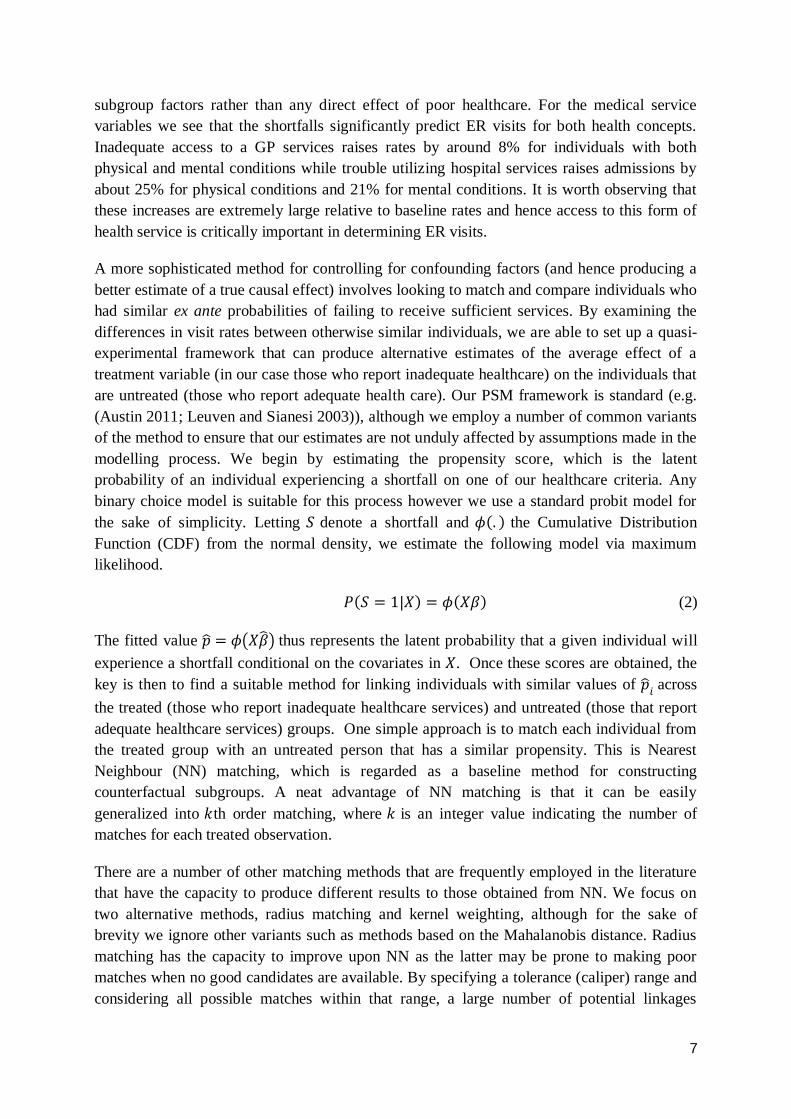
subgroup factors rather than any direct effect of poor healthcare. For the medical service
variables we see that the shortfalls significantly predict ER visits for both health concepts.
Inadequate access to a GP services raises rates by around 8% for individuals with both
physical and mental conditions while trouble utilizing hospital services raises admissions by
about 25% for physical conditions and 21% for mental conditions. It is worth observing that
these increases are extremely large relative to baseline rates and hence access to this form of
health service is critically important in determining ER visits.
A more sophisticated method for controlling for confounding factors (and hence producing a
better estimate of a true causal effect) involves looking to match and compare individuals who
had similar ex ante probabilities of failing to receive sufficient services. By examining the
differences in visit rates between otherwise similar individuals, we are able to set up a quasi-
experimental framework that can produce alternative estimates of the average effect of a
treatment variable (in our case those who report inadequate healthcare) on the individuals that
are untreated (those who report adequate health care). Our PSM framework is standard (e.g.
(Austin 2011; Leuven and Sianesi 2003)), although we employ a number of common variants
of the method to ensure that our estimates are not unduly affected by assumptions made in the
modelling process. We begin by estimating the propensity score, which is the latent
probability of an individual experiencing a shortfall on one of our healthcare criteria. Any
binary choice model is suitable for this process however we use a standard probit model for
the sake of simplicity. Letting 𝑆 denote a shortfall and 𝜙(. ) the Cumulative Distribution
Function (CDF) from the normal density, we estimate the following model via maximum
likelihood.
𝑃(𝑆 = 1|𝑋) = 𝜙(𝑋𝛽) (2)
The fitted value �̂� = 𝜙(𝑋�̂�) thus represents the latent probability that a given individual will
experience a shortfall conditional on the covariates in 𝑋. Once these scores are obtained, the
key is then to find a suitable method for linking individuals with similar values of �̂�𝑖 across
the treated (those who report inadequate healthcare services) and untreated (those that report
adequate healthcare services) groups. One simple approach is to match each individual from
the treated group with an untreated person that has a similar propensity. This is Nearest
Neighbour (NN) matching, which is regarded as a baseline method for constructing
counterfactual subgroups. A neat advantage of NN matching is that it can be easily
generalized into 𝑘th order matching, where 𝑘 is an integer value indicating the number of
matches for each treated observation.
There are a number of other matching methods that are frequently employed in the literature
that have the capacity to produce different results to those obtained from NN. We focus on
two alternative methods, radius matching and kernel weighting, although for the sake of
brevity we ignore other variants such as methods based on the Mahalanobis distance. Radius
matching has the capacity to improve upon NN as the latter may be prone to making poor
matches when no good candidates are available. By specifying a tolerance (caliper) range and
considering all possible matches within that range, a large number of potential linkages
8
become possible while ensuring that poor candidates are not employed. Similarly kernel
weighting allows for multiple matches – each observation is compared to a weighted average
of all possible candidates where the weighting is determined non-parametrically based upon
the similarity of scores.
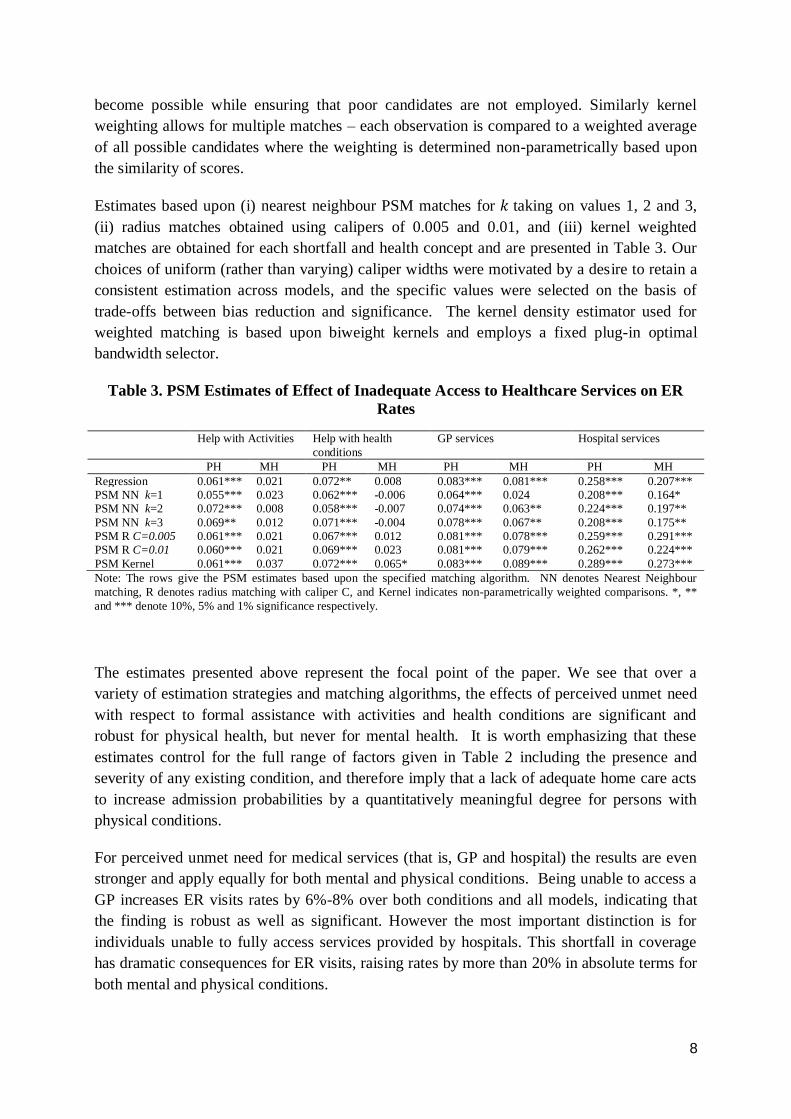
Estimates based upon (i) nearest neighbour PSM matches for 𝑘 taking on values 1, 2 and 3,
(ii) radius matches obtained using calipers of 0.005 and 0.01, and (iii) kernel weighted
matches are obtained for each shortfall and health concept and are presented in Table 3. Our
choices of uniform (rather than varying) caliper widths were motivated by a desire to retain a
consistent estimation across models, and the specific values were selected on the basis of
trade-offs between bias reduction and significance. The kernel density estimator used for
weighted matching is based upon biweight kernels and employs a fixed plug-in optimal
bandwidth selector.
Table 3. PSM Estimates of Effect of Inadequate Access to Healthcare Services on ER
Rates
Help with Activities Help with health
conditions
GP services Hospital services
PH MH PH MH PH MH PH MH
Regression 0.061*** 0.021 0.072** 0.008 0.083*** 0.081*** 0.258*** 0.207***
PSM NN k=1 0.055*** 0.023 0.062*** -0.006 0.064*** 0.024 0.208*** 0.164*
PSM NN k=2 0.072*** 0.008 0.058*** -0.007 0.074*** 0.063** 0.224*** 0.197**
PSM NN k=3 0.069** 0.012 0.071*** -0.004 0.078*** 0.067** 0.208*** 0.175**
PSM R C=0.005 0.061*** 0.021 0.067*** 0.012 0.081*** 0.078*** 0.259*** 0.291***
PSM R C=0.01 0.060*** 0.021 0.069*** 0.023 0.081*** 0.079*** 0.262*** 0.224***
PSM Kernel 0.061*** 0.037 0.072*** 0.065* 0.083*** 0.089*** 0.289*** 0.273***
Note: The rows give the PSM estimates based upon the specified matching algorithm. NN denotes Nearest Neighbour
matching, R denotes radius matching with caliper C, and Kernel indicates non-parametrically weighted comparisons. *, **
and *** denote 10%, 5% and 1% significance respectively.
The estimates presented above represent the focal point of the paper. We see that over a
variety of estimation strategies and matching algorithms, the effects of perceived unmet need
with respect to formal assistance with activities and health conditions are significant and
robust for physical health, but never for mental health. It is worth emphasizing that these
estimates control for the full range of factors given in Table 2 including the presence and
severity of any existing condition, and therefore imply that a lack of adequate home care acts
to increase admission probabilities by a quantitatively meaningful degree for persons with
physical conditions.
For perceived unmet need for medical services (that is, GP and hospital) the results are even
stronger and apply equally for both mental and physical conditions. Being unable to access a
GP increases ER visits rates by 6%-8% over both conditions and all models, indicating that
the finding is robust as well as significant. However the most important distinction is for
individuals unable to fully access services provided by hospitals. This shortfall in coverage
has dramatic consequences for ER visits, raising rates by more than 20% in absolute terms for
both mental and physical conditions.
9
Diagnostics
There are a number of assumptions that underlie PSM estimators which must be satisfied for
our results from Table 3 to be valid. In this section we conduct some diagnostic tests to
examine the performance of our models. The first issue we consider is the support structure
of the propensity scores for the treated and untreated subgroups. A crucial requirement
underpinning PSM estimation is that there must be sufficient overlap in the scores such that
observations in one group can be appropriately matched to an equivalent observation in the
other. If (for example) there are observations in the treated group that have propensity scores
that greatly exceed the range of scores in the untreated group then the quality of the matching
process will be adversely affected.
A standard tool for analysing the respective support structures of the propensity scores comes
from non-parametric distributional plots. In Figures 1 and 2 we illustrate the distributions of
the scores for each healthcare concept using histograms, where the distributions for treated
individuals are depicted with positive bars in light grey, while untreated individuals are
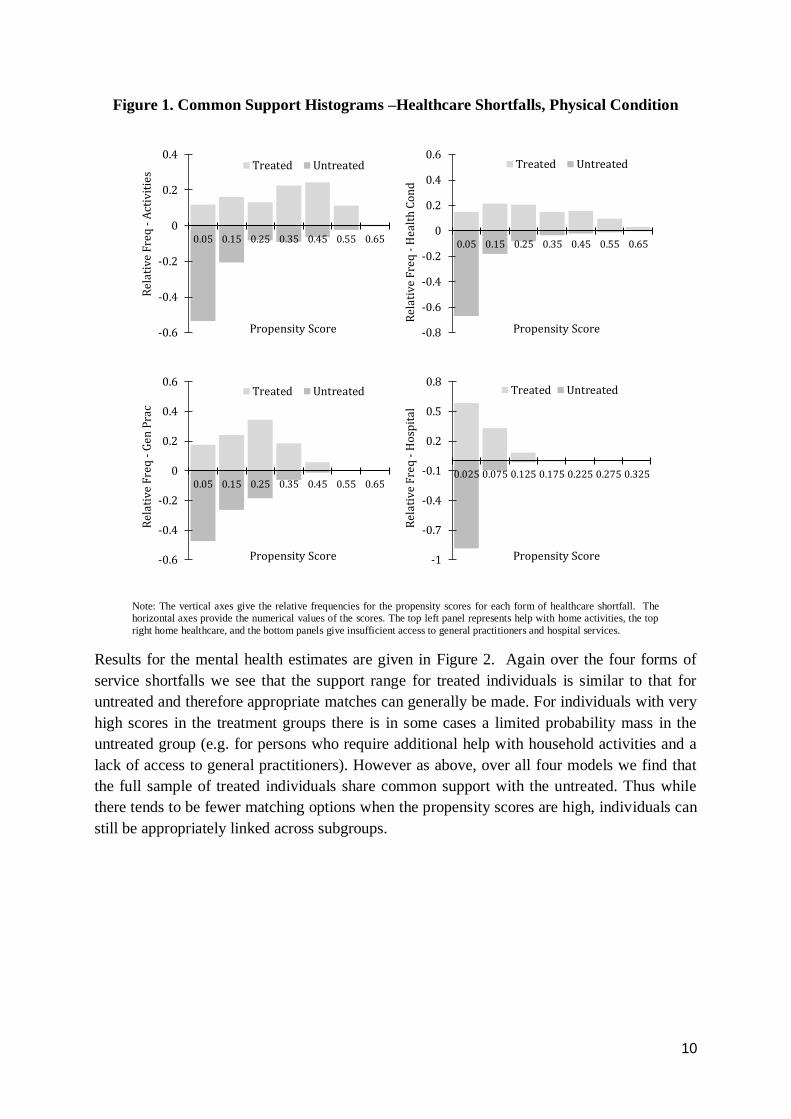
shown with negative bars in dark grey. Figure 1 shows that for physical health, over all four
shortfall measures, the support of the treated individuals generally corresponds closely with
the support of the untreated. This implies that for each individual in the treated group, there is
a corresponding person in the untreated group such that suitable matches are available.
Indeed the only instances where there are shortages of matches for treated individuals are for
shortfalls in community care for health conditions for individuals with high propensity scores
(over 0.5) and a lack of access to hospital services (propensities around 0.125). However it
should be noted that our treated subsamples represent only from 1-10% of the full sample,
and therefore there are many potential matches available for any treated observation. In all
instances the full 100% of scores for treated observations had support on the distribution of
values for the untreated.
10
Figure 1. Common Support Histograms –Healthcare Shortfalls, Physical Condition
Note: The vertical axes give the relative frequencies for the propensity scores for each form of healthcare shortfall. The horizontal axes provide the numerical values of the scores. The top left panel represents help with home activities, the top
right home healthcare, and the bottom panels give insufficient access to general practitioners and hospital services.
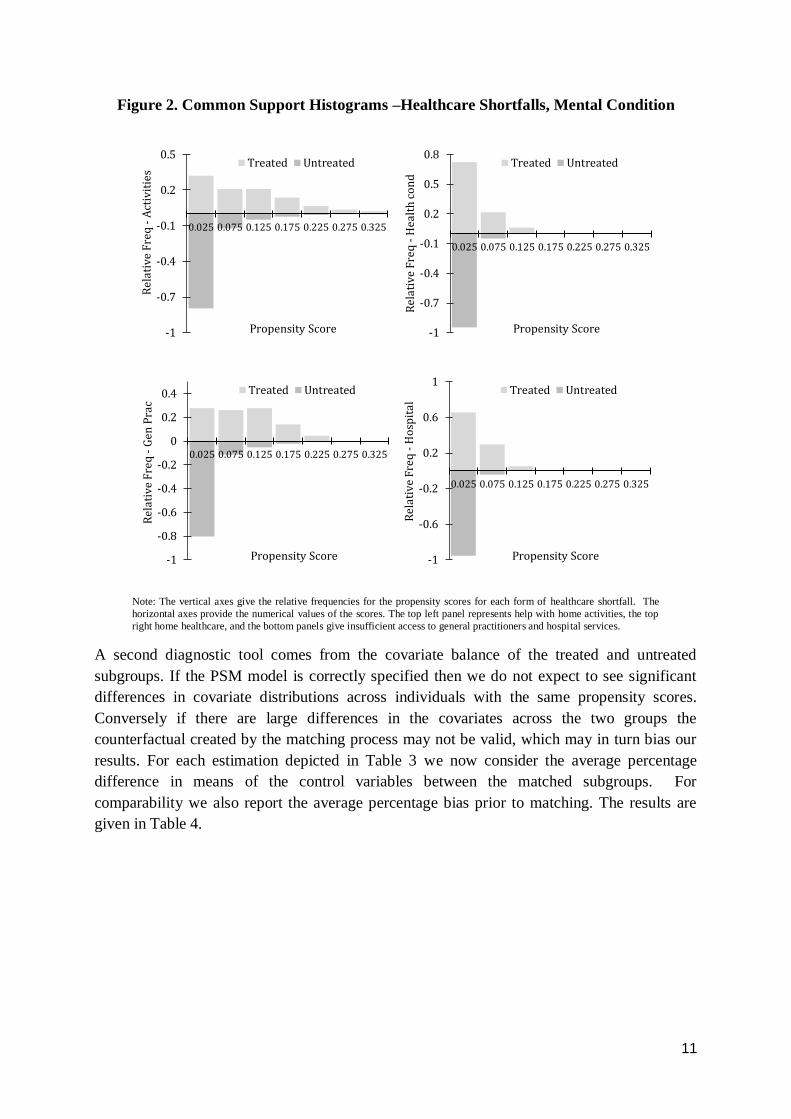
Results for the mental health estimates are given in Figure 2. Again over the four forms of
service shortfalls we see that the support range for treated individuals is similar to that for
untreated and therefore appropriate matches can generally be made. For individuals with very
high scores in the treatment groups there is in some cases a limited probability mass in the
untreated group (e.g. for persons who require additional help with household activities and a
lack of access to general practitioners). However as above, over all four models we find that
the full sample of treated individuals share common support with the untreated. Thus while
there tends to be fewer matching options when the propensity scores are high, individuals can
still be appropriately linked across subgroups.
-0.6
-0.4
-0.2
0
0.2
0.4
0.05 0.15 0.25 0.35 0.45 0.55 0.65
Rel
ativ
e F
req
-A
ctiv
itie
s
Propensity Score
Treated Untreated
-0.8
-0.6
-0.4
-0.2
0
0.2
0.4
0.6
0.05 0.15 0.25 0.35 0.45 0.55 0.65
Rel
ativ
e F
req
-H
ealt
h C
on
d
Propensity Score
Treated Untreated
-0.6
-0.4
-0.2
0
0.2
0.4
0.6
0.05 0.15 0.25 0.35 0.45 0.55 0.65
Rel
ativ
e F
req
-G
en P
rac
Propensity Score
Treated Untreated
-1
-0.7
-0.4
-0.1
0.2
0.5
0.8
0.025 0.075 0.125 0.175 0.225 0.275 0.325
Rel
ativ
e F
req
-H
osp
ital
Propensity Score
Treated Untreated
11
Figure 2. Common Support Histograms –Healthcare Shortfalls, Mental Condition
Note: The vertical axes give the relative frequencies for the propensity scores for each form of healthcare shortfall. The
horizontal axes provide the numerical values of the scores. The top left panel represents help with home activities, the top
right home healthcare, and the bottom panels give insufficient access to general practitioners and hospital services.
A second diagnostic tool comes from the covariate balance of the treated and untreated
subgroups. If the PSM model is correctly specified then we do not expect to see significant
differences in covariate distributions across individuals with the same propensity scores.
Conversely if there are large differences in the covariates across the two groups the
counterfactual created by the matching process may not be valid, which may in turn bias our
results. For each estimation depicted in Table 3 we now consider the average percentage
difference in means of the control variables between the matched subgroups. For
comparability we also report the average percentage bias prior to matching. The results are
given in Table 4.
-1
-0.7
-0.4
-0.1
0.2
0.5
0.025 0.075 0.125 0.175 0.225 0.275 0.325
Rel
ativ
e F
req
-A
ctiv
itie
s
Propensity Score
Treated Untreated
-1
-0.7
-0.4
-0.1
0.2
0.5
0.8
0.025 0.075 0.125 0.175 0.225 0.275 0.325
Rel
ativ
e F
req
-H
ealt
h c
on
d
Propensity Score
Treated Untreated
-1
-0.8
-0.6
-0.4
-0.2
0
0.2
0.4
0.025 0.075 0.125 0.175 0.225 0.275 0.325
Rel
ativ
e F
req
-G
en P
rac
Propensity Score
Treated Untreated
-1
-0.6
-0.2
0.2
0.6
1
0.025 0.075 0.125 0.175 0.225 0.275 0.325
Rel
ativ
e F
req
-H
osp
ital
Propensity Score
Treated Untreated
12
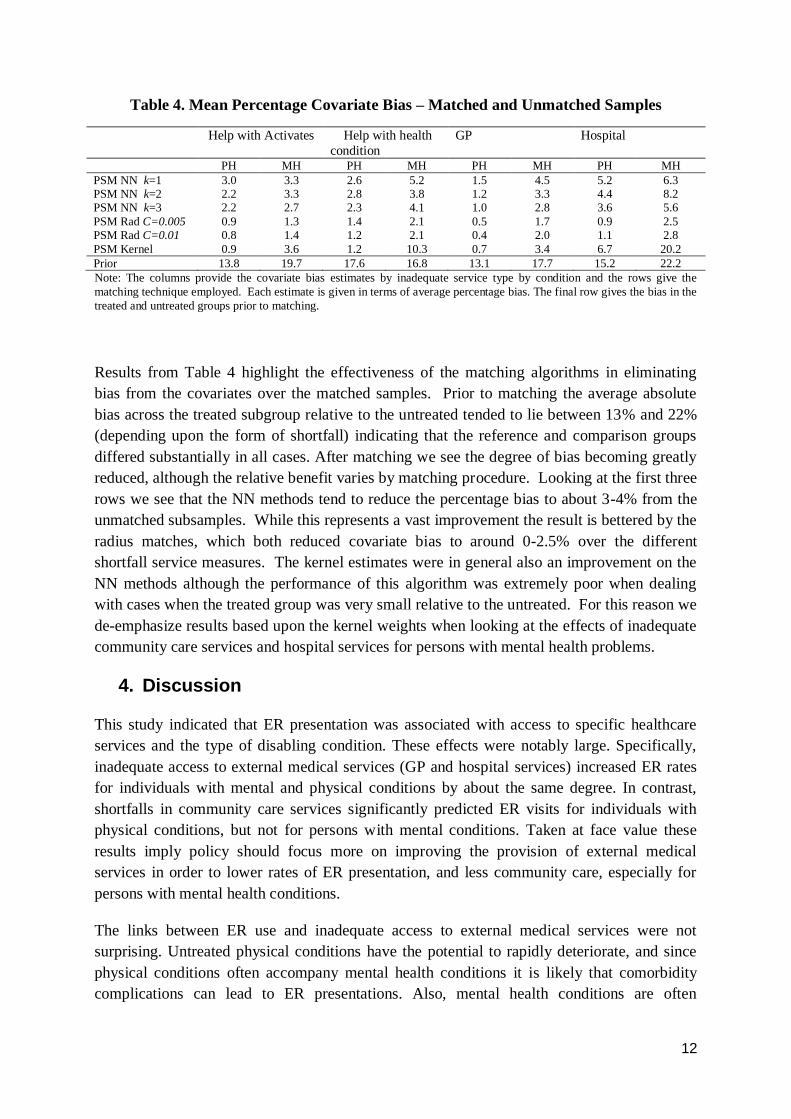
Table 4. Mean Percentage Covariate Bias – Matched and Unmatched Samples
Help with Activates Help with health
condition
GP Hospital
PH MH PH MH PH MH PH MH
PSM NN k=1 3.0 3.3 2.6 5.2 1.5 4.5 5.2 6.3
PSM NN k=2 2.2 3.3 2.8 3.8 1.2 3.3 4.4 8.2
PSM NN k=3 2.2 2.7 2.3 4.1 1.0 2.8 3.6 5.6
PSM Rad C=0.005 0.9 1.3 1.4 2.1 0.5 1.7 0.9 2.5
PSM Rad C=0.01 0.8 1.4 1.2 2.1 0.4 2.0 1.1 2.8
PSM Kernel 0.9 3.6 1.2 10.3 0.7 3.4 6.7 20.2
Prior 13.8 19.7 17.6 16.8 13.1 17.7 15.2 22.2
Note: The columns provide the covariate bias estimates by inadequate service type by condition and the rows give the
matching technique employed. Each estimate is given in terms of average percentage bias. The final row gives the bias in the
treated and untreated groups prior to matching.
Results from Table 4 highlight the effectiveness of the matching algorithms in eliminating
bias from the covariates over the matched samples. Prior to matching the average absolute
bias across the treated subgroup relative to the untreated tended to lie between 13% and 22%
(depending upon the form of shortfall) indicating that the reference and comparison groups
differed substantially in all cases. After matching we see the degree of bias becoming greatly
reduced, although the relative benefit varies by matching procedure. Looking at the first three
rows we see that the NN methods tend to reduce the percentage bias to about 3-4% from the
unmatched subsamples. While this represents a vast improvement the result is bettered by the
radius matches, which both reduced covariate bias to around 0-2.5% over the different
shortfall service measures. The kernel estimates were in general also an improvement on the
NN methods although the performance of this algorithm was extremely poor when dealing
with cases when the treated group was very small relative to the untreated. For this reason we
de-emphasize results based upon the kernel weights when looking at the effects of inadequate
community care services and hospital services for persons with mental health problems.
4. Discussion
This study indicated that ER presentation was associated with access to specific healthcare
services and the type of disabling condition. These effects were notably large. Specifically,
inadequate access to external medical services (GP and hospital services) increased ER rates
for individuals with mental and physical conditions by about the same degree. In contrast,
shortfalls in community care services significantly predicted ER visits for individuals with
physical conditions, but not for persons with mental conditions. Taken at face value these
results imply policy should focus more on improving the provision of external medical
services in order to lower rates of ER presentation, and less community care, especially for
persons with mental health conditions.
The links between ER use and inadequate access to external medical services were not
surprising. Untreated physical conditions have the potential to rapidly deteriorate, and since
physical conditions often accompany mental health conditions it is likely that comorbidity
complications can lead to ER presentations. Also, mental health conditions are often
13
associated with physical conditions related to neglect as dehydration, incorrect medication
dosages or urinary tract infections which may result in a need for urgent medical attention.
The links between ER use and our community care variables are considerably less strong.
Evidence shows that adequate and appropriate community care services by formal providers
reduces institutionalisation rates among frail and disabled individuals (Bowles et al. 2002;
Productivity Commission 2008). This supports our own findings which showed shortfalls in
community care services significantly predicted ER visits for physical conditions, however
the lack of a similar link for individuals with mental conditions was surprising. We offer
several possible explanations for this finding.
Firstly, not all hospitals, including those in metropolitan areas, include a mental health unit.
This means that people with a mental health condition are unlikely to visit the ER unless they
possess a physical condition that needs urgent attention. Secondly, among individuals
experiencing a mental health condition, there may be socio-demographic differences between
those who receive medical services and those who receive community care services. Indeed,
the vast majority of individuals receiving community care services consist of older cohorts,
i.e. those aged 65 and over. There is a greater incidence of dementia or Alzheimer condition
among older clients. Typically they require assistance with daily activities. In contrast,
functioning individuals with non-age related mental health conditions such as schizophrenia,
bipolar and depression are more likely to seek medical assistance to manage their condition.
The sporadic episodes of these non-aged related mental health conditions can cause
functioning adults to seek ER services.
Thirdly the decision to seek ER requires higher order thinking. The physical motivation to
seek help may be lacking among those with a mental illness. For this reason, there is the
possibility of people with a mental health condition not accessing the community services
until they reach a crisis situation. For instance, when an individual is a danger to themselves
or others, entry to ER will only occur via third party intervention. In contrast, those receiving
assistance from GP or hospital services are likely to possess the cognitive ability to seek out a
clinician for assistance (or have family support). Inadequately treated mental health
conditions might be less ‘able’ to show up in ER, which could offset the increased risk of
accident or emergency.
5. Conclusion
The evidence we have regarding the shortfalls in medical and community care services and
the type of condition that predict ER use shows that greater attention needs to be given to
providing more flexible and appropriate access to health care services in the community
setting. While it is well established that adequate medical care provided by GPs plays an
important role in reducing ER visits, the link between ER visits and community care is poorly
understood. This is surprising given the growing importance of community care as an integral
part of the health sector of many western nations. Furthermore, the global trend towards
deinstitutionalisation of mental health services warrants attention by researchers. Our study
narrowed the knowledge gap in this area of research.
14
Among those experiencing a mental health condition, the high association of ER rates with
inadequate medical services, combined with a lack of a similar association with inadequate
community services is alarming. The explanation we find most plausible for this finding is
that unless an individual is in physical rather than mental distress, crisis ER treatment is less
often sought or unavailable, in which case more effort should be made to extend community
care services to these individuals.
References
2013. “Survey Finds Shortfalls in the Quality of Mental Health Care for Older Americans.
Psychiatric Services.” Psychiatric Services 64(2).
Andersen, R. and J. Newman. 1973. “Societal and individual determinants of medical care
utilization in the United States. .” The Milbank Quarterly 51: 95-124.
Austin, P. C. 2011. “An Introduction to Propensity Score Methods for Reducing the Effects of
Confounding in Observational Studies ” Multivariate Behavioral Research 46(3): 399-424.
Australian Bureau of Statistics. 2012. “Disability Ageing and Carers 2012 Basic.” Australian
Bureau of Statistics. Canberra.
Australian Bureau of Statistics. 2014. “4839.0 - Patient Experiences in Australia: Summary of
Findings, 2013-14.” Australian Bureau of Statistics,.
Bowles, K., M. Naylor, and J. Foust. 2002. “Patient characteristics at hospital discharge and a
comparision of home care referral decisions ” J Am Geriatric Society 50(2): 336-42.
Callen, J. L., L. Blundell, and M. Prgomet. 2008. “Emergency department use in a rural
Australian setting: are the factors prompting attendance appropriate? .” Aust Health Rev
32(4): 710-19.
Holmes, D. 2014. “New initiative aims to tackle shortfalls in mental health crisis care.” The
Lancet Psychiatry 1(1): 15-16.
Kelly, A., A. Chirnside, and C. Curry. 1993. “An analysis of unscheduled return visits to an
urban emergency department.” New Zealand medical Journal 106: 334-35.
Klijakovic, M., B. C. Allan, and J. Reinker. 1981. “Why skip the General Practice and go to
the Accident and Emergency Department? .” NZ Medical Journal 93: 49-52.
Kravet, S. J., A. D. Shore, R. Miller, G. B. Green, K. Kolodner, and S. M. Wright. 2008.
“Health care utilization and the proportion of primary care physician.” The American Journal
of Medicine 121(2): 142-48.
15
Law, C. and P. Yip. 2002. “Acute care service utilization and the possible impacts of a user-
free policy in Hong Kong.” Hong Kong Medical Journal 8: 348-53.
Lee, A., F. Lau, H. Clarke, K. C., P. Wong, T. Wong, and S. Chow. 2000. “Factors associated
with non-urgent utilization of Accident and Emergency services: a case-control study in Hong
Kong.” Social Science and Medicine 51: 1075-85.
Leuven, E. and B. Sianesi. 2003. “PSMATCH2: Stata module to perform full Mahalanobis
and propensity score matching, common support graphing, and covariate imbalance testing ”.
Lowthian, J., A. Curtis, P. Cameron, J. Stoelwinder, M. Cooke, and J. McNeil. 2011.
“Systematic review of trends in emergency department attendances: an Australian
perspective.” Emergency Medicine Journal 28: 373-77.
Mechanic, D. 1979. “Correlates of physician utilization ” J. Hlth Soc. Behav. 20: 387.
Padgett, D. and B. Brodsky. 1992. “Psychosocial factors influencing non-urgent use of the
emergency room: A review of the literature and recommendations for research and improved
service delivery ” Social Science and Medicine 35(9): 1189-97.
Productivity Commission. 2008. “Trends in Aged Care Services: some implications
Commission Research Paper ”. Productivity Commission. Canberra
Reder, S., S. Hedrick, M. Guihan, and S. Miller. 2009. “Barriers to home and community-
based service referrals: The physician's role ” Gerontology and Geriatrics Education 30: 21-
33.
Vecchio, N., S. Stevens, and P. Cybinski. 2008. “Caring for People with a Mental Disability
at Home. Carers’ Perceptions of Service Provision ” Community Mental Health 44(2): 125-
34.
White, H. 1980. “A Heteroskedasticity-Consistent Covariance Matrix Estimator and a Direct
Test for Heteroskedasticity.” Econometrica 48(4): 817-38.
Wright, D. and T. Ricketts. 2010. “The road to efficiency? Re-examining the impact of the
primary care physician workforce on health care utilization rates.” Social Science and
Medicine 70.