Embed Size (px)
Citation preview
THE EFFECT OF SELF-REGULATORY AND METACOGNITIVE STRATEGY
INSTRUCTION ON IMPOVERISHED STUDENTS’ ASSESSMENT ACHIEVEMENT
IN PHYSICS
by
Jaunine Fouché
Liberty University
A Dissertation Presented in Partial Fulfillment
Of the requirements for the Degree
Doctor of Education
Liberty University
April, 2013
THE EFFECT OF METACOGNITIVE AND SELF-REGULATORY STRATEGY
INSTRUCTION ON IMPOVERISHED STUDENTS’ ASSESSMENT ACHIEVEMENT
IN PHYSICS
By Jaunine Fouché
A Dissertation Presented in Partial Fulfillment
Of the Requirements for the Degree
Doctor of Education
Liberty University, Lynchburg, VA
April 2013
APPROVED BY:
Scott B. Watson, Ph.D., Committee Chair
Linda J. Woolard, Ph.D.
Kathleen Blouch, D.Ed.
Scott B. Watson, Associate Dean, Advanced Programs
2
Abstract
The purpose of this nonequivalent control group design study was to evaluate the
effectiveness of metacognitive and self-regulatory strategy use on the assessment
achievement of 215 9th-grade, residential physics students from low socioeconomic status
(low-SES) backgrounds. Students from low-SES backgrounds often lack the self-
regulatory habits and metacognitive strategies to improve academic performance. In an
effort to increase these scores and to increase student self-regulation and metacognition
with regard to achievement in physics, this study investigated the use of metacognitive
and self-regulatory strategies specifically as they apply to students’ use of their own
assessment data. Traditionally, student performance data is used by adults to inform
instructional and curricular decisions. However, students are rarely given or asked to
evaluate their own performance data. Moreover, students are not shown how to use this
data to plan for or inform their own learning. It was found that students in the overall and
algebra-ready treatment groups performed significantly better than their control group
peers. These results are favorable for inclusion of strategies involving self-regulation and
metacognition in secondary physics classrooms. Although these results may be
applicable across residential, impoverished populations, further research is needed with
non-residential populations.
3
DEDICATION
This paper is dedicated, first, to God in whom all things are possible and whose
blessing and mercy are ever-present in my life. This paper is dedicated to my family,
especially my husband and daughter who gave up immeasurable amounts of time with
me while I took classes and worked on assignments, and who offered me never-ending
encouragement when the task felt too overwhelming to accomplish; to my sons who
communicated constant support; and to my extended family who helped pick up the slack
and reminded me that I was not alone in this process. This paper is dedicated to Dr.
Kathy Blouch and Dr. Mike Benner under whose tutelage I have grown as an educator
and a researcher. This paper is dedicated to Dr. Linda Woolard for her time, expertise,
and willingness to help prepare me for the dissertation defense. This paper is dedicated
to Jim Cudworth, mentor and friend. I am grateful for your influence and perspective.
Finally, this paper is dedicated to Dr. Scott Watson, who has led by example in both his
walk with Christ and his steady hand as he guided me through this process. Thank you.
4
Table of Contents
DEDICATION……………………………………………………………………….3
List of Tables………………………………………………………………………….7
List of Figures…………………………………………………………………………8
CHAPTER ONE: INTRODUCTION……………………………..…………………..9
Background………………………………………………………..………………9
Problem Statement……………………………………………………………….11
Purpose Statement………………………………………………………………..11
Significance of the Study………………………………………………………...12
Research Questions and Hypotheses…………………………………………….13
Identification of Variables……………………………………………………….14
Definitions……………………………………………………………………….15
CHAPTER TWO: REVIEW OF THE LITERATURE……………………………...17
Historical Summary……………………………………………………………...21
Theoretical Framework…………………………………………………………..25
Social Cognitive Theory of Self-Regulation…………………………………25
Social Development Theory…………………………………………………29
Relationship of Theories to Study Context…………………………………..32
The Impact of Self-Regulation, Metacognition, and Locus of Control on
Achievement for Students from Backgrounds of Poverty…………………33
Self-Regulation………………………………………………………………33
Self-Regulation in Science Education……………………………………….35
Metacognition………………………………………………………………..40
5
Locus of Control……………………………………………………………..45
Summary…………………………………………………………………………49
CHAPTER THREE: METHODOLOGY……………………………………………51
Problem and Purpose of the Study………………………………………………51
Research Design…………………………………………………………………52
Rationale……………………………………………………………………..52
Design Elements……………………………………………………………..53
End-of-Chapter Exams……………………………………………………….54
Control Groups……………………………………………………………….54
Experimental Groups………………………………………………………...55
Professional Development…………………………………………………...57
Questions and Hypotheses……………………………………………………….58
Participants and Setting………………………………………………………….58
Instrumentation…………………………………………………………………..60
Procedures………………………………………………………………………..62
Data Analysis Procedures………………………………………………………..63
CHAPTER FOUR: RESULTS………………………………………………………65
Descriptive Statistical Analysis………………………………………………….66
Analysis of Covariance Results………………………………………………….68
Null Hypothesis One. ………………………………………………………68
Null Hypothesis Two. ………………………………………………………71
Null Hypothesis Three……………………………………………………….72
Summary…………………………………………………………………………75
6
CHAPTER FIVE: DISCUSSION……………………………………………………76
Summary…………………………………………………………………………76
Discussion………………………………………………………………………..78
Theoretical Framework…………………………………………………………..79
Metacognition………………………………………………………………..79
Self-Regulation………………………………………………………………80
Research Parallels……………………………………………………………82
Study Strategies……………………………………………………………...85
Limitations……………………………………………………………………….88
Implications………………………………………………………………………90
Recommendations for Further Research…………………………………………92
Conclusions………………………………………………………………………93
References……………………………………………………………………………96
APPENDIX A – Pretest/Posttest Instrument……………………………………….106
APPENDIX B – Liberty University IRB Approval………………………………...120
APPENDIX C – Professional Development Documents…………………………..121
APPENDIX D – Student Documents (Samples)…………………………………...126
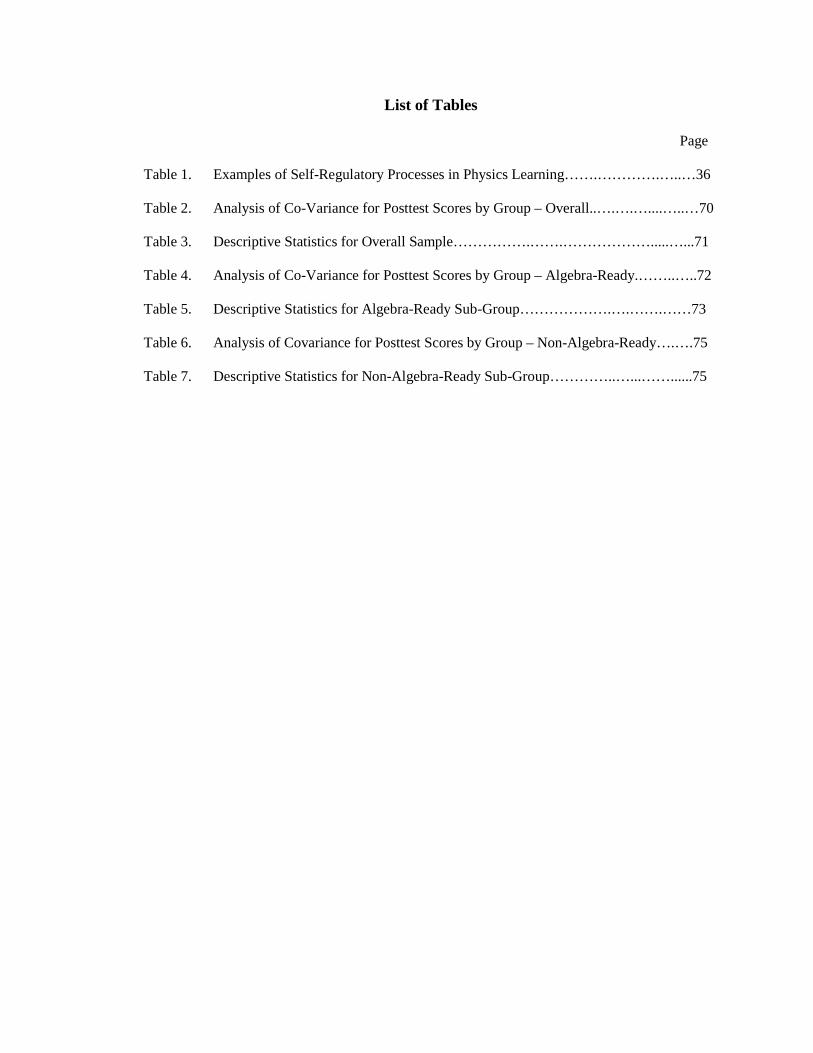
List of Tables
Page
Table 1. Examples of Self-Regulatory Processes in Physics Learning…….………….…..…36
Table 2. Analysis of Co-Variance for Posttest Scores by Group – Overall..….….…....…..…70
Table 3. Descriptive Statistics for Overall Sample…………….…….……………….....…...71
Table 4. Analysis of Co-Variance for Posttest Scores by Group – Algebra-Ready.……..…..72
Table 5. Descriptive Statistics for Algebra-Ready Sub-Group……………….….…….……73
Table 6. Analysis of Covariance for Posttest Scores by Group – Non-Algebra-Ready….….75
Table 7. Descriptive Statistics for Non-Algebra-Ready Sub-Group…………..…...……......75
8
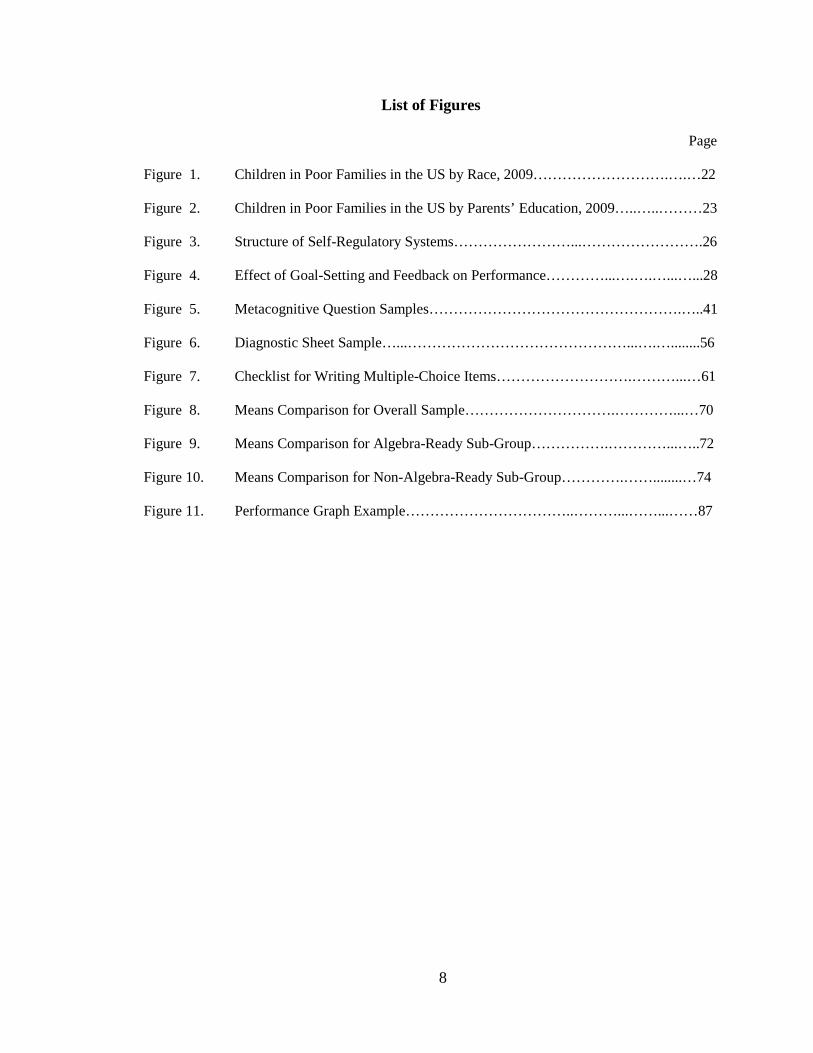
List of Figures
Page
Figure 1. Children in Poor Families in the US by Race, 2009……………………….….…22
Figure 2. Children in Poor Families in the US by Parents’ Education, 2009…..…..………23
Figure 3. Structure of Self-Regulatory Systems……………………...…………………….26
Figure 4. Effect of Goal-Setting and Feedback on Performance…………...….….…...…...28
Figure 5. Metacognitive Question Samples…………………………………………….…..41
Figure 6. Diagnostic Sheet Sample…...………………………………………...….…........56
Figure 7. Checklist for Writing Multiple-Choice Items……………………….………...…61
Figure 8. Means Comparison for Overall Sample………………………….…………...…70
Figure 9. Means Comparison for Algebra-Ready Sub-Group…………….…………...…..72
Figure 10. Means Comparison for Non-Algebra-Ready Sub-Group………….……........…74
Figure 11. Performance Graph Example……………………………..………...……...……87

CHAPTER ONE: INTRODUCTION
Chapter One contains a brief explanation of the problem, purpose, and
significance of this study which investigates the effect of metacognitive and self-
regulatory strategy use on assessment achievement in a 9th-grade physics class for
residential students from impoverished backgrounds. It also describes the research
questions and hypotheses for the study, as well as the identification of study variables and
definitions of items that pertain to the study.
Background
With the advent of the No Child Left Behind (NCLB) act in 2001, a standardized
testing framework was implemented that called attention to various sub-groups including
ethnicity and socioeconomic status. A central focus of NCLB is to reduce inequities in
performance that have historically existed between sub-groups, especially the ones listed
above. Facing stricter scrutiny, schools were faced with quickly determining professional
development, curriculum development, and instructional strategies to increase the
academic success of students from these and other sub-groups.
Out of this need, an entire “getting to proficiency” culture of school improvement
was born with a focus on data-driven instruction and best practices. Schools began
systematically identifying students who were advanced, proficient, basic, and below basic
in the areas of reading, writing, mathematics, and science. Inequities that had historically
existed for students from low socioeconomic backgrounds, especially when those
students were also considered minorities, were given even greater attention. Because of
this, specific areas of concern for these sub-groups became better defined.
One area of concern is the significant effect of stress that living in poverty can
10
have on a student’s brain development. This altered brain development, in turn, can have
significant effects on achievement, emotional development, and decision making (Jensen,
2009). Poverty, early negative conditioning, and at-risk factors, primarily at home and at
school, have also been shown to affect adolescents’ world views and self-concepts. In
studies of juvenile delinquency, greater levels of poverty when accompanied by negative
conditioning and at-risk factors were significantly correlated to a greater external locus of
control (Bansal, Thind, & Jaswal, 2006; Borman & Rachuba, 2001; Kelley, 1996). In
other words, quantitative studies have suggested that as the level of negative risk factors
increase, including poverty, adolescents become increasingly likely to believe that the
outcomes in their lives are as a result of “other people, outside events, even fate and luck”
(Kelley, 1996, p. 40). Each of these is associated with an external locus of control.
Adding to the issues of poverty and at-risk factors, the attitudes of learners toward
the secondary sciences is also of concern (DiBenedetto & Zimmerman, 2010). Since
school efforts and federal mandates (e.g. – No Child Left Behind) focus on reading,
writing, and mathematics, the sciences have taken a back seat (Chang, Singh, & Mo,
2007). In addition, students and their parents are more likely to admit and accept that
they “aren’t good” at science, thereby excusing attempts at improving their performance
or encouraging better performance for their children (Mettas, Karmiotis, & Christoforou,
2006; Provasnik, Gonzales, & Miller, 2009).
In light of these concerns, strategies that help students to practice control over
their own learning and achieve greater success in science may then also contribute to
greater student achievement in science.
11
Problem Statement
Students from low-SES backgrounds often lack the self-regulatory habits and
metacognitive strategies to improve academic performance (Lipina & Colombo, 2009).
They classically exhibit low task persistence, poor study skills, and do not engage in
reflection related to performance (Jensen, 2009). For low achieving students, poor
performance often becomes reinforcing, especially in science, and may lead to
disengagement, lack of motivation, and further compromises the likelihood that they will
fall further behind in science as their schooling progresses (Ruby, 2006).
In an effort to improve student assessment scores and to increase student self-
regulation and metacognition with regard to achievement in Foundations of Physics, this
study will investigate the use of metacognitive and self-regulatory strategies specifically
as they apply to students’ assessment data. Traditionally, student performance data is
used by adults to inform instructional and curricular decisions (Marzano, 2003).
However, students are rarely given or asked to evaluate their own performance data.
Moreover, students are not shown how to use this data to plan for or inform their own
learning. As one may then expect, there is a corresponding gap in the existing literature
with regard to instructing students to use their own data to inform their own learning,
especially in the secondary sciences.
Purpose Statement
The purpose of this nonequivalent control group design study was to evaluate the
effectiveness of metacognitive and self-regulatory strategy use (independent variable) on
assessment achievement of 9th-grade, residential physics students from low
socioeconomic status (low-SES) backgrounds. The independent variable was the
12
presence or absence of metacognitive and self-regulatory strategy use. The dependent
variable was the level of assessment achievement on a teacher-made pretest and posttest
of course content.
The students involved in this study are typical representations of those admitted to
private, residential schools for low-SES students. However, this population is not
representative of low-SES student populations in general. Because this sample is based in
residential education, many confounding factors (e.g. – diet, exercise, supervision, health
care, sleep, environmental conditions, and access to resources) are greatly controlled
compared to non-residential populations. Therefore, the study population is
representative of residential low-SES populations. However, it is not representative of
non-residential, low-SES populations.
Significance of the Study
With the advent of No Child Left Behind (NCLB) and the reauthorization of the
Individuals with Disabilities Education Act (IDEA), research-based instructional methods
and curricula that meet the needs of a varied population of students are mandated. As
such, teachers are under considerable pressure to implement a host of research-based
curricular and behavioral initiatives. However, because of the measurable gains in
learning that can result, especially for students with identified learning disabilities and
low-achieving learners, the use of class time to facilitate direct instruction in
metacognitive and self-regulatory strategy use should be investigated.
A significant finding would suggest that school districts should include
professional development training for science teachers in the use and inclusion of
metacognitive and self-regulatory strategies in the classroom. A significant finding
13
would also suggest the importance of students intentionally using metacognitive and self-
regulatory strategies as a means of improving achievement scores and levels of
understanding, especially for students from low-SES backgrounds who are also identified
as learning disabled or in lower level math courses. Additionally, this study has potential
significance to the field of education with regard to science education specifically. This
is important because often students do not feel in control of their learning, especially in
science (Mettas, Karmiotis, & Christoforou, 2006). Since standardized exams often do
not focus on science, and because sciences at the high school level become increasingly
abstract and difficult, students may triage science to the bottom of their list of priorities.
Understanding how students view their level of control over their own learning in science
may help improve their effort and self-regulation through targeted interventions. Since
U.S. students frequently rank near the bottom of international science exams (Provasnik,
Gonzales, & Miller, 2009) finding ways to improve science achievement is crucial.
Research Questions and Hypotheses
RQ–What is the effect of metacognitive and self-regulatory strategy use on
pretest/posttest achievement in a 9th-grade physics class for residential students
from low-SES backgrounds?
HO1 - There will be no significant difference in achievement of students in classes
which use metacognitive and self-regulatory strategies as compared to
students in classes which do not use these strategies, as shown by scores on a
pretest/posttest assessment.
HO2 - There will be no significant difference in achievement of algebra-ready
students in classes which use metacognitive and self-regulatory strategies as
14
compared to algebra-ready students in classes which do not use these
strategies, as shown by scores on a pretest/posttest assessment.
HO3 - There will be no significant difference in achievement of non-algebra-ready
students in classes which use metacognitive and self-regulatory strategies as
compared to non-algebra-ready students in classes which do not use these
strategies, as shown by scores on a pretest/posttest assessment.
Identification of Variables
The independent variable in this study was the presence or absence of
metacognitive and self-regulatory strategy use. These strategies were taught to the
experimental groups but not to the control groups. The strategies included: diagnostic
sheets identifying levels of understanding in each of four categories of content from a 9th-
grade physics class; think-alouds done with the teacher and as part of whole class
discussion; creation of a performance graph which students use to track their own
learning progress as part of a progressive goal-setting strategy and growth model of
learning; reflection discussions with teacher and/or peers; and creation of a personalized
study plan for each student created by each student based on their diagnostic sheet and
performance graph results.
The dependent variable in this study was the level of achievement on a teacher-
made, cumulative, pretest/posttest exam from the first four chapters of the course. The
exam was given at the end of the first chapter and again at the end of the fourth chapter.
The exam was multiple-choice and contained 35 questions. Pretest and posttest scores
were compared for the experimental group/sub-groups and the control group/sub-groups.
15
Definitions
Algebra-Ready – Students at the study site who have shown on performance assessments
that they are ready to begin algebra. Because the freshman physics course at the study
site is algebra-based, students are grouped into science classes based on their math level.
Learning Disability – identified learning disability in math or reading as defined by the
2008 Chapter 14 Special Education Regulations of the Pennsylvania State Board of
Education.
Locus of control – refers to the perception of control over (internal LOC), or a lack of
control over (external LOC) one’s own learning. For the purposes of this study, LOC
will be studied as it relates specifically to a student’s performance in science.
Metacognition – defined as “one's knowledge concerning one's own cognitive processes
or anything related to them, e.g., the learning-relevant properties of information or data.
For example, I am engaging in metacognition if I notice that I am having more trouble
learning A than B; if it strikes me that I should double check C before accepting it as
fact” (Flavell, 1976, p. 232).
Non-Algebra-Ready – Students at the study site who have not shown adequate progress
with pre-algebra concepts and, therefore, are not ready to move on to a regular, freshman
algebra class. These students receive double periods of math daily and also receive
additional instructional support. Because the freshman physics course at the study site is
algebra-based, students are grouped into science classes based on their math level. These
students typically have greater gaps in their education and perform below grade level.
Self-regulation - as it pertains to learning, refers to the willingness of a person to attend
to, attempt to control, and affect their own learning (Kitsantas & Zimmerman, 2006).

16
Summative Assessment – cumulative, common assessment of course content as assessed
through a computer-scored, multiple choice exam and given by all teachers in the study.
17
CHAPTER TWO: REVIEW OF THE LITERATURE
With the advent of the No Child Left Behind (NCLB) act in 2001, a standardized
testing framework was implemented that called attention to various sub-groups including
ethnicity and socioeconomic status. A central focus of NCLB is to reduce inequities in
performance that have historically existed between sub-groups, especially the ones listed
above. Facing stricter scrutiny, schools were faced with quickly determining professional
development, curriculum development, and instructional strategies to increase the
academic success of students from these and other sub-groups.
Out of this need, an entire “getting to proficiency” culture of school improvement
was born with a focus on data-driven instruction and best practices. Schools began
systematically identifying students who were advanced, proficient, basic, and below basic
in the areas of reading, writing, mathematics, and science. Inequities that had historically
existed for students from low socioeconomic backgrounds, especially when those
students were also considered minorities, were given even greater attention. Because of
this, specific areas of concern for these sub-groups became better defined.
During this same time, brain-scanning became more advanced through the use of
technologies like functional magnetic resonance imaging, allowing neurologists and
neurobiologists to study how the brain functions during learning tasks. Additionally,
NCLB’s directives gave rise to ground-breaking, multi-disciplinary studies uniting the
knowledge of educational researchers, psychologists, sociologists, neuroscientists, and
neurobiologists giving us an unprecedented, multifaceted understanding of the brain, its
development, and how people learn.
Groundbreaking studies showed that the brain is a work in progress, that the
18
conditions under which a brain develops impact the brain, in some instances, forever.
This is especially true for children from chronically stressful and traumatic backgrounds.
For example, the hippocampus is responsible for explicit memory. Research has shown
that in the brains of children experiencing chronic stress and trauma, excessive
production of cortisol, the “stress hormone”, may be responsible for suppressing the
development of the hippocampus (Starkman, Giordani, Gebarski, & Schteingart, 2003).
Likewise, it was discovered that as the home environment of children becomes more
chaotic, the brain undergoes physical changes that inhibit the development of certain
regions of the brain related to response, inhibition, and learning (Gunnar, Frenn,
Wewerka, & Van Ryzin, 2009). Dr. Daniel Segal (2008) states, “the legacy of trauma
may then create cognitive impairments making school even more stressful for children
who have experienced various forms of abuse or neglect” (para. 15). In a study by the
National Institute of Child Health and Human Development and the Early Child Care
Research Network (2005), the effects of non-poverty, intermittent poverty, and chronic
poverty environments on children from birth to 9 years of age was investigated. Findings
suggest that children living in chronic poverty throughout childhood, especially for the
formative years from ages 4 to 9, performed substantially lower than their non-poverty or
intermittent poverty peers in language, school readiness, and standardized measures, and
scored higher in behavioral and emotional problems. Lipina and Colombo (2009) state
that the effects of chronic poverty environments are attributable to more than low socio-
economic status: biological risk factors, psychological risk factors, and socio-cultural
factors also play a large part.
“Socio-cultural risk factors include gender inequity, low maternal education,

19
and reduced access to services. Biological risks include prenatal and postnatal
growth, nutrient deficiencies, infectious diseases, and environmental toxins.
Psychosocial risks include parenting factors, maternal depression, and exposure to
violence” (Lipina & Colombo, 2009, p. 53).
Even more concerning is the finding that the effects of these risk factors are multi-
generational, meaning that children raised in chronically impoverished environments
typically go on to raise their own children in poverty, thereby extending the pathways for
poor development (Walker et al., 2007).
However, it was also discovered that the brain is, in other respects, plastic, or
changeable in ways that were not previously understood. This neuroplasticity of the
brain means that, under the right conditions, previously underdeveloped regions of the
brain can become better developed. Further, the brain acts throughout adolescence and
into adulthood to expand and protect, or prune and remove, neural networks and
pathways based on what information is repeatedly accessed or abandoned. Kurt Fisher of
Harvard University’s Mind, Brain, and Education Program states, “Intelligence is not
fixed, it turns out, nor planted firmly in our brains from birth. Rather, it's forming and
developing throughout our lives” (Bernard, 2010, para. 3). Even more astounding is that
by simply telling students that their brains are plastic and capable of changing can
actually change them. A study conducted by Blackwell, Trzesniewski, and Dweck
(2007) found that motivation and achievement increased significantly once students
understood that their intelligence is malleable. Equally hopeful is a finding by Stipek and
Ryan (1997) that suggests children from chronically impoverished backgrounds are no
less motivated to learn than their peers from high-income backgrounds.
20
In a study by Zimmerman and Martinez-Pons (1986), open-ended interview
questions about the use of self-regulated learning strategies were given to 80 randomly
selected high school students: 40 from an advanced academic track of high achievers and
40 from lower academic tracks of low achievers. Fourteen self-regulatory categories
were assessed: self-evaluation, organizing and transforming, goal-setting and planning,
seeking information, keeping records and monitoring, environmental structuring, self-
consequences, rehearsing and memorizing, seeking social assistance (from peers,
teachers, adults), and reviewing records (re-read tests, notes, or textbooks). There was
also an “other” category that assessed learning behaviors that did not originate from
within the student such as following a teacher’s instructions or doing what they were told
to do. Both male and female high achieving students reported using 13 of the 14 self-
regulatory categories to a statistically higher degree than their lower track counterparts.
The exception was self-evaluation. The most important factor was the self-reported
consistency of using the strategies. High achieving students reported using the strategies
frequently, whereas low achieving students reported using the strategies occasionally.
Additionally, high achieving students sought help from others almost twice as often as
low achieving students. The low achieving group relied more heavily on reviewing notes
rather than interacting socially. Low achieving students reported in the “other” category
almost twice as frequently as their high achieving peers, meaning that they attributed
their actions not to internal measures but to external ones (e.g. - the teacher told me to, I
was following directions, that’s what I was supposed to do).
Findings revealed that students’ achievement track could be predicted with 93%
accuracy using the self-regulatory category responses through discriminant function
21
analyses. As reported by Zimmerman and Martinez-Pons (1986), “When compared to
students’ gender and socioeconomic status indices in regression analyses, self-regulated
learning measures proved to be the best predictor of standardized achievement test
scores” (p. 614). This is promising, indicating that the effects of lower socioeconomic
status may be overcome through the application of self-regulatory strategy usage.
Likewise, Zimmerman and Martinez-Pons state, “The present results suggest that
theoretical concepts of students as initiators, planners, and observers of their own
instructional experiences have empirical and practical merit” (p. 626).
What do these findings mean for education and special sub-groups in light of
NCLB? They mean that research and strategies aimed at improving brain functioning as
it relates to not only subject learning, but also emotional response, are warranted. This is
also true for studies that investigate how children from backgrounds of poverty respond
to the high stakes world of testing. In the case of teaching children from backgrounds of
poverty, this has given birth to controversy over how to approach an understanding of the
hurdles that these children face, and how those challenges impact how they learn and,
therefore, perform on state standardized exams and in the classroom.
Historical Summary
We have long known a clear connection exists between income and achievement,
especially for minority students in urban areas where co-morbid conditions compound the
problem (Figure 1).
22
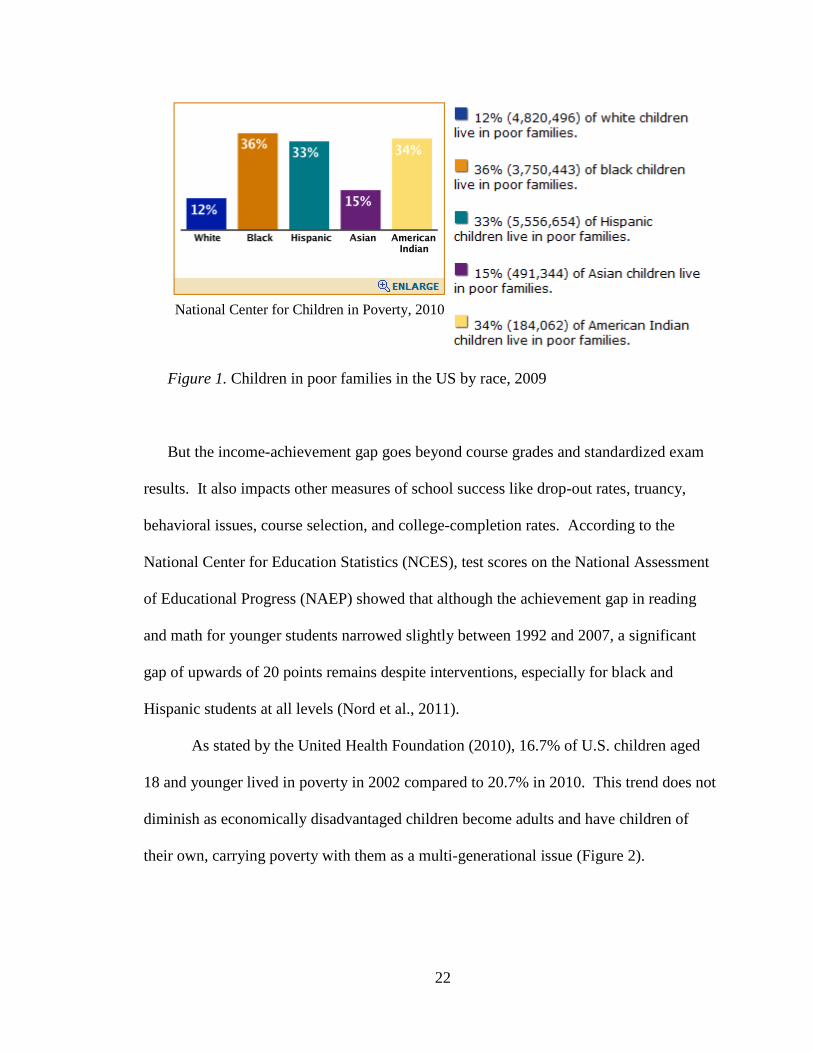
Figure 1. Children in poor families in the US by race, 2009
But the income-achievement gap goes beyond course grades and standardized exam
results. It also impacts other measures of school success like drop-out rates, truancy,
behavioral issues, course selection, and college-completion rates. According to the
National Center for Education Statistics (NCES), test scores on the National Assessment
of Educational Progress (NAEP) showed that although the achievement gap in reading
and math for younger students narrowed slightly between 1992 and 2007, a significant
gap of upwards of 20 points remains despite interventions, especially for black and
Hispanic students at all levels (Nord et al., 2011).
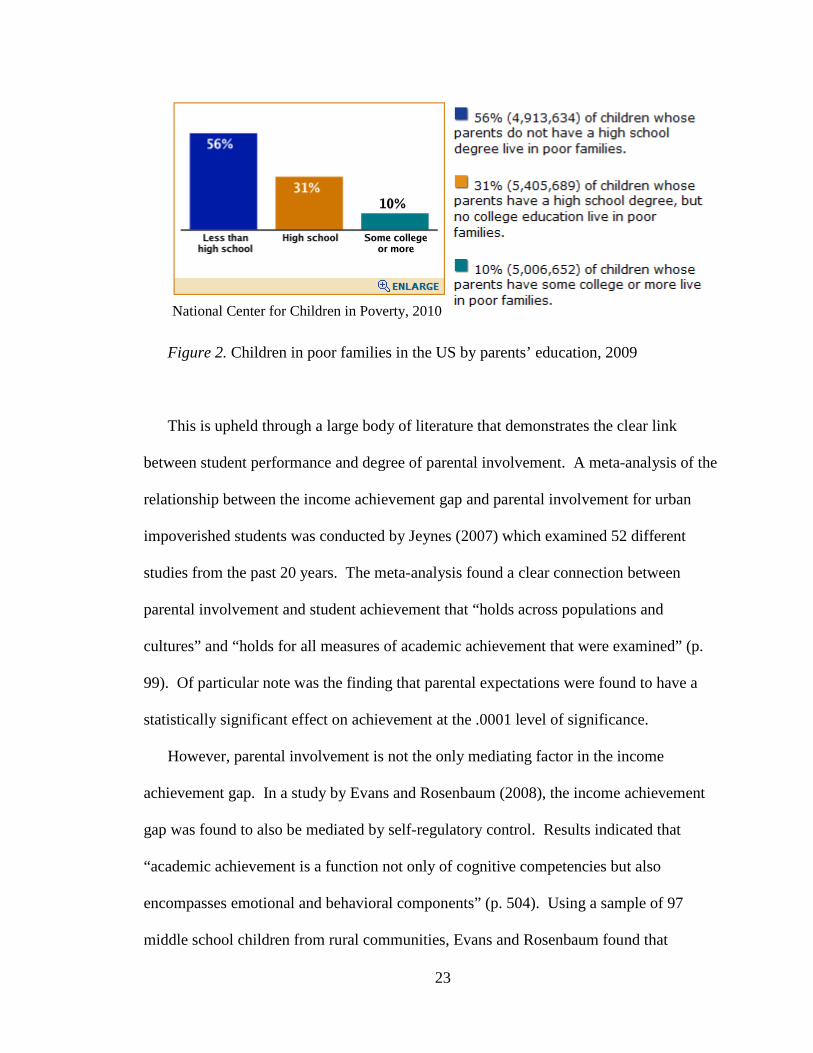
As stated by the United Health Foundation (2010), 16.7% of U.S. children aged
18 and younger lived in poverty in 2002 compared to 20.7% in 2010. This trend does not
diminish as economically disadvantaged children become adults and have children of
their own, carrying poverty with them as a multi-generational issue (Figure 2).
National Center for Children in Poverty, 2010
23
Figure 2. Children in poor families in the US by parents’ education, 2009
This is upheld through a large body of literature that demonstrates the clear link
between student performance and degree of parental involvement. A meta-analysis of the
relationship between the income achievement gap and parental involvement for urban
impoverished students was conducted by Jeynes (2007) which examined 52 different
studies from the past 20 years. The meta-analysis found a clear connection between
parental involvement and student achievement that “holds across populations and
cultures” and “holds for all measures of academic achievement that were examined” (p.
99). Of particular note was the finding that parental expectations were found to have a
statistically significant effect on achievement at the .0001 level of significance.
However, parental involvement is not the only mediating factor in the income
achievement gap. In a study by Evans and Rosenbaum (2008), the income achievement
gap was found to also be mediated by self-regulatory control. Results indicated that
“academic achievement is a function not only of cognitive competencies but also
encompasses emotional and behavioral components” (p. 504). Using a sample of 97
middle school children from rural communities, Evans and Rosenbaum found that
National Center for Children in Poverty, 2010
24
students from impoverished backgrounds performed lower than their non-impoverished
peers. However, the achievement gap became non-significant when the impoverished
students tested positively for increased levels of self-regulation on a delay of gratification
test.
So what are schools to do when 20% of the children, on average, in their districts are
arriving to school, even in kindergarten, already behind their middle or upper class peers?
This is where the controversy in the literature heightens.
From one perspective, strategies aimed at mitigating the deficits of children from
poverty are most beneficial. According to Payne (2005), children from backgrounds of
poverty are in need of a new framework from which to reference if they wish to enter
successfully into middle-class environments, school being one of them. Therefore, it is to
the school’s advantage, and the student’s, to intentionally teach this new framework so
that students from backgrounds of poverty learn to operate under rules that allow for
success in school (both secondary and post-secondary) and the middle-class work world
(Payne, 2005). If these multiple areas are not addressed, than even high academically-
achieving students from poor backgrounds will likely fall back into patterns of poverty.
From another perspective, strategies aimed at capitalizing on the strengths
children of poverty bring with them, and learning to understand and appreciate their
cultural capital, are most beneficial. If a deficit model of educating those from poverty
focuses on teaching children a new set of rules, than an asset model focuses on the
cultural assets of these same groups. Proponents of an asset model believe that to
adequately address the income-achievement gap that exists for many black, Hispanic,
Latino, Native American, Mexican American, and other socio- economically
25
disadvantaged groups, we must first understand the cultural components these groups
bring with them to the classroom. In other words, rather than seeing students from these
cultural groups as “have nots,” we must instead view them as alternate “haves.” These
cultural groups have particular beliefs, expectations, and experiences (social, political,
and economic) that describe a different but equally valid cultural experience through
which they operate. Tileston and Darling (2008) offer an asset model of differentiation
that honors the cultural experiences of these groups and asks educators to place value on
the cultural capital that these students bring with them into the classroom. Most
important is 1) a healthy, mentoring relationship with at least one caring adult, 2) a
“sense of purpose and future [which] signifies goal direction, educational aspirations,
achievement motivation, persistence, hopefulness, optimism, and spiritual
connectedness” (Tileston & Darling, 2008, p. 8), and 3) problem-solving skills.
Together, these three components make up the backbone of resilient children. Resiliency
fosters an internal locus of control and promotes self-regulated learning (Benard, 2003;
Nota, Soresi, & Zimmerman, 2004; Tileston & Darling, 2008).
Theoretical Framework
This study is based in two main theories. The first is Bandura’s social cognitive
theory of self-regulation. The second is Vygotsky’s social development theory as it
relates to metacognition.
Social Cognitive Theory of Self-Regulation. Bandura’s social cognitive theory
states that human behavior is “regulated by an interplay of self-generated and external
sources of influence” (Bandura, 1991, p. 249). In other words, people are neither rule-
following machines nor are they any more likely to ignore social expectations or contexts
26
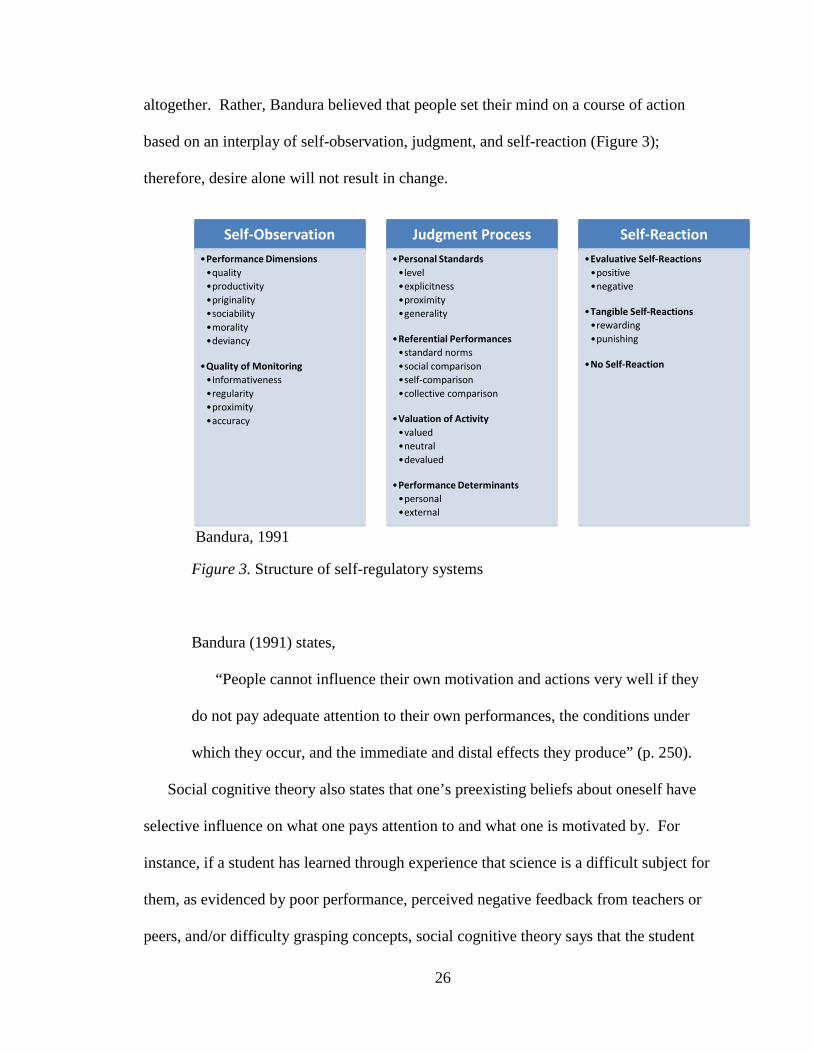
altogether. Rather, Bandura believed that people set their mind on a course of action
based on an interplay of self-observation, judgment, and self-reaction (Figure 3);
therefore, desire alone will not result in change.
Figure 3. Structure of self-regulatory systems
Bandura (1991) states,
“People cannot influence their own motivation and actions very well if they
do not pay adequate attention to their own performances, the conditions under
which they occur, and the immediate and distal effects they produce” (p. 250).
Social cognitive theory also states that one’s preexisting beliefs about oneself have
selective influence on what one pays attention to and what one is motivated by. For
instance, if a student has learned through experience that science is a difficult subject for
them, as evidenced by poor performance, perceived negative feedback from teachers or
peers, and/or difficulty grasping concepts, social cognitive theory says that the student
Self-Observation•Performance Dimensions•quality•productivity•priginality•sociability•morality•deviancy
•Quality of Monitoring•Informativeness•regularity•proximity•accuracy
Judgment Process•Personal Standards•level•explicitness•proximity•generality
•Referential Performances•standard norms•social comparison•self-comparison•collective comparison
•Valuation of Activity•valued•neutral•devalued
•Performance Determinants•personal•external
Self-Reaction•Evaluative Self-Reactions•positive•negative
•Tangible Self-Reactions•rewarding•punishing
•No Self-Reaction
Bandura, 1991
27
may fail to persist, lose motivation, and disengage from the subject, viewing the subject
as the problem. They may even internalize this to the point where they view themselves
as inadequate or incapable of understanding the subject. This is important to consider
with adolescents who are developing self-identities, and especially important to consider
with impoverished adolescents who have been shown to already struggle with persistence
and motivation (Jensen, 2009).
However, Bandura’s social cognitive theory also states that self-observation, when
made consciously and purposefully, can provide self-diagnostic feedback which can
dynamically change one’s own patterns and actions. According to Bandura (1991), “For
those who know how to alter their behavior and modifiable aspects of their environment,
the self-insights so gained can set in motion a process of corrective change” (p. 250). He
also states, “Self-observation enhances performance when there is clear evidence of
progress, but it has little effect when there is considerable ambiguity about the effects of
one’s courses of action” (Bandura, 1991, p. 251). In other words, even though a student
has, through experience, perceived themselves as “bad” at science, they can still change
all of that: 1) if they are shown how and 2) these efforts are reinforced with evidence of
progressive improvement.
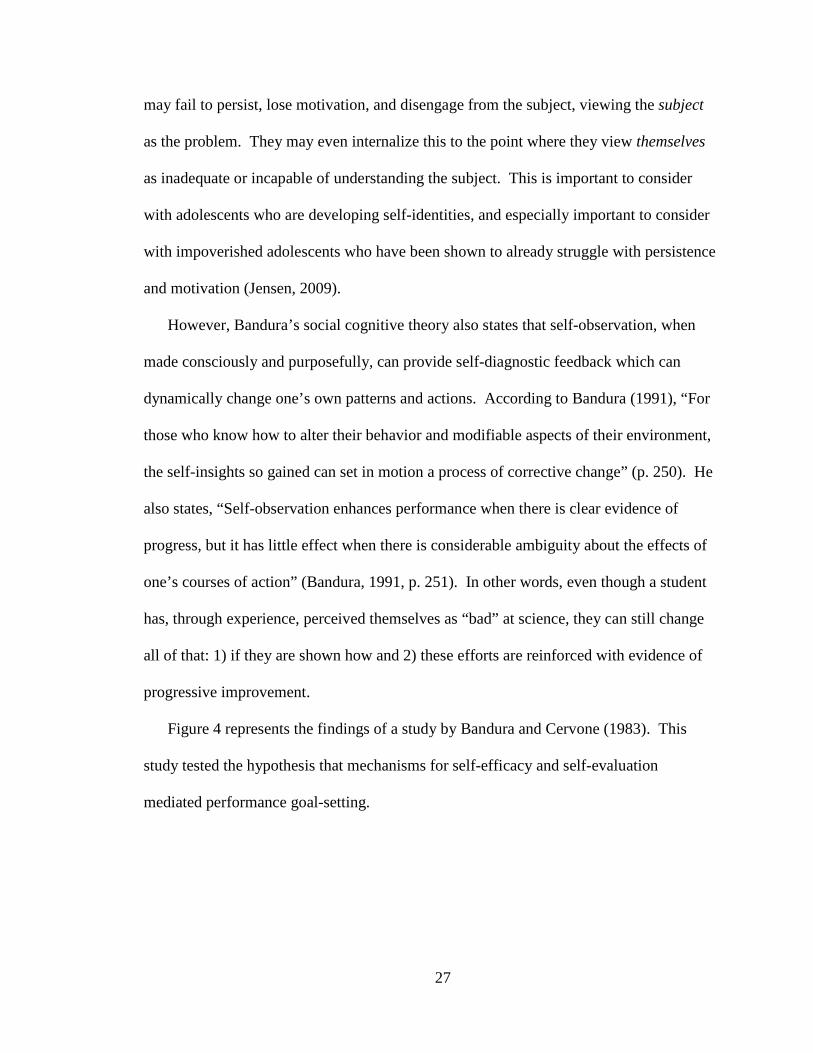
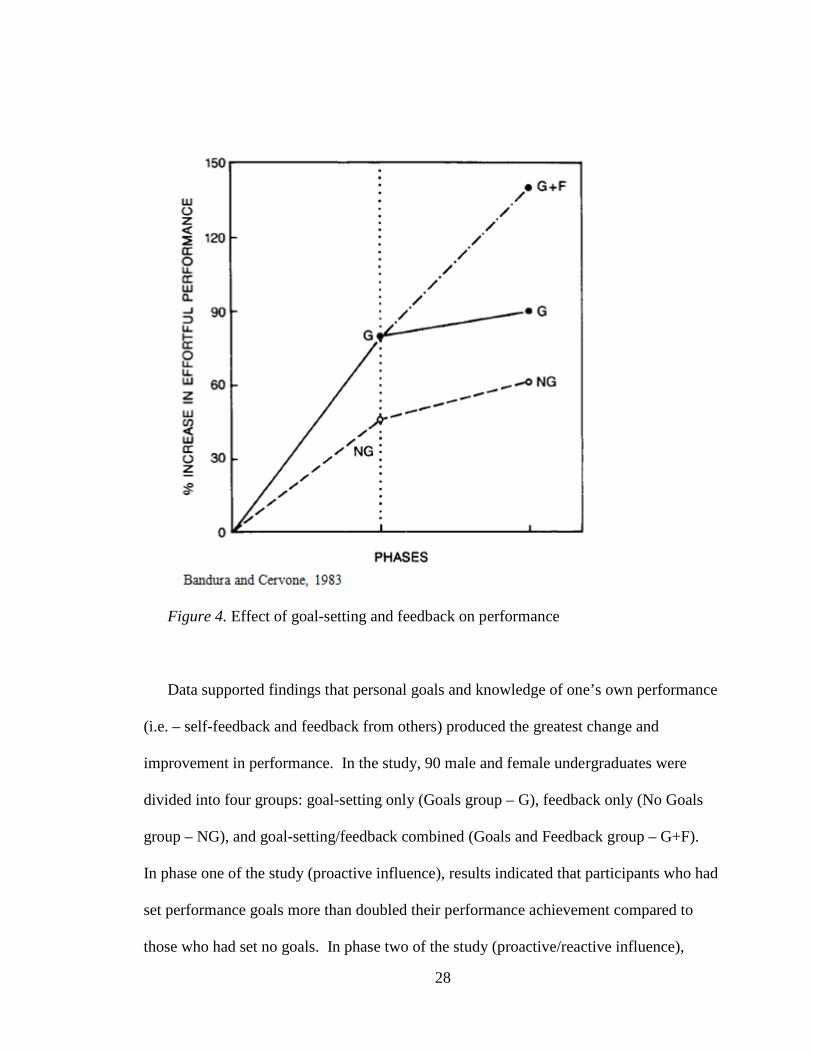
Figure 4 represents the findings of a study by Bandura and Cervone (1983). This
study tested the hypothesis that mechanisms for self-efficacy and self-evaluation
mediated performance goal-setting.
28
Figure 4. Effect of goal-setting and feedback on performance
Data supported findings that personal goals and knowledge of one’s own performance
(i.e. – self-feedback and feedback from others) produced the greatest change and
improvement in performance. In the study, 90 male and female undergraduates were
divided into four groups: goal-setting only (Goals group – G), feedback only (No Goals
group – NG), and goal-setting/feedback combined (Goals and Feedback group – G+F).
In phase one of the study (proactive influence), results indicated that participants who had
set performance goals more than doubled their performance achievement compared to
those who had set no goals. In phase two of the study (proactive/reactive influence),
29
results indicated that participants who had set performance goals and received feedback
almost doubled their performance achievement compared to those who had set goals but
received no feedback about their performance.
To accomplish this, social cognitive theory supports that one must set goals to
achieve change and that one must be motivated toward goal-setting. Unlike negative
feedback models which state that there can be no change unless there is a discrepancy
between an internal standard set by the participant and the participant’s performance
(Piaget, 1960), social cognitive theory states that no such discrepancy need be present to
promote or motivate change.
“Although comparative feedback is essential in the ongoing regulation of
motivation, people initially raise their level of motivation by adopting goals before
they receive any feedback regarding their beginning effort. The exercise of
forethought enables them to wield adaptive control anticipatorily rather than being
simply reactive to the effects of their efforts” (Bandura, 1991, p. 259).
This view argues for the possibility of motivational goal-setting even when a student
has previously perceived their level of achievement to be adequate. This study
capitalized on this aspect as each student in the treatment group was provided with
metacognitive and self-regulatory instruction, not just students who have been
predetermined as struggling with science.
Social Development Theory. Vygotsky’s social development theory is centered on
the assumption that higher order mental processes (e.g. – metacognitions) and mental
functioning are mediated by social interactions. Vygotsky (1978) states:
“Every function in the child’s cultural development appears twice: first, between
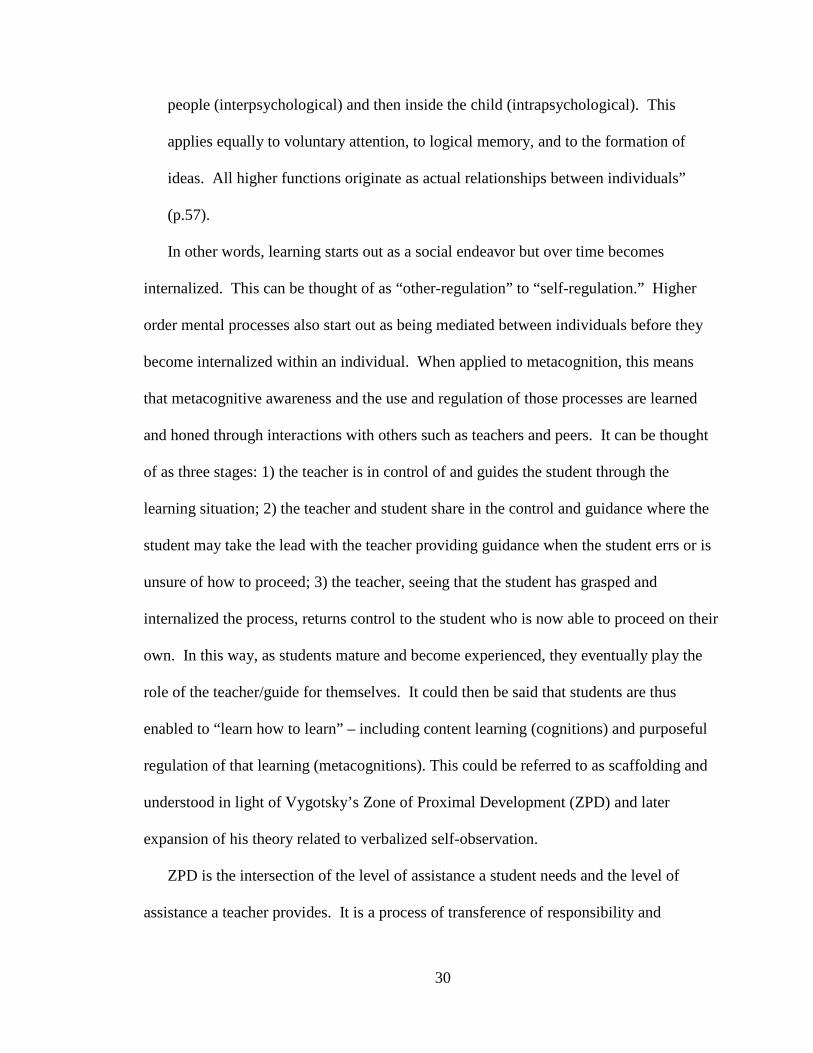
30
people (interpsychological) and then inside the child (intrapsychological). This
applies equally to voluntary attention, to logical memory, and to the formation of
ideas. All higher functions originate as actual relationships between individuals”
(p.57).
In other words, learning starts out as a social endeavor but over time becomes
internalized. This can be thought of as “other-regulation” to “self-regulation.” Higher
order mental processes also start out as being mediated between individuals before they
become internalized within an individual. When applied to metacognition, this means
that metacognitive awareness and the use and regulation of those processes are learned
and honed through interactions with others such as teachers and peers. It can be thought
of as three stages: 1) the teacher is in control of and guides the student through the
learning situation; 2) the teacher and student share in the control and guidance where the
student may take the lead with the teacher providing guidance when the student errs or is
unsure of how to proceed; 3) the teacher, seeing that the student has grasped and
internalized the process, returns control to the student who is now able to proceed on their
own. In this way, as students mature and become experienced, they eventually play the
role of the teacher/guide for themselves. It could then be said that students are thus
enabled to “learn how to learn” – including content learning (cognitions) and purposeful
regulation of that learning (metacognitions). This could be referred to as scaffolding and
understood in light of Vygotsky’s Zone of Proximal Development (ZPD) and later
expansion of his theory related to verbalized self-observation.
ZPD is the intersection of the level of assistance a student needs and the level of
assistance a teacher provides. It is a process of transference of responsibility and
31
accountability that gradually passes from the teacher to the student. This gradient of
responsibility and accountability ideally should proceed at the pace set by the student’s
ability to understand and engage meaningfully in the content or skill being presented.
Verbalized self-observation, sometimes referred to as introspection or reflective
awareness, is discussed in Vygotsky’s 1978 and 1986 works. Since Vygotsky believed
human development was culturally determined and shaped by experience, he viewed
verbalized self-observation as a direct outcome of interacting with others through
language. As interactions with others continue, those interactions become progressively
more abstract. “Metacognition and self-regulation, the awareness, knowledge, and
control of thoughts and behavior, move along this same developmental path, in which
change proceeds via qualitative transformations toward mature reflective awareness and
deliberate control” (Fox & Riconscente, 2008, p. 383). As these language-mediated
interactions are moving from generalized to abstract, students are also engaging in the
social construct of formal schooling and, with practice, can be taught to use language to
shape, make known, and take control of their thoughts, goals, and actions.
Without conscious control and the ability for abstraction, Vygotsky did not believe
that metacognition was possible: “We use consciousness to denote awareness of the
activity of the mind – the consciousness of being conscious” (Vygotsky, 1986, p. 180).
Vygotsky attributed metacognitive abilities to adolescents and adults, stating that children
are not capable of it because they are not able to assess what they are and are not able to
do. Vygotsky states, “[Children] operate with complex tasks in the same way they
operate with simple ones” (Vygotsky, 1978, p. 71). It is through repeated practice and
exposure to socially mediated opportunities that metacognitive knowledge is developed
32
and in which the student is eventually aware of their own thinking.
However, being aware of one’s own thinking is not enough. Vygotsky also believed
that to engage in metacognition one also needed to be self-regulated. Therefore, he saw
metacognition and self-regulation as intertwined and interdependent. The most basic
type of self-regulation is the ability and willingness to direct our thoughts toward a
particular goal or activity. Without this, it is not possible to manipulate the situation or
ourselves.
Relationship of Theories to Study Context. Together, these insights into self-
regulation and metacognition support the basis for this study’s approach and argue for
teaching students to monitor their own academic performance within the context of
progressive goal-setting. If students are able to confirm growth and increased
achievement over time this should be reinforcing to their self-concept and their self-
esteem. The student goal-setting and voluntary study mechanisms (e.g. – tutoring, study
groups/buddies) that are part of this study each relate back to social cognitive theory in
support of changing student behaviors toward their own learning. The think-alouds, self-
diagnostic interventions, and classroom culture of continuous, progressive improvement
that are part of this study each relate back to social development theory in support of
metacognitive efforts that provide students with feedback about their own learning and
progress. Additionally, this study relates back to social development theory; is
appropriately placed in terms of developmental level; and includes scaffolding of
metacognitive and self-regulatory strategies such that students will eventually be
positioned to take full responsibility for informing their own learning through the use of
their own assessment data as a feedback mechanism.
33
The Impact of Self-Regulation, Metacognition, and Locus of Control on
Achievement for Students from Backgrounds of Poverty
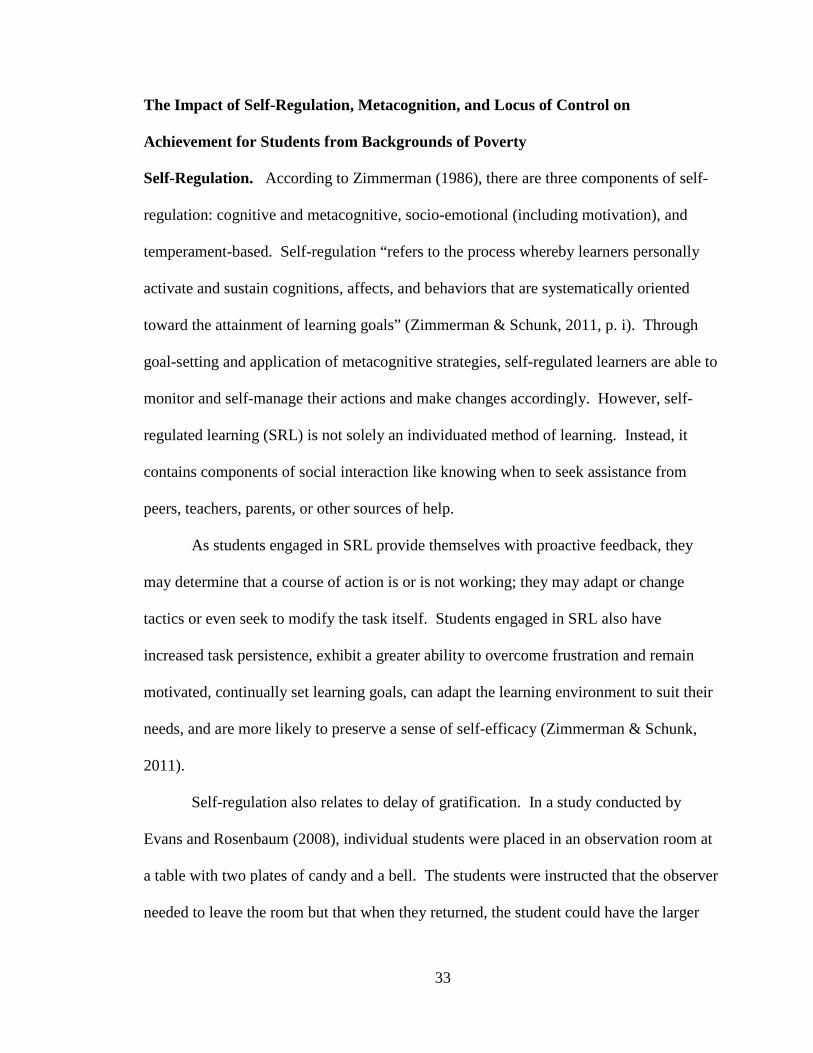
Self-Regulation. According to Zimmerman (1986), there are three components of self-
regulation: cognitive and metacognitive, socio-emotional (including motivation), and
temperament-based. Self-regulation “refers to the process whereby learners personally
activate and sustain cognitions, affects, and behaviors that are systematically oriented
toward the attainment of learning goals” (Zimmerman & Schunk, 2011, p. i). Through
goal-setting and application of metacognitive strategies, self-regulated learners are able to
monitor and self-manage their actions and make changes accordingly. However, self-
regulated learning (SRL) is not solely an individuated method of learning. Instead, it
contains components of social interaction like knowing when to seek assistance from
peers, teachers, parents, or other sources of help.
As students engaged in SRL provide themselves with proactive feedback, they
may determine that a course of action is or is not working; they may adapt or change
tactics or even seek to modify the task itself. Students engaged in SRL also have
increased task persistence, exhibit a greater ability to overcome frustration and remain
motivated, continually set learning goals, can adapt the learning environment to suit their
needs, and are more likely to preserve a sense of self-efficacy (Zimmerman & Schunk,
2011).
Self-regulation also relates to delay of gratification. In a study conducted by
Evans and Rosenbaum (2008), individual students were placed in an observation room at
a table with two plates of candy and a bell. The students were instructed that the observer
needed to leave the room but that when they returned, the student could have the larger
34
plate of candy. If the student felt they could not wait, they were to ring the bell, the
observer would return, and the student could have the smaller plate of candy. Results
indicated there was a strong correlation between delay of gratification and achievement in
math and English classes. More importantly, there was also a significant correlation
between income and achievement, but that correlation became non-significant when the
analysis included self-regulatory behavior. These findings have significant implications
for education. With increasing importance being placed on standardized achievement in
school, math and English in particular, remediation efforts have traditionally been
focused solely on cognitive interventions. The results of this study suggest that for
students from backgrounds of poverty additional interventions that focus on self-
regulatory control are warranted to truly close the income-achievement gap.
Because SRL involves both internal “self-talk” and external verbal interactions
with others, Vygotskian socio-cultural theory suggests that this focus on language is
central to understanding how children use language as a means of controlling their
actions and thoughts. This theoretical framework is useful not only in understanding
SRL, but also in understanding the interaction of SRL and poverty.
Children growing up in poverty accompanied by a chronically stressful
environment experience a host of risk factors and other stressors which predispose them
to behavioral, emotional, and learning problems (Buckner, Mezzacappa, & Beardslee,
2003). However, there are some children who grow up in poverty that, although they
may experience the same risk factors and stressors as other impoverished students
(although not necessarily the same in terms of quantity of risk factors), seem to weather
their circumstances and remain resilient. The ability to self-regulate is an important
35
component to resiliency. Through proactive coping rather than reactive coping, students
are able to retain a sense of self-control and mastery over their own circumstances.
Buckner, Mezzacappa, and Beardslee (2003) found that criteria that most influenced
whether students from impoverished backgrounds developed resilient, self-regulated
behaviors or non-resilient, reactive behaviors were quantity and frequency of risk factors
(e.g. – abuse, homelessness, violence, and neglect), level of adult monitoring (not
necessarily familial), and a healthy relationship with at least one caring adult (also not
necessarily familial). Based on a neurobiological understanding of brain development
and how chronic exposure to risk factors and trauma diminish brain development
(especially in executive function), these findings suggest that poverty in and of itself is
not enough to predispose children to unhealthy coping mechanisms and poor
performance in school.
Self-Regulation in Science Education. Self-regulation as it applies to achievement
is not necessarily universal in its application; rather, it can be situational or contextual.
The skills and approaches needed for one subject do not necessarily apply to all subjects.
As applied to the study of science, Winne and Perry’s (2000) view of self-regulation,
which is similar to that of Zimmerman, has three components: cognition, metacognition,
and motivation. The cognitive aspect is comprised of the knowledge and skills a student
needs to engage in the processes of science: problem-solving, inquiry, and critical
thinking. The metacognitive aspect is comprised of the knowledge and skills a student
needs to understand and exert control over their cognitions. The motivational aspect is
comprised of the attitudes and beliefs a student has related to the “use and development
of one’s cognition and metacognition” (Sinatra & Taasoobshirazi, 2011, p. 204).
36
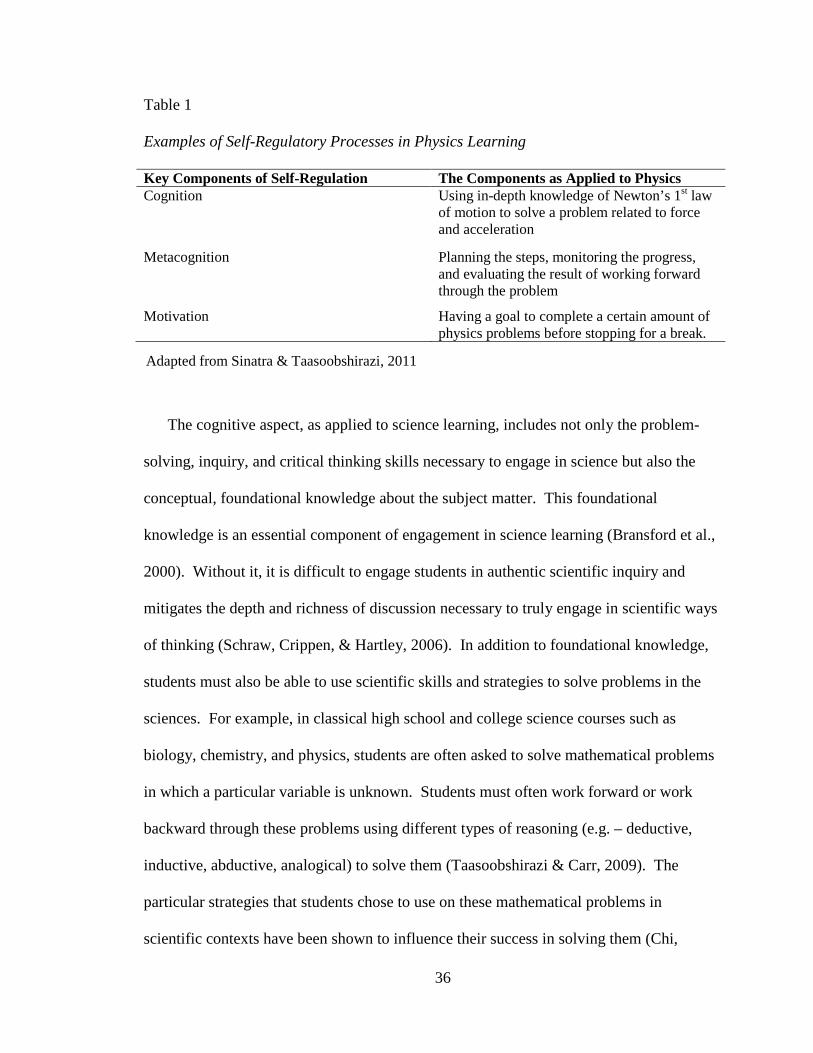
Table 1
Examples of Self-Regulatory Processes in Physics Learning
Key Components of Self-Regulation The Components as Applied to Physics Cognition Using in-depth knowledge of Newton’s 1st law
of motion to solve a problem related to force and acceleration
Metacognition Planning the steps, monitoring the progress, and evaluating the result of working forward through the problem
Motivation Having a goal to complete a certain amount of physics problems before stopping for a break.
The cognitive aspect, as applied to science learning, includes not only the problem-
solving, inquiry, and critical thinking skills necessary to engage in science but also the
conceptual, foundational knowledge about the subject matter. This foundational
knowledge is an essential component of engagement in science learning (Bransford et al.,
2000). Without it, it is difficult to engage students in authentic scientific inquiry and
mitigates the depth and richness of discussion necessary to truly engage in scientific ways
of thinking (Schraw, Crippen, & Hartley, 2006). In addition to foundational knowledge,
students must also be able to use scientific skills and strategies to solve problems in the
sciences. For example, in classical high school and college science courses such as
biology, chemistry, and physics, students are often asked to solve mathematical problems
in which a particular variable is unknown. Students must often work forward or work
backward through these problems using different types of reasoning (e.g. – deductive,
inductive, abductive, analogical) to solve them (Taasoobshirazi & Carr, 2009). The
particular strategies that students chose to use on these mathematical problems in
scientific contexts have been shown to influence their success in solving them (Chi,
Adapted from Sinatra & Taasoobshirazi, 2011
37
2006).
The metacognitive aspect, as applied to science learning, relates to students’
awareness of and control over their own knowledge, skills, and strategies as they apply to
the scientific endeavor. Although metacognition will be covered in greater depth in the
next section, suffice to say here that students who are successful at science are also more
adept at and more consistent in their use of metacognitive strategies. They can choose
the proper strategy to use, can explain why they chose it, and they can switch strategies if
they find the one they are currently using is not producing the desired outcome. Less
successful students in science are often unable to identify a strategy to use, cannot
explain their thinking or their explanations are naive, and they may withdraw from the
learning task if they are unable to identify another approach (Bransford, et al., 2000).
The motivational aspect, as applied to science learning, relates to students’ level of
motivation needed to remain engaged in the learning activity and to commit to the
necessary behaviors for successful habits in science. Proficiency in discrete areas of
science, such as biology, chemistry, or physics, requires attention, focus, and a
commitment to a certain amount of practice that is of high quality (Sinatra &
Taasoobshirazi, 2011).
Examples of self-regulation in the sciences can be seen in a few examples. In a study
by Kitsantas and Zimmerman (2006), the effect of graphing and progressive goals was
evaluated related to a performance skill. Participants were divided into five groups:
control, absolute standards/graphing, absolute standards/no graphing, progressive
standards/graphing, progressive standards/no graphing. The results of the study revealed
that students who graphed their results showed greater skill improvement. However,
38
students who graphed their results and also set progressively more challenging goals
toward an ultimate standard met that standard more frequently than those who set an
absolute goal of meeting or not meeting the ultimate standard. In other words, students
who set one goal (e.g. – receive an A on the test) were less successful than students who
set progressive goals (e.g. – receive a B on this test and increase to an A on the next test).
Graphing of the intermediate performance allowed students to correct their practice and
methods, whereas the students who did not graph did not have this opportunity to reflect
on their practice or methods. Additionally, student self-esteem and self-satisfaction were
also highest in the group that both graphed and set progressive goals, thereby increasing
their motivation to continue engaging in mastering the skill. The results were self-
reinforcing. Even more interesting was that students who graphed their results and set
progressive goals were more likely to assign their performance deficits to lack of skill
practice (within their control), whereas students who did not graph their results and set
ultimate goals were more likely to assign their performance deficits to insufficient ability
(outside of their control).
In another study by Peters and Kitsantas (2010), the successful instruction of the
nature of science over a two year period of time to 162 eighth-grade students was
examined. Students were separated into two groups. The experimental groups were
asked to engage in a very student-directed form of inquiry related to investigating
magnetism, static electricity, and current electricity. They were also given instruction in
and expected to use summarizing, think-aloud protocols, and the portion of the
Metacognitive Prompts Intervention – Science (MPI-S) that deals with self-monitoring.
This was composed of “(1) checklists for students to monitor their work, and (2) graphing
39
strategies to monitor the breadth of consideration of scientific processes” (p. 33). The
control groups were asked to investigate the same magnetic and electric concepts but
were not given any of the metacognitive or self-regulatory strategy instruction or
expectations. At the end of the study, students in both groups were asked to reflect on
whether the inquiry experience met nature of science standards (e.g. – I would be able to
understand my data table weeks or months from now; my rationale and conclusions
would be understandable to someone who did not do the experiment; my experiment
would be replicable based only on how I wrote my procedure) and whether they thought
they were asked whether the type of thinking they had to do during the investigation was
scientific. Those in the control groups said that the experience did not reflect true
scientific experiences and they had not been asked to think like real scientists. “The
students reported that the modules were too fun and creative to be associated with the
word ‘scientific’. They explained that the modules did not have enough strict directions
to be scientific” (p. 41). Therefore, the act of engaging in inquiry was not enough for
students to grasp the presence of or understanding of the components of the nature of
science in the investigation. To truly grasp this, students also needed to be exposed to
and expected to engage in scientific discussion, reflect on their performance, and revise
explanations – just as real scientists do.
As in the previous study, when asked to engage in self-reflection the “highly self-
regulated learners [in the experimental groups] attributed outcomes to strategy deficiency
rather than ability or effort, and [felt] more satisfied about their performance than naïve
self-regulated learners [in the control groups]” (p. 28).
40
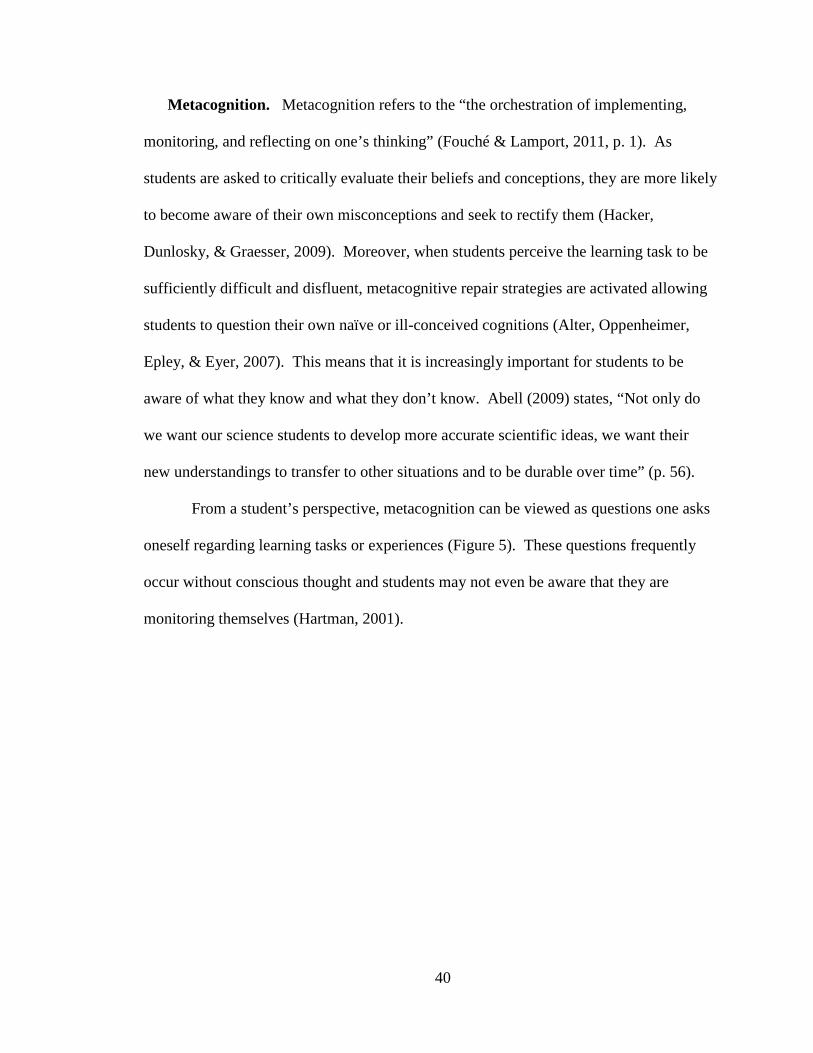
Metacognition. Metacognition refers to the “the orchestration of implementing,
monitoring, and reflecting on one’s thinking” (Fouché & Lamport, 2011, p. 1). As
students are asked to critically evaluate their beliefs and conceptions, they are more likely
to become aware of their own misconceptions and seek to rectify them (Hacker,
Dunlosky, & Graesser, 2009). Moreover, when students perceive the learning task to be
sufficiently difficult and disfluent, metacognitive repair strategies are activated allowing
students to question their own naïve or ill-conceived cognitions (Alter, Oppenheimer,
Epley, & Eyer, 2007). This means that it is increasingly important for students to be
aware of what they know and what they don’t know. Abell (2009) states, “Not only do
we want our science students to develop more accurate scientific ideas, we want their
new understandings to transfer to other situations and to be durable over time” (p. 56).
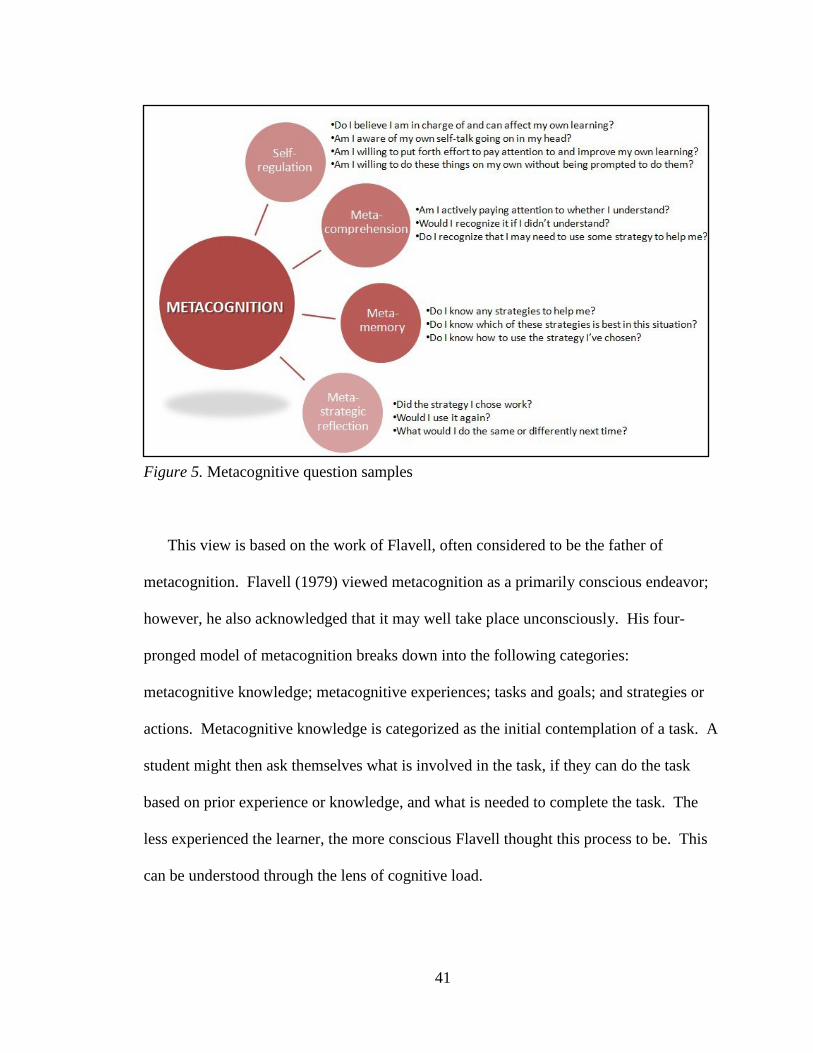
From a student’s perspective, metacognition can be viewed as questions one asks
oneself regarding learning tasks or experiences (Figure 5). These questions frequently
occur without conscious thought and students may not even be aware that they are
monitoring themselves (Hartman, 2001).
41
Figure 5. Metacognitive question samples
This view is based on the work of Flavell, often considered to be the father of
metacognition. Flavell (1979) viewed metacognition as a primarily conscious endeavor;
however, he also acknowledged that it may well take place unconsciously. His four-
pronged model of metacognition breaks down into the following categories:
metacognitive knowledge; metacognitive experiences; tasks and goals; and strategies or
actions. Metacognitive knowledge is categorized as the initial contemplation of a task. A
student might then ask themselves what is involved in the task, if they can do the task
based on prior experience or knowledge, and what is needed to complete the task. The
less experienced the learner, the more conscious Flavell thought this process to be. This
can be understood through the lens of cognitive load.
42
The use of metacognitive strategies can increase significantly the cognitive load
students must carry during investigations and group discussion. Cognitive load refers to
the working capacity of a student’s memory. A major tenet of cognitive load theories is
that our working memory is limited (Kirschner, 2002). The capacity of the working
memory must encompass the task and all associated functions relevant to it. The
demands placed upon the student by the task are almost always complicated by the
demands place upon the student by the instructional format. According to Bannert
(2002), “the basic idea is to reduce such external load in order to make available more
capacity for actual learning so that better learning and transfer performance is achieved”
(p. 139).
Cognitive load can be managed externally by the teacher. As such, the teacher
needs to understand the developmental level of the students and the cognitive load that
will be placed upon those students based on the instructional format chosen for the
lesson. Too little cognitive load and students may not engage fully in the lesson. Too
much cognitive load and students may become overwhelmed or frustrated and disengage.
Cognitive load is also managed internally by the student. When students lack a
sufficient mastery of task processes or content, the cognitive load required for those tasks
is increased. Because of this, students must make decisions about what and how much to
learn. Although they initially cause an increase in cognitive load, the use of
metacognitive strategies, when modeled and used repeatedly, become much more
automatic and eventually take up little working memory (Fouché & Lamport, 2011). The
added benefit of using metacognitive strategies is that they provide students with a
mechanism for monitoring their own internal cognitive load “pressure” gauge, giving
43
them a heads up that they are becoming frustrated or overwhelmed and providing them
with the opportunity to change strategies or seek help rather than simply disengaging.
Metacognition is central to critical thinking and problem-solving in the sciences. To
do so, the learner must have awareness of and control over their thoughts, processes, and
knowledge (Ku & Ho, 2010). Investigations into student use of metacognition often rely
on student self-reporting and this has traditionally been a concern (Ku & Ho, 2010). The
potential for inaccuracy may hinder the validity of any data gathered from studies that
rely on this method of data collection. One way to deal with this and help students
engage successfully in metacognitions related to critical thinking and problem-solving is
through the use of think-alouds. Think-alouds make covert processes visible and
capitalize on the language-centered and social nature of learning. In the context of the
science classroom which relies heavily on cooperative learning and discussion, the use of
think-alouds supports best practices.
In practice, think-alouds ask a participant to say everything they are thinking, why
they are thinking it, and anything else that is going on in their heads at the time of the
activity. However, it is done in such a way as to minimally interfere with the learning.
In other words, the think-alouds are the subordinate mechanism for eliciting student
understanding and do not supersede the learning experience itself due to concerns of
cognitive load. Studies conducted by Bannert and Mengelkamp (2008) and Veenman,
Elshout, and Groen (1993) both showed that the use of think-alouds in the context of the
learning activity did not detract from the learning activity itself.
In a small study by Ku and Ho (2010), ten students of similar cognitive ability and
educational performance were divided into two groups: a group that performed at the
44
high end of a previous critical thinking task, and a group that performed at the low end of
a previous critical thinking task. These students were chosen from a larger pool of 137
students who participated in an earlier critical thinking study. The participants in this
study were given six critical thinking prompts of which five were open-ended and
problem-based and the sixth required students to support their reasoning for choosing one
side of a controversial issue. The participants were then audiotaped and asked to
verbalize everything they were thinking during each of the six prompts. Responses were
coded for not only presence and type of metacognitive response but also the quality of
those responses. The high performing group showed significantly more use of
metacognitive responses and their metacognitive responses were of higher quality (e.g. –
I should identify the gap in logic related to the study design). The low performing group
did not respond metacognitively as often as the high performing group. Their think-
alouds were also characterized by low quality statements (e.g. – I think I’m supposed to
identify something here but I don’t know what it is).
These findings are similar to those typically seen when comparing novice and expert
learners (Bransford, et al., 2000; Dweck, 2006). According to Bransford, et al. (2000), a
chief distinguishing characteristic is that experts possess a considerable amount of
background knowledge that is organized or chunked for easy retrieval whereas novices
have modest background knowledge and find it difficult to retrieve the information when
it is required. Experts are able to identify patterns and pull meaning from situations,
reorganize a problem to fit their view of it, monitor their thinking, and will change
strategies if the current one is not successful. According to Dweck (2006), novices on the
other hand rarely look for patterns, find retrieval of information difficult, do not see
45
connections between bits of information, and lack task persistence. Novices spend less
time on a problem, wanting to get through it and move on.
There are broad implications for educational research within metacognitive contexts,
especially in the secondary sciences where the body of research is scarce. After spending
much of his career studying metacognition and self-regulation, Schunk (2008)
recommends that educational research in the area of metacognition and self-regulation
focus on several key areas including: “identify relevant theories, ensure that assessments
clearly reflect processes, link processes with academic outcomes, conduct more
educational developmental research, tie processes firmly with instructional methods” (p.
464). Therefore, studies that focus on these areas are warranted.
Locus of Control. Locus of control (LOC) refers to the perception of control over
(internal LOC), or a lack of control over (external LOC) one’s own learning (Baumeister,
Zell, & Tice, 2007). If students who are self-regulated have an internal LOC, they may
take greater responsibility for and ownership over their own learning, and may have
increased motivation to learn. Conversely, if students who are not self-regulated have an
external LOC, they may not take responsibility for or have ownership over their own
learning, and may have decreased motivation to learn (Kitsantas & Zimmerman, 2006).
The theoretical framework is situated in Rotter’s (1954, 1966) social learning
theory of personality, and Weiner’s (1980, 1986) attribution theory of motivation as it
relates to achievement in education. Each of these theories provides the foundation for
and insight into how students make sense of and interpret the world around them as well
as how they may respond to it. Rotter’s (1954, 1966) social learning theory of
personality is built upon the framework of locus of control (LOC), and refers to a
46
person’s perceived control or lack of control of reinforcements (Lefcourt, 1966). In other
words, LOC is “the tendency of people to ascribe achievements and failures either to
internal factors…or external factors” (Shepherd, Fitch, Owen, & Marshall, 2006, p. 318).
Internal LOC refers to a person’s belief that they are in control of their behavior and their
life through effort, ability, and motivation. External LOC refers to a person’s belief that
other people, their environment, a higher power, chance, or fate controls their decisions
or their lives. However, a person’s tendency is not necessarily toward one or the other;
rather, Rotter (1954) explains that internal and external LOC exist along a continuum. A
person’s LOC may also be contextual. For example, a student may hold a strongly
internal LOC related to their social studies class, a mildly internal LOC related to English
class, and a strongly external LOC related to science class.
The psychological theory that explains how individuals attribute responsibility for
what they do or do not achieve was developed by Weiner (1980, 1986) in his attribution
theory of motivation and achievement. This theory is based on three principles:
1. Attribution occurs in three stages: a behavior is observed, the individual perceives
the behavior to be deliberate, and the individual then attributes the behavior to
either internal or external causes.
2. Individuals attribute achievement to effort, ability, difficulty of the task, and luck
or chance.
3. Individuals perceive the cause of behavior to: locus of control (internal vs.
external), stability (how likely the event is to occur again with the same outcome),
and controllability (controllable vs. uncontrollable factors as they relate to the
event)
47
This theory helps to explain the differences between high-achieving students and low-
achieving students. For example, high achievers are thought to engage in tasks related to
succeeding because they attribute the potential for success to their own internal causes
(e.g. - effort, ability), while failure is attributed to external causes (e.g. – bad luck,
chance). Low achievers are thought to avoid tasks related to succeeding because they
attribute the potential outcome to external causes outside of their control.
In a study by Shepherd, Fitch, Owen, and Marshall (2006), 187 high school students,
aged 14 to 19 years, in three different cities in Kentucky were given the Nowicki-
Strickland Locus of Control Scale. The scale is a series of 40 dichotomous questions
answered in paper-pencil format. Higher scores on the scale indicate greater external
locus of control. Lower scores indicate greater internal locus of control. The students
were also asked to self-report their current grade point average. Regardless of ethnicity,
those students whose locus of control was increasingly external also had low grade point
averages.
In another study by Miller, Fitch, and Marshall (2003), 234 high school and middle
school students were given the Nowicki-Strickland Locus of Control Scale. The sample
population included students from the regular classroom setting and alternative classroom
settings. The alternative classroom settings were comprised of students whose problem
behaviors or attendance were such that they were removed from the regular academic
setting. Findings indicated that gender and ethnicity did not correlate to locus of control.
However, students with greater behavioral and attendance issues showed greater external
locus of control while those students with fewer behavioral and attendance problems
showed greater internal locus of control. No causal attributions were made; rather, it was
48
noted that students with greater behavioral or attendance problems often have a greater
amount of concurrent issues they may perceive as outside of their control (e.g. – quality
of home life, lack of resources or opportunities, absence of adult mentors) and may then
be overemphasized resulting in a greater external locus of control.
This has important implications for students of poverty. The stress of living in
poverty can have significant effects not only on their locus of control but also on a
student’s brain development. This altered brain development, in turn, can have
significant effects on achievement, emotional development, and decision making (Jensen,
2009). Poverty, early negative conditioning, and at-risk factors, primarily at home and at
school, have also been shown to affect adolescents’ world views and self-concepts. In
studies of juvenile delinquency, greater levels of poverty when accompanied by negative
conditioning and at-risk factors were significantly correlated to a greater external locus of
control (Bansal, et al., 2006; Borman & Rachuba, 2001; Kelley, 1996). In other words,
quantitative studies have suggested that as the level of negative risk factors increase,
including poverty, adolescents become even more likely to believe that the outcomes in
their lives are as a result of “other people, outside events, even fate and luck” (Kelley,
1996, p. 40). Each of these is associated with an external locus of control. However,
additional qualitative studies have the ability to shed new light on this phenomenon by
delving into the reasons behind why adolescents from impoverished and at-risk
backgrounds perceive their lived experiences the way they do and why they tend to hold
these beliefs. In turn, greater understanding may lead to targeted, successful academic
and social interventions aimed at mediating and mitigating students’ responses and
resiliency to these risk factors (Evans & Rosenbaum, 2008).
49
Summary
The information presented in this paper has painted a picture of poverty which
may be construed as negative. However, it should be noted that “poverty” refers to more
than socioeconomic status. As students increasingly do without – in other words, are
impoverished with regard to tangible and emotional resources – life becomes more
chaotic and, with increasing frequency and duration, the brain undergoes physical
changes that inhibit the development of certain regions of the brain related to response,
inhibition, and learning, especially during childhood (Gunnar, et al., 2009). Although
these negative conditions are more likely to occur in the homes of students from low
socioeconomic backgrounds, they can also occur in the homes of students from middle or
high socioeconomic backgrounds. Gorski (2008) points out that middle-class and upper-
class families may have problems that are equally if not more disturbing and impactful on
children and their education, and that is it not just the economically disadvantaged or
minority populations who struggle with these issues.
Therefore, instead of grappling with the value-laden trappings of a deficit model or
cultural competency model, it may be better for teachers to approach the concerns
discussed here from the viewpoint of best practices: communication of high
expectations; opportunities to be involved and invested in the school culture; positive,
mentoring relationships with students; effectively designed, collaborative discussion and
activities; rich questioning strategies; and instruction and opportunities for practice in
self-regulatory control and metacognitive strategy usage. Focusing on best practices for
all students, especially with regard to self-regulatory control and metacognitive
strategies, has been shown to improve the learning outcomes for students from all
50
backgrounds (Jensen, 2009; Rawlinson, 2011). More importantly, they effectively
mediate the income-achievement gap to non-significant levels (Evans & Rosenbaum,
2008). In this way, as teachers, we focus on what works and make use of inclusive
instruction regardless of a student’s background.
51
CHAPTER THREE: METHODOLOGY
Chapter Three contains the methodology used to conduct this study. It includes
an explanation of the study design, the participants and setting, the instrumentation, as
well as data collection and data analysis procedures.
Problem and Purpose of the Study
Students from low-SES backgrounds often lack the self-regulatory habits and
metacognitive strategies to improve academic performance. They classically exhibit low
task persistence, poor study skills, and do not engage in reflection related to performance
(Jensen, 2009). For low-achieving students, poor performance often becomes
reinforcing, especially in science, and may lead to disengagement, lack of motivation,
and further compromises the likelihood that they will fall further behind in science as
their schooling progresses (Ruby, 2006). Additionally, the non-algebra-ready, 9th-grade
students at the study site historically score 8-12% below the algebra-ready students in
Foundations of Physics. Standard remediation has not been successful in improving
these students’ assessment scores.
In an effort to improve students’ assessment scores and to increase student self-
regulation and metacognition with regard to achievement in Foundations of Physics, this
study will investigate the use of metacognitive and self-regulatory strategies specifically
as they relate to students’ assessment data. Traditionally, student performance data is
used by adults to inform instructional and curricular decisions. However, students are
rarely given or asked to evaluate their own performance data. Moreover, students are not
shown how to use this data to plan for or inform their own learning. As one may then
expect, there is a corresponding gap in the existing literature with regard to instructing
52
students to use their own data to inform their own learning, especially in the secondary
sciences.
Research Design
Rationale. This study utilized a nonequivalent control group design to identify
whether, and to what extent, the use of metacognitive and self-regulatory strategies
improve science assessment scores for low-SES students in the secondary science
classroom. This design, including stratification and multiple control groups, was used to
allow for a more robust study, to address potential threats to study validity, and to
minimize the potential for type I and type II error. When carried out properly, a non-
equivalent control group design with multiple control groups “effectively controls for the
eight threats to internal validity originally identified by Campbell and Stanley: history,
maturation, testing, instrumentation, statistical regression, differential selection,
experimental mortality, and selection-maturation interaction” (Gall, Gall, & Borg, 2007,
p. 405).
Multiple control groups were used to control for the potential threat that the
results were due to individual teachers rather than the treatment. Although the algebra-
based physics curriculum being delivered to participants is the same across all teachers at
the 9th-grade level, it is reasonable to assume that some differences in teachers will exist.
If control groups showed similar achievement scores as compared to the treatment
groups, study validity will have been be improved.
The stratified element was included to more accurately identify the growth of
different student populations, specifically algebra-ready and non-algebra-ready students.
While higher-level learners naturally engage in many components of metacognitive
53
strategy use, lower-level learners generally do not (Zohar & Ben-David, 2008). In a
report by the National Research Council (Duschl, Schweingruber, & Shouse, 2007), the
council recommends that metacognitively guided instruction be used regularly in the
science classroom. The council reports that lower-level learners generally do not
inherently use or are even aware of metacognitive or self-regulatory strategies, much like
poor readers are not aware of and do not inherently use effective reading strategies.
Larger achievement gains from this type of instruction have been reported for lower-level
learners than have been reported for their higher-level peers (Zohar & Peled, 2008). In
the researcher’s school, a consistent 8-12% difference has existed for the past three years
between the average science assessment scores of lower-level math students, and the
average science assessment scores of higher-level math students; therefore, a stratified
design may more accurately identify which sub-group showed the greatest response to the
treatment based on a growth model for learning.
Design Elements. A non-equivalent control group design, was utilized to provide
a more robust study, to address potential threats to study validity, and to minimize the
potential for type I and type II error. Following this study design an end-of-chapter,
cumulative assessment was given for Chapter 1-4 and was the pretest. This pretest was
the same test given as the posttest. Achievement scores on this assessment set the
baseline for all sub-groups. The pretest was followed by direct, intentional instruction
and use of metacognitive and self-regulatory strategies. This was followed by
cumulative, end-of-chapter exams at the end of Chapter 2 and Chapter 3 and
accompanied by additional instruction of the study strategies. Although these exam
scores were not evaluated for the purposes of this study, the treatment still occurred after
54
each exam was given.
Finally, there was an end-of-chapter exam for Chapters 1- 4 (mid-term exam) and
was the posttest. Data collection occurred after the pretest and posttest. These exams
were cumulative and common among all teachers in the study. They were given as
computer-scored, multiple-choice exams and given by all teachers of the course.
End-of-Chapter Exams. The pretest was given at the end of Chapter 1 and set
the baseline for the study. It included content for Chapters 1-4. This same test was given
as the posttest at the end of Chapter 4 and was also considered the mid-term for the
course. In between the pre and posttest, a Chapter 2 exam and Chapter 3 exam were
given. All students took the same exams on the same days. Each exam was an end-of-
chapter exam and was cumulative in nature, meaning that the Chapter 2 exam contained
all content from Chapters 1 & 2, the Chapter 3 exam contained all content from Chapters
1, 2, & 3…etc. Each exam had two to four questions per section of content evaluated on
that exam (e.g. – chapter 3 had three sections: 3.1, 3.2, and 3.3 – each section of content
on the exam had no less than two and no more than four questions evaluating that
content).
Control Groups. Control group elements were as follows:
- Two, 45 minute sessions after each of four end-of-chapter exams
- Sessions included a general review of exam answers and then practice with
general nature of science content (graphing, experimental design, data
analysis). These general nature of science topics were not included in the end-
of-chapter exams but were applicable to the course overall.
55
Experimental Groups. Experimental group elements were as follows
(Appendix F):
- Two, 45-minute sessions immediately after each of four end-of-chapter exams
& part of a 45-minute period one week prior to the next exam.
- Sessions immediately after the exam included the following components:
General review of exam answers followed by think-alouds related to
why students chose wrong answers. Think-aloud sessions occurred as
a large group during each class and individually with students as
needed. It was important to foster an environment of acceptance and
support so that students felt open to sharing mistakes. An environment
that focuses on correct answers is not conducive to this methodology.
Students completed diagnostic sheets of content performance by
chapter and section (Figure 6). These diagnostic sheets helped
students determine for themselves how they performed in each section
of content and provided a foundation for what they needed to study for
the next exam. The front of the diagnostic sheet was linked to the test
questions. The back of the diagnostic sheet was linked to the learning
objectives for the course. In this way, students were able to use the
diagnostic sheet results to easily see what they did well on and what
they still needed to work on.
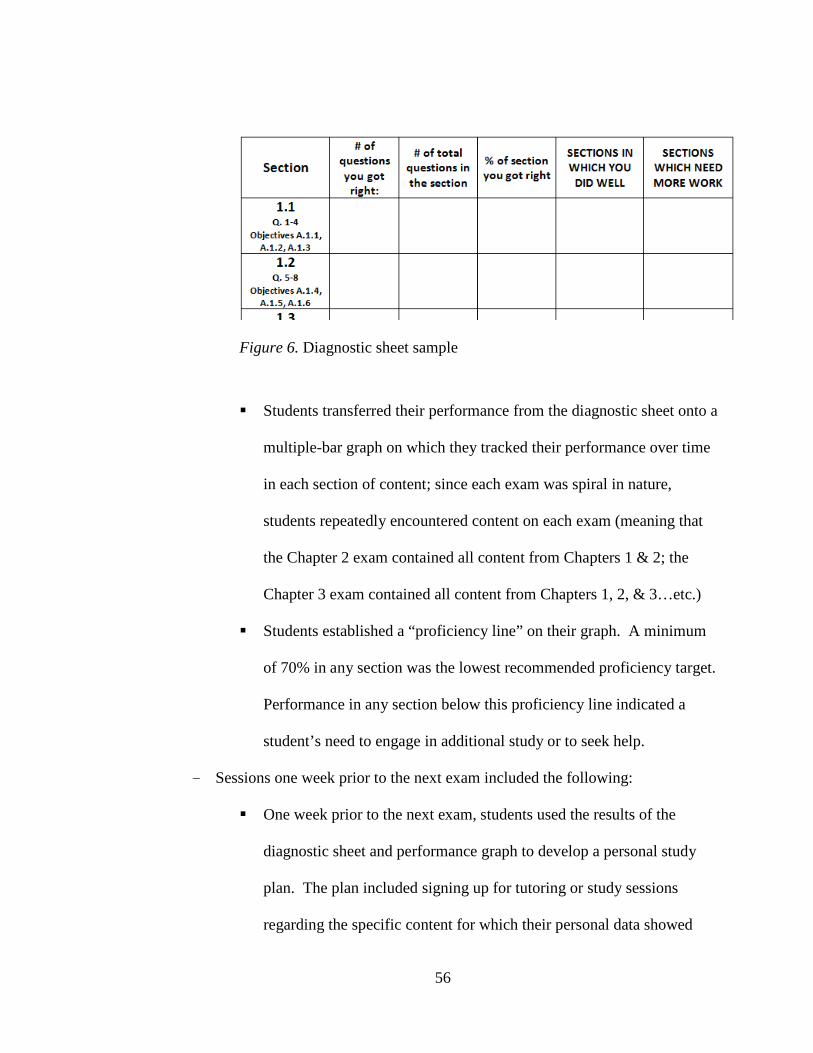
56
Figure 6. Diagnostic sheet sample Students transferred their performance from the diagnostic sheet onto a
multiple-bar graph on which they tracked their performance over time
in each section of content; since each exam was spiral in nature,
students repeatedly encountered content on each exam (meaning that
the Chapter 2 exam contained all content from Chapters 1 & 2; the
Chapter 3 exam contained all content from Chapters 1, 2, & 3…etc.)
Students established a “proficiency line” on their graph. A minimum
of 70% in any section was the lowest recommended proficiency target.
Performance in any section below this proficiency line indicated a
student’s need to engage in additional study or to seek help.
- Sessions one week prior to the next exam included the following:
One week prior to the next exam, students used the results of the
diagnostic sheet and performance graph to develop a personal study
plan. The plan included signing up for tutoring or study sessions
regarding the specific content for which their personal data showed
57
they needed assistance. These tutoring sessions were open, meaning
that they were available to all students whether they were in the
control or experimental groups. Participation in these sessions was
completely voluntary for all students. Students were also given the
opportunity to discuss their personal study plan with the instructor.
Professional Development. The literature regarding successful professional
development for science teachers indicates that the PD must have three components:
1) high quality, clear instruction of the strategy; 2) regular support to ensure proper and
regular use of the strategy; and 3) “pressure” to use the strategy properly (Snow-Renner
& Lauer, 2005). Therefore, this study included the following:
- ½ day of professional development in the use of the study strategies and procedures
prior to the start of the study (Appendix E).
- Regular support for teachers during assessment diagnostics sessions during and after
E1-E4, including learning objective results from each exam at the class level and
question/answer/ clarification sessions with the study developer.
- Teacher held accountable for performance through yearly evaluation by content
supervisor which will include their involvement in this study. For clarification, the
evaluations were tied to the proper data collection on exams, the adjustment of
instruction and tutoring based on the data, and proper adherence to the metacognitive
and self-regulatory strategy instruction. Evaluation was not tied to whether students
in the experimental group have shown statistically significant growth. This was done
to minimize the chance that teachers would purposefully improve the outcome of the
study; rather, it improved the likelihood that teachers would use the study strategies
58
and procedures with fidelity.
Questions and Hypotheses
RQ–What is the effect of metacognitive and self-regulatory strategy use on
pretest/posttest achievement in a 9th-grade physics class for residential students
from low-SES backgrounds?
HO1 - There will be no significant difference in achievement of students in classes
which use metacognitive and self-regulatory strategies as compared to
students in classes which do not use these strategies, as shown by scores on a
pretest/posttest assessment.
HO2 - There will be no significant difference in achievement of algebra-ready
students in classes which use metacognitive and self-regulatory strategies as
compared to algebra-ready students in classes which do not use these
strategies, as shown by scores on a pretest/posttest assessment.
HO3 - There will be no significant difference in achievement of non-algebra-ready
students in classes which use metacognitive and self-regulatory strategies as
compared to non-algebra-ready students in classes which do not use these
strategies, as shown by scores on a pretest/posttest assessment.
Participants and Setting
The population consisted of all students (N = 215) taking the 9th-grade
Foundations of Physics course at a small, residential high school for deeply impoverished
students in the northeastern United States. These students are typical representations of
those admitted to private, residential schools for low-SES students. However, this
population is not representative of low-SES student populations in general. Because this
59
sample is based in residential education, many confounding factors (e.g. – diet, exercise,
supervision, health care, sleep, environmental conditions, and access to resources) are
greatly controlled compared to non-residential populations. Therefore, the study
population is representative of low-SES residential populations. However, it is not
representative of non-residential, low-SES populations.
The students at the study sight are enrolled based on selective criteria set forth in
the enrollment process. Students are enrolled exclusively from families in extreme
poverty and social need from select communities across the country, creating a
homogeneous study population with regard to background and life experience. Students
are approximately 50% minority/50% Caucasian and approximately 50% female/50%
male. The largest group of students enrolled on campus arrives in 9th grade. Since this is
the same group of students with which this study was conducted, it should be noted that,
prior to enrollment, a large portion of these students have significant educational gaps
due to high rates of truancy, poor or non-existent supervision, abuse, neglect, transience,
and lack of access to resources. A small percentage of students do not make a successful
shift to the highly structured and supervised culture of the residential and academic
programs on campus and will dis-enroll; however, dis-enrollment is lower ,on average,
than at public schools.
Stratified, cluster sampling was used in this study as follows. Students were
divided into Foundations of Physics course sections by math level: non-algebra-ready
students were placed in a supported algebra class, while algebra-ready students were
placed in a regular algebra or geometry class. Students were further grouped by teacher.
At least 30 students were included in each sub-group within the study where possible.
60
However, the number of students placed into various math levels floats one or two
sections in either direction each year depending on the composition of that year’s
students. Therefore, study sub-group numbers in the non-algebra-ready control and
treatment groups ended up falling below 30 participants: 19 in the control group and 24
in the treatment group respectively. The algebra-ready control group contained 69
participants while the algebra-ready treatment group contained 100 participants
respectively. Control group and treatment group numbers at the various math levels were
kept as even as possible given the constraints of existing class size and number of
enrolled students qualifying for each math level of the course. In total, 215 participants
took part in the entire study.
Instrumentation
An achievement measure was designed and validated for this study. The
multiple-choice, end-of-chapter, cumulative assessment was used as both the pretest and
the posttest. It consisted of 35 multiple-choice questions. The exam represented 12
sections of content in four chapters of the text used in the 9th grade Foundations of
Physics course: measurement, velocity, acceleration, and circular motion. Each section
was comprised of two to four questions that were representative of the domain of interest
for that section.
The reliability for the assessment at the time of the study scored .822 on the
Kuder Richardson coefficient of reliability for binary data (KR20) over three prior
administrations of the exam to a total of approximately 650 students. The KR20 values
for tests should be .8 or higher (Kehoe, 1995). A KR20 is appropriate for use in
calculating reliability statistics for multiple-choice exams because their answers can be
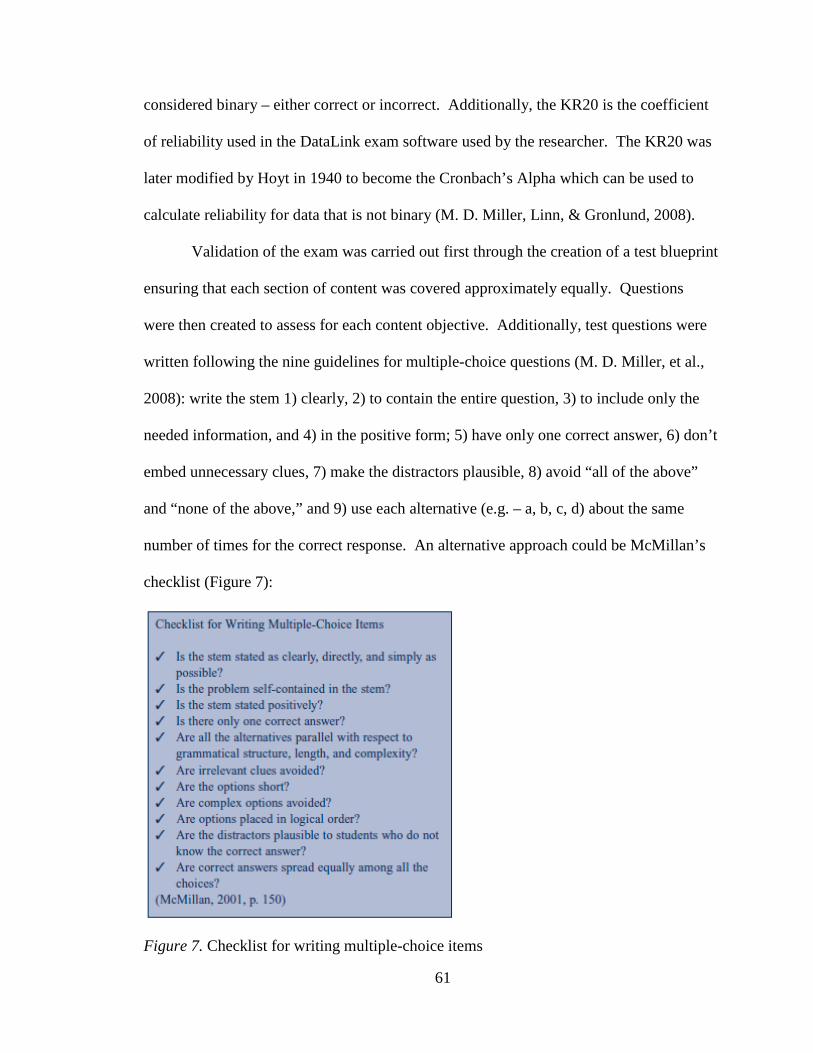
61
considered binary – either correct or incorrect. Additionally, the KR20 is the coefficient
of reliability used in the DataLink exam software used by the researcher. The KR20 was
later modified by Hoyt in 1940 to become the Cronbach’s Alpha which can be used to
calculate reliability for data that is not binary (M. D. Miller, Linn, & Gronlund, 2008).
Validation of the exam was carried out first through the creation of a test blueprint
ensuring that each section of content was covered approximately equally. Questions
were then created to assess for each content objective. Additionally, test questions were
written following the nine guidelines for multiple-choice questions (M. D. Miller, et al.,
2008): write the stem 1) clearly, 2) to contain the entire question, 3) to include only the
needed information, and 4) in the positive form; 5) have only one correct answer, 6) don’t
embed unnecessary clues, 7) make the distractors plausible, 8) avoid “all of the above”
and “none of the above,” and 9) use each alternative (e.g. – a, b, c, d) about the same
number of times for the correct response. An alternative approach could be McMillan’s
checklist (Figure 7):
Figure 7. Checklist for writing multiple-choice items
62
Measurements of discrimination and difficulty for each individual test item were
also calculated. Item discrimination was measured with a point-biserial correlation (rpbi).
rpbi is the ratio of the student’s overall score on the exam to the student’s score on a
particular item. Positive rpbi values indicate that students who answered an individual
question correctly also had higher overall test scores. Negative rpbi values indicate the
opposite and also indicate a reduction of test reliability. A target rpbi value of .15 or
higher is desirable for each item on the exam (Kehoe, 1995).
Item difficulty was measured using an index of difficulty. The index of difficulty
is simply a measure of the percentage of students who answered a particular question
incorrectly. For multiple-choice items with three, four, or five choices, an index of
difficulty of approximately 60% is desirable (Wells & Wollack, 2003).
Procedures
Due to the residential nature of the study site campus, parent/sponsors have
provided full legal rights to the school allowing them to make educational and care
decisions for all students while enrolled at the school. The school’s Office of Applied
Research and Evaluation (OARE) oversees all studies on campus to ensure that student
safety and confidentiality are maintained and that the school’s educational programming
is not interrupted. OARE approval and oversight is required for all studies conducted on
campus. Additionally, OARE approval is legally equivalent to parental consent.
Approval for the study from the Director of Applied Research at the OARE was granted
without hesitation, stating that the study goals are well aligned with the organization’s
goals for high quality instructional methods, and that the study fell within the purview of

63
a teacher’s regular job description.
Additionally, the study design was conducted as a pilot study and for action
research for the past three years at the study site. It is already accepted practice at the
school at the 9th grade level and is now being considered for inclusion across grades 9-12.
Data Analysis Procedures
Exam scoring was done automatically through the use of Scantron sheets and
linked to core course content through DataLink software by Apperson. Reports detailing
individual question results were also run. Additionally, individual test items were linked
through the software to course objectives and state eligible content. Reports were then
run that detailed student achievement at these levels. Further data analysis was
conducted at several levels of specificity allowing teachers to provide tutoring based on
those results.
Study data was evaluated using the Statistical Package for the Social Sciences
(SPSS) version 21. An ANCOVA was conducted to evaluate the null hypotheses for the
sub-groups within the control and treatment groups to evaluate the effectiveness of the
intervention as measured by posttest performance while controlling for pretest
performance. “ANCOVA is a control technique used in causal-comparative studies in
which already formed, not necessarily equal groups are involved. [It] essentially 1)
adjusts posttest scores for initial differences on some variable and compares adjusted
scores, 2) increases the power of a statistical test by reducing within-group (error)
variance. Although increasing sample size also increases power, the researcher is often
limited to samples of a given size because of financial and practical reasons” (Ouyang,
2010, section 17). The null hypotheses were evaluated at the p < 0.05 level of

64
significance. The ANCOVA was conducted using posttest scores as the dependent
variable, pretest scores as the covariate, and treatment or control group as the fixed
factor. The results were evaluated at the overall, algebra-ready, and non-algebra-ready
levels.
65
CHAPTER FOUR: RESULTS
Chapter Four contains a presentation of the data analysis for this study as well as
a restatement of the purpose, research question, and hypotheses. As stated in Chapter
One, the purpose of this nonequivalent control group design study is to evaluate the
effectiveness of metacognitive and self-regulatory strategy use on assessment
achievement of 9th-grade, residential physics students from low-SES backgrounds. The
independent variable was the presence or absence of the treatment which included
metacognitive and self-regulatory strategy instruction. The dependent variable was
performance on a teacher-made, multiple-choice pretest/posttest. The research question
and hypotheses for this study are as follows:
RQ–What is the effect of metacognitive and self-regulatory strategy use on
pretest/posttest achievement in a 9th-grade physics class for residential students
from low-SES backgrounds?
HO1 - There will be no significant difference in achievement of students in classes
which use metacognitive and self-regulatory strategies as compared to
students in classes which do not use these strategies, as shown by scores on a
pretest/posttest assessment.
HO2 - There will be no significant difference in achievement of algebra-ready
students in classes which use metacognitive and self-regulatory strategies as
compared to algebra-ready students in classes which do not use these
strategies, as shown by scores on a pretest/posttest assessment.
HO3 - There will be no significant difference in achievement of non-algebra-ready
students in classes which use metacognitive and self-regulatory strategies as
66
compared to non-algebra-ready students in classes which do not use these
strategies, as shown by scores on a pretest/posttest assessment.
Descriptive Statistical Analysis
A total of 215 students took part in the study. The sample consisted of 53%
female and 47% male participants. Approximately 38% of the participants were reported
as Caucasian with 62% of the participants were reported as minority. All students in the
study came from backgrounds of extreme poverty. For hypothesis one, 89 students were
in the overall control group and 126 students were in the treatment group. For hypothesis
two, the algebra-ready control sub-group contained 69 participants while the algebra-
ready treatment sub-group contained 100 participants respectively. The number of
students placed into various math levels floats one or two sections in either direction each
year depending on the composition of that year’s students. Therefore, hypothesis three
study sub-group numbers in the non-algebra-ready control and treatment sub-groups
ended up falling below 30 participants: 19 in the control sub-group and 25 in the
treatment sub-group respectively. Control group and treatment group numbers at the
various math levels were kept as even as possible given the constraints of existing class
sizes and number of enrolled students qualifying for each math level of the course.
Sixteen participants’ scores were removed from the original study either because
they dis-enrolled during the period of time the study was conducted or, alternatively,
because they enrolled during the period of time the study was being conducted, resulting
in 217 remaining participants present for the entire study. An additional two students
were removed from the study because, at the time of the study, their enrollment at the
school was under review due to significant emotional and behavioral issues which had a
decided impact on their classroom performance. Both of these students’ posttest
67
performances were significantly lower than their pretest performances because they
declined to engage meaningfully in the posttest. In other words, these two students
declined to answer many of the questions on the posttest and intentionally failed it. This
is not an uncommon phenomenon at the study site, as some students remove themselves
as much as possible from engaging in the learning environment as a way of accelerating
their removal from the residential program and returning to their home of origin.
A common sense approach to evaluation of the study data was employed to
remove the scores of these two students, treating their scores as outliers. According to
Seo (2006), “Outliers can be caused by incorrect measurements, including data entry
errors, or by coming from a different population than the rest of the data (p. 1).
According to Osborne and Overbay (2004),
1) Outliers increase error variance and negatively impact the observed power of a
study
2) Outliers affect the chances of making Type I or Type II errors and can
negatively impact normality
3) Outliers can influence statistical estimates or create unintended bias
The scores of the two students who purposefully failed the posttest were
considered outliers given that they are part of a different population, and are not part of
the intended population being investigated by this study; therefore, their scores were
removed. This resulted in the final tally of 215 participants used in the data analyses for
this study.
An ANCOVA was used to evaluate the null hypotheses for this study.
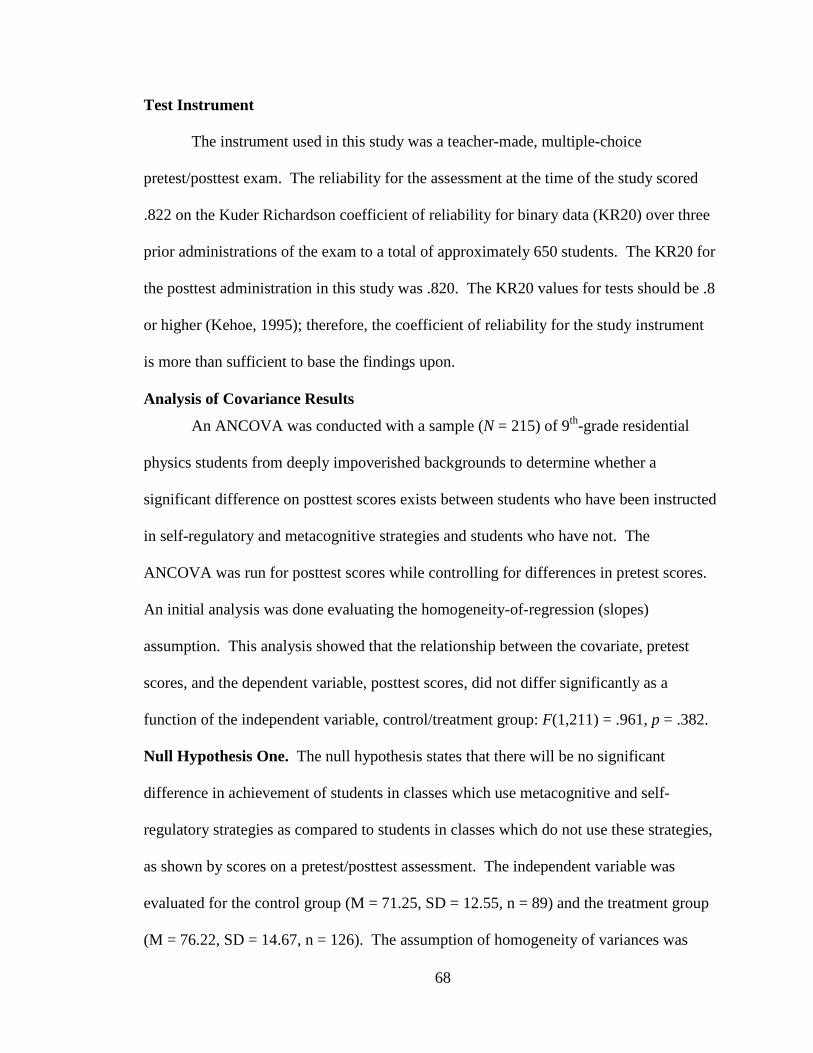
68
Test Instrument
The instrument used in this study was a teacher-made, multiple-choice
pretest/posttest exam. The reliability for the assessment at the time of the study scored
.822 on the Kuder Richardson coefficient of reliability for binary data (KR20) over three
prior administrations of the exam to a total of approximately 650 students. The KR20 for
the posttest administration in this study was .820. The KR20 values for tests should be .8
or higher (Kehoe, 1995); therefore, the coefficient of reliability for the study instrument
is more than sufficient to base the findings upon.
Analysis of Covariance Results
An ANCOVA was conducted with a sample (N = 215) of 9th-grade residential
physics students from deeply impoverished backgrounds to determine whether a
significant difference on posttest scores exists between students who have been instructed
in self-regulatory and metacognitive strategies and students who have not. The
ANCOVA was run for posttest scores while controlling for differences in pretest scores.
An initial analysis was done evaluating the homogeneity-of-regression (slopes)
assumption. This analysis showed that the relationship between the covariate, pretest
scores, and the dependent variable, posttest scores, did not differ significantly as a
function of the independent variable, control/treatment group: F(1,211) = .961, p = .382.
Null Hypothesis One. The null hypothesis states that there will be no significant
difference in achievement of students in classes which use metacognitive and self-
regulatory strategies as compared to students in classes which do not use these strategies,
as shown by scores on a pretest/posttest assessment. The independent variable was
evaluated for the control group (M = 71.25, SD = 12.55, n = 89) and the treatment group
(M = 76.22, SD = 14.67, n = 126). The assumption of homogeneity of variances was
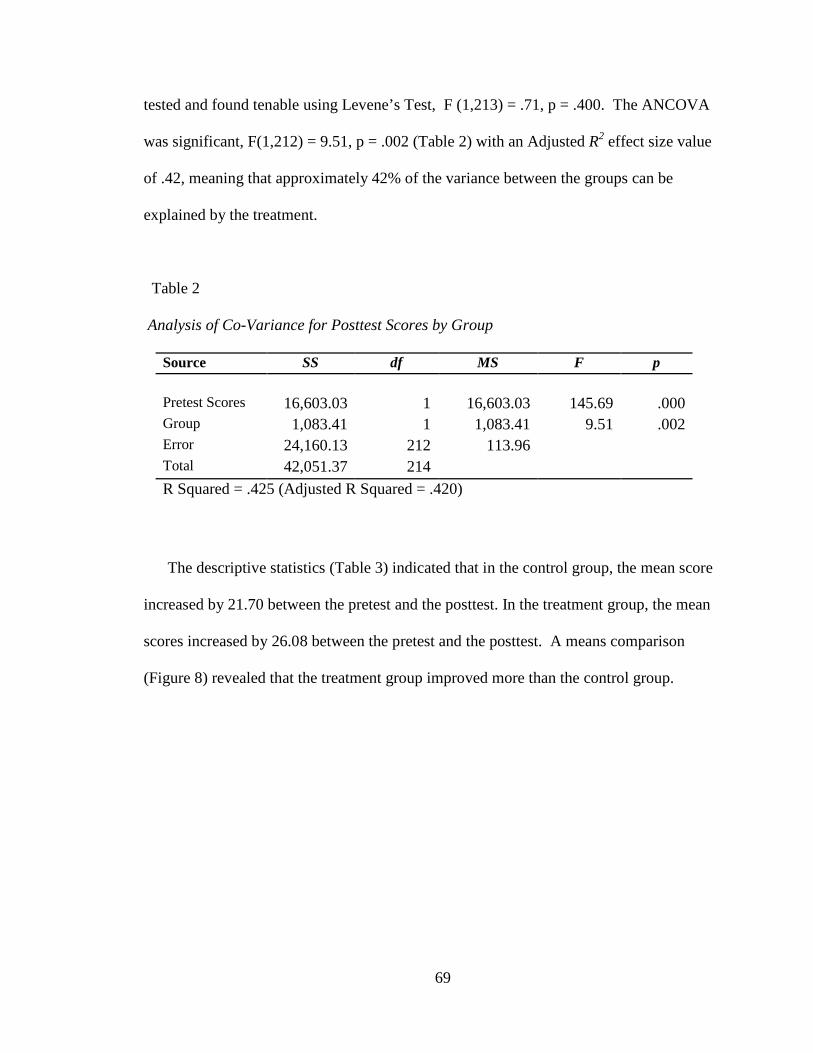
69
tested and found tenable using Levene’s Test, F (1,213) = .71, p = .400. The ANCOVA
was significant, F(1,212) = 9.51, p = .002 (Table 2) with an Adjusted R2 effect size value
of .42, meaning that approximately 42% of the variance between the groups can be
explained by the treatment.
Table 2
Analysis of Co-Variance for Posttest Scores by Group
Source SS df MS F p Pretest Scores 16,603.03 1 16,603.03 145.69 .000 Group 1,083.41 1 1,083.41 9.51 .002 Error 24,160.13 212 113.96 Total 42,051.37 214 R Squared = .425 (Adjusted R Squared = .420)
The descriptive statistics (Table 3) indicated that in the control group, the mean score
increased by 21.70 between the pretest and the posttest. In the treatment group, the mean
scores increased by 26.08 between the pretest and the posttest. A means comparison
(Figure 8) revealed that the treatment group improved more than the control group.
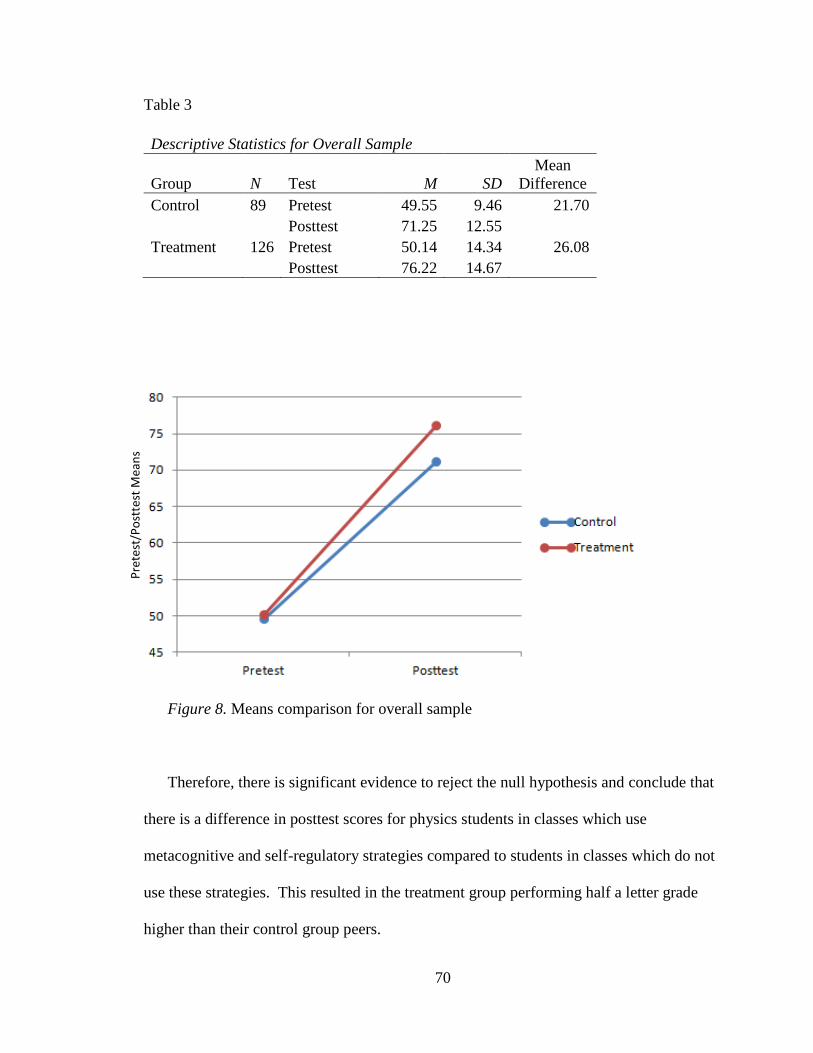
70
Table 3
Descriptive Statistics for Overall Sample
Group N Test M SD Mean
Difference Control 89 Pretest 49.55 9.46 21.70
Posttest 71.25 12.55
Treatment 126 Pretest 50.14 14.34 26.08 Posttest 76.22 14.67
Figure 8. Means comparison for overall sample
Therefore, there is significant evidence to reject the null hypothesis and conclude that
there is a difference in posttest scores for physics students in classes which use
metacognitive and self-regulatory strategies compared to students in classes which do not
use these strategies. This resulted in the treatment group performing half a letter grade
higher than their control group peers.
Pret
est/
Post
test
Mea
ns

71
Null Hypothesis Two. The null hypothesis states that there will be no significant
difference in achievement of algebra-ready students in classes which use metacognitive
and self-regulatory strategies as compared to algebra-ready students in classes which do
not use these strategies, as shown by scores on a pretest/posttest assessment. The
independent variable was evaluated for the control group (M = 72.91, SD = 12.02, n =
69) and the treatment group (M = 80.21, SD = 12.19, n = 101). The assumption of
homogeneity of variances was tested and found tenable using Levene’s Test, F (1,168) =
1.10, p = .295. The ANCOVA was significant, F(1,167) = 12.12, p = .001 (Table 4) with
an Adjusted R2 effect size value of .32, meaning that approximately 32% of the variance
between the groups can be explained by the treatment.
Table 4
Analysis of Co-Variance for Posttest Scores by Group – Algebra-Ready
Source SS df MS F p Pretest Scores 6,584.44 1 6,584.44 60.78 .000 Group 1,313.41 1 1,313.41 12.12 .001 Error 18,090.73 167 108.33 Total 26,858.19 169 R Squared = .326 (Adjusted R Squared = .318)
The descriptive statistics (Table 5) indicated that in the control group, the mean score
increased by 21.70 between the pretest and the posttest. In the treatment group, the mean
scores increased by 26.08 between the pretest and the posttest. A means comparison
(Figure 9) reveals that the treatment group improved more than the control group.
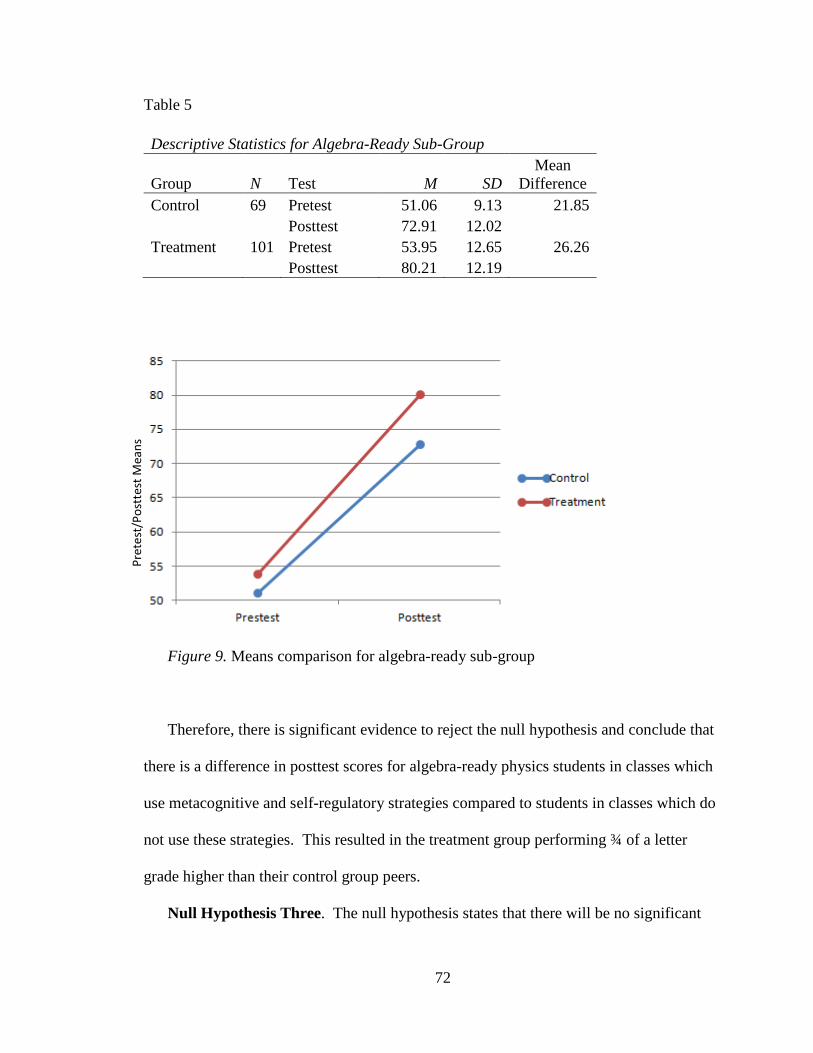
72
Table 5
Descriptive Statistics for Algebra-Ready Sub-Group
Group N Test M SD Mean
Difference Control 69 Pretest 51.06 9.13 21.85
Posttest 72.91 12.02
Treatment 101 Pretest 53.95 12.65 26.26 Posttest 80.21 12.19
Figure 9. Means comparison for algebra-ready sub-group
Therefore, there is significant evidence to reject the null hypothesis and conclude that
there is a difference in posttest scores for algebra-ready physics students in classes which
use metacognitive and self-regulatory strategies compared to students in classes which do
not use these strategies. This resulted in the treatment group performing ¾ of a letter
grade higher than their control group peers.
Null Hypothesis Three. The null hypothesis states that there will be no significant
Pret
est/
Post
test
Mea
ns
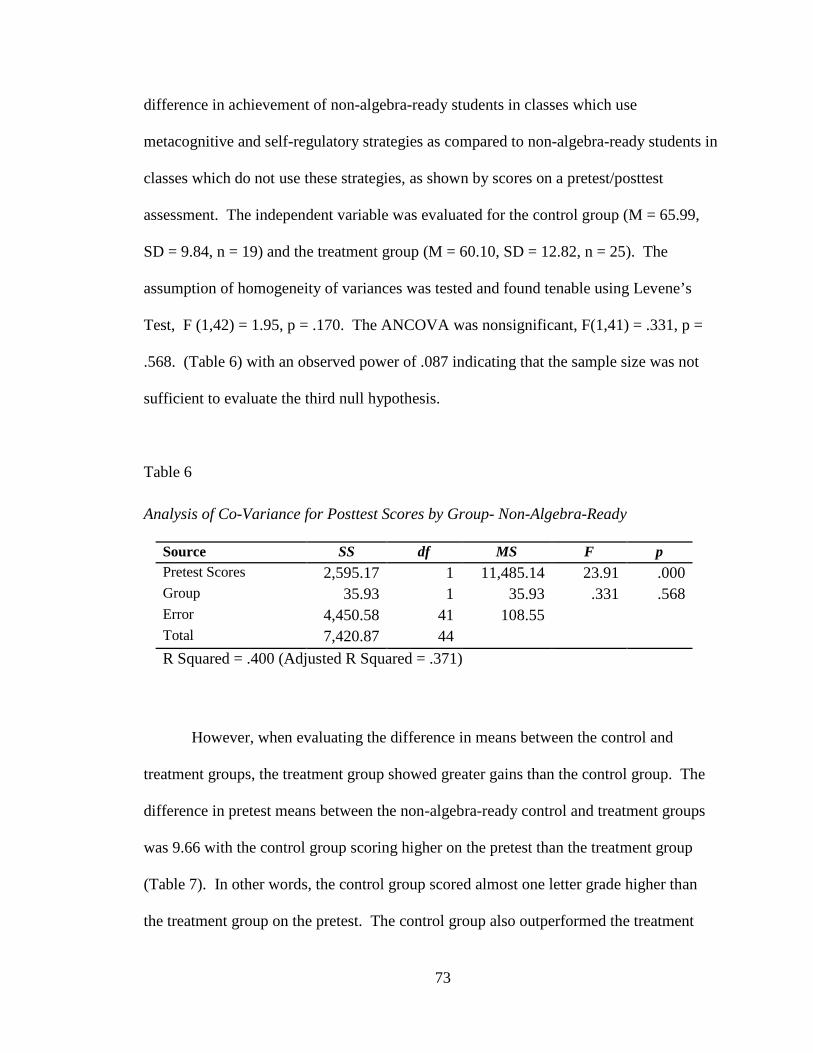
73
difference in achievement of non-algebra-ready students in classes which use
metacognitive and self-regulatory strategies as compared to non-algebra-ready students in
classes which do not use these strategies, as shown by scores on a pretest/posttest
assessment. The independent variable was evaluated for the control group (M = 65.99,
SD = 9.84, n = 19) and the treatment group (M = 60.10, SD = 12.82, n = 25). The
assumption of homogeneity of variances was tested and found tenable using Levene’s
Test, F (1,42) = 1.95, p = .170. The ANCOVA was nonsignificant, F(1,41) = .331, p =
.568. (Table 6) with an observed power of .087 indicating that the sample size was not
sufficient to evaluate the third null hypothesis.
Table 6 Analysis of Co-Variance for Posttest Scores by Group- Non-Algebra-Ready
Source SS df MS F p Pretest Scores 2,595.17 1 11,485.14 23.91 .000 Group 35.93 1 35.93 .331 .568 Error 4,450.58 41 108.55 Total 7,420.87 44 R Squared = .400 (Adjusted R Squared = .371)
However, when evaluating the difference in means between the control and
treatment groups, the treatment group showed greater gains than the control group. The
difference in pretest means between the non-algebra-ready control and treatment groups
was 9.66 with the control group scoring higher on the pretest than the treatment group
(Table 7). In other words, the control group scored almost one letter grade higher than
the treatment group on the pretest. The control group also outperformed the treatment
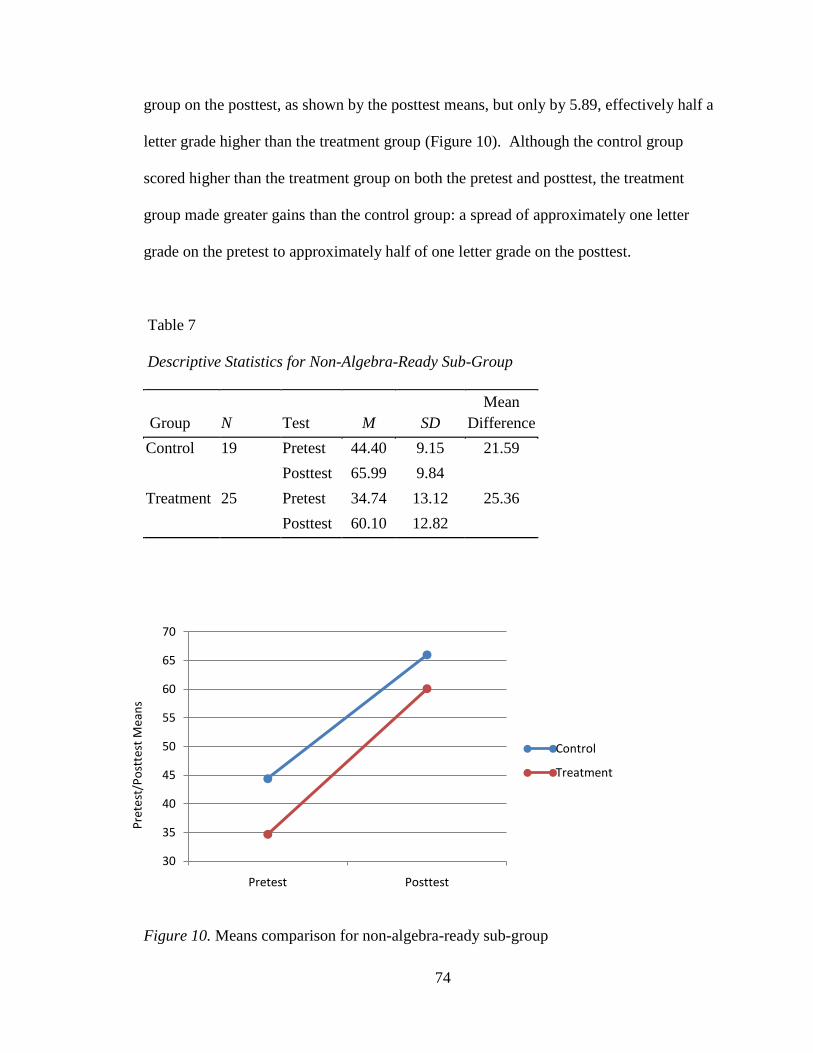
74
group on the posttest, as shown by the posttest means, but only by 5.89, effectively half a
letter grade higher than the treatment group (Figure 10). Although the control group
scored higher than the treatment group on both the pretest and posttest, the treatment
group made greater gains than the control group: a spread of approximately one letter
grade on the pretest to approximately half of one letter grade on the posttest.
Table 7
Descriptive Statistics for Non-Algebra-Ready Sub-Group
Group N Test M
SD
Mean Difference
Control 19 Pretest 44.40 9.15 21.59 Posttest 65.99 9.84
Treatment 25 Pretest 34.74 13.12 25.36 Posttest 60.10 12.82
Figure 10. Means comparison for non-algebra-ready sub-group
30
35
40
45
50
55
60
65
70
Pretest Posttest
Control
Treatment
Pret
est/
Post
test
Mea
ns
75
Therefore, although there was insufficient statistical evidence to reject the null
hypothesis due to the small sample size and low statistical power, there was greater
improvement in the treatment group than the control group. A further discussion of
Hypothesis Three will be conducted in Chapter Five.
Summary
Chapter Four provided a detailed report of the statistical measures and analyses
used for this study. The data were analyzed using SPSS Version 21 to perform an
ANCOVA for hypotheses one (overall results), two (algebra-ready sub-group),
hypothesis three (non-algebra-ready sub-group). The null hypotheses were rejected for
hypotheses one and two; however, the null hypothesis for hypothesis three could not be
rejected. Although the control group did outperform the treatment group for hypothesis
three, the treatment group showed greater improvement than the control.
76
CHAPTER FIVE: DISCUSSION
This chapter summarizes the findings from this study and an interpretation of the
results as well as a discussion of the implications, limitations, and recommendations for
further research.
Summary
The purpose of this nonequivalent control group design study was to evaluate the
effectiveness of metacognitive and self-regulatory strategy use on assessment
achievement of 215 9th-grade, residential physics students from low-SES backgrounds.
The data for the hypotheses were analyzed using an ANCOVA. Results indicated that
the use of metacognitive and self-regulatory strategies improve student achievement in
the treatment groups for the overall sample and the algebra-ready sub-group. A
nonsignificant effect was seen for the non-algebra-ready sub-group; however, the non-
algebra-ready treatment group did make greater gains than the non-algebra-ready control
group.
Null Hypothesis One. Null hypothesis one stated: There will be no significant
difference in achievement of students in classes which use metacognitive and self-
regulatory strategies as compared to students in classes which do not use these strategies,
as shown by scores on a pretest/posttest assessment. Results indicated that students in the
treatment group outperformed students in the control group for the overall sample (p =
.002, Adjusted R2 = .42); therefore, there was significant evidence to reject the null
hypothesis.
Null Hypothesis Two. Null hypothesis two stated: There will be no significant
difference in achievement of algebra-ready students in classes which use metacognitive
and self-regulatory strategies as compared to algebra-ready students in classes which do
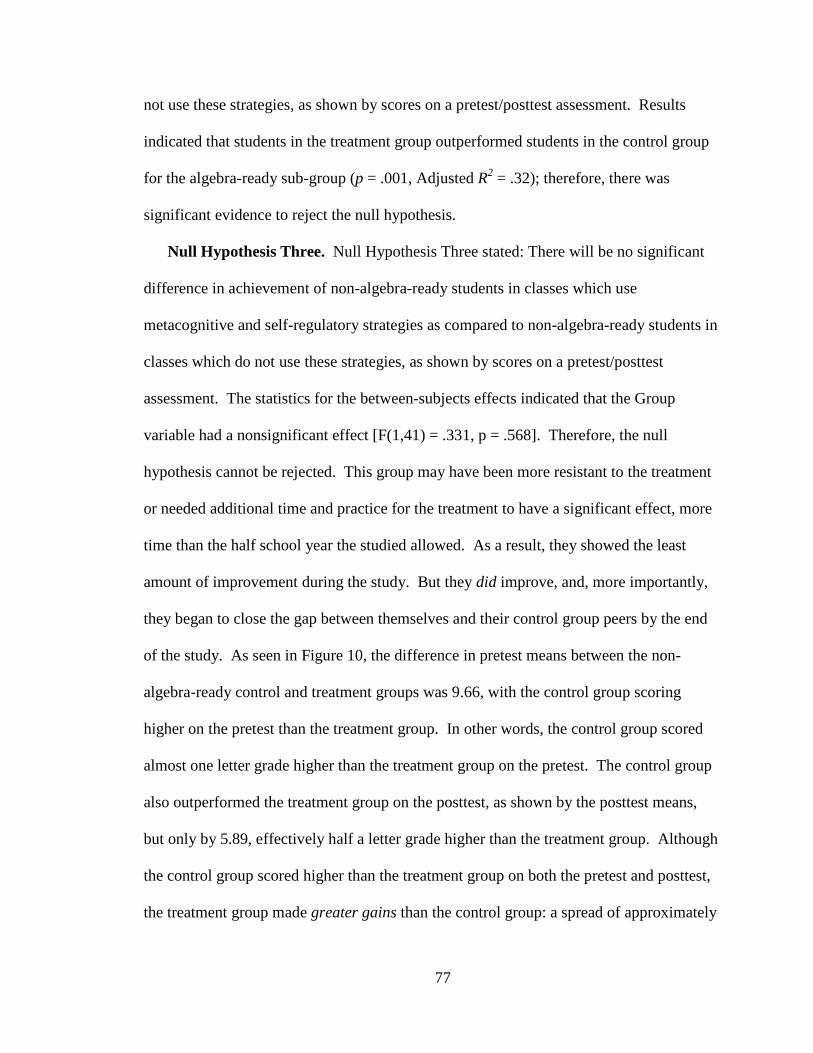
77
not use these strategies, as shown by scores on a pretest/posttest assessment. Results
indicated that students in the treatment group outperformed students in the control group
for the algebra-ready sub-group (p = .001, Adjusted R2 = .32); therefore, there was
significant evidence to reject the null hypothesis.
Null Hypothesis Three. Null Hypothesis Three stated: There will be no significant
difference in achievement of non-algebra-ready students in classes which use
metacognitive and self-regulatory strategies as compared to non-algebra-ready students in
classes which do not use these strategies, as shown by scores on a pretest/posttest
assessment. The statistics for the between-subjects effects indicated that the Group
variable had a nonsignificant effect [F(1,41) = .331, p = .568]. Therefore, the null
hypothesis cannot be rejected. This group may have been more resistant to the treatment
or needed additional time and practice for the treatment to have a significant effect, more
time than the half school year the studied allowed. As a result, they showed the least
amount of improvement during the study. But they did improve, and, more importantly,
they began to close the gap between themselves and their control group peers by the end
of the study. As seen in Figure 10, the difference in pretest means between the non-
algebra-ready control and treatment groups was 9.66, with the control group scoring
higher on the pretest than the treatment group. In other words, the control group scored
almost one letter grade higher than the treatment group on the pretest. The control group
also outperformed the treatment group on the posttest, as shown by the posttest means,
but only by 5.89, effectively half a letter grade higher than the treatment group. Although
the control group scored higher than the treatment group on both the pretest and posttest,
the treatment group made greater gains than the control group: a spread of approximately

78
one letter grade on the pretest to approximately half of one letter grade on the posttest.
However, given the small sample size of the non-algebra-ready sub-group, any results for
this group should be viewed with caution.
Discussion
Although adults in education are becoming increasingly familiar with the use of
student data to inform instruction and guide curricular decisions, this same condition does
not exist for students, who are rarely asked to use this data to inform their own learning
(Marzano, 2003). As one may then expect, there is a corresponding gap in the literature
with regard to students being taught how to use their own data to inform their own
learning, especially in the secondary sciences.
Compounding this problem are the background and experiences of the student
population investigated in this study. Chronic stress, negative conditioning, and other at-
risk factors experienced by students from backgrounds of poverty have been shown to
alter brain development. This, in turn, can have a significant effect on achievement,
emotional development, and decision making (Jensen, 2009). Poverty, early negative
conditioning, and other at-risk factors, primarily at home and at school, have been shown
to affect adolescents’ world views and self-concepts. In studies of juvenile delinquency,
greater levels of poverty when accompanied by negative conditioning and at-risk factors
were significantly correlated to a greater external locus of control (Bansal, Thind, &
Jaswal, 2006; Borman & Rachuba, 2001; Kelley, 1996). In other words, quantitative
studies have suggested that as the level of negative risk factors increase, including
poverty, adolescents become increasingly likely to believe that the outcomes in their lives
are as a result of “other people, outside events, even fate and luck” (Kelley, 1996, p. 40).
Each of these is associated with an external locus of control.
79
Adding to the issues of poverty and at-risk factors, the attitudes of learners toward
the secondary sciences is also of concern (DiBenedetto & Zimmerman, 2010). Since
school efforts and federal mandates (e.g. – No Child Left Behind) focus on reading,
writing, and mathematics, the sciences have taken a back seat (Chang, Singh, & Mo,
2007). In addition, students and their parents are more likely to admit and accept that
they “aren’t good” at science, thereby excusing attempts at improving their performance
or encouraging better performance for their children (Mettas, Karmiotis, & Christoforou,
2006; Provasnik, Gonzales, & Miller, 2009).
In light of these concerns, strategies that help students to practice control over
their own learning and achieve greater success in science may then also contribute to
greater student achievement in science. This study found that metacognitive and self-
regulatory strategy instruction did result in students achieving higher scores on a posttest
than students who did not receive this instruction.
Theoretical Framework
This study was grounded in two main theories. The first is Vygotsky’s social
development theory as it relates to metacognition. The second is Bandura’s social
cognitive theory of self-regulation.
Metacognition. Vygotsky’s social development theory is centered on the assumption
that higher order mental processes (e.g. – metacognitions) and mental functioning are
mediated by social interactions. Learning starts out as a social endeavor but over time
becomes internalized (Vygotsky, 1978). In other words, learning starts out as mediated
between individuals before they become internalized within an individual. When applied
to metacognition, this means that metacognitive awareness and the use and regulation of
those processes are learned and honed through interactions with others such as teachers
80
and peers. It can be thought of as three stages: 1) the teacher is in control of and guides
the student through the learning situation; 2) the teacher and student share in the control
and guidance where the student may take the lead with the teacher providing guidance
when the student errs or is unsure of how to proceed; 3) the teacher, seeing that the
student has grasped and internalized the process, returns control to the student who is
now able to proceed on their own. In this way, as students mature and become
experienced, they eventually play the role of the teacher/guide for themselves. It could
then be said that students are thus enabled to learn how to learn – including content
learning (cognitions) and purposeful regulation of that learning (metacognitions). It is
through repeated practice and exposure to socially mediated opportunities that
metacognitive knowledge is developed and in which the student is eventually aware of
their own thinking.
However, being aware of one’s own thinking is not enough. Vygotsky also
believed that to engage in metacognition one also needed to be self-regulated. He saw
metacognition and self-regulation as intertwined and interdependent. Therefore, the
metacognitive strategies used in this study capitalized on this interdependence and the
nature of social practice.
Self-Regulation. Bandura’s social cognitive theory states that human behavior is
“regulated by an interplay of self-generated and external sources of influence” (Bandura,
1991, p. 249). In other words, people are neither rule-following machines nor are they
any more likely to ignore social expectations or contexts altogether. Rather, Bandura
believed that people set their mind on a course of action based on an interplay of self-
observation, judgment, and self-reaction; therefore, desire alone will not result in change.
81
Bandura (1991) states,
“People cannot influence their own motivation and actions very well if they
do not pay adequate attention to their own performances, the conditions under
which they occur, and the immediate and distal effects they produce” (p. 250).
Social cognitive theory also states that one’s preexisting beliefs about oneself have
selective influence on what one pays attention to and what one is motivated by. For
instance, if a student has learned through experience that science is a difficult subject for
them, as evidenced by poor performance, perceived negative feedback from teachers or
peers, and/or difficulty grasping concepts, social cognitive theory says that the student
may fail to persist, lose motivation, and disengage from the subject, viewing the subject
as the problem. They may even internalize this to the point where they view themselves
as inadequate or incapable of understanding the subject. This is important to consider
with adolescents who are developing self-identities, and especially important to consider
with impoverished adolescents who have been shown to already struggle with persistence
and motivation (Jensen, 2009).
However, Bandura’s social cognitive theory also states that self-observation,
when made consciously and purposefully, can provide self-diagnostic feedback which
can dynamically change one’s own patterns and actions. According to Bandura (1991),
“For those who know how to alter their behavior and modifiable aspects of their
environment, the self-insights so gained can set in motion a process of corrective change”
(p. 250). He also states, “Self-observation enhances performance when there is clear
evidence of progress, but it has little effect when there is considerable ambiguity about
the effects of one’s courses of action” (Bandura, 1991, p. 251). In other words, even
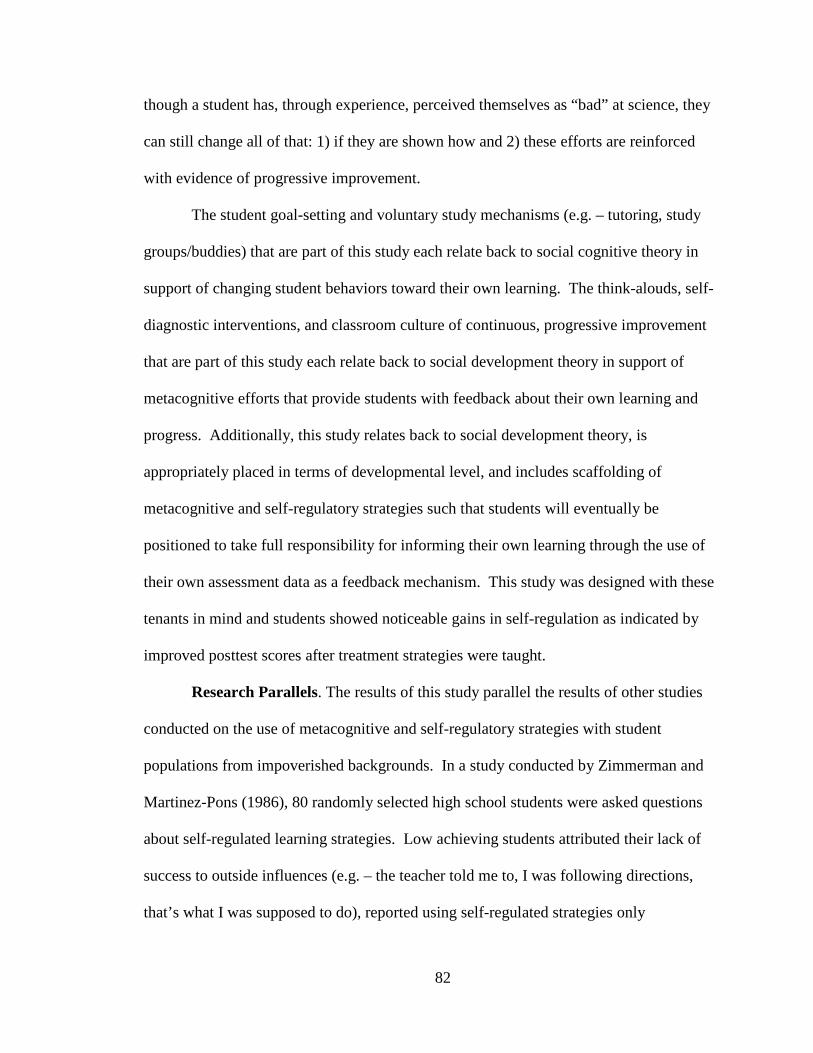
82
though a student has, through experience, perceived themselves as “bad” at science, they
can still change all of that: 1) if they are shown how and 2) these efforts are reinforced
with evidence of progressive improvement.
The student goal-setting and voluntary study mechanisms (e.g. – tutoring, study
groups/buddies) that are part of this study each relate back to social cognitive theory in
support of changing student behaviors toward their own learning. The think-alouds, self-
diagnostic interventions, and classroom culture of continuous, progressive improvement
that are part of this study each relate back to social development theory in support of
metacognitive efforts that provide students with feedback about their own learning and
progress. Additionally, this study relates back to social development theory, is
appropriately placed in terms of developmental level, and includes scaffolding of
metacognitive and self-regulatory strategies such that students will eventually be
positioned to take full responsibility for informing their own learning through the use of
their own assessment data as a feedback mechanism. This study was designed with these
tenants in mind and students showed noticeable gains in self-regulation as indicated by
improved posttest scores after treatment strategies were taught.
Research Parallels. The results of this study parallel the results of other studies
conducted on the use of metacognitive and self-regulatory strategies with student
populations from impoverished backgrounds. In a study conducted by Zimmerman and
Martinez-Pons (1986), 80 randomly selected high school students were asked questions
about self-regulated learning strategies. Low achieving students attributed their lack of
success to outside influences (e.g. – the teacher told me to, I was following directions,
that’s what I was supposed to do), reported using self-regulated strategies only
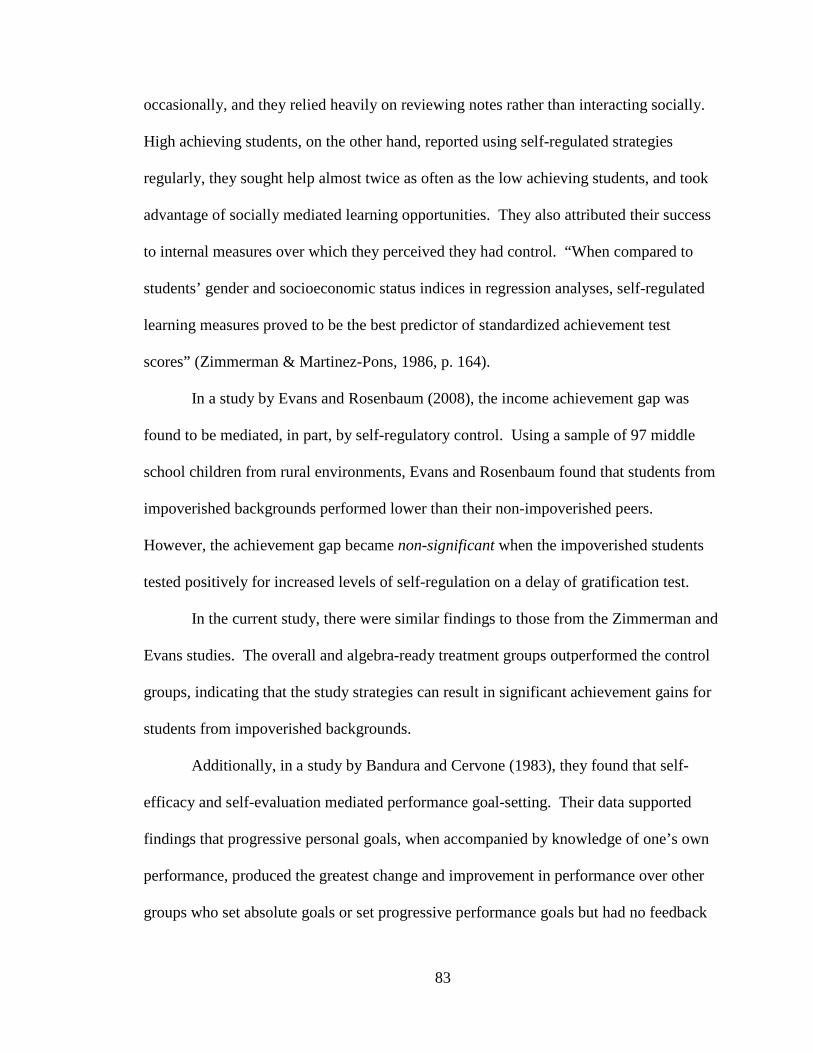
83
occasionally, and they relied heavily on reviewing notes rather than interacting socially.
High achieving students, on the other hand, reported using self-regulated strategies
regularly, they sought help almost twice as often as the low achieving students, and took
advantage of socially mediated learning opportunities. They also attributed their success
to internal measures over which they perceived they had control. “When compared to
students’ gender and socioeconomic status indices in regression analyses, self-regulated
learning measures proved to be the best predictor of standardized achievement test
scores” (Zimmerman & Martinez-Pons, 1986, p. 164).
In a study by Evans and Rosenbaum (2008), the income achievement gap was
found to be mediated, in part, by self-regulatory control. Using a sample of 97 middle
school children from rural environments, Evans and Rosenbaum found that students from
impoverished backgrounds performed lower than their non-impoverished peers.
However, the achievement gap became non-significant when the impoverished students
tested positively for increased levels of self-regulation on a delay of gratification test.
In the current study, there were similar findings to those from the Zimmerman and
Evans studies. The overall and algebra-ready treatment groups outperformed the control
groups, indicating that the study strategies can result in significant achievement gains for
students from impoverished backgrounds.
Additionally, in a study by Bandura and Cervone (1983), they found that self-
efficacy and self-evaluation mediated performance goal-setting. Their data supported
findings that progressive personal goals, when accompanied by knowledge of one’s own
performance, produced the greatest change and improvement in performance over other
groups who set absolute goals or set progressive performance goals but had no feedback
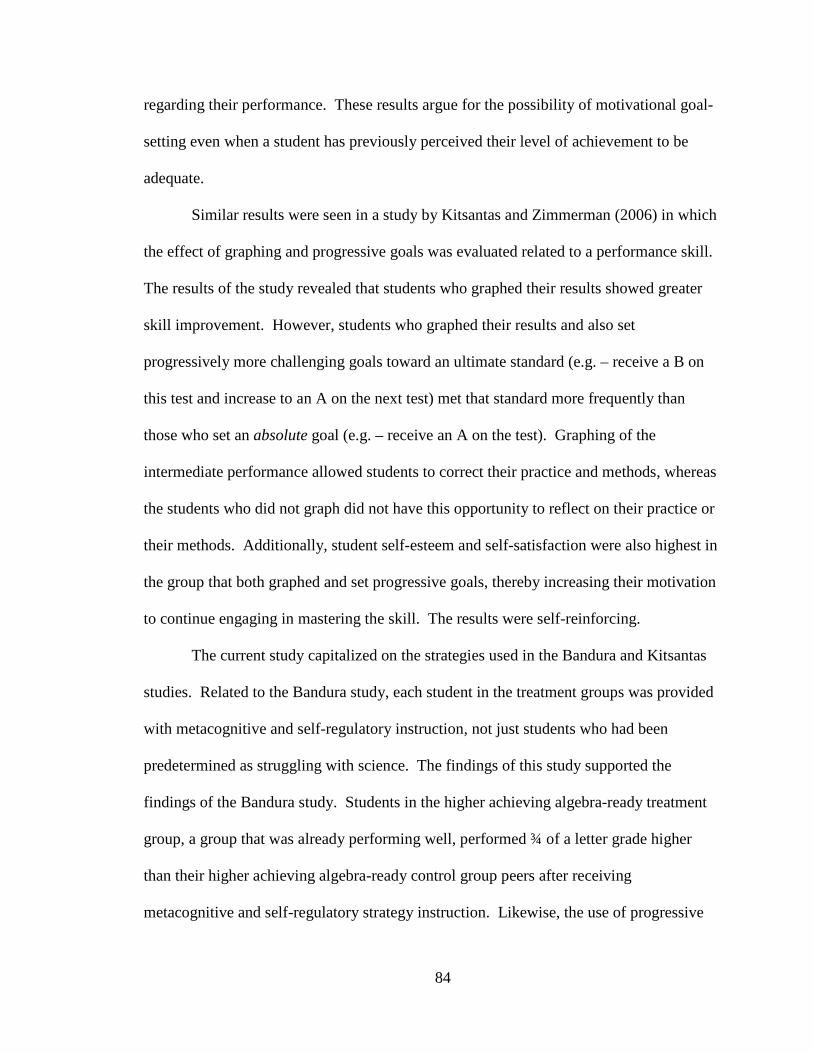
84
regarding their performance. These results argue for the possibility of motivational goal-
setting even when a student has previously perceived their level of achievement to be
adequate.
Similar results were seen in a study by Kitsantas and Zimmerman (2006) in which
the effect of graphing and progressive goals was evaluated related to a performance skill.
The results of the study revealed that students who graphed their results showed greater
skill improvement. However, students who graphed their results and also set
progressively more challenging goals toward an ultimate standard (e.g. – receive a B on
this test and increase to an A on the next test) met that standard more frequently than
those who set an absolute goal (e.g. – receive an A on the test). Graphing of the
intermediate performance allowed students to correct their practice and methods, whereas
the students who did not graph did not have this opportunity to reflect on their practice or
their methods. Additionally, student self-esteem and self-satisfaction were also highest in
the group that both graphed and set progressive goals, thereby increasing their motivation
to continue engaging in mastering the skill. The results were self-reinforcing.
The current study capitalized on the strategies used in the Bandura and Kitsantas
studies. Related to the Bandura study, each student in the treatment groups was provided
with metacognitive and self-regulatory instruction, not just students who had been
predetermined as struggling with science. The findings of this study supported the
findings of the Bandura study. Students in the higher achieving algebra-ready treatment
group, a group that was already performing well, performed ¾ of a letter grade higher
than their higher achieving algebra-ready control group peers after receiving
metacognitive and self-regulatory strategy instruction. Likewise, the use of progressive
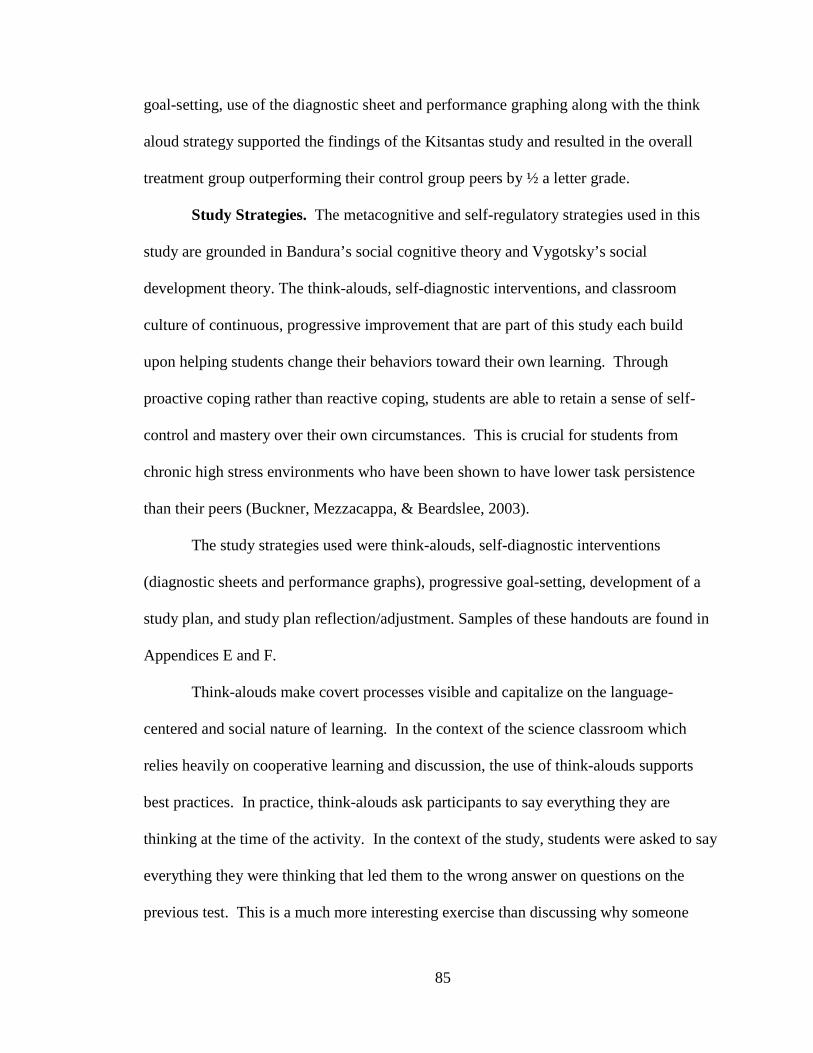
85
goal-setting, use of the diagnostic sheet and performance graphing along with the think
aloud strategy supported the findings of the Kitsantas study and resulted in the overall
treatment group outperforming their control group peers by ½ a letter grade.
Study Strategies. The metacognitive and self-regulatory strategies used in this
study are grounded in Bandura’s social cognitive theory and Vygotsky’s social
development theory. The think-alouds, self-diagnostic interventions, and classroom
culture of continuous, progressive improvement that are part of this study each build
upon helping students change their behaviors toward their own learning. Through
proactive coping rather than reactive coping, students are able to retain a sense of self-
control and mastery over their own circumstances. This is crucial for students from
chronic high stress environments who have been shown to have lower task persistence
than their peers (Buckner, Mezzacappa, & Beardslee, 2003).
The study strategies used were think-alouds, self-diagnostic interventions
(diagnostic sheets and performance graphs), progressive goal-setting, development of a
study plan, and study plan reflection/adjustment. Samples of these handouts are found in
Appendices E and F.
Think-alouds make covert processes visible and capitalize on the language-
centered and social nature of learning. In the context of the science classroom which
relies heavily on cooperative learning and discussion, the use of think-alouds supports
best practices. In practice, think-alouds ask participants to say everything they are
thinking at the time of the activity. In the context of the study, students were asked to say
everything they were thinking that led them to the wrong answer on questions on the
previous test. This is a much more interesting exercise than discussing why someone
86
chose a correct answer and provides richer discussion. It also supports an environment of
continual improvement in which mistakes are valued as opportunities for learning rather
than something to be embarrassed by. Because each exam in the study was cumulative,
students were exposed to the same content each time. Using this think-aloud strategy as
part of whole class instruction allowed students to learn from each other what pitfalls and
common mistakes were made so that they could learn from them and make better choices
on the next exam. It is important to note that teachers must model the think-aloud
strategy frequently prior to asking students to begin using it, as many students are
initially unaware of the thinking going on in their heads until they are made aware of it
through modeling.
Self-diagnostic interventions used in the study included a diagnostic sheet after
each exam and use of a performance graph. The diagnostic sheet was a simple way for
students to use their exam data and categorize it by learning objectives to identify which
learning objectives were mastered and which were not. Test questions were coded ahead
of time with the learning objectives and were then matched up on the diagnostic sheet by
content section. This performance was then transferred to a performance graph. The
performance graph was set up after the results of the pretest during the beginning of the
study. It was created as a multiple bar graph with room to track performance on each of
four exams given during the study. Students drew a line of proficiency across the graph.
The minimum proficiency target students could use was 70%; however, many students
chose a proficiency line of 75% or higher. Students were guided to view their
performance through a growth model. In other words, they were encouraged to set
incremental goals after each exam until they reached their proficiency goal by the time of
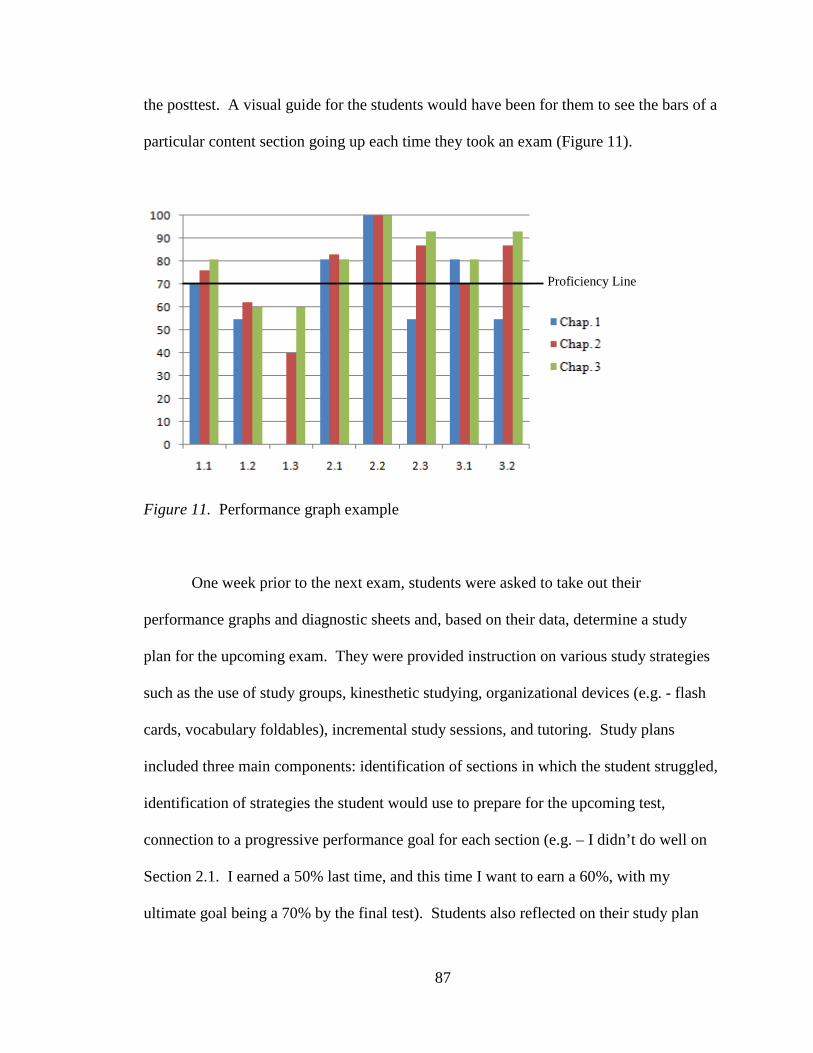
87
the posttest. A visual guide for the students would have been for them to see the bars of a
particular content section going up each time they took an exam (Figure 11).
Figure 11. Performance graph example
One week prior to the next exam, students were asked to take out their
performance graphs and diagnostic sheets and, based on their data, determine a study
plan for the upcoming exam. They were provided instruction on various study strategies
such as the use of study groups, kinesthetic studying, organizational devices (e.g. - flash
cards, vocabulary foldables), incremental study sessions, and tutoring. Study plans
included three main components: identification of sections in which the student struggled,
identification of strategies the student would use to prepare for the upcoming test,
connection to a progressive performance goal for each section (e.g. – I didn’t do well on
Section 2.1. I earned a 50% last time, and this time I want to earn a 60%, with my
ultimate goal being a 70% by the final test). Students also reflected on their study plan
Proficiency Line
88
prior to the next exam. If they felt a strategy was successful, they were encouraged to use
it again. If they felt a strategy was not successful, they were encouraged to try a different
strategy or combination of strategies. Students were also encouraged to share their study
ideas with their classmates.
Limitations
Limitations encountered in this study were as follows: quasi-experimental design;
time factor; a small non-algebra-ready sub-group sample; external validity to non-
residential populations; and single study site.
This study was conducted using a quasi-experimental pretest/posttest design. This
was necessitated due to the enrollment procedures at the study site. Students were
assigned to science classes based on their math level. Although students were randomly
assigned to either the control or treatment group, it was not possible to ensure a random
mix of students in each class. This presented itself most prominently in the non-algebra-
ready treatment sub-group.
During pilot studies, the metacognitive and self-regulatory strategy instruction
occurred throughout an entire school year. However, for the purposes of this study and
due to practical constraints, these strategies only occurred for the first half of the school
year. As a result, the extent of the study results are limited and likely do not reflect
adequate time for students to fully internalize them or begin using them to their full
extent.
Another limitation was the composition and size of the non-algebra-ready sub-
group. Of the 25 students in the non-algebra-ready treatment sub-group, 21 of them were
from a single science section. Students were assigned to science classes at the 9th-grade
level based on mathematics performance determined by various criteria related to grade-
89
level/below-grade-level performance (e.g. – prior math course grades, standardized test
performance). As a result, a single math class and, therefore, science class, was
assembled consisting of the lowest scoring math students. This was done by the study
site to maximize these students’ access to support personnel and resources. An
unintended consequence was the impact this grouping had on the current study. Further
compounding the issue, these students’ mathematics achievement may not necessarily
have been due solely to ability; it may also have been due to large educational gaps as a
result of excessive truancy or transience prior to enrolling at the study site. Compared to
their peers in any other 9th-grade science or math class, this class of students began the
school year significantly behind the rest of their peers. It may not be surprising that this
same group of students saw the least amount of benefit from the study treatment. This
may have been because this group was more resistant to the treatment or because this
group simply needed more exposure to the treatment to receive the full benefit.
Additionally, the non-algebra ready treatment and control sub-groups were the
smallest in the study (n = 44). This resulted in reduced observed power compared to the
ANCOVA procedures that were used in the rest of the study with larger groups and
higher observed power. This prevented any substantive conclusions from being made
regarding this sub-group.
Finally, a limitation of this study was the applicability to non-residential student
populations. Although the students involved in this study are typical representations of
those admitted to private, residential schools for low-SES students, they are not
representative of low-SES student populations in general. Because this sample is based in
residential education, many confounding factors (e.g. – diet, exercise, supervision, health
90
care, sleep, environmental conditions, and access to resources) are greatly controlled
compared to non-residential populations. Therefore, the study population is
representative of residential, low-SES populations. However, it is not representative of
non-residential, low-SES populations.
Implications
There was statistically significant evidence to support the use of metacognitive
and self-regulatory strategy instruction with 9th-grade science students from low-SES
backgrounds. The study strategies produced a significant main effect explaining 42% of
the variance in student scores on a pretest/posttest for the overall study group. This
translates into the overall treatment group performing a half letter grade higher than their
control group peers.
There was also a significant main effect explaining 32% of the variance in student
scores on a pretest/posttest for the algebra-ready sub-group. This translates into the
algebra-ready treatment group performing ¾ of a letter grade higher than their control
group peers.
The results for the non-algebra-ready sub-group were less clear. A small sample
size produced results with low statistical power increasing the likelihood of a Type I
error. Other statistical measures were considered for this group, however, they were
rejected. Although the use of a repeated measures analysis of variance would have
accommodated the small sample size and produced sufficient observed power, it was not
appropriate because the pretest cannot be considered a repeated measure since the
treatment had not yet been applied (Dimitrov & Rumrill, 2003). An analysis of variance
was not appropriate because there were significant differences between the pretest means
of the non-algebra-ready control and treatment groups which must be accounted for
91
(Gall, Gall, & Borg, 2007). Therefore, ANCOVA was the most appropriate test;
however, the sample size needed for this test was much larger than was available in the
study sample resulting in low statistical power. Simply said, null hypothesis three cannot
be rejected for the non-algebra ready group because the sample size was too small to
produce sufficient statistical power to avoid a Type I error using an ANCOVA.
However, it is possible that as a result of the small sample size a Type II error occurred.
When looking strictly at the means for the non-algebra-ready sub-group, the
treatment group made greater gains than the control group: one letter grade difference
between groups on the pretest to half a letter grade difference between the groups on the
posttest. However, great caution should be used in any interpretation of data from this
sub-group with further research recommended.
Overall, the study results are promising. At a time when state standardized exams
are beginning to include the sciences and data-driven best practices are becoming more
valued, effective strategies are needed to improve performance especially for traditionally
low-performing groups such as students from low-SES backgrounds. The study findings
suggest that schools may benefit from the inclusion of metacognitive and self-regulatory
strategy instruction as part of a physics curriculum. Professional development would also
be necessary so that teachers could properly model and implement the strategies.
It should be noted that the study strategies take time to teach. They take even
more time for teachers and students to internalize them and begin using them on their
own. When students are already struggling with content, cognitive load limits mean that
students will be challenged to use the strategies at first. They will likely internalize them
only later, after much practice. For practical reasons, this study was conducted over only
92
half of a school year, but pilot studies were conducted for an entire school year for this
very reason. Therefore, it is recommended that these strategies be modeled from the very
start of the school year in addition to being used consistently throughout the school year.
These metacognitive and self-regulatory strategies may require a shift in the
classroom environment from one that rewards correct answers to one that values
incorrect ones. The reasons behind why students choose incorrect answers are much
more educationally interesting. More importantly, they act as a springboard for
discussion, and help develop a culture of continuous improvement. Because of this, a
supportive classroom environment in which students feel safe to take academic risks
cannot be overstated.
Recommendations for Further Research
This study took place from August to January - half of the school year. In pilot
studies, students received strategy instruction and worked with their own data for an
entire school year. It was hoped that students in the non-algebra-ready sub-group would
experience the greatest gains from the treatment; however, due to sample size the
outcome of the study strategies on this group are unclear. A lack of greater improvement
in this group may also mean that this group was more resistant to the study strategies than
their algebra-ready counterparts or, potentially, they may have needed more time to begin
to internalize the study strategies. This was also the smallest group (n = 44). Therefore,
a recommendation for further research with this non-algebra-ready sub-group would be
two-fold: increase the study time to a full school year to maximize the exposure to the
treatment, and increase the sample size to at least double its current size to improve the
statistical power of the study.
93
This study was conducted solely with residential, low-SES students. Because of
the residential nature of the study site, many confounding factors were greatly controlled
compared to non-residential populations. Therefore, to increase the external validity to
non-residential student populations, another recommendation would be to conduct this
study with low-SES, public school populations.
Finally, although this study was focused on empowering students to inform their
own learning, no survey was included to ask students to voice their interpretation of or
thoughts about the metacognitive and self-regulatory processes in which they engaged.
Their individual and collective voice is important and meaningful; therefore, it would be
a recommendation that student reflection be included as part of further research.
Conclusions
Students from low-SES backgrounds often lack the self-regulatory habits and
metacognitive strategies to improve academic performance (Lipina & Colombo, 2009).
They classically exhibit low task persistence, poor study skills, and do not engage in
reflection related to performance (Jensen, 2009). Additionally, greater levels of poverty,
when accompanied by negative conditioning and at-risk factors, were significantly
correlated to a greater external locus of control (Bansal, Think, & Jaswal, 2006; Borman
& Rachuba, 2001; Kelley, 1996). Taken together, these findings paint a bleak academic
picture for low-SES students.
In answer to these concerns and in an effort to improve science achievement
scores for students from low-SES backgrounds, this study investigated the use of
metacognitive and self-regulatory strategies specifically as they apply to students’
assessment data in science. The study found that metacognitive and self-regulatory
strategy instruction resulted in increased achievement for the overall treatment group and
94
the algebra-ready treatment group. There was a less clear outcome for the non-algebra-
ready group in which greater gains were made by the treatment sub-group than the
control sub-group, but in which the control sub-group outperformed the treatment sub-
group.
Overall, these are encouraging results which speak to the potential in these
children. When presented with strategies to take control over and claim ownership of
their own learning, these students responded positively, resulting in ½ to ¾ of a letter
grade improvement over their control group counterparts in just ½ a school year.
A legitimate criticism of this study may be the time required for proper instruction
of the metacognitive and self-regulatory strategies. Teachers and administrators would
be right to question this. However, considerable gains were made for a population of
students known for their resistance to educational interventions, making the time invested
very well spent. In an era when standardized and high stakes testing have an increasingly
prominent role in education, educators must take a step back and ask themselves whether
they should be the only players holding the cards. If we, as educators, seek to empower
our students to truly be life-long learners and take ownership of their own learning, time
must be prioritized for sharing student data with students. They must be taught effective
strategies for interpreting, internalizing, and making operational the metacognitive and
self-regulatory tools to inform their own learning and instruction.
The voice of our students is being increasingly lost among the noise of testing.
The study findings suggest that this collective voice can be found, in part, through the use
of metacognitive and self-regulatory strategies. The findings also suggest that school
districts should include professional development for science teachers in the use and

95
inclusion of metacognitive and self-regulatory strategies, and provide for the inclusion of
these strategies on a regular basis within the science classroom.
96
References
Abell, S. K. (2009). Thinking about thinking in science class. Science and Children,
46(6), 56-57.
Alter, A., Oppenheimer, D., Epley, N., & Eyer, R. (2007). Overcoming intuition:
metacognitive difficulty activates analytic reasoning. Journal of Experimental
Psychology, 136(4), 569-576.
Bandura, A. (1991). Social cognitive theory of self-regulation. Organizational Behavior
and Human Decision Processes, 50, 248-287.
Bandura, A., & Cervone, D. (1983). Self-evaluative and self-efficacymechanisms
governing the motivational effects of goal systems. Journal of Personality and
Social Psychology, 45(5), 1017-1028.
Bannert, M. (2002). Managing cognitive load: Recent trends in cognitive load theory.
Learning and Instruction, 12(1), 139-146.
Bannert, M., & Mengelkamp, C. (2008). Assessment of metacognitive skills by means of
instruction to think aloud and reflect when prompted. Does the verbalisation
method affect learning? [Feature]. Metacognition and Learning, 3(1), 39-58.
Bansal, S., Thind, S. K., & Jaswal, S. (2006). Relationship between quality of home
environment, locus of control and achievement motivation among high achiever
urban female adolescents. Journal of Human Ecology, 19(4), 253-257.
Baumeister, R. F., Zell, A. L., & Tice, D. M. (2007). How emotions facilitate and impair
self-regulation. In J. J. Gross (Ed.), Handbook of emotion regulation (pp. 408-
428). New York, NY: Guilford.
97
Benard, B. (2003). Turnaround teachers and schools. In B. Williams (Ed.), Closing the
achievement gap: A vision for changing beliefs and practices (2nd ed.) (pp. 115-
137). Alexandria, VA: Association for Supervision and Curriculum Development.
Blackwell, L. S., Trzesniewski, K. H., & Dweck, C. S. (2007). Implicit theories of
intelligence predict achievement across an adolescent transition: A longitudinal
study and an intervention. Child Development, 78(1), 246-263.
Borman, G. D., & Rachuba, L. T. (2001). Academic success among poor and minority
students: An analysis of competing models of school effects. (ERIC Document
Reproduction Service No. ED451281).
Bransford, J. D., Brown, A. L., Anderson, J. R., Gelman, R., Glaser, R., Greenough, W.
T., . . . Wineburg, S. S. (2000). How people learn: Brain, mind, experience, and
school (Expanded ed.). Washington, D.C.: National Academy Press.
Buckner, J. C., Mezzacappa, E., & Beardslee, W. R. (2003). Characteristics of resilient
youths living in poverty: The role of self-regulatory processes. Development and
Psychopathology, 15, 139-162.
Chang, M., Singh, K., & Mo, Y. (2007). Science engagement and science achievement:
Longitudinal models using NELS data. Educational Research and Evaluation,
13(4), 349-371.
Chi, M. T. H. (2006). Two approaches to the study of experts' characteristics. In K. A.
Ericsson, N. Charness, P. J. Feltovich & R. R. Hoffman (Eds.), The Cambridge
handbook of expertise and expert performance (pp. 21-30). New York, NY:
Cambridge University Press.
98
DiBenedetto, M. K., & Zimmerman, B. J. (2010). Differences in self-regulatory
processes among students studying science: A microanalytic investigation. The
International Journal of Educational and Psychological Assessment, 5, 2-24.
Dimitrov, D.M., & Rumrill, P.D. (2003). Pretest-posttest designs and measurement of
change. Work, 20, 159-165.
Duschl, R. A., Schweingruber, H. A., & Shouse, A. W. (2007). Taking science to school:
Learning and teaching science in grades K-8. Washington, D.C.: National
Academies Press.
Dweck, C. S. (2006). Mindset: The new psychology of success. New York: Ballantine
Books.
Evans, G. W., & Rosenbaum, J. (2008). Self-regulation and the income-achievement gap.
Early Childhood Research Quarterly, 23(4), 504-514. doi:
10.1016/j.ecresq.2008.07.002
Flavell, J. H. (1976). The Nature of Intelligence. In L. B. Resnick (Ed.). Hillsdale, NJ:
Erlbaum.
Flavell, J. H. (1979). Metacognition and cognitive monitoring: A new area of cognitive-
developmental inquiry. American Psychologist, 34(10), 906-911.
Fouché, J., & Lamport, M. A. (2011). Do metacognitive strategies improve student
achievement in secondary science classrooms?: The case for metacognition as
enhancement classroom method in the sciences. Christian Perspectives in
Education, 4(2).
99
Fox, E., & Riconscente, M. (2008). Metacognition and self-regulation in James, Piaget,
and Vygotsky. Educational Psychology Review, 20(4), 373-389. doi:
10.1007/s10648-008-9079-2
Gall, M., Gall, J., & Borg, W. (2007). Educational research: An introduction (8th ed.).
Boston: Pearson.
Gorski, P. C. (2008). Peddling poverty for profit: Elements of oppression in Ruby Payne's
framework. Equity & Excellence in Education, 41(1), 130-148. doi:
10.1080/10665680701761854
Gunnar, M., Frenn, K., Wewerka, S., & Van Ryzin, M. (2009). Moderate versus severe
early life stress: Associations with stress reactivity and regulation in 10- to 12-
year old children. Psychoneuroendocrinology, 34(1), 62-75.
Hacker, D. J., Dunlosky, J., & Graesser, A. C. (Eds.). (2009). Handbook of metacognition
in education. New York, NY: Routledge.
Hartman, H. J. (2001). Teaching metacognitively. In H. J. Hartman (Ed.), Metacognition
in Learning and Instruction: Theory, Research, and Practice (pp. 149-169).
Dordrecht, The Netherlands: Kluwer Academic Publishers.
Hinkle, D. E., Wiersma, W., & Jurs, S. G. (2003). Applied Statistics for the Behavioral
Sciences (5th ed.). Boston, MA: Houghton Mifflin Company.
Jensen, E. (2009). Teaching with poverty in mind: What being poor does to kids' brains
and what schools can do about it. Alexandria, VA: Association for Supervision
and Curriculum Development.
100
Jeynes, W. H. (2007). The relationship between parental involvement and urban
secondary school student academic achievement: A meta-analysis. Urban
Education, 42(1), 82-110.
Kehoe, J. (1995). Basic item analysis for multiple-choice tests. Practical Assessment,
Research & Evaluation, 4(10), 5.
Kelley, T. M. (1996). At-risk youth and locus of control: Do they really see a choice?
Juvenile and Family Court Journal, 47(4), 39-53.
Kirschner, P. A. (2002). Cognitive load theory: Implications of cognitive load theory on
the design of learning. Learning and Instruction, 12(1), 1-10.
Kitsantas, A., & Zimmerman, B. J. (2006). Enhancing self-regulation of practice: the
influence of graphing and self-evaluative standards. Metacognition and Learning,
1(3), 201-212.
Ku, K., & Ho, I. (2010). Metacognitive strategies that enhance critical thinking.
Metacognition Learning, 5, 251-267.
Lefcourt, H. M. (1966). Internal versus external control of reinforcement: A review.
Psychological Bulletin, 65(4), 206-220.
Lipina, S. J., & Colombo, J. A. (2009). Poverty and brain development during childhood:
An approach from cognitive psychology and neuroscience. Washington, D.C.:
American Psychological Association.
Marzano, R. (2003). Using data: Two wrongs and a right. Educational Leadership, 60(5),
56-60.
Mettas, A., Karmiotis, I., & Christoforou, P. (2006). Relationship between students' self-
beliefs and attitudes on science achievements in Cyprus: Findings from the Third
101
International Mathematics and Science Study (TIMSS). . Eurasia Journal of
Mathematics, Science & Technology Education, 2(1), 41-52.
Miller, C. A., Fitch, T., & Marshall, J. L. (2003). Locus of control and at-risk youth: A
comparison of regular education high school students and students in alternative
schools. Education, 123(3), 548-551.
Miller, M. D., Linn, R. L., & Gronlund, N. E. (2008). Measurement and assessment in
teaching. Upper Saddle River, NJ: Prentice Hall.
National Institute of Child Health and Human Development & Early Child Care Research
Network (2005). Predicting individual differences in in attention, memory, and
planning in first graders from experiences at home, child care, and school.
Developmental Psychology, 41, 99-114.
Nord, C., Roey, S., Perkins, R., Lyons, M., Lemanski, N., Brown, J., & Schuknecht, J.
(2011). The nation's report card: America's high school graduates. Results of the
2009 NAEP high school transcript study. NCES 2011-462: National Center for
Education Statistics.
Nota, L., Soresi, S., & Zimmerman, B. J. (2004). Self-regulation and academic
achievement and resilience: A longitudinal study. International Journal of
Educational Research, 41(3), 198-215. doi: 10.1016/j.ijer.2005.07.001
Osborne, J.W., & Overbay, A. (2004). The power of outliers (and why researchers should
always check for them). Practical Assessment, Research & Evaluation, 9(6).
Payne, R. K. (2005). A framework for understanding poverty. Highlands, TX: aha!
Process, Inc.
102
Peters, E. E., & Kitsantas, A. (2010). Self-regulation of student epistemic thinking in
science: the role of metacognitive prompts. Educational Psychology, 30(1), 27-
52. doi: 10.1080/01443410903353294
Piaget, J. (1960). Equilibration and development of logical structures. In J. M. Tanner &
B. Inhelder (Eds.), Discussions on child development (Vol. 4). New York:
International Universities Press.
Provasnik, S., Gonzales, P., & Miller, D. (2009). U.S. Performance Across International
Assessments of Student Achievement: Special Supplement to The Condition of
Education 2009. NCES 2009-083: National Center for Education Statistics.
Rawlinson, R. (2011). A mind shaped by poverty: Ten things educators should know.
Bloomington, IN: iUniverse.
Rotter, J. B. (1954). Social learning and clinical psychology. New York, NY: Prentice-
Hall.
Rotter, J. B. (1966). Generalized expectancies for internal versus external control of
reinforcement. Journal of Educational Research, 74, 185-190.
Ruby, A. (2006). Improving science achievement at high-poverty urban middle schools.
Science Education, 90(6), 1005-1027.
Schraw, G., Crippen, K. J., & Hartley, K. D. (2006). Promoting self-regulation in science
education: Metacognition as part of a broader perspective on learning. Research
in Science Education, 36, 111-139.
Schunk, D. H. (2008). Metacognition, self-regulation, and self-regulated learning:
Research recommendations. Educational Psychology Review, 20, 463-467.
103
Seo, Songwon (2006). A review and comparison of methods for detecting outliers in
univariate data sets (Doctoral dissertation). Retrieved from ProQuest
Dissertations and Theses.
Shepherd, S., Fitch, T. J., Owen, D., & Marshall, J. L. (2006). Locus of control and
academic achievement in high school students. Psychological Reports, 98(2),
318-322. doi: 10.2466/pr0.98.2.318-322
Sinatra, G. M., & Taasoobshirazi, G. (2011). Intentional conceptual change: The self-
regulation of science learning. In B. J. Zimmerman & D. H. Schunk (Eds.),
Handbook of self-regulation of learning and performance. New York, NY:
Routledge.
Snow-Renner, R., & Lauer, P. A. (2005). Professional development analysis. McREL
Insights. Denver, CO: Mid-Continent Research for Education and Learning.
Starkman, M. N., Giordani, B., Gebarski, S. S., & Schteingart, D. E. (2003).
Improvement in learning associated with increase in hippocampal formation
volume. Biological Psychiatry, 53(3), 233-238. doi: 10.1016/s0006-
3223(02)01750-x
Stipek, D. J., & Ryan, R. H. (1997). Economically disadvantaged preschoolers: Ready to
learn but farther to go. Developmental Psychology, 33, 711-723.
Taasoobshirazi, G., & Carr, M. (2009). A structural equation model of expertise in
college physics. Journal of Educational Psychology, 101(3), 630-643.
Tileston, D. W., & Darling, S. K. (2008). Why culture counts: teaching children of
poverty. Bloomington, IN: Solution Tree Press.
104
Veenman, M. V. J., Elshout, J. J., & Groen, M. G. M. (1993). Thinking aloud: Does it
affect regulatory processes in learning. Tijdschrift voor Onderwijsresearch, 18,
322-330.
Vygotsky, L. S. (1978). Mind in society: The development of higher psychological
processes. Harvard, CT: Harvard University Press.
Vygotsky, L. S. (1986). Thought and language. Cambridge, MA: MIT (A. Kozulin,
trans.).
Walker, S., Wachs, T., Gardner, J., Lozoff, B., Wasserman, G., & Pollit, E. (2007). Child
Development: Risk factors for adverse outcomes in developing countries. Lancet,
369, 145-157.
Weiner, B. (1980). Human Motivation. New York, NY: Rinehart & Winston.
Weiner, B. (1986). An attributional theory of motivation and emotion. New York, NY:
Springer-Verlag.
Wells, C. S., & Wollack, J. A. (2003). An instructor's guide to understanding test
reliability. Madison, WI: Testing & Evaluation Services.
Winne, P. H., & Perry, N. E. (2000). Measuring self-regulated learning. In M. Boekaerts,
P. R. Pintrich & M. Zeidner (Eds.), Handbook of self-regulation. San Diego, CA:
Academic Press.
Zimmerman, B. J., & Martinez-Pons, M. (1986). Development of a structured interview
for assessing student use of self-regulated learning strategies. American
Educational Research Journal, 23, 614-628.
Zimmerman, B. J., & Schunk, D. H. (Eds.). (2011). Handbook of self-regulation of
learning and performance. New York, NY: Routledge.
105
Zohar, A., & Ben-David, A. (2008). Explicit teaching of meta-strategic knowledge in
authentic classroom situations. Metacognition and Learning, 3(1), 59-82.
Zohar, A., & Peled, B. (2008). The effects of explicit teaching of metastrategic
knowledge on low- and high-achieving students. Learning and Instruction, 18(4),
337-353. doi: 10.1016/j.learninstruc.2007.07.001
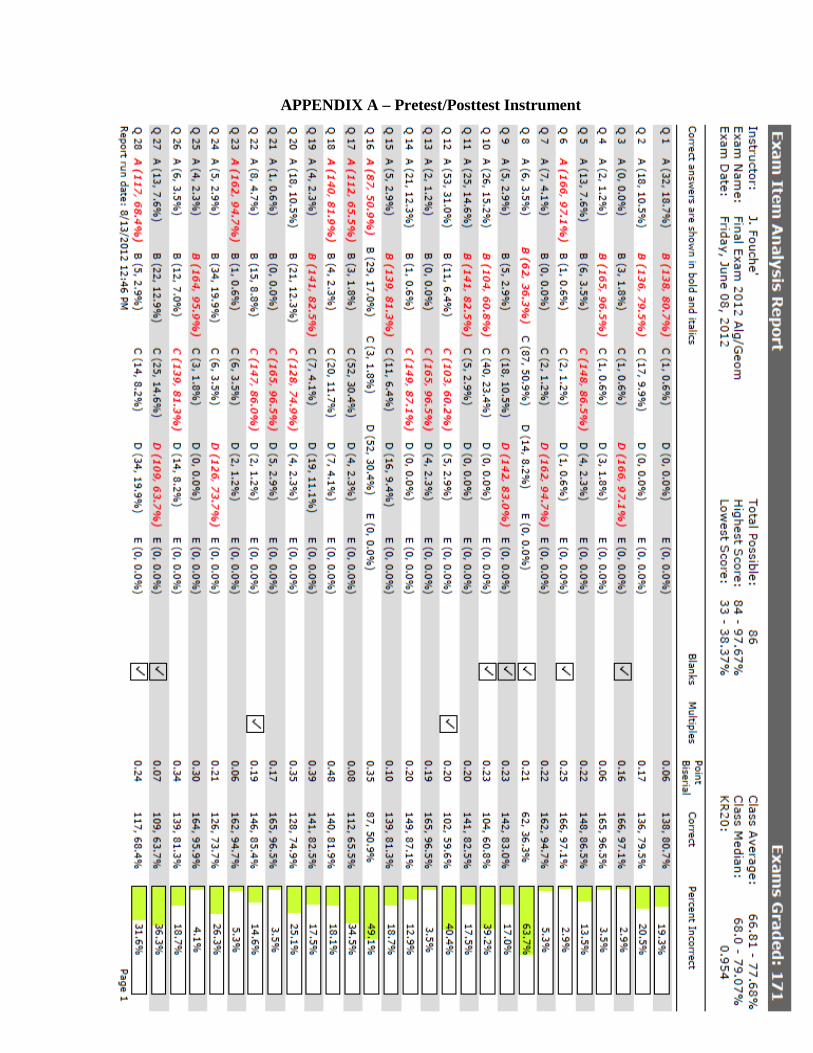
106
APPENDIX A – Pretest/Posttest Instrument

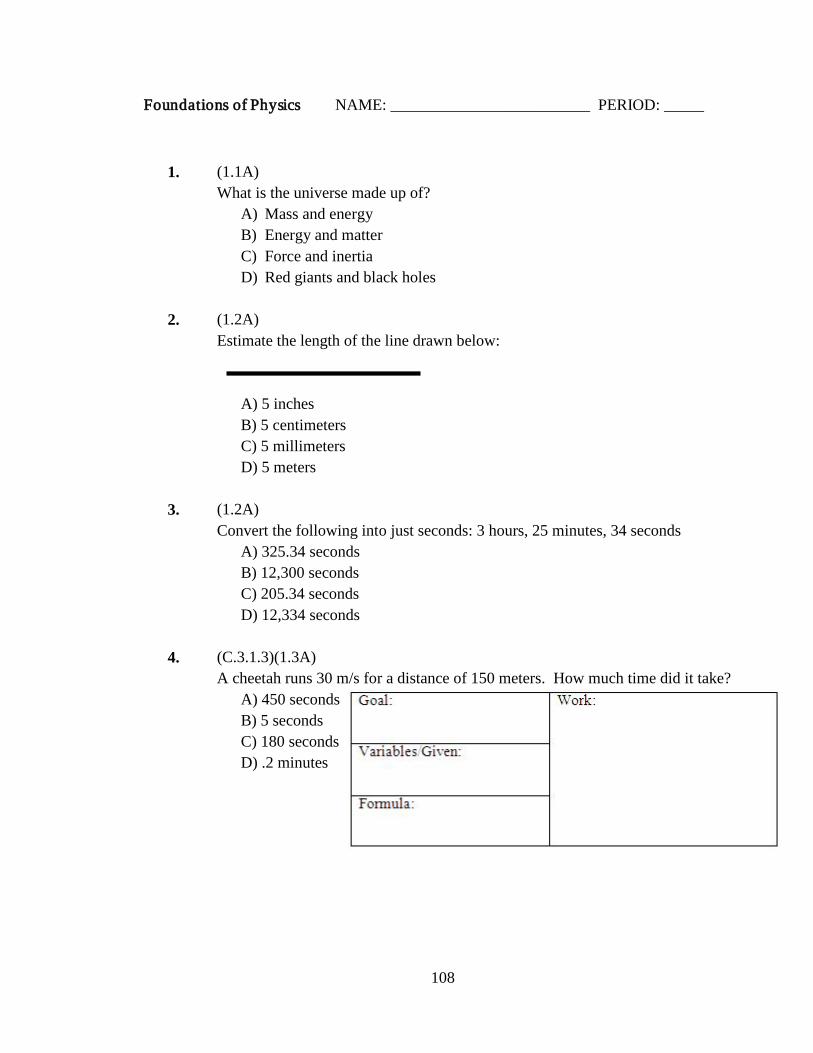
108
Foundations of Physics NAME: _________________________ PERIOD: _____
1. (1.1A)
What is the universe made up of? A) Mass and energy B) Energy and matter C) Force and inertia D) Red giants and black holes
2. (1.2A)
Estimate the length of the line drawn below: A) 5 inches B) 5 centimeters C) 5 millimeters D) 5 meters
3. (1.2A)
Convert the following into just seconds: 3 hours, 25 minutes, 34 seconds A) 325.34 seconds B) 12,300 seconds C) 205.34 seconds D) 12,334 seconds
4. (C.3.1.3)(1.3A) A cheetah runs 30 m/s for a distance of 150 meters. How much time did it take?
A) 450 seconds B) 5 seconds C) 180 seconds D) .2 minutes
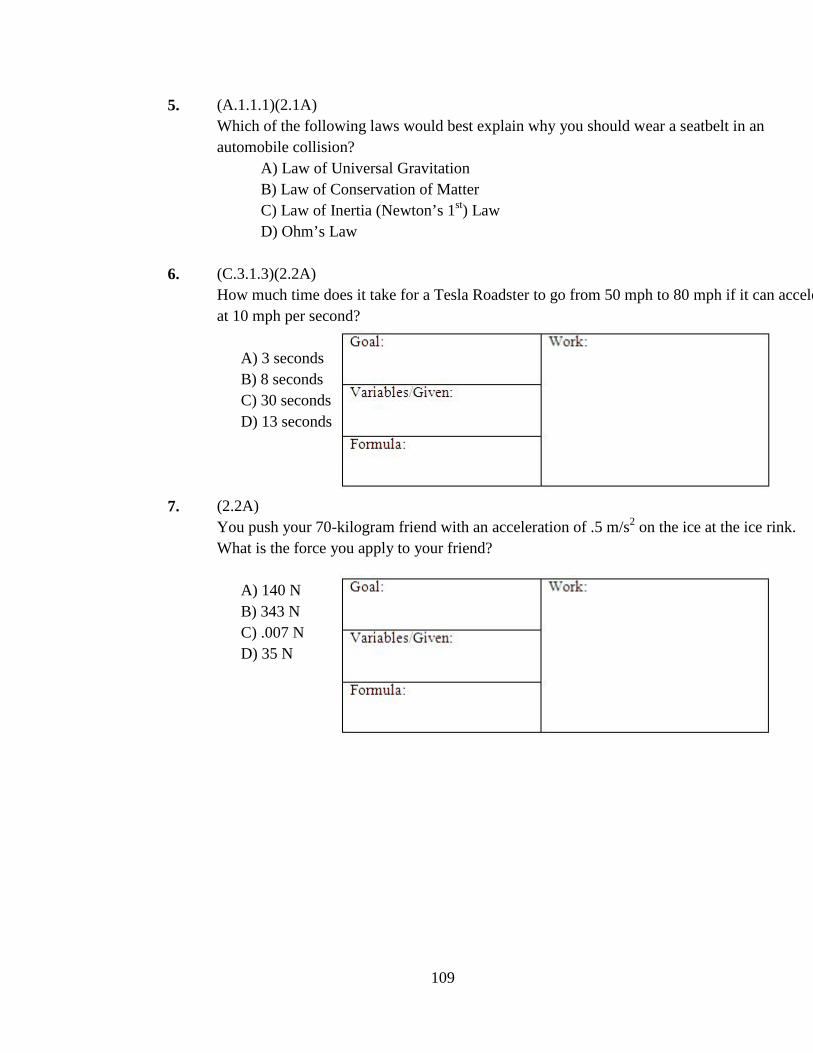
109
5. (A.1.1.1)(2.1A) Which of the following laws would best explain why you should wear a seatbelt in an automobile collision?
A) Law of Universal Gravitation B) Law of Conservation of Matter C) Law of Inertia (Newton’s 1st) Law D) Ohm’s Law
6. (C.3.1.3)(2.2A) How much time does it take for a Tesla Roadster to go from 50 mph to 80 mph if it can accelerate at 10 mph per second?
A) 3 seconds B) 8 seconds C) 30 seconds D) 13 seconds
7. (2.2A)
You push your 70-kilogram friend with an acceleration of .5 m/s2 on the ice at the ice rink. What is the force you apply to your friend?
A) 140 N B) 343 N C) .007 N D) 35 N
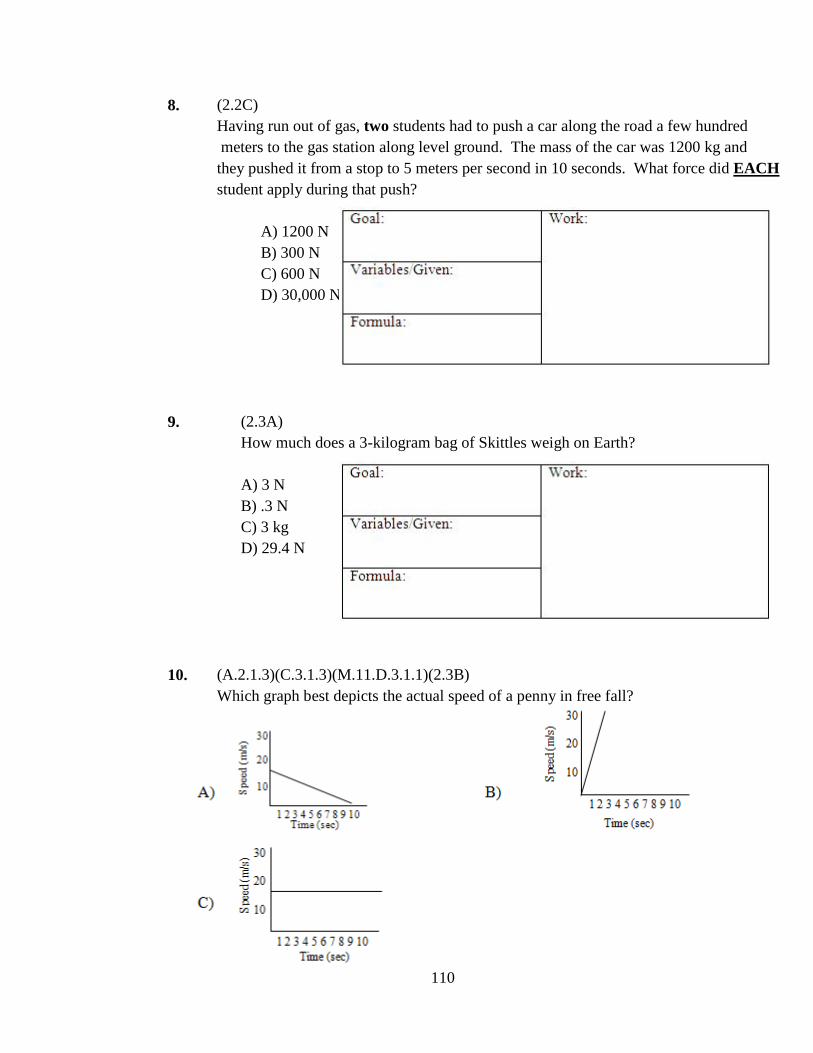
110
8. (2.2C) Having run out of gas, two students had to push a car along the road a few hundred meters to the gas station along level ground. The mass of the car was 1200 kg and they pushed it from a stop to 5 meters per second in 10 seconds. What force did EACH
A) 1200 N B) 300 N C) 600 N D) 30,000 N
student apply during that push?
9. (2.3A) How much does a 3-kilogram bag of Skittles weigh on Earth? A) 3 N B) .3 N C) 3 kg D) 29.4 N
10. (A.2.1.3)(C.3.1.3)(M.11.D.3.1.1)(2.3B) Which graph best depicts the actual speed of a penny in free fall?
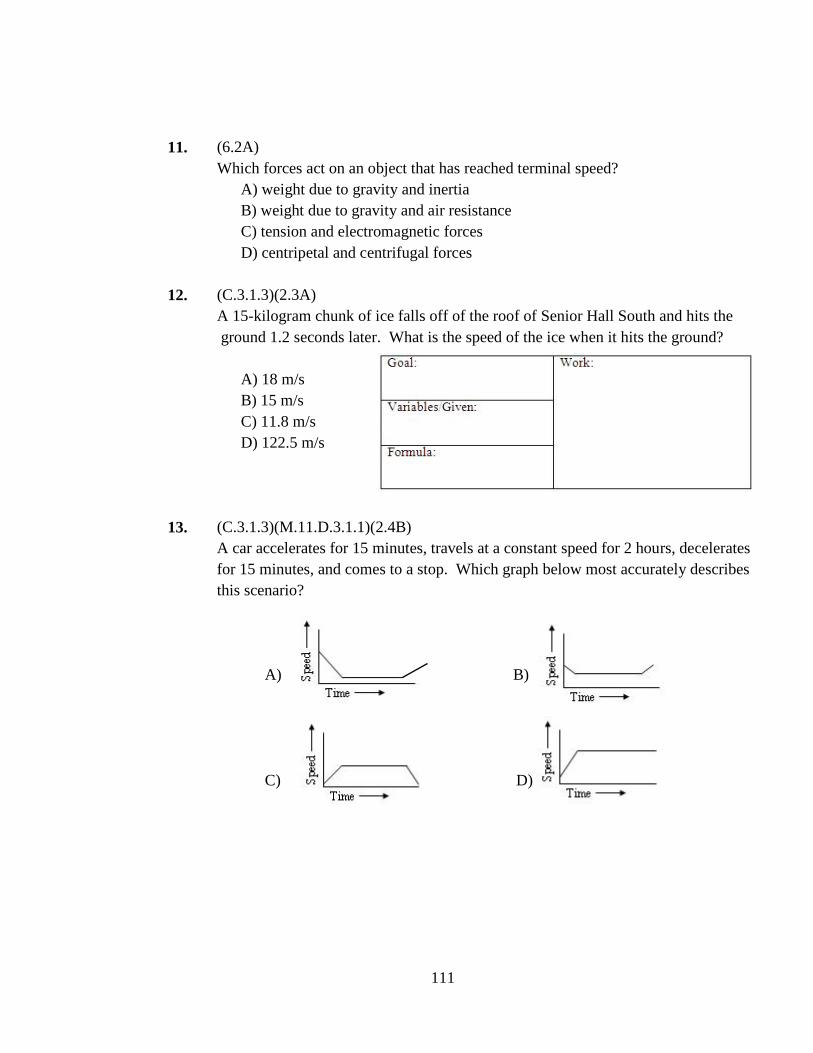
111
11. (6.2A) Which forces act on an object that has reached terminal speed?
A) weight due to gravity and inertia B) weight due to gravity and air resistance C) tension and electromagnetic forces D) centripetal and centrifugal forces
12. (C.3.1.3)(2.3A) A 15-kilogram chunk of ice falls off of the roof of Senior Hall South and hits the ground 1.2 seconds later. What is the speed of the ice when it hits the ground?
A) 18 m/s B) 15 m/s C) 11.8 m/s D) 122.5 m/s
13. (C.3.1.3)(M.11.D.3.1.1)(2.4B)
A car accelerates for 15 minutes, travels at a constant speed for 2 hours, decelerates for 15 minutes, and comes to a stop. Which graph below most accurately describes this scenario?
A) B)
C) D)

112
14.
(C.3.1.1)(3.1B) A 5-gram butterfly collides with a 4000-kilogram truck traveling at high speed. The truck applies 3 N of force to the butterfly. According to Newton’s laws, how much force does the butterfly apply to the truck?
A) The butterfly applies less force to the truck B) The butterfly applies more force to the truck C) The butterfly applies the same force to the truck
15. (3.1A)
A 1.3-kg fish is swimming through the water at 1.1 m/s for 25 seconds. Calculate the momentum of the fish.
A) 1.18 kg·m/s B) 1.43 kg·m/s C) 27.50 kg·m/s D) 35.80 kg·m/s
16. (3.1B) To escape a burning building John must jump from a second story window. John aims to land on the soft mud rather than the hard concrete sidewalk. Landing on the soft mud will:
A) reduce the force of impact by increasing his time of impact. B) reduce the force of impact by decreasing his time of impact. C) increase the force of impact by decreasing his change in momentum. D) reduce the force of impact by decreasing his change in momentum.
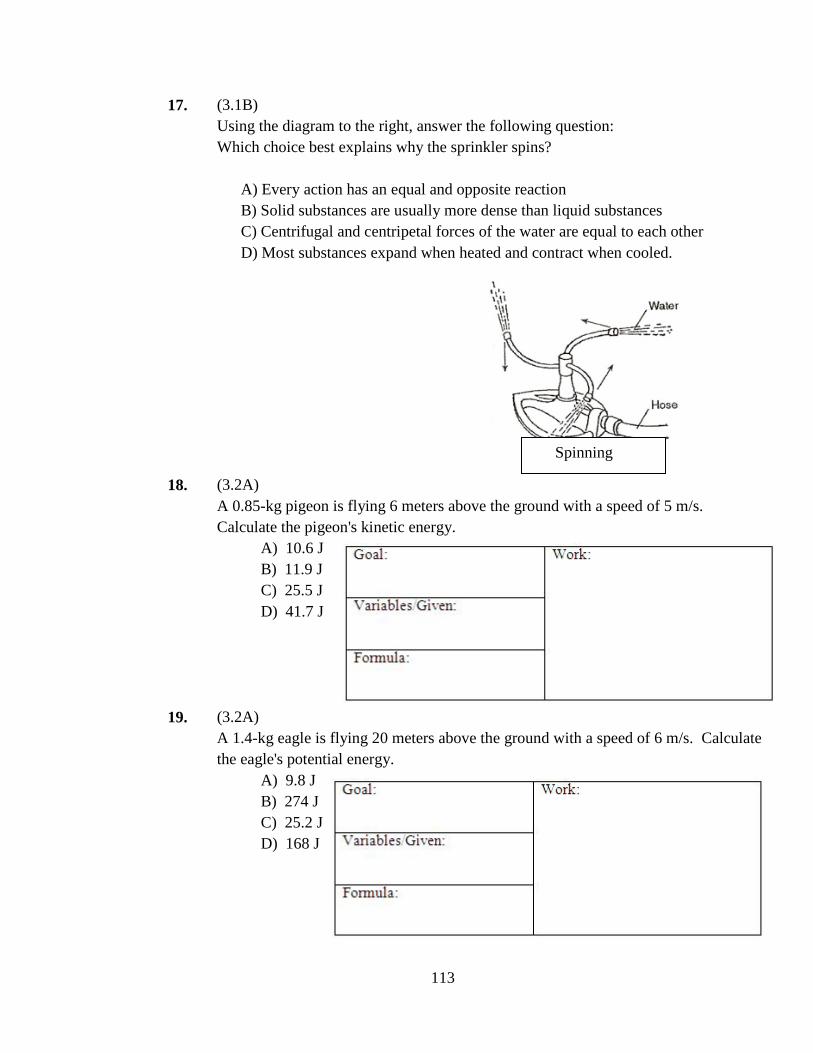
113
17. (3.1B) Using the diagram to the right, answer the following question: Which choice best explains why the sprinkler spins?
A) Every action has an equal and opposite reaction B) Solid substances are usually more dense than liquid substances C) Centrifugal and centripetal forces of the water are equal to each other D) Most substances expand when heated and contract when cooled.
18.
(3.2A) A 0.85-kg pigeon is flying 6 meters above the ground with a speed of 5 m/s. Calculate the pigeon's kinetic energy.
A) 10.6 J B) 11.9 J C) 25.5 J D) 41.7 J
19. (3.2A) A 1.4-kg eagle is flying 20 meters above the ground with a speed of 6 m/s. Calculate the eagle's potential energy.
A) 9.8 J B) 274 J C) 25.2 J D) 168 J
Spinning
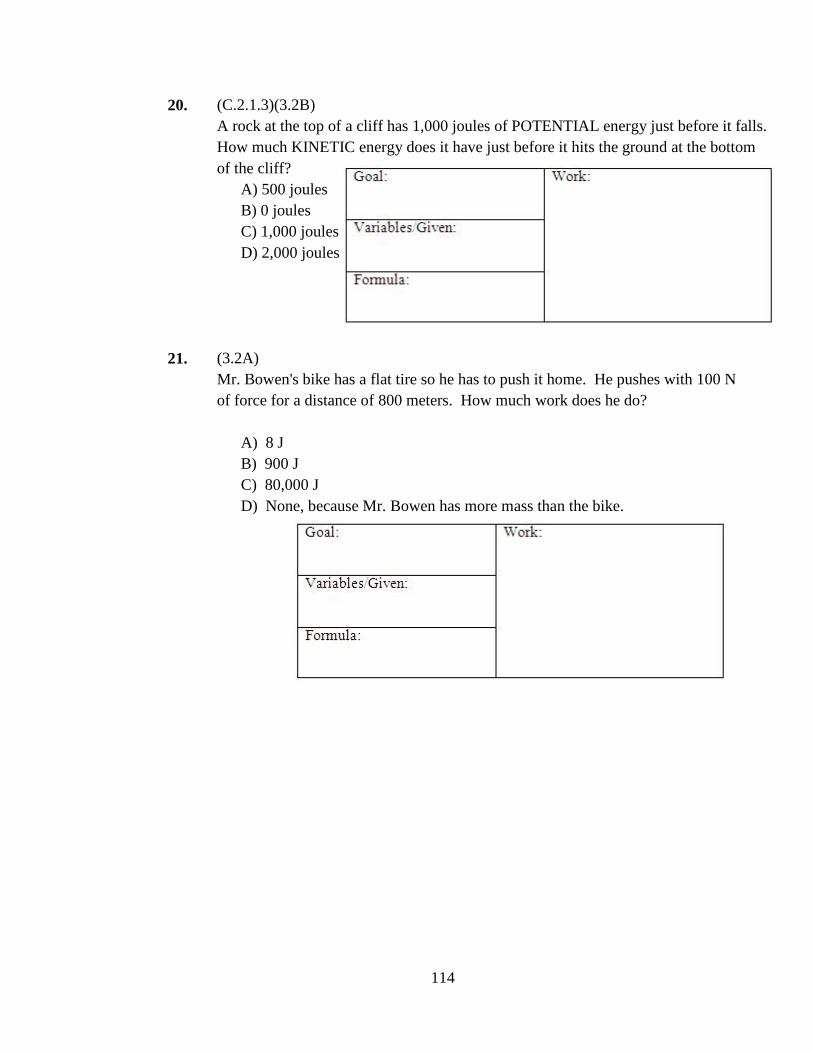
114
20. (C.2.1.3)(3.2B) A rock at the top of a cliff has 1,000 joules of POTENTIAL energy just before it falls. How much KINETIC energy does it have just before it hits the ground at the bottom of the cliff?
A) 500 joules B) 0 joules C) 1,000 joules D) 2,000 joules
21. (3.2A) Mr. Bowen's bike has a flat tire so he has to push it home. He pushes with 100 N of force for a distance of 800 meters. How much work does he do?
A) 8 J B) 900 J C) 80,000 J D) None, because Mr. Bowen has more mass than the bike.
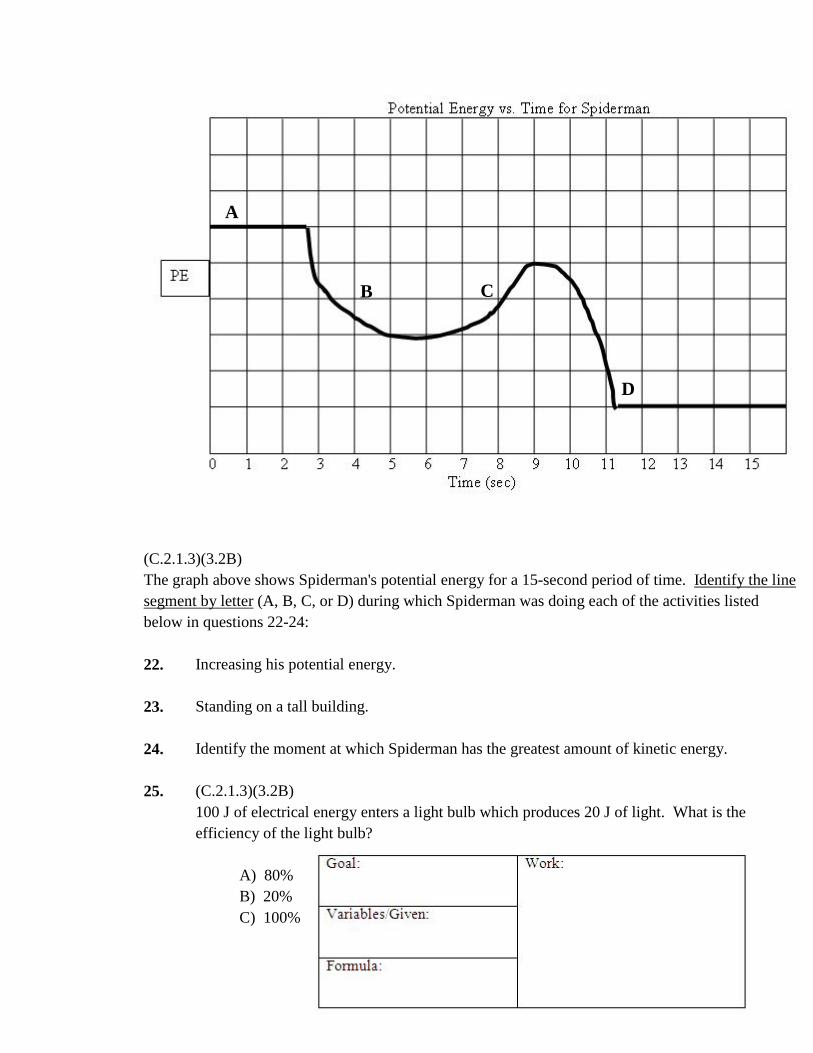
115
(C.2.1.3)(3.2B) The graph above shows Spiderman's potential energy for a 15-second period of time. Identify the line segment by letter
22.
(A, B, C, or D) during which Spiderman was doing each of the activities listed below in questions 22-24:
Increasing his potential energy.
23. Standing on a tall building.
24. Identify the moment at which Spiderman has the greatest amount of kinetic energy.
25. (C.2.1.3)(3.2B)
100 J of electrical energy enters a light bulb which produces 20 J of light. What is the efficiency of the light bulb?
A) 80% B) 20% C) 100%
A
B C
D

116
26. (C.2.1.3)(3.2A) Tarzan slips and falls from a tree. As he is falling his:
A) kinetic energy decreases and his potential energy decreases. B) kinetic energy increases and his potential energy increases. C) kinetic energy increases and his potential energy decreases. D) kinetic energy decreases and his potential energy increases.
27. (C.3.1.1)(3.3B) A 2-kg ball moving at 4 m/s collides with another 2-kg ball at rest. After impact the total momentum of the system is:
A) 2 kg-m/s B) 4 kg-m/s C) 16 kg-m/s D) 8 kg-m/s
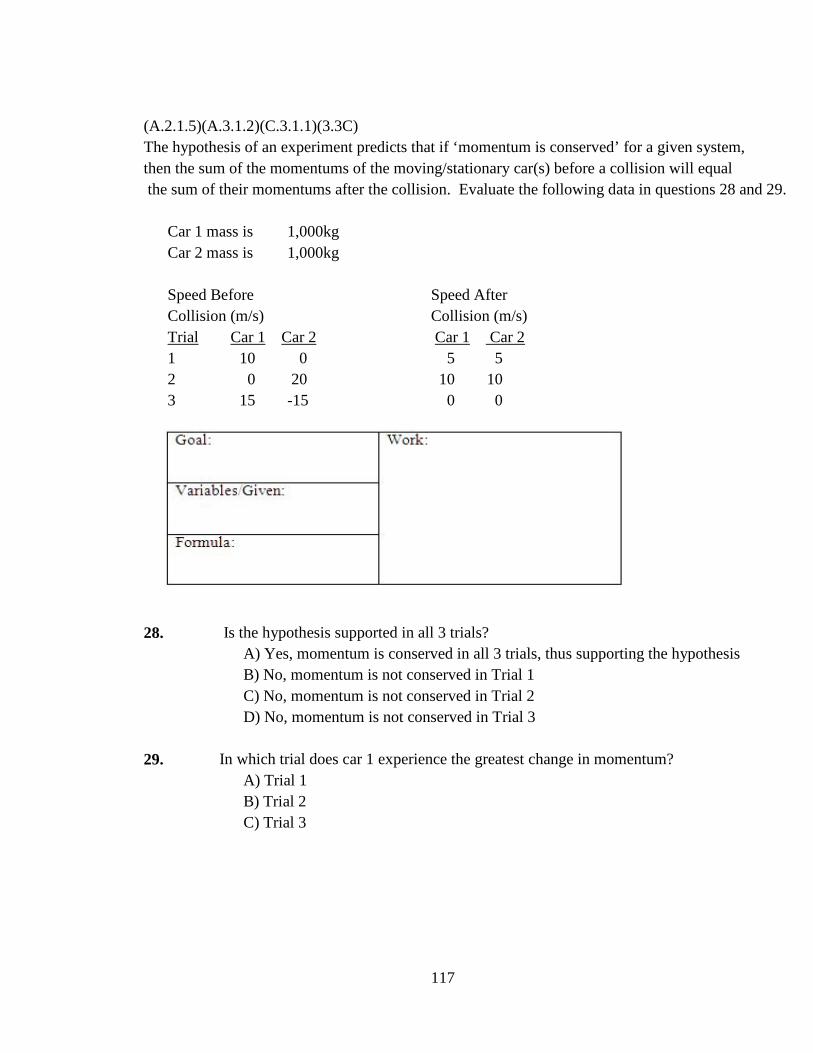
117
(A.2.1.5)(A.3.1.2)(C.3.1.1)(3.3C) The hypothesis of an experiment predicts that if ‘momentum is conserved’ for a given system, then the sum of the momentums of the moving/stationary car(s) before a collision will equal the sum of their momentums after the collision. Evaluate the following data in questions 28 and 29.
Car 1 mass is 1,000kg Car 2 mass is 1,000kg Speed Before Speed After Collision (m/s) Collision (m/s) Trial Car 1 Car 2 Car 1
Car 2 1 10 0 5 5 2 0 20 10 10 3 15 -15 0 0
28. Is the hypothesis supported in all 3 trials? A) Yes, momentum is conserved in all 3 trials, thus supporting the hypothesis B) No, momentum is not conserved in Trial 1 C) No, momentum is not conserved in Trial 2 D) No, momentum is not conserved in Trial 3
29. In which trial does car 1 experience the greatest change in momentum?
A) Trial 1 B) Trial 2 C) Trial 3

118
30. (4.1A) On Saturday, Marsha walks slowly up a set of stairs carrying a heavy book. The next day, she runs
31.
very fast up the same stairs with the same book. Compare the amount of work and power on Saturday and Sunday.
A) Work on both days is the same. Power is greater on Sunday. B) Work on both days is the same. Power on both days is the same. C) Work on Saturday is greater. Power on Sunday is greater. D) Work on Sunday is greater. Power on Sunday is greater.
(4.1B) Stacey lifts a 980 Newton barbell from the floor to a height of 2.0 meters in 1.5 seconds. The amount of power she generates is about:
A) 130 watts B) 200 watts C) 1,310 watts D) 1,960 watts
32. (4.1A) Joe walks up the stairs at Senior Hall South with a 15-kilogram backpack on his back. The stairs are 4 meters high. How much work against gravity did Joe do to lift his backpack up the stairs?
A) 60 joules B) 3.75 joules C) 588 joules D) 36.75 joules
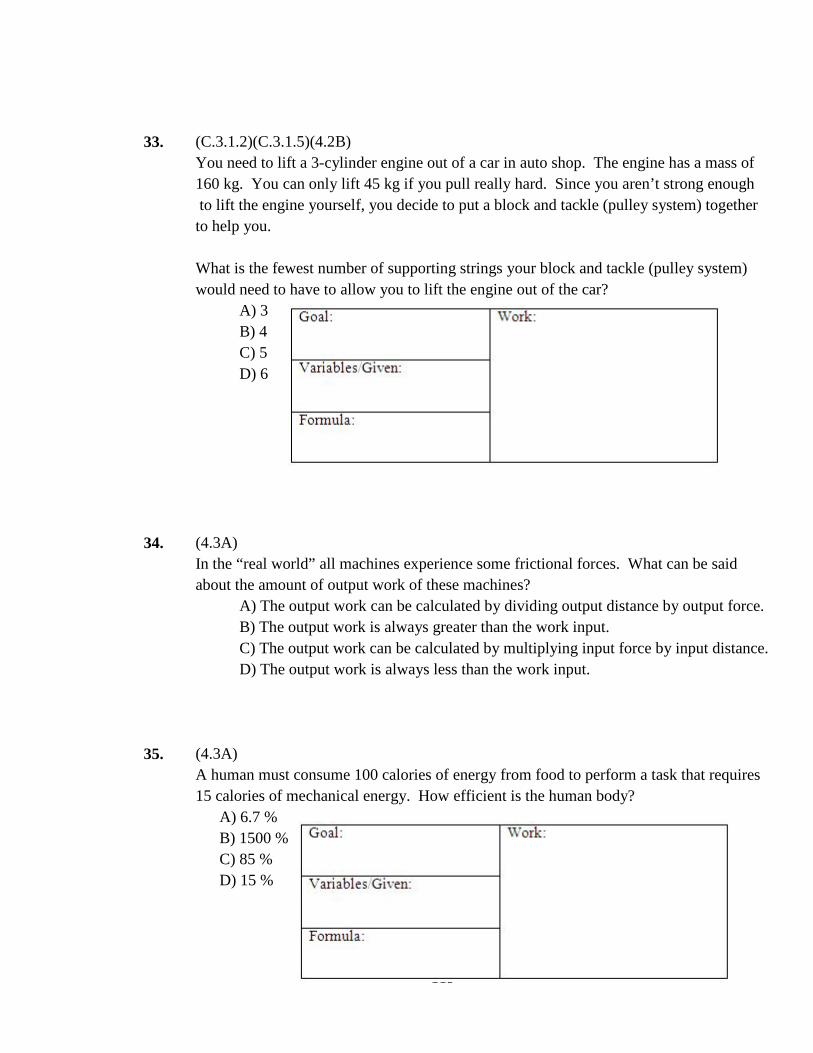
119
33. (C.3.1.2)(C.3.1.5)(4.2B) You need to lift a 3-cylinder engine out of a car in auto shop. The engine has a mass of 160 kg. You can only lift 45 kg if you pull really hard. Since you aren’t strong enough to lift the engine yourself, you decide to put a block and tackle (pulley system) together to help you.
What is the fewest number of supporting strings your block and tackle (pulley system) would need to have to allow you to lift the engine out of the car?
A) 3 B) 4 C) 5 D) 6
34. (4.3A) In the “real world” all machines experience some frictional forces. What can be said about the amount of output work of these machines?
A) The output work can be calculated by dividing output distance by output force. B) The output work is always greater than the work input. C) The output work can be calculated by multiplying input force by input distance. D) The output work is always less than the work input.
35. (4.3A) A human must consume 100 calories of energy from food to perform a task that requires 15 calories of mechanical energy. How efficient is the human body?
A) 6.7 % B) 1500 % C) 85 % D) 15 %
120
APPENDIX B – Liberty University IRB Approval
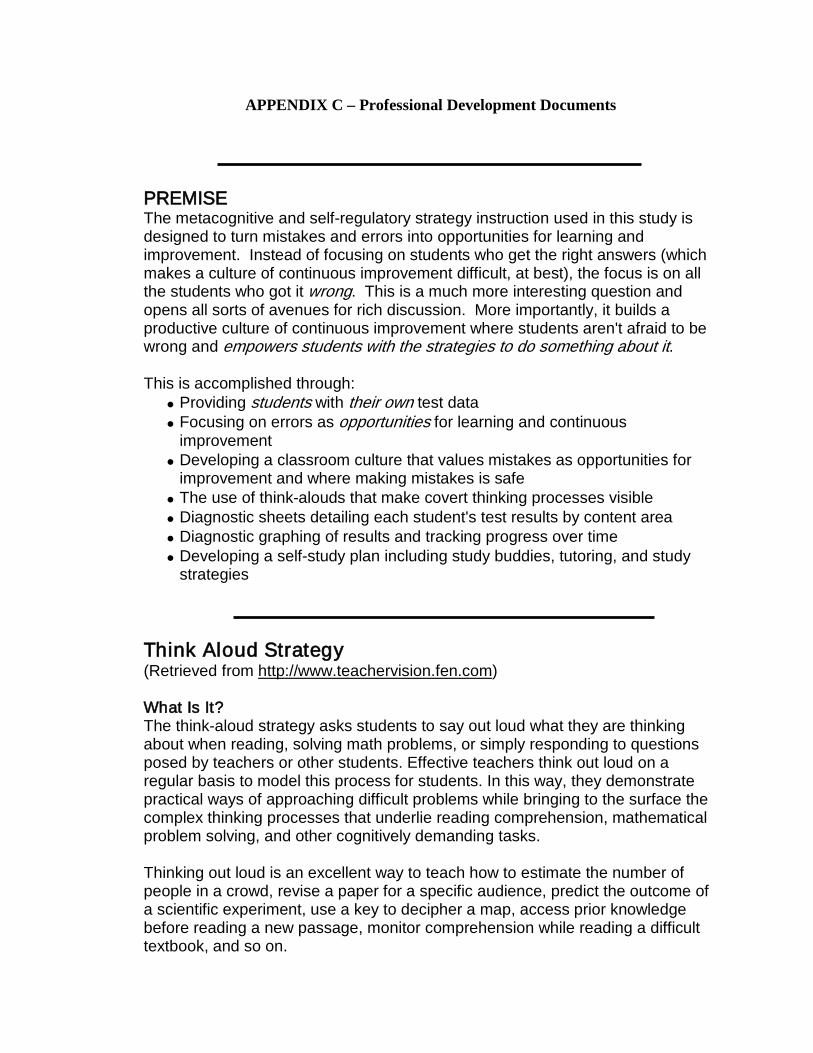
APPENDIX C – Professional Development Documents
PREMISE The metacognitive and self-regulatory strategy instruction used in this study is designed to turn mistakes and errors into opportunities for learning and improvement. Instead of focusing on students who get the right answers (which makes a culture of continuous improvement difficult, at best), the focus is on all the students who got it wrong. This is a much more interesting question and opens all sorts of avenues for rich discussion. More importantly, it builds a productive culture of continuous improvement where students aren't afraid to be wrong and empowers students with the strategies to do something about it. This is accomplished through:
• Providing students with their own test data • Focusing on errors as opportunities for learning and continuous
improvement • Developing a classroom culture that values mistakes as opportunities for
improvement and where making mistakes is safe • The use of think-alouds that make covert thinking processes visible • Diagnostic sheets detailing each student's test results by content area • Diagnostic graphing of results and tracking progress over time • Developing a self-study plan including study buddies, tutoring, and study
strategies Think Aloud Strategy (Retrieved from http://www.teachervision.fen.com) What Is It? The think-aloud strategy asks students to say out loud what they are thinking about when reading, solving math problems, or simply responding to questions posed by teachers or other students. Effective teachers think out loud on a regular basis to model this process for students. In this way, they demonstrate practical ways of approaching difficult problems while bringing to the surface the complex thinking processes that underlie reading comprehension, mathematical problem solving, and other cognitively demanding tasks. Thinking out loud is an excellent way to teach how to estimate the number of people in a crowd, revise a paper for a specific audience, predict the outcome of a scientific experiment, use a key to decipher a map, access prior knowledge before reading a new passage, monitor comprehension while reading a difficult textbook, and so on.
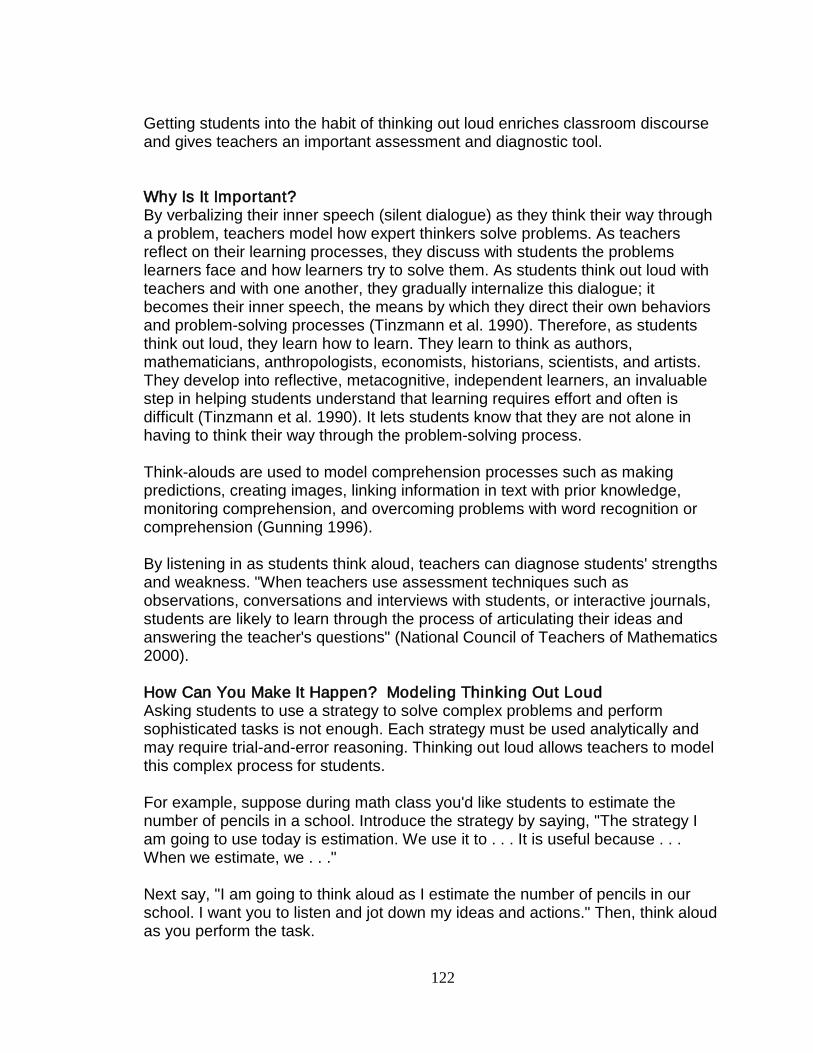
122
Getting students into the habit of thinking out loud enriches classroom discourse and gives teachers an important assessment and diagnostic tool. Why Is It Important? By verbalizing their inner speech (silent dialogue) as they think their way through a problem, teachers model how expert thinkers solve problems. As teachers reflect on their learning processes, they discuss with students the problems learners face and how learners try to solve them. As students think out loud with teachers and with one another, they gradually internalize this dialogue; it becomes their inner speech, the means by which they direct their own behaviors and problem-solving processes (Tinzmann et al. 1990). Therefore, as students think out loud, they learn how to learn. They learn to think as authors, mathematicians, anthropologists, economists, historians, scientists, and artists. They develop into reflective, metacognitive, independent learners, an invaluable step in helping students understand that learning requires effort and often is difficult (Tinzmann et al. 1990). It lets students know that they are not alone in having to think their way through the problem-solving process. Think-alouds are used to model comprehension processes such as making predictions, creating images, linking information in text with prior knowledge, monitoring comprehension, and overcoming problems with word recognition or comprehension (Gunning 1996). By listening in as students think aloud, teachers can diagnose students' strengths and weakness. "When teachers use assessment techniques such as observations, conversations and interviews with students, or interactive journals, students are likely to learn through the process of articulating their ideas and answering the teacher's questions" (National Council of Teachers of Mathematics 2000). How Can You Make It Happen? Modeling Thinking Out Loud Asking students to use a strategy to solve complex problems and perform sophisticated tasks is not enough. Each strategy must be used analytically and may require trial-and-error reasoning. Thinking out loud allows teachers to model this complex process for students. For example, suppose during math class you'd like students to estimate the number of pencils in a school. Introduce the strategy by saying, "The strategy I am going to use today is estimation. We use it to . . . It is useful because . . . When we estimate, we . . ." Next say, "I am going to think aloud as I estimate the number of pencils in our school. I want you to listen and jot down my ideas and actions." Then, think aloud as you perform the task.
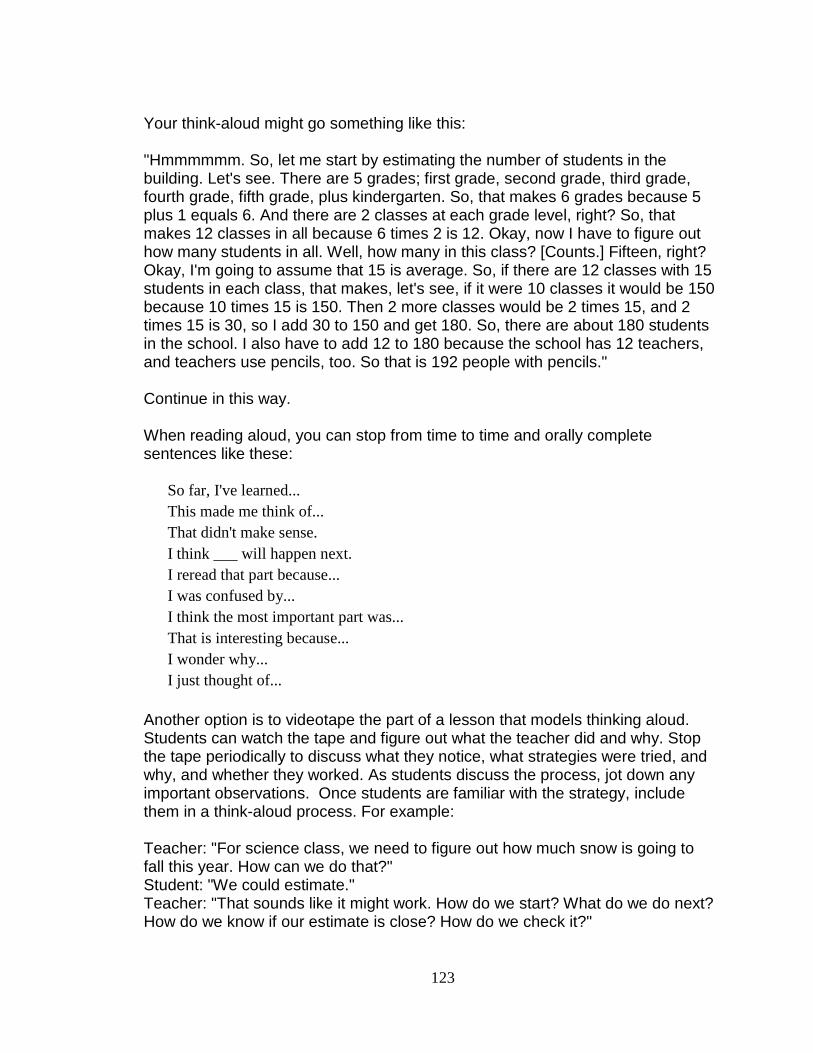
123
Your think-aloud might go something like this: "Hmmmmmm. So, let me start by estimating the number of students in the building. Let's see. There are 5 grades; first grade, second grade, third grade, fourth grade, fifth grade, plus kindergarten. So, that makes 6 grades because 5 plus 1 equals 6. And there are 2 classes at each grade level, right? So, that makes 12 classes in all because 6 times 2 is 12. Okay, now I have to figure out how many students in all. Well, how many in this class? [Counts.] Fifteen, right? Okay, I'm going to assume that 15 is average. So, if there are 12 classes with 15 students in each class, that makes, let's see, if it were 10 classes it would be 150 because 10 times 15 is 150. Then 2 more classes would be 2 times 15, and 2 times 15 is 30, so I add 30 to 150 and get 180. So, there are about 180 students in the school. I also have to add 12 to 180 because the school has 12 teachers, and teachers use pencils, too. So that is 192 people with pencils." Continue in this way. When reading aloud, you can stop from time to time and orally complete sentences like these:
So far, I've learned... This made me think of... That didn't make sense. I think ___ will happen next. I reread that part because... I was confused by... I think the most important part was... That is interesting because... I wonder why... I just thought of...
Another option is to videotape the part of a lesson that models thinking aloud. Students can watch the tape and figure out what the teacher did and why. Stop the tape periodically to discuss what they notice, what strategies were tried, and why, and whether they worked. As students discuss the process, jot down any important observations. Once students are familiar with the strategy, include them in a think-aloud process. For example: Teacher: "For science class, we need to figure out how much snow is going to fall this year. How can we do that?" Student: "We could estimate." Teacher: "That sounds like it might work. How do we start? What do we do next? How do we know if our estimate is close? How do we check it?"
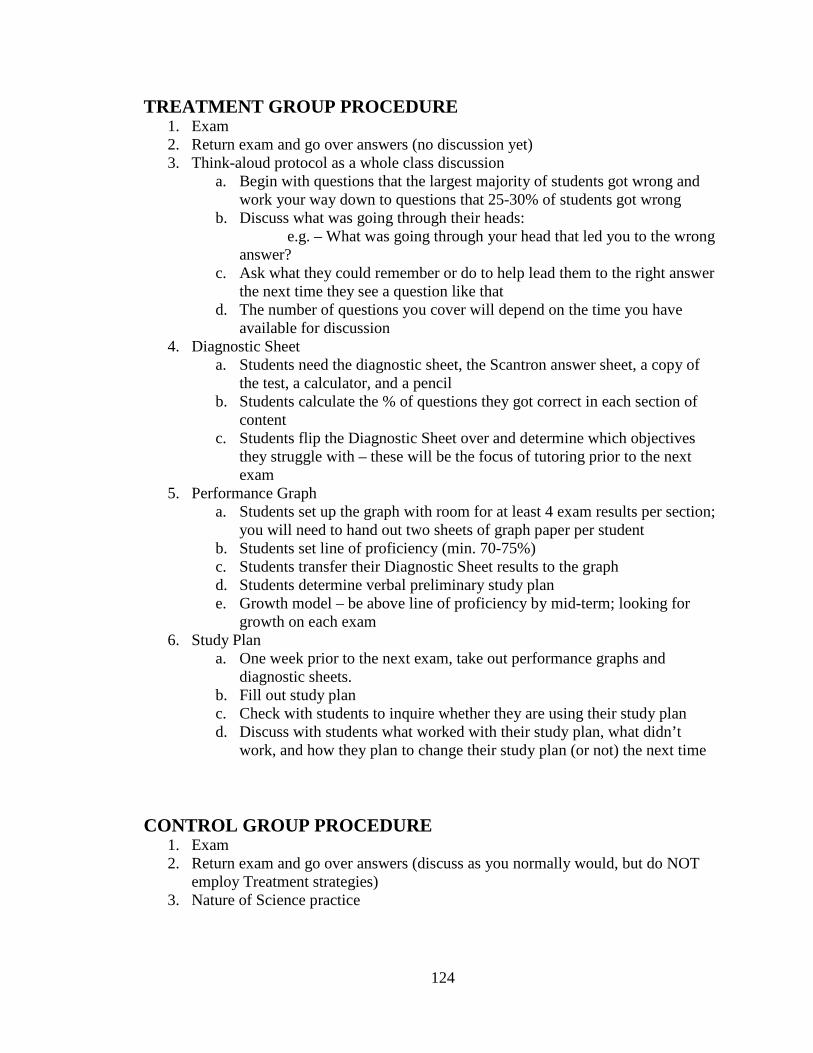
124
TREATMENT GROUP PROCEDURE 1. Exam 2. Return exam and go over answers (no discussion yet) 3. Think-aloud protocol as a whole class discussion
a. Begin with questions that the largest majority of students got wrong and work your way down to questions that 25-30% of students got wrong
b. Discuss what was going through their heads: e.g. – What was going through your head that led you to the wrong
answer? c. Ask what they could remember or do to help lead them to the right answer
the next time they see a question like that d. The number of questions you cover will depend on the time you have
available for discussion 4. Diagnostic Sheet
a. Students need the diagnostic sheet, the Scantron answer sheet, a copy of the test, a calculator, and a pencil
b. Students calculate the % of questions they got correct in each section of content
c. Students flip the Diagnostic Sheet over and determine which objectives they struggle with – these will be the focus of tutoring prior to the next exam
5. Performance Graph a. Students set up the graph with room for at least 4 exam results per section;
you will need to hand out two sheets of graph paper per student b. Students set line of proficiency (min. 70-75%) c. Students transfer their Diagnostic Sheet results to the graph d. Students determine verbal preliminary study plan e. Growth model – be above line of proficiency by mid-term; looking for
growth on each exam 6. Study Plan
a. One week prior to the next exam, take out performance graphs and diagnostic sheets.
b. Fill out study plan c. Check with students to inquire whether they are using their study plan d. Discuss with students what worked with their study plan, what didn’t
work, and how they plan to change their study plan (or not) the next time CONTROL GROUP PROCEDURE
1. Exam 2. Return exam and go over answers (discuss as you normally would, but do NOT
employ Treatment strategies) 3. Nature of Science practice
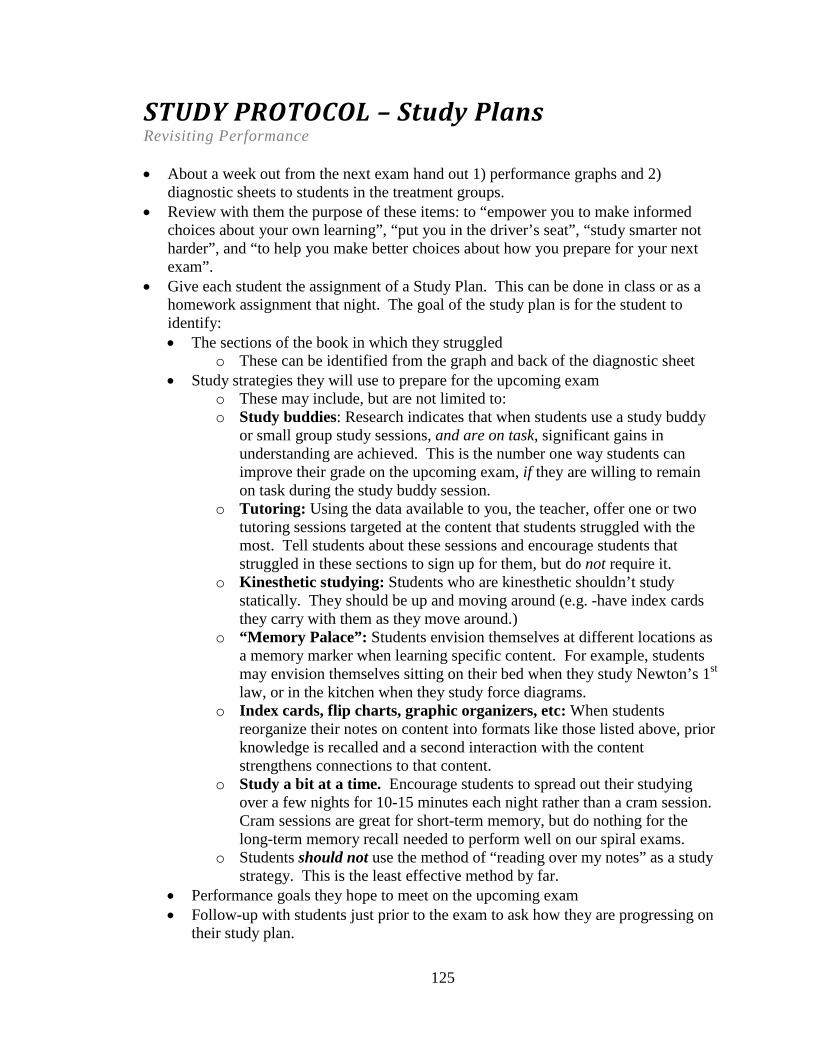
125
STUDY PROTOCOL – Study Plans Revisiting Performance
• About a week out from the next exam hand out 1) performance graphs and 2) diagnostic sheets to students in the treatment groups.
• Review with them the purpose of these items: to “empower you to make informed choices about your own learning”, “put you in the driver’s seat”, “study smarter not harder”, and “to help you make better choices about how you prepare for your next exam”.
• Give each student the assignment of a Study Plan. This can be done in class or as a homework assignment that night. The goal of the study plan is for the student to identify: • The sections of the book in which they struggled
o These can be identified from the graph and back of the diagnostic sheet • Study strategies they will use to prepare for the upcoming exam
o These may include, but are not limited to: o Study buddies: Research indicates that when students use a study buddy
or small group study sessions, and are on task, significant gains in understanding are achieved. This is the number one way students can improve their grade on the upcoming exam, if they are willing to remain on task during the study buddy session.
o Tutoring: Using the data available to you, the teacher, offer one or two tutoring sessions targeted at the content that students struggled with the most. Tell students about these sessions and encourage students that struggled in these sections to sign up for them, but do not require it.
o Kinesthetic studying: Students who are kinesthetic shouldn’t study statically. They should be up and moving around (e.g. -have index cards they carry with them as they move around.)
o “Memory Palace”: Students envision themselves at different locations as a memory marker when learning specific content. For example, students may envision themselves sitting on their bed when they study Newton’s 1st law, or in the kitchen when they study force diagrams.
o Index cards, flip charts, graphic organizers, etc: When students reorganize their notes on content into formats like those listed above, prior knowledge is recalled and a second interaction with the content strengthens connections to that content.
o Study a bit at a time. Encourage students to spread out their studying over a few nights for 10-15 minutes each night rather than a cram session. Cram sessions are great for short-term memory, but do nothing for the long-term memory recall needed to perform well on our spiral exams.
o Students should not use the method of “reading over my notes” as a study strategy. This is the least effective method by far.
• Performance goals they hope to meet on the upcoming exam • Follow-up with students just prior to the exam to ask how they are progressing on
their study plan.
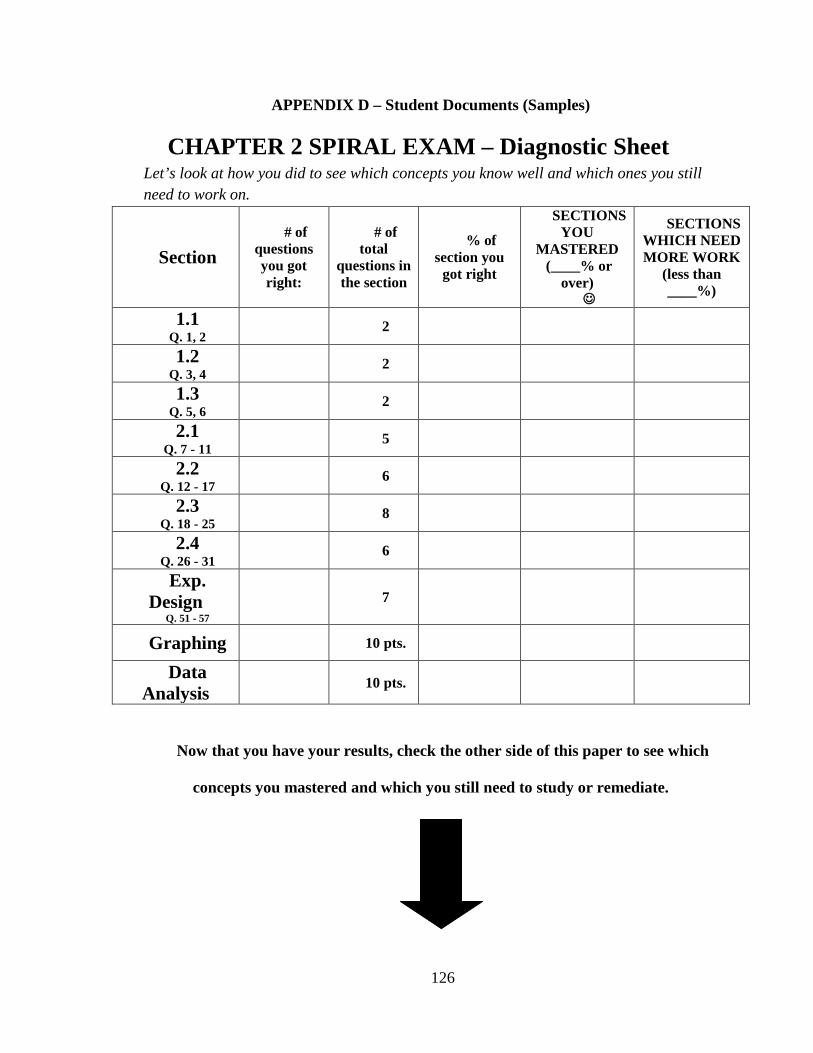
126
APPENDIX D – Student Documents (Samples)
CHAPTER 2 SPIRAL EXAM – Diagnostic Sheet Let’s look at how you did to see which concepts you know well and which ones you still need to work on.
Section # of
questions you got right:
# of total
questions in the section
% of section you
got right
SECTIONS YOU
MASTERED (____% or
over)
SECTIONS WHICH NEED MORE WORK
(less than ____%)
1.1 Q. 1, 2
2
1.2 Q. 3, 4
2
1.3 Q. 5, 6
2
2.1 Q. 7 - 11
5
2.2 Q. 12 - 17
6
2.3 Q. 18 - 25
8
2.4 Q. 26 - 31
6
Exp. Design
Q. 51 - 57
7
Graphing 10 pts.
Data Analysis 10 pts.
Now that you have your results, check the other side of this paper to see which
concepts you mastered and which you still need to study or remediate.
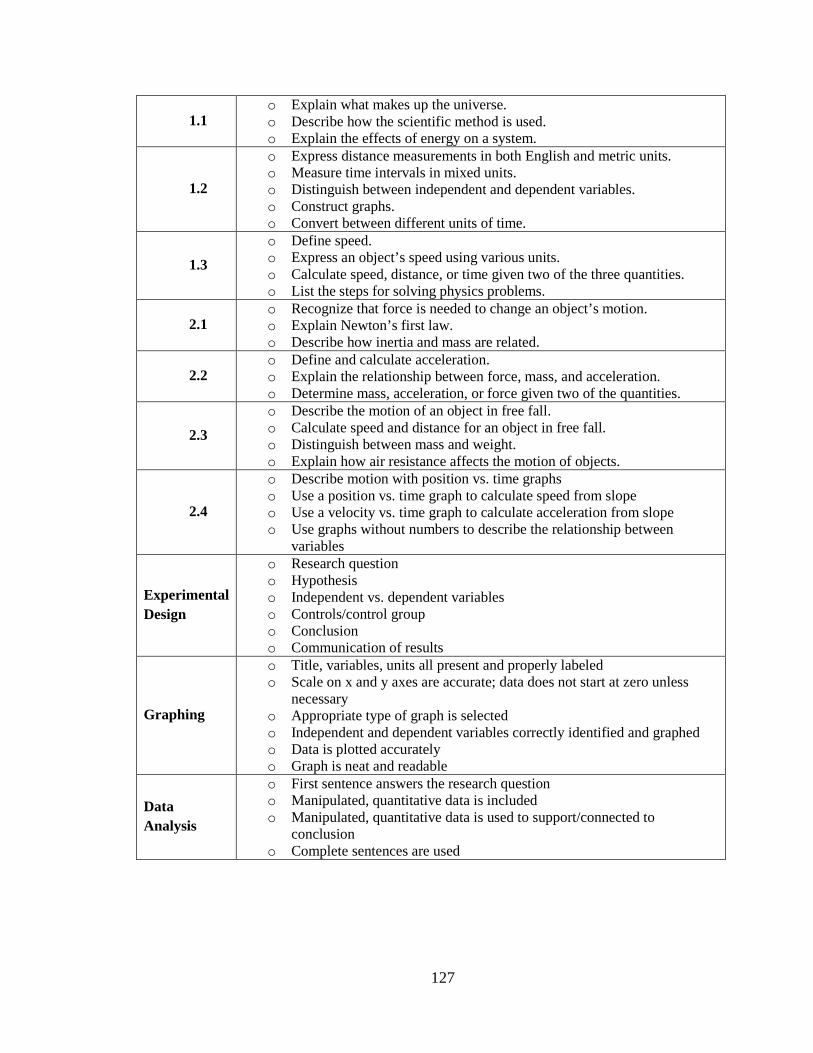
127
1.1 o Explain what makes up the universe. o Describe how the scientific method is used. o Explain the effects of energy on a system.
1.2
o Express distance measurements in both English and metric units. o Measure time intervals in mixed units. o Distinguish between independent and dependent variables. o Construct graphs. o Convert between different units of time.
1.3 o Define speed. o Express an object’s speed using various units. o Calculate speed, distance, or time given two of the three quantities. o List the steps for solving physics problems.
2.1 o Recognize that force is needed to change an object’s motion. o Explain Newton’s first law. o Describe how inertia and mass are related.
2.2 o Define and calculate acceleration. o Explain the relationship between force, mass, and acceleration. o Determine mass, acceleration, or force given two of the quantities.
2.3
o Describe the motion of an object in free fall. o Calculate speed and distance for an object in free fall. o Distinguish between mass and weight. o Explain how air resistance affects the motion of objects.
2.4
o Describe motion with position vs. time graphs o Use a position vs. time graph to calculate speed from slope o Use a velocity vs. time graph to calculate acceleration from slope o Use graphs without numbers to describe the relationship between
variables
Experimental Design
o Research question o Hypothesis o Independent vs. dependent variables o Controls/control group o Conclusion o Communication of results
Graphing
o Title, variables, units all present and properly labeled o Scale on x and y axes are accurate; data does not start at zero unless
necessary o Appropriate type of graph is selected o Independent and dependent variables correctly identified and graphed o Data is plotted accurately o Graph is neat and readable
Data Analysis
o First sentence answers the research question o Manipulated, quantitative data is included o Manipulated, quantitative data is used to support/connected to
conclusion o Complete sentences are used

128
Individual Study Plan
Name: ____________________________
Chapter: _____
STEP ONE: Identify sections from book in which you struggled (graph/diagnostic sheet)
________________________________________________________________________
________________________________________________________________________
________________________________________________________________________
________________________________________________________________________
_______________________________________________________________________
STEP TWO: Identify at least two strategies you will use to prepare for the next test
________________________________________________________________________
________________________________________________________________________
________________________________________________________________________
________________________________________________________________________
_______________________________________________________________________
STEP THREE: Create a performance goal for each section above that you hope to meet
for this test. Remember: it isn’t necessary to hit your goal all at once!
________________________________________________________________________
________________________________________________________________________
________________________________________________________________________
________________________________________________________________________
_______________________________________________________________________