Embed Size (px)
Citation preview

The Effect of Private Information and Monitoring onthe Role of Accounting Quality in Investment Decisions
The MIT Faculty has made this article openly available. Please share how this access benefits you. Your story matters.
Citation Beatty, Anne, W. Scott Liao, and Joseph Weber. “The Effect ofPrivate Information and Monitoring on the Role of AccountingQuality in Investment Decisions*.” Contemporary AccountingResearch 27.1 (2010): 17–47.
As Published http://dx.doi.org/10.1111/j.1911-3846.2010.01000.x
Publisher Wiley Blackwell
Version Author's final manuscript
Citable link http://hdl.handle.net/1721.1/76345
Terms of Use Creative Commons Attribution-Noncommercial-Share Alike 3.0
Detailed Terms http://creativecommons.org/licenses/by-nc-sa/3.0/

Electronic copy available at: http://ssrn.com/abstract=1499307
The Effect of Private Information and Monitoring on the Role of Accounting Quality in Investment
Decisions
ANNE BEATTY
[email protected], 614-292-541
Fisher College of Business
The Ohio State University
442 Fisher Hall
2100 Neil Avenue
Columbus, OH 43210
SCOTT LIAO
[email protected], 416-946-8599
Rotman School of Management
University of Toronto105 St. George Street
Toronto, ON M5S 3E6
JOSEPH WEBER
[email protected], 617-253-4310
Sloan School of Management
Massachusetts Institute of Technology
50 Memorial Drive, E52-325
Cambridge, MA 02142
June 30, 2009
*Corresponding author. Beatty thanks Deloitte & Touche for financial support. The authors would like to
thank Jennifer Altamuro, Ron Dye, Ben Lansford, Tom Lys, Waleed Muhana, Rick Johnston, Shail Pandit,
Joe Piotroski, Shyam Sunder, Rick Young, Helen Zhang, and seminar participants at Stanford University,
Northwestern University, and Ohio State University.

Electronic copy available at: http://ssrn.com/abstract=1499307
Abstract
We investigate how private information and monitoring affect the role of accounting quality in reducing the
investment-cash flow sensitivity. We argue that access to private information and direct restrictions on
investments are likely to affect the extent to which accounting quality reduces financing constraints. Our
results suggest that for financially constrained firms, banks’ access to private information decreases the
value of accounting quality. We further find that, for both financially constrained and unconstrained firms,
covenants directly restricting capital expenditures also mitigate the importance of accounting quality. Our
results suggest that when information asymmetry problems are likely to be the largest, accounting quality is
most important. However, the importance of accounting quality is mitigated if outside capital suppliers
have access to private information and is eliminated if they impose contractual restrictions on investment.
We also provide evidence that banks’ access to private information reduces the cash flow sensitivity of
cash and mitigates the importance of accounting quality in reducing this sensitivity. This additional
evidence suggests that our investment-cash flow sensitivity results are not driven by measurement error of
the investment opportunity set.
Keywords Private information; Monitoring; Accounting Quality; Investment

1
1. Introduction
Information asymmetry between managers and outside capital suppliers can affect how firms
finance capital investments. A growing body of evidence indicates that better accounting quality can reduce
information asymmetry costs and reduce financing constraints. Consistent with this possibility, Biddle and
Hilary (2006) document that higher accounting quality reduces the sensitivity of firms’ investment to their
internally generated cash flows. Verdi (2006) and Biddle, Hillary, and Verdi (2009) find that accounting
quality is positively correlated with investment for firms prone to under-invest and is negatively correlated
with investment for firms prone to over-invest.
The importance of accounting quality on investment inefficiency may be mitigated when outside
capital suppliers have private information or can directly monitor managers. By accessing private
information and controlling managerial actions, outside capital suppliers can directly affect a firm’s
investments reducing the importance of accounting quality. Consistent with this idea, Biddle and Hilary
(2006) compare the influence of accounting quality on investment efficiency across countries. They find
that accounting quality influences investment efficiency in the U.S., but not in Japan. They suggest that one
potential explanation for this cross-country difference is the mix of debt and equity in the capital structures
of U.S. versus Japanese firms.
We extend this research by examining how different sources of financing affect the importance of
accounting quality on firms’ investment-cash flow sensitivity. Directly testing how different sources of
financing influence the effect of accounting quality on the investment-cash flow sensitivity is challenging
because a comparison of firms that recently obtained debt financing to those that did not could be affected
by their ability to obtain financing. To alleviate this problem, we restrict our sample to firms that have all
recently obtained debt financing and exploit the differences in access to private information and monitoring
that exist across the public debt to private lending continuum as suggested by Diamond 1991.1
We
acknowledge that the sensitivity of investment to internal cash flows may be lower immediately after
obtaining debt financing. However, this possibility would bias against rejecting our hypotheses.
Specifically, we identify a sample of 1,163 firms on the Securities Datacorp (SDC) database that
have recently raised capital through the issuance of either public debt or syndicated bank debt. We restrict
our sample to firms that have recently obtained debt financing to hold constant the firm characteristics

2
associated with borrowing. However, within the sample of firms that have recently obtained debt financing,
there are likely to be significant differences in the capital provider’s access to private information and the
constraints they place on managerial actions.
Diamond’s (1991) theory implies that public debt holders have less access to private information
and are thus less effective in monitoring borrowers than banks. Based on these arguments, we predict that
accounting quality should have a larger influence on firms’ investment-cash flow sensitivity for firms with
public debt than for those with bank debt. Second, we expect that the effect of accounting quality on firms’
investment policies will depend on whether lenders contractually restrict investment. We predict that when
firms face contractual restrictions on investments, overinvestment problems are partially addressed, and
accounting quality becomes less valuable and less likely to affect the investment-cash flow sensitivity.
To provide evidence on these hypotheses, we estimate a model of investments on internal cash
flows separately for the sample of firms that only issue public debt and for the sample of firms that issue
syndicated loans. In these regressions, we interact the cash flow variable with our measure of accounting
quality to investigate whether accounting quality influences investment-cash flow sensitivities. For the
bank sample, we further interact the product of the cash flow and accounting quality variables with the
investment restrictions variables to examine whether capital expenditure covenants affect the investment-
cash flow sensitivity. We use both ordinary least squares (OLS) and endogenous switching model
estimation to address potential sample selection bias arising from the public versus bank debt financing
choice. Our first-stage model of the determinants to enter the public versus private debt market follows
Bharath, Sunder, and Sunder 2008. We estimate second-stage “regime” investment model regressions
separately for firms that have public versus private debt. These regime regressions also control for
endogeneity in the capital expenditure covenant choice using the fitted values from a first-stage regression
model of the determinants of including an investment restriction in the debt contract.
Consistent with prior research, we find that investment is sensitive to internal cash flows and the
investment-cash flow sensitivity is lower for firms with higher accounting quality. These results hold in
both our OLS and endogenous switching model regressions. We also find that, for both estimation
techniques, investment restrictions reduce the investment-cash flow sensitivity and reduce the importance
of accounting quality. In this analysis using the overall sample, we do not find a relationship between the

3
type of lender providing capital and the effect of accounting quality on the investment-cash flow
sensitivity.
In a series of sensitivity analyses, we also consider the possibility that the investment-cash flow
sensitivity captures information not only about financing constraints but also about firms’ investment
opportunities. To address this concern, we examine the effect of sources of financing on investment-cash
flow sensitivities for financially constrained firms versus unconstrained firms.
To identify financially constrained firms we use an ex ante definition of financial constraint based
on the Whited and Wu 2004 index. We expect that the investments of financially constrained firms, who
have greater information asymmetry problems, will depend more on internally generated funds. Similarly,
investment-cash flow sensitivities for financially constrained firms will depend more on the quality of
accounting information, the existence of private information, and the use of contractual investment
restrictions. Consistent with these conjectures, we find that for financially constrained firms, accounting
quality is less important in reducing investment-cash flow sensitivities in the presence of private
information. These results support the hypothesis that private information and accounting quality serve as
substitutes. This result is also consistent with the notion that access to private information is more
important when information asymmetry problems are likely to be high.
In a second sensitivity analysis, we adopt a balance sheet liquidity approach to address the concern
that growth opportunities captured in our cash flow measures affect the association between cash flows and
investments. Almeida, Campello, and Weisbach (2004) suggest that replacing investment with changes in
cash holdings will reduce the influence of the investment opportunity set, as changes in cash balances
should be uncorrelated with investment opportunities in the absence of financing constraints. Consistent
with previous results, we find that accounting quality reduces the cash-cash flow sensitivity, but that
lenders’ access to private information decreases this effect.
Jointly, our results confirm the importance of accounting quality in mitigating the negative effects
of information asymmetry on the investment-cash flow sensitivity. Our results are also consistent with
Biddle and Hilary’s 2006 argument that accounting quality should play a lower role when capital suppliers
have alternative information problem mitigating mechanisms. However, they are inconsistent with
accounting quality playing no role in improving investment efficiency in the debt market.2

4
Our paper also expands our understanding of the importance of accounting information by
identifying the contexts in which the quality of the firm’s accounting information is likely to be important.
When information asymmetry problems are likely to be the largest, accounting quality is more important.
However, in these settings, if outside capital suppliers impose contractual investment restrictions, or have
access to private information, then accounting quality is less important. Furthermore, our finding that
accounting quality reduces the sensitivity of balance sheet liquidity to cash flows and that the importance of
accounting quality decreases in the face of bank debt suggests that our investment-cash flow sensitivity
results are not merely due to cash flows capturing firms’ investment opportunity sets.
Section 2 provides background for our study. We discuss our hypothesis development in Section
3. We describe our sample in Section 4 and our research design in Section 5. We discuss our empirical
results in Section 6 and conclude in Section 7.
2. Background
Related research
Several recent papers examine the effect of accounting quality on firms’ investments using a
variety of approaches. Bushman, Piotroski, and Smith (2005) focus on firms’ propensities to promptly
withdraw capital from losing projects. They investigate whether firms located in countries with accounting
regimes characterized by more timely accounting recognition of economic losses reduce capital
investments more quickly when investment opportunities decline. They argue that their results support this
hypothesis and that this effect is stronger in countries with more diffuse ownership.
Verdi (2006) is concerned not only with whether firms over-invest in losing projects, but also with
whether they under-invest in positive net-present-value projects. His findings that higher accounting quality
mitigates the overinvestment problem and that the effect is greater for firms with dispersed ownership are
similar to those in Bushman et al. 2005. However, he states that he “cannot conclude that accounting
quality is associated with lower underinvestment due to the reduction in information asymmetry between
the firm and investors.”
Biddle and Hilary (2006) examine how accounting quality affects firms’ investment-cash flow
sensitivity. They find that higher accounting quality is associated with lower investment-cash flow
sensitivity in the U.S., but not in Japan. They argue that the difference in results across these two countries

5
is driven by the fact that more capital in the U.S. is provided through arm’s-length transactions with
investors who do not have access to private information channels. They do not directly test this
interpretation. Furthermore, as they acknowledge, it is not clear which attributes of the private debt markets
drive their results. Their tests do not distinguish between lenders’ ability to obtain private information
versus their ability to monitor managers once capital is supplied. Thus, the existing research examining the
effects of accounting quality on investments concludes that accounting quality improves investment
efficiency, but the improvements are predominantly in firms with diffuse ownership where equity is likely
to be the source of capital.
Given the results in Bharath et al. (2008), Francis, Schipper, and Vincent (2005), and
Whittenberg-Moerman (2008) that firms with relatively higher accounting quality are rewarded with a
reduction in the cost of debt, it is somewhat surprising that this lower cost of capital would not lead to
improved investment efficiency. The central argument underlying these papers is that improved accounting
quality allows lenders to reduce the costs associated with information asymmetry suggesting that
accounting quality should increase investment efficiency even for firms that rely on debt financing. In this
paper we attempt to reconcile these results by looking at the contexts in the U.S. debt markets in which
accounting quality is likely to be the most important. We also attempt to distinguish between the effects of
lenders’ private information versus monitoring on the role accounting quality plays in reducing financing
constraints and improving investment efficiency.
Features of U.S. debt markets
Diamond (1991) describes the U.S. debt market as a continuum of access to private information
and monitoring. At one end of the spectrum are public debt holders who do not have direct access to private
information and engage in very little monitoring. At the other end is private bank debt, which is
characterized by lenders who have greater access to private information and by loans that contain numerous
covenants. There is much theoretical banking literature that focuses on banks’ ability to reduce information
asymmetries. Empirical support for these theoretical models is provided by the findings in James 1987 that
banks provide cheap “informed” funds as opposed to the costly “uninformed” funds provided by public
debt. Similarly, Krishnaswami, Spindt, and Subramaniam (1999) find that firms with a greater degree of
information asymmetry rely more on bank debt.

6
Previous research has also documented that covenant use differs for public versus bank debt. For
example, Billet, King, and Mauer (2007) document covenant use for a sample of 7,567 public bonds issued
between 1995 and 2003 with covenant data available on the FISD database. They find that less than 5
percent of these issues include capital expenditure restrictions, while Nini, Smith, and Sufi (2009)
document that the incidence of these covenants in syndicated bank loans is much higher.3 They find capital
expenditure restrictions in 32 percent of their sample of 3,720 deals with covenant data.
We exploit the difference in banks’ access to private information relative to public debt holders to
explore how private information affects the role that accounting quality plays in reducing investment-cash
flow sensitivities. In addition, the prevalence of capital expenditure covenants in bank debt contracts allows
us to further distinguish between the importance of banks’ private information and their ability to monitor
the borrower in mitigating information problems.
3. Hypothesis development
In the absence of information problems, investment decisions should not depend on internal cash
flows. However, in the presence of information asymmetry between managers and outside capital suppliers,
firms may face financing constraints causing them to rely on internally generated funds to finance their
investments (Fazzari, Hubbard, and Peterson 1988 and 2000). Firms’ dependence on internal cash flows
will increase with the extent of information asymmetry between managers and capital providers.
Capital providers with greater access to private information (like banks) are likely to have superior
information about firms compared to lenders that obtain their information from public sources (like public
debt holders).4 Biddle and Hilary (2006) argue that banks’ superior private information should serve as a
substitute for accounting quality in determining the sensitivity of investment to internal cash flows. While
this prediction is consistent with theoretical models such as Holthausen and Verrecchia 1998, recent
empirical research suggests that rather than acting as substitutes, private information and public
information may act as complements.
For example, Francis, Schipper, and Vincent (2002) find a positive association between the market
reaction to analysts’ reports and quarterly earnings announcement. Similarly, Chen, Cheng, and Lo (2006)
argue that private and public information sources can complement one another if the public information
contains complex data that is made more informative after additional explanation and interpretation. Given

7
the conflicting predictions from the theoretical versus empirical work, we expect that access to private
information and accounting quality could serve either as substitutes or as complements in determining the
investment-cash-flow sensitivity. Our first hypothesis is:
HYPOTHESIS 1. The effect of accounting quality on the investment-cash flow sensitivity is
mitigated for firms issuing bank debt relative to those issuing public debt if public and
private information are substitutes and is enhanced if these two sources of information
are complements.
In addition, banks often include explicit covenants in their debt agreements to limit managers’
opportunistic investments. These covenants provide banks with an alternative mechanism to mitigate the
problems associated with information asymmetry. Based on the assumption that capital expenditure
covenants provide a substitute mechanism for addressing information problems, we expect that the
importance of accounting quality in reducing the investment-cash flow sensitivity to be mitigated in the
presence of these covenants. (The opposite prediction would hold if these covenants and accounting quality
are complements rather than substitutes.) Our second hypothesis is:
HYPOTHESIS 2. The effect of higher quality accounting on the investment-cash flow sensitivity
is mitigated by the existence of a capital expenditure covenant.
4. Sample characteristics
Sample selection
We test our hypotheses using a sample of firms listed on the SDC database that have issued public
debt or entered into a syndicated loan. We include firm years in which these public or bank debts are
outstanding. To deal with the selection bias of investment covenants in bank loans, we require that the SDC
database have information on the size of the loan, the type of loan (revolver or term), and whether the bank
loan contains an investment covenant.5 We then merge this data with the COMPUSTAT database to obtain
financial accounting information for the firm that entered into the loan or debenture. This data restriction
resulted in a final sample of 1,163 firms (4,475 firm years) that had all of the data necessary to test our
hypotheses.
Of the 4,475 firm years in our final sample we noted that 1,083 observations issued public debt,
3,392 observations issued bank debt (syndicated loans), and 1,026 observations issued both. Within the
final bank debt sample, 1,124 observations are associated with the use of covenants that restrict investments
8
representing 33 percent of the bank debt sample. These percentages are similar to those reported in Nini et
al. 2009.
Accounting quality proxy
Given a lack of consensus about the best way to measure accounting quality we calculate four
different measures of accounting quality and combine them to make one composite measure.6 All of our
accounting quality measures are estimated on a firm-specific basis using 10 years of data, including the
investment year.7 When estimating the regression we require at least eight years of observations.
Our first accounting quality measure, AQ1, is based on Dechow and Dichev 2002. This measure
captures the extent to which accruals map into cash flows. For each firm in the sample we run a time-series
regression of total current accruals on cash flows from operations measured concurrently and with a one
period lead and one period lag. The variable AQ1 is measured as the quintile ranking of Adjusted R-
squared from these regressions (this measure is consistent with the measure used in Biddle and Hilary
2006). Following Wysocki (2005), our second measure of earnings quality is a measure of earnings
persistence. For each sample firm, we run a time-series regression of one period ahead earnings on current
earnings. The variable AQ2 is measured as the quintile ranking of coefficients on current earnings from
these regressions.
Our third measure of earnings quality, AQ3, is measured as the quintile ranking of Adjusted R-
squared from our earnings persistence model, and is designed to measure earnings predictability. Our
fourth measure, AQ4, captures cash flow predictability. It is measured as the quintile ranking of Adjusted
R-squared from a regression of one-year-ahead cash flows on current earnings. We then combine these four
measures by taking the average of the ranks of each of our four individual measures to create our composite
measure, AQ.
5. Research design
Investment model
We test our hypotheses about the effects of accounting quality, investment restrictions, and banks’
private information on the investment-cash flow sensitivity by estimating the following investment model:8
Investment = α + β1 Inv_Cov + β2 AQ + β3 AQ*Inv_Cov + β4 CFO + β5 CFO*Inv_Cov +
β 6 CFO*AQ + β7 CFO*AQ*Inv_Cov + β8 TobinsQ + β 9 Size +
β10 Credit Rating + β11 Leverage+ β12 Tangibility +
β13 ROE + ε (1)

9
VARIABLE DEFINITIONS.
Investment: the firm’s total capital expenditures (COMPUSTAT #128) divided by total average assets
(COMPUSTAT #6).
Inv_Cov: an indicator variable equal to one when the bank debt contains a covenant restricting
capital investment, 0 otherwise.
CFO: cash flow from operations (COMPUSTAT #308) divided by average total assets
(COMPUSTAT #6).
AQ: the average of the rankings of AQ1, AQ2, AQ3, and AQ4.
TobinsQ: the book value of total assets (COMPUSTAT #6) plus market value of equity
(COMPUSTAT #199 * COMPUSTAT #25) minus book value of equity (COMPUSTAT
#60) and deferred tax (COMPUSTAT # 74) divided by the book value of total assets.
Size: the log of total assets (COMPUSTAT #6).
Credit Rating: a categorical variable that ranges from 1-4. For firms with rated debt the variable is 1 if
the rating is between D and B+, 2 if their rating is between BB- and BB+, 3 if their
rating is between BBB- and BBB+, and 4 if their rating is between A- and AAA. For firms
without rated debt, we follow Barth et al. 2008 to develop a credit rating that falls within
this 1-4 scale.
Leverage: long-term debt (COMPUSTAT #9) divided by the sum of long-term debt and market
value of equity (COMPUSTAT #199 * COMPUSTAT #25).
Tangibility: Almeida and Campello’s (2007) estimate of asset tangibility: 0.715* accounts receivable
(COMPUSTAT #2) + 0.547* inventory (COMPUSTAT #3) + 0.535*PPE (COMPUSTAT
#8) +cash (COMPUSTAT #1) divided by total assets (COMPUSTAT #6).
ROE: net income (COMPUSTAT #172) divided by average shareholders’ equity
(COMPUSTAT #60).
Consistent with existing research, we measure the extent of the firm’s investing activities,
Investment, as the total capital expenditures of the firm. In an untabulated sensitivity analysis we also
include expenditures on research and development in our measurement of investment and find similar
results to those reported in the paper.9 We measure cash flows, CFO, as the cash flows from operations
since it excludes accruals that may be correlated with investments.10
If firms’ investments are sensitive to their internal cash flows then we would expect a positive
coefficient on the CFO variable. Higher accounting quality should reduce the information problems that
lead to the investment-cash flow sensitivity, so we expect the coefficient on CFO*AQ to be negative. We
also include control variables for other factors that are likely to affect the firm’s investment choices.11
Consistent with previous research, we control for the firm’s growth options in place by including TobinsQ,
which we expect to be positively correlated with investment. In addition, we control for Size, Credit
Rating, and Leverage. Smaller firms, firms with lower credit ratings, and more levered firms are expected
to have fewer investments. Finally, we also include controls for the tangibility of the firm’s assets,
10
Tangibility, and firm performance, ROE, but we do not make explicit predictions on the effect of these
variables on investment.
Our analysis is conducted at the firm-year level using all firm years with available data between
the debt issuance and maturity dates. Thus, each year after the firm has entered into the loan, we measure
investment and the corresponding independent variables until the loan matures. For those loans that occur
towards the end of our sample period, we artificially set the debt “maturity” to 2005, since financial data
beyond 2005 is not available. We include firm fixed effects and year fixed effects in our regressions.
To test Hypothesis 1, we compare the coefficients on CFO*AQ across public versus bank debt
samples. We hypothesize that the coefficient on CFO*AQ should be lower in the bank debt sample if
private information and accounting information serve as substitutes and should be higher if these sources of
information are complements.12
To test Hypothesis 2, we include a measure of the use of investment
covenant restrictions, Inv_Cov, in the regression.13
The existence of an investment covenant restriction is
expected to reduce the importance of information asymmetries and is therefore expected to reduce the
benefits of higher accounting quality, thus the coefficient on CFO*AQ*Inv_Cov is expected to be
positive.14
Since the choice of issuing bank debt versus public debt is likely to cause a self-selection bias in
OLS regressions, we estimate an endogenous switching model that controls for the selection problem
associated with the debt-financing source. Similarly, the choice of using debt covenants to restrict
investments is also likely to be endogenously determined. To address this concern, we estimate a first-stage
model of the determinants of the decision to include an investment restriction in the debt contract and
include the fitted value from that model in our endogenous switching model.
Endogenous switching model of public versus bank debt choice
To measure private information’s effect on the relationship between accounting quality and
investment-cash flow sensitivities, we compare sub-samples of firms with public versus bank debt. The
public debt subsample includes firm years in which no syndicated bank loan was currently or previously
issued. The bank debt sub-sample refers to firm years with at least one syndicated bank loan outstanding.
To control for the endogeneity of the choice of bank debt and public debt, we follow Bharath et al.
2008 estimating an endogenous switching model proposed by Lee 1978. The endogenous switching model

11
has a first-stage selection equation for the choice between public and bank debt and two second-stage
“regime” equations modeling the determinants of investment (one for the bank debt sub-sample and one for
public debt sub-sample). Similar to Bharath et al. (2008), this approach allows us to control for the self-
selection of debt choice and compare the effects of accounting quality on CFO across the two regimes.
The first-stage model of debt choice includes variables from Denis and Mihov 2003,
Krishnaswami et al. 1999, and Bharath et al. 2008. Specifically, we argue that debt choice depends on the
firm’s accounting quality (AQ), where firms with better quality are more likely to choose public debt. The
choice will also depend on the firm’s profitability, where more profitable firms will access public debt.
Based on this argument we include CFO and ROE in the regression. The choice is also likely to depend on
size, growth options, credit quality, and leverage so we include our Size, TobinsQ, Credit Rating, and
Leverage variables. Finally the choice will also depend on the tangibility of the firm’s assets, so we include
Tangibility in the regression.
Similar to Bharath et al. (2008), we include Rated to control for the access to public debt market as an
identification instrument. In addition, considering that financial constraints play a role in deciding financing
sources, we follow Whited and Wu 2004 and include DivPos as a second instrumental variable.15
Thus the
first-stage probit model is as follows:
Bank = α + β1 AQ+ β2 CFO + β3 ROE + β4 Size + β5 TobinsQ + β 6 Credit Rating +
β7 Rated+ β8 Leverage + β 9 Tangibility + β10 DivPos +ε (2)
VARIABLE DEFINITIONS.
Bank: a dichotomous variable that is set equal to one if the firm issues bank debt during our
sample period, and 0 otherwise.
AQ: the average of the rankings of AQ1, AQ2, AQ3, and AQ4.
CFO: cash flow from operations (COMPUSTAT #308) divided by average total assets
(COMPUSTAT #6).
ROE: net income (COMPUSTAT #172) divided by average shareholders’ equity
(COMPUSTAT #60).
TobinsQ: the book value of total assets (COMPUSTAT #6) plus market value of equity
(COMPUSTAT #199 * COMPUSTAT #25) minus book value of equity (COMPUSTAT
#60) and deferred tax (COMPUSTAT #74) divided by the book value of total assets.
Size: the log of total assets (COMPUSTAT #6).
Credit Rating: a categorical variable that ranges from 1-4. For firms with rated debt the variable is 1 if
the rating is between D and B+, 2 if their rating is between BB- and BB+, 3 if their
rating is between BBB- and BBB+, and 4 if their rating is between A- and AAA. For firms
without rated debt, we follow Barth et al. 2008 to develop a credit rating that falls within
this 1-4 scale.
Rated: an indicator variable that equals one for firms rated by the S&P.
Leverage: long-term debt (COMPUSTAT #9) divided by the sum of long-term debt and market
value of equity (COMPUSTAT #199 * COMPUSTAT #25).

12
Tangibility: Almeida and Campello’s (2007) estimate of asset tangibility: 0.715* accounts receivable
(COMPUSTAT #2) + 0.547* inventory (COMPUSTAT #3) + 0.535*PPE (COMPUSTAT
#8) +cash (COMPUSTAT #1) divided by total assets (COMPUSTAT #6).
DivPos: an indicator that takes the value of one if the firm pays cash dividends (COMPUSTAT
#21).
The second-stage regressions are the regime regressions described by equation 1. There are two
modifications that we make to this regression. First, as opposed to estimating the “regime” regression
separately using OLS in each sample, we use full information maximum likelihood and estimate the three
regressions simultaneously. Second, as opposed to including the indicator variable Inv_Cov in the
regression, we allow for the decision to include an investment restriction to be endogenously determined
with the investment choice. This requires us to develop a prediction model of the decision to include an
investment restriction in the debt contract, and to derive a fitted value from this model using two-stage least
squares.
Model of investment restriction covenant use
Our first-stage model of the decision to include investment restriction covenants includes variables
drawn from Nini et al. 2009 and from our model of public versus bank debt choice. We also include AQ in
our model to allow for the possibility that accounting quality and investment covenants provide alternative
methods of addressing the agency problems of debt. Consistent with the findings of Nini et al. (2009) that
the use of this covenant is less prevalent for firms that are larger and that have higher credit ratings, we
include Size, Credit Rating, and Rated in our model.16
They also find mixed evidence that the use of this
covenant is less prevalent for firms with higher market to book ratios and with lower debt relative to cash
flows.17
We include TobinsQ, Leverage, and CFO in our model to capture these constructs.
We also allow the decision to include an investment restriction in the firm’s debt contract to
depend on the firm’s profitability, tangibility, and dividend payments. Therefore, we include ROE,
Tangibility, and DivPos in our model. Finally, we allow the investment covenant decision to depend on
characteristics of the contract as instrumental variables, like the size of the loan and the type of loan.
Specifically, we include Debt Amount, calculated as the natural log of the amount of bank debt, and
Revolver, which is an indicator variable coded to be one if the loan is revolving; otherwise, it is set to be 0.
Since the decision to include an investment restriction in the debt contract is made at the inception of the
debt contract, all variables are measured prior to the bank debt issuance.

13
We construct a predicted Inv_Cov variable that equals one if the predicted probability of using
Inv_Cov based on estimates from the following first-stage probit model is greater than 50 percent and that
equals 0 otherwise.
Inv_Cov = α + β1 AQ+ β2 CFO + β3 ROE + β4 Size + β5 TobinsQ + β 6 Credit Rating +
β7 Rated+ β8 Leverage + β 9 Tangibility + β10 DivPos + β11 Debt Amount + β12 Revolver
+ ε (3)
VARIABLE DEFINITIONS.
Inv_Cov: an indicator variable equal to one when the bank debt contains a covenant restricting
capital investment, 0 otherwise.
AQ: the average of the rankings of AQ1, AQ2, AQ3, and AQ4.
CFO: cash flow from operations (COMPUSTAT #308) divided by average total assets
(COMPUSTAT #6).
ROE: net income (COMPUSTAT #172) divided by average shareholders’ equity
(COMPUSTAT #60).
TobinsQ: the book value of total assets (COMPUSTAT #6) plus market value of equity
(COMPUSTAT #199 * COMPUSTAT #25) minus book value of equity (COMPUSTAT
#60) and deferred tax (COMPUSTAT #74) divided by the book value of total assets.
Size: the log of total assets (COMPUSTAT #6).
Credit Rating: a categorical variable that ranges from 1-4. For firms with rated debt the variable is 1 if
the rating is between D and B+, 2 if their rating is between BB- and BB+, 3 if their
rating is between BBB- and BBB+, and 4 if their rating is between A- and AAA. For firms
without rated debt, we follow Barth et al. 2008 to develop a credit rating that falls within
this 1-4 scale.
Rated: an indicator variable that equals one for firms rated by the S&P.
Leverage: long-term debt (COMPUSTAT #9) divided by the sum of long-term debt and market
value of equity (COMPUSTAT #199 * COMPUSTAT #25).
Tangibility: Almeida and Campello’s (2007) estimate of asset tangibility: 0.715* accounts receivable
(COMPUSTAT #2) + 0.547* inventory (COMPUSTAT #3) + 0.535*PPE (COMPUSTAT
#8) +cash (COMPUSTAT #1) divided by total assets (COMPUSTAT #6).
DivPos: An indicator that takes the value of one if the firm pays cash dividends (COMPUSTAT
#21).
Debt Amount: the natural log of the amount of the bank debt.
Revolver: an indicator variable that equals one if the loan is a revolver.
Financing constraints index
While there is considerable debate about whether the investment-cash flow sensitivity actually
captures a lack of access to external financing (Fazzari et al. 2000; Kaplan and Zingales 2000), there is
some consensus that this measure behaves differently between financially constrained and unconstrained
firms. Whited and Wu (2004) state that financially constrained firms act as if they have high discount rates,
which is likely to cause these firms to rely on internal cash flows. If the existence of financing restrictions
suggests an increase in the importance of information asymmetry problems then we would expect
accounting quality, access to private information, and investment restrictions to have a greater influence on
investment-cash flow sensitivity for financially constrained firms.

14
To provide evidence on whether financial constraints affect the relationship between investment
and internal cash flows, we partition the sample into firms that are more versus less likely to have financial
constraints using the index developed by Whited and Wu 2004. They suggest that the extent of the firm’s
financing constraints is a function of the firm’s leverage, sales growth, cash flow, and dividend policy.
Their index is calculated as:
FCIndex = –0.062*TLTD + 0.01*DivPos + 0.067*SG + 0.06 *Size – 0.043* ISG + 0.053*CF
VARIABLE DEFINITIONS.
TLTD: the firm’s long-term debt (COMPUSTAT #9) divided by total assets (COMPUSTAT #6).
DivPos: an indicator that takes the value of one if the firm pays cash dividends (COMPUSTAT #21).
SG: change in sales divided by lagged sales (COMPUSTAT #12).
Size: the natural log of total assets (COMPUSTAT #6).
ISG: the firm’s three-digit industry sales growth.
CF: the ratio of cash flow, measured by earnings before extraordinary (COMPUSTAT #123) plus
depreciation (COMPUSTAT #14), to total assets.
For each firm in our sample, we calculate this index, and then partition the sample into two groups
at the median of the distribution. We then rerun our analyses on the firms that are financially constrained.
We omit reporting the results on the unconstrained sample, for parsimony.
Cash model
In order to address the concern that growth opportunities implied in our cash flow measure might
drive the result, we also consider a different approach to capture financing constraints. Almeida, Campello,
and Weisbach (2004) suggest that estimating the effect of cash flows on balance sheet liquidity provides an
alternative method of detecting financing constraints. They argue that the sensitivity of changes in the cash
balance to cash flows from operations is less subject to concerns about cash flows measuring investment
opportunities since, in the absence of financing constraints, the change in the cash balance should not be
correlated with investment opportunities. We follow Almeida et al. (2004) and estimate the following cash
model using annual data for each firm year after the debt issuance until the debt matures with sufficient
available data:
Cash = α + β1 AQ + β2 CFO + β 3 CFO*AQ + β4TobinsQ + β 5 Size +
β6 Credit Rating + β7 Leverage+ β8 Tangibility + β9 ROE + ε,
where Cash is the change in cash reported in the balance sheet (COMPUSTAT #1) scaled by lagged
total asset (COMPUSTAT #6) and all other variables are as defined above.

15
6. Results
Descriptive statistics
Table 1 provides descriptive statistics for our sample. Columns 2 and 3 of Table 1 provide means
for our test and control variables for sample firms partitioned by whether they have bank debt. When we
compare firms that have only public debt to those that have bank debt, we find no significant difference in
our accounting quality measure. Similarly, when we compare the extent of investment, the amount of cash
flows from operations, and the change in cash, we find that firms that have only public debt appear no
different than firms that have bank debt. We also note that firms with bank debt are smaller, have lower
credit rating, and more tangible assets. Firms with bank debt are also less profitable, more financially
constrained, and less likely to pay dividends.
Columns 4 and 5 of Table 1 provide means for our test and control variables for sample firms
partitioned by whether they have bank debt that contains an investment restriction versus bank debt that
does not have an investment restriction. Again, we do not find significant difference in accounting quality
measures between these two groups. We also find that firms that have investment restrictions in their debt
contracts spend less money on capital expenditures after they enter into the debt contract. They also have
lower cash flow from operations. However, we find no difference in the change in cash across these two
groups of firms. In addition, we find that firms with investment restrictions have fewer growth options,
smaller size, lower credit rating, higher leverage, lower tangibility, and lower profitability. Firms with
investment covenants are also less likely to be rated, more financially constrained, and less likely to pay
dividends.
Results from first-stage selection models
Table 2 reports the results of our first-stage “selection” models. The first two columns report the
results of the model of the determinants to use bank debt or public debt as a source of financing. The
second two columns of data report the results of our model of the determinants of the decision to include an
investment restriction in the firm’s debt contract.
Focusing on the determinants of the source of financing, we find that firms are more likely to use bank
debt when they are smaller, have lower credit quality, less tangible assets, and are not paying dividends.
More importantly, both instrumental variables (Rated and DivPos) have significant loadings. To test

16
whether these two variables are effective identification variables, we include these two variables in an
aggregate investment model.18
The results seem to suggest that these two instruments are effective
identifiers, that is, these two variables do not have significant correlations with investments.
Similar to the examination of the determinants of the source of financing, we also find that
profitability (as measured by CFO), size, credit quality, asset tangibility, and dividend paying position are
associated with the decision to include investment covenant restrictions in the firm’s debt contracts. We
also find that one of our exogenous variables, Revolver, is associated with the decision, where revolving
loans are less likely to have investment restrictions. Since revolving loans can be drawn down and repaid
many times over the life of the contract, it is not surprising that they are less likely to have investment
restrictions.
Results from OLS and endogenous switching estimation of the investment model
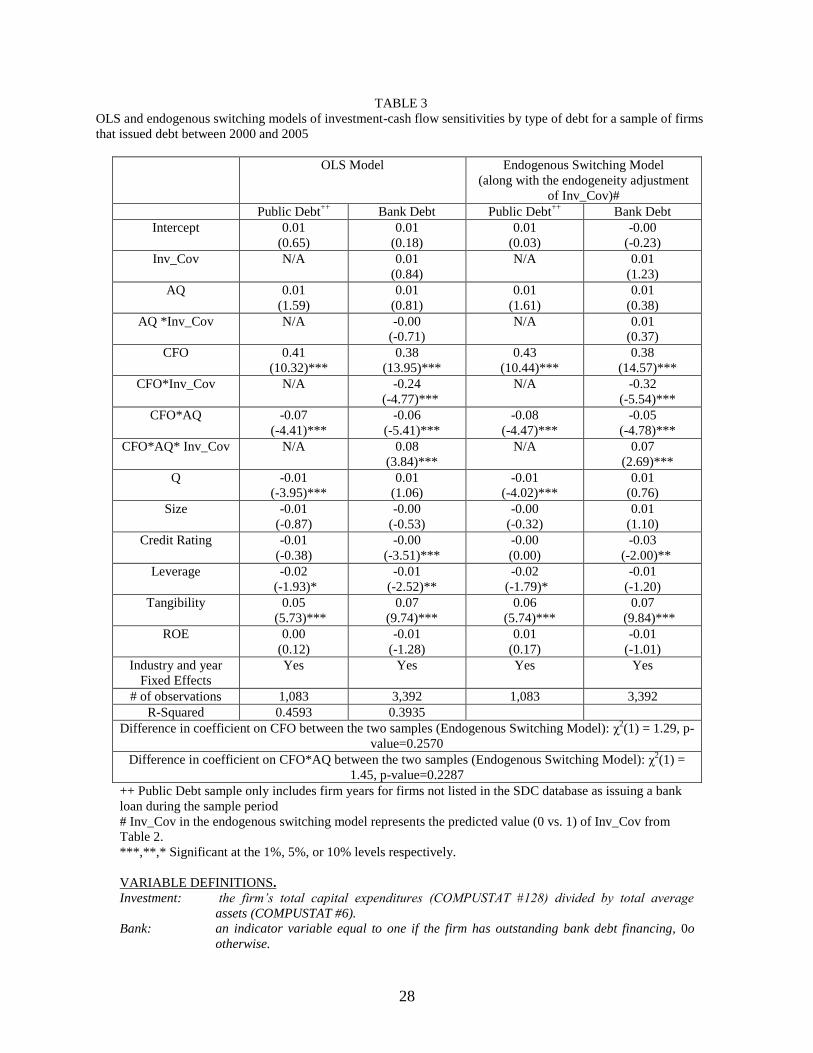
Table 3 reports the results of our analysis of our investment model. The first two columns report
the results from our OLS regressions, which do not account for the endogeneity of the financing or the
investment covenant choices. The second two columns report the results of our endogenous switching
model.
Focusing first on the OLS results, we find that CFO is positively correlated with investment for
the firms with public debt and the firms with bank debt, suggesting that financial constraints affect
investment decisions. For both sets of firms we also find that the effect is mitigated by the quality of the
firm’s financial accounting information. This is consistent with both Biddle and Hilary (2006) and Verdi
(2006): Firms with better accounting quality have fewer information asymmetries and are less likely to face
financing constraints.
We also find that investment restrictions appear to both reduce the association between CFO and
investment and eliminate the effect of accounting quality on the relationship between cash flows and
investment. This suggests that monitoring mechanisms, like covenants that restrict investment, can alleviate
financing constraints and eliminate the importance of accounting information in the financing decision.
(Note that in this table, we can’t compare the effects of investment restrictions between the two samples as
we assume that public debt does not contain such covenants (see endnote 3 and 13)).

17
The endogenous switching tests yield results that are very similar to the OLS models. That is, we
find that CFO is associated with investment, and that good accounting quality reduces this association. We
further find that investment restriction covenants appear to diminish the association and investment
covenants also dampen the effects of accounting quality. While we only report the comparisons of key
coefficients across regimes using the endogenous switching model, the comparisons for the OLS models
are similar. The results of these tests are reported at the bottom of the table. We find no difference in the
coefficients on CFO*AQ across the two regimes, suggesting that banks’ private information does not
diminish the importance of accounting quality in the investment decision. In unreported tables where we do
not interact AQ and CFO*AQ with Inv_Cov, the coefficient on CFO*AQ is lower (albeit weakly
significant (p-value=0.12)) in the bank debt sample than the public debt sample.
Comparing the results from the OLS models to the endogenous switching model, we see that our
attempts at controlling for the endogeneity of financing choice do not have a large impact on the
coefficients in the regressions. This finding is similar to Bharath et al. 2008 as the statistical significance is
similar in both sets of regressions. This suggests that either our attempts at addressing endogeneity are not
adequate or that endogeneity is not a significant problem in this setting. Since we cannot differentiate
between these two alternatives, the reader should be cautious when interpreting our results.
Results from analysis on firms likely to be constrained
Table 4 reports the results of our investment model for the financially constrained sub-samples.
Recall that firms that are financially constrained are more likely to rely on cash flows from operations to
fund their investment, and thus accounting quality, investment restrictions, and private monitoring are more
likely to have an effect on investment decisions. Similar to Table 3, the first two columns report the results
from our OLS regressions, while the second two columns report the results of our endogenous switching
model.
In both the OLS and the endogenous switching models, we find that CFO is associated with
investment, that investment restriction covenants diminish this association, and that investment covenants
eliminate the effects of accounting quality on the investment-cash flow sensitivity.
Our test of the equivalence of the coefficient on the CFO*AQ variable across the two regimes in
the endogenous switching model indicates that banks’ access to private information is important and

18
reduces the effect of accounting quality on the investment-cash flow sensitivity for firms likely to have the
most severe information problems. In contrast to the results for the entire sample, which suggest that access
to private information does not affect the importance of accounting quality on the investment-cash flow
sensitivity, this result suggests that private information and public financial reporting serve as substitutes in
mitigating information problems for firms facing financing constraints. Again, while not tabulated, this
result holds in the OLS model and models where we do not interact CFO and CFO*AQ with Inv_Cov.
Results from cash-on-cash flow models
We report the results of estimating our balance sheet liquidity model in Table 5. The results look
very similar to those from the investment model for constrained firms. Specifically, we find that association
between cash flows and the cash balance is higher for firms that issue public debt than for firms that use
private bank loans. The results also indicate that the association between cash flows and cash balances is
decreasing in accounting quality for firms that issue public debt (but not for firms issuing bank debt). The
results from the endogenous switching model indicate that the effect of accounting quality is lower for
firms using private bank loans than for firms issuing public debt.
Taken together, the results in Tables 4 and 5 suggest that our investment-cash flow sensitivity
results are not merely an artifact of a potential correlation between cash from operations and the investment
opportunity set. Specifically, this interpretation is supported by our findings that the coefficients on the
interactions of cash from operations with accounting quality and the bank debt indicator are only significant
for the financially constrained firms and that they are also significant in explaining cash retention.
Sensitivity analyses
To further ensure that our results are not just an artifact of our research design, we conduct a
number of additional sensitivity analyses. First, our analysis focuses on firm years after the initiation of a
debt contract. We make this research design choice because it allows us to measure the lender’s access to
private information and whether there are contractual restrictions on investment after the capital is
provided. However, a drawback of this research design is that the firms in our sample have recently
accessed the capital markets. In an untabulated sensitivity analysis, we rerun our tests in the period prior to
the firm raising capital. We continue to find that accounting quality reduces the sensitivity of investment to
internal cash flows. Our variable measuring whether there is a contractual restriction on investment is

19
insignificant in the pre-loan period. This result suggests that it is the actual restriction on investment (rather
than a sample-selection bias) that reduces the sensitivity of cash flows to investment. Similarly, the
interaction between accounting quality and our variable measuring the access to private information is
insignificant, suggesting that it is the actual access to private information (rather than self-selection) that
reduces the importance of accounting quality.
Second, we partition our sample using different financial constraint metrics. Following prior
studies, we use firm size, whether the firm is rated, and whether the firm has investment grade debt as
financial constraint proxies. Unreported results show that all partitions generate similar results to those
partitioned by the Whited and Wu 2004 index.
Third, we redid the analysis year-by-year. We note that as we move out over the life of the
contract, the results generally get stronger. This result is not surprising, since firms are less likely to rely on
internal cash flows for investment in the first year or two after raising external capital.
Fourth, following Alti’s (2003) suggestion, we use lagged cash flow instead of current cash flow
to investigate investment-cash flow sensitivities. This approach potentially mitigates the concern that
current cash flow contains growth opportunities information. We redid all analyses with this instrumental
variable, and the results are qualitatively similar.
Finally, our research design assumes that private lenders do not monitor the public debt sample.
We coded firms that issued public and syndicated bank debt (as per the SDC database) as being in the bank
debt sample. However, some firms may have issued private placements or bank debt, which is not captured
on the SDC database. To attempt to address this issue, we identified the COMPUSTAT data items where
new debt issues are likely to be located, and eliminated all firms that had a change in these items during the
post-issuance period.19
While this reduced our public debt sample by 36 percent, we find that the results of
this analysis are qualitatively similar to those reported in the paper.
7. Conclusions
Previous research shows that higher accounting quality reduces the sensitivity of firms’
investments to internal cash flows. Biddle and Hilary (2006) find that this relation exists in the U.S., but not
in Japan and they conclude that accounting quality should play a lower role when capital suppliers have
alternative information sources.

20
Our paper extends this research, examining the factors within the debt market that enhance or
diminish the importance of accounting information in reducing financing constraints. We examine a sample
of U.S. firms that have recently raised debt financing and investigate the role of private information and
monitoring on the sensitivity of investment to internal cash flows. We find that improved accounting
quality decreases investment-cash flow sensitivities for firms that issue either public debt or bank debt. We
also find that investment restrictions eliminate the influence of accounting quality on the investment-cash
flow sensitivity. In addition, we find that for firms with high financial constraints, lenders’ private
information also mitigates the role of accounting quality in reducing the investment-cash flow sensitivity.
We find that our results hold even when we allow for the possibility that cash flows not only
capture firms’ reliance on internally generated funds, but may also capture information about firms’
investment opportunities. Specifically we find that for firms facing financing constraints, where
information asymmetry problems are likely to be the largest, accounting quality is most important.
Furthermore, we find that our results hold when we examine the cash flow sensitivity of balance sheet
liquidity.
Our paper extends the financial economics literature that discusses the relation between financial
constraints and investment decisions. We find that the source of financing affects investment decisions. Our
paper further distinguishes the informational and monitoring roles played by banks in reducing financing
constraints. These results are interesting because they help us understand the implications of different forms
of debt financing in investment decisions and their interactions with accounting information.

21
Endnotes
1. An alternative would be to investigate the role of relationship banking on the sensitivity of investment to
cash flows. The SDC loan database has mostly syndicated loans. The lack of a significant number of
“relationship” loans limits our ability to explore this possibility.
2. The inconsistency between our findings and those of Biddle and Hillary’s (2006) results for Japan might
arise because of differences in the type of debt across the two papers. Our debt sample is comprised of
public debt and syndicated loans whereas their Japanese firms rely more heavily on relationship banking,
where private information is likely to be the most readily available.
3. Their public debt sample includes a variety of different covenants primarily related to restrictions on
mergers and restrictions and on issuances of additional debt. Similarly, Chava, Kumar, and Warga (2007)
report that 92.9 percent of their public debt sample has restrictions on mergers and acquisitions, 21.7
percent have covenants that indirectly constrain investments, but only 1.4 percent have direct investment
restrictions.
4. Yu (2007) provides evidence that banks have superior information compared to other sophisticated
investors such as analysts.
5. If covenant information was not disclosed in the SDC database, the observation was not included in our
sample. Loans that are missing covenant information in the database often have covenants.
6. In an untabulated sensitivity analysis, we also ran each measure separately in our main tests. The results
are similar to those we report. We omit them for parsimony.
7. The results are similar if the accounting quality measures exclude the investment year.
8. Since our investment model includes two- and three-way interactions we examine the variance inflation
factors for the coefficients estimated in these models. The VIFs, which range from a low of 1.09 to a high
of 2.65, are well below the level that would suggest that multicollinearity is causing a problem.
9. We considered including mergers and acquisitions in our investment measure, but bank debt typically
has covenants restricting firms from engaging in this activity. These covenants are distinct from the
investment restriction covenant that is our focus. Analyzing this alternative form of investment is beyond
our scope.
10. We use CFO rather than CF (earnings plus depreciation) because CFO is more theoretically correct. As
Bushman, Smith, and Zhang (2007) point out, CF contains accruals, so regressing investment on CF is like
regressing investment on investment. Although Bushman et al. (2007) do not find that the correlation
between CFO and investment varies with ex ante financial constraint variables, Biddle and Hilary (2006)
find that the correlation does depend on financial constraints. The discrepancy might be driven by sample
differences.
11. In our tabulated results the control variables are all lagged values. Using the current value doesn’t
qualitatively change the results.
12. Using the current model (Equation 1) to test the equality of coefficients on CFO*AQ only compares
public debt and bank debt that does not contain an investment covenant.
13. Although the SDC database does not provide information on covenants for public debt, we assume that
none of the public debt contracts in our sample have direct investment restrictions based on the low rate
(i.e., 1.4 percent) of these covenants in public debt reported by Chava et al. 2007.
14. For completeness, we will also discuss the results of models where we do not include Inv_Cov and its
interactions with other variables.

22
15. We use the constraint index developed by Whited and Wu 2004 and individual variables in their model
as instrumental variables. DivPos seems to be the only variable that has a significant loading in Equation
(2).
16. Consistent with the results of Nini et al. (2009), Kahan and Yarmack (2003) find that larger firms are
more likely to have nonconvertible public debt with investment restrictions.
17. The importance of growth opportunities in the determining investment restriction covenants in public
debt is also examined by Kahan and Yarmack 2003 using R&D expenses to sales and Nash, Netter, and
Poulson 2003 using the market to book ratio. Neither paper finds statistical significance on these growth
variables.
18. Because all firms that issue public debt should be rated, we cannot test the effectiveness of Rated
variable in the public debt sample. Instead, we test the effectiveness using an overall sample where we do
not separate public and bank debt samples.
19. We use COMPUSTAT #83 to identify whether there is a change in other bank debt or private
placements. If there is an increase in #83, we further require COMPUSTAT #111 to be non-0 to ensure a
debt issuance.

23
References
Almeida, H., M. Campello, and M. Weisbach. 2004. The cash flow sensitivity of cash. Journal of Finance
59: 1777-1804.
Almeida, H., and M. Campello. 2007. Financial constraints, asset tangibility, and corporate investment.
Review of Financial Studies 20: 1429-1460.
Alti, A. 2003. How sensitive is investment to cash flow when financing is frictionless? Journal of Finance
58: 707-722.
Barth, M., L. D. Hodder, and S.R. Stubben. 2008. Fair value accounting for liabilities and own credit risk.
The Accounting Review 83: 629-664.
Bharath, S. T., J. Sunder, and S. V. Sunder. 2008. Accounting quality and debt contracting. The Accounting
Review 83: 1-28.
Biddle, G., and G. Hilary. 2006. Accounting quality and firm-level capital investment. The Accounting
Review 81: 963-982.
Biddle, G., G. Hilary, and R. Verdi. 2009. How does financial reporting quality improve investment
efficiency? Working paper, MIT.
Billet, M., D. King, and D. Mauer. 2007. Growth opportunities and the choice of leverage, debt maturity,
and covenants. Journal of Finance 62 (2): 627-729.
Bushman, R., J. Piotroski, and A. Smith. 2005. Capital allocation and timely accounting recognition of
economic losses: international evidence. Working paper, University of Chicago.
Bushman, R., A. Smith, and F. Zhang. 2007. Investment-cash flow sensitivities are really investment-
investment sensitivities. Working Paper, University of North Carolina.
Chava, S., P. Kumar and A. Warga. 2007. Managerial moral hazard and bond covenants. Working paper,
University of Houston.
Chen, X., Q. Cheng, and K. Lo. 2006. Are analyst research and corporate disclosure complements of
substitutes? Working paper, University of British Columbia.
Diamond, D. 1991. Monitoring and reputation: the choice between bank loans and privately placed debt.
Journal of Political Economy 99: 689-721.
Denis, D. J., and V. T. Mihov. 2003. The choice among bank debt, non-bank private debt, and public debt:
evidence from new corporate borrowings. Journal of Financial Economics 70: 3-28
Fazzari, S., R. G. Hubbard, and B. Petersen. 1988. Investment and finance reconsidered. Brookings Papers
on Economic Activity 141-195.
Fazzari, S., R. G. Hubbard, and B. Petersen. 2000. Investment-cash flow sensitivities are useful: a comment
on Kaplan and Zingales. The Quarterly Journal of Economics 115: 595-705.
Francis, J., K. Schipper, and L. Vincent. 2002. Earnings announcements and competing information.
Journal of Accounting and Economics: 33: 313-342.
Francis, J., R. LaFond, P. Olsson, and K. Schipper, 2005. The market pricing of accruals quality. Journal of
Accounting and Economics 39: 295-327.

24
Holthausen, R., and R. Verrecchia. 1988. The effect of sequential information release on the variation of
price changes in an intertemporal multi-asset market. Journal of Accounting Research 26: 82-
106.
James, C. 1987. Some evidence on the uniqueness of bank loans. Journal of Financial Economics 19: 217-
235.
Kahan, M., and D. Yermack. 2003. Investment opportunities and the design of debt securities. Journal of
Law, Economics, and Organization 14 (1): 136-151.
Kaplan, S., and L. Zingales. 2000. Investment-cash flow sensitivities are not valid measures of financing
constraints. The Quarterly Journal of Economics 115: 707-712.
Krishnaswami, S., P.A. Spindt, and V. Subramaniam. 1999. Information asymmetry, monitoring, and the
placement structure of corporate debt. Journal of Financial Economics 51: 407-434.
Lee, L. 1978. Unionism and Wage Rates: a simultaneous equations model with qualitative and limited
dependent variables. International Economic Review 19: 415-434.
Nash, R., J. Netter, and A. Poulson. 2003. Determinants of contractual relations between shareholders and
bondholders: Investment opportunities and restrictive covenants. Journal of Corporate
Finance 9: 201-232.
Nini, G., D. Smith, and A. Sufi. 2009. Creditor control rights and firm investment policy. Journal of
Financial Economics, forthcoming.
Verdi, R. 2006. Financial reporting quality and investment efficiency. Working paper, MIT.
Whited, T. M., and G. Wu. 2004. Financial constraints risk. Working paper, University of Wisconsin.
Whittenberg-Moerman, R. W. 2008. The role of information asymmetry and financial reporting quality in
debt trading: evidence from the secondary loan market. Journal of Accounting and Economics
46: 240-260.
Wysocki, P. 2005. Assessing earnings and accruals quality: U.S. and international evidence. Working
paper, MIT.
Yu, J. 2007. Loan spreads and unexpected earnings: do banks know what analysts do not? Working paper,
SMU.

25
TABLE 1
Descriptive statistics (Means) by debt type for the period 2000-2005
Public Debt++
Bank Debt
(t-stat for difference
between Bank and
Public Debt)
Bank Debt without
Investment Covenant
Bank Debt with Investment
Covenant (t-stat for
difference of bank debts
with and without covenants)
AQ
2.01 2.00
(0.37)
2.005 1.98
(0.66)
Investment
0.05 0.05
(-0.05)
0.059 0.05
(7.04)***
CFO
0.10 0.10
(-0.19)
0.105 0.08
(7.78)***
TobinsQ
1.62 1.55
(2.23)**
1.605 1.44
(5.63)***
Size
8.84 7.18
(30.69)***
7.541 6.45
(19.85)***
Credit Rating
3.17 2.32
(25.76)***
2.602 1.76
(26.87)***
Leverage
0.30 0.29
(1.04)
0.257 0.36
(-12.46)***
Tangibility 0.42 0.43
(-2.49)**
0.436 0.42
(3.76)***
ROE 0.13 0.08
(3.80)***
0.109 0.01
(6.07)***
Cash 0.01 0.01
(-1.28)
0.006 0.01
(-0.64)
Rated N/A 0.61
(N/A)
0.636 0.55
(5.09)***
FC Index 0.53 0.43
(29.04)***
0.453 0.38
(21.89)***
DivPos 0.80 0.52
(16.91)***
0.638 0.28
(20.70)***
Number of
observations
1,083 3,392 2,268 1,124
++ Public Debt sample only includes firm-years for firms not listed in the SDC database as issuing a bank
loan during the sample period
***,**,* Significant at the 1%, 5%, or 10% levels respectively.
VARIABLE DEFINITIONS.
Investment: the firm’s total capital expenditures (COMPUSTAT #128) divided by total average
assets (COMPUSTAT #6).
Bank: an indicator variable equal to one if the firm has outstanding bank debt financing, 0
otherwise.
Inv_Cov: an indicator variable equal to one when the bank debt contains a covenant restricting
capital investment, 0 otherwise.
CFO: cash flow from operations (COMPUSTAT #308) divided by average total assets
(COMPUSTAT #6).
AQ: the average of the rankings of the following 4 AQ measures.
AQ1: the quintile ranking of Adjusted R-squared from estimating a regression of total current
accruals on cash flows from operations measured concurrently and with a one-period
lead and one-period lag (Dechow and Dichev (2002)). When estimating the regression

26
we require at least eight years of observations from the past 10 years, including the
investment year.
AQ2: a measure of earnings persistence derived by regressing one period ahead earnings on
current earnings. When estimating the regression, we require at least eight years of
observations from the past 10 years, including the investment year. We use the quintile
ranking of the coefficient on current earnings as our measure of earnings persistence.
AQ3: the quintile ranking of Adjusted R-squared from the earnings persistence model discussed
in AQ2.
AQ4: the quintile ranking of Adjusted R squared from a regression of one year ahead cash flow
on current earnings. When estimating the regression we require at least eight years of
observations from the past 10 years, including the investment year.
TobinsQ: the book value of total assets (COMPUSTAT #6) plus market value of equity
(COMPUSTAT #199 * COMPUSTAT #25) minus book value of equity (COMPUSTAT
#60) and deferred tax (COMPUSTAT #74) divided by the book value of total assets.
Size: the log of total assets (COMPUSTAT #6).
Credit Rating: a categorical variable that ranges from 1-4. For firms with rated debt the variable is 1 if
the rating is between D and B+, 2 if their rating is between BB- and BB+, 3 if their
rating is between BBB- and BBB+, and 4 if their rating is between A- and AAA. For firms
without rated debt, we follow Barth et al. 2008 to develop a credit rating that falls within
this 1-4 scale.
Leverage: long-term debt (COMPUSTAT #9) divided by the sum of long-term debt and market
value of equity (COMPUSTAT #199 * COMPUSTAT #25).
Tangibility: Almeida and Campello’s (2007) estimate of asset tangibility: 0.715* accounts receivable
(COMPUSTAT #2) + 0.547* inventory (COMPUSTAT #3) + 0.535*PPE (COMPUSTAT
#8) +cash (COMPUSTAT #1) divided by total assets (COMPUSTAT #6).
ROE: net income (COMPUSTAT #172) divided by average shareholders’ equity
(COMPUSTAT #60).
Cash: the change in cash and cash equivalents (COMPUSTAT #1) divided by total assets
(COMPUSTAT #6).
Rated: an indicator variable that equals one for firms rated by the S&P.
FCIndex: –0.062*TLTD + 0.01*DIVPOS + 0.067*SG + 0.06 *SIZE – 0.043* ISG + 0.053*CF.
TLTD: the firm’s long-term debt (COMPUSTAT #9) divided by total assets (COMPUSTAT
#6).
DivPos: an indicator that takes the value of one if the firm pays cash dividends (COMPUSTAT
#21).
SG: the change in sales divided by lagged sales (COMPUSTAT #12).
ISG: the firm’s three-digit industry sales growth.
CF: the ratio of cash flow, measured by earnings before extraordinary (COMPUSTAT #123)
plus depreciation (COMPUSTAT #14), to total assets.

27
TABLE 2
Determinants of the use of bank debt and the use of capital expenditure covenants
Prediction of The Use of Bank Debt Prediction of The Use of Capital
Expenditure Covenants
Variable Coefficient z-stat Coefficient z-stat
Intercept 4.547 22.67*** 2.002 3.39***
AQ -0.011 -0.43 0.018 0.64
CFO -0.227 -0.51 -0.615 -1.66*
ROE -0.049 -0.74 0.035 0.69
TobinsQ 0.026 0.77 -0.028 -0.65
Size -0.196 -9.78*** -0.166 -5.00***
Credit Rating -0.320 -7.80*** -0.437 -9.41***
Rated -0.937 -9.84*** 0.090 1.26
Leverage -0.633 -3.93*** 0.327 2.05**
Tangibility -0.854 -4.39*** -0.855 -3.38***
DivPos -0.100 -1.67* -0.244 -3.97***
Debt Amount -0.016 -0.56
Revolver -0.401 -6.43***
# of observations 4,475 3,345
Pseudo R-Squared 0.2258 0.2321
***,**,* Significant at the 1%, 5%, or 10% levels respectively.
VARIABLE DEFINITIONS.
AQ: the average of the rankings of AQ1, AQ2, AQ3 and AQ4.
CFO: cash flow from operations (COMPUSTAT #308) divided by average total assets
(COMPUSTAT #6).
ROE: net income (COMPUSTAT #172) divided by average shareholders’ equity
(COMPUSTAT #60).
TobinsQ: the book value of total assets (COMPUSTAT #6) plus market value of equity
(COMPUSTAT #199 * COMPUSTAT #25) minus book value of equity (COMPUSTAT
#60) and deferred tax (COMPUSTAT #74) divided by the book value of total assets.
Size: the log of total assets (COMPUSTAT #6).
Credit Rating: a categorical variable that ranges from 1-4. For firms with rated debt the variable is 1 if
the rating is between D and B+, 2 if their rating is between BB- and BB+, 3 if their
rating is between BBB- and BBB+, and 4 if their rating is between A- and AAA. For firms
without rated debt, we follow Barth et al. 2008 to develop a credit rating that falls within
this 1-4 scale.
Rated: an indicator variable that equals one for firms rated by the S&P.
Leverage: long-term debt (COMPUSTAT #9) divided by the sum of long-term debt and market
value of equity (COMPUSTAT #199 * COMPUSTAT #25).
Tangibility: Almeida and Campello’s (2007) estimate of asset tangibility: 0.715* accounts receivable
(COMPUSTAT #2) + 0.547* inventory (COMPUSTAT #3) + 0.535*PPE (COMPUSTAT
#8) +cash (COMPUSTAT #1) divided by total assets (COMPUSTAT #6).
DivPos: an indicator that takes the value of one if the firm pays cash dividends (COMPUSTAT
#21).
Debt Amount: the natural log of the amount of the bank debt.
Revolver: an indicator variable that equals one if the loan is a revolver.
28
TABLE 3
OLS and endogenous switching models of investment-cash flow sensitivities by type of debt for a sample of firms
that issued debt between 2000 and 2005
OLS Model Endogenous Switching Model
(along with the endogeneity adjustment
of Inv_Cov)#
Public Debt++
Bank Debt Public Debt++
Bank Debt
Intercept
0.01
(0.65)
0.01
(0.18)
0.01
(0.03)
-0.00
(-0.23)
Inv_Cov
N/A 0.01
(0.84)
N/A 0.01
(1.23)
AQ
0.01
(1.59)
0.01
(0.81)
0.01
(1.61)
0.01
(0.38)
AQ *Inv_Cov
N/A -0.00
(-0.71)
N/A 0.01
(0.37)
CFO
0.41
(10.32)***
0.38
(13.95)***
0.43
(10.44)***
0.38
(14.57)***
CFO*Inv_Cov
N/A
-0.24
(-4.77)***
N/A -0.32
(-5.54)***
CFO*AQ
-0.07
(-4.41)***
-0.06
(-5.41)***
-0.08
(-4.47)***
-0.05
(-4.78)***
CFO*AQ* Inv_Cov N/A 0.08
(3.84)***
N/A 0.07
(2.69)***
Q
-0.01
(-3.95)***
0.01
(1.06)
-0.01
(-4.02)***
0.01
(0.76)
Size
-0.01
(-0.87)
-0.00
(-0.53)
-0.00
(-0.32)
0.01
(1.10)
Credit Rating
-0.01
(-0.38)
-0.00
(-3.51)***
-0.00
(0.00)
-0.03
(-2.00)**
Leverage
-0.02
(-1.93)*
-0.01
(-2.52)**
-0.02
(-1.79)*
-0.01
(-1.20)
Tangibility
0.05
(5.73)***
0.07
(9.74)***
0.06
(5.74)***
0.07
(9.84)***
ROE 0.00
(0.12)
-0.01
(-1.28)
0.01
(0.17)
-0.01
(-1.01)
Industry and year
Fixed Effects
Yes Yes Yes Yes
# of observations 1,083 3,392 1,083 3,392
R-Squared 0.4593 0.3935
Difference in coefficient on CFO between the two samples (Endogenous Switching Model): χ2(1) = 1.29, p-
value=0.2570
Difference in coefficient on CFO*AQ between the two samples (Endogenous Switching Model): χ2(1) =
1.45, p-value=0.2287
++ Public Debt sample only includes firm years for firms not listed in the SDC database as issuing a bank
loan during the sample period
# Inv_Cov in the endogenous switching model represents the predicted value (0 vs. 1) of Inv_Cov from
Table 2.
***,**,* Significant at the 1%, 5%, or 10% levels respectively.
VARIABLE DEFINITIONS.
Investment: the firm’s total capital expenditures (COMPUSTAT #128) divided by total average
assets (COMPUSTAT #6).
Bank: an indicator variable equal to one if the firm has outstanding bank debt financing, 0o
otherwise.

29
Inv_Cov: an indicator variable equal to one when the bank debt contains a covenant restricting
capital investment, 0 otherwise.
CFO: cash flow from operations (COMPUSTAT #308) divided by average total assets
(COMPUSTAT #6).
AQ: the average of the rankings of AQ1, AQ2, AQ3, and AQ4. .
TobinsQ: the book value of total assets (COMPUSTAT #6) plus market value of equity
(COMPUSTAT #199 * COMPUSTAT #25) minus book value of equity (COMPUSTAT
#60) and deferred tax (COMPUSTAT #74) divided by the book value of total assets.
Size: the log of total assets (COMPUSTAT #6).
Credit Rating: a categorical variable that ranges from 1-4. For firms with rated debt the variable is 1 if
the rating is between D and B+, 2 if their rating is between BB- and BB+, 3 if their
rating is between BBB- and BBB+, and 4 if their rating is between A- and AAA. For firms
without rated debt, we follow Barth et al. 2008 to develop a credit rating that falls within
this 1-4 scale.
Leverage: long-term debt (COMPUSTAT #9) divided by the sum of long-term debt and market
value of equity (COMPUSTAT #199 * COMPUSTAT #25.)
Tangibility: Almeida and Campello’s (2007) estimate of asset tangibility: 0.715* accounts receivable
(COMPUSTAT #2) + 0.547* inventory (COMPUSTAT #3) + 0.535*PPE (COMPUSTAT
#8) +cash (COMPUSTAT #1) divided by total assets (COMPUSTAT #6).
ROE: net income (COMPUSTAT #172) divided by average shareholders’ equity
(COMPUSTAT #60).
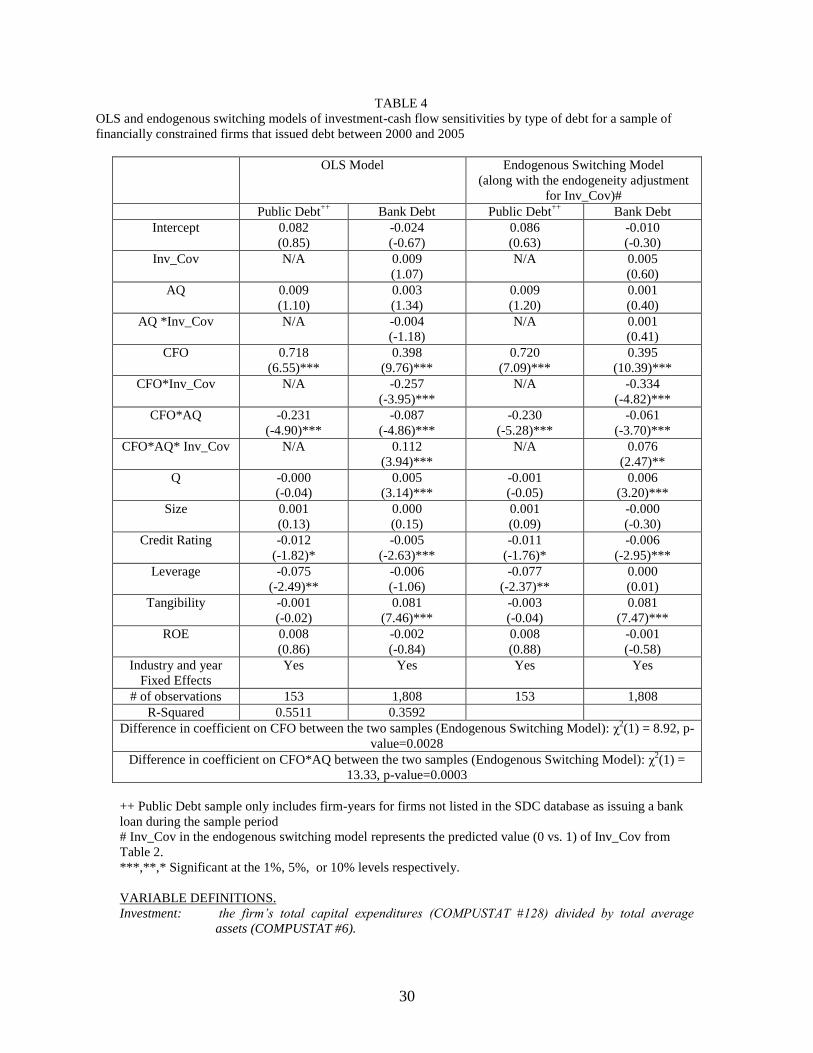
30
TABLE 4
OLS and endogenous switching models of investment-cash flow sensitivities by type of debt for a sample of
financially constrained firms that issued debt between 2000 and 2005
OLS Model Endogenous Switching Model
(along with the endogeneity adjustment
for Inv_Cov)#
Public Debt++
Bank Debt Public Debt++
Bank Debt
Intercept
0.082
(0.85)
-0.024
(-0.67)
0.086
(0.63)
-0.010
(-0.30)
Inv_Cov
N/A 0.009
(1.07)
N/A 0.005
(0.60)
AQ
0.009
(1.10)
0.003
(1.34)
0.009
(1.20)
0.001
(0.40)
AQ *Inv_Cov
N/A -0.004
(-1.18)
N/A 0.001
(0.41)
CFO
0.718
(6.55)***
0.398
(9.76)***
0.720
(7.09)***
0.395
(10.39)***
CFO*Inv_Cov
N/A -0.257
(-3.95)***
N/A -0.334
(-4.82)***
CFO*AQ
-0.231
(-4.90)***
-0.087
(-4.86)***
-0.230
(-5.28)***
-0.061
(-3.70)***
CFO*AQ* Inv_Cov N/A 0.112
(3.94)***
N/A 0.076
(2.47)**
Q
-0.000
(-0.04)
0.005
(3.14)***
-0.001
(-0.05)
0.006
(3.20)***
Size
0.001
(0.13)
0.000
(0.15)
0.001
(0.09)
-0.000
(-0.30)
Credit Rating
-0.012
(-1.82)*
-0.005
(-2.63)***
-0.011
(-1.76)*
-0.006
(-2.95)***
Leverage
-0.075
(-2.49)**
-0.006
(-1.06)
-0.077
(-2.37)**
0.000
(0.01)
Tangibility
-0.001
(-0.02)
0.081
(7.46)***
-0.003
(-0.04)
0.081
(7.47)***
ROE 0.008
(0.86)
-0.002
(-0.84)
0.008
(0.88)
-0.001
(-0.58)
Industry and year
Fixed Effects
Yes Yes Yes Yes
# of observations 153 1,808 153 1,808
R-Squared 0.5511 0.3592
Difference in coefficient on CFO between the two samples (Endogenous Switching Model): χ2(1) = 8.92, p-
value=0.0028
Difference in coefficient on CFO*AQ between the two samples (Endogenous Switching Model): χ2(1) =
13.33, p-value=0.0003
++ Public Debt sample only includes firm-years for firms not listed in the SDC database as issuing a bank
loan during the sample period
# Inv_Cov in the endogenous switching model represents the predicted value (0 vs. 1) of Inv_Cov from
Table 2.
***,**,* Significant at the 1%, 5%, or 10% levels respectively.
VARIABLE DEFINITIONS.
Investment: the firm’s total capital expenditures (COMPUSTAT #128) divided by total average
assets (COMPUSTAT #6).

31
Bank: an indicator variable equal to one if the firm has outstanding bank debt financing, 0
otherwise.
Inv_Cov: an indicator variable equal to one when the bank debt contains a covenant restricting
capital investment, 0 otherwise.
CFO: cash flow from operations (COMPUSTAT #308) divided by average total assets
(COMPUSTAT #6).
AQ: the average of the rankings of AQ1, AQ2, AQ3, and AQ4.
TobinsQ: the book value of total assets (COMPUSTAT #6) plus market value of equity
(COMPUSTAT #199 * COMPUSTAT #25) minus book value of equity (COMPUSTAT
#60) and deferred tax (COMPUSTAT #74) divided by the book value of total assets.
Size: the log of total assets (COMPUSTAT #6).
Credit Rating: a categorical variable that ranges from 1-4. For firms with rated debt the variable is 1 if
the rating is between D and B+, 2 if their rating is between BB- and BB+, 3 if their
rating is between BBB- and BBB+, and 4 if their rating is between A- and AAA. For firms
without rated debt, we follow Barth et al. 2008 to develop a credit rating that falls within
this 1-4 scale.
Leverage: long-term debt (COMPUSTAT #9) divided by the sum of long-term debt and market
value of equity (COMPUSTAT #199 * COMPUSTAT #25).
Tangibility: Almeida and Campello’s (2007) estimate of asset tangibility: 0.715* accounts receivable
(COMPUSTAT #2) + 0.547* inventory (COMPUSTAT #3) + 0.535*PPE (COMPUSTAT
#8) +cash (COMPUSTAT #1) divided by total assets (COMPUSTAT #6).
ROE: net income (COMPUSTAT #172) divided by average shareholders’ equity
(COMPUSTAT #60).

32
TABLE 5
Determinants of cash-cash flow sensitivities (OLS and endogenous switching models) by type of debt for a
sample firms that issued debt between 2000 and 2005
OLS Model Endogenous Switching Model
Public Debt++
Bank Debt Public Debt++
Bank Debt
Intercept
-0.021
(-1.20)
-0.000
(-0.01)
-0.009
(-0.35)
-0.029
(-1.49)
AQ
0.006
(2.71)***
0.001
(0.52)
0.006
(2.74)***
0.001
(0.54)
CFO
0.247
(5.84)***
0.123
(4.60)***
0.246
(5.88)***
0.122
(4.56)***
CFO*AQ
-0.071
(-4.03)***
-0.001
(-0.07)
-0.070
(-4.07)***
-0.002
(-0.21)
Q
-0.002
(-1.30)
-0.002
(-1.38)
-0.002
(-1.22)
-0.001
(-1.14)
Size
0.002
(1.99)**
0.002
(2.99)***
0.002
(1.17)
0.006
(6.91)***
Credit Rating
-0.003
(-1.33)
-0.005
(-3.44)***
-0.004
(-1.49)
-0.001
(-0.86)
Leverage
0.008
(0.91)
-0.004
(-0.86)
0.006
(0.72)
0.004
(0.81)
Tangibility
-0.048
(-5.07)***
-0.038
(-4.86)***
-0.049
(-5.16)***
-0.028
(-3.51)***
ROE 0.006
(1.64)
-0.000
(-0.17)
0.006
(1.58)
-0.000
(-0.14)
Industry
Fixed Effects
Yes Yes Yes Yes
Year
Fixed Effects
Yes Yes Yes Yes
# of observations 1,083 3,392
R-Squared 0.0563 0.0446
Difference in coefficient on CFO between the two samples (Endogenous Switching Model): χ2(1) = 6.14, p-
value=0.0133
Difference in coefficient on CFO*AQ between the two samples (Endogenous Switching Model): χ2(1) =
10.85, p-value=0.0010
++ Public Debt sample only includes firm-years for firms not listed in the SDC database as issuing a bank
loan during the sample period
***,**,* Significant at the 1%, 5%, or 10% levels respectively.
VARIABLE DEFINITIONS.
Investment: the firm’s total capital expenditures (COMPUSTAT #128) divided by total average
assets (COMPUSTAT #6).
Bank: an indicator variable equal to one if the firm has outstanding bank debt financing, 0
otherwise.
Inv_Cov: an indicator variable equal to one when the bank debt contains a covenant restricting
capital investment, 0 otherwise.
CFO: cash flow from operations (COMPUSTAT #308) divided by average total assets
(COMPUSTAT #6).
AQ: the average of the rankings of AQ1, AQ2, AQ3, and AQ4.
TobinsQ: the book value of total assets (COMPUSTAT #6) plus market value of equity
(COMPUSTAT #199 * COMPUSTAT #25) minus book value of equity (COMPUSTAT
#60) and deferred tax (COMPUSTAT #74) divided by the book value of total assets.
Size: the log of total assets (COMPUSTAT #6).

33
Credit Rating: a categorical variable that ranges from 1-4. For firms with rated debt the variable is 1 if
the rating is between D and B+, 2 if their rating is between BB- and BB+, 3 if their
rating is between BBB- and BBB+, and 4 if their rating is between A- and AAA. For firms
without rated debt, we follow Barth et al. 2008 to develop a credit rating that falls within
this 1-4 scale.
Leverage: long-term debt (COMPUSTAT #9) divided by the sum of long-term debt and market
value of equity (COMPUSTAT #199 * COMPUSTAT #25).
Tangibility: Almeida and Campello’s (2007) estimate of asset tangibility: 0.715* accounts receivable
(COMPUSTAT #2) + 0.547* inventory (COMPUSTAT #3) + 0.535*PPE (COMPUSTAT
#8) +cash (COMPUSTAT #1) divided by total assets (COMPUSTAT #6).
ROE: net income (COMPUSTAT #172) divided by average shareholders’ equity
(COMPUSTAT #60).