Embed Size (px)
Citation preview
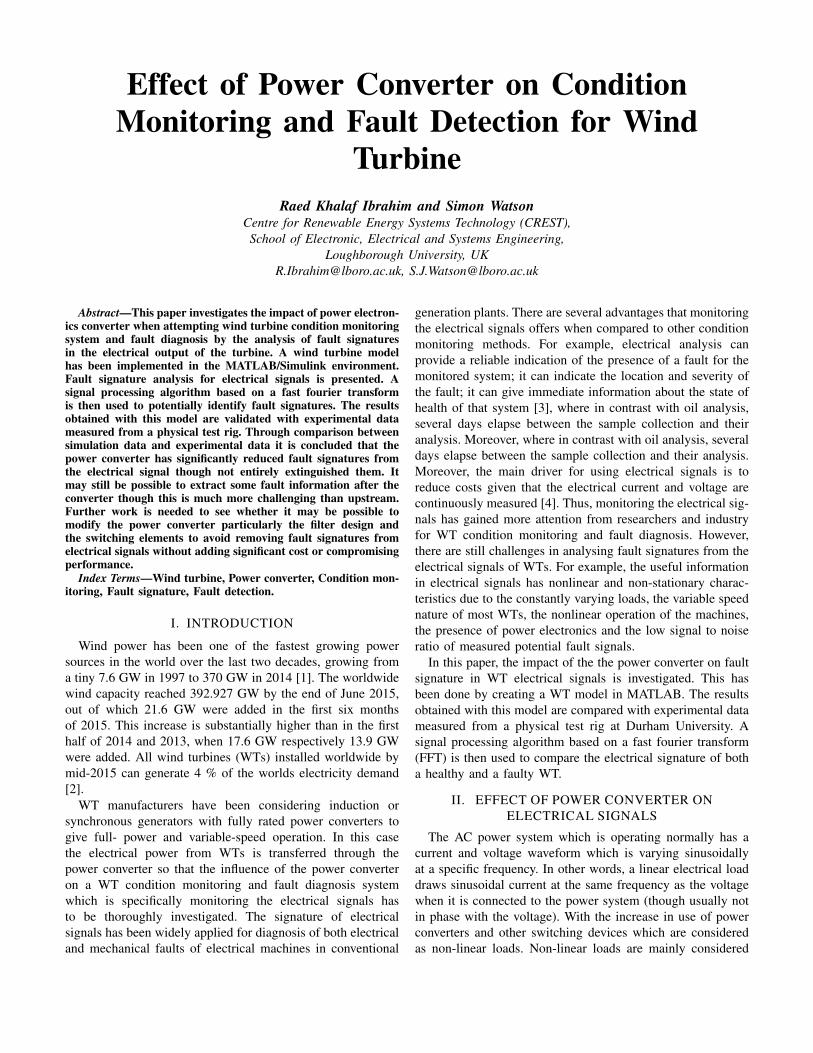
Effect of Power Converter on ConditionMonitoring and Fault Detection for Wind
TurbineRaed Khalaf Ibrahim and Simon Watson
Centre for Renewable Energy Systems Technology (CREST),School of Electronic, Electrical and Systems Engineering,
Loughborough University, [email protected], [email protected]
Abstract—This paper investigates the impact of power electron-ics converter when attempting wind turbine condition monitoringsystem and fault diagnosis by the analysis of fault signaturesin the electrical output of the turbine. A wind turbine modelhas been implemented in the MATLAB/Simulink environment.Fault signature analysis for electrical signals is presented. Asignal processing algorithm based on a fast fourier transformis then used to potentially identify fault signatures. The resultsobtained with this model are validated with experimental datameasured from a physical test rig. Through comparison betweensimulation data and experimental data it is concluded that thepower converter has significantly reduced fault signatures fromthe electrical signal though not entirely extinguished them. Itmay still be possible to extract some fault information after theconverter though this is much more challenging than upstream.Further work is needed to see whether it may be possible tomodify the power converter particularly the filter design andthe switching elements to avoid removing fault signatures fromelectrical signals without adding significant cost or compromisingperformance.
Index Terms—Wind turbine, Power converter, Condition mon-itoring, Fault signature, Fault detection.
I. INTRODUCTION
Wind power has been one of the fastest growing powersources in the world over the last two decades, growing froma tiny 7.6 GW in 1997 to 370 GW in 2014 [1]. The worldwidewind capacity reached 392.927 GW by the end of June 2015,out of which 21.6 GW were added in the first six monthsof 2015. This increase is substantially higher than in the firsthalf of 2014 and 2013, when 17.6 GW respectively 13.9 GWwere added. All wind turbines (WTs) installed worldwide bymid-2015 can generate 4 % of the worlds electricity demand[2].
WT manufacturers have been considering induction orsynchronous generators with fully rated power converters togive full- power and variable-speed operation. In this casethe electrical power from WTs is transferred through thepower converter so that the influence of the power converteron a WT condition monitoring and fault diagnosis systemwhich is specifically monitoring the electrical signals hasto be thoroughly investigated. The signature of electricalsignals has been widely applied for diagnosis of both electricaland mechanical faults of electrical machines in conventional
generation plants. There are several advantages that monitoringthe electrical signals offers when compared to other conditionmonitoring methods. For example, electrical analysis canprovide a reliable indication of the presence of a fault for themonitored system; it can indicate the location and severity ofthe fault; it can give immediate information about the state ofhealth of that system [3], where in contrast with oil analysis,several days elapse between the sample collection and theiranalysis. Moreover, where in contrast with oil analysis, severaldays elapse between the sample collection and their analysis.Moreover, the main driver for using electrical signals is toreduce costs given that the electrical current and voltage arecontinuously measured [4]. Thus, monitoring the electrical sig-nals has gained more attention from researchers and industryfor WT condition monitoring and fault diagnosis. However,there are still challenges in analysing fault signatures from theelectrical signals of WTs. For example, the useful informationin electrical signals has nonlinear and non-stationary charac-teristics due to the constantly varying loads, the variable speednature of most WTs, the nonlinear operation of the machines,the presence of power electronics and the low signal to noiseratio of measured potential fault signals.
In this paper, the impact of the the power converter on faultsignature in WT electrical signals is investigated. This hasbeen done by creating a WT model in MATLAB. The resultsobtained with this model are compared with experimental datameasured from a physical test rig at Durham University. Asignal processing algorithm based on a fast fourier transform(FFT) is then used to compare the electrical signature of botha healthy and a faulty WT.
II. EFFECT OF POWER CONVERTER ONELECTRICAL SIGNALS
The AC power system which is operating normally has acurrent and voltage waveform which is varying sinusoidallyat a specific frequency. In other words, a linear electrical loaddraws sinusoidal current at the same frequency as the voltagewhen it is connected to the power system (though usually notin phase with the voltage). With the increase in use of powerconverters and other switching devices which are consideredas non-linear loads. Non-linear loads are mainly considered
as harmonic sources because non-linear loads consume onlysome part of the sinusoidal current and voltage rather thanconsuming the full wave. This distortion in the current andvoltage waveforms will cause unwanted harmonics. It hasbeen reported in [5] that high levels of harmonic distortioncan be caused by components such as capacitors, static VARcompensators, inverters, AC converters, switch-mode powersupplies, AC or DC motor drives, etc. However, the use ofpower electronic equipment with switching always leads toharmonic disturbances causing power quality issues in the grid[6].
Generally, the power produced from a WT with a fully ratedcon-verter is first converted into DC and then converted backto AC with the grid frequency. On the DC side, the harmonicsare of less importance, because the DC load acts as a filterwith highly inductive impedance, which minimizes the level ofharmonics. Since the DC harmonic is within the zero sequence,there is no transfer of these harmonics between the differentvoltage levels. While on the AC side, the AC filters are used tominimize the flow of harmonic current into the AC network.There are two types of AC harmonic filters: tuned filter andhigh pass filter [7]. In a large AC/DC power converter, two ormore tuned filters are employed for the lower-harmonic (onefor each harmonic frequency). These filters are used in thereduction of harmonic currents in the AC-side of the converter.Furthermore, the power converters inject harmonic currents orvoltages into the power system in order to control the steady-state and dynamic active and reactive power [8].
In these investigations, it is found that power converters haveclearly effected the electrical signals by either minimizing theharmonics level or adding harmonics into the electrical signals,meaning that any fault signature in electrical signals might beeffected as well. In order to have a more clear understandingof the effect of the power converter on the faults signature, itis essential to understand the analysis of the fault signature ofthat electrical signal.
III. FAULT SIGNATURE ANALYSIS FORELECTRICAL SIGNALS
Voltage and current are electrical signals which can beacquired from the terminals of electrical machine such asgenerators and motors. The signature of electrical signalshas been widely applied for diagnosis of both electrical andmechanical faults of electrical machines in nuclear, fossil-fueland hydro power stations. Stator current analysis for WT faultdetection has been in practice for quite some time now, forfurther details, see [9]. However, if a fault occurs in a WT thismight cause radial rotor movement and shaft torque variationof the WT. Accordingly, these fault effects will modulatethe amplitude and frequency of the current signals measuredfrom the terminals of the generator. If we suppose i(t) bethe instantaneous current signal of a healthy WT, then thefundamental component waveform of i(t) is
i(t) = Imax sin(2πft+ φ) (1)
where t is the time index in second; f is the fundamentalfrequency (50Hz or 60Hz), Imax and φ are the amplitude,frequency and phase of the fundamental component of thecurrent signal, respectively. It is clear from a power systempoint of view that current signals may include more or lesshigher harmonic components for various reasons. Harmonicscan be defined as waveforms superimposed on a fundamentalwaveform having frequencies different to the fundamentalfrequency. The frequency of each harmonic component isknown as the harmonic frequency. The harmonic componentof a current of order n can be represented by using Fourierseries as
inh(t) = In sin(2πnft+ φ) (2)
where n is the harmonic order, and In is the amplitude ofharmonic component. Generally, the current signal will be asfollows:
i(t) = Imax sin(2πft+ φ) + inh(t) (3)
It is assumed below that if (t) is the current signal for afaulty WT
if (t) = If sin(2πff t+ φf ) + inh(t) (4)
where If , ff , φf and inh are the amplitude, frequency, phaseand harmonics of the current signal during fault conditions,respectively. It is important to highlight that the main driverfor the analysis of the current signal is to detect If ), ff , φfand inh(t), which are the signatures of the WT fault in thecurrent signal. But, as mentioned before, signal to noise ratioof measured signals (current and voltage) is low. Accordingly,the traditional methods based on time domain analysis cannoteasily uncover the characteristics of time-varying components.In order to have a more clear understanding of the charac-teristics of the fault current signal in (4), the techniques ofamplitude, frequency and phase modulation, used in electroniccommunication (see [10] for details), will be adopted in thisresearch. Consequently, the modulated current signal im of thefault current signal in (4) can be modeled as:
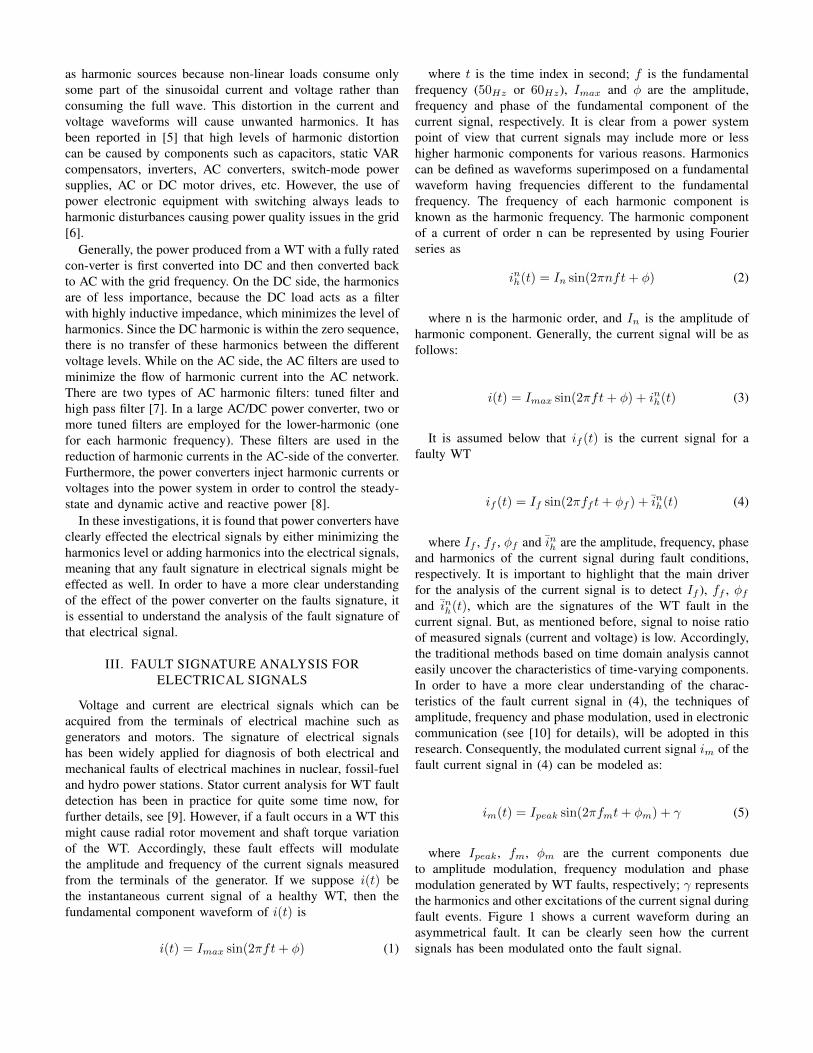
im(t) = Ipeak sin(2πfmt+ φm) + γ (5)
where Ipeak, fm, φm are the current components dueto amplitude modulation, frequency modulation and phasemodulation generated by WT faults, respectively; γ representsthe harmonics and other excitations of the current signal duringfault events. Figure 1 shows a current waveform during anasymmetrical fault. It can be clearly seen how the currentsignals has been modulated onto the fault signal.
Time (Sec)
0 0.05 0.1 0.15 0.2 0.25 0.3 0.35 0.4 0.45 0.5
Am
pli
tud
e
-4000
-2000
0
2000
4000
6000
8000
10000
12000
14000
16000
Fig. 1: Current signal during fault events
To overcome the shortcomings of time domain analysis,technique such as fourier transform is used for feature extrac-tion. The fourier transform is can be used to convert the timedescription of the continuous waveform x(t) into an equivalentfunction in frequency by:
X(f) =
∞∫−∞
x(t)e−j2πft dt (6)
Then, Eq. (5) can be rewritten as:
F [Im(f)] =
∞∫−∞
im(t)e−j2πft dt (7)
substituting Equation (5) into Equation (7) and neglectingthe phase term,
F [Im(f)] =
∞∫−∞
[Ipeak sin(2πfmt) + γ]e−j2πftdt (8)
while
sin 2πft =ej2πft
j2− e−j2πft
j2(9)
then by manipulation to obtain the following equation:
F [Im(f)] =1
j2Ipeak[δ(f + fm) − δ(f − fm)] +Hf (10)
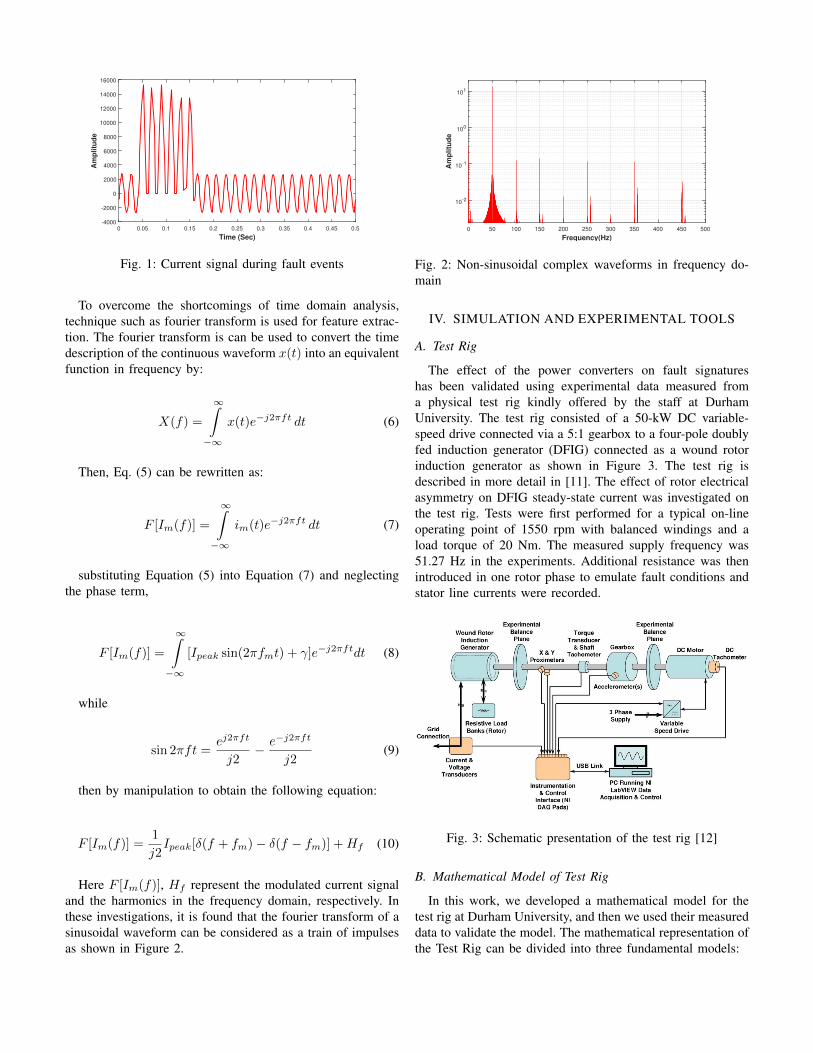
Here F [Im(f)], Hf represent the modulated current signaland the harmonics in the frequency domain, respectively. Inthese investigations, it is found that the fourier transform of asinusoidal waveform can be considered as a train of impulsesas shown in Figure 2.
Frequency(Hz)
0 50 100 150 200 250 300 350 400 450 500
Amplitude
10-2
10-1
100
101
Fig. 2: Non-sinusoidal complex waveforms in frequency do-main
IV. SIMULATION AND EXPERIMENTAL TOOLS
A. Test Rig
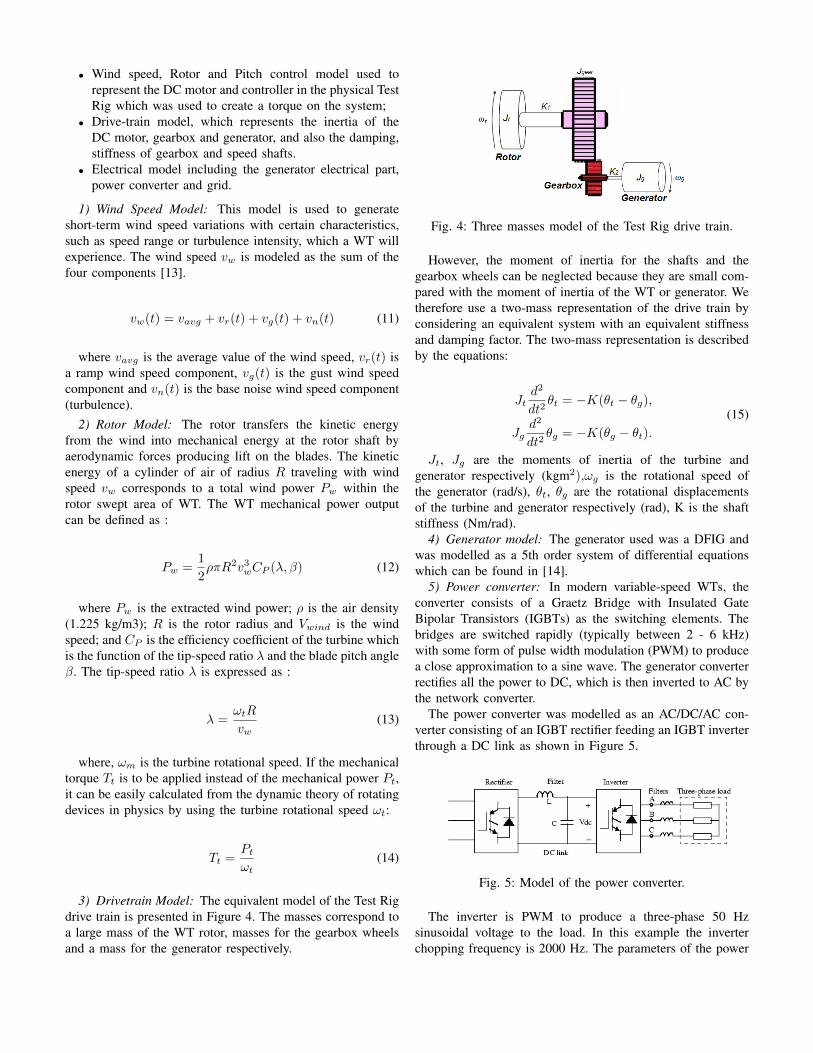
The effect of the power converters on fault signatureshas been validated using experimental data measured froma physical test rig kindly offered by the staff at DurhamUniversity. The test rig consisted of a 50-kW DC variable-speed drive connected via a 5:1 gearbox to a four-pole doublyfed induction generator (DFIG) connected as a wound rotorinduction generator as shown in Figure 3. The test rig isdescribed in more detail in [11]. The effect of rotor electricalasymmetry on DFIG steady-state current was investigated onthe test rig. Tests were first performed for a typical on-lineoperating point of 1550 rpm with balanced windings and aload torque of 20 Nm. The measured supply frequency was51.27 Hz in the experiments. Additional resistance was thenintroduced in one rotor phase to emulate fault conditions andstator line currents were recorded.
Fig. 3: Schematic presentation of the test rig [12]
B. Mathematical Model of Test Rig
In this work, we developed a mathematical model for thetest rig at Durham University, and then we used their measureddata to validate the model. The mathematical representation ofthe Test Rig can be divided into three fundamental models:
• Wind speed, Rotor and Pitch control model used torepresent the DC motor and controller in the physical TestRig which was used to create a torque on the system;
• Drive-train model, which represents the inertia of theDC motor, gearbox and generator, and also the damping,stiffness of gearbox and speed shafts.
• Electrical model including the generator electrical part,power converter and grid.
1) Wind Speed Model: This model is used to generateshort-term wind speed variations with certain characteristics,such as speed range or turbulence intensity, which a WT willexperience. The wind speed vw is modeled as the sum of thefour components [13].
vw(t) = vavg + vr(t) + vg(t) + vn(t) (11)
where vavg is the average value of the wind speed, vr(t) isa ramp wind speed component, vg(t) is the gust wind speedcomponent and vn(t) is the base noise wind speed component(turbulence).
2) Rotor Model: The rotor transfers the kinetic energyfrom the wind into mechanical energy at the rotor shaft byaerodynamic forces producing lift on the blades. The kineticenergy of a cylinder of air of radius R traveling with windspeed vw corresponds to a total wind power Pw within therotor swept area of WT. The WT mechanical power outputcan be defined as :
Pw =1
2ρπR2v3wCP (λ, β) (12)
where Pw is the extracted wind power; ρ is the air density(1.225 kg/m3); R is the rotor radius and Vwind is the windspeed; and CP is the efficiency coefficient of the turbine whichis the function of the tip-speed ratio λ and the blade pitch angleβ. The tip-speed ratio λ is expressed as :
λ =ωtR
vw(13)
where, ωm is the turbine rotational speed. If the mechanicaltorque Tt is to be applied instead of the mechanical power Pt,it can be easily calculated from the dynamic theory of rotatingdevices in physics by using the turbine rotational speed ωt:
Tt =Ptωt
(14)
3) Drivetrain Model: The equivalent model of the Test Rigdrive train is presented in Figure 4. The masses correspond toa large mass of the WT rotor, masses for the gearbox wheelsand a mass for the generator respectively.
Fig. 4: Three masses model of the Test Rig drive train.
However, the moment of inertia for the shafts and thegearbox wheels can be neglected because they are small com-pared with the moment of inertia of the WT or generator. Wetherefore use a two-mass representation of the drive train byconsidering an equivalent system with an equivalent stiffnessand damping factor. The two-mass representation is describedby the equations:
Jtd2
dt2θt = −K(θt − θg),
Jgd2
dt2θg = −K(θg − θt).
(15)
Jt, Jg are the moments of inertia of the turbine andgenerator respectively (kgm2),ωg is the rotational speed ofthe generator (rad/s), θt, θg are the rotational displacementsof the turbine and generator respectively (rad), K is the shaftstiffness (Nm/rad).
4) Generator model: The generator used was a DFIG andwas modelled as a 5th order system of differential equationswhich can be found in [14].
5) Power converter: In modern variable-speed WTs, theconverter consists of a Graetz Bridge with Insulated GateBipolar Transistors (IGBTs) as the switching elements. Thebridges are switched rapidly (typically between 2 - 6 kHz)with some form of pulse width modulation (PWM) to producea close approximation to a sine wave. The generator converterrectifies all the power to DC, which is then inverted to AC bythe network converter.
The power converter was modelled as an AC/DC/AC con-verter consisting of an IGBT rectifier feeding an IGBT inverterthrough a DC link as shown in Figure 5.
Fig. 5: Model of the power converter.
The inverter is PWM to produce a three-phase 50 Hzsinusoidal voltage to the load. In this example the inverterchopping frequency is 2000 Hz. The parameters of the power
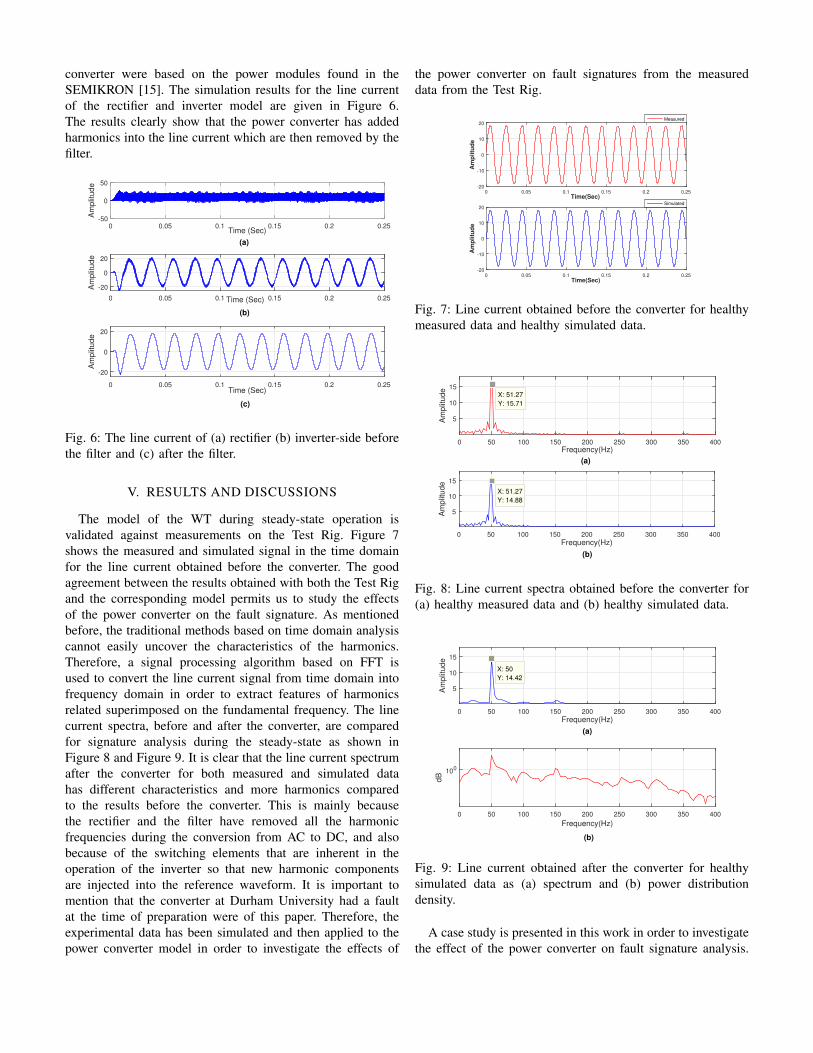
converter were based on the power modules found in theSEMIKRON [15]. The simulation results for the line currentof the rectifier and inverter model are given in Figure 6.The results clearly show that the power converter has addedharmonics into the line current which are then removed by thefilter.
Time (Sec)0 0.05 0.1 0.15 0.2 0.25
Am
plit
ude
-50
0
50
(a)
Time (Sec)0 0.05 0.1 0.15 0.2 0.25
Am
plit
ude
-20
0
20
(c)
Time (Sec)0 0.05 0.1 0.15 0.2 0.25
Am
plit
ude
-20
0
20
(b)
Fig. 6: The line current of (a) rectifier (b) inverter-side beforethe filter and (c) after the filter.
V. RESULTS AND DISCUSSIONS
The model of the WT during steady-state operation isvalidated against measurements on the Test Rig. Figure 7shows the measured and simulated signal in the time domainfor the line current obtained before the converter. The goodagreement between the results obtained with both the Test Rigand the corresponding model permits us to study the effectsof the power converter on the fault signature. As mentionedbefore, the traditional methods based on time domain analysiscannot easily uncover the characteristics of the harmonics.Therefore, a signal processing algorithm based on FFT isused to convert the line current signal from time domain intofrequency domain in order to extract features of harmonicsrelated superimposed on the fundamental frequency. The linecurrent spectra, before and after the converter, are comparedfor signature analysis during the steady-state as shown inFigure 8 and Figure 9. It is clear that the line current spectrumafter the converter for both measured and simulated datahas different characteristics and more harmonics comparedto the results before the converter. This is mainly becausethe rectifier and the filter have removed all the harmonicfrequencies during the conversion from AC to DC, and alsobecause of the switching elements that are inherent in theoperation of the inverter so that new harmonic componentsare injected into the reference waveform. It is important tomention that the converter at Durham University had a faultat the time of preparation were of this paper. Therefore, theexperimental data has been simulated and then applied to thepower converter model in order to investigate the effects of
the power converter on fault signatures from the measureddata from the Test Rig.
Time(Sec)0 0.05 0.1 0.15 0.2 0.25
Amplitude
-20
-10
0
10
20Measured
Time(Sec)0 0.05 0.1 0.15 0.2 0.25
Amplitude
-20
-10
0
10
20Simulated
Fig. 7: Line current obtained before the converter for healthymeasured data and healthy simulated data.
Frequency(Hz)0 50 100 150 200 250 300 350 400
Am
plit
ude
5
10
15
(b)
Frequency(Hz)0 50 100 150 200 250 300 350 400
Am
plit
ude
5
10
15
(a)
X: 51.27
Y: 15.71
X: 51.27
Y: 14.88
Fig. 8: Line current spectra obtained before the converter for(a) healthy measured data and (b) healthy simulated data.
Frequency(Hz)0 50 100 150 200 250 300 350 400
Am
plit
ude
5
10
15
(a)
Frequency(Hz)
0 50 100 150 200 250 300 350 400
dB
100
(b)
X: 50
Y: 14.42
Fig. 9: Line current obtained after the converter for healthysimulated data as (a) spectrum and (b) power distributiondensity.
A case study is presented in this work in order to investigatethe effect of the power converter on fault signature analysis.
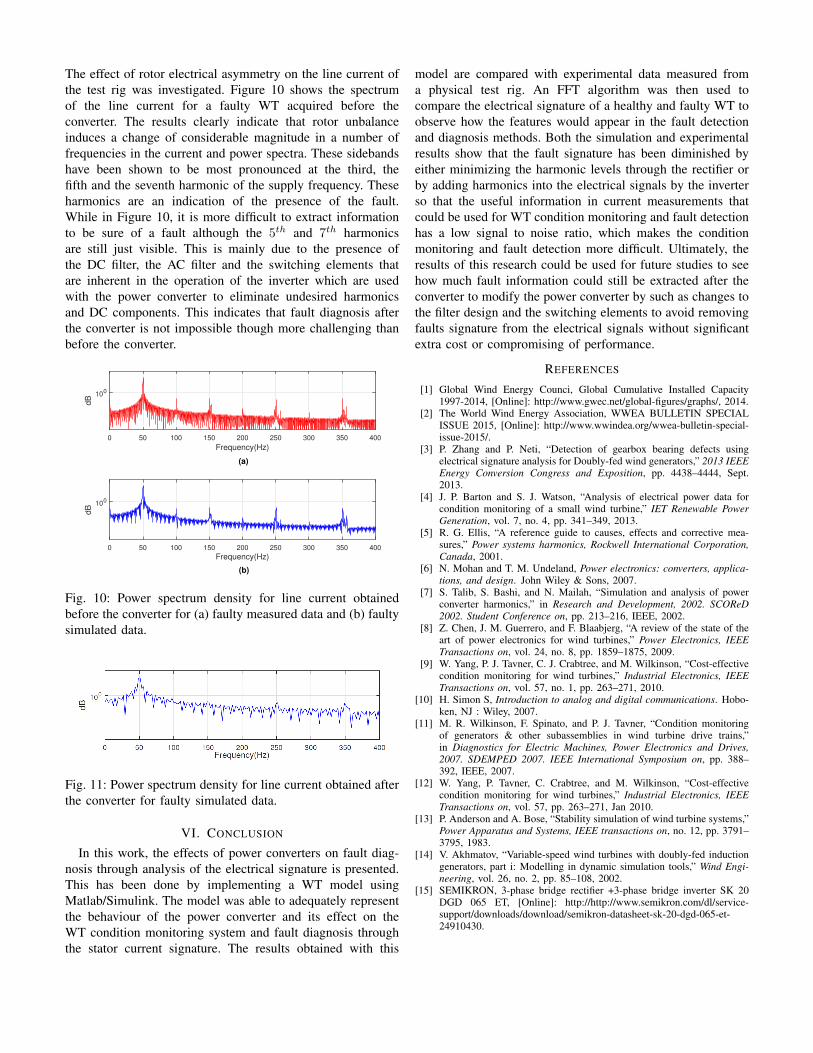
The effect of rotor electrical asymmetry on the line current ofthe test rig was investigated. Figure 10 shows the spectrumof the line current for a faulty WT acquired before theconverter. The results clearly indicate that rotor unbalanceinduces a change of considerable magnitude in a number offrequencies in the current and power spectra. These sidebandshave been shown to be most pronounced at the third, thefifth and the seventh harmonic of the supply frequency. Theseharmonics are an indication of the presence of the fault.While in Figure 10, it is more difficult to extract informationto be sure of a fault although the 5th and 7th harmonicsare still just visible. This is mainly due to the presence ofthe DC filter, the AC filter and the switching elements thatare inherent in the operation of the inverter which are usedwith the power converter to eliminate undesired harmonicsand DC components. This indicates that fault diagnosis afterthe converter is not impossible though more challenging thanbefore the converter.
Frequency(Hz)
0 50 100 150 200 250 300 350 400
dB
100
(a)
Frequency(Hz)0 50 100 150 200 250 300 350 400
dB
100
(b)
Fig. 10: Power spectrum density for line current obtainedbefore the converter for (a) faulty measured data and (b) faultysimulated data.
Fig. 11: Power spectrum density for line current obtained afterthe converter for faulty simulated data.
VI. CONCLUSION
In this work, the effects of power converters on fault diag-nosis through analysis of the electrical signature is presented.This has been done by implementing a WT model usingMatlab/Simulink. The model was able to adequately representthe behaviour of the power converter and its effect on theWT condition monitoring system and fault diagnosis throughthe stator current signature. The results obtained with this
model are compared with experimental data measured froma physical test rig. An FFT algorithm was then used tocompare the electrical signature of a healthy and faulty WT toobserve how the features would appear in the fault detectionand diagnosis methods. Both the simulation and experimentalresults show that the fault signature has been diminished byeither minimizing the harmonic levels through the rectifier orby adding harmonics into the electrical signals by the inverterso that the useful information in current measurements thatcould be used for WT condition monitoring and fault detectionhas a low signal to noise ratio, which makes the conditionmonitoring and fault detection more difficult. Ultimately, theresults of this research could be used for future studies to seehow much fault information could still be extracted after theconverter to modify the power converter by such as changes tothe filter design and the switching elements to avoid removingfaults signature from the electrical signals without significantextra cost or compromising of performance.
REFERENCES
[1] Global Wind Energy Counci, Global Cumulative Installed Capacity1997-2014, [Online]: http://www.gwec.net/global-figures/graphs/, 2014.
[2] The World Wind Energy Association, WWEA BULLETIN SPECIALISSUE 2015, [Online]: http://www.wwindea.org/wwea-bulletin-special-issue-2015/.
[3] P. Zhang and P. Neti, “Detection of gearbox bearing defects usingelectrical signature analysis for Doubly-fed wind generators,” 2013 IEEEEnergy Conversion Congress and Exposition, pp. 4438–4444, Sept.2013.
[4] J. P. Barton and S. J. Watson, “Analysis of electrical power data forcondition monitoring of a small wind turbine,” IET Renewable PowerGeneration, vol. 7, no. 4, pp. 341–349, 2013.
[5] R. G. Ellis, “A reference guide to causes, effects and corrective mea-sures,” Power systems harmonics, Rockwell International Corporation,Canada, 2001.
[6] N. Mohan and T. M. Undeland, Power electronics: converters, applica-tions, and design. John Wiley & Sons, 2007.
[7] S. Talib, S. Bashi, and N. Mailah, “Simulation and analysis of powerconverter harmonics,” in Research and Development, 2002. SCOReD2002. Student Conference on, pp. 213–216, IEEE, 2002.
[8] Z. Chen, J. M. Guerrero, and F. Blaabjerg, “A review of the state of theart of power electronics for wind turbines,” Power Electronics, IEEETransactions on, vol. 24, no. 8, pp. 1859–1875, 2009.
[9] W. Yang, P. J. Tavner, C. J. Crabtree, and M. Wilkinson, “Cost-effectivecondition monitoring for wind turbines,” Industrial Electronics, IEEETransactions on, vol. 57, no. 1, pp. 263–271, 2010.
[10] H. Simon S, Introduction to analog and digital communications. Hobo-ken, NJ : Wiley, 2007.
[11] M. R. Wilkinson, F. Spinato, and P. J. Tavner, “Condition monitoringof generators & other subassemblies in wind turbine drive trains,”in Diagnostics for Electric Machines, Power Electronics and Drives,2007. SDEMPED 2007. IEEE International Symposium on, pp. 388–392, IEEE, 2007.
[12] W. Yang, P. Tavner, C. Crabtree, and M. Wilkinson, “Cost-effectivecondition monitoring for wind turbines,” Industrial Electronics, IEEETransactions on, vol. 57, pp. 263–271, Jan 2010.
[13] P. Anderson and A. Bose, “Stability simulation of wind turbine systems,”Power Apparatus and Systems, IEEE transactions on, no. 12, pp. 3791–3795, 1983.
[14] V. Akhmatov, “Variable-speed wind turbines with doubly-fed inductiongenerators, part i: Modelling in dynamic simulation tools,” Wind Engi-neering, vol. 26, no. 2, pp. 85–108, 2002.
[15] SEMIKRON, 3-phase bridge rectifier +3-phase bridge inverter SK 20DGD 065 ET, [Online]: http://http://www.semikron.com/dl/service-support/downloads/download/semikron-datasheet-sk-20-dgd-065-et-24910430.