Embed Size (px)
Citation preview
The effect of self-benefit and other-benefit appeals in combination with
emotional message framing on the consumption of demerit goods.
Master Thesis Marketing
Erasmus School of Economics
4th of July, 2020
Jordi van den Berg, 341356
Supervised by P. Gorji
Abstract
This study investigates the relationship between self-benefit & other-benefit appeals and
emotional message framing on the consumption of demerit goods. In this experiment, smoking is
chosen as a proxy for demerit good consumption. A 2x2 between-subjects survey design is
conducted on Prolific among 170 participants. Results show that both appeal and emotion have a
significant effect on smoking intention. It seems that a combination of self-benefit appeal and
negative message framing leads to the lowest smoking intention. In addition, a hypothesized
moderating effect of habit on appeal and emotion appears to be not significant as well as a
hypothesized mediating effect of social norms. Based on these findings recommendations are
made.
Keywords: smoking intention, self-benefit appeal, other-benefit appeal, emotional framing, positive framing, negative
framing, habit formation, social norms, demerit goods, attitude-behavior gap, nudging
The views stated in this thesis are those of the author and not necessarily those of Erasmus School of Economics or
Erasmus University Rotterdam.
2
Table of contents
1. Introduction ............................................................................................................................... 4
1.1 Research Background ............................................................................................................ 4
1.2 Research Question ................................................................................................................. 5
1.3 Relevance .............................................................................................................................. 7
1.4 Structure ................................................................................................................................ 7
2. Theoretical Framework ............................................................................................................ 9
2.1 Demerit Goods ...................................................................................................................... 9
2.2 Attitude-behavior gap .......................................................................................................... 11
2.3 Nudging ............................................................................................................................... 13
2.4 Self-benefit and other-benefit.............................................................................................. 16
2.5 Negative and positive framing ............................................................................................ 20
2.6 Habit formation ................................................................................................................... 22
2.7 Social Norms ....................................................................................................................... 25
2.8 Conceptual Model ............................................................................................................... 26
3. Methodology ............................................................................................................................ 27
3.1 Research Design .................................................................................................................. 27
3.2 Research Setting .................................................................................................................. 28
3.3 Measurements of Variables ................................................................................................. 29
3.3.1 Smoking Intention ........................................................................................................ 29
3.3.2 Self-benefit and other-benefit appeal ........................................................................... 29
3.3.3 Negative and positive framing ...................................................................................... 30
3.3.4 Habit Formation and Social Norms .............................................................................. 31
3.3.5 Control Variables .......................................................................................................... 31
3.3.6 Constructs overview ..................................................................................................... 32
3.4 Statistical Analysis .............................................................................................................. 34
3.4.1. Pre-test ......................................................................................................................... 38
4. Data .......................................................................................................................................... 40
5. Results ...................................................................................................................................... 42
5.1 Reliability & validity ........................................................................................................... 42
5.1.1 Manipulation check ...................................................................................................... 42
3
5.1.2 Factor Analysis ............................................................................................................. 43
5.1.3 Cronbach’s Alpha ......................................................................................................... 46
5.2 Hypothesis testing ............................................................................................................... 46
5.3 Control variables ................................................................................................................. 52
6. Conclusion ............................................................................................................................... 57
6.1 Main Findings ..................................................................................................................... 57
6.2 Academic Implications ........................................................................................................ 58
6.3 Managerial Implications ...................................................................................................... 59
6.4 Limitations .......................................................................................................................... 60
6.5 Further research ................................................................................................................... 61
References .................................................................................................................................... 63
Appendix A .................................................................................................................................. 77
Appendix B .................................................................................................................................. 83
4
1. Introduction
1.1 Research Background
Every year the month of October is branded as Stoptober in The Netherlands. Stoptober is an
initiative of several NGOs and the Ministry of Health, Welfare and Sport to encourage people to
quit smoking through a national campaign. Stoptober is one of the many efforts to reduce smoking
in The Netherlands, such as but not limited to raising taxes on tobacco, the prohibition of smoking
in certain public spaces and offering free services to quit smoking through Dutch health insurance.
It is estimated that approximately one million people attempt to quit smoking in The Netherlands
and despite many efforts, only less than 10% of them are successful.1 Tobacco is considered as the
third most addictive drug after heroin and crack (Opperhuizen et al., 2009). In 2018, 22.4% of the
people over 18 in The Netherlands smoked, of whom 71.6% on a daily base which roughly
translates to 2.8 million people.2 Among people who smoke, for up to 66% of the people the cause
of death can be attributed to their smoking habit. While quitting greatly improves life expectancy
(Banks et al., 2015). Smoking is responsible for the majority of deaths among adults in the
Netherlands.3
Due to various efforts by the tobacco industry, smoking remains a widespread habit.
Manufacturers add other addictive substances such as glycerine, sugar and menthol to cigarettes.4
Menthol is known to numb the throat, which makes smoking easier. Tobacco itself contains
ammonia, which increases the absorption of nicotine on the blood. This results in a higher
likelihood of becoming addicted to nicotine. All these factors make quitting smoking even harder.
The profits of the six biggest tobacco companies in 2013 were equal to the profits of Coca-Cola
Company, Walt Disney, General Mills, FedEx, AT&T, Google, McDonald’s and Starbucks
combined.5 One example of the influence of the tobacco industry is that the former Dutch Minister
of Health Elco Brinkman became a lobbyist for the tobacco industry.6 Despite major criticism, this
directly influenced Dutch policymaking in favour of the tobacco industry.7 Unsuccessful attempts
1 https://www.trimbos.nl/kennis/stoppen-met-roken/stoppen-met-roken-feiten-en-cijfers 2 https://www.cbs.nl/nl-nl/nieuws/2019/12/lichte-daling-aantal-rokers-onder-volwassenen 3 https://www.volksgezondheidenzorg.info/onderwerp/roken/cijfers-context/gevolgen#node-sterfte-door-roken 4 https://www.rivm.nl/tabak/toevoegingen-aan-tabak 5 https://blogs.bath.ac.uk/business-and-society/2018/01/16/big-tobacco/ 6 https://www.tabaknee.nl/tabakslobby/de-mensen-achter-de-lobby/item/93-elco-brinkman-dom-of-gewetenloos 7 https://www.nu.nl/politiek/2827558/de-jager-zwichtte-tabakslobby.html
5
to quit smoking is not the only reason the tobacco industry is booming. The tobacco industries is
targeting markets in Asia and Africa such as India, Thailand and South-Africa. This way, the
tobacco industry expands from Western countries to countries where tobacco regulations are
absent and are being actively suppressed by lobbyists.8 In these countries aggressive techniques
are being used such as colourful advertisements and giving away free cigarettes to children in
India.9 These efforts are not without results, in 2009 15% of the children in India smoked tobacco
on a regular base (Gajalakshmi & Kanimozhi, 2010). The rapid expansion in developing countries
combined with the fact that smoking is (indirectly) responsible for a large number of deaths
underscores the need for an effective and feasible strategy to reduce the number of smokers.
1.2 Research Question
The rational choice theory assumes that individuals make rational choices that are in their own
best interests (Robert, 1991). For example, a consumer determines that eating unhealthy food is
bad for him and decides to consume healthy food from now on. However, consumers tend to keep
consuming unhealthy food which is bad for them for various reasons. Goods that consumers tend
to consume not only whilst knowing that they are harmful to them but also that they cause negative
external effects are called demerit goods.
Attempts to decrease the consumption of demerit goods have been unsuccessful in the past.
One of the more well-known examples is the banning of alcohol in the United States between 1920
and 1933. This experiment was considered to be a failure by many in both social and political
aspects. It also made clear that government control cannot replace individual responsibility. The
experiment has shown that the prohibition decreased alcohol consumption in the short term but
did not have a significant effect in the long run (Dills, Jacobson & Miron, 2005). Because of the
prohibition government expenditures, crime rates & mortality rates had increased, making it a
failure. In another attempt to reduce the consumption of demerit goods, the European Commission
has established a tobacco guideline. The Tobacco Directive stipulates that all European countries,
among them The Netherlands, must print warning messages. In total there are 13 messages,
varying from “Smoking causes mouth and throat cancer” to “Smoking reduces fertility”. All
8 https://www.theguardian.com/world/2017/jul/12/big-tobacco-dirty-war-africa-market 9 https://www.independent.co.uk/news/world/asia/india-philip-morris-marlboro-advertising-tactics-cigarettes-smoking-young-people-a7848426.html
6
messages have a clear negative formulated warning and nearly all messages emphasize the
negative consequences for oneself. Research has shown that the effect of these warnings varies
greatly between countries and seems to greatly depend on additional measures that vary by country
(Hitchman et al., 2012). In reaction to these findings, the European Commission added graphic
images to the warnings in an attempt to increase the effectivity. A 2015 (Agaku et al.) research has
shown that there are indications that these graphics might affect effectivity, though no significant
increases in effectivity are found.
This study proposes a different approach. Attempts to reduce the consumption of demerit
goods often focus on emphasizing the negative consequences for oneself. This might be an
explanation for the insignificant results from Agaku et al. (2015). Repeating the same warning
over and over leads to warning fatigue, or also known as ‘the boy who cried wolf’-effect (Mackie,
2014). Individuals become desensitized to recurring messages, rendering the warning useless.
Another explanation might be that negative health warnings are per definition not effective in
nudging behavior (Chang, 2007; Agrawal et al., 2007). On top of that, other disciplines show that
nudges that place an appeal on oneself are not as effective as nudges that place an appeal on others
(Peloza & White, 2009; Green & Peloza, 2014; Peloza, White & Shang, 2013; Fisher et al., 2008).
Approaches from other disciplines that have proven to be effective, might be effective in this area
of research as well. Therefore, this study is aimed at exploring policies that include nudges that
are effective at encouraging consumers to consume less demerit goods. Based on this, the
following research question is formulated:
“To what extent can consumers be nudged to consume less demerit goods through self- and other-
benefit appeals in combination with negative and positive message framing?”
In this study smoking is chosen as a proxy for demerit goods. This is done because smoking
is one of the deadliest objects in the history of human civilization, killing 6 million people a year.
It is estimated in the twentieth century smoking is responsible for over 100 million deaths (Proctor,
2013). In addition, smoking is highly addictive. Smokers have a 85% chance of becoming addicted
compared to a 12,5% for alcohol drinkers (Proctor, 2013). Smoking also has a higher level of
negative external effects compared to other demerit goods such as alcohol and junk food.
7
1.3 Relevance
This study contributes to the area of policymaking and nudging in particular. The results can be
used by policymakers to decrease demerit good consumption on a national level. By using the
appropriate nudges, based on this study, policymakers can achieve substantial results by making
minor changes. This results in not only an effective but also a cost-efficient tool. The latter is even
more important for developing countries with lower public budgets. These countries are more than
ever in need of cost-efficient tools as they are seen as expansion markets for tobacco producers.
Besides, using the appropriate nudges to decrease demerit good consumption also leads to potential
cost-savings such as lower health costs, lower crime rates and higher productivity rates. Finally,
in countries such as The Netherlands and other European countries, demerit good deconsumption
policies are becoming controversial. Policies such as fat tax lead to (judicial) discussions and
frictions.10 Nudging is often experienced as non-intrusive (Hagman et al., 2015) and can prevent
so-said discussions and frictions.
On an academic level this study contributes to further expansion of using other-benefit appeals.
The use of other-benefit appeals is widely used in certain fields such as environmental issues (e.g.
going green) and charity donation. By showing that other-benefit appeals have a significant effect
in this area of research, it can encourage other areas of research to use this concept as well. Vice
versa, disciplines already using other-benefit appeals can learn from study-specific factors such as
the combination with message framing (positively and negatively), social norms and habit
formation. Furthermore, while not in the main scope of this research, an addition can be made to
the discussion of the roles of the control variables such as age and gender and their effect on
nudges.
1.4 Structure
The remainder of this study is structured as follows. Chapter 2 gives an overview of the literature
and describes demerit goods, attitude-behavior and nudging. Furthermore, the reader will be
introduced with concepts such as self-benefit and other-benefit, emotional message framing, social
norms and habit formation. At the end of chapter 2 the conceptual model is presented. Chapter 3
presents the methodology of this study while chapter 4 briefly discusses the data. Chapter 5
10 https://www.volkskrant.nl/nieuws-achtergrond/vetbelasting-wordt-alweer-afgeschaft~b78b370e/

8
presents the results after testing the data on reliability and validity. Finally, in chapter 6 an answer
to the research question is formulated together with the limitations of this study and suggestions
for further research.
9
2. Theoretical Framework
This chapter will discuss previous research, provide hypotheses of the study and give an overview
of the conceptual model. In the first paragraph, the definition of demerit goods will be introduced.
In the second paragraph the problem of the attitude-behavior gap will be introduced and in the
third paragraph a potential solution is formulated through nudging. The fourth and fifth paragraphs
explain in detail which specific nudges have potential. Whereas the sixth and seventh paragraphs
discusses respectively a potential moderating and mediating variable.
2.1 Demerit Goods
Demerit goods is a term derived from merit goods, therefore merit goods will be briefly examined
in this paragraph before demerit goods will be discussed. The concept of merit goods has been
introduced by Musgrave (1956). For a product to be classified as a merit good two criteria must
be fulfilled. First, the good should be considered beneficial to the individual. Secondly, the good
should have measurable positive spillover effects on other individuals and society as a whole
(Mendoza, 2011). Examples of merit goods are healthcare and education, since these goods not
only have a positive effect on the consumer, but also allow society to benefit from these positive
effects (e.g. more education leads to more available doctors). However, merit goods tend to be
under-consumed and under-produced when left to the private market (Koch, 2008; Anderton,
2006). One reason for under-consumption is that the individual doesn’t take external effects into
account. For example, in the case of flu-shots the social benefits outweigh the individual benefit.
Meaning that flu-shots will prevent large percentages of the labor force from becoming ill. Yet,
individuals dislike taking flu shots. Another reason is that consumers tend to focus on the short-
term benefits instead of long-term benefits. For example, education is time-intensive and costly in
the short term, making labor more attractive (e.g. monetary short-term gains). However, in a
monetary sense educated individuals are better off in the long-term (Rehme, 2007).
A situation where the private market does not succeed in allocating resources efficiently
(e.g. under-production and under-consumption) is called market failure. Suboptimal allocation of
resources, also known as non-Pareto optimal allocation, has five generic causes: imperfection in
competition, asymmetry of information, public goods, externalities and inequality (Borooah,
2003). Because consumers grossly under- or over evaluate externalities, Musgrave stated that
governments should put aside money to supply merit goods, even when they otherwise could be
10
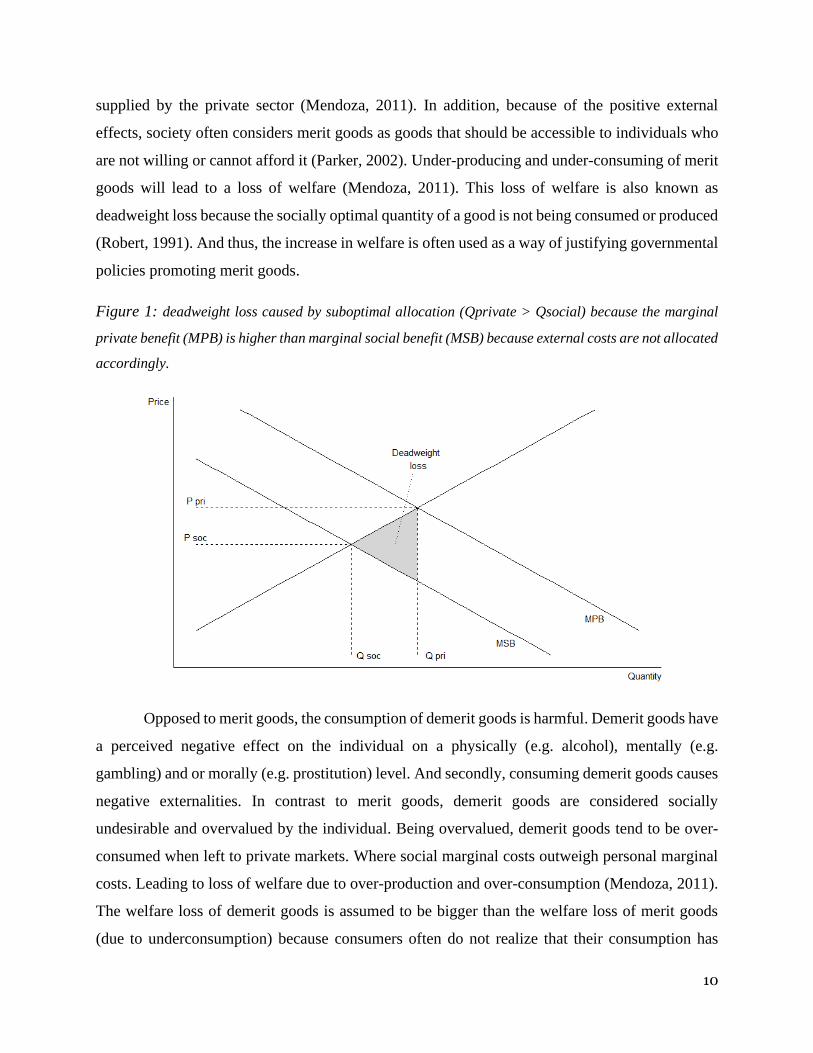
supplied by the private sector (Mendoza, 2011). In addition, because of the positive external
effects, society often considers merit goods as goods that should be accessible to individuals who
are not willing or cannot afford it (Parker, 2002). Under-producing and under-consuming of merit
goods will lead to a loss of welfare (Mendoza, 2011). This loss of welfare is also known as
deadweight loss because the socially optimal quantity of a good is not being consumed or produced
(Robert, 1991). And thus, the increase in welfare is often used as a way of justifying governmental
policies promoting merit goods.
Figure 1: deadweight loss caused by suboptimal allocation (Qprivate > Qsocial) because the marginal
private benefit (MPB) is higher than marginal social benefit (MSB) because external costs are not allocated
accordingly.
Opposed to merit goods, the consumption of demerit goods is harmful. Demerit goods have
a perceived negative effect on the individual on a physically (e.g. alcohol), mentally (e.g.
gambling) and or morally (e.g. prostitution) level. And secondly, consuming demerit goods causes
negative externalities. In contrast to merit goods, demerit goods are considered socially
undesirable and overvalued by the individual. Being overvalued, demerit goods tend to be over-
consumed when left to private markets. Where social marginal costs outweigh personal marginal
costs. Leading to loss of welfare due to over-production and over-consumption (Mendoza, 2011).
The welfare loss of demerit goods is assumed to be bigger than the welfare loss of merit goods
(due to underconsumption) because consumers often do not realize that their consumption has
11
harmful side-effects (Lipsey & Harbury, 1993). Therefore governments argue that interventions
are legitimized in the case of demerit goods, such as sin taxes and prohibition (Borer, 2018;
McCormick, 2007).
Smoking is considered a demerit good since it is not only harmful to individuals but also
society. Not only does smoking only contribute to health care cost due to smoking-related illnesses
but it also causes productivity loss, wealth loss and financial stress in smoking households (Nayak,
2019). Many of these negative effects are unaccounted for, which is reinforced by the notion of
Lipsey & Harbury (1993) about unawareness. Causing consumers to continue consuming demerit
goods.
Yet governments struggle to correct market failure caused by (de)merit goods. In the U.S.
the government attempted to introduce fluoride-treated public water to combat tooth decay,
periodontal diseases and improve overall oral health (U.S. Department of Health and Human
Services, 2000). Which would not only be beneficial to individuals but also to society in terms of
decreased health costs and less productivity loss. However, this has caused a major reaction among
consumers. Anti-fluoridation opposition arose everywhere, some scientifically-backed and some
conjectural, leading to the downfall of the U.S. fluoridation project. Another example is the family-
planning program in China and India. Both counties adopted a two-child policy in the national
interest, arguing that having too many children would be disastrous. However, the policy itself has
proven to be disastrous. Women suffered from increased health risks by having abortions, children
were given up for adoption or were hidden away (Manch, 2004). The alcohol prohibition in the
U.S., as explained in the introduction, can also be considered a failed attempt to correct market
failure caused by demerit goods. These examples show that government policies not always reflect
how the costs and benefits of (de)merit goods are valued or devalued by consumers.
2.2 Attitude-behavior gap
Rational Choice Theory assumes that consumers enter the marketplace with defined preferences
(Robert, 1991). The consumer then tries to allocate its income in accordance with its preferences
through two steps. First, it determines what combination of goods the consumer can buy according
to its budget constraint and secondly it determines which bundle is preferred above all others. By
taking this information into account the consumer tries to determine the best possible outcome,
this process is also known as utility maximization (Tversky & Kahneman, 1981). Whenever
12
confronted by uncertainty, according to Rational Choice Theory, a consumer should act according
to its pre-determined best possible allocation. However, inconsistencies have been found in
consumers’ attitudes (Strotz, 1995). Attitude regarding demerit goods, being no exception, is also
prone to inconsistencies. Assumed can be that the attitude is there (e.g. “I want to stop smoking”)
because they decided that consuming demerit goods (e.g. smoking) does not lead to utility
maximization (e.g. costs are higher than benefits), and yet their actual behaviour shows different
by keep consuming demerit goods.
Research has shown that a positive attitude does not always result in corresponding
behavior (Echegaray & Hansstein, 2017; Baumann et al., 2015 & Carrington et al., 2014). This
phenomenon is also known as the attitude-behavior gap, intention-behavior gap or belief-behavior
gap and is found in many instances (Sheeran & Webb, 2016). Carrigan & Attalla (2001) concluded
in their research that even though consumers express their preference to support ethical companies
and refrain from purchasing from unethical companies, their purchasing behavior often remains
unchanged. This attitude-behavior gap is also found in Massive Open Online Course (MOOC)
participation (Henderikx et al., 2017). Participants enrolled en masse for MOOC’s in hope of
educating themselves. Initially, they started with great enthusiasm which quickly turned into
frustration, leading to an average dropout rate between 90% and 98%. Indicating that a positive
attitude alone is by far no guarantee for actual behavior. For example, a positive attitude towards
eating organic food rarely results in eating organic food (Vermeir & Verbeke, 2006).
The Theory of Planned Behavior (TPB) stipulates that behavior is a result of intention (Ajzen,
1991; Ajzen, 2015). According to TPB intention is determined by three factors: attitude, subjective
norm and perceived behavioral control. Attitude refers to what an individual thinks about the
behavior, which is based on one’s both positive and negative behavioral beliefs (e.g. “smoking is
cool” or “I think that smoking is unhealthy”). Subjective norms refer to the social pressure one
feels and is influenced by peers and family (e.g. “all my friends smoke, so I should smoke as well”
or “nobody smokes, I should stop as well”). And at last, perceived behavioral control reflects one’s
belief of how difficult it is to perform certain tasks (e.g. “it is easy for me to quit smoking” or “I
cannot do this”). The more an individual thinks he is in control and the more power he perceives,
the higher its perceived behavioral control is (Godin & Kok, 1966). The higher the degree of the
three components together, the more likely it is that the behavior will take place (Agentha, 2014).
13
The application of TPB in changing behavior has proven to be successful numerous times
(Hardeman et al., 2002). McEachan et al. (2011) conducted a meta-analysis of the application of
TPB in health-related behaviors, showing that over two hundred papers effectively predicted
changing health-related behaviors using TPB. TPB has also shown to be applicable to physical
activity (Hager et al., 2002) and screening programs (Cooke & French, 2008). Cooke et al. (2014)
showed that TPB can be used for alcohol-consumption as well and it suggests its applicable to
smoking. Stating that regarding substance-usage attitude has the strongest effect (r=0.62), followed
by subjective norms (r=0.47) and perceived behavioral control (r=0.31).
In order to bridge the attitude-behavior gap, adjustments should be made in addressing one’s
intention (Sheeran, 2002). Keeping in mind all potential three factors stipulated as in TPB, not
having the right intention will not result in the preferred behavior, which happens frequently.
Physical activity has a known attitude-behavior gap of 47% people who fail to act in accordance
with their intention (Rhodes & Bruijn, 2013), cancer screening 57% (Gallois et al., 1992) and
condom usage as well 57% (Orbell & Sheeran, 1998). Implying that the attitude-behavior gap is a
gap not to be underestimated.
2.3 Nudging
As stated in paragraph 2.1, demerit goods tend to be overconsumed when left to the private market.
This combined with the fact that demerit goods are considered harmful to the individual and
society one could argue this legitimates government intervention. Government intervention has
the potential to reduce both any harmful effects on the individual and negative external effects to
a minimum.
Even in the case that individuals have a positive attitude towards the deconsumption of
demerit goods, the attitude-behavior gap has shown us that a positive attitude rarely results in
actual behavior. Thus, reinforcing the need for external help, such as government intervention.
Prohibition has shown to be effective in the short term, but ineffective in the long run (Dills,
Jacobson & Miron, 2005). This raises the question of what kind of government intervention is
needed to decrease the consumption of demerit goods.
One intervention design that has become increasingly popular in the last couple of years is
nudging. Nudging can be defined as altering individuals’ behavior predictably without forbidding
14
any options or any significant monetary incentives (Thaler & Sunstein, 2018). This includes not
changing prices, prohibition through laws and making alternatives significantly less attractive
(Hausman & Welch, 2010). Nudging is popular among policy makes for two reasons. Nudges have
the potential to have a high cost-benefit ratio. And secondly, nudges have been proven to be an
effective intervention to alter behavior (Mardian & Shea, 2001; Thaler & Benartzi, 2004).
However, nudging has been criticized for not being ethical since it might violate one’s
freedom (Kosters & Van der Heijden, 2015). Since they steer individuals into making certain
decisions. Yet in the case of nudges, nothing is being prohibited and no one is being coerced,
giving the individual the same options without the behavioral intervention. The major difference
is that the options are merely presented differently. One example is food positioning (Bucher et
al., 2016). An intervention was done by placing healthy food at cash registers and putting unhealthy
food at inconvenient places (Kroese et al., 2016). This led to an increase in selling healthy foods
without banning or changing the prices of unhealthy food.
Yet nudging received a lot of criticism. One of the fears is that consumers would rely too
much on the government and their policy regarding nudges (Rizzo & Whitman, 2008). This would
lead to the loss of individuals’ capabilities to make decisions on their own and learn from their
mistakes. This view is shared by Kleinpaste (2013), who states that nudges will make individuals
tamable beings without their own will in the long run. Making them even more suspectable for
incentives that might not be in their best interest. A more philosophical approach is that a
government should not be paternalistic (Furedi, 2011). Individuals should be able to make their
own choice without the government acting as a parent. These critics forget that a nudge is nothing
more than a gentle push in the right direction (Thaler & Sunstein, 2008). Nudges have an initial
modest impact on individuals (John et al., 2009). The idea behind a nudge is that a small change
in behavior can have a huge impact in the long run (e.g. less alcohol leads to fewer health-issues
and less crime). A more compelling argument is that a nudge can be used to help consumers to act
in accordance with their real preferences (Bovens, 2009). For example, consumers who want to
eat healthily often experience difficulties due to external stimuli. A nudge can be a great tool to
help these individuals to act according to their real preferences. Besides, nudges should not keep
consumers captive (Mitchell, 2005). Nudges, being a soft push, should be easy to get out of. If
15
concerns keep arising one could make it more transparent to consumers that they are being nudged,
making the usage of nudging more responsible (Hansen & Jesperen, 2013).
Previous literature has shown nudging can be a very effective tool. Changing the default
option increased the number of organ donors among European countries (Johnson and Goldstein,
2003). In countries where potential donors have to sign up as a donor, a so-called opt-in system,
the amount of donors varies from 4,25% in Denmark up to 27,5% in the Netherlands. On the
contrary, in countries with an opt-out system, the number of donors could be as high as 85,9% in
Sweden up to 99,98% in Austria. Critics could argue that individuals are being made donors
against their will. But a survey among Americans indicated that a higher percentage of Americans
favor organ donation compared to the actual amount of donors (Johnson and Goldstein, 2003).
This could be an indication of an attitude-behavior gap which can be solved by a nudge. Other
research has shown that framing is an effective way of nudging as well. A study on message
responsiveness in the payment of fines has shown that different wording affects influence the
response rate (Gallagher, 2012). For example, by including personalized information such as one’s
name the response rate increased from 25% to 33%. Simplifying the message by leaving out
unnecessary details and highlighting potential consequences increased the response rate even
more, from 4% to 35%.
One of the reasons that nudging is very effective is because, as stated in the previous
paragraph, consumers don’t always act in accordance with Rational Choice Theory (Srotz, 1995).
Rational consumers tend to operate on a set of pre-defined logical rules (Robert, 1991). However,
consumers often make choices under stressing circumstances. Causing decisions to be made based
on a habit of thoughts or rule of thumbs instead (John, Smith & Stoker, 2009). This results in
consumers filtering information, excessively focusing on some parts and ignoring other parts, and
causes them to shift away from their real, rational, preferences (Bovens, 2009). In situations where
consumers lack time, information and experience they often rely on automatic thinking instead of
reflective thinking (Sellinger and Whyte, 2011). Where reflective thinking is considered
controlled, deductive and rational while automatic thinking is considered gut feeling. This effect
is even bigger when there is a so-called choice overload (Iyengar and Lepper, 2000). The more
information is available to consumers, the less information is being used (Hauser and Wernerfelt,
1990). Suggesting that consumers have difficulties processing a lot of information and making
16
complex decisions. A similar system to reflective and automatic thinking is found in System 1 and
System 2 thinking (Kahneman, 2011). System 1 thinking is fast, instinctive and emotional. While
System 2 is slower, deliberative and logical. Kahneman (2011) stated System 1 is dominant,
leading to suboptimal choices. Therefore, it is crucial to put a nudge at the right moment and place
to correct these cognitive limitations (Eve & Masters, 2006; Thaler & Suntein, 2008) and help
consumers to act according to their real preferences. Because when decision-making becomes too
complex, consumers are more likely to simplify their decision-making (Payne, 1982). Which
invokes cognitive limitations such as, but not limited to loss aversion, ignorance, overconfidence
and anchoring (Thaler & Sunstein, 2008).
There are different types of nudges, addressing different types of cognitive limitations.
Since nudges span a wide range and the variety of nudges keeps growing, an attempt to summarize
all potential nudges would be too comprehensive. Sunstein (2014) addressed the ten most well-
known nudges, one of them being the default option. By automatically enrolling individuals into
retirement plans, their savings increase significantly. Another nudge is simplification, many
programs are unnecessary complex and deter individuals from partaking. Simplification is also a
potential nudge to address choice-overload complexity. Other nudges are the usage of social norms
(e.g. “9 of 10 people wash their hands”), increase in ease and convenience (e.g. making healthy
food more visible) and disclosure of information (e.g. pointing out negative externalities). A key
element in most nudges is the priming and framing of information (Wilson et al., 2016). But only
priming and framing of information is not enough, implementing the right nudge at the right time
can be very challenging.
2.4 Self-benefit and other-benefit
A traditional approach to decrease the consumption of demerit goods is often communicating the
negative effects for the individual itself regarding the consumption of demerit goods. An example
of this is that cigarette packs in The Netherlands contain health warnings such as “smoking is
deadly” and “smoking causes fatal lung cancer”. This is classified as a self-benefit, self-interest,
pro-self or egocentric appeal. According to Peterson (2018), people take more responsibility in
taking care of someone else than when caring for themselves. This effect is often caused by a lack
of discipline of the individual (Thompson & Hirschman, 1995), which appears to be less present
when being responsible for others.
17
Building upon this abstract concept, literature regarding donations has found that other-
appeals can be more effective than self-appeal messages. A potential explanation for this effect
might be the empathy-helping hypothesis (Batson, 2009), where people experience the emotions
of people who are in need and thus are more inclined to help. Research exploring the conditions
in which people are the most likely to donate to charity has shown strong favour for nudges
emphasising the benefit of others (Fisher et al., 2008). This can be defined as other-benefit opposed
to self-benefit. Self-benefit appeal in a donation setting is defined as an appeal that mainly benefits
the one itself while other-benefit apeal emphasize the benefit for other individuals or organisations.
For example, when donating blood a self-beneficial appeal would remind one of the fact he or she
is doing a good deed and he or she should be proud of itself. On the contrary, an other-benefit
appeal should remind one of the fact that he or she is contributing to others by potentially saving
lives.
These appeals are not limited to emotions, one can for instance also point out (self-benefit)
monetary gains such as tax deductibles for donations. Brunel and Nelson (2000) found that women
were more likely to respond to charity ads that have a help-other appeal instead of a help-self
appeal. However, these findings were contradicted by Holmes et al. (2002). Their research found
that individuals were more likely to donate when they were given a product in return for their
donation, even when the product was of no use to the donator. An explanation frequently used for
the prevalence of self-benefit is the social exchange theory (Blau, 1964). The social exchange
theory stipulates that consumers decide whether to invest in relationships or not based on potential
gains and costs. Where it often is assumed that self-benefit appeals are more effective in
emphasizing potential gains and/or costs (Rothschild, 1984). However, findings regarding self-
benefit and other-benefit constructs are not limited to the studies mentioned above. Extensive
research is done in this area with various results as can be seen in table 1.
18
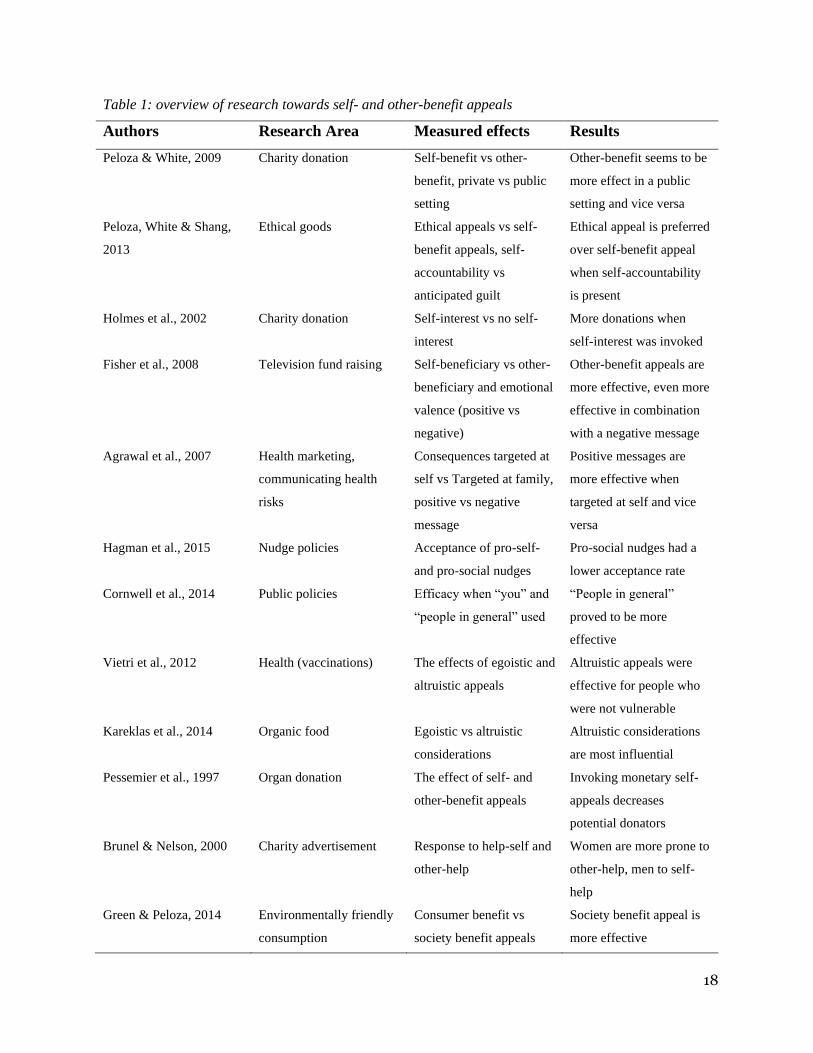
Table 1: overview of research towards self- and other-benefit appeals
Authors Research Area Measured effects Results
Peloza & White, 2009 Charity donation Self-benefit vs other-
benefit, private vs public
setting
Other-benefit seems to be
more effect in a public
setting and vice versa
Peloza, White & Shang,
2013
Ethical goods Ethical appeals vs self-
benefit appeals, self-
accountability vs
anticipated guilt
Ethical appeal is preferred
over self-benefit appeal
when self-accountability
is present
Holmes et al., 2002 Charity donation Self-interest vs no self-
interest
More donations when
self-interest was invoked
Fisher et al., 2008 Television fund raising Self-beneficiary vs other-
beneficiary and emotional
valence (positive vs
negative)
Other-benefit appeals are
more effective, even more
effective in combination
with a negative message
Agrawal et al., 2007 Health marketing,
communicating health
risks
Consequences targeted at
self vs Targeted at family,
positive vs negative
message
Positive messages are
more effective when
targeted at self and vice
versa
Hagman et al., 2015 Nudge policies Acceptance of pro-self-
and pro-social nudges
Pro-social nudges had a
lower acceptance rate
Cornwell et al., 2014 Public policies Efficacy when “you” and
“people in general” used
“People in general”
proved to be more
effective
Vietri et al., 2012 Health (vaccinations) The effects of egoistic and
altruistic appeals
Altruistic appeals were
effective for people who
were not vulnerable
Kareklas et al., 2014 Organic food Egoistic vs altruistic
considerations
Altruistic considerations
are most influential
Pessemier et al., 1997 Organ donation The effect of self- and
other-benefit appeals
Invoking monetary self-
appeals decreases
potential donators
Brunel & Nelson, 2000 Charity advertisement Response to help-self and
other-help
Women are more prone to
other-help, men to self-
help
Green & Peloza, 2014 Environmentally friendly
consumption
Consumer benefit vs
society benefit appeals
Society benefit appeal is
more effective
19
Peloza & White (2009) understated that people were more likely to donate to a charity
when given an altruistic appeal instead of an egocentric one. However, people were more likely to
act according to the marketed message when they were in a public setting. Whenever a private
setting arose, egocentric motivations became dominant. This effect was also found in promoting
ethical products (Peloza et al., 2013). An explanation for this is that in public settings self-
accountability was raised and activated consumers’ desire to live up to their self-standards.
Research into organ donation found that people were more likely to donate when an other-benefit
appeal was used (Pessemier et al., 1997). Whenever self-interest appeals such as financial
compensation was added, willingness to donate dropped, which indicates that self-interest appeals
can be contra-productive.
Research regarding environmentalism found similar results. Early research shows that pro-
environment consumers stated that they preferred environment-friendly products, but their
behaviour showed otherwise by buying relatively cheap products that were harmful to the
environment. Indicating a self-benefit approach with financial incentives is effective in
environmental approaches and thus that price was the most important factor (Mandese, 1991;
Hume, 1991). However, research into organic food showed that altruistic considerations (e.g.
environmental) were proven to be more effective than egoistic (e.g. personal health) considerations
into influencing behaviour (Kareklas et al., 2006). These findings are underlined by Van Vught
(2009), his research showed that calling upon motives beyond self-interest (e.g. other-benefit) are
more likely to invoke pro-environmental behaviour. Green & Peloza (2014) found similar results,
calling upon other-benefit appeals caused people to have a higher intention towards pro-
environmental purchases and made them also more likely to reuse their mug.
On the other hand, some research favour self-benefit appeals. In both the United States and
Sweden, pro-self nudges were viewed more favourable than pro-social nudges (Hagman et al.,
2015). Pro-social nudges were experienced as more intrusive on freedom of choice as opposed to
pro-self nudges and had a significantly lower acceptance rate. A possible explanation for this might
be that rational beings value themselves more than others (Hagman et al., 2015). Indicating a self-
benefit approach. However, in a study about public policy initiatives it is found that people were
more likely to react to nudging when the frame was the altruistic “people in general” instead of
the individualistic “you” (Cornwell & Krantz, 2014). These findings were supported in research
20
about vaccinations (Vietri et al., 2012), stating that individuals were more likely to vaccinate when
presented about societal benefits of vaccinating. Suggesting that an other-benefit approach should
be preferred above a self-benefit approach.
Considering that it could be argued that both self- and other-benefit could be more effective
than the other, in this research a choice has been made to prefer other-benefit above self -benefit.
The reason for doing so is that the majority of discussed studies indicate that an other-benefit
appeal is more effective (see table 1), among studies that are the closest to our area of research.
Thus the following hypothesis is formulated:
Hypothesis 1: “A nudge emphasized on other-appeal is more effective than a nudge
emphasized on self-appeal on lowering smoking intention.”
2.5 Negative and positive framing
Message framing is an important tool in influencing consumers’ attitudes, intentions and behavior
(Block & Keller, 1995). Message framing can be defined as presenting equivalent information in
different ways (Levin & Gaeth, 1998). By framing messages one can influence how information
is perceived by the reader. A water glass being labeled half-empty or half-full objectively transfers
the same information, but can invoke very different emotions (Paese, 1995). Based on this
distinction, messages can be either framed positive or negative. Positively framed messages
emphasize on potential gains or benefits from purchasing a certain product or advocating certain
behavior. While negative messages emphasize potential losses or negative consequences
(Maheswaran & Meyers-Levy, 1990). Both positively- and negatively framed messages have the
potential to impact the effect of appeals on consumers (Chang & Lee, 2009).
Research has shown that negative frames can be more effective than positive frames (Blocker
& Keller, 1995; Grewal et al., 1994; Cox & Cox, 2001). Shiv et al. (1997) found that negatively
framed messages tend to be even more effective when consumers are limited in their involvement.
Negatively framed messages are popular and have been proven to be effective in the political field
(Bizer et al., 2011). Negatively framed messages towards political opponents invoked more
attitude, certainty and consistency among citizens. In another research, a credit card company used
message framing to send a message to credit card owners who hadn’t used their credit card for a
couple of months (Ganazch & Karashi, 1995). Two different messages were sent, a positively
21
framed on highlighting the benefits of using a credit card and a negatively framed message,
highlighting the losses of not using the credit card. The latter proved to be more effective. An
explanation for this effect might be the prospect theory (Tversky & Kahneman, 1981). Prospect
theory stipulates that consumers are motivated by both potential gains (positive framing) and losses
(negative framing) but tend to weigh losses heavier. Resulting in consumers being more likely to
pursue action when a message was negatively framed to avoid potential losses (Kanouse, 1984).
This effect tends to be stronger in the case when consequences are delayed. Consumers tend to
discount future gains more heavily than future losses (Madden, 2000; Simpson & Vuchnich, 2000).
By discounting potential future gains more heavily, consumers give potential future losses even
more weight and therefore are more inclined to act in order to avoid these losses.
Whenever framing is used towards motivating on acting in accordance with healthy behavior
results are not consistent (Rothman & Salovey, 1997). For example, a study of Levin & Gaeth
(1988) focused on nudging consumers into eating healthier meat. In this study they presented a
piece of meat in a both a positive (“75% lean”) and a negative (“25% fat”) way. Consumers were
more susceptible towards the positive message. Positively framed messages were also more
effective in the area of health-care product advertising. Consumers are more likely to purchase
preventive health care products when the message was positively framed, this effect was even
stronger in the case of unfamiliar products (Chang, 2007). Research not only found evidence in
favor of positively framing in the area of health-related topics, but it also found evidence against
using negatively framed messages. Negatively framed heavy-handed judgmental approaches have
shown the potential to backfire (Wansink, 2006). These negatively framed messages can cause a
negative reaction that leads to consumers ignoring these messages. These findings are consistent
with the notion that negative messages invoke emotions such as shame, demotivate consumers and
render the initial message ineffective (Vartanian & Smyth, 2013; Abrams, 2012). Stipulating that
public health campaigns should focus on facilitating behavioral changes and not stigmatizing
individuals, in other words emphasizing the positive side of a message.
Some findings suggest that negatively framed messages are more effective in the area of health-
related topics is available. For example, when confronted with information that stresses the
negative consequences and potential losses of not performing breast examinations, women were
more likely to perform breast examinations than when confronted with the potential benefits of
22
breast examinations (Meyerowitz & Chaiken, 1987). Potential explanations for these
inconsistencies in message framing might be the different standards of risky choice framing
(Tversky and Kahneman, 1981), discrepancies between attribute and goal framing (Block &
Keller, 1995) or simply some underlying attribute we have not tapped into yet (Levin & Gaeth,
1998).
Due to these mixed results, it is interesting to see how negatively and positively framed
messages affect the deconsumption of demerit goods. Though there is evidence that negative
framed messages are more effective in the area of health nudges, the majority is in favor of
positively framed messages. Therefore, I assume that positively framed messages will show better
results. Which will be our second hypothesis:
Hypothesis 2: “A positively framed nudge is more effective than a negatively framed
nudge on lowering smoking intention.”
It would be interesting to see whether combining nudges will yield different results. Given
the strong theoretical evidence of both positive framed messages and other-benefit appeals,
combining these nudges might create a more effective nudge. Which leads to our third hypothesis:
Hypothesis 3: “A positively framed other-benefit nudge is more effective than a negatively
framed other-benefit on lowering smoking intention.”
2.6 Habit formation
So far, we have read in the previous paragraphs that messages could potentially influence one’s
behavior by shifting the appeal from self-appeal to other-appeal and framing the message
positively or negatively (Levin & Geath, 1998; Peloza & White, 2009). However, it is proven that
age and habit have a significant role in processing information (Carstensen & Mikels, 2005).
Carstensen & Mikels (2005) stated that processing capacity deteriorates as age increases, while
judgement, knowledge and emotion are less likely to deteriorate. This results in behavior that
increasingly relies on environmental cues that invoke habit. In addition, emotion remaining
constant compared to processing capacity leads to the fact that older consumers are more likely to
react to positively or negatively framed messages compared to younger consumers. Research from
Shamaskin et al. (2010) support this hypothesis by comparing 25 older consumers to 24 younger
consumers. Each group was presented a negatively and a positively framed pamphlet containing a
23
health-related message. Older consumers not only rated the positively framed messages higher in
general, but they also remembered more information compared to the younger consumers when
messages were framed postively. Meta-analysis suggested that this relationship might be inversed
for younger consumers (Reed et al., 2014), indicating that negatively framed messages are more
effective. However, this was not proven in a health-related setting by Shamaskin et al. (2010).
A meta-analysis regarding the Theory of Planned Behavior (TPB) also found that age plays
a significant role in the effect of nudges (Cooke et al., 2014). As stated previously, TPB stipulates
that intention determines actual behavior and that intention is determined by three factors: attitude,
subjective norm and perceived behavioral control. According to meta-analysis attitude has a
stronger relationship with intention for older consumers than for younger consumers (Cooke et al.,
2014), indicating that nudge tapping into one’s attitude is moderated by age and habit. Based on
the findings it is tempting to assume that the older someone is, the stronger habits are formed, and
the more likely that he or she is affected by a positively other-benefit framed message.
Older consumers tend to be creatures of habit lead by previous experiences instead of
constantly evaluating their choices (Sutton, 1998). Habit is defined as repetitive behaviour by
repeating past behaviour based on previous experiences (Ajzen et al., 2009). Indicating that habits
cause decision making to be a fast and instinctive process instead of being an elaborate decision
process. According to Wood et al. (2002) up to 45% of our daily decisions are made through habit.
Consumers prefer eating similar types of food throughout their days (Khare & Inman, 2006) and
prefer buying similar products or specific brands (Seethamaran, 2004). As previously mentioned
in paragraph 2.3, this way of thinking classifies as System 1 thinking where consumers act
automatically (Kahneman, 2011). Once a habit is formed, a specific type of behaviour is
automatically triggered by environmental cues (Wood & Neal, 2009). Saving consumers’ time and
energy. This assumption is supported by Aarts et al. (1998), who found that previous choices had
the biggest effect on the current favourite way of travel. Even more, they found that the more often
individuals choose a certain decision, the stronger the habit becomes and the less likely individuals
are willing to consider an alternative. These findings are underlined by Ajzen et al. (2009), stating
that old habits are difficult to change because they are imprinted in one’s memory. In order to be
able to nudge individuals into making decisions that do not align with their previous decisions, it
is important that individuals must be willing to seek variety (Steenkamp & Baumgartner, 1995).
24
Therefore, habits could potentially impose a barrier to improving one’s behaviour through nudges.
For example, getting consumers to purchase more environmentally friendly is often challenging
due to poor habits which are hard to overcome (Kolmuss and Agyemann, 2002). Habits are also
known to be a key factor in maintaining unhealthy lifestyle choices (Webb & Sheeran, 2006).
Another potential danger of habits is that they become stronger with age (Cole et al., 2008).
Due habits becoming stronger, habit could have a bigger effect on actual behaviour than intention
in the TPB model (Web & Sheeran, 2006), rendering nudges obsolete. Research into fruit
consumption has shown that intention does not have a significant effect on actual behaviour
(p=0,596) when habit is high (Bruijn et al., 2007). Similar effects were found by Danner et al.
(2008). Their research shows that intention can predict future behaviour when habit is low,
however when habit became high the effect of intention diminished. From the perspective of
nudges, the main danger of habit is that consumers act automatically and are less likely to be
triggered by subtle changes in the environment (Verplanken & Wood, 2006), potentially rendering
nudges useless. In order to overcome this potential barrier one needs to address System 2 thinking
which focuses on deliberative and logical thinking (Kahneman, 2011). This requires a lot of active
cognitive effort from individuals, which is hard to realise (Young et al., 2010). Therefore, a
successful nudge should help to allocate the limited resources (e.g. time and effort) from
individuals to the right trigger (e.g. other-benefit).
Research shows arguments both in favour and against the moderating effect of habit on the
effect of nudging on actual behaviour. Despite many papers indicating that higher age, and thus a
stronger habit, may diminish the effect of a nudge, there is sufficient evidence that a well-placed
nudge might overcome the barriers of habits. Therefore, the following hypothesises are
formulated:
Hypothesis 4a: “The effect of positively or negatively framed nudges on smoking
intention is moderated by habit formation.”
Hypothesis 4b: “The effect of self- and other-benefit nudges on smoking intention is
moderated by habit formation.”
25
2.7 Social Norms
The previous paragraph mentioned a potential internal factor (habit formation) that could act as a
moderating variable on the effect of nudges. However, there is also an important external variable
that could act as a mediator on the effect of the other-benefit vs self-benefit: social norms. In a
study about an environmental conservation program in towel usage, hotels guests were asked to
conserve their towels (Goldstein et al., 2008). Nudges that were primed with social norms (e.g.
“the majority of guests reuse their towels”) proved to more effective than traditional nudges (e.g.
“you can help save the environment by reusing your towels”). Consumers like to show that their
behaviour is socially preferred and derive status from making such choices (Griskevicius et al.,
2009). This explanation is strengthened by Argo et al. (2006), their research shows individuals are
willing to go as far as lying to present a preferable positive public image. Behaviour which is in
accordance with social norms not per se implies having a positive public image. It can also imply
that certain behaviour is unacceptable, such as males showing emotions in public (Fisher & Dubé,
2005). Consumers want to steer their behaviour to conform to expectations created by society
(Leary & Kowalski, 1990).
As stated above, whenever consumers are confronted by social norms they act differently.
One way of invoking social norms is by creating a distinction between a private and public setting
(White & Peloza, 2009; Green & Peloza, 2014). According to White & Peloza (2009) social norms
will be invoked whenever the consumers are reminded of the public. In an experiment where
consumers got to decide how much they were willing to pay for a coffee by putting money in a
box results showed a significant difference (Batseon et al., 2006). When consumers had the
impression they were in a private setting they donated three times as less for their drinks as
compared to when they had the impression they were in a public setting. Bateson et al. (2006)
invoked social norms by simply putting images of eyes on the wall, giving a cue that they were
watched and indicating the importance of reputational concern and cooperative behavior. Similar
results were achieved by Haley et al. (2007). By showing merely eye dots participants donated
much more money, concluding that prosocial behavior is a major part of reputation management.
To push it even further, it doesn’t even have to be human. A picture of a robot is enough to invoke
social norms and to get more donations (Burnham & Hare, 2007). The usage of social norms as a
nudge is not new and has been proven to be effective numerous times (Sunstein, 2014). Given the
26
H4b
H4a
H5
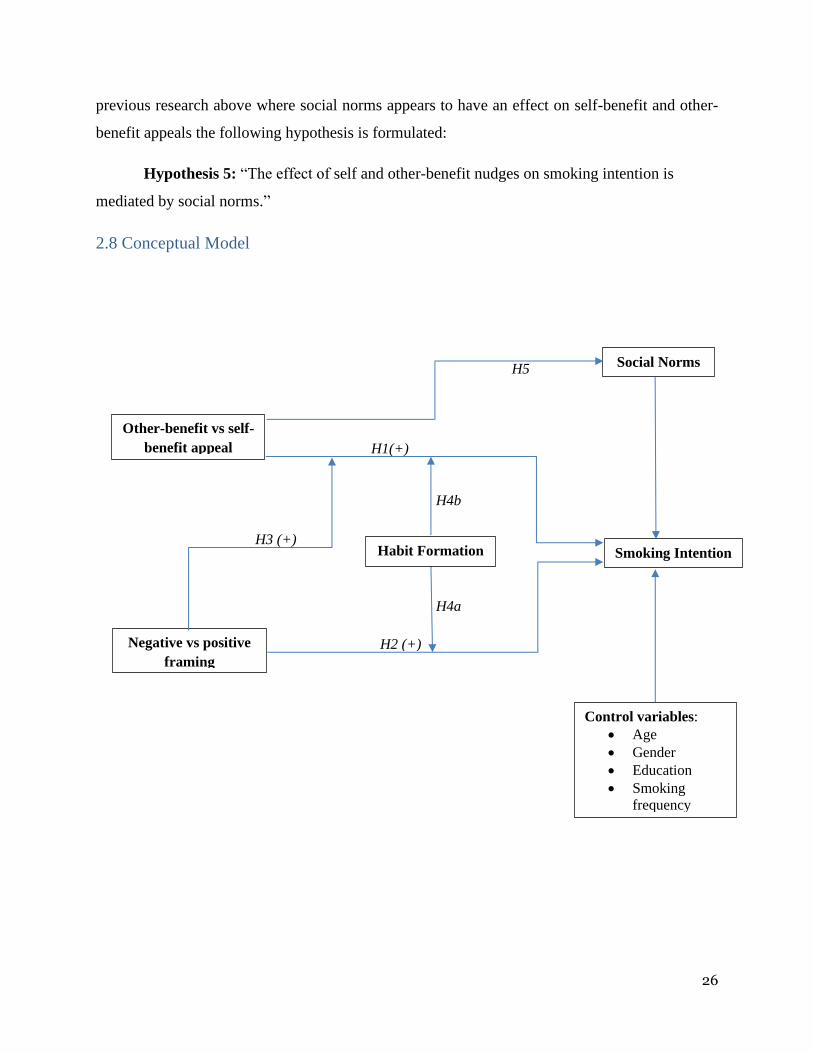
previous research above where social norms appears to have an effect on self-benefit and other-
benefit appeals the following hypothesis is formulated:
Hypothesis 5: “The effect of self and other-benefit nudges on smoking intention is
mediated by social norms.”
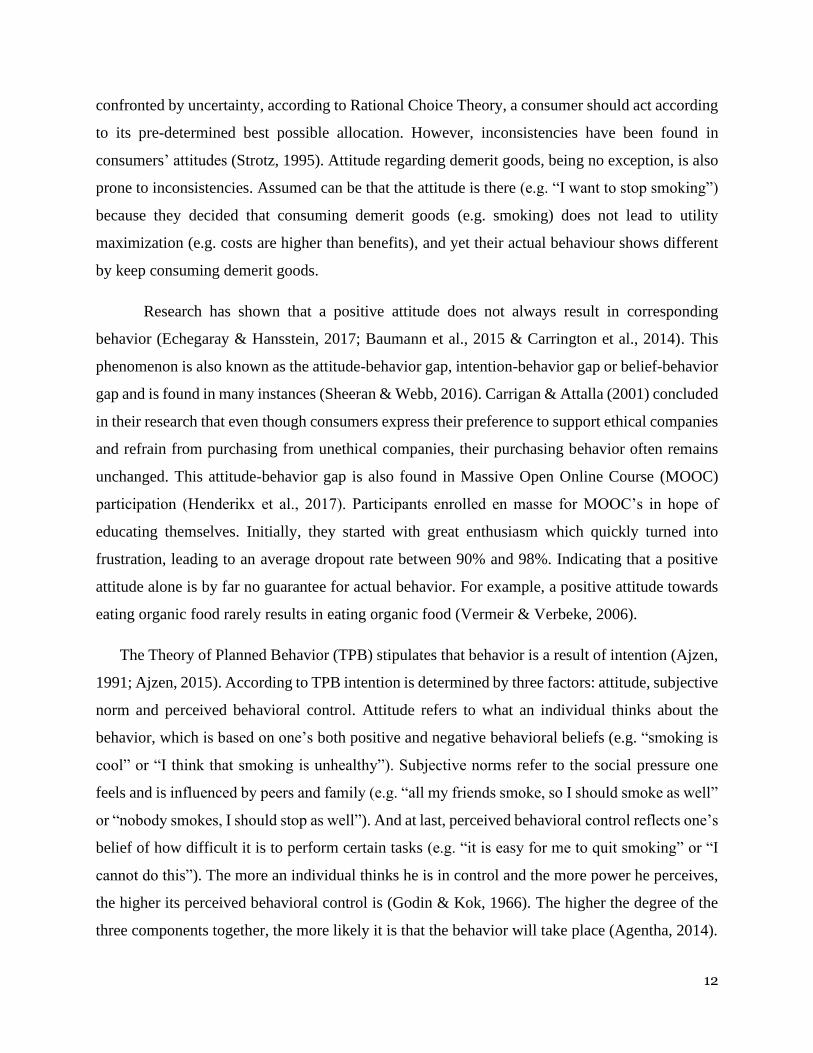
2.8 Conceptual Model
Other-benefit vs self-
benefit appeal
Negative vs positive
framing
Smoking Intention
H1(+)
H2 (+)
H3 (+) Habit Formation
Control variables:
• Age
• Gender
• Education
• Smoking
frequency
Social Norms
27
3. Methodology
This chapter explains the methodology. The first two paragraphs cover the research set-up by
explaining the research design, survey flow and research setting. The third paragraph explains in
detail how constructs were designed whereas the fourth paragraph briefly discusses the appropriate
analytical produces. The fifth and last paragraph summarize the findings from the pre-test.
3.1 Research Design
In order to test the conceptual model quantitative research is used. Based on the literature an
experimental design is used to test the hypotheses. The primary advantage of using an experimental
design is that it allows for a high level of customization (Cooke et al., 2002). By creating an
experimental design, constructs can be created that measure the dependent and independent
variables accurately. In this study smoking intention is the dependent variable, whereas appeal and
framing are the independent variables. Appeal has two different levels: self-benefit appeal and
other-benefit appeal. Framing also has two different levels: negatively framed and positively
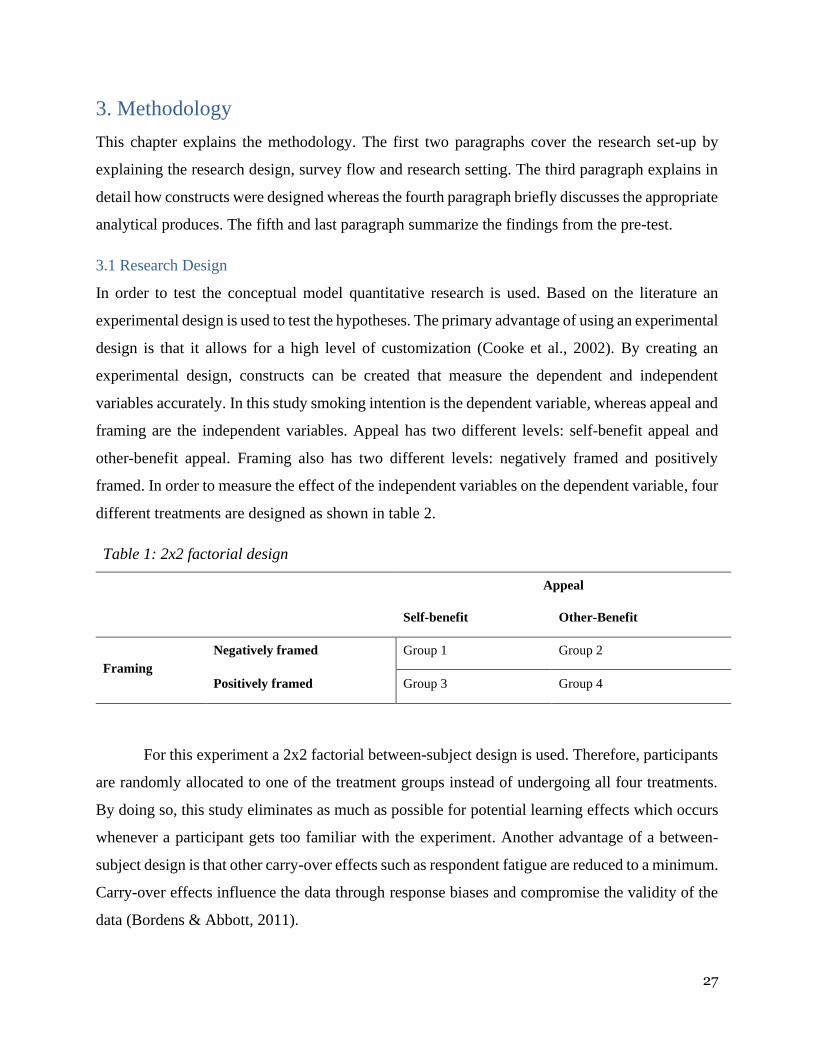
framed. In order to measure the effect of the independent variables on the dependent variable, four
different treatments are designed as shown in table 2.
Table 1: 2x2 factorial design
Appeal
Self-benefit Other-Benefit
Framing
Negatively framed Group 1 Group 2
Positively framed Group 3 Group 4
For this experiment a 2x2 factorial between-subject design is used. Therefore, participants
are randomly allocated to one of the treatment groups instead of undergoing all four treatments.
By doing so, this study eliminates as much as possible for potential learning effects which occurs
whenever a participant gets too familiar with the experiment. Another advantage of a between-
subject design is that other carry-over effects such as respondent fatigue are reduced to a minimum.
Carry-over effects influence the data through response biases and compromise the validity of the
data (Bordens & Abbott, 2011).
28
3.2 Research Setting
In this study an experiment in the form of a survey is designed. The tool used for designing the
experiment is Qualtrics Survey Software, an online survey tool. Additionally, Prolific is used to
conduct the experiment. Prolific is an online platform used to gather respondents for (academic)
surveys. Besides having a relatively fast response rate, Prolific allows for pre-filtering respondents
on various factors such as experience, quality and smoking habits. The Prolific pool is also more
diverse than the traditionally used student pool. This decreases potential biases and increases data
validity & reliability. Furthermore, Prolific data has shown to be of higher quality than similar
platforms such as Amazon Turk because of a higher naivety among participants (Peer et al., 2017).
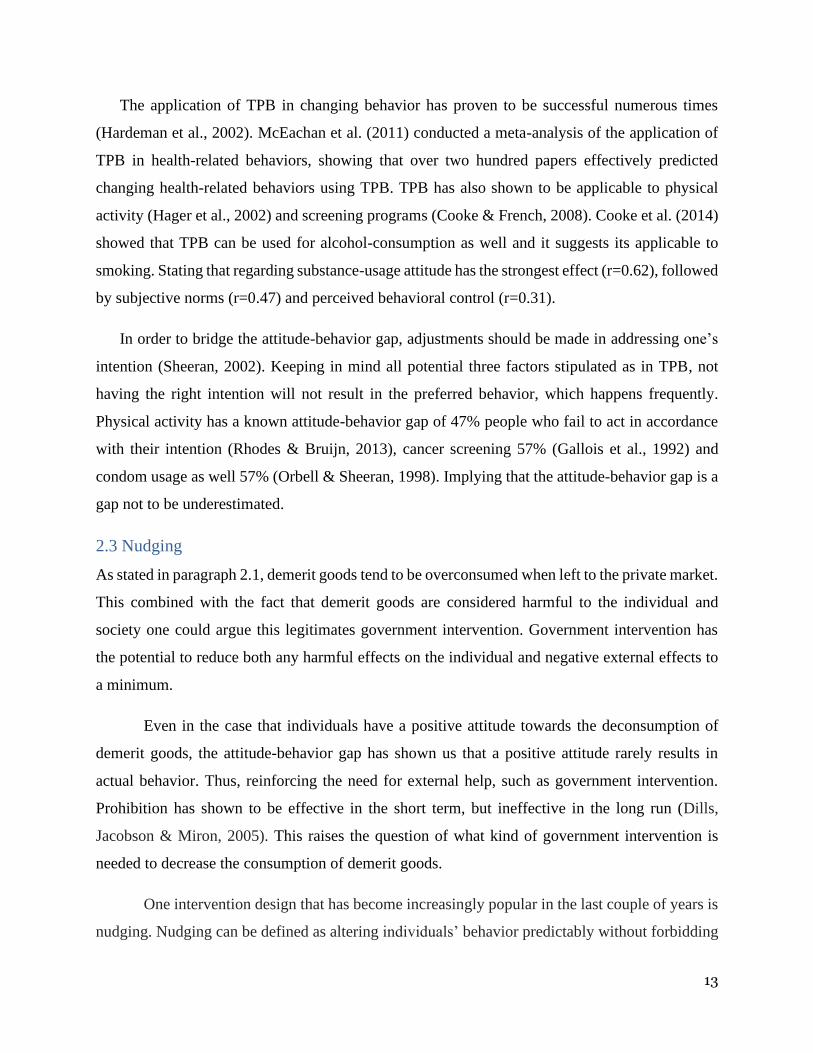
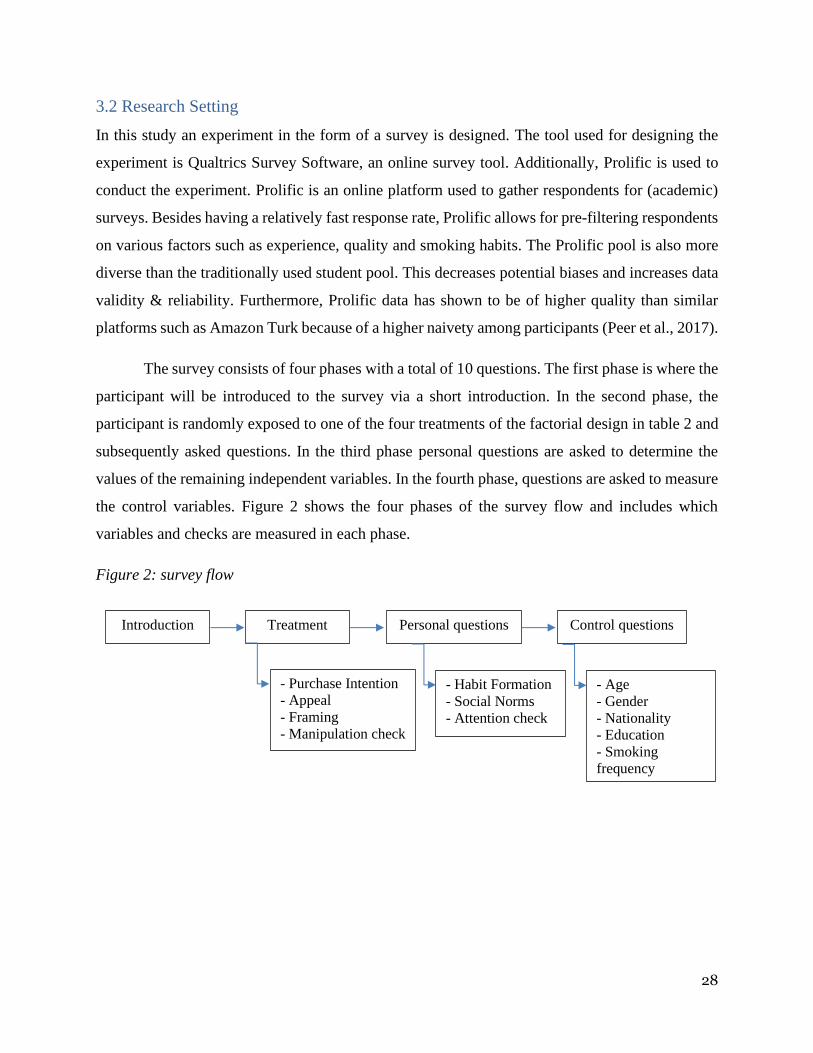
The survey consists of four phases with a total of 10 questions. The first phase is where the
participant will be introduced to the survey via a short introduction. In the second phase, the
participant is randomly exposed to one of the four treatments of the factorial design in table 2 and
subsequently asked questions. In the third phase personal questions are asked to determine the
values of the remaining independent variables. In the fourth phase, questions are asked to measure
the control variables. Figure 2 shows the four phases of the survey flow and includes which
variables and checks are measured in each phase.
Figure 2: survey flow
Introduction Treatment Personal questions
- Purchase Intention
- Appeal
- Framing
- Manipulation check
- Habit Formation
- Social Norms
- Attention check
- Age
- Gender
- Nationality
- Education
- Smoking
frequency
Control questions
29
3.3 Measurements of Variables
Variables in this study have been constructed from scientific papers, some have been introduced in the
theoretical framework whereas some papers are newly introduced. In this paragraph, the variables of the
research will be discussed.
3.3.1 Smoking Intention
In this study smoking intention is used as a dependent variable. A construct to reflect smoking
intention will be derived from other constructs since there are, to the best of my knowledge, no
specific papers that define and use smoking intention in a similar experiment. The most
substantiated choice would be purchase intention. Because individuals who purchase cigarette
packages are very likely to smoke the cigarettes it just bought and thus have an intention to smoke.
Although purchase intention is not the same as actual behaviour, it can be considered as a
parameter that is very close to actual behaviour (Peter & Olson, 2008). Due to these similarities,
in this study purchase intention will be used as a proxy for smoking intention. Purchase intention
is often designed as single-item construct (Bergkvist & Rossiter, 2007). In the paper of Churchill
(1979), single-item constructs are considered a poor measure. However, Bergkvist & Rossiter
(2007) have shown that single-item constructs do not always have a lower predictive validity than
multi-item constructs. Yet, it is often mentioned as a limitation in studies. Therefore, in this study
a multi-construct will be used for measuring purchase intention. In a research on the effect of price,
brand and store information on purchase intention by Dodds et al. (1991) a five-item construct is
used. This paper is cited more than 7000 times, indicating that there is a consensus these five
questions reflect purchase intention properly. In this study, four out of the five questions are used
because one of the questions poorly applies to smoking.
3.3.2 Self-benefit and other-benefit appeal
One of the two independent variables that is manipulated in this study is appeal (self-benefit vs
other-benefit). Participants are manipulated through a cigarette package which is shown in the
survey. A white, default cigarette package is used to reduce the influence of other factors such as
colour, size and brands as much as possible. Before the package is shown, the participant is asked
in the introduction to imagine itself in a store to buy its next pack of cigarettes (see appendix b).
As discussed in the theoretical framework self-benefit appeals should appeal upon the participant
itself, while other-benefit should appeal upon other individuals. There is sufficient literature about
30
priming messages with self-benefit and other-benefit appeals (see table 1). Furthermore, during
the literature research of this topic there were no studies found which specifically used these
appeals in context of smoking in a similar experiment. Therefore, these constructs cannot be
duplicated from other studies and must be derived from existing studies in other fields similar to
smoking intention. However, there are European guidelines regarding warnings on cigarette
packages that will be used as a guideline for designing the treatments using constructs from studies
in other fields.11 Combining constructs from Agrawal et al. (2007) and Fisher et al. (2008) whilst
using The Tobacco Products Directive as a guideline, the four messages in table 3 are generated
(see appendix b for picture designs).
3.3.3 Negative and positive framing
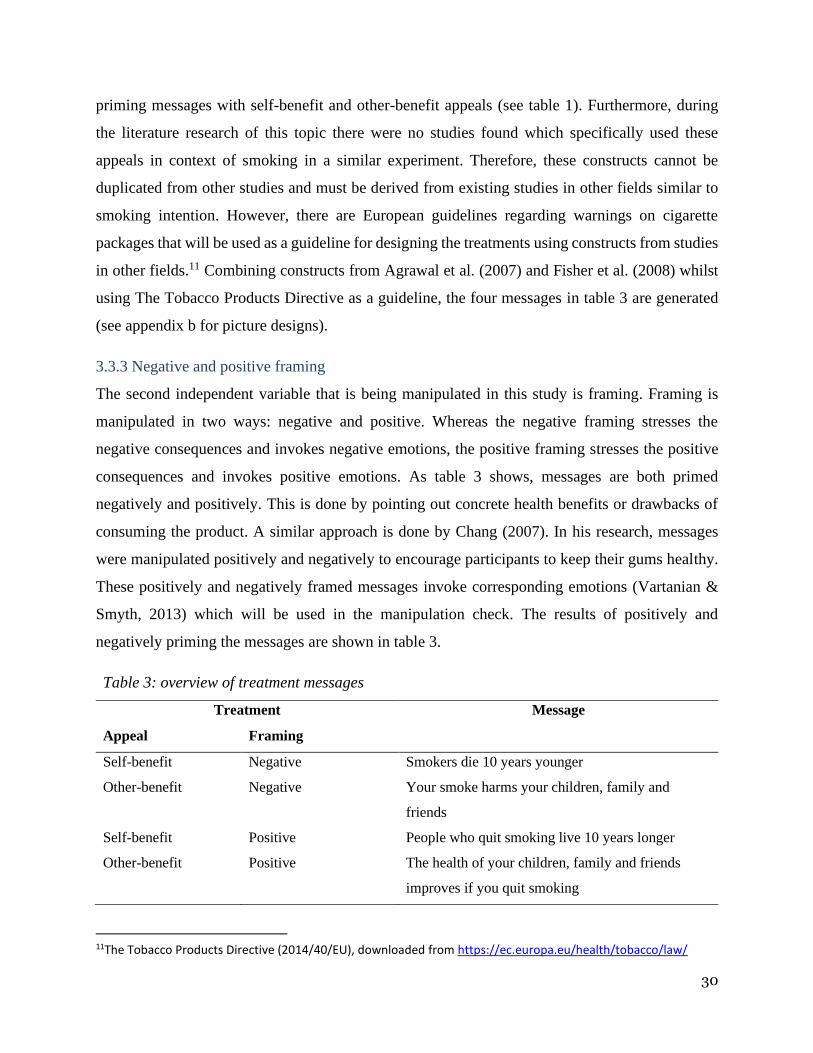
The second independent variable that is being manipulated in this study is framing. Framing is
manipulated in two ways: negative and positive. Whereas the negative framing stresses the
negative consequences and invokes negative emotions, the positive framing stresses the positive
consequences and invokes positive emotions. As table 3 shows, messages are both primed
negatively and positively. This is done by pointing out concrete health benefits or drawbacks of
consuming the product. A similar approach is done by Chang (2007). In his research, messages
were manipulated positively and negatively to encourage participants to keep their gums healthy.
These positively and negatively framed messages invoke corresponding emotions (Vartanian &
Smyth, 2013) which will be used in the manipulation check. The results of positively and
negatively priming the messages are shown in table 3.
Table 3: overview of treatment messages
Treatment Message
Appeal Framing
Self-benefit Negative Smokers die 10 years younger
Other-benefit Negative Your smoke harms your children, family and
friends
Self-benefit Positive People who quit smoking live 10 years longer
Other-benefit Positive The health of your children, family and friends
improves if you quit smoking
11The Tobacco Products Directive (2014/40/EU), downloaded from https://ec.europa.eu/health/tobacco/law/
31
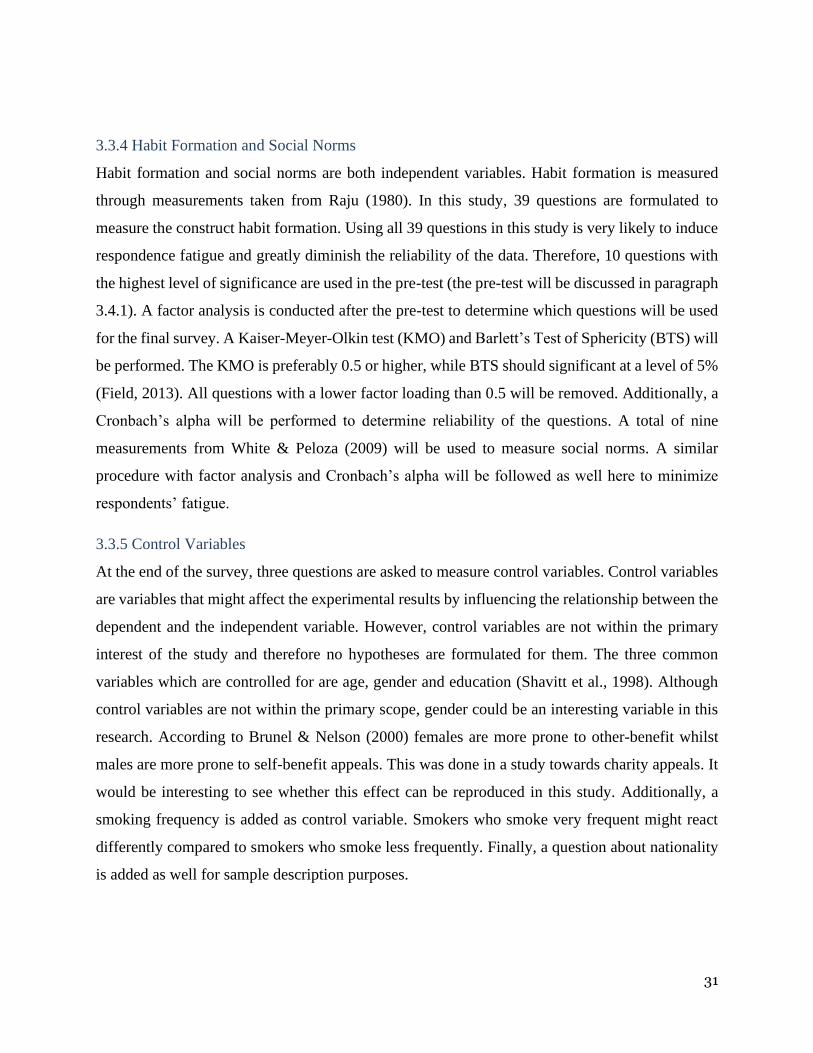
3.3.4 Habit Formation and Social Norms
Habit formation and social norms are both independent variables. Habit formation is measured
through measurements taken from Raju (1980). In this study, 39 questions are formulated to
measure the construct habit formation. Using all 39 questions in this study is very likely to induce
respondence fatigue and greatly diminish the reliability of the data. Therefore, 10 questions with
the highest level of significance are used in the pre-test (the pre-test will be discussed in paragraph
3.4.1). A factor analysis is conducted after the pre-test to determine which questions will be used
for the final survey. A Kaiser-Meyer-Olkin test (KMO) and Barlett’s Test of Sphericity (BTS) will
be performed. The KMO is preferably 0.5 or higher, while BTS should significant at a level of 5%
(Field, 2013). All questions with a lower factor loading than 0.5 will be removed. Additionally, a
Cronbach’s alpha will be performed to determine reliability of the questions. A total of nine
measurements from White & Peloza (2009) will be used to measure social norms. A similar
procedure with factor analysis and Cronbach’s alpha will be followed as well here to minimize
respondents’ fatigue.
3.3.5 Control Variables
At the end of the survey, three questions are asked to measure control variables. Control variables
are variables that might affect the experimental results by influencing the relationship between the
dependent and the independent variable. However, control variables are not within the primary
interest of the study and therefore no hypotheses are formulated for them. The three common
variables which are controlled for are age, gender and education (Shavitt et al., 1998). Although
control variables are not within the primary scope, gender could be an interesting variable in this
research. According to Brunel & Nelson (2000) females are more prone to other-benefit whilst
males are more prone to self-benefit appeals. This was done in a study towards charity appeals. It
would be interesting to see whether this effect can be reproduced in this study. Additionally, a
smoking frequency is added as control variable. Smokers who smoke very frequent might react
differently compared to smokers who smoke less frequently. Finally, a question about nationality
is added as well for sample description purposes.
32
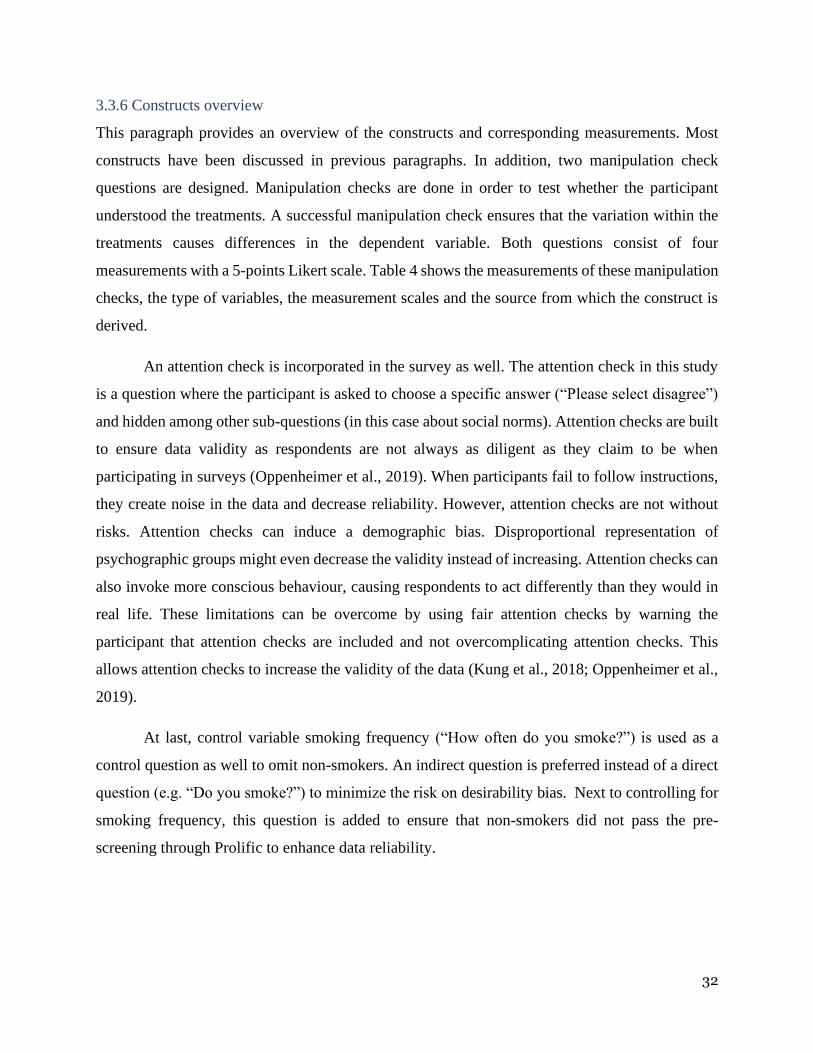
3.3.6 Constructs overview
This paragraph provides an overview of the constructs and corresponding measurements. Most
constructs have been discussed in previous paragraphs. In addition, two manipulation check
questions are designed. Manipulation checks are done in order to test whether the participant
understood the treatments. A successful manipulation check ensures that the variation within the
treatments causes differences in the dependent variable. Both questions consist of four
measurements with a 5-points Likert scale. Table 4 shows the measurements of these manipulation
checks, the type of variables, the measurement scales and the source from which the construct is
derived.
An attention check is incorporated in the survey as well. The attention check in this study
is a question where the participant is asked to choose a specific answer (“Please select disagree”)
and hidden among other sub-questions (in this case about social norms). Attention checks are built
to ensure data validity as respondents are not always as diligent as they claim to be when
participating in surveys (Oppenheimer et al., 2019). When participants fail to follow instructions,
they create noise in the data and decrease reliability. However, attention checks are not without
risks. Attention checks can induce a demographic bias. Disproportional representation of
psychographic groups might even decrease the validity instead of increasing. Attention checks can
also invoke more conscious behaviour, causing respondents to act differently than they would in
real life. These limitations can be overcome by using fair attention checks by warning the
participant that attention checks are included and not overcomplicating attention checks. This
allows attention checks to increase the validity of the data (Kung et al., 2018; Oppenheimer et al.,
2019).
At last, control variable smoking frequency (“How often do you smoke?”) is used as a
control question as well to omit non-smokers. An indirect question is preferred instead of a direct
question (e.g. “Do you smoke?”) to minimize the risk on desirability bias. Next to controlling for
smoking frequency, this question is added to ensure that non-smokers did not pass the pre-
screening through Prolific to enhance data reliability.
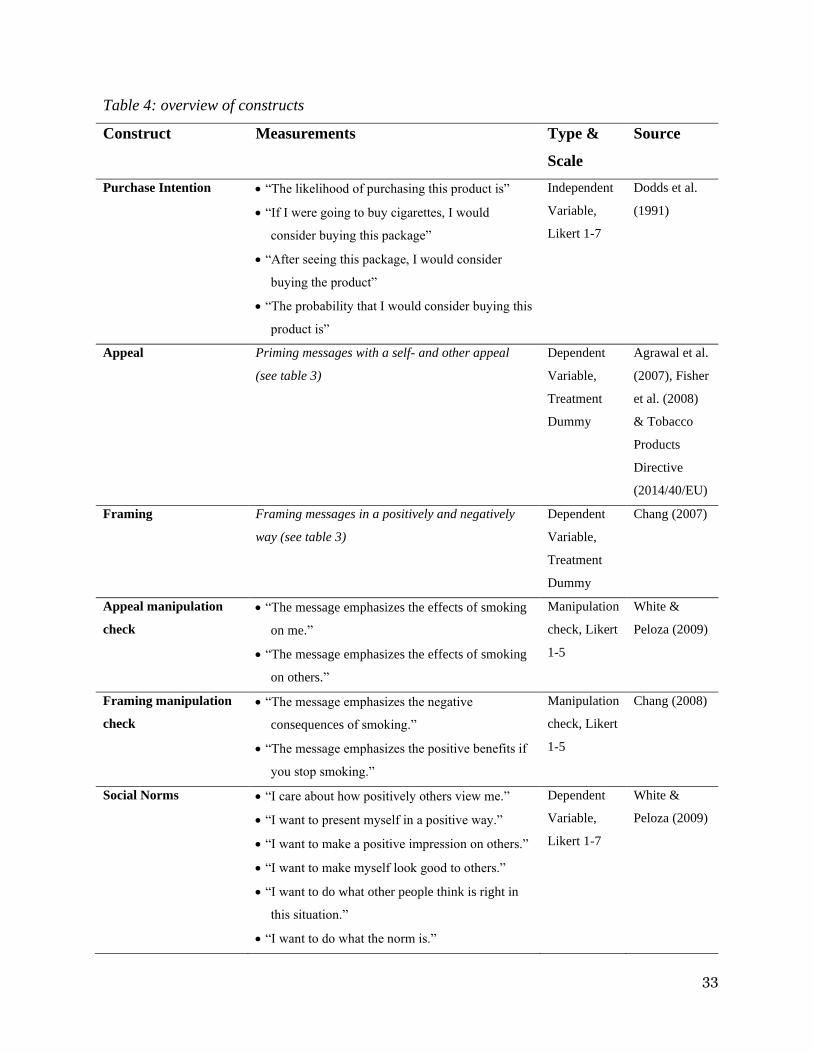
33
Table 4: overview of constructs
Construct Measurements Type &
Scale
Source
Purchase Intention • “The likelihood of purchasing this product is”
• “If I were going to buy cigarettes, I would
consider buying this package”
• “After seeing this package, I would consider
buying the product”
• “The probability that I would consider buying this
product is”
Independent
Variable,
Likert 1-7
Dodds et al.
(1991)
Appeal Priming messages with a self- and other appeal
(see table 3)
Dependent
Variable,
Treatment
Dummy
Agrawal et al.
(2007), Fisher
et al. (2008)
& Tobacco
Products
Directive
(2014/40/EU)
Framing Framing messages in a positively and negatively
way (see table 3)
Dependent
Variable,
Treatment
Dummy
Chang (2007)
Appeal manipulation
check
• “The message emphasizes the effects of smoking
on me.”
• “The message emphasizes the effects of smoking
on others.”
Manipulation
check, Likert
1-5
White &
Peloza (2009)
Framing manipulation
check
• “The message emphasizes the negative
consequences of smoking.”
• “The message emphasizes the positive benefits if
you stop smoking.”
Manipulation
check, Likert
1-5
Chang (2008)
Social Norms • “I care about how positively others view me.”
• “I want to present myself in a positive way.”
• “I want to make a positive impression on others.”
• “I want to make myself look good to others.”
• “I want to do what other people think is right in
this situation.”
• “I want to do what the norm is.”
Dependent
Variable,
Likert 1-7
White &
Peloza (2009)
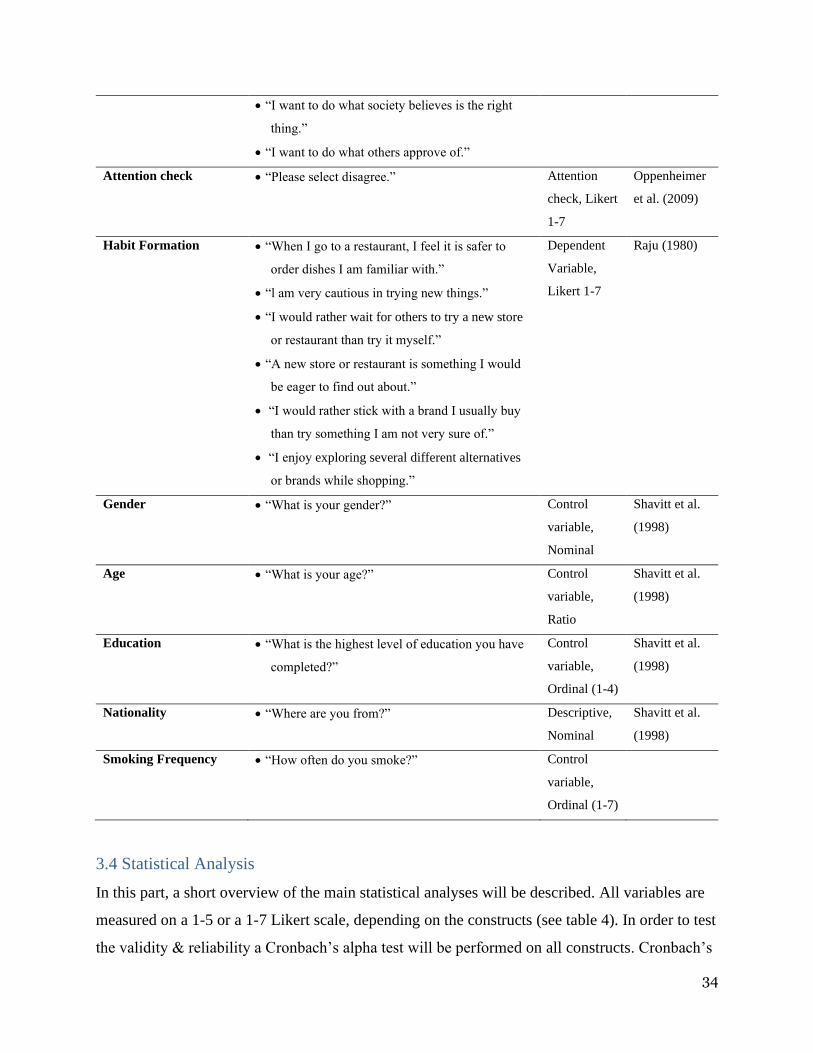
34
• “I want to do what society believes is the right
thing.”
• “I want to do what others approve of.”
Attention check • “Please select disagree.” Attention
check, Likert
1-7
Oppenheimer
et al. (2009)
Habit Formation • “When I go to a restaurant, I feel it is safer to
order dishes I am familiar with.”
• “l am very cautious in trying new things.”
• “I would rather wait for others to try a new store
or restaurant than try it myself.”
• “A new store or restaurant is something I would
be eager to find out about.”
• “I would rather stick with a brand I usually buy
than try something I am not very sure of.”
• “I enjoy exploring several different alternatives
or brands while shopping.”
Dependent
Variable,
Likert 1-7
Raju (1980)
Gender • “What is your gender?” Control
variable,
Nominal
Shavitt et al.
(1998)
Age • “What is your age?” Control
variable,
Ratio
Shavitt et al.
(1998)
Education • “What is the highest level of education you have
completed?”
Control
variable,
Ordinal (1-4)
Shavitt et al.
(1998)
Nationality • “Where are you from?” Descriptive,
Nominal
Shavitt et al.
(1998)
Smoking Frequency • “How often do you smoke?”
Control
variable,
Ordinal (1-7)
3.4 Statistical Analysis
In this part, a short overview of the main statistical analyses will be described. All variables are
measured on a 1-5 or a 1-7 Likert scale, depending on the constructs (see table 4). In order to test
the validity & reliability a Cronbach’s alpha test will be performed on all constructs. Cronbach’s
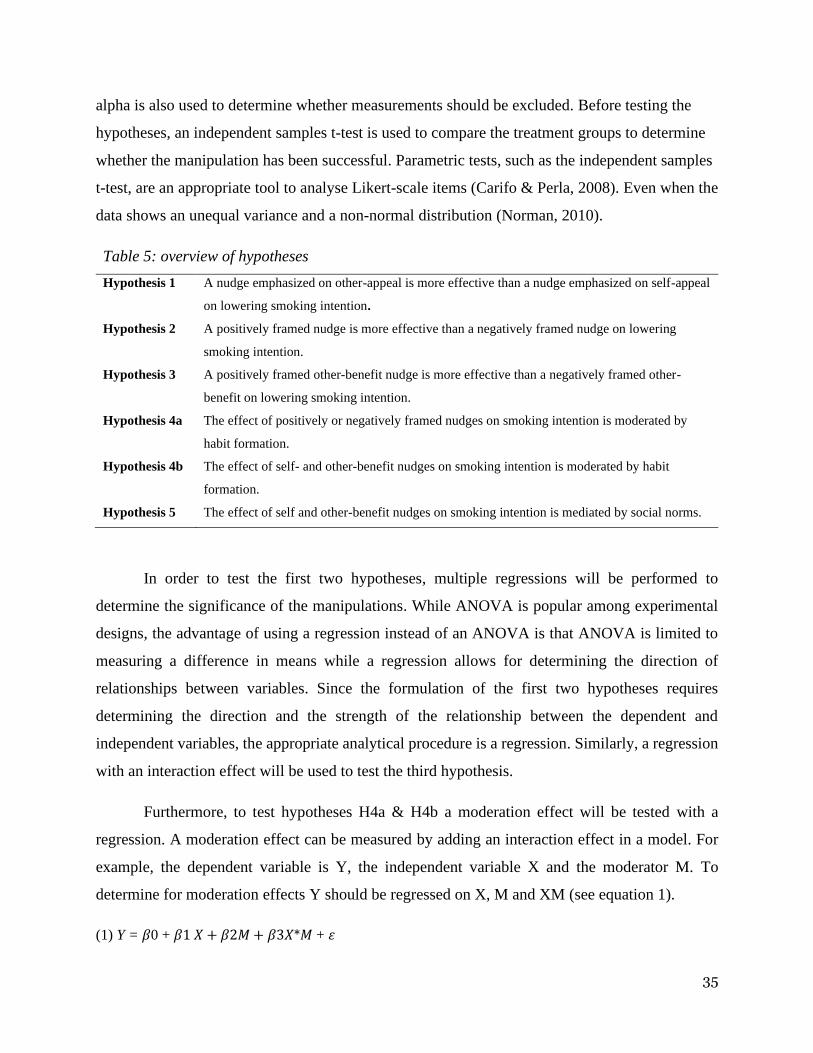
35
alpha is also used to determine whether measurements should be excluded. Before testing the
hypotheses, an independent samples t-test is used to compare the treatment groups to determine
whether the manipulation has been successful. Parametric tests, such as the independent samples
t-test, are an appropriate tool to analyse Likert-scale items (Carifo & Perla, 2008). Even when the
data shows an unequal variance and a non-normal distribution (Norman, 2010).
Table 5: overview of hypotheses
Hypothesis 1 A nudge emphasized on other-appeal is more effective than a nudge emphasized on self-appeal
on lowering smoking intention.
Hypothesis 2 A positively framed nudge is more effective than a negatively framed nudge on lowering
smoking intention.
Hypothesis 3 A positively framed other-benefit nudge is more effective than a negatively framed other-
benefit on lowering smoking intention.
Hypothesis 4a The effect of positively or negatively framed nudges on smoking intention is moderated by
habit formation.
Hypothesis 4b The effect of self- and other-benefit nudges on smoking intention is moderated by habit
formation.
Hypothesis 5 The effect of self and other-benefit nudges on smoking intention is mediated by social norms.
In order to test the first two hypotheses, multiple regressions will be performed to
determine the significance of the manipulations. While ANOVA is popular among experimental
designs, the advantage of using a regression instead of an ANOVA is that ANOVA is limited to
measuring a difference in means while a regression allows for determining the direction of
relationships between variables. Since the formulation of the first two hypotheses requires
determining the direction and the strength of the relationship between the dependent and
independent variables, the appropriate analytical procedure is a regression. Similarly, a regression
with an interaction effect will be used to test the third hypothesis.
Furthermore, to test hypotheses H4a & H4b a moderation effect will be tested with a
regression. A moderation effect can be measured by adding an interaction effect in a model. For
example, the dependent variable is Y, the independent variable X and the moderator M. To
determine for moderation effects Y should be regressed on X, M and XM (see equation 1).
(1) Y = 𝛽0 + 𝛽1 𝑋 + 𝛽2𝑀 + 𝛽3𝑋*𝑀 + 𝜀
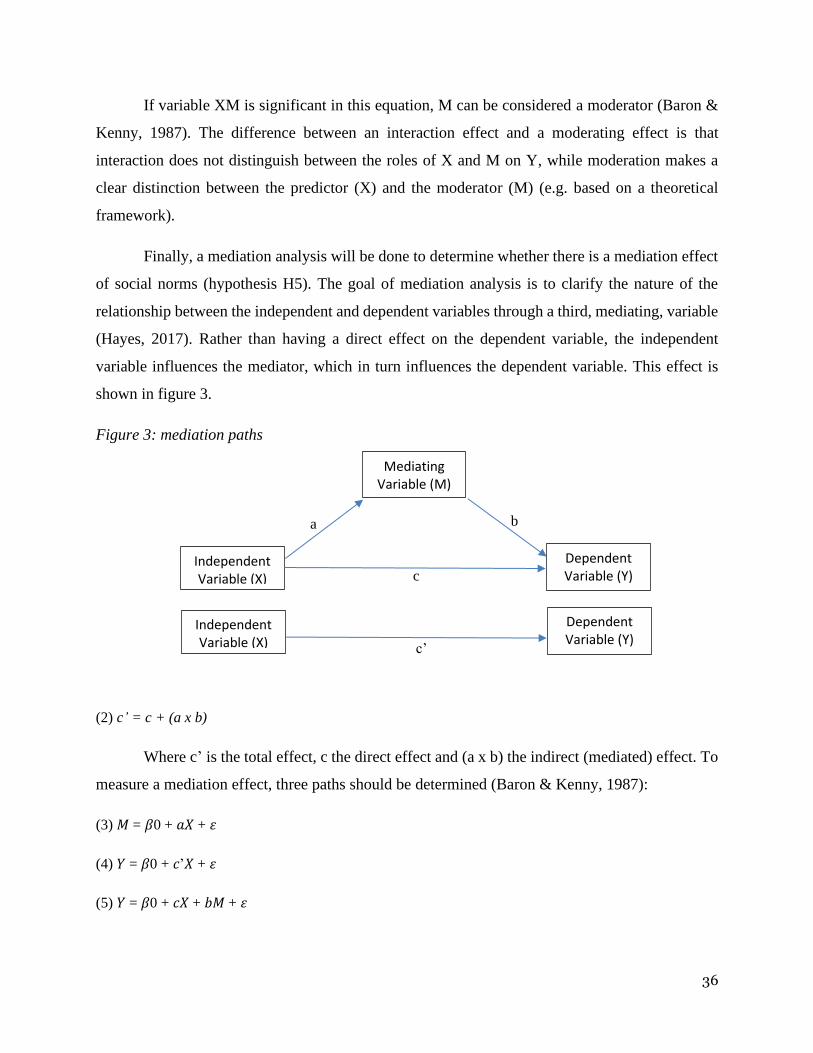
36
a b
c
c’
If variable XM is significant in this equation, M can be considered a moderator (Baron &
Kenny, 1987). The difference between an interaction effect and a moderating effect is that
interaction does not distinguish between the roles of X and M on Y, while moderation makes a
clear distinction between the predictor (X) and the moderator (M) (e.g. based on a theoretical
framework).
Finally, a mediation analysis will be done to determine whether there is a mediation effect
of social norms (hypothesis H5). The goal of mediation analysis is to clarify the nature of the
relationship between the independent and dependent variables through a third, mediating, variable
(Hayes, 2017). Rather than having a direct effect on the dependent variable, the independent
variable influences the mediator, which in turn influences the dependent variable. This effect is
shown in figure 3.
Figure 3: mediation paths
(2) c’ = c + (a x b)
Where c’ is the total effect, c the direct effect and (a x b) the indirect (mediated) effect. To
measure a mediation effect, three paths should be determined (Baron & Kenny, 1987):
(3) 𝑀 = 𝛽0 + 𝑎𝑋 + 𝜀
(4) 𝑌 = 𝛽0 + 𝑐’𝑋 + 𝜀
(5) 𝑌 = 𝛽0 + 𝑐𝑋 + 𝑏𝑀 + 𝜀
Mediating Variable (M)
Independent Variable (X)
Dependent Variable (Y)
Independent Variable (X)
Dependent Variable (Y)
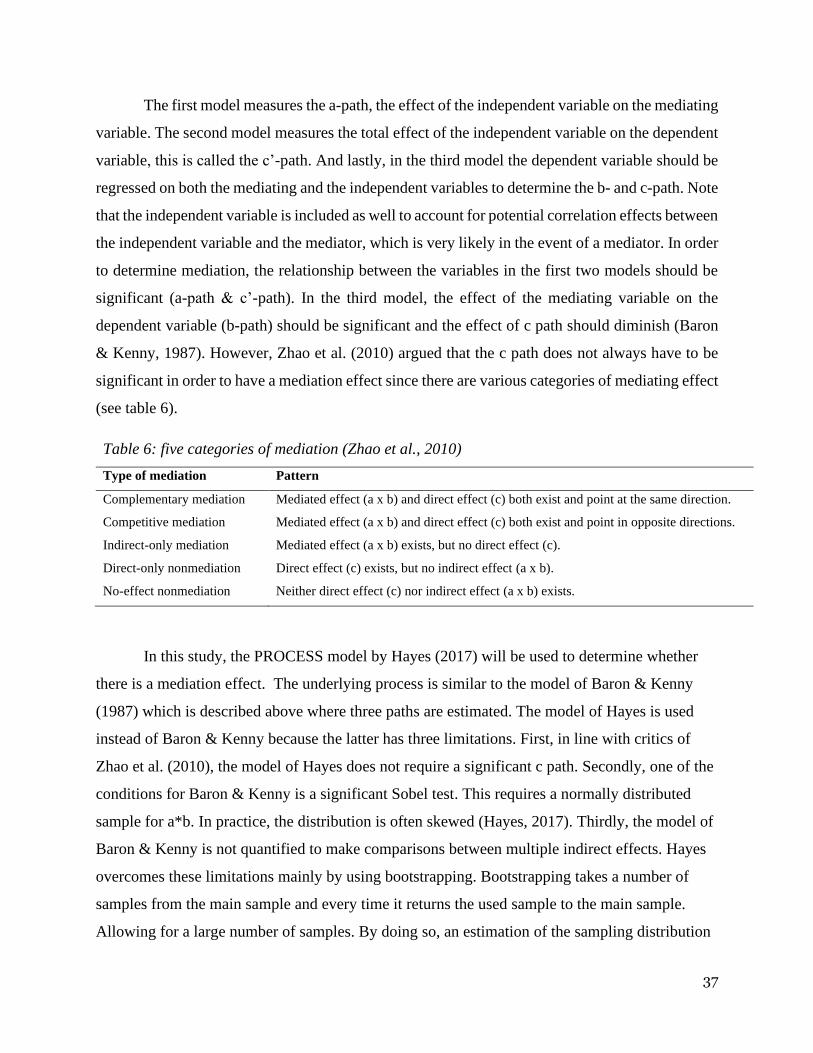
37
The first model measures the a-path, the effect of the independent variable on the mediating
variable. The second model measures the total effect of the independent variable on the dependent
variable, this is called the c’-path. And lastly, in the third model the dependent variable should be
regressed on both the mediating and the independent variables to determine the b- and c-path. Note
that the independent variable is included as well to account for potential correlation effects between
the independent variable and the mediator, which is very likely in the event of a mediator. In order
to determine mediation, the relationship between the variables in the first two models should be
significant (a-path & c’-path). In the third model, the effect of the mediating variable on the
dependent variable (b-path) should be significant and the effect of c path should diminish (Baron
& Kenny, 1987). However, Zhao et al. (2010) argued that the c path does not always have to be
significant in order to have a mediation effect since there are various categories of mediating effect
(see table 6).
Table 6: five categories of mediation (Zhao et al., 2010)
Type of mediation Pattern
Complementary mediation Mediated effect (a x b) and direct effect (c) both exist and point at the same direction.
Competitive mediation Mediated effect (a x b) and direct effect (c) both exist and point in opposite directions.
Indirect-only mediation Mediated effect (a x b) exists, but no direct effect (c).
Direct-only nonmediation Direct effect (c) exists, but no indirect effect (a x b).
No-effect nonmediation Neither direct effect (c) nor indirect effect (a x b) exists.
In this study, the PROCESS model by Hayes (2017) will be used to determine whether
there is a mediation effect. The underlying process is similar to the model of Baron & Kenny
(1987) which is described above where three paths are estimated. The model of Hayes is used
instead of Baron & Kenny because the latter has three limitations. First, in line with critics of
Zhao et al. (2010), the model of Hayes does not require a significant c path. Secondly, one of the
conditions for Baron & Kenny is a significant Sobel test. This requires a normally distributed
sample for a*b. In practice, the distribution is often skewed (Hayes, 2017). Thirdly, the model of
Baron & Kenny is not quantified to make comparisons between multiple indirect effects. Hayes
overcomes these limitations mainly by using bootstrapping. Bootstrapping takes a number of
samples from the main sample and every time it returns the used sample to the main sample.
Allowing for a large number of samples. By doing so, an estimation of the sampling distribution
38
of the indirect effect can be made. This effect will be measured through a confidence interval and
not with a p-value. In this study a bootstrap with 10.000 samples will be done through mediation
model 4 (which is the same as figure 3).
3.4.1. Pre-test
A pre-test is a crucial element of good study design (Teijlinen & Hundley, 2001). A pre-test can
be considered as a mini version of the experiment design which is run with a smaller sample size.
The goal of the pre-test is to gain valuable insights to enhance the study. For example, by doing a
pre-test one can examine whether the manipulation design was successful. It also allows the
researcher to add additional or remove certain questions if needed based on the feedback.
In this study a pre-test is run among 30 people who are master students at the Erasmus
University Rotterdam or recently graduated with the use of Qualtrics. One of the objectives of the
pre-test is determine whether the manipulation was successful. This is done by asking the
participants to score the experienced level of self- and other-appeal after presenting the treatment
as discussed in paragraph 3.3.6. A low score indicates that the respondent experienced a self-
benefit appeal and a high score an other-benefit appeal. For a successful manipulation it would be
expected that the two values differ. The results of the pre-test indicate that there is a difference in
means between self-appeal (M=2.51) and other-appeal (M=3.23). However, the difference is not
significant (F=6.938, p=0.11) at a significance level of 5%. This in combination with feedback
from respondents that the questions are ambiguous and might be open for interpretation is reason
for redesigning the measurements. Despite a high Crobnach’s Alpha (α=0.919) the number of
items to measure the manipulation is reduced from two questions to one for both self-benefit and
other-benefit appeal. Using the best of both questions, one clear question per appeal is asked.
Bringing the total of measurements from four to two.
Message framing manipulations checks were performed in a similar way as appeal.
Framing the message positively (M=3.63) and negatively (M=2.52) has proven to significant
(F=0.169, p=0.006). Complaints of ambiguity and different interpretations were raised here as
well. Similar adjustment is done as for self- & other-appeal are done here as well. Resulting in two
clear formulated questions about emotional framing.
39
Social norms has a Cronbach’s alpha of 0.827. After performing a Kaiser-Varimax rotation
factor analysis (KMO=0.64 & BTS: X²=150, p=0.000) the only item with a factor loading smaller
than 0.5 was sub-question 5 (0.362). Deleting sub-question 5 (“I do things because I want to do
what is expected of me.”) improved the reliability of the question (α=0.84). Habit formation is
improved (α=0.666 to α=0.8) by removing four sub-questions which all had had a lower factor
loading than 0.5 (KMO=0.541 & BTS: X²=114, p=0.000). One sub-question is rephrased due to
complaints about a double negative formulation. The removal of these five sub-questions (one
social norms, four habit formation) is desirable to reduce respondent fatigue as discussed before.
Purchase intention remains unchanged (α=0.925).
Furthermore, some textual alterations are made based on the feedback. Some alterations
are made to improve the imagined setting. Nationality question is rephrased. Purchase intention
question is rephrased as well. Smoking frequency scale has been revamped. And at last the overall
survey design is adjusted for mobile users. Running the second pre-test has shown that the
adjustments to the manipulation check for self- and other-benefit appeal were successful (F=5.011,
p=0.000).
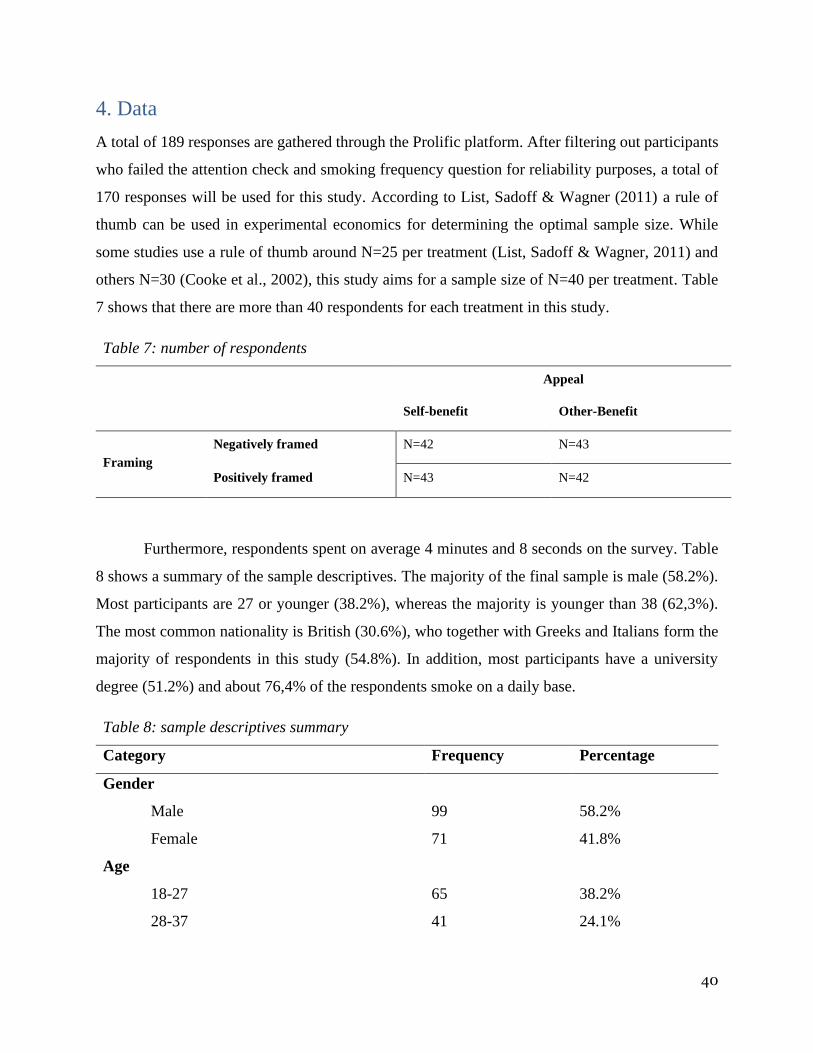
40
4. Data
A total of 189 responses are gathered through the Prolific platform. After filtering out participants
who failed the attention check and smoking frequency question for reliability purposes, a total of
170 responses will be used for this study. According to List, Sadoff & Wagner (2011) a rule of
thumb can be used in experimental economics for determining the optimal sample size. While
some studies use a rule of thumb around N=25 per treatment (List, Sadoff & Wagner, 2011) and
others N=30 (Cooke et al., 2002), this study aims for a sample size of N=40 per treatment. Table
7 shows that there are more than 40 respondents for each treatment in this study.
Table 7: number of respondents
Appeal
Self-benefit Other-Benefit
Framing
Negatively framed N=42 N=43
Positively framed N=43 N=42
Furthermore, respondents spent on average 4 minutes and 8 seconds on the survey. Table
8 shows a summary of the sample descriptives. The majority of the final sample is male (58.2%).
Most participants are 27 or younger (38.2%), whereas the majority is younger than 38 (62,3%).
The most common nationality is British (30.6%), who together with Greeks and Italians form the
majority of respondents in this study (54.8%). In addition, most participants have a university
degree (51.2%) and about 76,4% of the respondents smoke on a daily base.
Table 8: sample descriptives summary
Category Frequency Percentage
Gender
Male 99 58.2%
Female 71 41.8%
Age
18-27 65 38.2%
28-37 41 24.1%
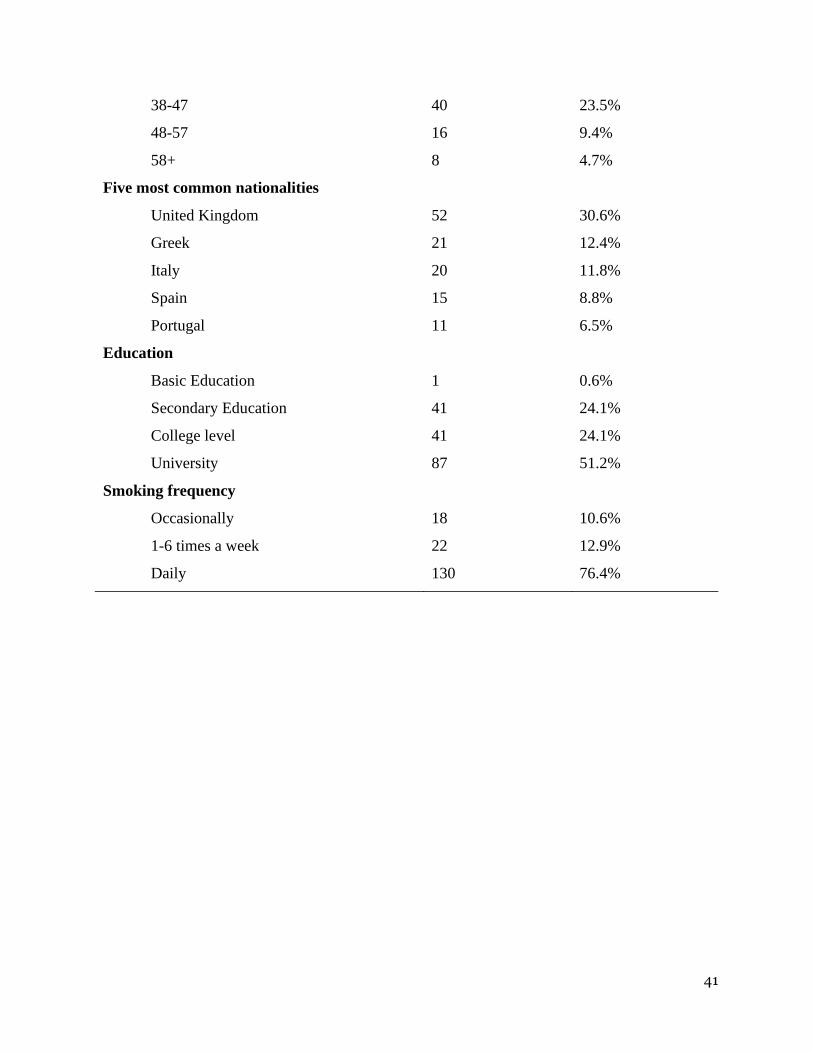
41
38-47 40 23.5%
48-57 16 9.4%
58+ 8 4.7%
Five most common nationalities
United Kingdom 52 30.6%
Greek 21 12.4%
Italy 20 11.8%
Spain 15 8.8%
Portugal 11 6.5%
Education
Basic Education 1 0.6%
Secondary Education 41 24.1%
College level 41 24.1%
University 87 51.2%
Smoking frequency
Occasionally 18 10.6%
1-6 times a week 22 12.9%
Daily 130 76.4%
42
5. Results
In this chapter the results of the study are provided. The first section describes the results of tests
regarding the reliability & validity of the data, whereas the second section involves hypothesis
testing. The last and third section shows the results of including the control variables.
5.1 Reliability & validity
5.1.1 Manipulation check
Before the hypotheses are tested, the data is checked to determine if the manipulation was
successful. Both manipulation checks (self- and other-benefit appeal & negative and positive
message framing) consisted of two questions.
In order to compute the variables using the items, a Kaiser-Varimax rotation factor analysis
is performed to determine if the items are measuring the same underlying construct. For self- and
other-benefit appeal, the KMO is 0.5 and Bartlett's test of sphericity is significant at a level of
p=0.005 (X²=8). Both items have a loading of 0.78, which is considered sufficient as explained in
methods. Next, negative and positive message framing has a KMO of 0.5 as well. Bartlett's test of
sphericity is also significant at a level of p=0.003 (X²=8.8). Both items of emotional framing have
a loading of 0.783. A Cronbach’s Alpha will not be performed since both manipulations consist of
only two items. In order to test the assumptions for a Cronbach’s Alpha test, more items are needed.
Instead, a substitute is used, namely calculating the correlation between the two items. Pearson’s
correlation test is performed for both constructs. Both appeal (r=0.216) and emotional framing
(r=0.227) appear to be significant at the level of p=0.01. Though it should be mentioned a
Pearson’s r below 0.3, despite being significant, indicates low strength of the correlation. However,
given that the factor loadings are high, the pre-test has shown good results in this respect and the
Pearson’s r is not insignificant, there are sufficient grounds to compute the variable. Before doing
so, one of the two items will be reverse-scored since the items for both constructs are formulated
as opposites.
After computing both variables there are two manipulation variables: appeal and emotion.
Appeal is defined as a dummy (0=self-benefit and 1=other-benefit). Both levels of appeal consist
of N=85, whereas the mean score of appeal=0 is 3.46 and appeal=1 has a mean score of 1.97. A
high score indicates that the participant experienced the treatment as a self-benefit appeal, whereas
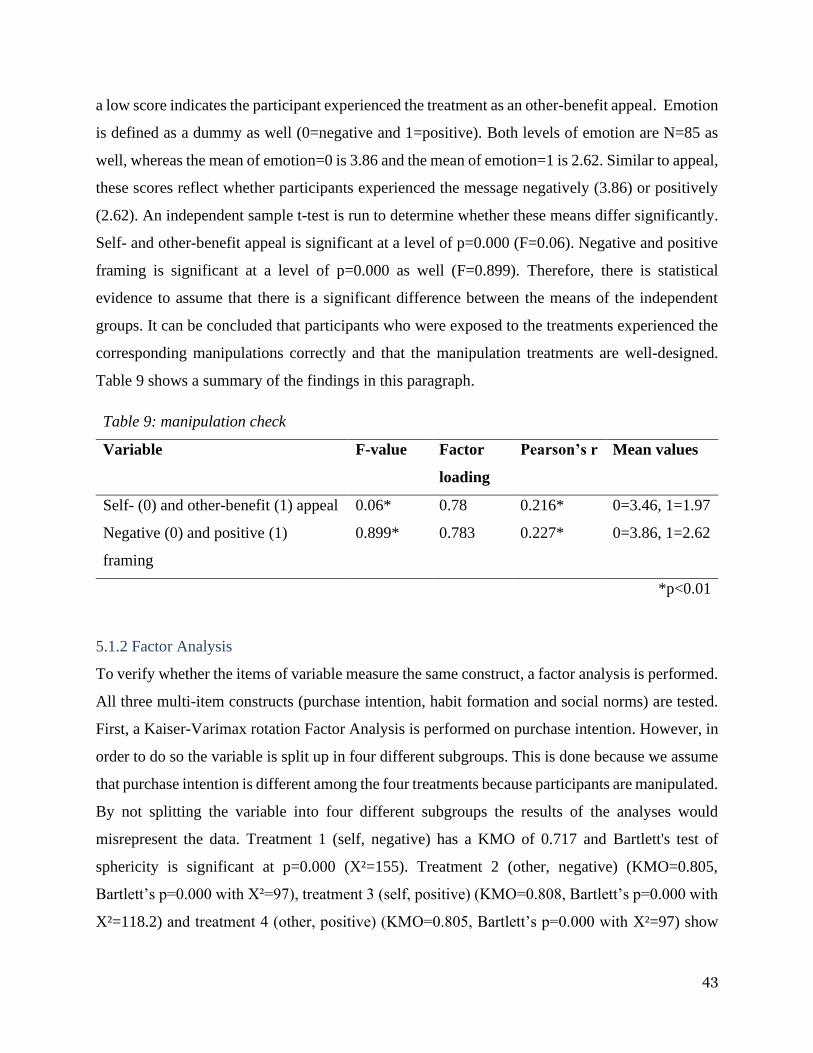
43
a low score indicates the participant experienced the treatment as an other-benefit appeal. Emotion
is defined as a dummy as well (0=negative and 1=positive). Both levels of emotion are N=85 as
well, whereas the mean of emotion=0 is 3.86 and the mean of emotion=1 is 2.62. Similar to appeal,
these scores reflect whether participants experienced the message negatively (3.86) or positively
(2.62). An independent sample t-test is run to determine whether these means differ significantly.
Self- and other-benefit appeal is significant at a level of p=0.000 (F=0.06). Negative and positive
framing is significant at a level of p=0.000 as well (F=0.899). Therefore, there is statistical
evidence to assume that there is a significant difference between the means of the independent
groups. It can be concluded that participants who were exposed to the treatments experienced the
corresponding manipulations correctly and that the manipulation treatments are well-designed.
Table 9 shows a summary of the findings in this paragraph.
Table 9: manipulation check
Variable F-value Factor
loading
Pearson’s r Mean values
Self- (0) and other-benefit (1) appeal 0.06* 0.78 0.216* 0=3.46, 1=1.97
Negative (0) and positive (1)
framing
0.899* 0.783 0.227* 0=3.86, 1=2.62
*p<0.01
5.1.2 Factor Analysis
To verify whether the items of variable measure the same construct, a factor analysis is performed.
All three multi-item constructs (purchase intention, habit formation and social norms) are tested.
First, a Kaiser-Varimax rotation Factor Analysis is performed on purchase intention. However, in
order to do so the variable is split up in four different subgroups. This is done because we assume
that purchase intention is different among the four treatments because participants are manipulated.
By not splitting the variable into four different subgroups the results of the analyses would
misrepresent the data. Treatment 1 (self, negative) has a KMO of 0.717 and Bartlett's test of
sphericity is significant at p=0.000 (X²=155). Treatment 2 (other, negative) (KMO=0.805,
Bartlett’s p=0.000 with X²=97), treatment 3 (self, positive) (KMO=0.808, Bartlett’s p=0.000 with
X²=118.2) and treatment 4 (other, positive) (KMO=0.805, Bartlett’s p=0.000 with X²=97) show
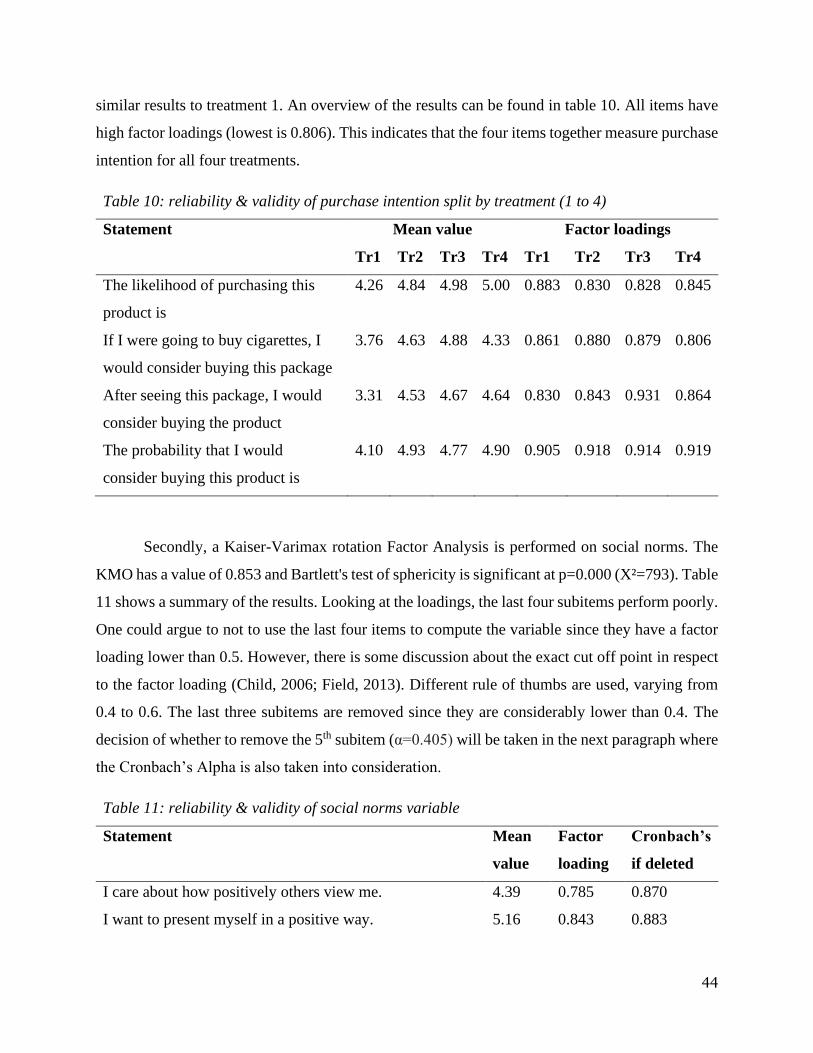
44
similar results to treatment 1. An overview of the results can be found in table 10. All items have
high factor loadings (lowest is 0.806). This indicates that the four items together measure purchase
intention for all four treatments.
Table 10: reliability & validity of purchase intention split by treatment (1 to 4)
Statement Mean value Factor loadings
Tr1 Tr2 Tr3 Tr4 Tr1 Tr2 Tr3 Tr4
The likelihood of purchasing this
product is
4.26 4.84 4.98 5.00 0.883 0.830 0.828 0.845
If I were going to buy cigarettes, I
would consider buying this package
3.76 4.63 4.88 4.33 0.861 0.880 0.879 0.806
After seeing this package, I would
consider buying the product
3.31 4.53 4.67 4.64 0.830 0.843 0.931 0.864
The probability that I would
consider buying this product is
4.10 4.93 4.77 4.90 0.905 0.918 0.914 0.919
Secondly, a Kaiser-Varimax rotation Factor Analysis is performed on social norms. The
KMO has a value of 0.853 and Bartlett's test of sphericity is significant at p=0.000 (X²=793). Table
11 shows a summary of the results. Looking at the loadings, the last four subitems perform poorly.
One could argue to not to use the last four items to compute the variable since they have a factor
loading lower than 0.5. However, there is some discussion about the exact cut off point in respect
to the factor loading (Child, 2006; Field, 2013). Different rule of thumbs are used, varying from
0.4 to 0.6. The last three subitems are removed since they are considerably lower than 0.4. The
decision of whether to remove the 5th subitem (α=0.405) will be taken in the next paragraph where
the Cronbach’s Alpha is also taken into consideration.
Table 11: reliability & validity of social norms variable
Statement Mean
value
Factor
loading
Cronbach’s
if deleted
I care about how positively others view me. 4.39 0.785 0.870
I want to present myself in a positive way. 5.16 0.843 0.883
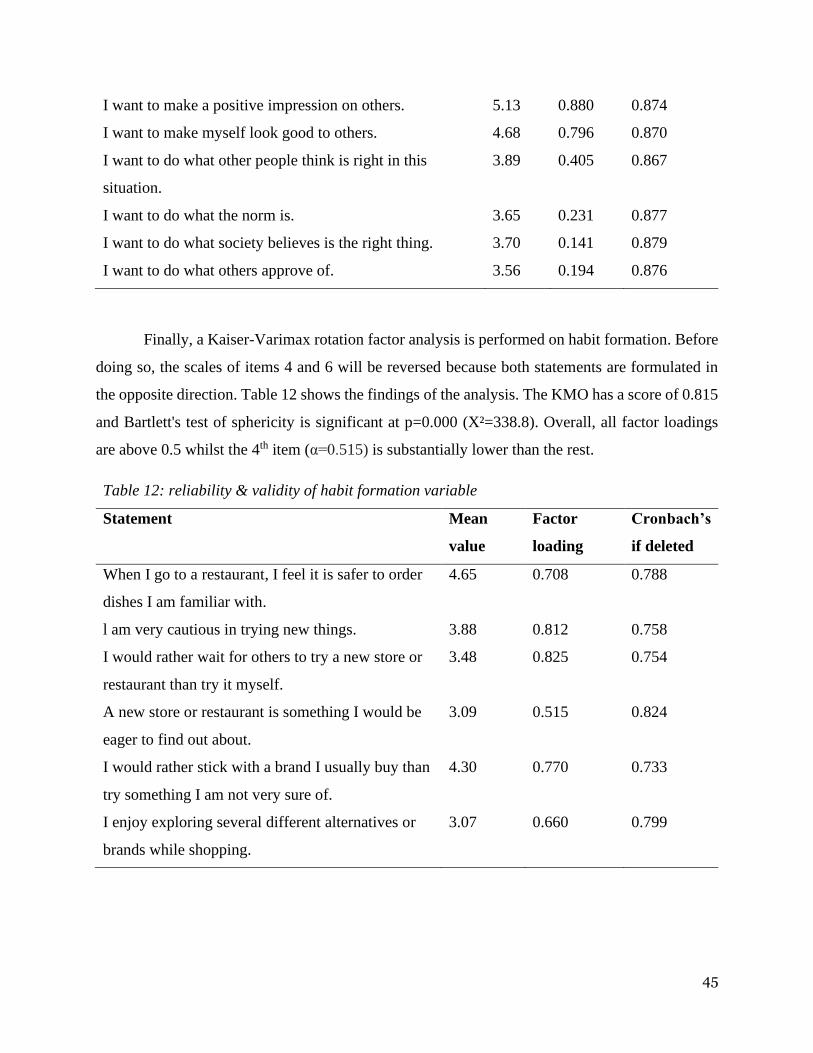
45
I want to make a positive impression on others. 5.13 0.880 0.874
I want to make myself look good to others. 4.68 0.796 0.870
I want to do what other people think is right in this
situation.
3.89 0.405 0.867
I want to do what the norm is. 3.65 0.231 0.877
I want to do what society believes is the right thing. 3.70 0.141 0.879
I want to do what others approve of. 3.56 0.194 0.876
Finally, a Kaiser-Varimax rotation factor analysis is performed on habit formation. Before
doing so, the scales of items 4 and 6 will be reversed because both statements are formulated in
the opposite direction. Table 12 shows the findings of the analysis. The KMO has a score of 0.815
and Bartlett's test of sphericity is significant at p=0.000 (X²=338.8). Overall, all factor loadings
are above 0.5 whilst the 4th item (α=0.515) is substantially lower than the rest.
Table 12: reliability & validity of habit formation variable
Statement Mean
value
Factor
loading
Cronbach’s
if deleted
When I go to a restaurant, I feel it is safer to order
dishes I am familiar with.
4.65 0.708 0.788
l am very cautious in trying new things. 3.88 0.812 0.758
I would rather wait for others to try a new store or
restaurant than try it myself.
3.48 0.825 0.754
A new store or restaurant is something I would be
eager to find out about.
3.09 0.515 0.824
I would rather stick with a brand I usually buy than
try something I am not very sure of.
4.30 0.770 0.733
I enjoy exploring several different alternatives or
brands while shopping.
3.07 0.660 0.799
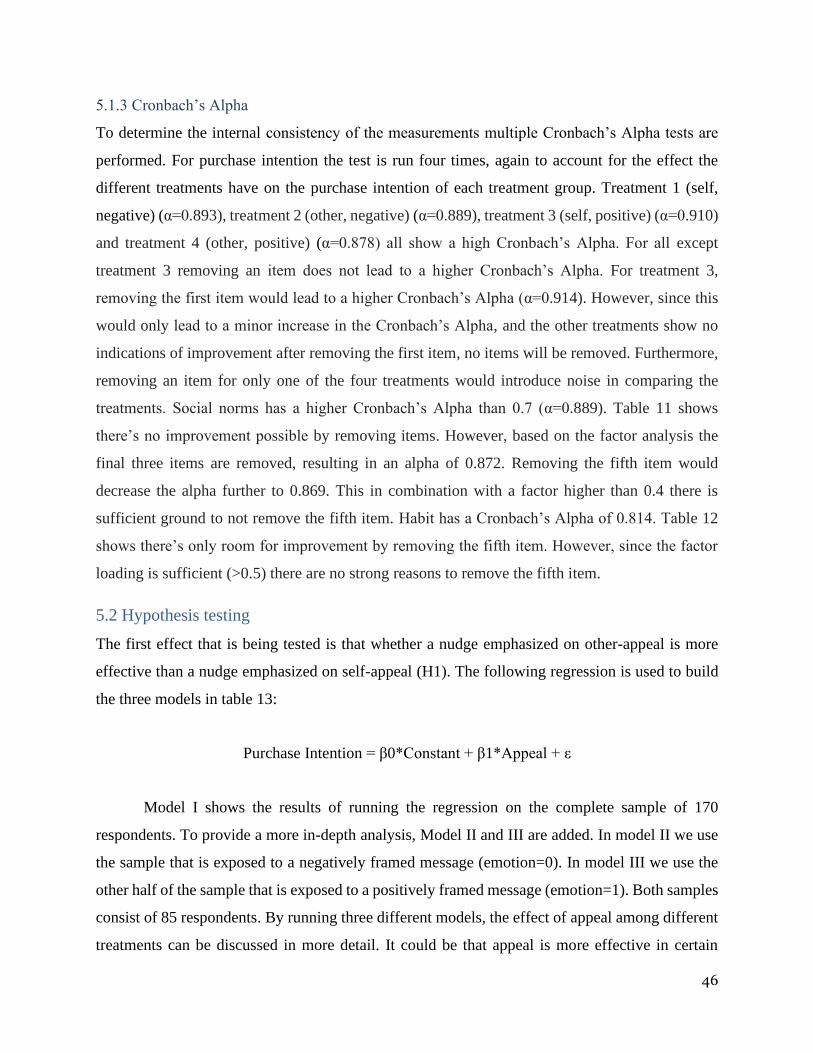
46
5.1.3 Cronbach’s Alpha
To determine the internal consistency of the measurements multiple Cronbach’s Alpha tests are
performed. For purchase intention the test is run four times, again to account for the effect the
different treatments have on the purchase intention of each treatment group. Treatment 1 (self,
negative) (α=0.893), treatment 2 (other, negative) (α=0.889), treatment 3 (self, positive) (α=0.910)
and treatment 4 (other, positive) (α=0.878) all show a high Cronbach’s Alpha. For all except
treatment 3 removing an item does not lead to a higher Cronbach’s Alpha. For treatment 3,
removing the first item would lead to a higher Cronbach’s Alpha (α=0.914). However, since this
would only lead to a minor increase in the Cronbach’s Alpha, and the other treatments show no
indications of improvement after removing the first item, no items will be removed. Furthermore,
removing an item for only one of the four treatments would introduce noise in comparing the
treatments. Social norms has a higher Cronbach’s Alpha than 0.7 (α=0.889). Table 11 shows
there’s no improvement possible by removing items. However, based on the factor analysis the
final three items are removed, resulting in an alpha of 0.872. Removing the fifth item would
decrease the alpha further to 0.869. This in combination with a factor higher than 0.4 there is
sufficient ground to not remove the fifth item. Habit has a Cronbach’s Alpha of 0.814. Table 12
shows there’s only room for improvement by removing the fifth item. However, since the factor
loading is sufficient (>0.5) there are no strong reasons to remove the fifth item.
5.2 Hypothesis testing
The first effect that is being tested is that whether a nudge emphasized on other-appeal is more
effective than a nudge emphasized on self-appeal (H1). The following regression is used to build
the three models in table 13:
Purchase Intention = β0*Constant + β1*Appeal + ε
Model I shows the results of running the regression on the complete sample of 170
respondents. To provide a more in-depth analysis, Model II and III are added. In model II we use
the sample that is exposed to a negatively framed message (emotion=0). In model III we use the
other half of the sample that is exposed to a positively framed message (emotion=1). Both samples
consist of 85 respondents. By running three different models, the effect of appeal among different
treatments can be discussed in more detail. It could be that appeal is more effective in certain
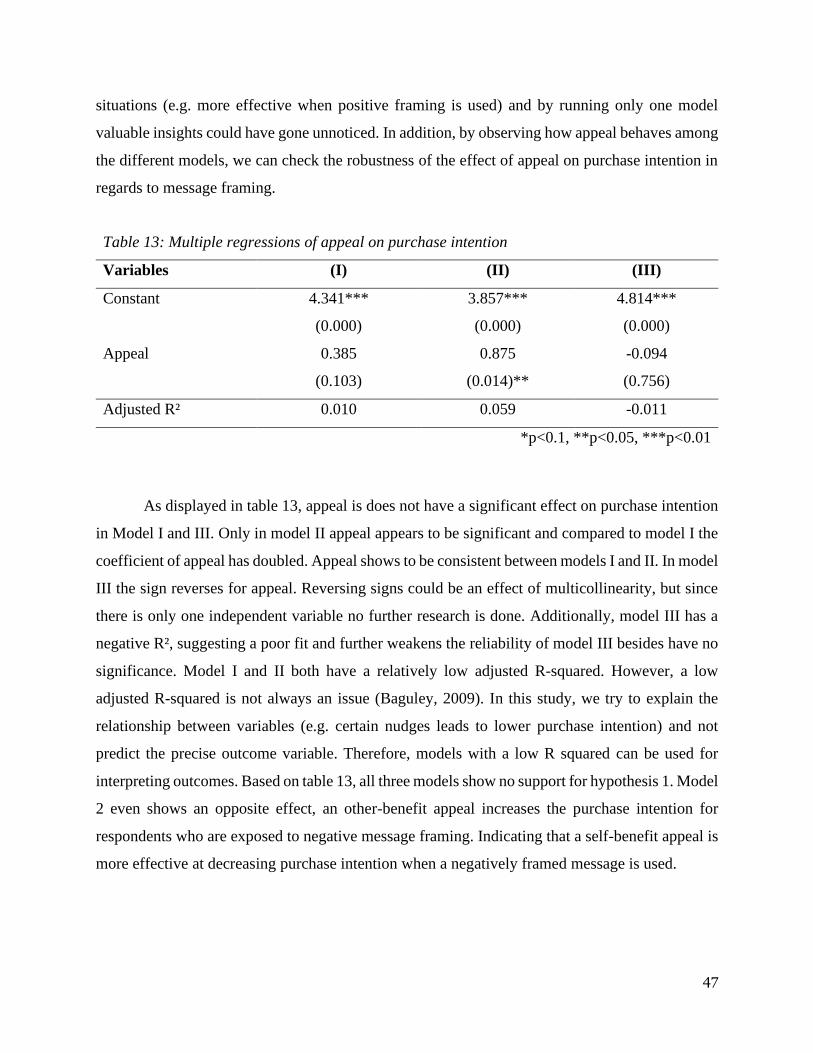
47
situations (e.g. more effective when positive framing is used) and by running only one model
valuable insights could have gone unnoticed. In addition, by observing how appeal behaves among
the different models, we can check the robustness of the effect of appeal on purchase intention in
regards to message framing.
Table 13: Multiple regressions of appeal on purchase intention
Variables (I) (II) (III)
Constant 4.341***
(0.000)
3.857***
(0.000)
4.814***
(0.000)
Appeal 0.385
(0.103)
0.875
(0.014)**
-0.094
(0.756)
Adjusted R² 0.010 0.059 -0.011
*p<0.1, **p<0.05, ***p<0.01
As displayed in table 13, appeal is does not have a significant effect on purchase intention
in Model I and III. Only in model II appeal appears to be significant and compared to model I the
coefficient of appeal has doubled. Appeal shows to be consistent between models I and II. In model
III the sign reverses for appeal. Reversing signs could be an effect of multicollinearity, but since
there is only one independent variable no further research is done. Additionally, model III has a
negative R², suggesting a poor fit and further weakens the reliability of model III besides have no
significance. Model I and II both have a relatively low adjusted R-squared. However, a low
adjusted R-squared is not always an issue (Baguley, 2009). In this study, we try to explain the
relationship between variables (e.g. certain nudges leads to lower purchase intention) and not
predict the precise outcome variable. Therefore, models with a low R squared can be used for
interpreting outcomes. Based on table 13, all three models show no support for hypothesis 1. Model
2 even shows an opposite effect, an other-benefit appeal increases the purchase intention for
respondents who are exposed to negative message framing. Indicating that a self-benefit appeal is
more effective at decreasing purchase intention when a negatively framed message is used.
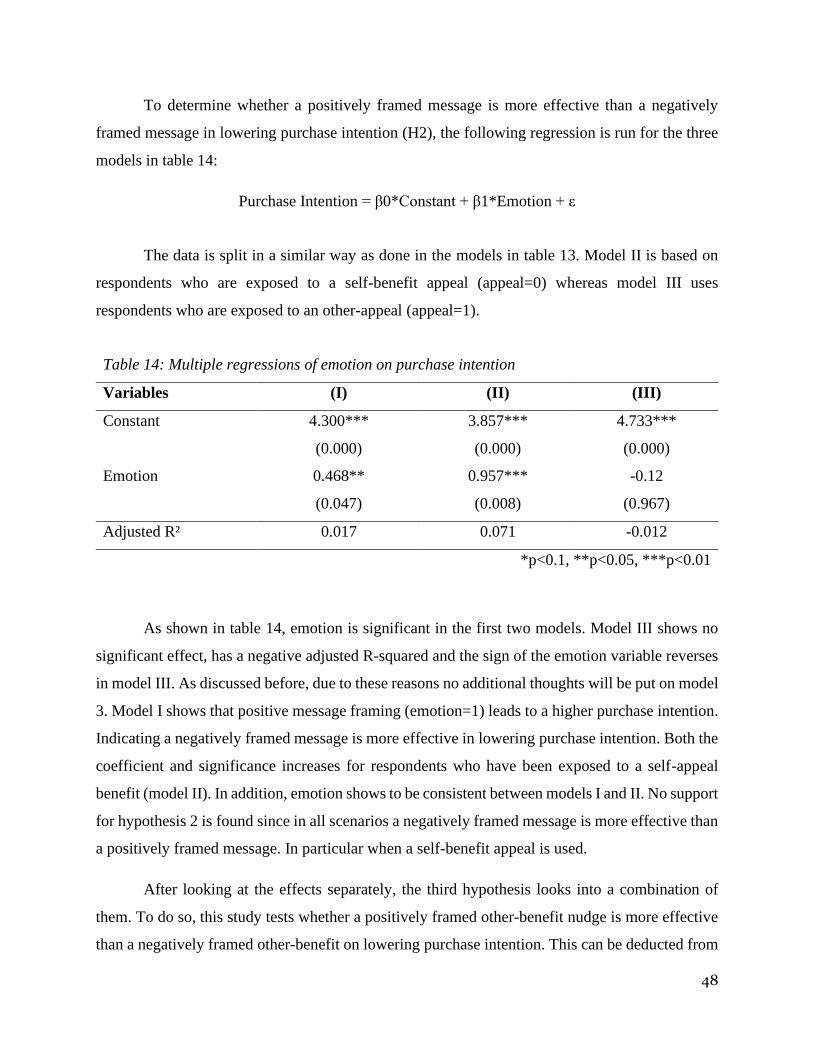
48
To determine whether a positively framed message is more effective than a negatively
framed message in lowering purchase intention (H2), the following regression is run for the three
models in table 14:
Purchase Intention = β0*Constant + β1*Emotion + ε
The data is split in a similar way as done in the models in table 13. Model II is based on
respondents who are exposed to a self-benefit appeal (appeal=0) whereas model III uses
respondents who are exposed to an other-appeal (appeal=1).
Table 14: Multiple regressions of emotion on purchase intention
Variables (I) (II) (III)
Constant 4.300***
(0.000)
3.857***
(0.000)
4.733***
(0.000)
Emotion 0.468**
(0.047)
0.957***
(0.008)
-0.12
(0.967)
Adjusted R² 0.017 0.071 -0.012
*p<0.1, **p<0.05, ***p<0.01
As shown in table 14, emotion is significant in the first two models. Model III shows no
significant effect, has a negative adjusted R-squared and the sign of the emotion variable reverses
in model III. As discussed before, due to these reasons no additional thoughts will be put on model
3. Model I shows that positive message framing (emotion=1) leads to a higher purchase intention.
Indicating a negatively framed message is more effective in lowering purchase intention. Both the
coefficient and significance increases for respondents who have been exposed to a self-appeal
benefit (model II). In addition, emotion shows to be consistent between models I and II. No support
for hypothesis 2 is found since in all scenarios a negatively framed message is more effective than
a positively framed message. In particular when a self-benefit appeal is used.
After looking at the effects separately, the third hypothesis looks into a combination of
them. To do so, this study tests whether a positively framed other-benefit nudge is more effective
than a negatively framed other-benefit on lowering purchase intention. This can be deducted from
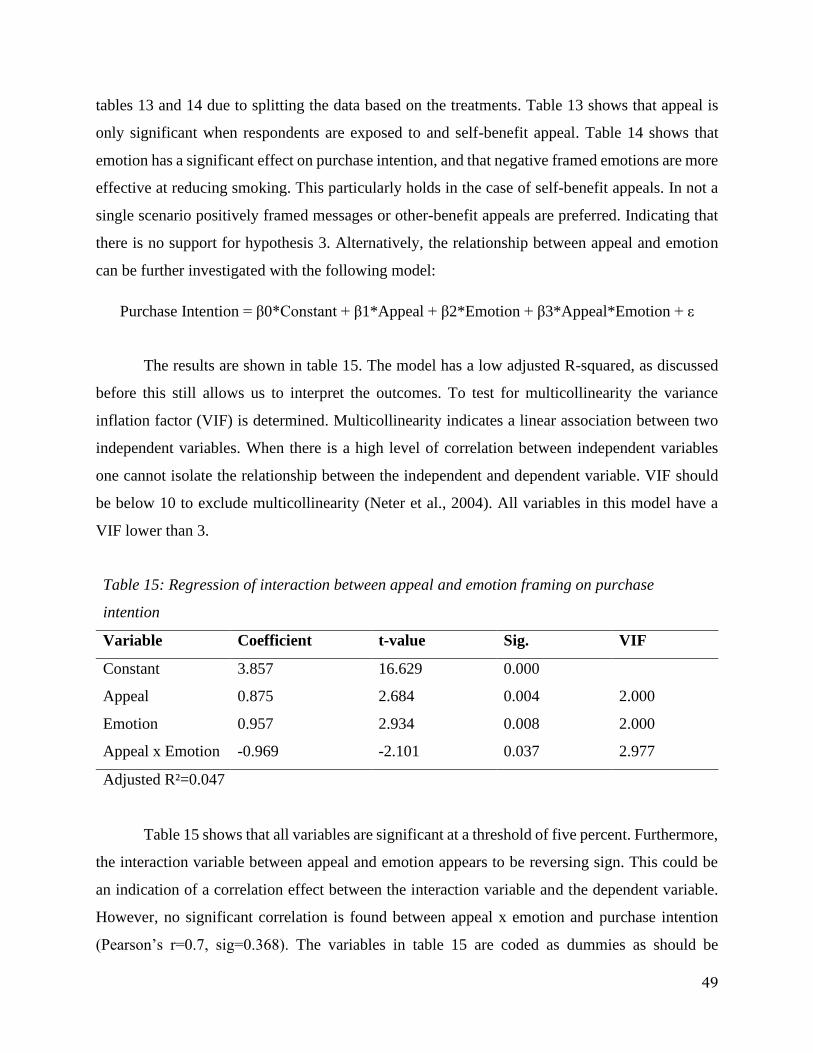
49
tables 13 and 14 due to splitting the data based on the treatments. Table 13 shows that appeal is
only significant when respondents are exposed to and self-benefit appeal. Table 14 shows that
emotion has a significant effect on purchase intention, and that negative framed emotions are more
effective at reducing smoking. This particularly holds in the case of self-benefit appeals. In not a
single scenario positively framed messages or other-benefit appeals are preferred. Indicating that
there is no support for hypothesis 3. Alternatively, the relationship between appeal and emotion
can be further investigated with the following model:
Purchase Intention = β0*Constant + β1*Appeal + β2*Emotion + β3*Appeal*Emotion + ε
The results are shown in table 15. The model has a low adjusted R-squared, as discussed
before this still allows us to interpret the outcomes. To test for multicollinearity the variance
inflation factor (VIF) is determined. Multicollinearity indicates a linear association between two
independent variables. When there is a high level of correlation between independent variables
one cannot isolate the relationship between the independent and dependent variable. VIF should
be below 10 to exclude multicollinearity (Neter et al., 2004). All variables in this model have a
VIF lower than 3.
Table 15: Regression of interaction between appeal and emotion framing on purchase
intention
Variable Coefficient t-value Sig. VIF
Constant 3.857 16.629 0.000
Appeal 0.875 2.684 0.004 2.000
Emotion 0.957 2.934 0.008 2.000
Appeal x Emotion -0.969 -2.101 0.037 2.977
Adjusted R²=0.047
Table 15 shows that all variables are significant at a threshold of five percent. Furthermore,
the interaction variable between appeal and emotion appears to be reversing sign. This could be
an indication of a correlation effect between the interaction variable and the dependent variable.
However, no significant correlation is found between appeal x emotion and purchase intention
(Pearson’s r=0.7, sig=0.368). The variables in table 15 are coded as dummies as should be
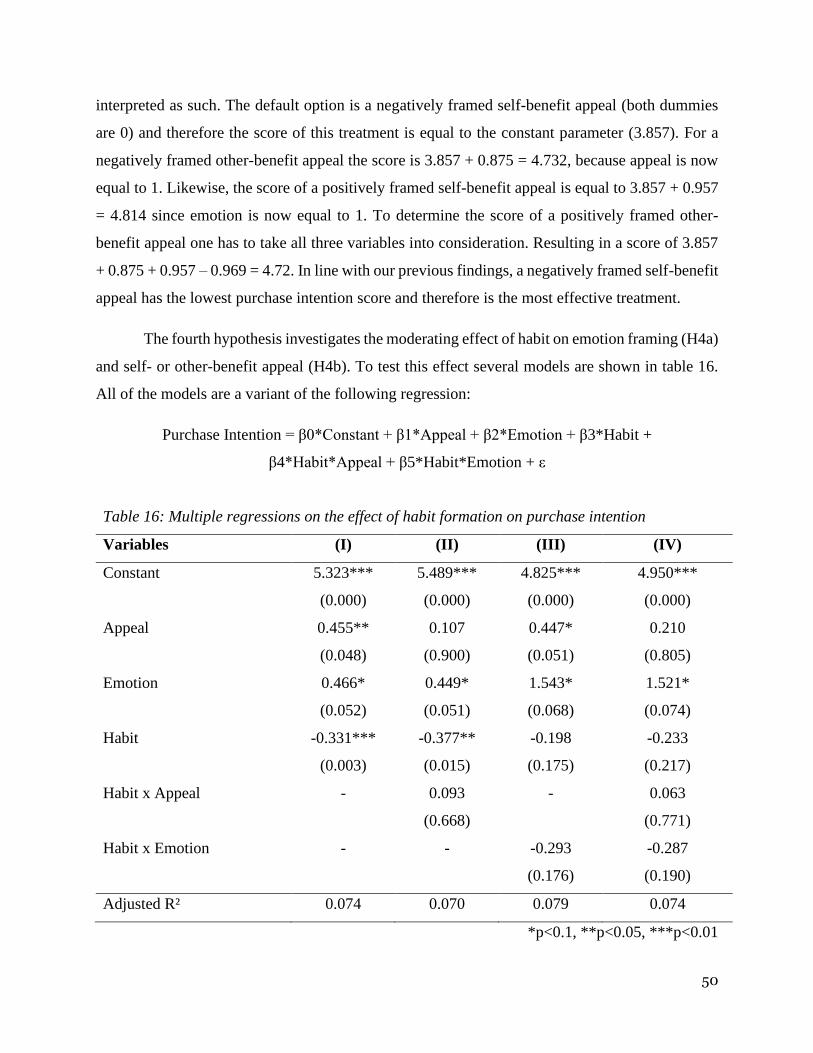
50
interpreted as such. The default option is a negatively framed self-benefit appeal (both dummies
are 0) and therefore the score of this treatment is equal to the constant parameter (3.857). For a
negatively framed other-benefit appeal the score is 3.857 + 0.875 = 4.732, because appeal is now
equal to 1. Likewise, the score of a positively framed self-benefit appeal is equal to 3.857 + 0.957
= 4.814 since emotion is now equal to 1. To determine the score of a positively framed other-
benefit appeal one has to take all three variables into consideration. Resulting in a score of 3.857
+ 0.875 + 0.957 – 0.969 = 4.72. In line with our previous findings, a negatively framed self-benefit
appeal has the lowest purchase intention score and therefore is the most effective treatment.
The fourth hypothesis investigates the moderating effect of habit on emotion framing (H4a)
and self- or other-benefit appeal (H4b). To test this effect several models are shown in table 16.
All of the models are a variant of the following regression:
Purchase Intention = β0*Constant + β1*Appeal + β2*Emotion + β3*Habit +
β4*Habit*Appeal + β5*Habit*Emotion + ε
Table 16: Multiple regressions on the effect of habit formation on purchase intention
Variables (I) (II) (III) (IV)
Constant 5.323***
(0.000)
5.489***
(0.000)
4.825***
(0.000)
4.950***
(0.000)
Appeal 0.455**
(0.048)
0.107
(0.900)
0.447*
(0.051)
0.210
(0.805)
Emotion 0.466*
(0.052)
0.449*
(0.051)
1.543*
(0.068)
1.521*
(0.074)
Habit -0.331***
(0.003)
-0.377**
(0.015)
-0.198
(0.175)
-0.233
(0.217)
Habit x Appeal - 0.093
(0.668)
- 0.063
(0.771)
Habit x Emotion - - -0.293
(0.176)
-0.287
(0.190)
Adjusted R² 0.074 0.070 0.079 0.074
*p<0.1, **p<0.05, ***p<0.01
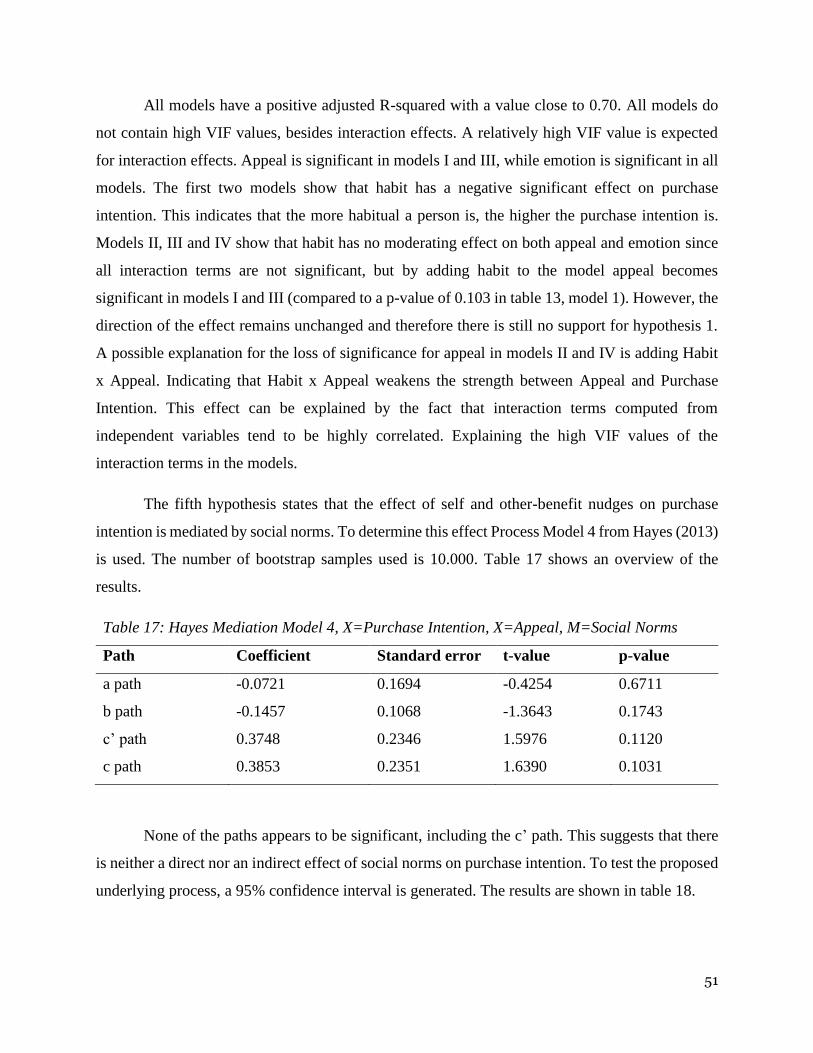
51
All models have a positive adjusted R-squared with a value close to 0.70. All models do
not contain high VIF values, besides interaction effects. A relatively high VIF value is expected
for interaction effects. Appeal is significant in models I and III, while emotion is significant in all
models. The first two models show that habit has a negative significant effect on purchase
intention. This indicates that the more habitual a person is, the higher the purchase intention is.
Models II, III and IV show that habit has no moderating effect on both appeal and emotion since
all interaction terms are not significant, but by adding habit to the model appeal becomes
significant in models I and III (compared to a p-value of 0.103 in table 13, model 1). However, the
direction of the effect remains unchanged and therefore there is still no support for hypothesis 1.
A possible explanation for the loss of significance for appeal in models II and IV is adding Habit
x Appeal. Indicating that Habit x Appeal weakens the strength between Appeal and Purchase
Intention. This effect can be explained by the fact that interaction terms computed from
independent variables tend to be highly correlated. Explaining the high VIF values of the
interaction terms in the models.
The fifth hypothesis states that the effect of self and other-benefit nudges on purchase
intention is mediated by social norms. To determine this effect Process Model 4 from Hayes (2013)
is used. The number of bootstrap samples used is 10.000. Table 17 shows an overview of the
results.
Table 17: Hayes Mediation Model 4, X=Purchase Intention, X=Appeal, M=Social Norms
Path Coefficient Standard error t-value p-value
a path -0.0721 0.1694 -0.4254 0.6711
b path -0.1457 0.1068 -1.3643 0.1743
c’ path 0.3748 0.2346 1.5976 0.1120
c path 0.3853 0.2351 1.6390 0.1031
None of the paths appears to be significant, including the c’ path. This suggests that there
is neither a direct nor an indirect effect of social norms on purchase intention. To test the proposed
underlying process, a 95% confidence interval is generated. The results are shown in table 18.
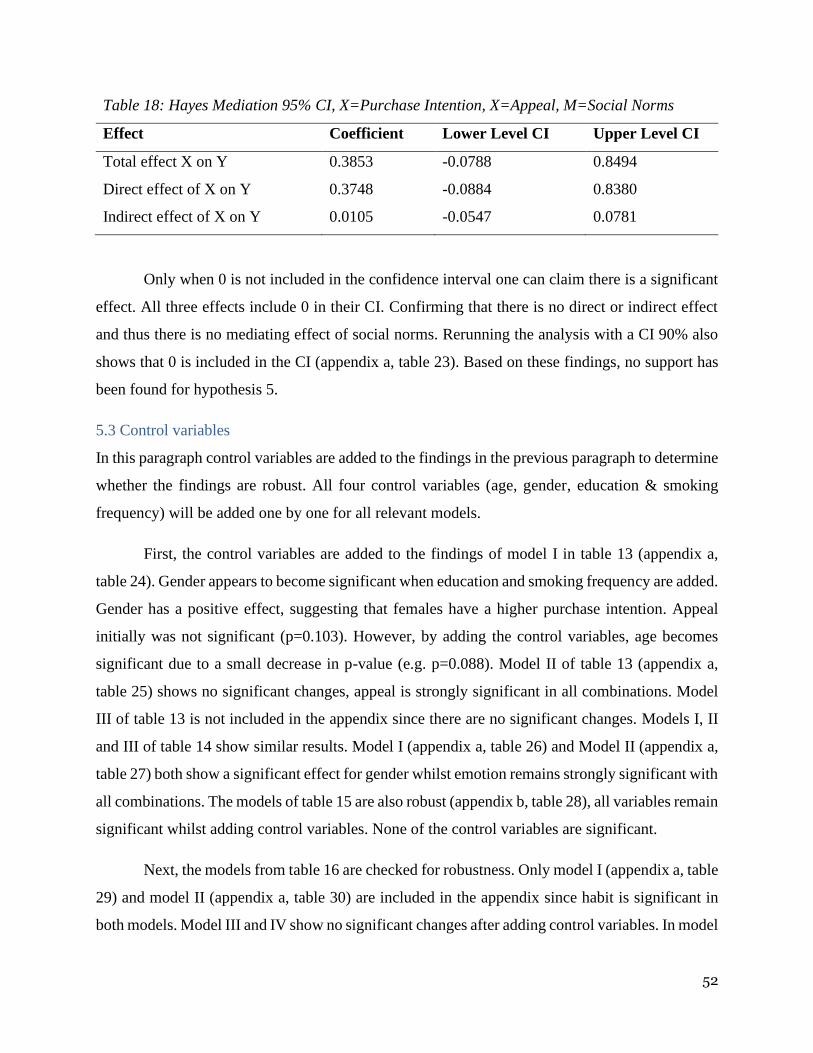
52
Table 18: Hayes Mediation 95% CI, X=Purchase Intention, X=Appeal, M=Social Norms
Effect Coefficient Lower Level CI Upper Level CI
Total effect X on Y 0.3853 -0.0788 0.8494
Direct effect of X on Y 0.3748 -0.0884 0.8380
Indirect effect of X on Y 0.0105 -0.0547 0.0781
Only when 0 is not included in the confidence interval one can claim there is a significant
effect. All three effects include 0 in their CI. Confirming that there is no direct or indirect effect
and thus there is no mediating effect of social norms. Rerunning the analysis with a CI 90% also
shows that 0 is included in the CI (appendix a, table 23). Based on these findings, no support has
been found for hypothesis 5.
5.3 Control variables
In this paragraph control variables are added to the findings in the previous paragraph to determine
whether the findings are robust. All four control variables (age, gender, education & smoking
frequency) will be added one by one for all relevant models.
First, the control variables are added to the findings of model I in table 13 (appendix a,
table 24). Gender appears to become significant when education and smoking frequency are added.
Gender has a positive effect, suggesting that females have a higher purchase intention. Appeal
initially was not significant (p=0.103). However, by adding the control variables, age becomes
significant due to a small decrease in p-value (e.g. p=0.088). Model II of table 13 (appendix a,
table 25) shows no significant changes, appeal is strongly significant in all combinations. Model
III of table 13 is not included in the appendix since there are no significant changes. Models I, II
and III of table 14 show similar results. Model I (appendix a, table 26) and Model II (appendix a,
table 27) both show a significant effect for gender whilst emotion remains strongly significant with
all combinations. The models of table 15 are also robust (appendix b, table 28), all variables remain
significant whilst adding control variables. None of the control variables are significant.
Next, the models from table 16 are checked for robustness. Only model I (appendix a, table
29) and model II (appendix a, table 30) are included in the appendix since habit is significant in
both models. Model III and IV show no significant changes after adding control variables. In model
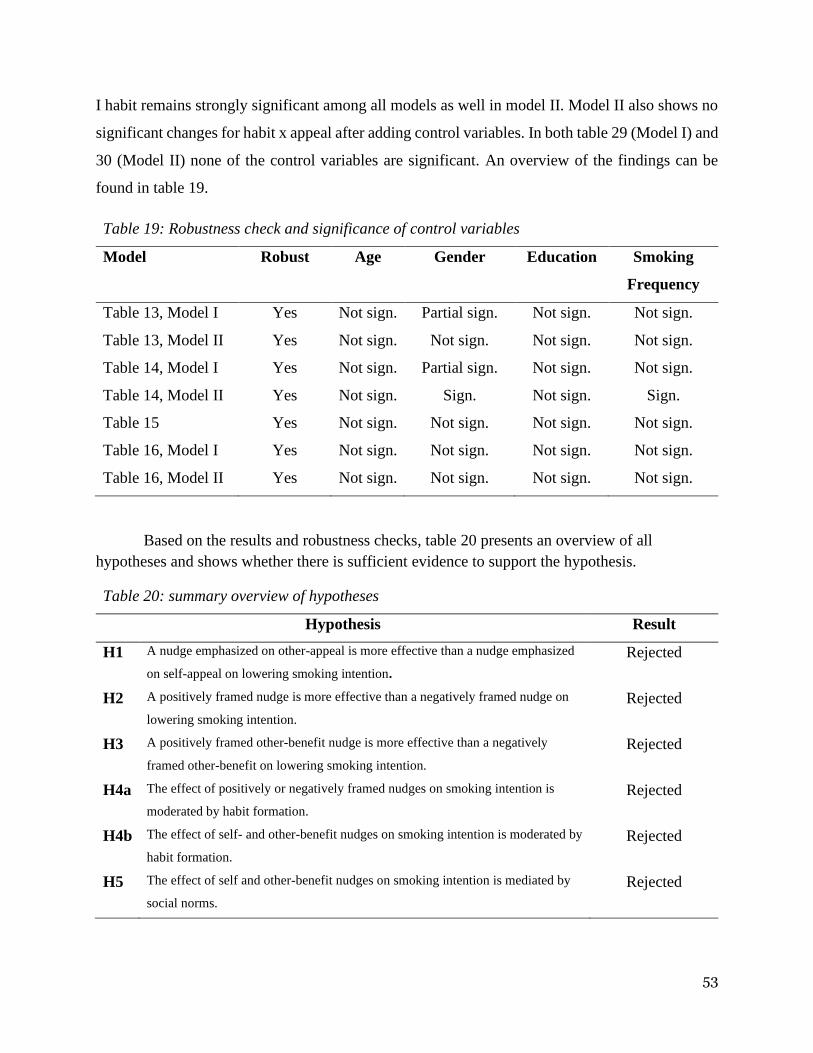
53
I habit remains strongly significant among all models as well in model II. Model II also shows no
significant changes for habit x appeal after adding control variables. In both table 29 (Model I) and
30 (Model II) none of the control variables are significant. An overview of the findings can be
found in table 19.
Table 19: Robustness check and significance of control variables
Model Robust Age Gender Education Smoking
Frequency
Table 13, Model I Yes Not sign. Partial sign. Not sign. Not sign.
Table 13, Model II Yes Not sign. Not sign. Not sign. Not sign.
Table 14, Model I Yes Not sign. Partial sign. Not sign. Not sign.
Table 14, Model II Yes Not sign. Sign. Not sign. Sign.
Table 15 Yes Not sign. Not sign. Not sign. Not sign.
Table 16, Model I Yes Not sign. Not sign. Not sign. Not sign.
Table 16, Model II Yes Not sign. Not sign. Not sign. Not sign.
Based on the results and robustness checks, table 20 presents an overview of all
hypotheses and shows whether there is sufficient evidence to support the hypothesis.
Table 20: summary overview of hypotheses
Hypothesis Result
H1 A nudge emphasized on other-appeal is more effective than a nudge emphasized
on self-appeal on lowering smoking intention.
Rejected
H2 A positively framed nudge is more effective than a negatively framed nudge on
lowering smoking intention.
Rejected
H3 A positively framed other-benefit nudge is more effective than a negatively
framed other-benefit on lowering smoking intention.
Rejected
H4a The effect of positively or negatively framed nudges on smoking intention is
moderated by habit formation.
Rejected
H4b The effect of self- and other-benefit nudges on smoking intention is moderated by
habit formation.
Rejected
H5 The effect of self and other-benefit nudges on smoking intention is mediated by
social norms.
Rejected
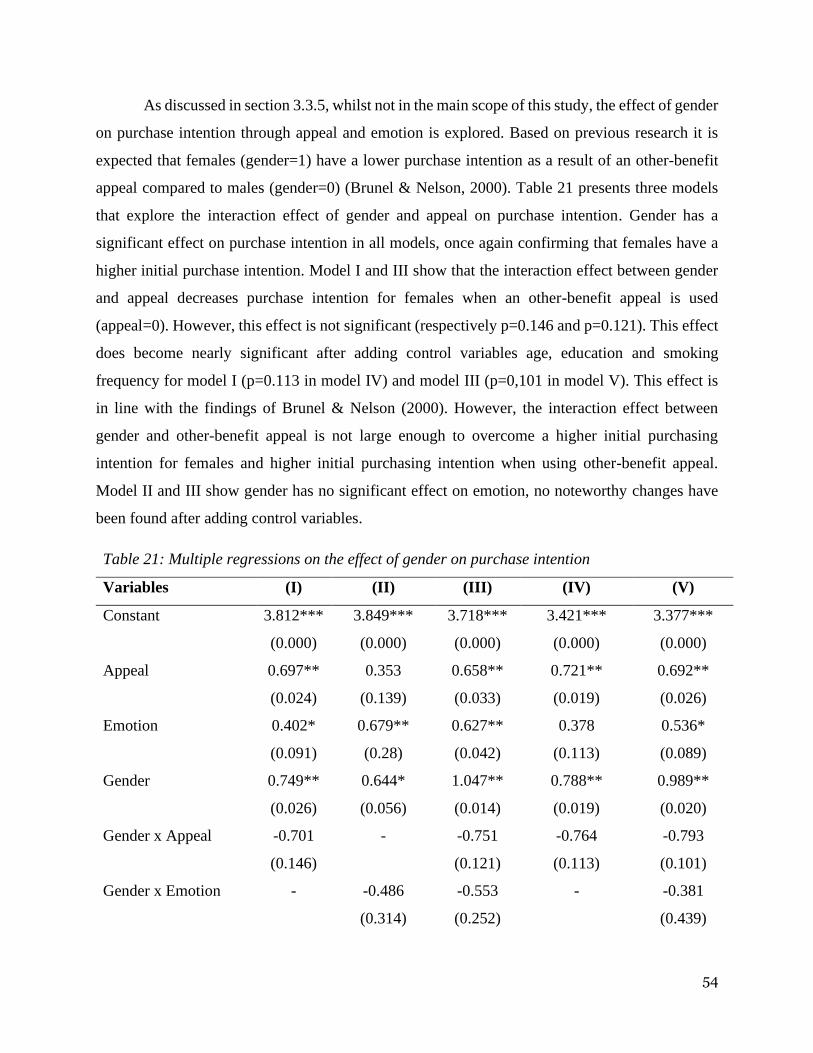
54
As discussed in section 3.3.5, whilst not in the main scope of this study, the effect of gender
on purchase intention through appeal and emotion is explored. Based on previous research it is
expected that females (gender=1) have a lower purchase intention as a result of an other-benefit
appeal compared to males (gender=0) (Brunel & Nelson, 2000). Table 21 presents three models
that explore the interaction effect of gender and appeal on purchase intention. Gender has a
significant effect on purchase intention in all models, once again confirming that females have a
higher initial purchase intention. Model I and III show that the interaction effect between gender
and appeal decreases purchase intention for females when an other-benefit appeal is used
(appeal=0). However, this effect is not significant (respectively p=0.146 and p=0.121). This effect
does become nearly significant after adding control variables age, education and smoking
frequency for model I (p=0.113 in model IV) and model III (p=0,101 in model V). This effect is
in line with the findings of Brunel & Nelson (2000). However, the interaction effect between
gender and other-benefit appeal is not large enough to overcome a higher initial purchasing
intention for females and higher initial purchasing intention when using other-benefit appeal.
Model II and III show gender has no significant effect on emotion, no noteworthy changes have
been found after adding control variables.
Table 21: Multiple regressions on the effect of gender on purchase intention
Variables (I) (II) (III) (IV) (V)
Constant 3.812***
(0.000)
3.849***
(0.000)
3.718***
(0.000)
3.421***
(0.000)
3.377***
(0.000)
Appeal 0.697**
(0.024)
0.353
(0.139)
0.658**
(0.033)
0.721**
(0.019)
0.692**
(0.026)
Emotion 0.402*
(0.091)
0.679**
(0.28)
0.627**
(0.042)
0.378
(0.113)
0.536*
(0.089)
Gender 0.749**
(0.026)
0.644*
(0.056)
1.047**
(0.014)
0.788**
(0.019)
0.989**
(0.020)
Gender x Appeal -0.701
(0.146)
- -0.751
(0.121)
-0.764
(0.113)
-0.793
(0.101)
Gender x Emotion - -0.486
(0.314)
-0.553
(0.252)
- -0.381
(0.439)
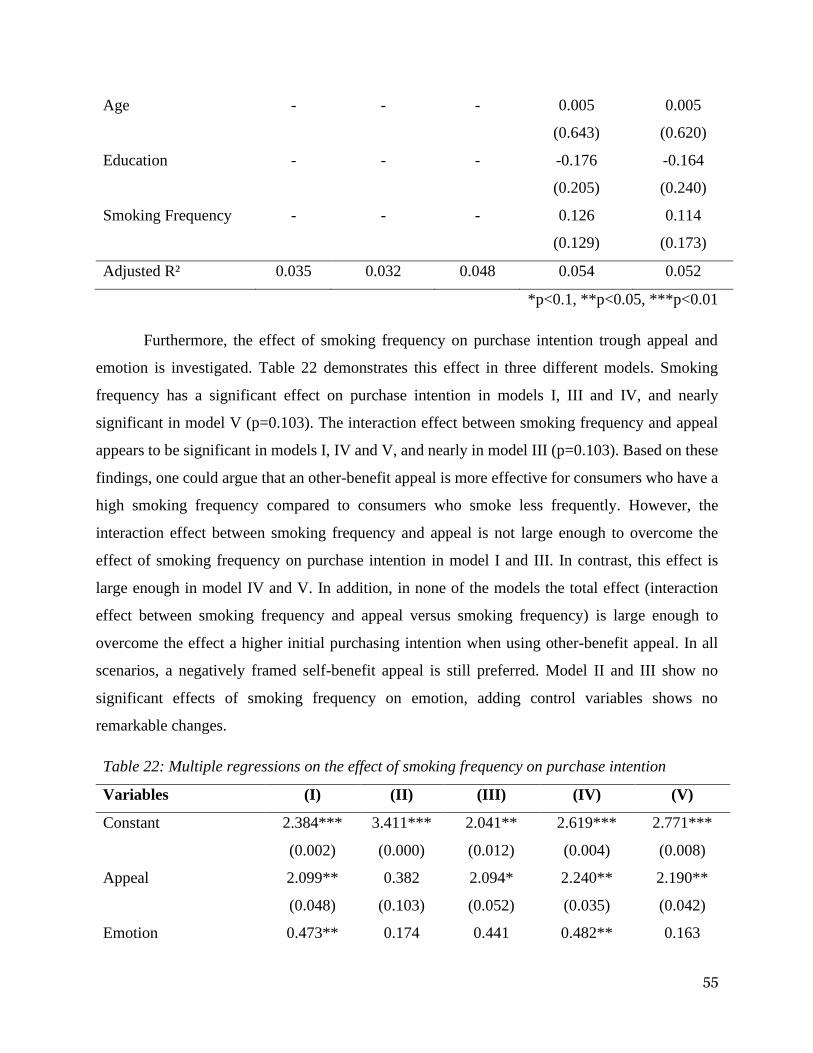
55
Age - - - 0.005
(0.643)
0.005
(0.620)
Education - - - -0.176
(0.205)
-0.164
(0.240)
Smoking Frequency - - - 0.126
(0.129)
0.114
(0.173)
Adjusted R² 0.035 0.032 0.048 0.054 0.052
*p<0.1, **p<0.05, ***p<0.01
Furthermore, the effect of smoking frequency on purchase intention trough appeal and
emotion is investigated. Table 22 demonstrates this effect in three different models. Smoking
frequency has a significant effect on purchase intention in models I, III and IV, and nearly
significant in model V (p=0.103). The interaction effect between smoking frequency and appeal
appears to be significant in models I, IV and V, and nearly in model III (p=0.103). Based on these
findings, one could argue that an other-benefit appeal is more effective for consumers who have a
high smoking frequency compared to consumers who smoke less frequently. However, the
interaction effect between smoking frequency and appeal is not large enough to overcome the
effect of smoking frequency on purchase intention in model I and III. In contrast, this effect is
large enough in model IV and V. In addition, in none of the models the total effect (interaction
effect between smoking frequency and appeal versus smoking frequency) is large enough to
overcome the effect a higher initial purchasing intention when using other-benefit appeal. In all
scenarios, a negatively framed self-benefit appeal is still preferred. Model II and III show no
significant effects of smoking frequency on emotion, adding control variables shows no
remarkable changes.
Table 22: Multiple regressions on the effect of smoking frequency on purchase intention
Variables (I) (II) (III) (IV) (V)
Constant 2.384***
(0.002)
3.411***
(0.000)
2.041**
(0.012)
2.619***
(0.004)
2.771***
(0.008)
Appeal 2.099**
(0.048)
0.382
(0.103)
2.094*
(0.052)
2.240**
(0.035)
2.190**
(0.042)
Emotion 0.473** 0.174 0.441 0.482** 0.163
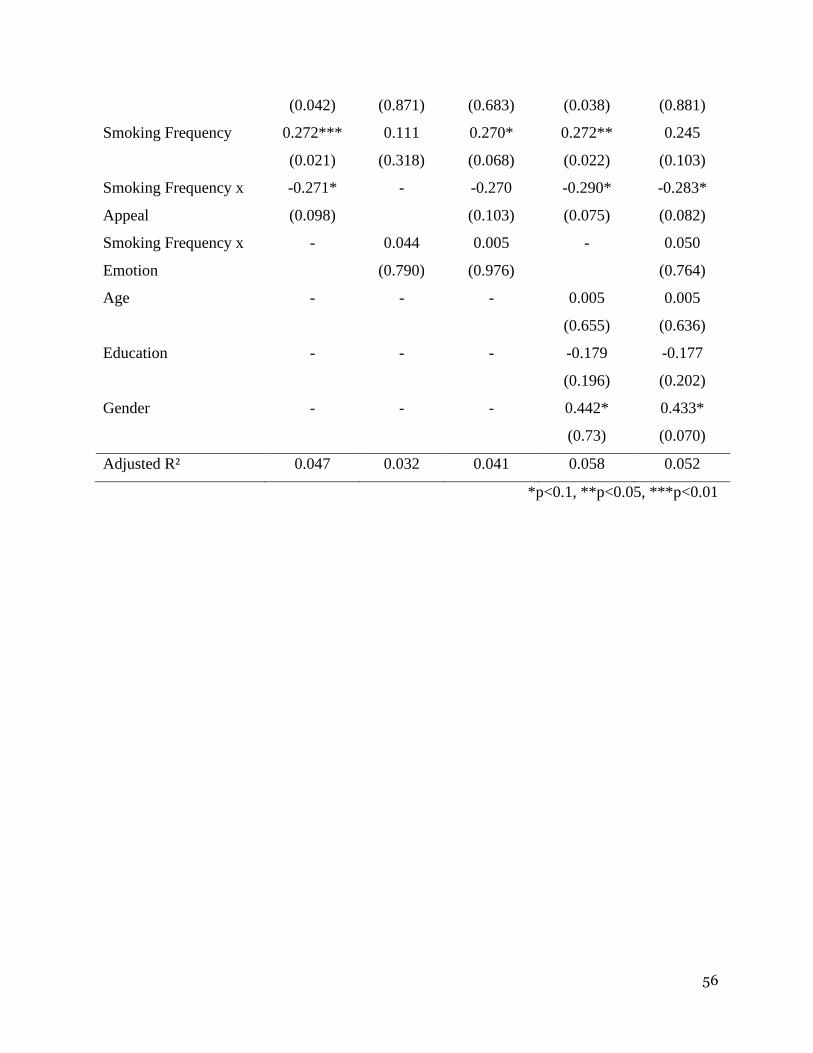
56
(0.042) (0.871) (0.683) (0.038) (0.881)
Smoking Frequency 0.272***
(0.021)
0.111
(0.318)
0.270*
(0.068)
0.272**
(0.022)
0.245
(0.103)
Smoking Frequency x
Appeal
-0.271*
(0.098)
- -0.270
(0.103)
-0.290*
(0.075)
-0.283*
(0.082)
Smoking Frequency x
Emotion
- 0.044
(0.790)
0.005
(0.976)
- 0.050
(0.764)
Age - - - 0.005
(0.655)
0.005
(0.636)
Education - - - -0.179
(0.196)
-0.177
(0.202)
Gender - - - 0.442*
(0.73)
0.433*
(0.070)
Adjusted R² 0.047 0.032 0.041 0.058 0.052
*p<0.1, **p<0.05, ***p<0.01
57
6. Conclusion
6.1 Main Findings
The purpose of this study is to determine to what extent consumers can be nudged to consume less
demerit goods through self- and other benefit appeals in combination with negative and positive
message framing. The reason for studying this is that consuming demerit goods is not only harmful
to consumers themselves but also causes negative external effects, for example deadweight loss.
While the prohibition of demerit goods has shown to be ineffective, nudging has shown promising
results in other areas of research. Nudging has shown to be able to influence the decision-making
of consumers, even when they are under stress. According to the Theory of Planned Behaviour
model, a well-placed nudge can influence consumers’ intentions. The results of this study can be
used for the development of nudging policies. In this study towards the effect of nudging on
demerit goods, smoking has been chosen as a proxy for demerit goods because smoking is one of
the deadliest and most addictive demerit goods. Data was gathered through an online survey on
Prolific, where four different treatments were tried on participants to capture the effects of self-
benefit & other-benefit appeals and negative and positive message framing on purchase intention.
Purchase intention is used as a proxy in this study because it reflects smoking intention well. In
this paragraph the following research question will be answered:
“To what extent can consumers be nudged to consume less demerit goods through self- and other-
benefit appeals in combination with negative and positive message framing?”
Results show that appeal has significant effect on purchase intention in certain models.
When exposed to a negatively framed message, a self-benefit appeal leads to a lower purchase
intention compared to an other-benefit appeal. Appeal also significant has a significant effect on
purchase intention for respondents who are exposed to a positively framed message when habit or
control variables were taken into account. This is the opposite effect as this study has hypothesized.
The effect of emotion through message framing is strongly significant in all models. Negatively
framed messages lead to a lower purchase intention compared to positively framed messages. This
effect is contrary to the hypothesized effect stating that a positively framed message leads to a
lower purchase intention. However, the interaction effect between a positively framed and other-
benefit appeal seems to lead to a lower purchase intention as shown in table 15. Nevertheless, the
58
lowering effect due to the interaction effect between both nudges is not enough to overcome the
separate effects.
Habit appears to have a significant effect on purchase intention. The stronger a habit is, the
lower the purchase intention is. A possible explanation for this is that the majority of smokers who
filled in the survey started smoking because they liked trying new things and stumbled upon
smoking. It was hypothesized that habit had a moderating effect on both appeal and emotion.
However, habit appears to have no moderating effect. For appeal, the absence of this effect might
be caused by insufficient statistical power of the model because after adding an interaction effect,
both variables (appeal and interaction) become strongly insignificant as shown in table 16. In
contrast to appeal, emotion is strongly robust in all models and shows no sign of moderation by
habit. Additionally, this study hypothesized that social norms act as a mediation variable between
appeal and purchase intention. Based on Hayes’ PROCESS model 4 none of the paths (a, b, c’ and
c) show significant results. Though based on literature it was expected that social norms had a
significant effect, in this study it appears to be insignificant. A possible explanation for this is that
the studies used in the theoretical framework used real-life experiments to measure social norms
(e.g. in a hotel or a coffee bar) while this study relied on self-reporting.
In all models the constant parameter is overall relatively large, this suggests people tend to
keep smoking no matter what you present them. Yet, one of the treatments has shown to be quite
effective at decreasing the purchase intention by nearly a whole digit. Out of all four treatments, a
negatively framed self-benefit appeal leads to the lowest purchase intention. This suggests that
purchase intention of consumers with respect to demerit goods can be nudged to a certain extent.
In addition, one could state that consumers are quite selfish in general regarding demerit goods
due to the fact that a negatively framed self-benefit appeal is most effective in decreasing purchase
intention.
6.2 Academic Implications
This study contributes to the knowledge of using self-benefit and other-benefit appeals. It is shown
that other-benefit appeals are more effective than self-benefit in other areas of research such as
charity and environmental issues. While there were indications that other-benefit appeals were
effective in the area of health (Agrawal et al. 2007, Vietri et al. 2012), this study has shown that
other-benefit appeals are not always preferred. Based on this study, one should be reluctant to
59
apply other-benefit nudges in the area of health policies. Chapter 6.5 discusses which further
research is required to determine what factors might have reversed the effect of other-benefit
appeals in this study. This study also contributes to literature by showing that a negatively framed
message is more effective. While many studies suggest an approach through a positively framed
message (Block & Keller, 1995; Paese, 1995; Chang & Lee, 2009; Chang, 2007; Rothman &
Salovey, 1997), it is important to keep in mind that this is not always the case. For example,
Meyerowitz and Chaiken (1987) have shown that negative framing was more effective for breast
cancer research turnout. Whereas Chang (2008) have shown that positive framing was more
effective for preventive mouth care. It could be that certain health messages benefit better from
negative framing because the consequences are direr such as breast cancer and lung cancer due to
smoking compared to a tooth cavity which can be easily fixed. Additional research is needed to
explore these differences.
In addition, this study has found evidence to support findings from Brunel & Nelson (2000)
that females are more prone to other-benefit appeals. However, additional analysis is required to
optimize this effect since the interaction effect between gender other-benefit appeal effect was not
large enough to overcome a higher initial purchasing intention for females and the additional
increase in purchase intention due to other-benefit appeal. Furthermore, this study contributes to
existing literature by demonstrating a significant effect of smoking frequency on purchase
intention, where higher smoking frequency leads to a lower purchase intention if an other-appeal
benefit is used. Based on this effect it can be assumed that consumption frequency moderates the
effect of self-benefit and other-benefit appeals. However, similar to gender, the total effect is not
large enough to overcome the increase of purchase intention due to other-benefit appeal and
therefore additional analysis is required.
6.3 Managerial Implications
For policymakers, this study can act as a guideline on decreasing the consumption of demerit goods
through nudges. Warning messages as a nudge are a non-intrusive cost-efficient tool. While both
characteristics are relevant, cost-efficiency is crucial for third world countries which are battling
an increase in the number of smokers among younger citizens. Based on the results, this study
advises policymakers to design a negatively framed self-benefit appeal nudge to reduce smoking
intention. More concrete, for third world countries policymakers in general this study indicates
60
that printing negatively framed self-benefit messages on tobacco packages would lead to a lower
number of smokers. For other policymakers in countries that are already using warning messages
on tobacco package, this study indicates that policy should be aimed at emphasizing negatively
framed self-benefit messages as much as possible since they are proven to be more efficient.
In addition, whilst this study focuses on smokers, it should be emphasized once again that
this study can be used as an extension to policies regarding the deconsumption of other demerit
goods such as alcohol because of the common characteristics of demerit goods. By lowering the
consumption of demerit goods, not only negative externalities such as costs of healthcare, higher
crime rates and lower productivity are limited, but lives will be saved as well.
6.4 Limitations
First of all, this study is limited by its sample size. While in general, a bigger sample size nearly
always increases reliability, in this study there were concrete indications that it could have
benefited from a bigger sample size. For example, after adding interaction effects between
variables, sometimes signs of multicollinearity appeared. This led to preliminary conclusions such
as no significant moderating effects. These effects can be overcome by a bigger sample size.
Another limitation regarding the data is that there is a self-selection bias. Respondents were
gathered through Prolific where individuals were allowed to decide for themselves whether they
wanted to participate or not. This might distort the outcomes compared to random sampling. In
addition, the external validity of the results might be influenced by the fact that the experiment is
done in a lab setting. Individuals might behave differently in a lab in compared to real-life
situations. For example, social norms might have had a different effect in an in-store public setting
where participants would have felt that they are being watched. In addition to the lab setting, filling
in a survey induces a self-reporting bias. When respondents are asked for how they behave in
certain situations (e.g. social norms) they are more likely to describe their own experiences instead
of inferring from objective observations. Other interferences might that respondents give socially
desirable answers in the survey, as well as their state of mood while participating. This decreases
the reliability of data.
One should be careful with generalizing and extrapolating these findings to other demerit
goods. While demerit goods have similar characteristics, effects might differ between goods.
Another limitation of this study is that only one message is designed per treatment, the effect of
61
the manipulations depends on this message. It could be that there are other underlying factors
which are of influence on the effectivity of the message. For example, in this study the other-
benefit appeal focuses on friends and family. It could be that certain participants do not care about
friends at family at all, rendering the message ineffective. For these participants, a message for
example about building a better world could have been more effective.
6.5 Further research
Whilst control variables were not in the main scope of this study, both gender and smoking
frequency have shown interesting outcomes. Appeal and emotion became increasingly significant
after adding gender as a control variable, where females had a higher intention to smoke.
Furthermore, results show evidence that females are more prone to other-benefit appeals.
However, the interaction effect between gender and other-benefit appeal in this study was not large
enough to overcome a higher initial purchasing intention for females and the additional increase
in purchase intention due to other-benefit appeal. Due to this, it would be interesting to run
additional studies with different messages to see if an other-benefit appeal could be optimized to
the point where the interaction effect between gender and appeal outweighs their direct effects. To
achieve this, one could try further optimizing the other-appeal message focus used in this study,
which focuses on friends and family. Alternatively, one could opt for an other-benefit appeal
message that does not emphasize the effect on friends and family, such as climate change. This
increase in message effectivity could also benefit the potential moderating effect of consumption
frequency which suffers from the same limitations.
If a future study manages to design a more effective message, the fact that females are more
prone to other-benefit appeals could be leveraged. For example, a ratio of self-benefit and other-
benefit appeals could be used corresponding to the gender composition of the consumers in a
country. In situations where distinction based on gender can be made regarding the purchasing of
demerit goods, negatively framed other-benefit appeals should be used for females and negatively
framed self-benefit appeals for males. Second, by successfully developing a more effective
message consumption frequency can also be used for additional finetuning of policy guidelines.
Smokers with a high smoking frequency have shown to be more prone to other-benefit appeals.
This suggests that consumers who consume demerit goods frequently should be targeted through
a negatively framed other-benefit appeal. This becomes particularly relevant when we assume that
62
individuals with a high smoking frequency are responsible for a bigger share of healthcare costs.
Therefore, further research into both variables, their efficacy with different messages and how they
can be used to decrease the consumption of demerit goods could act as an additional guideline for
policymakers.
Furthermore, rerunning this experiment with other demerit goods such as alcohol or junk
food could lead to interesting results. It might be that the effects are similar to the effects found in
this study or different, both outcomes would be interesting. This only explains how the nudges
behave through different products, but also allows for a more directed expansion into other areas
of interest. Another effect that might be interesting to measure is the addition of graphic images to
the warning message. Graphics could contribute to conveying the message manipulations more
effectively to consumers.
Also, further research into a third form of appeal, a so-called all-benefit appeal might be
interesting. Some participants stated that they experienced an appeal initially as a self- or other-
benefit, but after giving it a second thought the opposed benefit appeal came into consideration as
well. For example, an other-benefit appeal might focus on the health of your family, but the health
of family can be a factor of an individual’s own health (e.g. mental wellbeing) as well and vice
versa. Messages which call upon this all-appeal phenomena could be more effective. Building
upon this idea, additional factors could be included in future research in order to try to explain
differences between the effectiveness of appeals. For example, personality traits could be an
explanation for why nudges affect respondents in a certain way (e.g. certain personality traits are
more susceptible to certain emotions). Another important factor could be cultural differences, as
some cultures might be more focused on the collective while other cultures focus more on the
individual. This would give additional insights into why some manipulations sort effect and why
others do not.
63
References
Aarts, H., Verplanken, B., & Knippenberg, A. (1998). Predicting behavior from actions in the past:
Repeated decision making or a matter of habit?. Journal of Applied Social Psychology, 28(15),
1355-1374.
Abrams, L. (2012). Obesity campaigns: The fine line between educating and shaming. The
Atlantic. Retrieved March 17, 2015 from http://www.theatlantic.com/health/archive/
2012/09/obesity-campaigns-the-fine-line-between-educating-and-shaming/262401/.
Agaku, I. T., Filippidis, F. T., & Vardavas, C. I. (2015). Effectiveness of text versus pictorial health
warning labels and predictors of support for plain packaging of tobacco products within the
European Union. European addiction research, 21(1), 47-52.
Aghenta, E. B. (2014). Using the theory of planned behavior to explain physical activity among
college students.
Agrawal, N., Menon, G., Aaker, J.L. (2007) „Getting emotional about health‟, Journal of
marketing research, 44, 1: pp. 100-113.
Ajzen, I. (1991). The theory of planned behavior. Organizational behavior and human decision
processes, 50(2), 179-211.
Ajzen, I. (2015). The theory of planned behaviour is alive and well, and not ready to retire: a
commentary on Sniehotta, Presseau, and Araújo-Soares. Health psychology review, 9(2), 131-
137.`
Ajzen, I., Czasch, C., & Flood, M. G. (2009). From intentions to behavior: Implementation
intention, commitment, and conscientiousness1. Journal of Applied Social Psychology, 39(6),
1356- 1372.
Anderton A. (2006). Economics, Delhi: Dorling Kindersley
Argo, J.J., White, K., Dahl, D.W. (2006) „Social comparison theory and deception in the
interpersonal exchange of consumption information‟, Journal of consumer research, 33, 1: pp. 99-
108.
64
Baguley, T. (2009). Standardized or simple effect size: What should be reported?. British journal
of psychology, 100(3), 603-617.
Banks, E., Joshy, G., Weber, M. F., Liu, B., Grenfell, R., Egger, S., ... & Beral, V. (2015). Tobacco
smoking and all-cause mortality in a large Australian cohort study: findings from a mature
epidemic with current low smoking prevalence. BMC medicine, 13(1), 38.
Baron, R. M., & Kenny, D. A. (1986). The moderator–mediator variable distinction in social
psychological research: Conceptual, strategic, and statistical considerations. Journal of personality
and social psychology, 51(6), 1173.
Bateson, M., Nettle, D., & Roberts, G. (2006). Cues of being watched enhance cooperation in a
real-world setting. Biology letters, 2(3), 412-414.
Batson C.D. (2009). Empathy-induced altruistic motivation. In Shaver P. R. & Mikulincer M.
(Eds.), Prosocial motives, emotions, and behavior (pp. 15–34). Washington DC: American
Psychological Association,
Baumann, S., Gaertner, B., Schnuerer, I., Haberecht, K., John, U., & Freyer-Adam, J. (2015).
Belief incongruence and the intention–behavior gap in persons with at-risk alcohol use. Addictive
behaviors, 48, 5-11.
Bergkvist, L., & Rossiter, J. R. (2007). The predictive validity of multiple-item versus single-item
measures of the same constructs. Journal of marketing research, 44(2), 175-184.
Bizer, G. Y., Larsen, J. T., & Petty, R. E. (2011). Exploring the valence‐framing effect: Negative
framing enhances attitude strength. Political psychology, 32(1), 59-80.
Blau, P. M. (1964). Exchange and Power in Social Life. Wiley, New York,
Block, L. G., & Keller, P. A. (1995). When to accentuate the negative: The effects of perceived
efficacy and message framing on intentions to perform a health-related behavior. Journal of
marketing research, 32(2), 192-203.
Bordens, K. S. & Abbott, B. B.: Research Design and Methods A process approach, 2011.
McGraw-Hill. ISBN: 0072887648.
65
Borer, D. (2018). Estimating the Welfare Loss due to Vehicle Tariffs in Malaysia.
Borooah V. K. (2003). Market Failure: An Economic Analysis of its Causes and Consequences
Bovens, L. (2009). The Ethics of Nudge. In T. Grüne-Yanoff & S.O. Hansson (eds.), Preference
change: Approaches from philosophy, economics and psychology (pp. 207-220). Springer.
Brunel, F.F., Nelson, M.R. (2000) „Explaining gendered responses to “help-self” and “help-
others” charity ad appeals‟, Journal of advertising, 29, 3: pp. 15-28.
Bruner, G.C., James, K.E. and Hensel, P.J. (2001). Marketing scales handbook: a compilation of
multi-item measures. Cincinnati, OH: South-Western Educational Pub, Vol.3, 84-93 and 722-729.
Bucher, T., Collins, C., Rollo, M. E., McCaffrey, T. A., De Vlieger, N., Van der Bend, D., ... &
Perez-Cueto, F. J. (2016). Nudging consumers towards healthier choices: a systematic review of
positional influences on food choice. British Journal of Nutrition, 115(12), 2252-2263.
Burnham, T.C., Hare, B. (2007) „Engineering human cooperation: does involuntary neural
activation increase public goods contributions?‟, Human nature, 18, 2: pp. 88-108.
Carifio, J., & Perla, R. (2008). Resolving the 50‐year debate around using and misusing Likert
scales. Medical education, 42(12), 1150-1152.
Carrigan, M., & Attalla, A. (2001). The myth of the ethical consumer-do ethics matter in purchase
behaviour? Journal of Consumer Marketing, 18(7), 560–577
Carrington, M. J., Neville, B. A., & Whitwell, G. J. (2014). Lost in translation: Exploring the
ethical consumer intention–behavior gap. Journal of Business Research, 67(1), 2759-2767.
Chang, C. T. (2007). Health‐care product advertising: The influences of message framing and
perceived product characteristics. Psychology & Marketing, 24(2), 143-169.
Chang, C. T. (2008). To donate or not to donate? Product characteristics and framing effects of
cause‐related marketing on consumer purchase behavior. Psychology & Marketing, 25(12), 1089-
1110.
66
Chang, C.T. & Lee, Y.K. (2009). Framing charity advertising: influences of message framing,
image valence, and temporal framing on a charitable appeal. Journal of Applied Social
Psychology, 2009, 39 (12), 2910-2935.
Child, D. (2006). The essentials of factor analysis. A&C Black.
Churchill Jr, G. A. (1979). A paradigm for developing better measures of marketing constructs.
Journal of marketing research, 16(1), 64-73.
Cole, C., Laurent, G., Drolet, A., Ebert, J., Gutchess, A., Lambert-Pandraud, R., ... & Peters, E.
(2008). Decision making and brand choice by older consumers. Marketing Letters, 19(3-4), 355-
365.
Cook, T. D., Campbell, D. T., & Shadish, W. (2002). Experimental and quasi-experimental designs
for generalized causal inference. Boston, MA: Houghton Mifflin.
Cooke, R., & French, D. P. (2008). How well do the theory of reasoned action and theory of
planned behaviour predict intentions and attendance at screening programmes? A meta-analysis.
Psychology & Health, 23, 745–765. doi:10.1080/08870440701544437
Cooke, R., Dahdah, M., Norman, P., & French, D. P. (2014). How well does the theory of planned
behaviour predict alcohol consumption? A systematic review and metaanalysis. Health
Psychology Review, 1–20. http://dx.doi.org/10.1080/17437199.2014. 947547
Cornwell, J. F., & Krantz, D. H. (2014). Public policy for thee, but not for me: Varying the
grammatical person of public policy justifications influences their support. Judgment and Decision
Making, 5, 433–444.
Cox, D., & Cox, A. D. (2001). Communicating consequences of early detection: The role of
evidence and framing. Journal of Marketing, 65, 91–103
Czoli, C. D., Goniewicz, M., Islam, T., Kotnowski, K., & Hammond, D. (2016). Consumer
preferences for electronic cigarettes: results from a discrete choice experiment. Tobacco Control,
25(e1), e30-e36.
67
Danner, U. N., Aarts, H., & Vries, N. K. (2008). Habit vs. intention in the prediction of future
behaviour: The role of frequency, context stability and mental accessibility of past behaviour.
British Journal of Social Psychology, 47(2), 245-265.
De Bruijn, G. J., Kremers, S. P., De Vet, E., De Nooijer, J., Van Mechelen, W., & Brug, J. (2007).
Does habit strength moderate the intention–behaviour relationship in the Theory of Planned
Behaviour? The case of fruit consumption. Psychology and Health, 22(8), 899-916.
Dills, A. K., Jacobson, M., & Miron, J. A. (2005). The effect of alcohol prohibition on alcohol
consumption: evidence from drunkenness arrests. Economics Letters, 86(2), 279-284.
Dodds, W. B., Monroe, K. B., & Grewal, D. (1991). Effects of price, brand, and store information
on buyers’ product evaluations. Journal of marketing research, 28(3), 307-319.
Echegaray, F., & Hansstein, F. V. (2017). Assessing the intention-behavior gap in electronic waste
recycling: the case of Brazil. Journal of Cleaner Production, 142, 180-190.
Field, A. (2013). Discovering statistics using IBM SPSS statistics. sage.
Fisher, R. J., & Dubé, L. (2005). Gender differences in responses to emotional advertising: A social
desirability perspective. Journal of Consumer Research, 31(4), 850-858.
Fisher, Robert & Vandenbosch, Mark & Antia, Kersi. (2008). An Empathy-Helping Perspective
on Consumers' Responses to Fund-Raising Appeals. Journal of Consumer Research. 35. 519-531.
Furedi, F. (2011, January 20). ‘Defending moral autonomy against an army of nudgers.’ Spiked.
Retrieved from http://www.spiked-online.com/newsite/article/10102#.VE90J_nF9pt
Gajalakshmi, V., & Kanimozhi, C. V. (2010). A survey of 24,000 students aged 13–15 years in
India: Global Youth Tobacco Survey 2006 and 2009. Tobacco Use Insights, 3,
1179173X1000300001.
Gallagher R (2012) Applying Behavioural Insights to Reduce Fraud, Error and Debt. London:
British Academy
Ganzach, Y., & Karsahi, N. (1995). Message framing and buying behavior: a field experiment.
Journal of Business Research, 32, 11–17.
68
Godin, G., & Kok, G. (1996). The theory of planned behavior: A review of its applications in
health-related behaviors. American Journal of Health Promotion, 11, 87-98.
Goldstein, N. J., Cialdini, R. B., & Griskevicius, V. (2008). A room with a viewpoint: Using social
norms to motivate environmental conservation in hotels. Journal of consumer Research, 35(3),
472-482.] highlighting the behavior of others
Green, T., & Peloza, J. (2014). Finding the right shade of green: The effect of advertising appeal
type on environmentally friendly consumption. Journal of Advertising, 43(2), 128-141.
Grewal, D., Gotlieb, J., & Marmorstein, H. (1994). The moderating effects of message framing
and source credibility on the price-perceived risk relationship. Journal of Consumer Research, 21,
145–153
Griskevicius, V., Tybur, J.M., Van den Bergh, B. (2009) „Going green to be seen: status,
reputation, and conspicuous conservation‟, Journal of personality & social psychology,
forthcoming.
Hagger, M. S., Chatzisarantis, N. L. D, & Biddle, S. J. H. (2002). A meta-analytic review of the
theories of reasoned action and planned behavior in physical activity: Predictive validity and the
contribution of additional variables. Journal of Sports & Exercise Psychology, 24, 3–32.
Hagman, W., Andersson, D., Vastfjall, D., & Tinghog, G. (2015). Public views on policies
involving nudges. Review of Philosophy and Psychology, 6, 439–453.
Haley, K.J., Fessler, D.M.T. (2005) „Nobody‟s watching? Subtle cues affect generosity in an
anonymous economic game‟, Evolution and human behavior, 26: pp. 245-256.
Hansen, P.G. & Jespersen, A.M. (2013). Nudge and the manipulation of choice: A framework for
the responsible use of the nudge approach to behavior change in public policy. European Journal
of Risk Regulation. 1. 3-28.
Hardeman, W., Johnston, M., Johnston, D., Bonetti, D., Wareham, N., & Kinmonth, A. L. (2002).
Application of the theory of planned behaviour in behaviour change interventions: A systematic
review. Psychology and health, 17(2), 123-158.
69
Hausman, D.M. & Welch, B. (2010). Debate: To nudge or not to nudge. Journal of Political
Philosophy, 18(1), 123-136.
Hayes, A. F. (2017). Introduction to mediation, moderation, and conditional process analysis: A
regression-based approach. Guilford publications..
Hayes, Andrew F and Michael Scharkow(2013), “The Relative Trustworthiness of Inferential
Tests of the Indirect Effect in Statistical Mediation Analysis: Does Method Really Matter?,”
Psychological Science, 24 (10), 1918-27.
Henderikx, M. A., Kreijns, K., & Kalz, M. (2017). Refining success and dropout in massive open
online courses based on the intention–behavior gap. Distance Education, 38(3), 353-368.
Hitchman, S. C., Mons, U., Nagelhout, G. E., Guignard, R., Mcneill, A., Willemsen, M. C., ... &
Pötschke-Langer, M. (2012). Effectiveness of the European Union text-only cigarette health
warnings: findings from four countries. The European Journal of Public Health, 22(5), 693-699.
Holmes, J.G., Miller, D.T, Lerner, M.J. (2002) „Committing altruism under the cloak of self-
interest: the exchange fiction‟, Journal of experimental social psychology, 38, 2: pp. 144-151.
Hume, S. (1991). Consumer doubletalk makes companies wary. Advertising Age, 62(46), 62-64.
John, P., Smith, G. & Stoker, G. (2009). Nudge, nudge, think, think: Two strategies for changing
civic behavior. The Political Quarterly. 80(3). 361-370.
Johnson E and Goldstein D (2003) Do defaults save lives? Science 302(5649): 1338–9.
Kahneman, D. (2011). Thinking, fast and slow. London: Penguin Books Ltd
Kanouse, David (1984), "Explaining Negativity Biases in Evalua- tion and Choice Behavior:
Theory and Research," in Advances in Consumer Research, T. Kinnear, ed., Provo, UT:
Association for Consumer Research, 703-70
Kareklas, I., Carlson, J. R., & Muehling, D. D. (2014). I eat organic for my benefit and yours:
Egoistic and altruistic considerations for purchasing organic food and their implications for
advertising strategists. Journal of Advertising,
70
Kashima, Y., Gallois, C., & McCamish, M. (1993). The theory of reasoned action and co-operative
behaviour: It takes two to use a condom. British Journal of Social Kendzierski, D. (1990a).
Khare, A., & Inman, J. J. (2006). Habitual behavior in American eating patterns: The role of meal
occasions. Journal of Consumer Research, 32(4), 567-575.
Kleinpaste, T. (2013, July 20). Stiekem burgers manipuleren: Van urinoir tot orgaandonatie.bNRC
Next Opinie & Debat Wetenschap. 1-2.
Koch, J. V. (2008). The relative decline of a Musgrave ‘Merit Good:’the case of public support of
flagship public universities. Journal of Economics and Finance, 32(4), 368-379.
Kollmuss, A., & Agyeman, J. (2002). Mind the gap: why do people act environmentally and what
are the barriers to pro-environmental behavior?. Environmental education research, 8(3), 239-260.
Kosters, M., & Van der Heijden, J. (2015). From mechanism to virtue: Evaluating Nudge theory.
Evaluation, 21(3), 276-291.
Kroese, F. M., Marchiori, D. R., & de Ridder, D. T. (2016). Nudging healthy food choices: a field
experiment at the train station. Journal of Public Health, 38(2), e133-e137.
Kung, F. Y., Kwok, N., & Brown, D. J. (2018). Are attention check questions a threat to scale
validity?. Applied Psychology, 67(2), 264-283.
Kutner M.H., Nachtsheim C.J., Neter J., Li W. & Wasserman W. (2004) Applied linear statistical
models. 5th ed. Boston, MA: McGraw Hill Higher Education.
Leary, M.R., Kowalski, R.M. (1990) „Impression management: a literature review and two-
component model‟, Psychological bulletin, 107, 1: pp. 24-47.
Lipsey R. G., Harbury C. (1993). First principles of Economics, Oxford: Oxford University Press.
List JA, Sadoff S, Wagner M. So you want to run an experiment, now what? Some simple rules of
thumb for optimal experimental design. Experimental Economics. 2011;14(4):439–457.
Mackie, B. (2014). Warning fatigue: Insights from the Australian bushfire context.
71
Madden, Gregory (2000), "A Behavioral Economics Primer," in Reframing Health Behavior
Change with Behavioral Econom- ics, Warren Bickel and Rudy Vuchinich, eds. Mahwah, NJ:
Lawrence Erlbaum Associates, 3-21
Madrian, B. C., & Shea, D. F. (2001). The power of suggestion: Inertia in 401 (k) participation
and savings behavior. The Quarterly journal of economics, 116(4), 1149-1187.
Maheswaran, D., & Meyers-Levy, J. (1990). The influence of message framing and issue
involvement. Journal of Marketing research, 27(3), 361-367.
Mahila Chetna Manch, Two child policy and its implications for women, unpublished report
prepared for the Ministry of Health and Family Welfare, Bhopal, India, 2004.
Mandese, J. (1991). New study finds green confusion. Advertising Age, 62(45), 1-2.
Martin, B., & Marshall, R. (1997). The interaction of message framing and felt involvement in the
context of cell phone commercials. European Journal of Marketing, 33(1), 206– 218.
McCormick, B., Stone, I., & Corporate Analytical Team. (2007). Economic costs of obesity and
the case for government intervention. Obesity reviews, 8, 161-164.
McEachan, R. R. C., Conner, M., Taylor, N. J., & Lawton, R. J. (2011). Prospective prediction of
health-related behaviours with the theory of planned behaviour: A meta-analysis. Health
Psychology Review, 5(2), 97–144. doi:10.1080/17437199.2010.521684
Mendoza, R. L. (2011). Merit goods at fifty: reexamining Musgrave’s theory in the context of
health policy. Review of Economic and Business Studies, 4(2), 275-284.
Meyerowitz, B. E., & Chaiken, S. (1987). The effect of message framing on breast selfexamination
attitudes, intentions, and behavior. Journal of personality and social psychology, 52(3), 500.
Mitchell, A. A., & Olson, J. C. (1981). Are product attribute beliefs the only mediator of
advertising effects on brand attitude?. Journal of marketing research, 18(3), 318-332.
Mitchell, G. (2005). Libertarian paternalism is an oxymoron. Northwestern University Law
Review. 99(3). 1245-1277.
72
Musgrave, R.A., 1956, September. A multiple theory of budget determination. Finanzarchiv 333–
343.
Nayak, S., Balasubramaniam, V., & Kané, A. P. (2019). Surrogate Advertising: A Clandestine
Attempt at Influencing People's Choices–The Indian Perspective. In The Role of Language and
Symbols in Promotional Strategies and Marketing Schemes (pp. 144-160). IGI Global.
Norman, G. (2010). Likert scales, levels of measurement and the “laws” of statistics. Advances in
health sciences education, 15(5), 625-632.
Oppenheimer, D. M., Meyvis, T., & Davidenko, N. (2009). Instructional manipulation checks:
Detecting satisficing to increase statistical power. Journal of experimental social psychology,
45(4), 867-872.
Orbell, S., & Sheeran, P. (1998). “Inclined abstainers”: A problem for predicting health-related
behaviour. British Journal of Social Psychology, 37, 151-65
Paese, P.W. (1995), “Effects of framing on actual time allocation decisions”, Organizational
Behavior and Human Decision Processes, Vol. 61 No. 1, pp. 67-76.
Parker, D. (2002). Economic regulation: a review of issues. Annals of Public and Cooperative
Economics, 73(4), 493-519.
Payne, J.W. (1982). Contingent decision behavior. Psychological Bulletin. 92(2). 382-402.
Peer, E., Brandimarte, L., Samat, S., & Acquisti, A. (2017). Beyond the Turk: Alternative
platforms for crowdsourcing behavioral research. Journal of Experimental Social Psychology, 70,
153-163.
Peloza, J., White, K., & Shang, J. (2013). Good and guilt-free: The role of self-accountability in
influencing preferences for products with ethical attributes. Journal of Marketing, 77(1), 104-119.
Pessemier, E. a, Bemmaor, A. C., & Hanssens, D. M. (1977). Willingness to supply human body
parts: some empirical results. The Journal of Consumer Research, 4(3), 131–140,
Peter, J., & Olson, J. (2008). Consumer Behavior and Marketing Strategy. The McGraw- Hill
companies
73
Peterson, J. B. (2018). 12 rules for life: An antidote to chaos. Random House Canada.
Proctor, R. N. (2013). Why ban the sale of cigarettes? The case for abolition. Tobacco Control,
22(suppl 1), i27-i30.
Raju, P. S. (1980). Optimum stimulation level: Its relationship to personality, demographics, and
exploratory behavior. Journal of consumer research, 7(3), 272-282.
Reed, A. E., Chan, L., & Mikels, J. A. (2014). Meta-analysis of the age-related positivity effect:
age differences in preferences for positive over negative information. Psychology and aging, 29(1),
1.
Rehme, G. (2007). Education, economic growth and measured income inequality. Economica,
74(295), 493-514.
Rhodes, R. E., & de Bruijn, G. J. (2013). How big is the physical activity intention–behaviour gap?
A meta‐analysis using the action control framework. British journal of health psychology, 18(2),
296-309.
Rizzo, M. & Whitman, D. (2008). Little brother is watching you: New paternalism on the slippery
slopes. Arizona Law Review. 51. 685-739.
Robert, H. (1991). Microeconomics and Behaviour. Mcgraw-Hill Publishing Company.
Rothman, A. J., & Salovey, P. (1997). Shaping perceptions to motivate healthy behavior: the role
of message framing. Psychological bulletin, 121(1), 3.
Rothschild, M. L. (1984). Perspectives on Involvement: Current Problems and Future Directions.
Advances in Consumer Research, 11(1), 216–217,
Rouse, S. V. (2015). A reliability analysis of Mechanical Turk data. Computers in Human
Behavior, 43, 304-307.
Schlosser AE, White TB, Lloyd SM. Converting web site visitors into buyers: How website
investment increases consumer trusting beliefs and online purchase intentions. Journal of
Marketing. 2006;70(2):133–148.
74
Seetharaman, P. B. (2004). Modeling multiple sources of state dependence in random utility
models: A distributed lag approach. Marketing Science, 23(2), 263-271.
Selinger, E. & Whyte, K.P. (2011). Is there a right way to nudge? The practice and ethics of choice
architecture. Sociology Compass. 5(10). 923-935.
Shamaskin, A. M., Mikels, J. A., & Reed, A. E. (2010). Getting the message across: Age
differences in the positive and negative framing of health care messages. Psychology and aging,
25(3), 746 citated by ook checken
Shavitt, S., Lowrey, P., & Haefner, J. (1998). Public attitudes toward advertising: More favorable
than you might think. Journal of advertising research, 38(4), 7-22.
Sheeran, P. (2002). Intention—behavior relations: a conceptual and empirical review. European
review of social psychology, 12(1), 1-36.
Sheeran, P., & Webb, T. L. (2016). The intention–behavior gap. Social and personality psychology
compass, 10(9), 503-518.
Shiv, B., Edell, J. A., & Payne, J. W. (1997). Factors affecting the impact of negatively and
positively framed ad messages. Journal of Consumer Research, 24(3), 285-294.
Simpson, Cathy and Rudy Vuchinich (2000), "Temporal Changes in the Value of Objects of
Choice: Discounting, Behavior Pat- terns and Health Behavior," in Reframing Health Behavior
Change with Behavioral Economics, Warren Bickel and Rudy Vuchinich, eds. Mahwah, NJ:
Lawrence Erlbaum Associates, 264-93.
Steenkamp, J. B. E., & Baumgartner, H. (1995). Development and cross-cultural validation of a
short form of CSI as a measure of optimum stimulation level. International Journal of Research in
Marketing, 12(2), 97-104.
Strotz, R. H. (1955). Myopia and inconsistency in dynamic utility maximization. The review of
economic studies, 23(3), 165-180.
Sunstein, C. R. (2014). Nudging: a very short guide. Journal of Consumer Policy, 37(4), 583-588.
75
Sutton, S. (1998). Predicting and explaining intentions and behavior: How well are we doing?.
Journal of applied social psychology, 28(15), 1317-1338.
Thaler, R. H., & Benartzi, S. (2004). Save more tomorrow™: Using behavioral economics to
increase employee saving. Journal of political Economy, 112(S1), S164-S187.
Thaler, R. H., & Sunstein, C. R. (2008). Nudg: Improving decisions about health, wealth, and
happiness. Yale University Press.
Thompson, C. J., & Hirschman, E. C. (1995). Understanding the socialized body: A
poststructuralist analysis of consumers' self-conceptions, body images, and self-care practices.
Journal of consumer research, 22(2), 139-153.
Tversky, Amos and Daniel Kahneman (1981), "The Framing of Decisions and the Psychology of
Choice," Science, 211 (Janu- ary 30), 453-58
U.S. Department of Health and Human Services, Healthy People 2010 (Washington D.C., 2000).
Van Amsterdam, J. G. C., Opperhuizen, A., Koeter, M. W. J., LAGJM, A., & Van den Brink, W.
(2009). Ranking van drugs. Een vergelijking van de schadelijkheid van drugs. RIVM rapport
340001001.
Van Teijlingen, E. R., & Hundley, V. (2001). The importance of pilot studies.
Van Vught, M. (2009) „Averting the tragedy of the commons: using social psychological science
to protect the environment‟, Current directions in psychological science: a journal of the American
Psychological Society, 18, 3: pp. 169-173.
Vartanian, L. R., & Smyth, J. M. (2013). Primum non nocere: obesity stigma and public health.
Journal of bioethical inquiry, 10(1), 49-57.
Ver Eecke, W. (2003). Adam Smith and Musgrave’s concept of merit good. The journal of socio-
economics, 31(6), 701-720.
Vermeir, I., & Verbeke, W. (2006). Sustainable food consumption: Exploring the consumer
“attitude–behavioral intention” gap. Journal of Agricultural and Environmental ethics, 19(2), 169-
194.
76
Verplanken, B., & Wood, W. (2006). Interventions to break and create consumer habits. Journal
of Public Policy & Marketing, 25(1), 90-103.
Vietri, J. T., Li, M., Galvani, A. P., & Chapman, G. B. (2012). Vaccinating to help ourselves and
others. Medical Decision Making, 32(3), 447-458.
Wansink, B., & Chandon, P. (2006). Can “low-fat” nutrition labels lead to obesity?. Journal of
marketing research, 43(4), 605-617.
Webb, T. L., & Sheeran, P. (2006). Does changing behavioral intentions engender behavior
change? A meta-analysis of the experimental evidence. Psychological bulletin, 132(2), 249.
Wilson, A. L., Buckley, E., Buckley, J. D., & Bogomolova, S. (2016). Nudging healthier food and
beverage choices through salience and priming. Evidence from a systematic review. Food Quality
and Preference, 51, 47-64.
Wood, W., & Neal, D. T. (2007). A new look at habits and the habit-goal interface. Psychological
review, 114(4), 843.
Wood, W., & Neal, D. T. (2009). The habitual consumer. Journal of Consumer Psychology, 19(4),
579-592.
Wood, W., Quinn, J. M., & Kashy, D. A. (2002). Habits in everyday life: thought, emotion, and
action. Journal of personality and social psychology, 83(6), 1281.
Young, W., Hwang, K., McDonald, S., & Oates, C. J. (2010). Sustainable consumption: green
consumer behaviour when purchasing products. Sustainable development, 18(1), 20-31.
Zhao, X., Lynch Jr, J. G., & Chen, Q. (2010). Reconsidering Baron and Kenny: Myths and truths
about mediation analysis. Journal of consumer research, 37(2), 197-206.
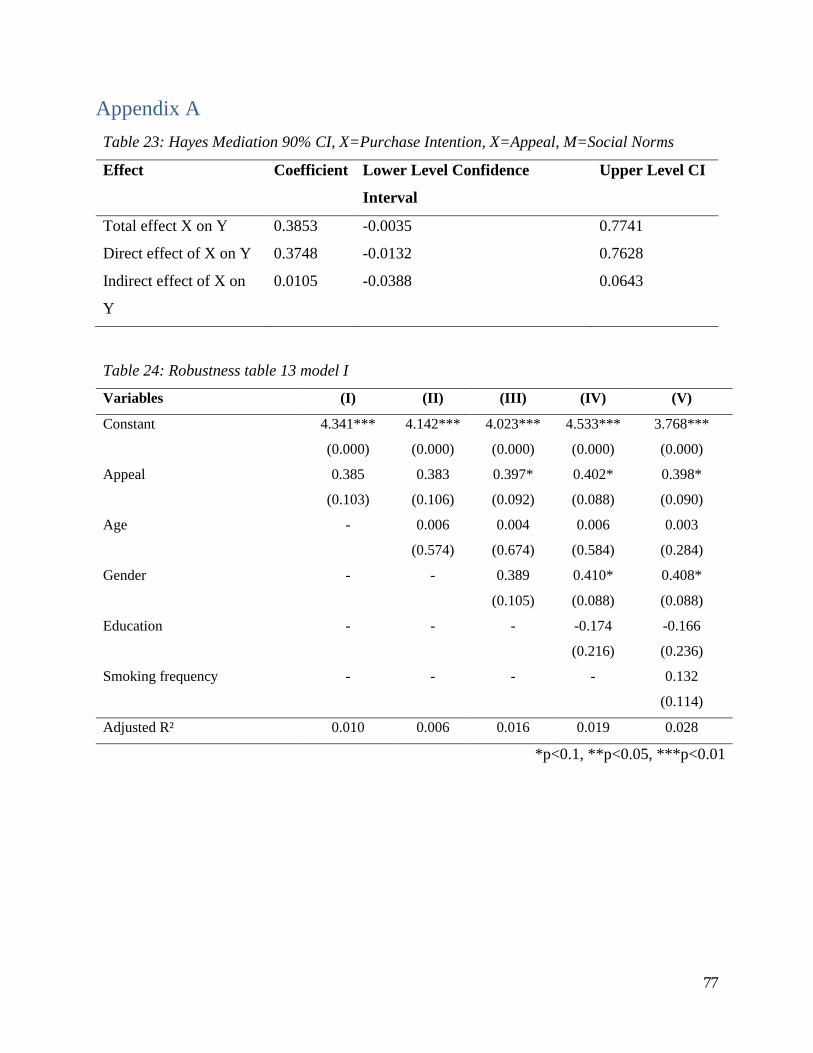
77
Appendix A
Table 23: Hayes Mediation 90% CI, X=Purchase Intention, X=Appeal, M=Social Norms
Effect Coefficient Lower Level Confidence
Interval
Upper Level CI
Total effect X on Y 0.3853 -0.0035 0.7741
Direct effect of X on Y 0.3748 -0.0132 0.7628
Indirect effect of X on
Y
0.0105 -0.0388 0.0643
Table 24: Robustness table 13 model I
Variables (I) (II) (III) (IV) (V)
Constant 4.341***
(0.000)
4.142***
(0.000)
4.023***
(0.000)
4.533***
(0.000)
3.768***
(0.000)
Appeal 0.385
(0.103)
0.383
(0.106)
0.397*
(0.092)
0.402*
(0.088)
0.398*
(0.090)
Age - 0.006
(0.574)
0.004
(0.674)
0.006
(0.584)
0.003
(0.284)
Gender - -
0.389
(0.105)
0.410*
(0.088)
0.408*
(0.088)
Education - - - -0.174
(0.216)
-0.166
(0.236)
Smoking frequency - - - - 0.132
(0.114)
Adjusted R² 0.010 0.006 0.016 0.019 0.028
*p<0.1, **p<0.05, ***p<0.01
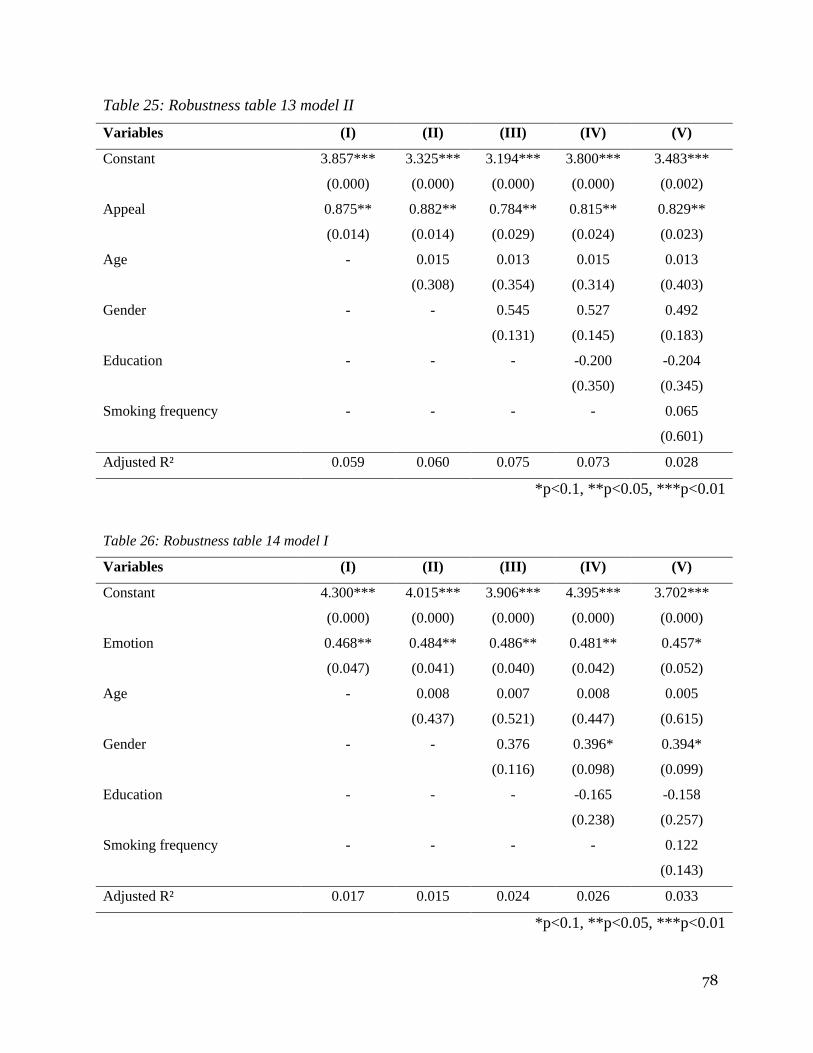
78
Table 25: Robustness table 13 model II
Variables (I) (II) (III) (IV) (V)
Constant 3.857***
(0.000)
3.325***
(0.000)
3.194***
(0.000)
3.800***
(0.000)
3.483***
(0.002)
Appeal 0.875**
(0.014)
0.882**
(0.014)
0.784**
(0.029)
0.815**
(0.024)
0.829**
(0.023)
Age - 0.015
(0.308)
0.013
(0.354)
0.015
(0.314)
0.013
(0.403)
Gender - -
0.545
(0.131)
0.527
(0.145)
0.492
(0.183)
Education - - - -0.200
(0.350)
-0.204
(0.345)
Smoking frequency - - - - 0.065
(0.601)
Adjusted R² 0.059 0.060 0.075 0.073 0.028
*p<0.1, **p<0.05, ***p<0.01
Table 26: Robustness table 14 model I
Variables (I) (II) (III) (IV) (V)
Constant 4.300***
(0.000)
4.015***
(0.000)
3.906***
(0.000)
4.395***
(0.000)
3.702***
(0.000)
Emotion 0.468**
(0.047)
0.484**
(0.041)
0.486**
(0.040)
0.481**
(0.042)
0.457*
(0.052)
Age - 0.008
(0.437)
0.007
(0.521)
0.008
(0.447)
0.005
(0.615)
Gender - -
0.376
(0.116)
0.396*
(0.098)
0.394*
(0.099)
Education - - - -0.165
(0.238)
-0.158
(0.257)
Smoking frequency - - - - 0.122
(0.143)
Adjusted R² 0.017 0.015 0.024 0.026 0.033
*p<0.1, **p<0.05, ***p<0.01
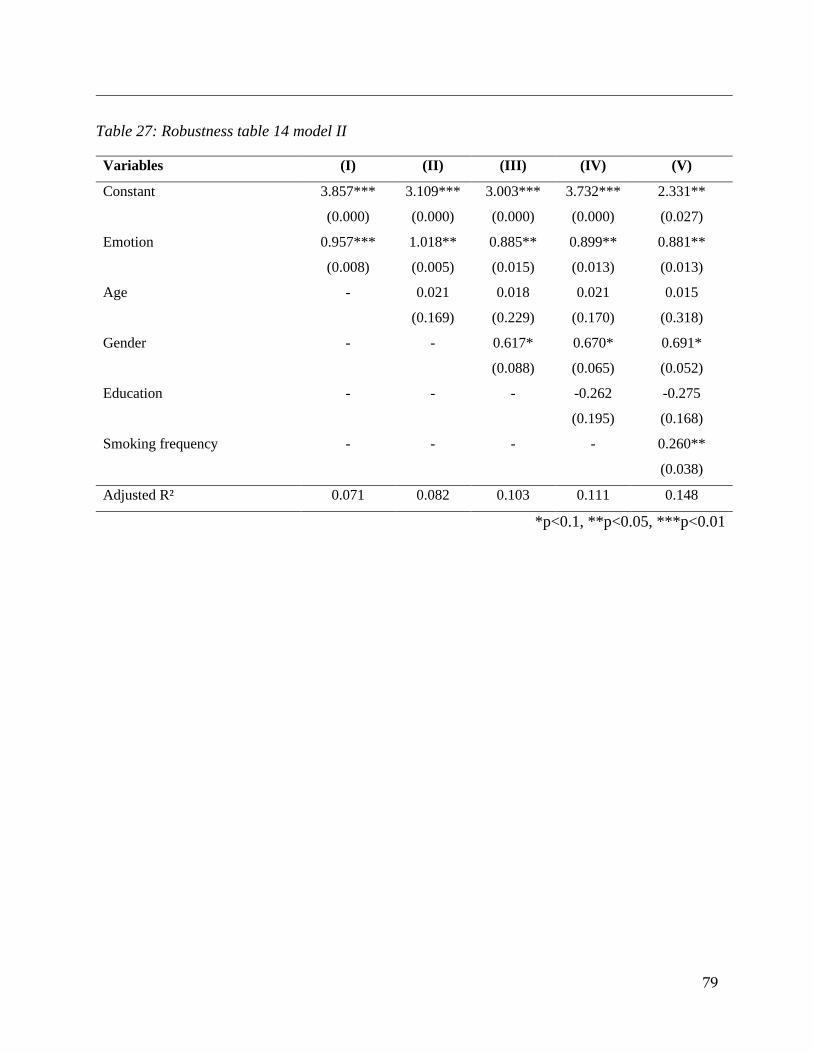
79
Table 27: Robustness table 14 model II
Variables (I) (II) (III) (IV) (V)
Constant 3.857***
(0.000)
3.109***
(0.000)
3.003***
(0.000)
3.732***
(0.000)
2.331**
(0.027)
Emotion 0.957***
(0.008)
1.018**
(0.005)
0.885**
(0.015)
0.899**
(0.013)
0.881**
(0.013)
Age - 0.021
(0.169)
0.018
(0.229)
0.021
(0.170)
0.015
(0.318)
Gender - -
0.617*
(0.088)
0.670*
(0.065)
0.691*
(0.052)
Education - - - -0.262
(0.195)
-0.275
(0.168)
Smoking frequency - - - - 0.260**
(0.038)
Adjusted R² 0.071 0.082 0.103 0.111 0.148
*p<0.1, **p<0.05, ***p<0.01
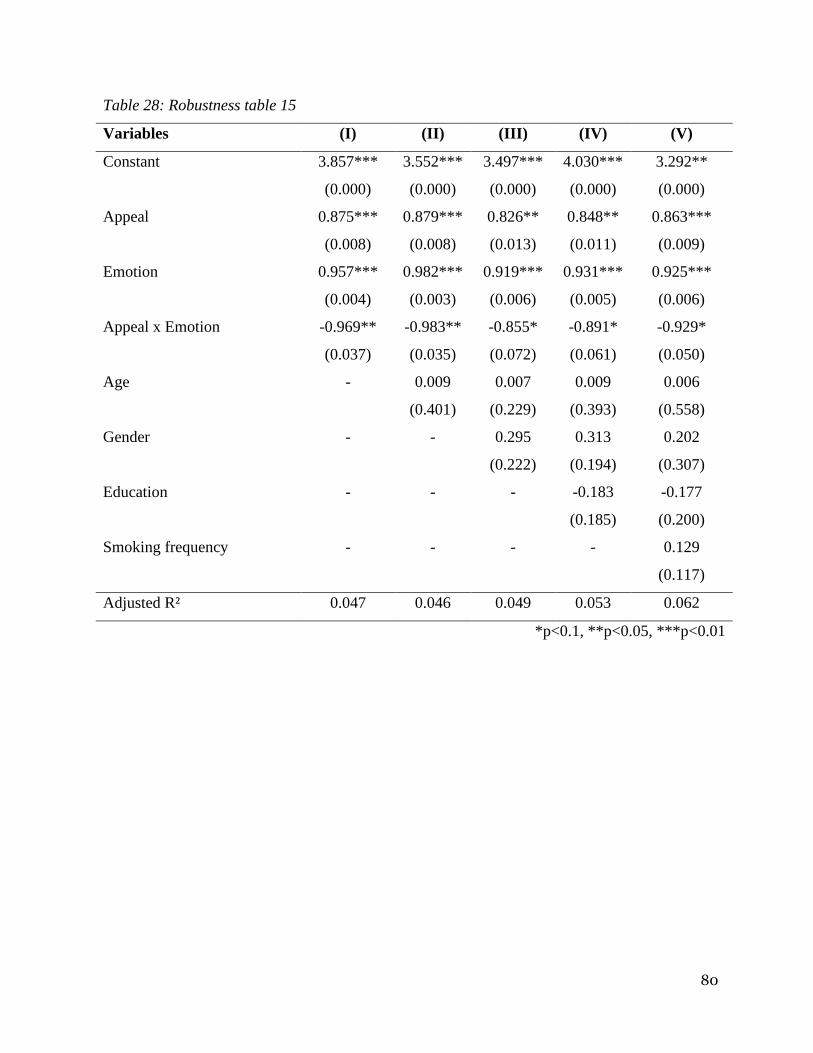
80
Table 28: Robustness table 15
Variables (I) (II) (III) (IV) (V)
Constant 3.857***
(0.000)
3.552***
(0.000)
3.497***
(0.000)
4.030***
(0.000)
3.292**
(0.000)
Appeal 0.875***
(0.008)
0.879***
(0.008)
0.826**
(0.013)
0.848**
(0.011)
0.863***
(0.009)
Emotion 0.957***
(0.004)
0.982***
(0.003)
0.919***
(0.006)
0.931***
(0.005)
0.925***
(0.006)
Appeal x Emotion -0.969**
(0.037)
-0.983**
(0.035)
-0.855*
(0.072)
-0.891*
(0.061)
-0.929*
(0.050)
Age - 0.009
(0.401)
0.007
(0.229)
0.009
(0.393)
0.006
(0.558)
Gender - -
0.295
(0.222)
0.313
(0.194)
0.202
(0.307)
Education - - - -0.183
(0.185)
-0.177
(0.200)
Smoking frequency - - - - 0.129
(0.117)
Adjusted R² 0.047 0.046 0.049 0.053 0.062
*p<0.1, **p<0.05, ***p<0.01
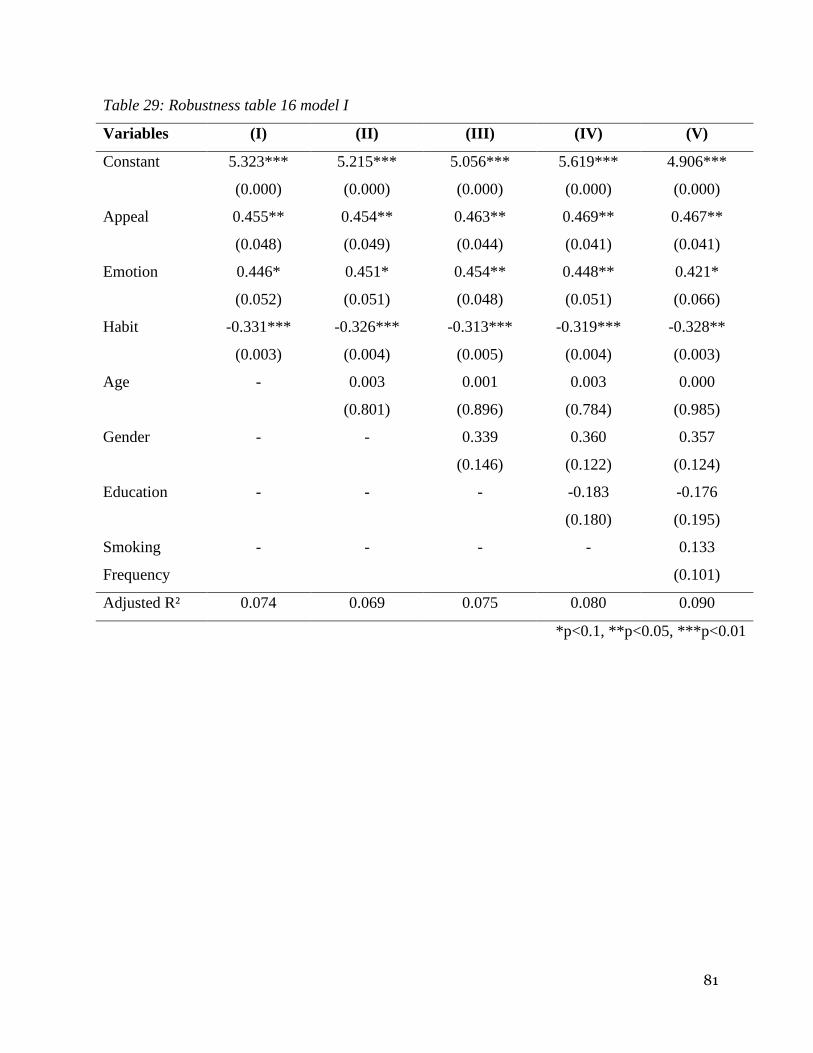
81
Table 29: Robustness table 16 model I
Variables (I) (II) (III) (IV) (V)
Constant 5.323***
(0.000)
5.215***
(0.000)
5.056***
(0.000)
5.619***
(0.000)
4.906***
(0.000)
Appeal 0.455**
(0.048)
0.454**
(0.049)
0.463**
(0.044)
0.469**
(0.041)
0.467**
(0.041)
Emotion 0.446*
(0.052)
0.451*
(0.051)
0.454**
(0.048)
0.448**
(0.051)
0.421*
(0.066)
Habit -0.331***
(0.003)
-0.326***
(0.004)
-0.313***
(0.005)
-0.319***
(0.004)
-0.328**
(0.003)
Age - 0.003
(0.801)
0.001
(0.896)
0.003
(0.784)
0.000
(0.985)
Gender - - 0.339
(0.146)
0.360
(0.122)
0.357
(0.124)
Education - - - -0.183
(0.180)
-0.176
(0.195)
Smoking
Frequency
- - - - 0.133
(0.101)
Adjusted R² 0.074 0.069 0.075 0.080 0.090
*p<0.1, **p<0.05, ***p<0.01
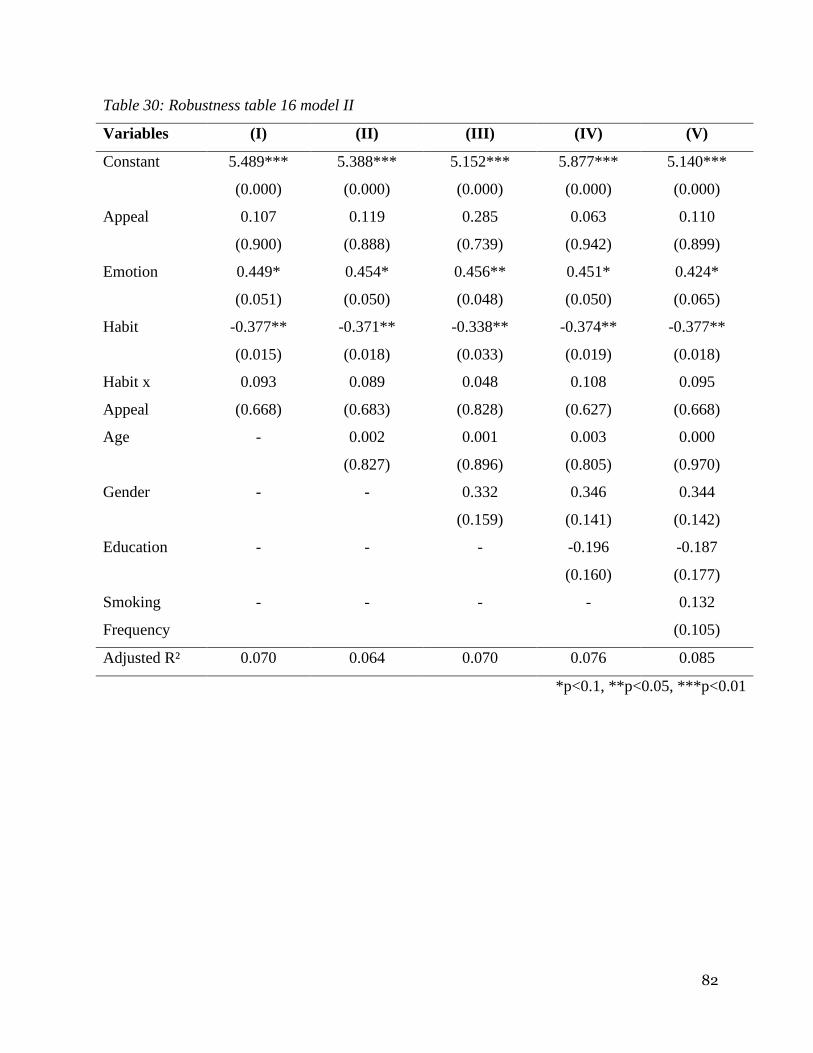
82
Table 30: Robustness table 16 model II
Variables (I) (II) (III) (IV) (V)
Constant 5.489***
(0.000)
5.388***
(0.000)
5.152***
(0.000)
5.877***
(0.000)
5.140***
(0.000)
Appeal 0.107
(0.900)
0.119
(0.888)
0.285
(0.739)
0.063
(0.942)
0.110
(0.899)
Emotion 0.449*
(0.051)
0.454*
(0.050)
0.456**
(0.048)
0.451*
(0.050)
0.424*
(0.065)
Habit -0.377**
(0.015)
-0.371**
(0.018)
-0.338**
(0.033)
-0.374**
(0.019)
-0.377**
(0.018)
Habit x
Appeal
0.093
(0.668)
0.089
(0.683)
0.048
(0.828)
0.108
(0.627)
0.095
(0.668)
Age - 0.002
(0.827)
0.001
(0.896)
0.003
(0.805)
0.000
(0.970)
Gender - - 0.332
(0.159)
0.346
(0.141)
0.344
(0.142)
Education - - - -0.196
(0.160)
-0.187
(0.177)
Smoking
Frequency
- - - - 0.132
(0.105)
Adjusted R² 0.070 0.064 0.070 0.076 0.085
*p<0.1, **p<0.05, ***p<0.01
83
Appendix B
Start of Block: Survey Begin
Q1.1 Dear respondent, Thank you for participating in this study. This study is conducted for my master's thesis at
the Erasmus University Rotterdam. Please take your time to read all instructions before responding. The survey
will take approximately 4-5 minutes. Fill in the questions carefully and answer all questions honestly.
You might encounter randomly placed attention checks, anyone who is following the instructions will see these
easily. The survey is anonymous and your input will be treated confidentially. Participation in this study is
voluntary, you may discontinue your participation at any time. If you have any questions about this study,
please e-mail me at [email protected]. Kind regards, Jordi van den Berg
Q1.2 Before you start, please enter your Prolific ID here:
________________________________________________________________
End of Block: Survey Begin
Start of Block: Introduction
Q2.1 After this page you will see three different pages.
On the first page you will see a short introduction and a picture. Please read the text carefully and take a close look
at the picture before moving on to the three questions.
On the second and third page some questions will be asked about you as a person.
End of Block: Introduction
Start of Block: OtherNegative
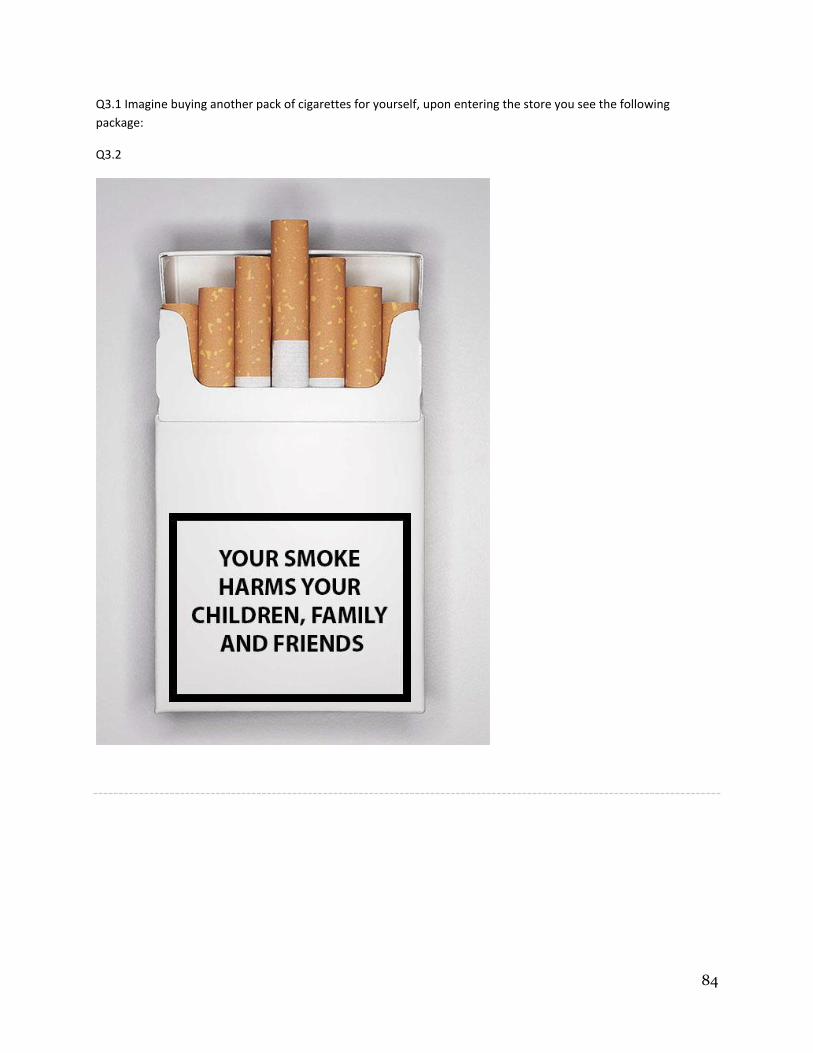
84
Q3.1 Imagine buying another pack of cigarettes for yourself, upon entering the store you see the following
package:
Q3.2

85
Q3.3 How do you evaluate the appeal of the message on the package?
None at all (1) A little (2) A moderate amount (3)
A lot (4) A great deal (5)
The message emphasizes the
effects of smoking on me
(1)
o o o o o
The message emphasizes the
effects of smoking on others (2)
o o o o o
Q3.4 How do you evaluate the emotion of the message on the package?
None at all (1) A little (2) A moderate amount (3)
A lot (4) A great deal (5)
The message emphasizes the
negative consequences of smoking (1)
o o o o o
The message emphasizes the positive benefits
if you stop smoking (2)
o o o o o

86
Q3.5 After reading the message on the package, how likely are you to purchase this product?
Extremely unlikely (1)
Moderately unlikely (2)
Slightly unlikely (3)
Neither likely nor
unlikely (4)
Slightly likely (5)
Moderately likely (6)
Extremely likely (7)
The likelihood
of purchasing
this product is
(1)
o o o o o o o
If I were going to
buy cigarettes, I
would consider
buying this package (2)
o o o o o o o
After seeing this package, I
would consider
buying the product (3)
o o o o o o o
The probability
that I would
consider buying this product is
(4)
o o o o o o o
End of Block: OtherNegative
Start of Block: OtherPositive
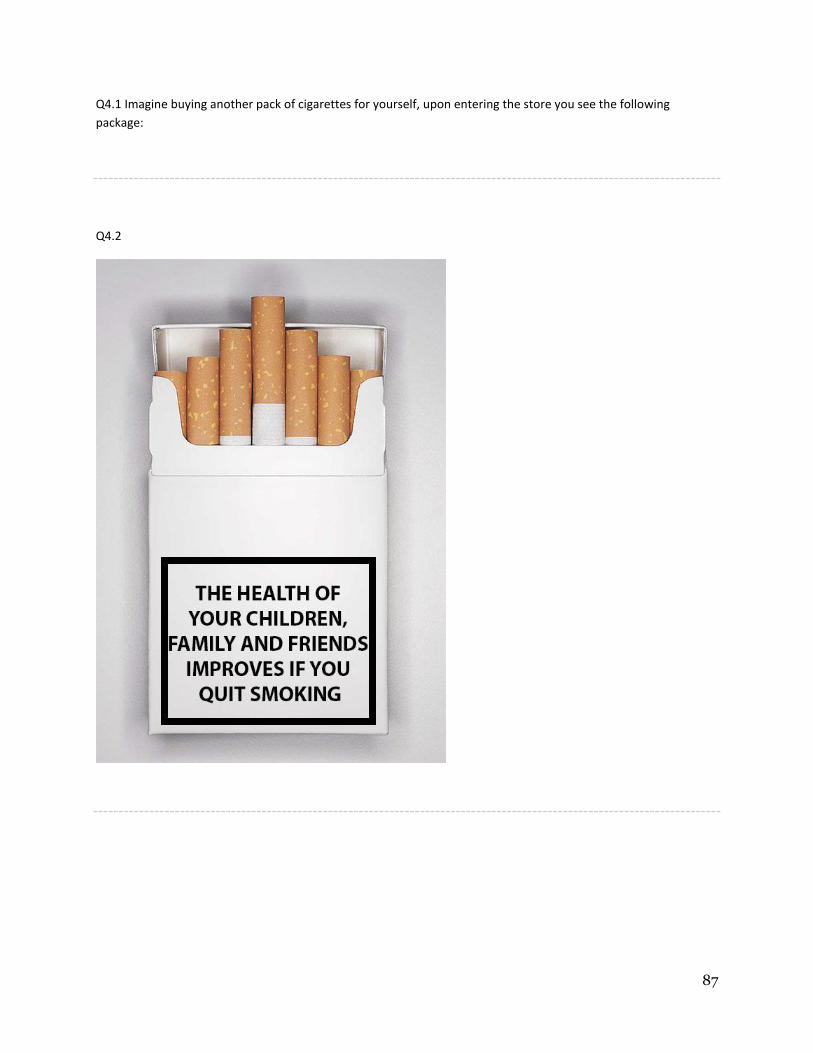
87
Q4.1 Imagine buying another pack of cigarettes for yourself, upon entering the store you see the following
package:
Q4.2

88
Q4.3 How do you evaluate the appeal of the message on the package?
None at all (1) A little (2) A moderate amount (3)
A lot (4) A great deal (5)
The message emphasizes the
effects of smoking on me
(1)
o o o o o
The message emphasizes the
effects of smoking on others (2)
o o o o o
Q4.4 How do you evaluate the emotion of the message on the package?
None at all (1) A little (2) A moderate amount (3)
A lot (4) A great deal (5)
The message emphasizes the
negative consequences of smoking (1)
o o o o o
The message emphasizes the positive benefits
if you stop smoking (2)
o o o o o
89
Q4.5 After reading the message on the package, how likely are you to purchase this product?
Extremely unlikely (1)
Moderately unlikely (2)
Slightly unlikely (3)
Neither likely nor
unlikely (4)
Slightly likely (5)
Moderately likely (6)
Extremely likely (7)
The likelihood
of purchasing
this product is
(1)
o o o o o o o
If I were going to
buy cigarettes, I
would consider
buying this package (2)
o o o o o o o
After seeing this package, I
would consider
buying the product (3)
o o o o o o o
The probability
that I would
consider buying this product is
(4)
o o o o o o o
End of Block: OtherPositive
Start of Block: SelfNegative
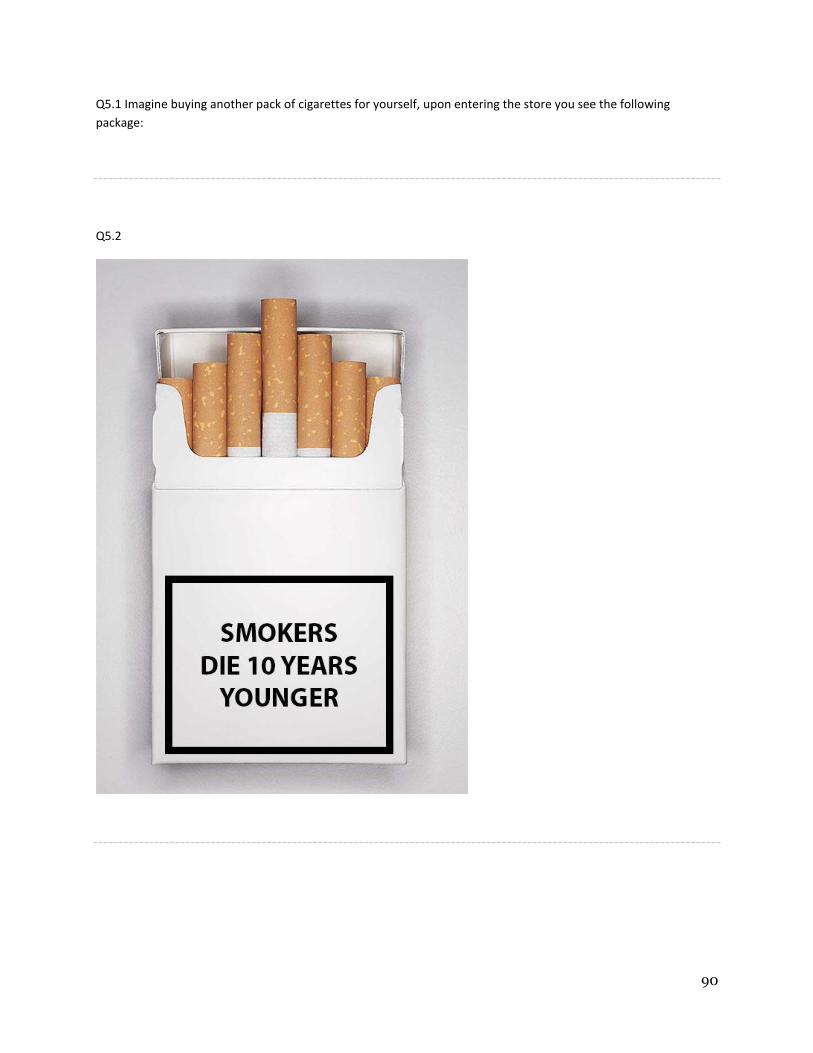
90
Q5.1 Imagine buying another pack of cigarettes for yourself, upon entering the store you see the following
package:
Q5.2

91
Q5.3 How do you evaluate the appeal of the message on the package?
None at all (1) A little (2) A moderate amount (3)
A lot (4) A great deal (5)
The message emphasizes the
effects of smoking on me
(1)
o o o o o
The message emphasizes the
effects of smoking on others (2)
o o o o o
Q5.4 How do you evaluate the emotion of the message on the package?
None at all (1) A little (2) A moderate amount (3)
A lot (4) A great deal (5)
The message emphasizes the
negative consequences of smoking (1)
o o o o o
The message emphasizes the positive benefits
if you stop smoking (2)
o o o o o
92
Q5.5 After reading the message on the package, how likely are you to purchase this product?
Extremely unlikely (1)
Moderately unlikely (2)
Slightly unlikely (3)
Neither likely nor
unlikely (4)
Slightly likely (5)
Moderately likely (6)
Extremely likely (7)
The likelihood
of purchasing
this product is
(1)
o o o o o o o
If I were going to
buy cigarettes, I
would consider
buying this package (2)
o o o o o o o
After seeing this package, I
would consider
buying the product (3)
o o o o o o o
The probability
that I would
consider buying this product is
(4)
o o o o o o o
End of Block: SelfNegative
Start of Block: SelfPositive
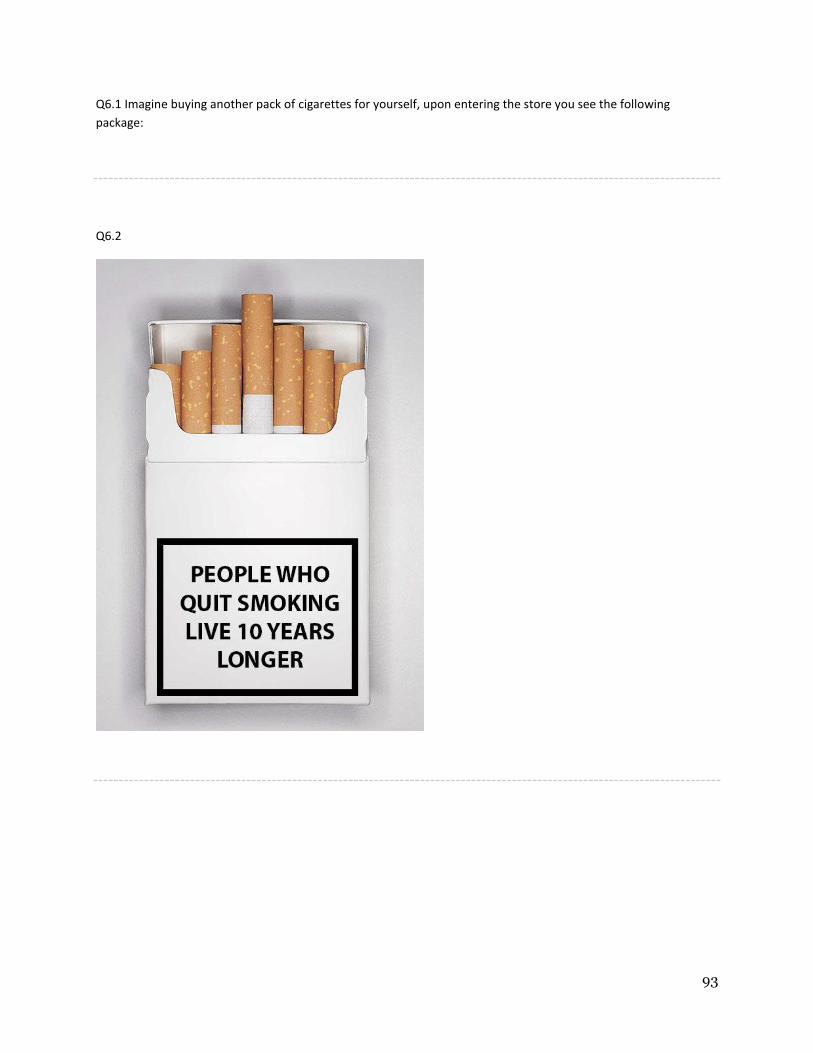
93
Q6.1 Imagine buying another pack of cigarettes for yourself, upon entering the store you see the following
package:
Q6.2
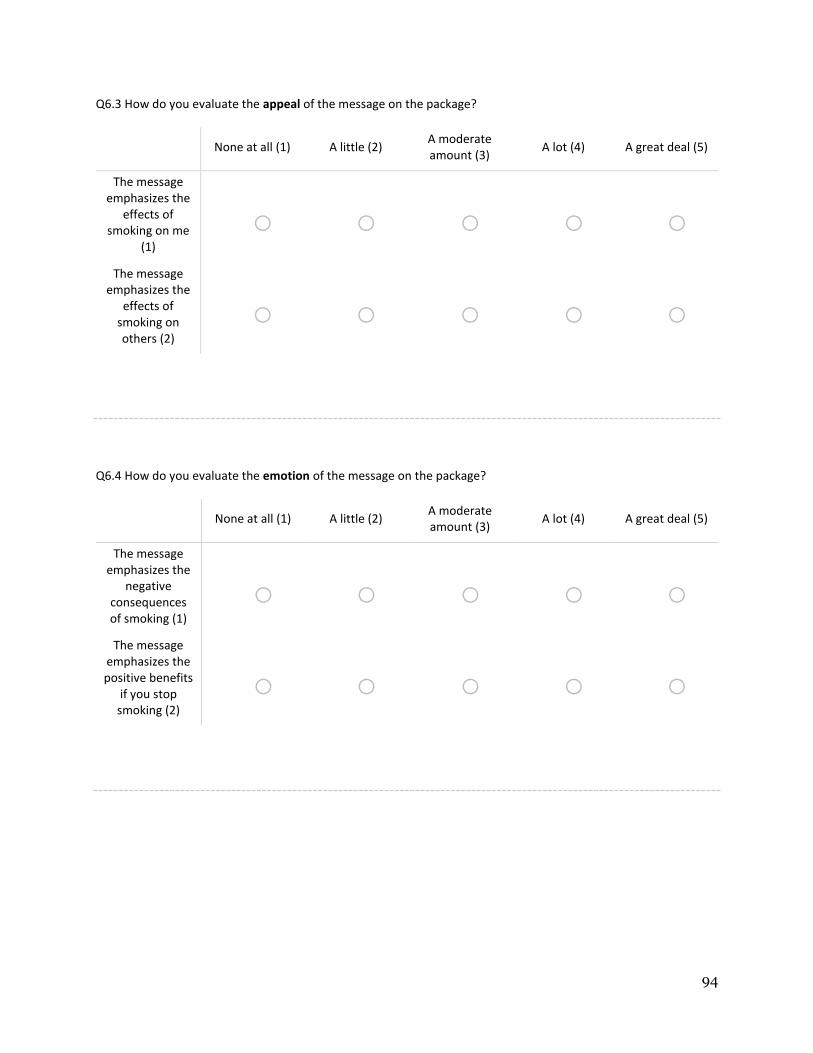
94
Q6.3 How do you evaluate the appeal of the message on the package?
None at all (1) A little (2) A moderate amount (3)
A lot (4) A great deal (5)
The message emphasizes the
effects of smoking on me
(1)
o o o o o
The message emphasizes the
effects of smoking on others (2)
o o o o o
Q6.4 How do you evaluate the emotion of the message on the package?
None at all (1) A little (2) A moderate amount (3)
A lot (4) A great deal (5)
The message emphasizes the
negative consequences of smoking (1)
o o o o o
The message emphasizes the positive benefits
if you stop smoking (2)
o o o o o
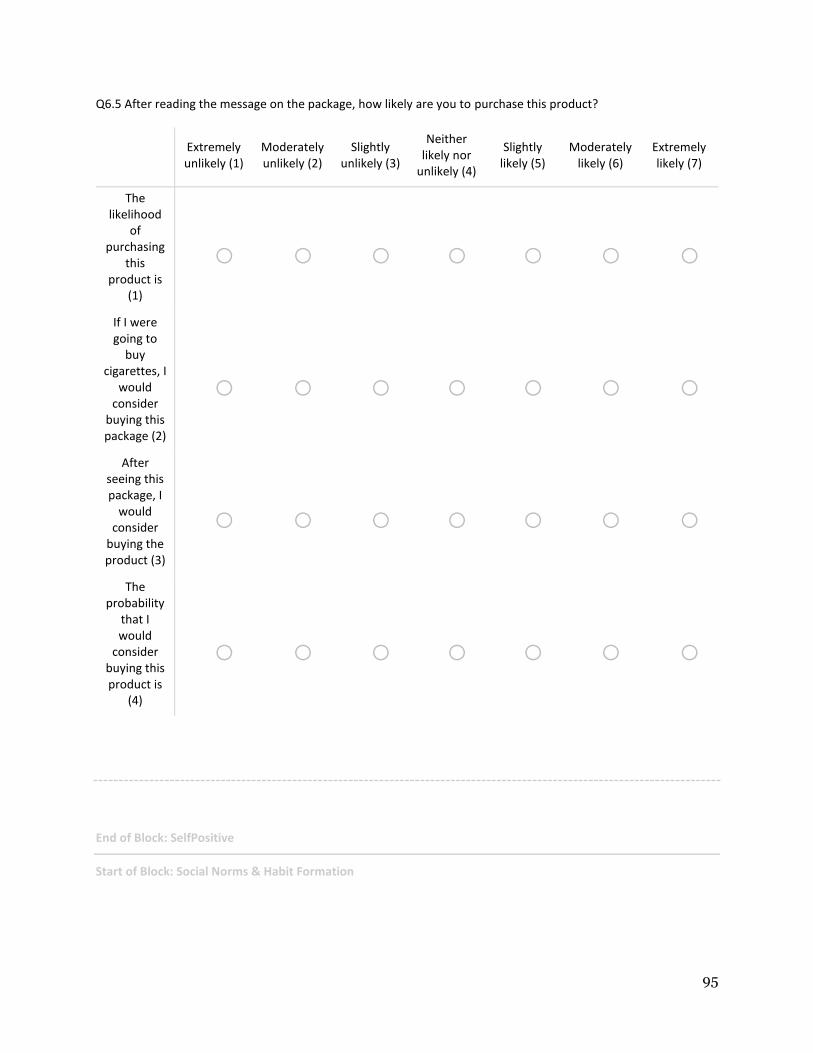
95
Q6.5 After reading the message on the package, how likely are you to purchase this product?
Extremely unlikely (1)
Moderately unlikely (2)
Slightly unlikely (3)
Neither likely nor
unlikely (4)
Slightly likely (5)
Moderately likely (6)
Extremely likely (7)
The likelihood
of purchasing
this product is
(1)
o o o o o o o
If I were going to
buy cigarettes, I
would consider
buying this package (2)
o o o o o o o
After seeing this package, I
would consider
buying the product (3)
o o o o o o o
The probability
that I would
consider buying this product is
(4)
o o o o o o o
End of Block: SelfPositive
Start of Block: Social Norms & Habit Formation

96
Q7.1 I do things because...
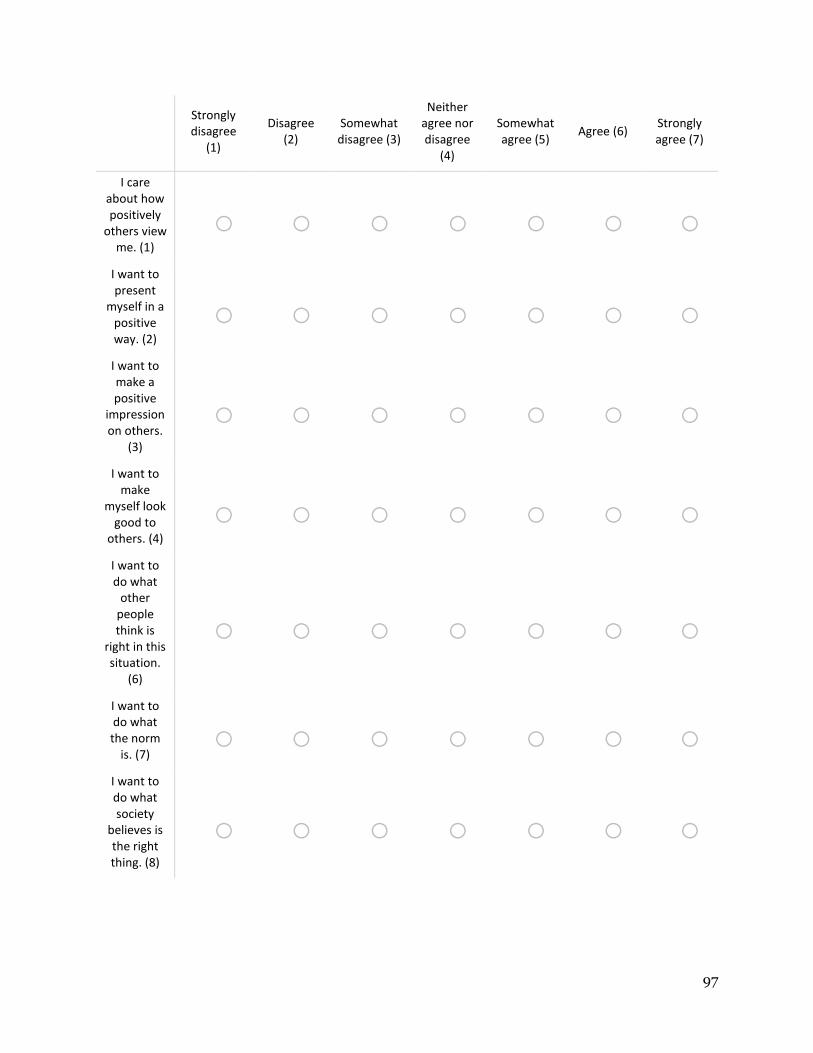
97
Strongly disagree
(1)
Disagree (2)
Somewhat disagree (3)
Neither agree nor disagree
(4)
Somewhat agree (5)
Agree (6) Strongly agree (7)
I care about how positively
others view me. (1)
o o o o o o o
I want to present
myself in a positive way. (2)
o o o o o o o
I want to make a positive
impression on others.
(3)
o o o o o o o
I want to make
myself look good to
others. (4)
o o o o o o o
I want to do what
other people think is
right in this situation.
(6)
o o o o o o o
I want to do what the norm
is. (7) o o o o o o o
I want to do what society
believes is the right thing. (8)
o o o o o o o
98
I want to do what others
approve of. (10)
o o o o o o o
Q7.2 How strongly do you agree or disagree with each of the following statements:
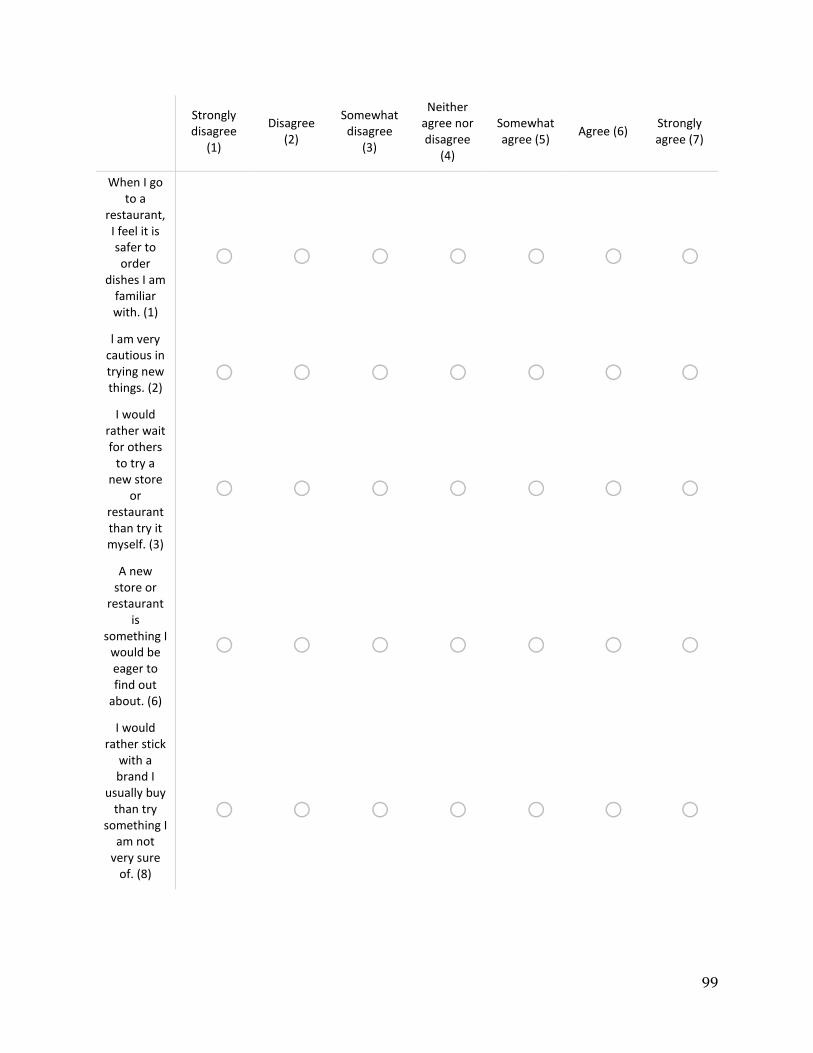
99
Strongly disagree
(1)
Disagree (2)
Somewhat disagree
(3)
Neither agree nor disagree
(4)
Somewhat agree (5)
Agree (6) Strongly agree (7)
When I go to a
restaurant, I feel it is safer to order
dishes I am familiar with. (1)
o o o o o o o
l am very cautious in trying new things. (2)
o o o o o o o I would
rather wait for others
to try a new store
or restaurant than try it myself. (3)
o o o o o o o
A new store or
restaurant is
something I would be eager to find out
about. (6)
o o o o o o o
I would rather stick
with a brand I
usually buy than try
something I am not
very sure of. (8)
o o o o o o o
100
Please select
disagree. (9)
o o o o o o o I enjoy
exploring several
different alternatives or brands
while shopping.
(10)
o o o o o o o
End of Block: Social Norms & Habit Formation
Start of Block: Control Variables
Q8.1 What is your gender?
o Male (1)
o Female (2)
Q8.2 What is your age?
________________________________________________________________
101
Q8.3 What is the highest level of education you have completed?
o Basic Education (1)
o Secondary Education (2)
o College level (3)
o University (4)
Q8.4 What is your nationality?
________________________________________________________________
Q8.5 How often do you smoke?
o Never (1)
o I am a former smoker (2)
o Occasionally (3)
o Once a week (4)
o 2-3 times a week (5)
o 4-6 times a week (6)
o Daily (7)
End of Block: Control Variables