Embed Size (px)
Citation preview

Amsterdam Business School
The effect of the horizon problem on the CEO compensation
structure
Name: Esmée Hilhorst
Student number: 10835784
Thesis supervisor: prof. dr. V.R. O’Connell
Date: 17 June 2016
Word count: 12,085
MSc Accountancy & Control, specialization Control
Faculty of Economics and Business, University of Amsterdam
2
Statement of Originality
This document is written by student Esmée Hilhorst who declares to take full responsibility for
the contents of this document.
I declare that the text and the work presented in this document is original and that no sources
other than those mentioned in the text and its references have been used in creating it.
The Faculty of Economics and Business is responsible solely for the supervision of completion
of the work, not for the contents.

3
Abstract
This research examines the effect of the horizon problem on the CEO compensation structure.
Previous research found evidence that CEOs make different decision when their career horizon
is short. Drawing on the agency theory and managerial opportunism, the compensation structure
is a tool to align the interest of the CEO and the firm. Firms could control for the horizon
problem in adapting the compensation structure of the CEO. Providing the CEO with more
long-term incentives leads to an extension of the horizon of the CEO, because then a great
amount of his rewards depend on it. In this paper, a sample is used consisting of 11,636
observations of US listed firms. Regression analyses are conducted to test the relation between
the percentage of long-term incentives and the indicators for the horizon problem. The results
suggest that when there are indicators of the horizon problem, CEOs receive less long-term
incentives. This evidence is contrary to expectations and indicates that firms do not control for
the horizon problem.

4
Table of contents
1 Introduction ............................................................................................................................................ 5
1.1 Background ...................................................................................................................................... 5
1.2 Research question ........................................................................................................................... 6
1.3 Motivation ........................................................................................................................................ 6
1.4 Structure ........................................................................................................................................... 6
2 Literature .................................................................................................................................................. 7
2.1 The agency theory and managerial opportunism ....................................................................... 7
2.2 The effect of the CEO compensation structure ........................................................................ 9
2.3 The horizon problem .................................................................................................................. 11
3 Hypotheses ........................................................................................................................................... 14
4 Sample and research methodology ................................................................................................... 17
4.1 Sample selection ........................................................................................................................... 17
4.2 Methodology ................................................................................................................................. 18
5 Descriptive statistics and empirical results ...................................................................................... 21
5.1 Descriptive statistics .................................................................................................................... 21
5.2 Multicollinearity ............................................................................................................................ 23
5.3 Regression analysis ...................................................................................................................... 24
5.4 Sensitivity analyses ....................................................................................................................... 26
5.5 Summary of the empirical results .............................................................................................. 28
6 Summary and conclusion ................................................................................................................... 29
6.1 Summary ........................................................................................................................................ 29
6.2 Conclusion .................................................................................................................................... 30
6.3 Limitations .................................................................................................................................... 32
References ................................................................................................................................................... 33
Appendix ..................................................................................................................................................... 36
Appendix 1 ............................................................................................................................................. 36
Appendix 2 ............................................................................................................................................. 38
Appendix 3 ............................................................................................................................................. 39

5
1 Introduction
1.1 Background
In this study the effect of the horizon problem on the compensation structure of CEOs is
examined. CEOs usually are rewarded with a combination of cash-based compensation and long-
term incentives. Cash-based compensations are basically salary and bonuses. Bonuses provide
short-term incentives, because they are paid annually. Long-term incentives are mainly stock-
based compensations. Most of the time, firms are interested in increasing the firm value and they
want to provide the CEO with the incentive to increase firm value. They do this in providing
CEOs with long-term incentives. Nevertheless, for managers the short-term results are just as
important, because these results will determine the amount of bonus they receive at the end of
the year. In most firms a so-called compensation or remuneration committee determines the
CEO compensation structure. This committee needs to consist of independent members to
make sure the decisions of the committee are objective and not influenced by the CEO.
For CEOs that are close to retirement or planning to leave the firm, the long-term results
become less important, because they will stop working for the firm soon. When these events
occur CEOs could go act in their own interest, which would be to try to establish an increase in
short-term results instead of an increase in firm value in the future. A consequence can be that
the CEOs will invest less money in new projects during their final years in the firm, to achieve
better accounting numbers. If they succeed in this, they would get a higher bonus before they
leave the firm. Nevertheless, investing in projects could have led to better results on the long
term. CEOs that will leave in the near future have shorter career horizons. According to Smith
and Watts (1982) this is called the horizon problem.
A way to force CEOs to focus on the future is the provision of long-term incentives.
Yermack (1995) tried to find a relation between offering stock options awards and the CEO
approaching retirement. The author expected to find that the firms increased stock options
awards to incentivize the CEO when the CEO approached the age of 65. No evidence was
found. The author researches compensation data from 1984 till 1991. These are the years just
after the introduction of the horizon problem by Smith and Watts (1982), so it could be that
companies were not even aware of the problem of short horizons at that time. Also, they do not
take into account that CEOs do not retire at 65 often. When looking at the sample that is used
for this research, it can be seen that a lot of CEOs are older than 65 and they are still working.
This supports the assumption that a lot of CEOs do not retire at the age of 65.
CEO compensation is intended to incentivize the CEO to act in the best interest of the

6
firm. Therefore, when the interests of a CEO change, the firm should correct for this. Firms
could control for the horizon problem by adapting the structure of CEO compensation when the
CEO is close to the age of retirement or has plans to leave the firm. This study investigates if
firms actually do this.
1.2 Research quest ion
The research looks at the effect of short horizons in determining the compensation structure for
CEOs. In particular, the study examines if firms take action to try to reduce the horizon problem
by aligning the interests of the CEO and the shareholders. The research question would be: Do
firms change the CEOs compensation structure when the horizon problem is present?
1.3 Motivat ion
This research contributes to the existing literature in multiple ways. There is a gap in the literature
in what firms do to control for the horizon problem or if they actually do something to reduce it.
Several researches looked at the effect of the horizon problem, but they did not look at possible
actions of the companies to prevent or solve it. Also, prior research examined the considerations
when determining the compensation. Mostly, firm characteristics are taken into account, but
there is no research available about the inclusion of CEO characteristics when designing the
compensation.
1.4 Structure
In the study, an ordinary least squares analysis is conducted. First, the relevant literature is
reviewed and discussed. Thereafter, the hypotheses are developed. Subsequently, the sample
process is described and the methodology is explained. After that, the sample is analyzed and
described. Section 5 presents and analyzes the results. Finally, the last section comprises the
summary, conclusion and limitations of the study.

7
2 Literature
In this section, the relevant literature is reviewed. First, the agency theory and managerial
opportunism are explained. This theory is important to understand the use of compensation and
incentives in motivating and guiding the CEO. Hereafter, several papers are discussed that
research the effect of the compensation structure on the actions of CEOs. Also, the expectancy
theory and the reinforcement theory are introduced. After that, literature about the horizon
problem is reviewed. The phenomenon is explained and prior research about the effect of the
horizon problem on several elements is disused. Furthermore, the key literature is summarized in
table 10 in appendix 1.
2.1 The agency theory and manager ia l opportunism
Jensen and Meckling (1976) describe an agency relationship where there is a contract between the
principal (owner of the firm) and the agent (controller of the firm). The principal delegates
decision-making authority to the agent and the agent should act on behalf of the principal.
Nevertheless, the agent will not always act in the best interest of the principal and thus act in his
own interest. It is almost impossible to ensure that the agent will always make the most optimal
decisions for the principal. This is called the agency problem. To prevent agency problems,
interests have to be aligned. The principal should provide the agent with incentives to act in the
principal’s best interest and make the best decisions for the welfare of the firm. One component
of the solution to the agency problem is financial alignment, which indicates that the
compensation committee should provide the CEO with equity ownership and they should adapt
the compensation structure when necessary (Jensen and Meckling, 1976; Fama and Jensen,
1983b).
Several researches referred to agency theory to explain the structure of CEO
compensation (Eisenhardt, 1985, 1989; Conlon and Parks, 1990). Compensation is used as a tool
to align the interest of the firm with those of the CEO. Coles et al. (2006) examined the relation
between managerial incentives and risk-taking. They found relationships between the executive
compensation and the investment policy, debt policy and the firm risk. Coles et al. (2006) found
evidence that when the wealth of the CEO is more dependent on stock volatility they show more
risky behavior. This risky behavior expresses itself in more investments in R&D and fewer
investments in PPE. In addition, they found that when the CEO adopts a more risky policy,
most of the time this leads to a compensation structure where there are more long-term
incentives and less short-term incentives. Also Gormley et al. (2013) investigated the relationship

8
between risk and the compensation structure of the CEO. They suggest that when firms operate
in a more risky environment, the CEO is provided with more stock and option based
compensation. Moreover, they argue that when the risk of the firm changes firms will quickly
adapt the compensation structure of the CEO. However, they claim that there will be a delayed
impact of these changes in the portfolio of the CEO. Therefore, they conclude that the board
should response quickly to future changes in the risk of the firm and they should react more
excessively to these changes.
The agency theory indicates that CEOs behave opportunistically and therefore their
interests have to be aligned with the interests of the shareholders. A theory that involves CEOs
acting self-interested is managerial optimism. The theory about managerial optimism suggests
that CEOs always act in their own interest. CEOs do not take the interest of the firm into
account when they make decisions, but they always decide in their own benefit. As a result, it
becomes a problem for the firm when the interests of the CEO and the shareholders differ from
each other.
Devos et al. (2015) examined if CEOs behave opportunistic. They researched if CEOs
exercise options before a split to take advantage of the stock price appreciation that occurs with a
stock split. They found evidence that only a third of the CEOs of the sample exercised their
options before the split announcement versus two third that exercised them after the split. This
evidence suggests that CEOs take advantage of the stock price appreciation due to the split. Also
Huddart and Lang (1996) looked at the exercise behavior of CEOs. They investigated the option
exercise behavior of employees provided with long-term incentives. In their research they found
evidence that the moment that CEOs exercise their options is consistent with financial factors as
stock price and return, which indicates that they exercise their options when stock price and
return are high. Both Devos et al. (2015) and Huddart and Lang (1996) confirmed the existence
of optimistic behavior of CEOs.
Otto (2014) examined how optimism affects CEOs compensation. The proxies for
optimism are based on the decisions about option exercises and the CEOs’ forecasts of the
earnings per share. The author found that if there are indications of optimistic beliefs, the CEOs
receive smaller stock options and fewer bonuses. They receive less total compensation as their
peers. This evidence suggests that firms control for opportunism in determining the
compensation. However, he found that firms decrease the total compensation when such events
occur and therefore he did not look at the explicit structure of the compensation. Also, the
indications of optimistic beliefs are not based on personal characteristics of the CEO, but more
on the previous actions of the CEO.

9
2.2 The e f f e c t o f the CEO compensat ion s tructure
Two theories that look at designing optimal compensation structures to incentivize employees are
the expectancy theory and the reinforcement theory. Vroom (1964) first came up with the
expectancy theory model. The theory suggests that providing employees with financial rewards
based on their performance leads to more motivation and subsequent higher performance.
Cammann and Lawler (1973) describe the model in their paper and discuss the three necessary
components for a successful and effective incentive scheme. They claim that good performance
should lead to rewards. These rewards have to be clear and achievable for the employees. Also,
more positive outcomes need to come from the desirable performance than negative outcomes.
This means that positive outcomes on one component should not lead to negative outcomes on
another component. Cammann and Lawler (1973) conducted an experiment where they looked
at the reactions of employees to an incentive plan. They examined if performance increased as
predicted by the model when using it to come to the compensation structure. They found
evidence that it did. The expectancy theory suggests that employees get motivated based on the
promised rewards.
The reinforcement theory by Komaki et al. (1996) suggests that firms have to make very
clear what behavior is wanted and what behavior is unwanted and act on this. The authors
conducted an experiment where they rewarded employees with desirable behavior and punished
the employees that showed undesirable behavior. They found that the average performance of
the employees increased. This evidence suggests that reinforcing the consequences of behavior
leads to an overall better performance.
Due to several changes, the combination of compensation for CEOs has changed
compared to earlier. Clementi and Cooley (2009) investigated the compensation of CEOs in the
US from 1993 to 2006. They found that, on average, the use of equity grants and the income of
CEOs from the sale of stock have increased during that time.
As discussed in the section about the agency theory and managerial opportunism, CEOs
act self-interested and they try to earn as much as they can. The compensation structure plays a
big role in this. Drawing on the expectancy theory, it is important to design a fitting
compensation plan, because this leads to an increase in performance of the employees. Adapting
the structure of the compensation can push the CEO in the right direction. Drawing on the
reinforcement theory, when putting more weight on certain behavior and thus focus on explicit
components of the compensation, the CEO will be incentivized to take certain actions.
According to Grossman en Hoskisson (2016), aligning the goals of the firm with those of the
CEO in the design of the compensation also helps in gaining public confidence in the top

10
management of large public firms. They conducted research where they examined how the
structure of the CEO compensation played a role in finding a balance in holding the CEO
accountable and influencing the decision-making behavior of the CEO.
Several researchers found evidence that the actions of the CEOs depend on the
compensation structure. Efendi et al. (2007) examined incentives that led to the restatement of
financial statements and found evidence that CEOs take advantage of opportunities to maximize
their wealth. In their research they found that the chance of misstated financial statements
increases when CEOs own a great amount of in-the-money stock options. Furthermore, they
found that when the CEO is also the chair of the board, the chance of misstated financial
statement also increases.
Gopalan et al. (2014) conducted research where they investigated the effects of short-
term and long-term incentives on several components. They used pay duration as a determinant
of the length of the incentives, because it can be difficult to establish if incentives are short-term
or long-term. In their research they compared the pay duration to firm characteristics and to the
presence of earnings management. To research the relationship between the duration of CEO
pay and earnings management they used the level of discretionary accruals. As a result, they
found a negative relation, which suggests that when incentives are more long-term the level of
earnings management is lower. Furthermore, they found that CEOs who are rewarded on short-
term results are more likely to use earnings-increasing accruals to increase the results.
Balsam and Miharjo (2007) examined the relation between equity and cash based
compensation and voluntary CEO turnover. They found that providing the CEO with more
equity based compensation decreases voluntary turnover. The same relationship is found with the
amount of cash based compensation, except this effect is weaker. This evidence suggests that the
chance of the CEO leaving the firm increases when there are more long-term incentives. The
relationship between CEO turnover and short-term incentives is weaker and this would mean
that long-term incentives have a greater effect on CEO turnover.
Dong et al. (2010) investigated the effect of providing CEOs with stock options on their risk
taking behavior. According to Dong et al. (2010), providing the CEO with stock options helps in
aligning the interests of the CEO and the shareholders. However, they state that the provision of
stock options can even lead to too much risk taking by the CEO. This would be the case when
the earnings of the CEO are too dependent on these stock options.
Berger et al. (1997) examined the effect of CEO entrenchment on the capital structure of the
firm. They found that when the interests of the CEO and the shareholders are better aligned, the
CEO accepts more debt. In addition, the CEO increases the leverage ratio to a more optimal

11
level. In conclusion, they argue that CEOs have to be forced to optimize the leverage level and
this can be done by adapting the CEO compensation structure. These researches all support the
assertion that CEOs act in line with the incentive design.
2.3 The horizon problem
There are various considerations when determining the compensation and researchers examined
the effect of several different components. Carter et al. (2007) investigated the accounting role in
determining the CEO compensation structure and looked at financial reporting concerns. As a
proxy for the concerns they used the costs for financial reporting. They found a positive relation
between financial reporting concerns and the use of stock options in the compensation structure
and a negative relation between financial reporting concerns and the use of restricted stock in the
compensation.
Boyd (1994) examined the effect of board control on the CEO compensation structure.
He expected that CEOs would demand a higher salary when they had control over the board.
However, he found that salaries were lower when there were higher control levels. This evidence
is contrary to his expectations.
Daily et al. (1998) investigated the relationship between members of the compensation
committee and the compensation structure. In particular they looked at independence of the
committee members, where board members that could be influenced by the CEO were seen as
not independent. They found no relationship between the independence of the members of the
compensation committee and CEO compensation.
Furthermore, Belliveau et al. (1996) examined the effect of social capital on the CEO
compensation structure. In the study, social capital was measured as status. They found a
negative relationship between the status of the chairman and the total CEO compensation, which
means that when the chairman has a low status, the CEO receives higher compensation. In
addition, a positive relation was found between the social capital of the CEO in comparison with
the chairman and the total CEO compensation. No evidence was found for a relation between
social similarity and the compensation of the CEO.
David et al (1998) investigated the influence of institutional investors on the structure of
CEO compensation. They distinguish two types of investors, namely those with only an
investment relationship and those that depend on the firm for their own business. They found
that only the institutional investors with an investment relationship could influence the
compensation structure of the CEO. They found evidence that those inventors were able to
negatively influence the level of compensation and they were able to positively influence the

12
relative amount of long-term incentives in comparison with the total compensation.
One thing that can affect the agency relationship is the presence of the horizon problem.
Smith and Watts (1982) first introduced the horizon problem. They state that the horizons of
managers who are leaving the firm are short and explain what can happen (p. 145):
“The incentive effects of future salaries decrease as the manager is close to retirement. In the extreme, the sixty-four
year old chief executive with one year’s service left will not be motivated by future salary adjustments.”
The horizon problem can arise in the case of retirement, but also when CEOs (have the intention
to) leave to work for another firm. Normally, when CEOs leave the firm, the board already
knows it long before they actually leave. CEOs that have the intention to leave will focus on the
performance of their last year, because bonus compensation depends on that. Smith and Watts
(1982) discuss how bonus plans for managers can affect the investment and financing decisions
of the managers, especially for those with short horizons. Also, they suggest that the provision of
long-term incentives can help in solving the horizon problem.
Prior research has covered the impact of CEOs short horizons on multiple variables.
Kalyta (2009) looked at the impact of the horizon problem on earnings management. Moreover,
he looked at pension plans that were based on performance and predicted that when there are
such pension plans in place, it would be more likely that the CEO would indulge in earnings
management. The proxy used for the horizon problem is managerial retirement. The author
found a positive relationship between CEO retirement arrangements based on firm performance
and income-increasing earnings management when CEOs were close to retirement.
Also Davidson et al. (2007) investigated the relationship between career horizons and
earnings management. They argue that not only the retirement age leads to incentives to manage
earnings, but also the structure of the compensation contributes to the horizon problem when a
relatively large part of the total compensation is based on short-term results. In their research,
they examine the effect of both CEO retirement and CEO compensation structure on earnings
management. In particular, they focus on CEO turnover in combination with CEO age to
differentiate turnover and retirement. The presence of earnings management is measured through
the amount of discretionary accruals. They found evidence that the amount of discretionary
accruals is higher, when CEOs near retirement. In firms where CEOs retire and a larger part of
the compensation is based on short-term results, they found a higher amount of discretionary
accruals. However, this last result was not robust.
McClelland et al. (2012) examined if the horizon of a CEO and CEO tenure have an

13
effect on future firm performance. For CEO tenure the evidence indicates that the results
depend on the industry. In dynamic environments, higher CEO tenure decreases firm
performance, but in less dynamic environments this could actually increase firm performance.
Moreover, McClelland et al. (2012) found results that CEOs with a short horizon perform worse
than CEOs with a longer horizon. According to the authors, this worsened performance is
caused by risk-averse behavior. They explain that when the CEO has a high level of ownership in
the firm, this relationship becomes stronger. They argue that this is the case, since ownership
comes with more power. For career horizon they used age as an indicator for short horizons.
Furthermore, Gray and Cannella (1997) examined the relation between risk and the CEO
compensation structure. They looked at the CEO compensation structure as a way to influence
the behavior of CEOs and focused on the influence on risk taking behavior. In addition, they
found evidence that the compensation structure is used as a tool to influence risk-taking
behavior. Also, they stated that when a CEO nears retirement, this influences the type of
investment decisions they make. This evidence supports that the horizon problem exists.
14
3 Hypotheses
In this section, the relationships that are expected are explained. First, the link between the
horizon problem and the compensation structure is discussed. Thereafter, three hypotheses are
formulated. The literature that is used to formulate the hypotheses is summarized in table 10 in
appendix 1.
When CEOs have short horizons, they could act in their own interest. Agency problems will
increase. To reduce the agency problems, CEOs have to be incentivized to act in the best interest
of the stockholders and the firm. Therefore, a change in the compensation structure of the CEO
should restore the agency relationship and this can prevent managerial opportunism. Firms can
cut back the short-term incentives for CEOs with short horizons, so the short-term accounting
numbers matter less for these CEOs. By providing the CEO with more long-term incentives,
they stimulate the CEO in increasing the firm value. So, despite the fact that the CEO will leave
the firm, it would still be remunerative for the CEO to invest in new projects.
Dechow and Sloan (1991) focused on the relationship between CEOs incentives and the
investments that they make. They hypothesized that CEOs spend less money on discretionary
investments in their final years, so they are able to increase the short-term results and maximize
their end of year bonus. In their research they found that CEOs spend less on R&D and
marketing during their final years in the firm. In addition, their results also indicate that CEO
stock ownership mitigates the effect on R&D expenditures. When the CEO owns more stocks
there is less reduction in expenditures. This evidence suggests that companies are able to control
for the horizon problem by adapting the compensation structure.
Also Cheng (2004) found evidence for the positive effect of adaption of the CEO
compensation structure on managerial behavior. He investigated the relationship between a
change in R&D spending and changes in the CEO option compensation when the horizon
problem is present. The proxy that is used for the horizon problem is when the CEO approaches
retirement. The changes in compensation should prevent opportunistic behavior in the form of a
decrease in R&D expenditures. He found that there is a positive relationship between changes in
R&D expenditures and changes in CEO compensation when there are indications of the horizon
problem. This evidence indicates that changing the CEO compensation structure is effective in
reducing opportunistic behavior and upholding R&D spending and investments in projects.
Matta et al. (2008) investigated the implications of a shorter career horizon on risk taking
in the form of an international acquisition. They found that CEOs approaching retirement with a

15
lot of equity holdings and in the money unexercised options are less likely to engage in
international acquisitions than CEOs that have less options and equity holdings. These results
suggest that the business decisions of CEOs are influenced by the amount of options and equity
that they own when they are close to retirement. In conclusion, they argue that despite owning
options and equity, CEOs prefer having money instead of options. Therefore, they sell them as
fast as they can. The researchers suggest that the companies, for example, should look at the
expiration date of the options, rather than just giving more options to CEOs that are close to
retirement. This evidence is contrary to Dechow and Sloan (1991) and Cheng (2004).
To examine the impact of short career horizons of CEOs on their compensation
structure, two hypotheses have been developed. I expect that when there are indications for short
horizons, the compensation structure will be adapted to prevent managerial opportunism and
reduce the horizon problem. When looking at the expectancy theory, the CEO compensation
structure need to be adapted into a structure where the specific performance of CEOs is more
linked to financial rewards (Vroom, 1964). To reduce the horizon problem, there need to be
more weight on the link between an increase in firm value and the rewards on long-term
incentives. Probably, this link is stronger and better known with CEOs when there are more
long-term incentives provided for them. Drawing on the reinforcement theory, the reinforcement
on long-term incentives should be bigger when dealing with the horizon problem (Komaki et al.,
1996). This way, the CEO will have to focus on the long-term incentives, because a lot of his
financial rewards depend on them. Providing more long-term incentives can extend their
horizon, but presumably this is only possible when a large amount of the financial rewards of the
CEO depend on it.
For the first hypothesis the original way the horizon problem was explained by Smith and Watts
(1982) is used. They had stated that the horizon problem arises when CEOs near retirement. So
according to them, the problem arises with an older age. This leads to the following hypothesis:
H1: Firms use more long-term incentives in determining the compensation for CEOs when the CEO is older.
However, not only age can lead to a short horizon. When CEOs plan to leave the firm, this also
could lead to the horizon problem. Therefore, the next hypothesis is as follows:
H2: Firms use more long-term incentives in determining the compensation for CEOs when the CEO has the
intention to leave.

16
Another hypothesis is added to examine an interaction effect. It would be only logical that older
CEOs are more likely to leave a firm than younger CEOs. Especially when they have already
passed the retirement age. They have to retire one day. The following hypothesis is added to look
at this interaction effect:
H3: CEOs that are older are more likely to have the intention to leave the firm.
Libby (1981) gives a framework that helps to illustrate a research. In the figure below, Libby’s
framework is given adjusted to this research. The independent variable is measured through the
proxies of CEO age (hypothesis 1) and CEO turnover (hypothesis 2). The dependent variable for
the research is the compensation structure. This is measured through the relative amount of long-
term incentives in relation to the total compensation. Six control variables are added to increase
the validity of the outcomes. The control variables are: gender, firm size, return on assets (ROA),
market-to-book ratio, z-score and firm industry. In the next section, all used variables are
explained in detail.
Independent variable:
Short horizons
Dependent variable:
CEO compensation
structure
Control variables:
Gender, firm size,
ROA, market-to-book
ratio, z-score, firm
industry
Proxies:
Relative amount of
long-term
incentives
Proxies:
- CEO age
- CEO turnover
Figure 1: Libby's framework

17
4 Sample and research methodology
In this chapter, the sample is described and the process of the selection of the sample is
explained. Furthermore, the methodology is given, the formulas are presented and the used
variables are discussed.
4.1 Sample se l e c t ion
To research the effect of the horizon problem on long-term incentives, database research is
conducted. Compensation data about listed firms in the US from 2004 until 2015 is gathered
from Compustat ExecuComp. Financial data is gathered from Compustat IQ. The financial data
is used to create control variables for the regression. These two datasets are merged into one.
Using the variable of the present age of the CEOs and the fiscal year (existing variables
from ExecuComp), a total of 321 missing values in age are added. Hereby, only 10 observations
had to be dropped because of missing values in age.
Eventually, only the data from 2004 to 2013 is used for the analysis. The years 2014 and
2015 are only used to create the dummy variable for CEO turnover. After the creation of the
variable, the observations of 2014 and 2015 are dropped.
Furthermore, observations that contain missing values in variables that are used in the
regression are dropped. Also variables that contain wrong information are dropped, such as a
negative amount of long-term incentives. Each of the variables included is checked for missing
values and specific errors. After correcting for this kind of errors, the remaining sample consists
of 11,636 observations (table 1). Table 1: Final sample after dropped observations
Number of observations
Begin sample 21,353
Less: Data from 2014 and 2015 2,015
Less: Missing values and negative
amounts in observations for
creation of LTINC
452
Less: Missing values in observations
for creation of MtoB
1,817
Less: Missing values in observations
for creation of ZSCORE
5,423
Less: Missing values in observation
for variable Age
10
Final sample 11,636

18
4.2 Methodology
An ordinary least squares analysis is conducted to research the effect of a short horizon on the
compensation structure. The dependent variable is the percentage of long-term incentives in
comparison with the total compensation. The independent variables are two proxies for the
horizon problem. Six control variables are added. The following formula is created:
𝐿𝑇𝐼𝑁𝐶 = 𝛽! + 𝛽!𝑂𝐿10𝑃 + 𝛽!𝐶𝐸𝑂𝑇𝑂 + 𝛽!𝑂𝐿10𝑃 ∗ 𝐶𝐸𝑂𝑇𝑂 + β!𝑌𝑂10𝑃 + β!𝐺𝐸𝑁
+ β!𝑆𝐼𝑍𝐸 + β!𝑅𝑂𝐴 + β!𝑀𝑡𝑜𝐵 + β!𝑍𝑆𝐶𝑂𝑅𝐸 + β!!𝐼𝑁𝐷 + ε
LTINC = Percentage long-term incentives in relation to total compensation OL10P = 10% oldest CEOs (oldest 10% = 1, other = 0) CEOTO = CEO turnover (leave next year = 1, leave in two years = 2) YO10P = 10% youngest CEOs (youngest 10% = 1, other = 0) GEN= Gender (male = 1, female = 0) SIZE = Firm size (logarithm of total assets) ROA = Return on assets (net income/total assets) MtoB = Market to book ratio (Market value/shareholder’s equity) ZSCORE = Z-score IND = Firm industry group (1-digit SIC)
The two proxies for short horizons are: CEO turnover and CEO age. For both variables,
dummies are created. CEO turnover comprises information about CEOs that left the next year
or the year after. CEO age is split into two variables, one for the 10% oldest CEOs and one for
the 10% youngest CEOs.
For the proxies CEOTO (CEO turnover) and OL10P (10% oldest CEOs) an interaction
effect is expected. The oldest 10% of the CEOs will have already reached the retirement age,
which increases the chance of them leaving the firm. Therefore, the interaction effect implies that
when CEOs are older, the CEO turnover will be higher.
The variable SIZE is added to control for firm size. The variable consists of the logarithm
of total assets. The larger the firm, the bigger the responsibilities will be for the CEOs. Therefore,
the total compensation of the CEO of a large firm will be higher than for a CEO of a smaller
firm. Wright et al. (2002) researched if compensation of CEOs changes when the firm size
increases. They found that there is a positive relationship between firm size and CEO
compensation. Also Dutta et al. (2011) found the same relationship.
Several researchers have shown that females are more risk averse than males (Khan and
Vieito, 2013; Croson and Gneezy, 2009; Powell and Ansic, 1997). Their evidence suggests that
companies should adapt the compensation structure to the gender of the CEO. When females
are more risk averse, they should receive more long-term incentives to motivate them to invest in

19
new projects that can results in an increase in the firm value. Therefore, a control variable for
gender is added (GEN).
The control variables ROA (return on assets) and MtoB (market to book ratio) are also
added to the regression. Davila and Penalva (2006) claim that when CEOs are evaluated more on
accounting performance measures, such as the return on assets and the market to book ratio,
they generally receive more cash-based compensation. Therefore, in these firms there would be a
positive relationship between the accounting performance measures and the received short-term
incentives. However, Mehran (1995) found evidence for a positive relation between financial
performance and long-term incentives. He used return on assets as a proxy for financial
performance and found a positive correlation between the return on assets and the percentage of
compensation that is equity based.
The control variable ZSCORE is calculated according to the z-score formula of Altman1
(1968). The z-score can be used to calculate the credit risk of a company, which in other words
stands for the possibility of bankruptcy. The lower the z-score, the higher the chance of
bankruptcy for a company. Gilson and Vetsuypens (1993) investigated the relationship between
CEO compensation and bankruptcy. They found that companies adapt the compensation of
CEOs when they are in financial trouble to incentivize them to reduce their financial problems.
Also, they found that companies reduce the salaries and bonuses for CEOs in this kind of
situations.
Furthermore, the industry of the firm has an impact on the CEO compensation. For
example, investments are more important for investment companies than for other companies.
The compensation of these companies would be more focused on investments in comparison
with other companies. For this reason, the control variable IND is added. Kostiuk (1990)
researched the relationship between firm size and firm industry and the compensation of
managers. He found that not only firm size has an impact on the compensation, but also industry
characteristics have a significant impact on the incomes of managers. The variable IND is created
based on the 1-digit SIC codes of the companies in the sample.
1 Altman’s Z-score = 0.012X1 + 0.014X2 + 0.033X3 + 0.006X4 + 0.999X5 X1 = working capital/total assets X2 = retained earnings/total assets X3 = earnings before interest and taxes/total assets X4 = market value equity / book value of total debt X5 = sales/total assets
20
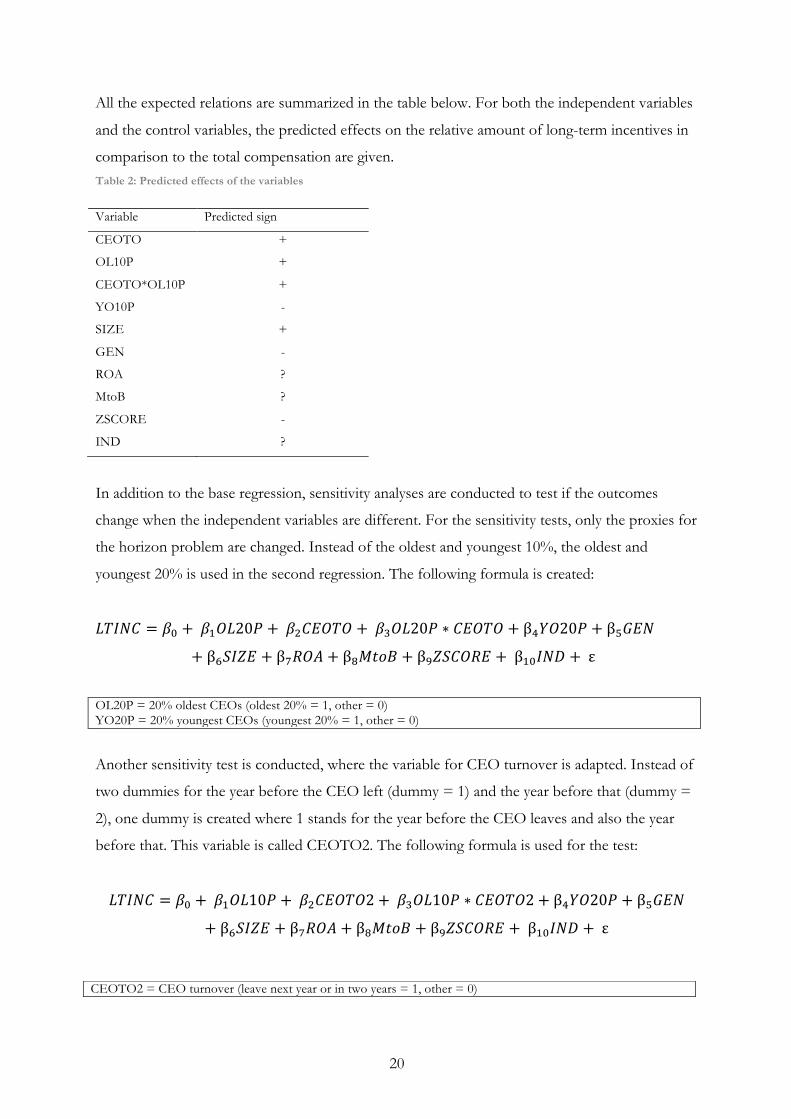
All the expected relations are summarized in the table below. For both the independent variables
and the control variables, the predicted effects on the relative amount of long-term incentives in
comparison to the total compensation are given. Table 2: Predicted effects of the variables
In addition to the base regression, sensitivity analyses are conducted to test if the outcomes
change when the independent variables are different. For the sensitivity tests, only the proxies for
the horizon problem are changed. Instead of the oldest and youngest 10%, the oldest and
youngest 20% is used in the second regression. The following formula is created:
𝐿𝑇𝐼𝑁𝐶 = 𝛽! + 𝛽!𝑂𝐿20𝑃 + 𝛽!𝐶𝐸𝑂𝑇𝑂 + 𝛽!𝑂𝐿20𝑃 ∗ 𝐶𝐸𝑂𝑇𝑂 + β!𝑌𝑂20𝑃 + β!𝐺𝐸𝑁
+ β!𝑆𝐼𝑍𝐸 + β!𝑅𝑂𝐴 + β!𝑀𝑡𝑜𝐵 + β!𝑍𝑆𝐶𝑂𝑅𝐸 + β!"𝐼𝑁𝐷 + ε
OL20P = 20% oldest CEOs (oldest 20% = 1, other = 0) YO20P = 20% youngest CEOs (youngest 20% = 1, other = 0)
Another sensitivity test is conducted, where the variable for CEO turnover is adapted. Instead of
two dummies for the year before the CEO left (dummy = 1) and the year before that (dummy =
2), one dummy is created where 1 stands for the year before the CEO leaves and also the year
before that. This variable is called CEOTO2. The following formula is used for the test:
𝐿𝑇𝐼𝑁𝐶 = 𝛽! + 𝛽!𝑂𝐿10𝑃 + 𝛽!𝐶𝐸𝑂𝑇𝑂2+ 𝛽!𝑂𝐿10𝑃 ∗ 𝐶𝐸𝑂𝑇𝑂2+ β!𝑌𝑂20𝑃 + β!𝐺𝐸𝑁
+ β!𝑆𝐼𝑍𝐸 + β!𝑅𝑂𝐴 + β!𝑀𝑡𝑜𝐵 + β!𝑍𝑆𝐶𝑂𝑅𝐸 + β!"𝐼𝑁𝐷 + ε
Variable Predicted sign
CEOTO +
OL10P +
CEOTO*OL10P +
YO10P -
SIZE +
GEN -
ROA ?
MtoB ?
ZSCORE -
IND ?
CEOTO2 = CEO turnover (leave next year or in two years = 1, other = 0)

21
5 Descriptive statistics and empirical results
In this section, first a description of the statistics is given. Thereafter, the main regression model
is checked for multicollinearity. One regression model is created to test whether the hypotheses
are supported. Two extra regressions are created to test the sensitivity of the results. The results
of the regression models are also discussed in this chapter.
5.1 Descr ipt ive s tat i s t i c s Table 3: Descriptive statistics for compensation data (n = 11,636)
Variables Mean Std. Dev. Min Max
Total compensation
($)
5923.804 7074.071 0.745 134457.9
Long-term incentives
($)
4669.454 6338.179 1.3315 129126.4
Short-term incentives
(salary and bonus) ($)
1207.225 1781.678 0.001 77926
Percentage of long-
term incentives
(LTINC)
67.13% 24.4100 3.06% 100%
The total compensation of CEOs can be divided between short-term incentives, long-term
incentives and other compensation. The total amount of long-term incentives is calculated
through deducting salary, bonuses and other compensation from the total compensation. Other
compensation comprises components that are not really short-term or long-term incentives, such
as perquisites, tax related payments, severance payment and signing bonuses. On average CEOs
receive $5.923.804 per year, where 67.13% of this amount consists of long-term incentives. The
average amount of long-term incentives is $4.669.454.
22
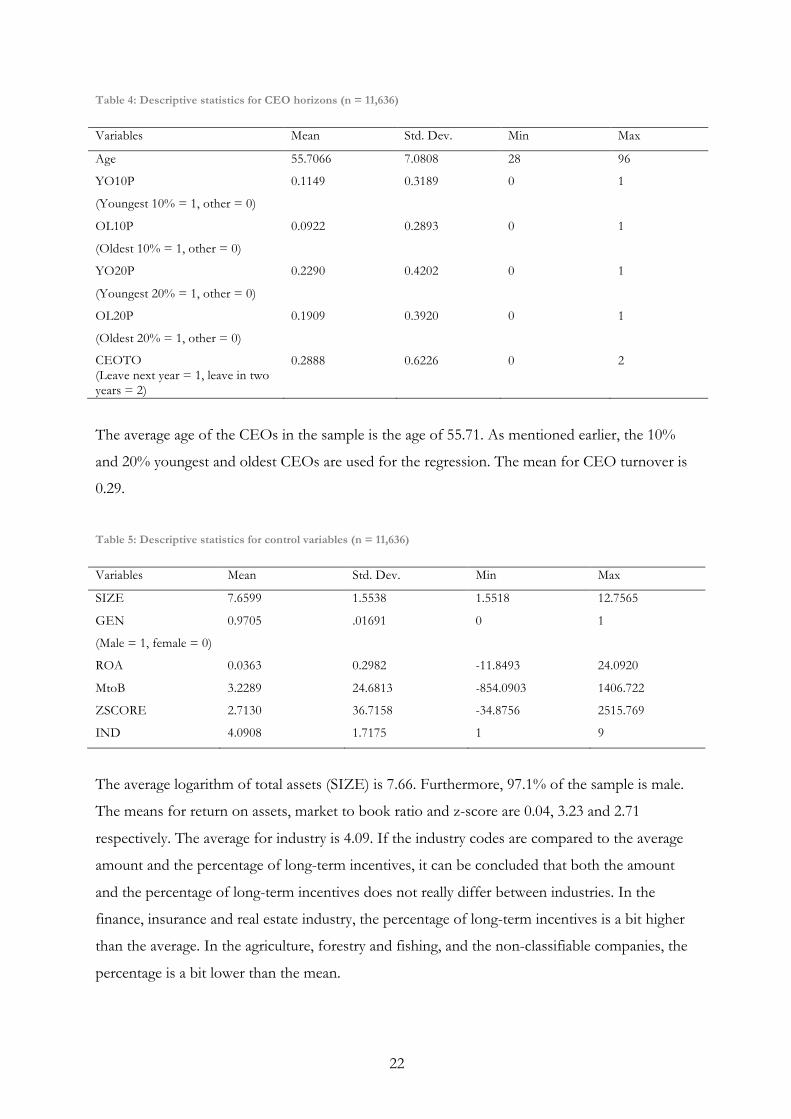
Table 4: Descriptive statistics for CEO horizons (n = 11,636)
Variables Mean Std. Dev. Min Max
Age 55.7066 7.0808 28 96
YO10P
(Youngest 10% = 1, other = 0)
0.1149 0.3189 0 1
OL10P
(Oldest 10% = 1, other = 0)
0.0922 0.2893 0 1
YO20P
(Youngest 20% = 1, other = 0)
0.2290 0.4202 0 1
OL20P
(Oldest 20% = 1, other = 0)
0.1909 0.3920 0 1
CEOTO (Leave next year = 1, leave in two years = 2)
0.2888 0.6226 0 2
The average age of the CEOs in the sample is the age of 55.71. As mentioned earlier, the 10%
and 20% youngest and oldest CEOs are used for the regression. The mean for CEO turnover is
0.29.
Table 5: Descriptive statistics for control variables (n = 11,636)
Variables Mean Std. Dev. Min Max
SIZE 7.6599 1.5538 1.5518 12.7565
GEN
(Male = 1, female = 0)
0.9705 .01691 0 1
ROA 0.0363 0.2982 -11.8493 24.0920
MtoB 3.2289 24.6813 -854.0903 1406.722
ZSCORE 2.7130 36.7158 -34.8756 2515.769
IND 4.0908 1.7175 1 9
The average logarithm of total assets (SIZE) is 7.66. Furthermore, 97.1% of the sample is male.
The means for return on assets, market to book ratio and z-score are 0.04, 3.23 and 2.71
respectively. The average for industry is 4.09. If the industry codes are compared to the average
amount and the percentage of long-term incentives, it can be concluded that both the amount
and the percentage of long-term incentives does not really differ between industries. In the
finance, insurance and real estate industry, the percentage of long-term incentives is a bit higher
than the average. In the agriculture, forestry and fishing, and the non-classifiable companies, the
percentage is a bit lower than the mean.

23
Table 6: Average amount and percentage of long-term incentives per industry (n = 11,636)
1-digit SIC code Industry Frequencies Average amount of
long-term incentives
($)
Average
percentage of
long-term
incentives
1 Agriculture, forestry
and fishing
42 4441.1966 59.99%
2 Mining and
construction
827 5931.7537 69.45%
3 Manufacturing 5907 4558.0073 67.81%
4 Transportation,
communications,
electric, gas and
sanitary service
974 5419.1376 63.86%
5 Wholesale trade and
retail trade
1585 4257.2645 65.45%
6 Finance, insurance and
real estate
339 4716.7868 70.44%
7 Services 1397 4614.949 67.27%
8 Public administration 535 3966.1945 65.58%
9 Non-classifiable 30 4117.8064 57.01%
Average 4669.454 67,13%
5.2 Multi co l l ineari ty
To make sure the regression model is accurate, I test for multicollinearity by creating a
correlation matrix. In appendix 2 (table 12), a correlation matrix is presented including the
dependent, independent and control variables. As seen in the matrix, there is no sign of
multicollinearity.

24
5.3 Regress ion analys is Table 7: Regression analysis (n = 11,636)
Variable Predicted
sign
Coefficient Standard
error
T-value P-value
CEOTO
Dummy = 1 + -2.9560 0.7431 -3.98 0.000***
Dummy = 2 + -2.1887 0.7803 -2.80 0.005***
OL10P + -7.8653 0.8865 -8.87 0.000***
CEOTO*OL10P
1*1 + -1.2595 1.8683 -0.67 0.500
2*1 + 1.3765 2.1627 0.64 0.524
YO10P - 0.8863 0.6612 1.34 0.180
SIZE + 6.0275 0.1357 44.40 0.000***
GEN - -1.5761 1.2280 -1.28 0.199
ROA ? 1.7500 0.6983 2.51 0.012**
MtoB ? 0.0173 0.0084 2.06 0.039**
ZSCORE - 0.0009 0.0056 0.16 0.874
IND ? 0.3052 0.1220 2.50 0.012**
Intercept 22.2636 1.6975 12.87 0.000***
***,**,*, Significant on a 1%, 5%, 10% level
R-squared = 0.1626
Adj. R-squared = 0.1617
Table 6 presents the results of the regression. The adjusted r-squared for the regression is
16.17%, which means that 16,17% of the total variation is explained in the regression model.
With respect to CEO turnover, the results are contrary to my expectations. There is a
negative significant relation between CEO turnover and the percentage of long-term incentives (t
= -3.98; sig. = 0.000; and t = -2.8; sig. = 0.005). This means that in the years before the CEO
leaves, the percentage of long-term incentives decreases. This effect is stronger in the year before
the CEO actually left. Therefore, hypothesis 2 has to be rejected. However with caution, because
it is not known for sure if the companies are aware of the intentions of the CEOs. An opposite
effect is also found for the variable for oldest 10% CEOs. A negative relation is found between
the oldest 10% of CEOs and the percentage of long-term incentives (t = -8.87; sig. = 0.000). This
means, hypothesis 1 is rejected. For the variable of the youngest 10%, no significant relation is
found.
The variables CEO turnover and oldest 10% are used for the interaction effect. As seen
in the model, no significant interaction effect between the variables is found. Hereby, hypothesis
3 has to be rejected as well.

25
The control variables SIZE (t = 44.4; sig. = 0.000), ROA (t = 2.51; sig. = 0.012) and
MtoB (t = 2.06; sig. = 0.039) are positively correlated with the percentage of long-term
incentives. For the variable SIZE, this is consistent with prior research. For ROA and MtoB no
prediction could be made, but both relationships seems to be positive and significant on a 5%
level. The results suggest no significant relationships for the control variables for gender (GEN)
and z-score (ZSCORE).
Furthermore, the results for the control variable of IND implicate a positive relationship
between IND and the percentage of long-term incentives (t = 2.50; sig. = 0.012). From this I
conclude that firms that are more service oriented (1-digit SIC numbers above 4) provide their
CEOs with relatively more long-term incentives.
To make sure there are no problems with multicollinearity between variables, an extra test
is conducted in addition to the correlation matrix. This is a Variance Inflation Factor (VIF) test.
The highest VIF value is 1.54 and the mean VIF value is 1.16, which confirms that there is no
multicollinearity problem (appendix 3, table 13).

26
5.4 Sensi t iv i ty analyses Table 8: Sensitivity test (1) (n = 11,636)
Variable Predicted
sign
Coefficient Standard
error
T-value P-value
CEOTO
Dummy = 1 + -2.0224 0.8318 -2.43 0.015**
Dummy = 2 + -1.6552 0.8657 -1.91 0.056*
OL20P + -6.1366 0.6584 -9.32 0.000***
CEOTO*OL20P
1*1 + -1.9546 1.4717 -0.33 0.184
2*1 + 0.4808 1.6127 0.30 0.766
YO20P - 0.9948 0.5173 1.92 0.054*
SIZE + 6.1001 0.1357 44.96 0.000***
GEN - -1.2942 1.2268 -1.05 0.291
ROA ? 1.7529 0.6974 2.51 0.012**
MtoB ? 0.0175 0.0084 2.08 0.037**
ZSCORE - 0.0007 0.0056 0.12 0.902
IND ? 0.2678 0.1219 2.20 0.028**
Intercept 21.8120 1.7391 12.54 0.000***
***,**,*, Significant on a 1%, 5%, 10% level
R-squared = 0.1649
Adj. R-squared = 0.1641
For the second regression model, the variables of 10% oldest and 10% youngest CEOs are
changed in variables for the 20% oldest and 20% youngest CEOs. The adjusted r-squared for this
regression model is 16.41%, which means that 16,41% of the total variation is explained by this
second regression model. This is 0.24% more than the first model.
The regression checks how sensitive the previous regression is on the created
independent variables of age. In general, the regression gives the same results. The level of
significant of some variables varies in this model compared to the previous model. Only one
extra variable is significant in this model, this is YO20P. The relation is positive and significant
on a 10% level (t = 1.92; sig. = 0.054). This would suggest that when the age is divided in bigger
groups and the youngest 20% of the CEOs is compared to the compensation structure, a relation
is would. The evidence implies that younger CEOs receive relatively more long-term incentives
than older CEOS, which is contrary to the prediction.
The Variance Inflation Factor (VIF) test for this regression gives 1.85 as the highest VIF
value and a mean VIF value of 1.27 (appendix 3, table 13). This confirms that there is no sign of

27
multicollinearity.
Table 9: Sensitivity test (2) (n = 11,636)
Variable Predicted
sign
Coefficient Standard
error
T-value P-value
CEOTO2 + -2.5929 0.5632 -4.59 0.000***
OL10P + -7.8672 0.8865 -8.87 0.000***
CEOTO2*OL10P + -0.2657 1.5402 -0.17 0.863
YO10P - 0.8809 0.6612 1.33 0.183
SIZE + 6.0246 0.1357 44.38 0.000***
GEN - -1.5713 1.2280 -1.28 0.201
ROA ? 1.7642 0.6982 2.53 0.012**
MtoB ? 0.0172 0.0084 2.05 0.040**
ZSCORE - 0.0009 0.0056 0.16 0.875
IND ? 0.3036 0.1220 2.49 0.013**
Intercept 22.2884 1.7301 12.88 0.000***
***,**,*, Significant on a 1%, 5%, 10% level
R-squared = 0.1624
Adj. R-squared = 0.1616
Table 8 presents the results of the regression where the variable for CEO turnover is changed
into one dummy instead of two. The adjusted r-squared for the model is 16,16%. Compared to
previous models, this model has less explanatory power. The model does not give different
results or extra significant relationships.
Again there is no sign of multicollinearity. The highest VIF value is 1.72 and the mean
VIF value is 1.15 (appendix 3, table 13).

28
5.5 Summary o f the empir i ca l resul ts
As a summary of all the conducted regressions, the following table is given. All the created
models are summarized and the findings are briefly discussed. Table 10: Summary of results
Summary of regression
Hypothesis Summary Findings
Firms use more long-term incentives in
determining the compensation for CEOs
when the CEO is older
Two variables are created, namely 10%
oldest and 10% youngest CEOs. The
relation between these variables and
the percentage of long-term incentives
is examined
Negative significant relation
between the oldest 10% of
the CEOs and the
percentage of long-term
incentives
Firms use more long-term incentives in
determining the compensation for CEOs
when the CEO has the intention to leave
One variable is created for CEO
turnover. The variable consists of two
dummies. One dummy for the year
before the CEO left (dummy = 1) and
another for the year before that
(dummy = 2). The relation between
the variable and the percentage of
long-term incentives is examined
Negative significant relation
between CEO turnover and
the percentage of long-term
incentives. The effect is
stronger in the year before
the CEO leaves than two
years before leaving
CEOs that are older are more likely to
have the intention to leave the firm
The interaction effect between the
variables of CEO turnover and the
10% oldest CEOs is investigated
No interaction effect
between the variables is
found
Summary of sensitivity analyses
Sensitivity analyses Summary Findings
Sensitivity test (1) The variables of 10% oldest and 10%
youngest CEOs are changed into
variables for the 20% oldest and 20%
youngest CEOs
Overall, same results are
found. One extra relation is
significant in this model,
this is the positive relation
between the youngest 20%
and the percentage of long-
term incentives
Sensitivity test (2) The variable for CEO turnover is
changed into one dummy for both one
and two year before the CEO leaves
instead of two separate dummies
Overall, same results are
found. The model shows no
extra significant relations

29
6 Summary and conclusion
In this last chapter, a short summary is given of the total research that is conducted. A conclusion
is added where the contribution, the results and possible explanations for these results are
discussed. In the last part, the limitations of the study are provided.
6.1 Summary
In this research the effect of the horizon problem on the structure of the CEO compensation is
examined. The horizon problem arises when the career horizon of a CEO shortens. Reasons for
a shorter career horizon are, for example, when a CEO nears retirement and when a CEO has
the intention to leave the firm. When these events occur, CEOs will stop working for the firm
soon and therefore their interest in the future value of the firm will weaken. In conclusion, the
horizon problem leads to a change in the interests of the CEO. When a CEO is not provided
with a lot of long-term incentives, he will try to increase the short-term results because his bonus
depends on this. Several researchers investigated the impact of short career horizons of CEOs on
their actions and found that CEOs make different decisions when the horizon problem is present
(e.g. McClelland et al., 2012; Gray and Cannella, 1997; Dechow and Sloan, 1991).
Drawing on the agency theory (Jensen and Meckling, 1976), the interests of the CEO
have to be aligned with those of the firm. Providing the CEO with more long-term incentives is a
way to align these interests, since it shifts the focus on short-term results to a focus on future
firm value. Consequently, financial rewards of the CEOs are more dependent on long-term
results. Looking at the expectancy theory (Vroom, 1964), there need to be more weight on the
link between an increase in firm value and the rewards from long-term incentives to reduce the
horizon problem. Also, the reinforcement of long-term incentives should be bigger when dealing
with the horizon problem. Therefore, the reinforcement theory applies (Komaki et al., 1996).
Taking all these theories together, providing the CEO with long-term incentives can extend the
horizon of the CEO. However, this is only possible when a large amount of their financial
rewards depend on these incentives.
Because adaption of the CEO compensation structure is a way to solve the horizon
problem, the following research question is developed: Do firms change the CEOs compensation
structure when the horizon problem is present?
Two hypotheses are created to research the question. Another hypothesis is added to
examine an interaction effect. The first hypothesis looks at the provision of long-term incentives
when a CEO nears retirement:

30
H1: Firms use more long-term incentives in determining the compensation for CEOs when the CEO is older.
The second hypothesis is created with another indicator for the horizon problem, namely
when a CEO plans to leave the firm:
H2: Firms use more long-term incentives in determining the compensation for CEOs when the CEO has the
intention to leave.
The last hypothesis researches the interaction effect between the two proxies used for the
horizon problem. I predict that when CEOs are older, the chance of turnover is higher:
H3: CEOs that are older are more likely to have the intention to leave the firm.
The research question is answered using an ordinary least square analysis. The dependent
variable used is the percentage of long-term incentives in comparison with the total
compensation. The independent variables are two proxies for the horizon problem, namely CEO
age (hypothesis 1) and CEO turnover (hypothesis 2). Two variables are created to investigate the
effect of CEO age, namely 10% oldest and 10% youngest CEOs. For the creation of these
variables, the 10% oldest and the 10% youngest CEOs are taken from the sample and dummies
are created were CEOs that belong to these groups get a one. CEO turnover comprises a variable
where two dummies are created, one dummy for the year before the CEO leaves and one for two
years before the CEO leaves. Furthermore, six control variables are added that might affect the
compensation structure (gender, firm size, return on assets, market to book ratio, z-score, firm
industry).
The regression model gives contrasting results to my expectations. All hypotheses are
rejected. The results suggest that when the indicators for the horizon problem are present, which
means that CEOs are older or have the intention to leave, CEOs receive less long-term
incentives. This relation is found for both indicators. Also no significant interaction effect was
found, which suggests that there is no significant relation between CEO age and CEO turnover.
Additional regression analyses are conducted to test the sensitivity of the results. In these
models, the independent variables are changed. The proxies used to test CEO age, 10% oldest
and 10% youngest CEOs, are changed into 20% oldest and 20% youngest CEOs. One extra
relation is significant in this model compared to the first regression. For CEO turnover, the
variable is changed into one dummy for the year before the CEOs leaves and two years before
the CEO leaves. In the original regression, two different dummies were created for this. In
general, these models give the same results.
6.2 Conclusion
Prior research examined the effect of the horizon problem on the action of CEOs. Also several

31
determinants of CEO compensation are already investigated. Nevertheless, the horizon problem
as a determinant of the compensation structure has not yet been researched extensively.
Smith and Watts (1982) first introduced the horizon problem and stated that the cause of
the horizon problem is the retirement of a CEO. However, retirement is not the only reason why
CEOs would leave the company. Still most researchers (e.g. Kalyta, 2009; Davidson et al., 2007;
McClelland et al. 2012) only looked at retirement when examining the horizon problem. In this
study, two indicators for the horizon problem are examined. CEO turnover is added to the
regression, because CEOs change jobs for several more reasons than their retirement. They could
go work for a different firm. The variable for CEO turnover leads to an extra contribution to the
existing literature where the current literature is mainly focused on retirement.
The overall results contribute to the existing literature in showing what firms do to
control for the horizon problem. Moreover, evidence is found that firm actually do not control
for it. Instead of solving the excessive focus on short-term results by providing the CEO with
more long-term incentives, firms adapt the structure in a way that could increase the horizon
problem. When there are indicators for the presence of the horizon problems, firms provide
CEOs with less long-term incentives than normal. Evidence is found for both the indicators of
the horizon problem. When CEOs are older, they receive more long-term incentives in
comparison to their total compensation. In their final years at the firm, CEOs also receive more
long-term incentives in comparison to their total compensation. These final years are not related
to age. Moreover, in the last sensitivity test an extra significant relation is found. This is a positive
relation between the 20% youngest CEOs and the relative amount of long-term incentives. The
evidence from this regression indicates that when CEOs are younger they are provided with
more long-term incentives in comparison to their total compensation.
There are possible explanations for the contrary results. It may be the case that firms just
do not take the determinants of the horizon problem under consideration when creating the
compensation structure. This would mean that firms do not know about the horizon problem
and consequently, they are not aware of the evidence from prior research on the effect of the
actions of CEOs. However, this would not explain the fact that the youngest CEOs receive more
long-term incentives, which is odd. One possibility is that firms may be trying to tie the younger
CEOs to the firm. Nevertheless, this relation is only significant when 20% of the CEOs of the
sample are taken into account when creating the variable instead of 10% of the CEOs. Also the
findings of this research raise questions about the independence of the compensation committee.
It indicates that CEOs get exactly what they want and that may be a little too coincidental.

32
6.3 Limitat ions
Future research should look into the actual independence of members of the compensation
committee and the possible influence of CEOs on this committee and their members. These
further investigations may explain the contrary results and the lack in information decreases the
explanatory power of the results. In addition, the results would have been stronger or could have
been different if I were able to control for independence of the compensation committee.
Another suggestion for future research is the investigation of possible actions to decrease
the horizon problem. Adaption of the compensation structure is already proven to be effective in
aligning the interests of the CEO and the shareholder, but evidence in this study suggests that
firms do not take this into account. However, there could be other ways to deal with agency
problems and the horizon problem, such as performing more monitoring activities to check the
actions of the CEO. Future research should focus on examining if firms take other actions to
prevent the horizon problem.
Also, the effectiveness of adaption of the CEO compensation structure to prevent the
horizon problem could depend on the kind of stocks that are provided to the CEO. For
example, firms can choose to restrict the stocks that they provide. As discussed in the literature
review, Carter et al. (2007) found contrary results in their investigation of the relation between
financial reporting concerns and the provision of stock options. They found a positive relation
for stock options and they found a negative relation for restricted stock options. The data for my
research was gathered from Compustat ExecuComp, but not all information is available in this
database. The database makes no distinction between the kinds of stocks that the CEO is
provided with. If this distinction could be made, the compensation structure could be determined
more precisely. This could lead to a more in depth research of the effects of CEO compensation
structure on actions of the CEO. Also, the actions of the firms in controlling for the horizon
problem could be examined in more depth.
Unfortunately, a lot of observation had to by dropped in this study due to incomplete
variables in the sample. In the beginning the sample consisted of 21,353 observations and after
several checks 11,636 observations remained. This means approximately 46% of the observations
had to be dropped, which made the sample a lot smaller. A larger sample would have increased
the reliability of the findings.

33
References
Altman, E. I. (1968). Financial ratios, discriminant analysis and the prediction of corporate
bankruptcy. The journal of finance, 23(4), 589-609.
Balsam, S., & Miharjo, S. (2007). The effect of equity compensation on voluntary executive
turnover. Journal of Accounting and Economics, 43(1), 95-119.
Belliveau, M. A., O'Reilly, C. A., & Wade, J. B. (1996). Social capital at the top: Effects of social
similarity and status on CEO compensation. Academy of management Journal, 39(6), 1568-
1593.
Berger, P. G., Ofek, E., & Yermack, D. L. (1997). Managerial entrenchment and capital structure
decisions. The journal of finance, 52(4), 1411-1438.
Boyd, B. K. (1994). Board control and CEO compensation. Strategic Management Journal, 15(5),
335-344.
Cammann, C., & Lawler, E. E. (1973). Employee reactions to a pay incentive plan. Journal of
Applied Psychology, 58(2), 163.
Carter, M. E., Lynch, L. J., & Tuna, I. (2007). The role of accounting in the design of CEO equity
compensation. The Accounting Review, 82(2), 327-357.
Cheng, S. (2004). R&D Expenditures and CEO Compensation. The Accounting Review, 79(2),
305-328.
Clementi, G. L., & Cooley, T. F. (2009). Executive compensation: facts (No. w15426). National
Bureau of Economic Research.
Coles, J. L., Daniel, N. D., & Naveen, L. (2006). Managerial incentives and risk-taking. Journal of
financial Economics, 79(2), 431-468.
Conlon, E. J., & Parks, J. M. (1990). Effects of monitoring and tradition on compensation
arrangements: An experiment with principal-agent dyads. Academy of Management
journal, 33(3), 603-622.
Croson, R., & Gneezy, U. (2009). Gender differences in preferences. Journal of Economic
literature, 47(2), 448-474.
Grossman, W., & Hoskisson, R. E. (1998). CEO pay at the crossroads of Wall Street and Main:
Toward the strategic design of executive compensation. The Academy of Management
Executive, 12(1), 43-57.
Daily, C.M., Johnson, J.L., Ellstrand, A.E., & Dalton, D.R. (1998). Compensation committee
composition as a determinant of CEO compensation. Academy of Management Journal 41(2),
209-220.
34
David, P., Kochhar, R., & Levitas, E. (1998). The effect of institutional investors on the level and
mix of CEO compensation. Academy of Management Journal, 41(2), 200-208. Davidson III, W. N., Xie, B., Xu, W., & Ning, Y. (2007). The influence of executive age, career
horizon and incentives on pre-turnover earnings management. Journal of Management &
Governance, 11(1), 45-60.
Davila, A., & Penalva, F. (2006). Governance structure and the weighting of performance
measures in CEO compensation. Review of Accounting Studies, 11(4), 463-493.
Dechow, P. M., & Sloan, R. G. (1991). Executive incentives and the horizon problem. Journal of
Accounting and Economics, 14(1), 51-89.
Devos, E., Elliott, W. B. & Warr, R. S. (2015). CEO opportunism?: Option grants and stock
trades around. Journal of Accounting and Economics, 60(1), 18-35.
Dong, Z., Wang, C., & Xie, F. (2010). Do executive stock options induce excessive risk taking?
Journal of Banking & Finance, 34(10), 2518-2529.
Dutta, S., MacAulay, K., & Saadi, S. (2011). CEO power, M&A decisions, and market reactions.
Journal of Multinational Financial Management, 21(5), 257-278.
Efendi, J., Srivastava, A., & Swanson, E. P. (2007). Why do corporate managers misstate financial
statements? The role of option compensation and other factors. Journal of Financial
Economics, 85(3), 667-708.
Eisenhardt, K. M. (1985). Control: Organizational and economic approaches. Management
science, 31(2), 134-149.
Eisenhardt, K. M. (1989). Agency theory: An assessment and review. Academy of management
review, 14(1), 57-74.
Fama, E. F., & Jensen, M. C. (1983). Separation of ownership and control. The Journal of Law &
Economics, 26(2), 301-325.
Gilson, S. C., & Vetsuypens, M. R. (1993). CEO compensation in financially distressed firms: An
empirical analysis. The Journal of Finance, 48(2), 425-458.
Gopalan, R., Milbourn, T., Song, F., & Thakor, A. V. (2014). Duration of executive
compensation. The Journal of Finance, 69(6), 2777-2817.
Gormley, T. A., Matsa, D. A., & Milbourn, T. (2013). CEO compensation and corporate risk:
Evidence from a natural experiment. Journal of Accounting and Economics, 56(2), 79-101.
Gray, S. R., & Cannella, A. A. (1997). The role and risk in executive compensation. Journal of
Management, 23(4), 517-540.
Huddart, S., & Lang, M. (1996). Employee stock option exercises an empirical analysis. Journal of
Accounting and Economics, 21(1), 5-43.

35
Jensen, M. C., & Meckling, W. H. (1976). Theory of the Firm: Managerial behavior, agency costs
and ownership structure. Journal of financial economics, 3(4), 305-360.
Kalyta, P. (2009). Accounting discretion, horizon problem, and CEO retirement benefits. The
Accounting Review, 84(5), 1553-1573.
Komaki, J., Waddell, W. M., & Pearce, M. G. (1977). The applied behavior analysis approach and
individual employees: Improving performance in two small businesses. Organizational
Behavior and Human Performance, 19(2), 337-352.
Khan, W. A., & Vieito, J. P. (2013). CEO gender and firm performance. Journal of Economics
and Business, 67, 55-66.
Kostiuk, P. F. (1990). Firm size and executive compensation. Journal of human Resources, 25(1), 90-
105.
Libby, R. (1981). Accounting and human information processing: Theory and applications. Michigan:
Prentice Hall.
Matta, E., & Beamish, P. W. (2008). The accentuated CEO career horizon problem: Evidence
from international acquisitions. Strategic Management Journal, 29(7), 683-700.
McClelland, P. L., Barker, V. L., & Oh, W. Y. (2012). CEO career horizon and tenure: Future
performance implications under different contingencies. Journal of Business Research, 65(9),
1387-1393.
Mehran, H. (1995). Executive compensation structure, ownership, and firm performance. Journal
of financial economics, 38(2), 163-184.
Otto, C. A. (2014). CEO optimism and incentive compensation. Journal of Financial Economics,
114(2), 366-404.
Powell, M., & Ansic, D. (1997). Gender differences in risk behaviour in financial decision-
making: An experimental analysis. Journal of economic psychology, 18(6), 605-628.
Smith, C. W., & Watts, R. L. (1982). Incentive and tax effects of executive compensation plans.
Australian Journal of Management, 7(2), 139-157.
Vroom, V. H. (1964). Work and Motivation. New York: Wiley & Sons.
Wright, P., Kroll, M. & Elenkov, D. (2002). Acquisition Returns, Increase in Firm Size, and Chief
Executive Officer Compensation: The Moderating Role of Monitoring. The Academy of
Management Journal, 45(3), 599-608.
Yermack, D. (1995). Do corporations award CEO stock options effectively? Journal of Financial
Economics, 39(2), 237-269.

36
Appendix
Appendix 1 Table 11: Summary of key literature
Section 2.3: The horizon problem Paper Sample Research design Key results Carter et al. (2007) U.S. listed firms from
1995-2001, 6,242 CEO-year observations
Examined the relation between financial reporting concerns and equity compensation Separated stock options, restricted stock options and total compensation
Positive relationship between financial reporting concerns and the provision of stock options. Negative relation between financial reporting concerns and the provision of restricted stock options
Boyd (1994) Data collected in 1980, 193 firms in 12 different industries
Looked at the relation between CEO compensation and board control
Negative relation between salaries and control levels
Daily et al. (1998) 200 public firms from the 1992 Fortune 500
Investigated the relation between independence of members of the compensation committee and CEO compensation
No relationship between the independence of the members of the compensation committee and CEO compensation
Belliveau et al. (1996) 85 public firms from 9 industries, 61 CEO-chairman compensation committee combinations
Examined the effect of social capital on the compensation structure
Negative relation between status of the chairman and the compensation of the CEO. Positive relation between the status of the CEO in comparison with the chairman and the CEO compensation
David et al (1998) 200 largest U.S. firms from 1992-1994
Focused on the effect of institutional investors on the compensation level and the compensation structure Two types of investors, namely: institutional investors and investors that depend on the firm for their own business
The effect of investors on the compensation depended on the nature of their relation. Institutional investors were able to reduce the level of pay and increase the relative proportion of long-term incentives. No significant effect was found for the other type of investors
Kalyta (2009) CEOs from Fortune 1000 firms. Final sample consists of 1,137 CEOs who left the firm between 1997 and 2006
Investigated the effect of the horizon problem on discretionary accounting choices Managerial retirement is used as an prosy for the horizon problem
Positive relationship between CEO retirement arrangements based on firm performance and income-increasing earnings management when CEOs were close to retirement
Davidson et al. (2007) Listed firms in the S&P 1500, data between 1992 and 1998. The sample
Examined the relation between the horizon problem and earnings
Positive relation between CEO retirement and the amount of discretionary

37
comprises 597 CEO turnovers
management Also, they examine the effect of both CEO retirement and CEO compensation structure on earnings management
accruals. This amount is higher when a larger part of the compensation is based on short-term results
McClelland et al. (2012) Random sample of 220 firms from the 2001 S&P 500 list. Final sample consists of 206 firms
Investigated the effects of the horizon problem and CEO tenure on future firm performance Proxy used for the horizon problem is CEO age
Negative relation between age and performance. Relation is stronger when the CEO own a higher level of stocks and shares Results for CEO tenure depend on industry
Gray and Cannella (1997) 750 firm-years observation from large public listed firms from 1980 until 1989
Examined the relation between risk and CEO compensation structure
The compensation structure is used as a tool to influence risk-taking behavior. CEO retirement influences the type of decisions they make
Section 3: Hypotheses Paper Sample Research design Key results Dechow and Sloan (1991) 58 changes in CEOs
between 1979 and 1989 from Forbes CEO compensation survey
Looked at the relation between CEO incentives and investments in the case of CEO turnover Sample consisted of CEOs where the compensation is based on earnings
In their final years, CEOs spend less on R&D and marketing. This effect is weaker when the CEO owns more stocks
Cheng (2004) Sample consists of 160 firms and 192 CEO turnovers from Forbes 500 firms between 1984 and 1997
Examined the effect of changes in CEO compensation structure on R&D spending when the horizon problem is present
Positive relation between changes in R&D investments and changes in CEO compensation structure when the horizon problem is present
Matta et al. (2008) 293 public U.S. firms between 1995 and 1999
Investigated the effect of CEO compensation structure on risk taking behavior when the horizon problem is present
CEOs approaching retirement with a lot of equity holdings and in the money unexercised options are less likely to engage in international acquisitions than CEOs that have less options and equity holdings

38
Appendix 2 Table 12: Correlation matrix
LTINC
(1)
CEOTO
(2)
YO10P
(3)
OL10P
(4)
SIZE
(5)
GEN
(6)
ROA
(7)
MtoB
(8)
ZSCORE
(9)
IND
(10)
1 1.0000
2 -0.0414 1.0000
3 -0.0104 -0.0728 1.0000
4 -0.1195 0.1017 -0.1148 1.0000
5 0.3855 0.0154 -0.0979 -0.0475 1.0000
6 -0.0235 0.0335 0.0102 0.0520 -0.0154 1.0000
7 0.0559 -0.0262 -0.0095 0.0031 0.0864 0.0045 1.0000
8 0.0179 0.0034 0.0080 -0.0004 0.0002 0.0004 0.0173 1.0000
9 -0.0076 -0.0090 -0.0065 -0.0052 -0.0262 0.0043 0.0050 -0.0006 1.0000
10 -0.0238 0.0124 0.0865 -0.0003 -0.1196 -0.0248 -0.0051 0.0057 0.0118 1.0000

39
Appendix 3 Table 13: Variance Inflation Factor (VIF)
Regression Sensitivity test
(1)
Sensitivity test
(2)
Variable VIF 1/VIF Variable VIF 1/VIF Variable VIF 1/VIF
CEOTO CEOTO CEOTO2 1.18 1.847
Dummy = 1 1.23 0.816 Dummy = 1 1.54 0.649
Dummy = 2 1.17 0.852 Dummy = 2 1.45 0.690
OL10P 1.53 0.653 OL20P 1.56 0.639 OL10P 1.53 0.653
CEOTO*OL10P CEOTO*OL20P CEOTO2*OL10P 1.72 0.582
1*1 1.54 0.649 1*1 1.85 0.540
2*1 1.38 0.727 2*1 1.68 0.596
YO10P 1.04 0.965 YO20P 1.10 0.907 YO10P 1.04 0.965
SIZE 1.04 0.965 SIZE 1.04 0.963 SIZE 1.04 0.965
GEN 1.00 0.995 GEN 1.01 0.994 GEN 1.00 0.995
ROA 1.01 0.990 ROA 1.01 0.990 ROA 1.01 0.990
MtoB 1.00 0.999 MtoB 1.00 0.999 MtoB 1.00 0.999
ZSCORE 1.00 0.999 ZSCORE 1.00 0.999 ZSCORE 1.00 0.999
IND 1.02 0.978 IND 1.02 0.977 IND 1.02 0.978
Mean VIF 1.16 Mean VIF 1.27 Mean VIF 1.15