Embed Size (px)
Citation preview
THE EFFECTIVENESS OF FLIPPING CLASSROOM INSTRUCTION WITH
HOMEWORK ASSIGNMENTS SO AS TO INCREASE STUDENT
UNDERSTANDING IN ALGEBRA
by
Charles P. Strobino
A professional paper submitted in partial fulfillment of the requirements for the degree
of
Master of Science
In
Science Education
MONTANA STATE UNIVERSITY Bozeman, Montana
July 2013
ii
STATEMENT OF PERMISSION OF USE
In presenting this professional paper in partial fulfillment of the requirements for a
master’s degree at Montana State University, I agree that the MSSE Program shall make
it available to borrowers under rules of the program.
Charles P. Strobino
July 2013
iii
TABLE OF CONTENTS
INTRODUCTION AND BACKGROUND ........................................................................1
CONCEPTUAL FRAMEWORK ........................................................................................4
METHODOLOGY ..............................................................................................................8
DATA AND ANALYSIS ..................................................................................................11
INTERPRETATION AND CONCLUSION .....................................................................18
VALUE ..............................................................................................................................19
REFERENCES CITED ......................................................................................................21
APPENDICES ...................................................................................................................23
APPENDIX A: Student Homework Survey .....................................................24 APPENDIX B: Student Confidence Survey .....................................................27 APPENDIX C: Student Interview Questions ...................................................30

iv
LIST OF TABLES
1. Data Triangulation Matrix .............................................................................................11
v
LIST OF FIGURES
1. Attitude Towards Algebra Homework...........................................................................12
2. Homework Time Versus Recreational Internet Use ......................................................13
3. Pre and Post Confidence Survey Responses to Selected Questions ..............................16
vi
ABSTRACT
The effectiveness of homework as a means of increasing student understanding in mathematics has been under debate for almost a century. Data collected prior to the control phase of this research showed that 61% of the students in Algebra I classes at E. J. King High School completed less than 90% of their homework. With the development of newer technology and the exponential growth of Internet use, teachers have looked for ways to incorporate these into their classrooms. As a means to increase homework completion rates, test and quiz scores, and student confidence in algebra, a research study was conducted to test the effectiveness of the flipped classroom. In a flipped classroom, the day’s lesson was recorded as a video and posted online for the students to watch as homework. Students took notes and completed a couple of practice problems to receive full credit for a homework assignment. Problems traditionally done for homework were then assigned as class work. Results from this study showed an increase in homework completion rates, test scores, and student confidence in regards to algebra.
1
INTRODUCTION AND BACKGROUND
E. J. King High School is situated on a U.S. Navy base located in Sasebo, Japan.
The U.S. Navy has occupied this port since 1945 with the school opening in 1952.
According to the latest Continuous School Improvement (CSI) report, current enrollment
figures show a student population of 247 in grades 7 thru 12. Grade level sizes are fairly
balanced with the exception of a typically small senior class. E. J. King enjoys a diverse
racial makeup. Twenty seven percent of the student population is racially mixed and
Japanese-American and Philippine-American make up the largest percentage of that
group. Twenty-four percent of the student population is Asian, 22% Caucasian, 16%
African American, and the remaining 11% is mostly Hispanic and Pacific Islander. More
than half of the population is bilingual with many speaking a language other than English
at home (CSI, 2012).
The vast majority of the students are children of U.S. Naval personnel. The tour
of duty for most personnel at this base is three years. This leads to a large turnover in the
student population on a yearly basis, though many Naval personnel choose to extend their
tour for another three years, especially those with mixed ethnic marriages.
Sailors are deployed at sea between 150 and 200 days per year. For most of the
school year, only one parent is at home, typically the mother, and often English is her
second language, if she speaks English at all. One of the consequences of having one
parent absent for half a year is often an inconsistent homework record. I have had more
than one mother exclaim to me, “I just don’t know how to get them to do their homework
when their father is away.”
2
E. J. King High School is one of ten high schools administered by the Department
of Defense Education Activity Pacific in Japan and Korea. Varsity sports, both boys and
girls, include football, volleyball, wrestling, basketball, cross-country, baseball, softball,
cheerleading, and soccer. Participation in sports often necessitates time away from school
for travel and games. In addition, each sport has a week-long final tournament. A player
on the girls’ soccer team, for example, can expect to miss up to three weeks of school.
Participation in more than one sport will lead to a significant amount of missed class time
during the school year. Although students are required to make up all work missed during
time away, it is often done with little teacher guidance.
High school students can also participate in Far East events. These are week-long
events in such things as journalism, music, fine arts, culinary, and Junior Reserve Officer
Training Corps. With the potential for so many missed school days, it is difficult for even
the most disciplined students to keep up with their schoolwork. Homework completion
rates in my classes drop for those involved in these extracurricular activities. Even
students who manage to complete their homework often do so late and without the
benefit of classroom instruction.
I teach two sections Algebra I. One section has 21 students and the other 12
students, with 20 girls and 13 boys in total. The vast majority of my students are ninth
graders, but I also have two seventh graders, eight eighth graders and one student in
eleventh grade. E. J. King High School has block scheduling with each class being 90
minutes long and meeting every other day.
Poor homework completion rates and a lack of understanding are not limited to
those involved in extracurricular activities. I assign homework after almost every class
3
period. In my Algebra I classes, over 40% of assigned homework is either not attempted
or not completed. Homework is often a bone of contention between me and my students.
Some students miss assignments occasionally, but for a small percentage, lack of
homework completion is the norm rather than the exception.
In addition to the lack of homework completion, I have on numerous occasions
seen students copying each other’s homework. I have witnessed not only my assignments
being copied but those for other subjects as well. This apparent lack of regard for
homework assignments by many of my students has led me to question the relevance of
homework for my students as a means to increase understanding. As I planned for my
research on whether homework is effective for increasing student achievement in
mathematics, it was brought to my attention that some teachers were experimenting with
a concept called flipping the classroom, that is, recording lectures on video, posting them
online, and requiring them to be viewed as homework. Class time is then used for
problem solving, group work, and projects.
The focus of this research project was to determine if flipping teacher lectures
with homework assignments would lead to an increase in student understanding and
attitude towards Algebra 1. My sub questions were:
• What are the current practices and completion rates of all homework of my
students?
• Will student confidence in their ability to solve algebraic problems increase?
4
CONCEPTUAL FRAMEWORK
Since the beginning of the 1900’s, the debate on the usefulness of homework in
improving academic achievement has continued unabated (Gill & Schlossman, 1999;
Cooper, 2001; Cooper, Robinson, & Patall, 2006). Cooper (2001) stated that the national
push for and against homework occurs in 30-year cycles. The debate has not been limited
to just educators, parents, and students. In 1901 the California state legislature passed a
law forbidding schools from assigning homework to students younger than 15 years of
age and putting a limit on the amount of homework that high schools could give their
students (Eren & Henderson 2011). Shortly after this law was enacted, the view changed
and common consensus was that the brain needed to be exercised through homework
assignments (Cooper, 2001). The tide swung yet again in the 1940’s. Otto (1950) stated,
“The benefits of assigned homework are too small to counterbalance the disadvantages”
(p. 42).
The advocates of homework received a big boost when in 1957, the Soviet Union
launched the spaceship Sputnik (Cooper, 1989, 2001; Cooper et al., 2006; Gill &
Schlossman, 1999, 2000; Eren and Henderson, 2011). The perception was that the United
States was being left behind, and our education lacked rigor (Cooper, 1989). However, as
it became clear that the U.S. was going to land on the moon first, the mood about
homework seemed to change. Wildman (1968) wrote, “Whenever homework crowds out
social experience, outdoor recreation, and creative activities, and whenever it usurps time
devoted to sleep, it is not meeting the basic needs of children and adolescents” (p. 203).
This was followed by the publication of A Nation at Risk (1983), which condemned the
state of American education. The report found that achievement test scores were lower
5
than they were 30 years before. The report stated that Scholastic Aptitude Test (SAT)
scores had been declining for 20 years. In addition, U.S. high schools were graduating
many functionally illiterate students and even more who showed no higher order thinking
skills (National Commission on Excellence in Education, 1983). The call for more
homework was heard again (Gill & Schlossman, 1999, 2000; Cooper, 1989, 2001;
Cooper et al., 2006; Eren & Henderson, 2011).
The debate continues today with strong advocates on both ends of the spectrum.
Perhaps two of the most vocal are Harris Cooper and Alfie Kohn. Cooper’s research has
led him to believe that homework and its completion are directly related to student
achievement as well as other non-academic benefits such as improving organizational
skills, greater self-discipline, and greater self-direction (Cooper, 1989, 2001; Cooper et
al., 2006). On the other hand, Alfie Kohn finds little academic or social benefit from
homework (Kohn, 2006).
In A Nation at Rest: The American Way of Homework, (Gill & Schlossman, 2003)
the homework debate was examined from a different perspective. Data from the 1940s,
1950s, 1970s, and 1980s were compared to data collected by the National Assessment of
Educational Progress (NAEP) in 1999. It was concluded that there has been little change
in the amount of time American students have studied, typically about one hour per day
at all grade levels, for the past 50 years. It was noted that a slight bump in homework
time occurred after Sputnik. So, despite all the debate about homework over the past 100
years, student behavior had not changed (Gill & Schlossman, 2003). Homework was seen
as a way to reinforce and improve skills that were presented that day in the classroom and
for practicing good work habits (Fisher & Frey, 2011; Cooper et al., 2006). At times
6
though, high school teachers have indicated that they have assigned homework only
because they ran out of class time (Fisher & Frey, 2008).
Homework is certainly a part of our schooling process (Fisher & Frey, 2008).
Surveys reveal that teachers, students and parents all view it as important (Wilson and
Rhodes, 2007; Fisher & Frey, 2008). Although most stakeholders believe that homework
is important, a recent study showed that only 39% of the students polled completed their
homework on regular basis (Wilson & Rhodes, 2010). The most frequent reason given by
students for not completing their homework was that they did not know how to solve the
problems (Darling-Hammond & Olivia, 2006). Lack of self-confidence with little or no
homework support services such as a desk, a quiet room to work, and calculators, were
also found to be factors contributing to lack of homework completion (Kitsantas,
Cheema, & Ware, 2011).
The traditional approach to teaching mathematics in most high school classrooms
has students doing warm-up exercises followed by a brief review of the previous lessons
homework. New material is introduced in lecture form and examples are provided with
step-by-step procedures for solving. A few practice problems might follow and
homework assigned to reinforce the day’s lesson (Woodward, 2004). Homework is
mostly done alone and away from school. Those having trouble with homework
assignments were expected to seek help from the teacher, most frequently after school.
This often causes difficulty for those who are unable to stay after school for a variety of
reasons.
In 2008 two chemistry teachers from Woodland Park High School in Woodland
Park, Colorado, Jonathan Bergman and Aaron Sams, decided to “flip” their classroom.
7
They have widely been credited with the idea, but the idea wasn’t new. In a flipped or
inverted classroom, what was traditionally done during class time was now going to be
done at home and what was done at home was now going to be done in school (Lage,
Platt, & Treglia, 2000). Bergman and Sams were producing videos of their lectures for
students to view at home and using class time for homework and support (Tucker, 2012).
They posted their lessons on YouTube and assigned students to watch them. Since 2008,
many teachers have taken the idea of the flipped classroom and applied it to their own
classrooms (Tucker, 2012).
In a flipped classroom, the day’s lesson is recorded as a video and posted online
for the students to watch as homework. One advantage of this is that students can watch
the video over and over until they understand the material. Students who have difficulty
decoding textbooks when asked to read the section before doing their homework will also
benefit (Brecht & Ogilby, 2008). In addition, students who were absent that day will have
access to the day’s lesson. Video podcasts have been shown to increase understanding in
mathematics and raise midterm and final test scores for both math and other subjects
(Kay & Kletskin, 2012; Henderson, Landesman, & Kachuck, 1985; Brecht & Ogilby,
2008). The viewing of video podcasts for homework allows class time to be used for
problem solving and cooperative learning (Brecht & Ogilby, 2008).
Cooperative learning, or group learning, allows for interaction between students
as they attempt to solve problems and work on projects together. Cooperative learning
has been found to be especially helpful in math classes at all grade levels (Whicker, Bol
& Nunnery, 1997). Like video podcasts, cooperative learning research has shown an
increase in test scores in secondary math classes (Jebson, 2012). Encouraging cooperative
8
learning between students has shown that once students are used to working in groups,
they will seek help from members of their group even when not in class (Dees, 1991).
Research has also indicated a reduction in mathematics anxiety when students work in
groups (Lavasani & Khandan, 2011).
Research shows that the effectiveness of traditional homework assignments has
not been established. Students often come to class without their homework or with
homework that is incomplete. Recent research shows that video podcasts and the use of
cooperative learning strategies have been effective in increasing student understanding.
Flipping the classroom with its use of video podcasts and cooperative classroom learning
should show an increase in student understanding.
METHODOLOGY
This research study was conducted with Algebra I students at E. J. King High
School / Middle School in Sasebo, Japan. E. J. King offers two sections of Algebra I. One
section had 21 students in grades 7-9 and the other section, 12 students in grades 9-11 (N
= 33). The research methodology for this project received an exemption by Montana
State University’s Institutional Review Board and compliance for working with human
subjects was maintained.
Data were collected over an 18-week period beginning at the start of the 2nd
quarter grading period. The 18 weeks were divided into 2 9-week periods. Students were
given the Student Homework Survey on the first day of the quarter (Appendix A). The
survey was composed of questions designed to determine each student’s current habits
and attitudes regarding homework in these classes. The survey data were analyzed to
determine common themes. Students were also given the Student Algebra Confidence
9
Pre-Survey (Appendix B). The survey used a Likert Scale rating of not confident,
somewhat confident, confident, fairly confident, and very confident, rated 1-5
respectively. The survey questions related to mathematical operations and application of
algebraic concepts. The data were analyzed to establish a baseline of students’ confidence
and were compared to the data collected at the end of the 18 weeks using the same
survey.
During the first nine weeks of the study, class was conducted in a normal manner.
Teacher lectures provided the core of the day’s lesson with practice problems given to
students to work on and homework assigned to reinforce the day’s lesson. Teacher
records were used to determine homework completion rates as well as quiz and test
scores. Teacher observations were recorded in a journal and reflected the general quality
of the homework and the perceived success of the day’s lesson.
For the next nine weeks, the treatment phase was employed, which consisted of
flipping the classroom. Lectures were recorded and posted on the class website for
students to watch as a homework assignment. Lectures were no longer than 12 minutes
and provided verbal and written information as well as problem solving demonstrations.
At the end of each lesson, several practice problems were assigned. Students were
instructed to watch as often as they needed to gain understanding or if unable to do so,
come to class with prepared questions about what they did not understand. Notes of each
lecture were to be recorded in their notebooks, and the practice problems were to be
completed for full credit to be awarded as a homework assignment. Tests and quizzes
were given in the usual manner and grades were recorded as always. In addition, a
number of formative assessments were used, Documented Problem Solutions, Memory
10
Matrix, and Muddiest Point (Angelo & Cross, 1993). In the Documented Problem
Solutions, students were to give a detailed step-by-step explanation of how they solved a
series of algebraic problems. The Memory Matrix allowed students to organize
information in a table regarding various concepts in mathematics. These two assessments
were used once during each of the nine-week periods and were recorded in their math
notebooks. The final formative assessment, Muddiest Point, was used weekly. For this
assessment, students wrote on a slip of paper anything that was still confusing them about
the week’s lessons and dropped the paper in the box provided on their way out after class.
Data from these three formative assessments was used to guide instruction during the
study.
At the end of the nine-week treatment period, students were given the Student
Algebra Confidence Post-Survey. These data were used to compare beginning confidence
in algebra to their confidence after the treatment. Student Interview Questions were then
discussed with all students (Appendix C). Questions had to do with the student’s feelings
about the treatment. Data collected at the end of the treatment period were used to help
determine students’ perceptions about the level of success of the treatment. A
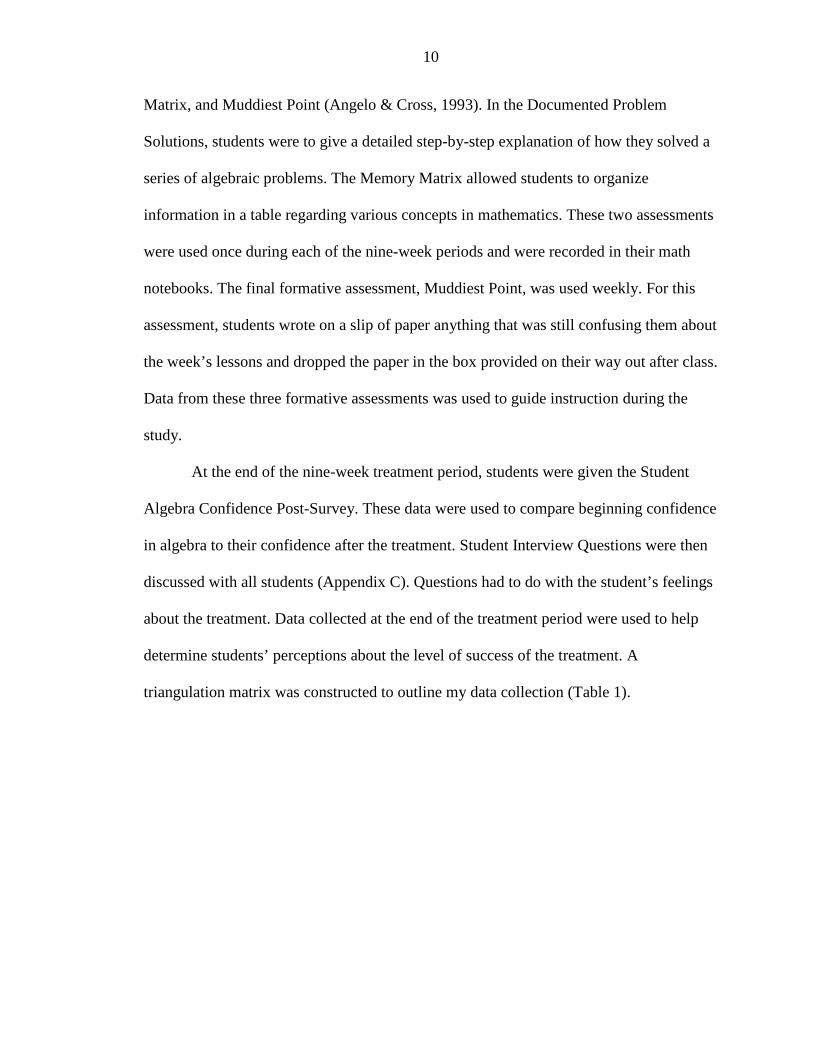
triangulation matrix was constructed to outline my data collection (Table 1).
11
Table 1 Triangulation Matrix
Research Question Data Source 1
Data Source 2
Data Source 3
Data Source 4
What is the level of homework completion and
student attitude towards homework in Algebra I?
Pre Survey Teacher Records Observation
Will flipping teacher lectures with homework
lead to an increase in student understanding?
Teacher Records
Pre and Post Treatment
Formative Assessments
Summative Assessments Observation
Will student confidence increase?
Pre and Post Survey
Student Interviews Observation
DATA ANALYSIS
The Student Homework Survey revealed that 71% of the Algebra I students at
E.J. King High School completed their assigned algebra homework 90% – 100 % of the
time (N = 33). However, teacher records revealed that in the quarter prior to taking the
survey, 39% of those students actually completed 90% or more of their homework. For
those who did not complete 100% of their algebra homework, 41% reported having too
much other homework, and 32 % stated that they could not do the word problems. In
reviewing homework, I noted that application problems left blank most often contributed
to incomplete assignments. Eighty-eight percent of those surveyed reported that they did
their homework at home and alone. The data also revealed how students handled
problems they encountered while doing their algebra homework. When stuck on a
homework problem, 50% reported asking a parent for help, 29% said they go online for
help, 15% reported calling a friend, and 3% reported using the text for help. The data
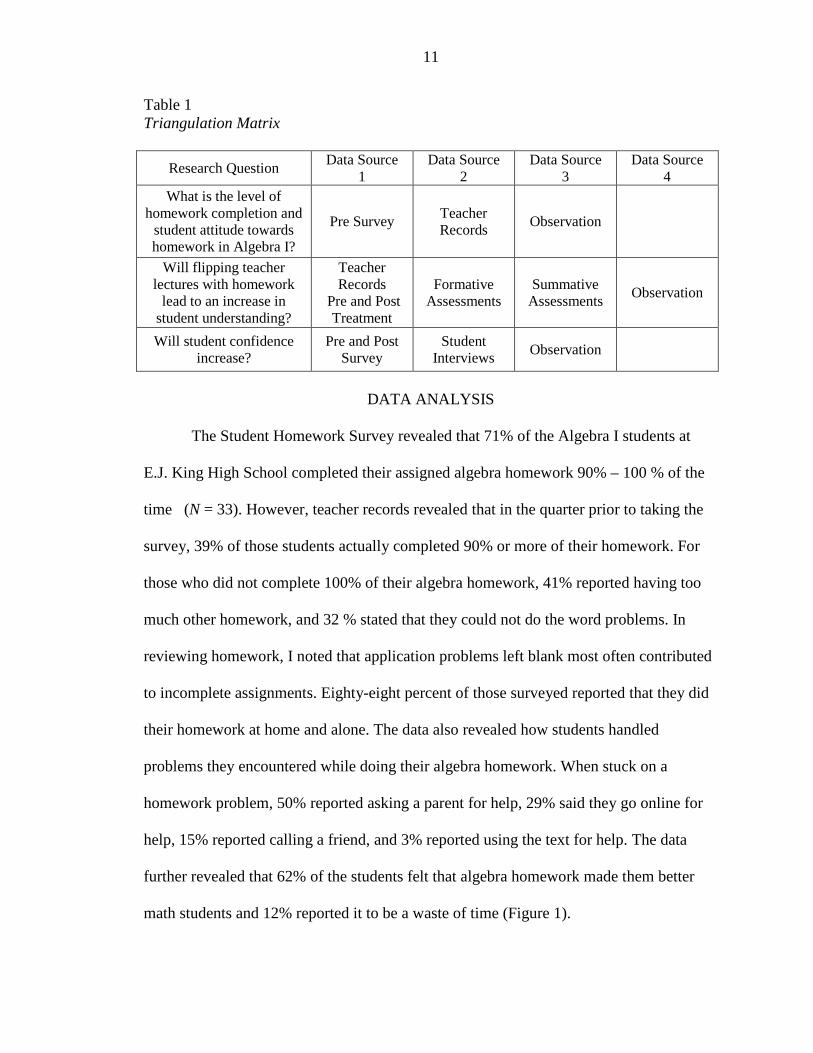
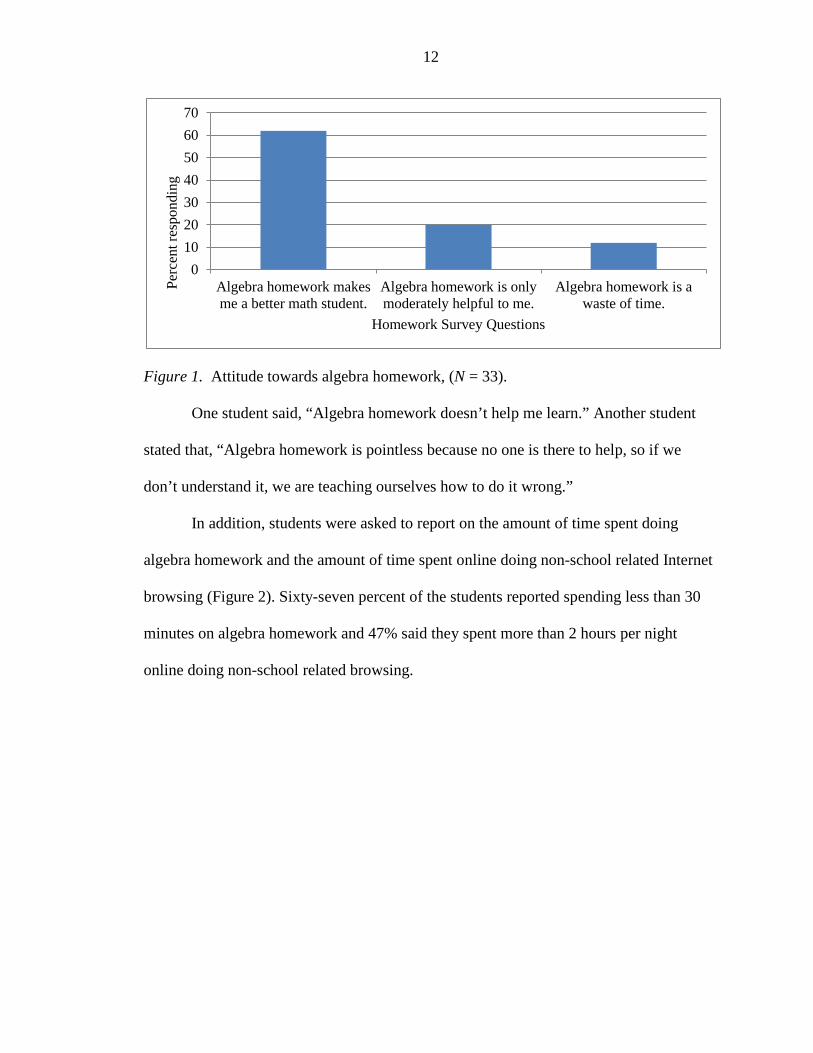
further revealed that 62% of the students felt that algebra homework made them better
math students and 12% reported it to be a waste of time (Figure 1).
12
Figure 1. Attitude towards algebra homework, (N = 33). One student said, “Algebra homework doesn’t help me learn.” Another student
stated that, “Algebra homework is pointless because no one is there to help, so if we
don’t understand it, we are teaching ourselves how to do it wrong.”
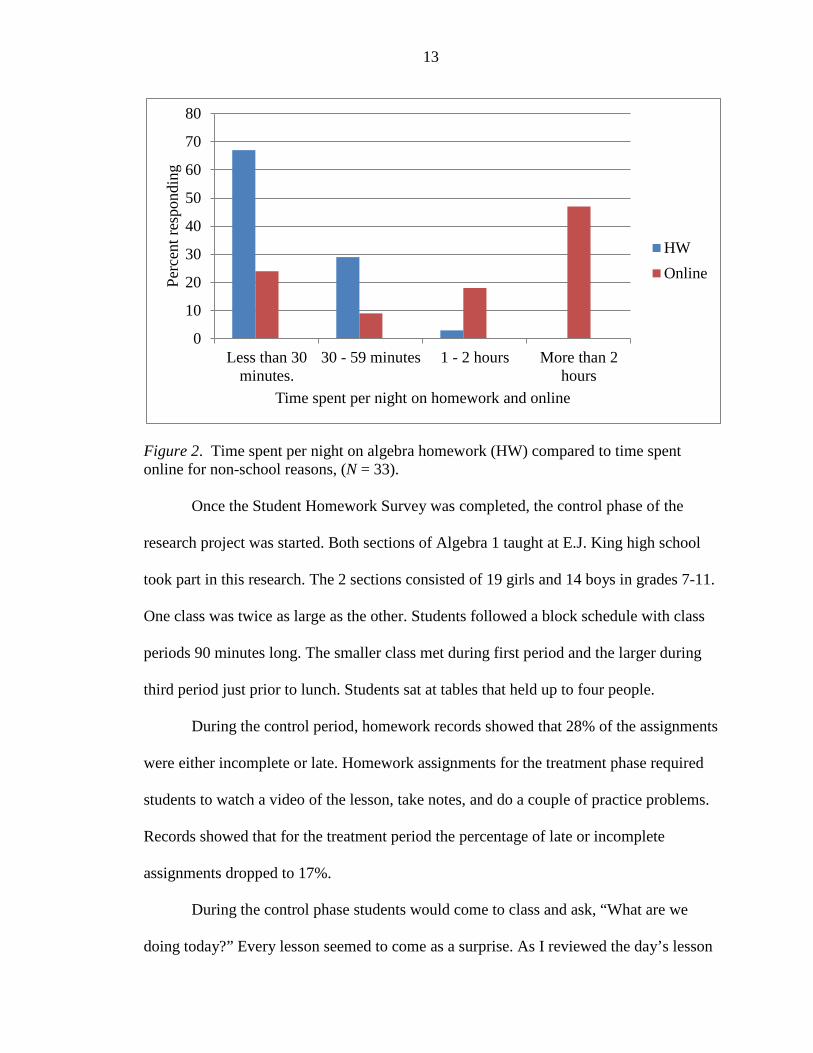
In addition, students were asked to report on the amount of time spent doing
algebra homework and the amount of time spent online doing non-school related Internet
browsing (Figure 2). Sixty-seven percent of the students reported spending less than 30
minutes on algebra homework and 47% said they spent more than 2 hours per night
online doing non-school related browsing.
010203040506070
Algebra homework makesme a better math student.
Algebra homework is onlymoderately helpful to me.
Algebra homework is awaste of time.
Perc
ent r
espo
ndin
g
Homework Survey Questions
13
Figure 2. Time spent per night on algebra homework (HW) compared to time spent online for non-school reasons, (N = 33). Once the Student Homework Survey was completed, the control phase of the
research project was started. Both sections of Algebra 1 taught at E.J. King high school
took part in this research. The 2 sections consisted of 19 girls and 14 boys in grades 7-11.
One class was twice as large as the other. Students followed a block schedule with class
periods 90 minutes long. The smaller class met during first period and the larger during
third period just prior to lunch. Students sat at tables that held up to four people.
During the control period, homework records showed that 28% of the assignments
were either incomplete or late. Homework assignments for the treatment phase required
students to watch a video of the lesson, take notes, and do a couple of practice problems.
Records showed that for the treatment period the percentage of late or incomplete
assignments dropped to 17%.
During the control phase students would come to class and ask, “What are we
doing today?” Every lesson seemed to come as a surprise. As I reviewed the day’s lesson
0
10
20
30
40
50
60
70
80
Less than 30minutes.
30 - 59 minutes 1 - 2 hours More than 2hours
Perc
ent r
espo
ndin
g
Time spent per night on homework and online
HWOnline
14
once class was over, I found more and more time being devoted to going over the
homework from the previous lesson. Seemingly, each lesson was being taught twice
rather than extending prior knowledge.
Students came to class during the treatment phase having already viewed the
video, hence knowing what we would be working on. They also had questions ready on
points that were still unclear after watching the lesson for homework. Class got off to a
quicker start with students ready to tackle the problems for that day. Instead of skipped
homework problems having to be explained before the class, students looked to the board
for the work they needed to do that day and started right in. Those who had questions
about the video would either ask other students at their table or if still confused would
call me over.
The Muddiest Point, a formative assessment that allowed students to write what
was still confusing them at the end of a lesson, was given weekly during both the control
and treatment phases. During the control phase typical responses were broad. For
example more than one student wrote, “I don’t get word problems.” Another typical
response was, “I don’t get this section.” Responses during the treatment phase tended to
be more specific. A student wrote, “I’m still not sure what side of the inequality to shade
when I graph them.” Another wrote, “I’m confused how to turn negative exponents into
positive ones.”
My observations during the treatment phase showed students more focused and
engaged than during the control period. As they tackled application problems, they had
other students to turn to as they attempted to decode what was being asked for. In one of
the classes, it became almost a competition as to which table would complete the day’s
15
work first. I watched students get up and move between tables to ask questions and
compare answers.
Teacher records were used to establish increases or decreases with respect to quiz
and test scores between the control and treatment periods. These records showed that
during the nine-week control period student quiz grades averaged 70%. The quiz grade
average during the nine-week treatment period dropped to 64%. On the other hand, test
grade averages rose from 67% during the control period to 71% during the treatment
phase. Looking further into the data revealed that 73% of the students saw their test
grades raise during the treatment period by an average of 10.4%.
A Pre and Post Student Algebra Confidence Survey were administered during this
project. The survey used a Likert Scale rating of not confident, somewhat confident,
confident, fairly confident, and very confident, rated 1-5 respectively. The survey
questions asked students to rate their confidence in solving specific types of mathematical
problems as well as their confidence in general about algebra. The pre survey data
showed that 27% of the responses on the survey rated their confidence as either not
confident or somewhat confident. At the completion of the treatment, the survey was
given again and the percentage of responses that rated confidence levels as not confident
or somewhat confident had declined to 12%. Pre survey data also revealed that 19% of all
responses were listed as very confident. The percentage rose to 29% in the post survey.
Four statements in particular were of the most interest to me; I am confident in my
ability to solve any type of algebra equation, I feel confident when I do my algebra
homework, I feel confident when I take quizzes and tests, and I feel confident that I can
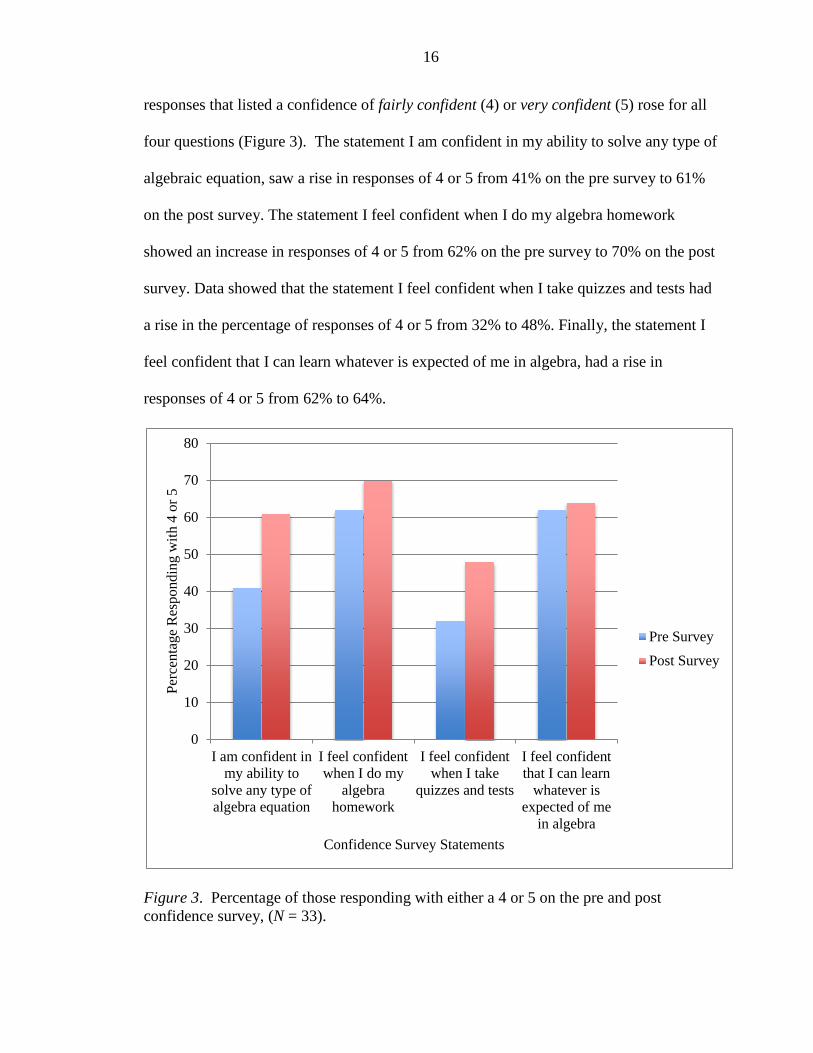
learn whatever is expected of me in algebra. Data showed that the percentage of
16
responses that listed a confidence of fairly confident (4) or very confident (5) rose for all
four questions (Figure 3). The statement I am confident in my ability to solve any type of
algebraic equation, saw a rise in responses of 4 or 5 from 41% on the pre survey to 61%
on the post survey. The statement I feel confident when I do my algebra homework
showed an increase in responses of 4 or 5 from 62% on the pre survey to 70% on the post
survey. Data showed that the statement I feel confident when I take quizzes and tests had
a rise in the percentage of responses of 4 or 5 from 32% to 48%. Finally, the statement I
feel confident that I can learn whatever is expected of me in algebra, had a rise in
responses of 4 or 5 from 62% to 64%.
Figure 3. Percentage of those responding with either a 4 or 5 on the pre and post confidence survey, (N = 33).
0
10
20
30
40
50
60
70
80
I am confident inmy ability to
solve any type ofalgebra equation
I feel confidentwhen I do my
algebrahomework
I feel confidentwhen I take
quizzes and tests
I feel confidentthat I can learn
whatever isexpected of me
in algebra
Perc
enta
ge R
espo
ndin
g w
ith 4
or 5
Confidence Survey Statements
Pre SurveyPost Survey
17
At the conclusion of the treatment phase, student interviews were conducted.
When asked which they enjoyed more, the regular classroom or the flipped classroom,
85% responded that they enjoyed the flipped classroom more. One student responded, “I
enjoyed that we were able to re-watch the videos when we didn’t understand it.” A
second student stated, “I enjoyed the flipped classroom because I could use the videos to
study for tests.” Of those who did not specifically say they enjoyed the flipped classroom
more, most stated, “I like them both, it doesn’t matter to me.”
In response to the question did you enjoy class time more, again 85% responded
in the affirmative. One student reported, “Yes, because if I was confused by a problem, I
had multiple ways to get help.” Another responded, “I enjoyed class time more because I
didn’t have to listen to a lecture for 20-40 minutes at the beginning of class.” Added
another, “Yes, I felt that briefly explaining things in class after having an overview from
the video saved time in class.” One student, who did not enjoy class more said, “I felt that
too often the class was distracting and loud.” Some stated that they preferred to work
alone.
When asked if they enjoyed working in groups, 82% stated yes. As one student
mentioned, “Yes, I found it beneficial to work in groups because with different minds to
work out problems we had more ideas on how to do it.” Other responses were typical of
that. For those who did not like group work, it was almost always due to distraction and
the preference to work independently.
When asked if there was anything else they would like me to know, several spoke
of trouble viewing the videos for any number of technical reasons. One student did say
that, “I like the videos but it was hard to always watch them because we only have one
18
computer at home and we all need to use it. Lastly, a student said, “I think this way is
much better because there is less stress around my house between me and my parents
during homework time.”
INTERPRETATION AND CONCLUSION
Data from the Homework Survey allowed me to get a perception of how students
viewed themselves in regard to their math homework. Research was mixed about the
value of homework, and I have mixed feelings about the subject as well. Although 62%
felt that homework was important, only 39% completed at least 90% of their
assignments. The question remained as to whether it’s homework in general or the type
of homework typically assigned. Homework completion rates rose by over ten percent
during the treatment phase. I think that not having to do repetitive problems and the idea
that they would get to see something new increased their desire to do their homework.
Although quiz grades dropped during the treatment phase, 73% of the students
showed test scores rising by over 10% on average. I find this type of data useless because
I have found that different topics yield different test scores regardless of the delivery.
Although heartening, I cannot claim that the flipped classroom was responsible for
improved test grades. As the year progresses students become better at anticipating the
type of questions I might ask and therefore, hopefully, prepare accordingly. I also had a
group of highly motivated eighth graders in one class that through their competition with
one another allowed for the whole class to look better than perhaps it was.
What I really hoped to find was an increase in student confidence in algebra. Data
clearly showed an increase in student confidence across the board. The post confidence
survey showed an increase of 20% in responses of fairly confident or very confident. It
19
could be argued that student’s gain confidence as the year progresses, but I think that
having the videos there to use when needed added to their confidence. Many students told
me that they liked having the videos on our website so they could use them to study for
our chapter tests. For those students who were absent or missed school for sporting
events, having the videos available to watch later allowed them to keep up with the class.
On the downside, if a student did not watch the video assigned for that day, it made for a
frustrating class on both of our parts. Given enough time, those students who most often
did not watch the videos might realize that the time spent watching each video prior to
class would make it easier to get through the day’s work. Too often the students who
came to class unprepared were unable to get much out of class time.
Student interviews showed an overwhelming enjoyment of the flipped classroom.
Students clearly liked watching the videos. The majority enjoyed the group work and the
interactions with their fellow students. The survey revealed all aspects of the flipped
classroom appealed to my students.
VALUE
I found the students liked having a resource they could access when needed. They
enjoyed having to spend their homework time watching videos and having to do only a
couple of problems. I did find that most often students watched the videos only once in
preparation for the next class. They wanted to get the notes and problems done so they
could move on to other things. Coming to class the next day, they would look at the
problems to be solved and hope that someone else at their table had understood the video
better than they had. Although 82% of the students reported viewing the videos more
than once, that seemed to take place days later. This meant that many students came to
20
class still needing a lot of clarification. My intent was that they would watch the videos a
couple of times to start with before the next class period.
Making the videos was time consuming and editing them even more so. My
frustration at their coming to class without having watched them a couple of times got the
best of me at times. Regardless, most came to class eager to get on with the day’s work.
Watching them engaged and interacting with each other was worth whatever effort on my
part in producing the videos. Their notes were much better since they basically copied
what I wrote during the videos. This was a contrast to taking notes during a lecture in
class when they tended to easily drift off and then realize the class has moved on and they
didn’t get to write what was discussed.
Producing the videos also made me aware of time. In class, lectures might
continue far longer than I had intended. When taping them, I kept to a strict time limit of
no more than 12 minutes. This allowed me to get to the heart of what I wanted to say and
what I wanted them to take from the lesson. This time limit assured that I write only what
was needed for their notes. After they realized that I would keep things concise, they
copied pretty much all that I wrote during the videos. They now had two resources to use
for test preparation. Despite their nice neat notes, I found that my students rarely looked
at them after they wrote them.
In conclusion, I found two very important pieces of information. Students liked
the short lectures and most all of them preferred homework during class time and lectures
during home time.
21
REFERENCES CITED
Angelo T, & Cross K. (1993). Classroom assessment techniques. San Francisco, CA Jossey-Bass
Brecht, H.D., & Ogilby, S.M. (2008). Enabling a comprehensive teaching strategy: video
lectures. Journal of Information Technology Education, Annual 2008. Cooper, H. (1989). Synthesis of research on homework. Educational Leadership, 4(2),
85-91. Cooper, H. (2001). Homework for all - in moderation. Educational Leadership, 58(1),
34-38 Cooper, H., Robinson, J. C., & Patall, E. A. (2006). Does homework improve academic
achievement? A synthesis of research, 1987 – 2003. Review of Educational Research, 76(1), 1-62.
Darling-Hammond, L., Olivia, I. (2006). If they’d only do their work! Educational Leadership, 63(5), 8-13.
Dees, R. L. (1991). The role of cooperative learning in increasing problem-solving
Ability in a college remedial course. Journal for Research in Mathematical Education, 22(5), 409-421.
Eren, O., & Henderson, D. J. (2011). Are we wasting our children’s time by giving them
more homework? Economics of Education Review, 30(1), 950-961 Fisher, D. & Frey, N. (2011). High quality homework. Principal Leadership, October,
2011, 56-58. Fisher, D. & Frey, N. (2008). Homework and the gradual release of responsibility:
Making student “responsibility” possible. English Journal, 98(2), 40-45. Gill, B. P., & Schlossman, S. L. (1999). History of homework. San Francisco Examiner,
December 19, 1999. Retrieved March, 2012. From http://www.sfgate.com/cgibin/article.cgi?f=/e/a/1999/12/19/NEWS4357.dtl
Gill, B. P., & Schlossman, S. L. (2000). Lost cause of homework reform. American
Journal of Education, 109(1), 27-62. Gill, B. P., & Schlossman, S. L. (2003). A nation at rest: the American way of
homework. Educational Evaluation and Policy Analysis, 25(3), 319-337.
22
Henderson, R.W., Landesman, E.M., & Kachuck (1985). Computer-video instruction in mathematics: field test of an interactive approach. Journal for Research in Mathematics Education, 16(3), 207-224.
Jebson, S.R. (2012). Impact of cooperative learning approach on senior secondary
school students’ performance in mathematics. Ife PsychologIA, 20(2), 107-111. Kay, R., & Kletskin, I. (2012). Evaluating the use of problem-based video podcasts
To teach mathematics in higher education. Computers & Education, 59(12), 619-627.
Kitsantas, A., Cheema, J., & Ware, H. (2011). The role of homework support resources,
Time spent on homework, and self-efficacy beliefs in mathematics achievement. Journal of Advanced Academics, 22(2), 312-314.
Kohn, A. (2006). Down with homework. Instructor, September, 2006. Lage, M.J., Platt, G.J., & Treglia, M. (2000). Inverting the classroom: a gateway to
creating an inclusive learning environment. The Journal of Economic Education. 31(1), 30-41.
Lavasani, M.G., & Khandan, F. (2011). Mathematic anxiety, help seeking behavior and
cooperative learning. Cypriot Journal of Educational Sciences, 2(1), 61-74. National Commission on Excellence in Education (1983). A nation at risk. Ann Arbor,
MI: University of Michigan Press Otto, H.J., (1950). Encyclopedia of educational research. New York, NY: New York
Free Press. Tucker, B. (2012). The flipped classroom. Education Next. 12(1), 82-83. Whicker, K.M., Bol, L., & Nunnery, J.A. (1997). Cooperative learning in the secondary
mathematics classroom. The Journal of Educational Research, 91(1), 42-48. Wildman, P.R., (1968). Homework pressures. Peabody Journal of Education, 45, 202-
204. Wilson, J. & Rhodes, J. (2010). Student perspectives on homework. Education, 131(2),
351-358. Woodward, J. (2004). Mathematics education in the United States. Journal of Learning
Disabilities, 37(1), 16-31.

23
APPENDICES
24
APPENDIX A
STUDENT HOMEWORK SURVEY
25
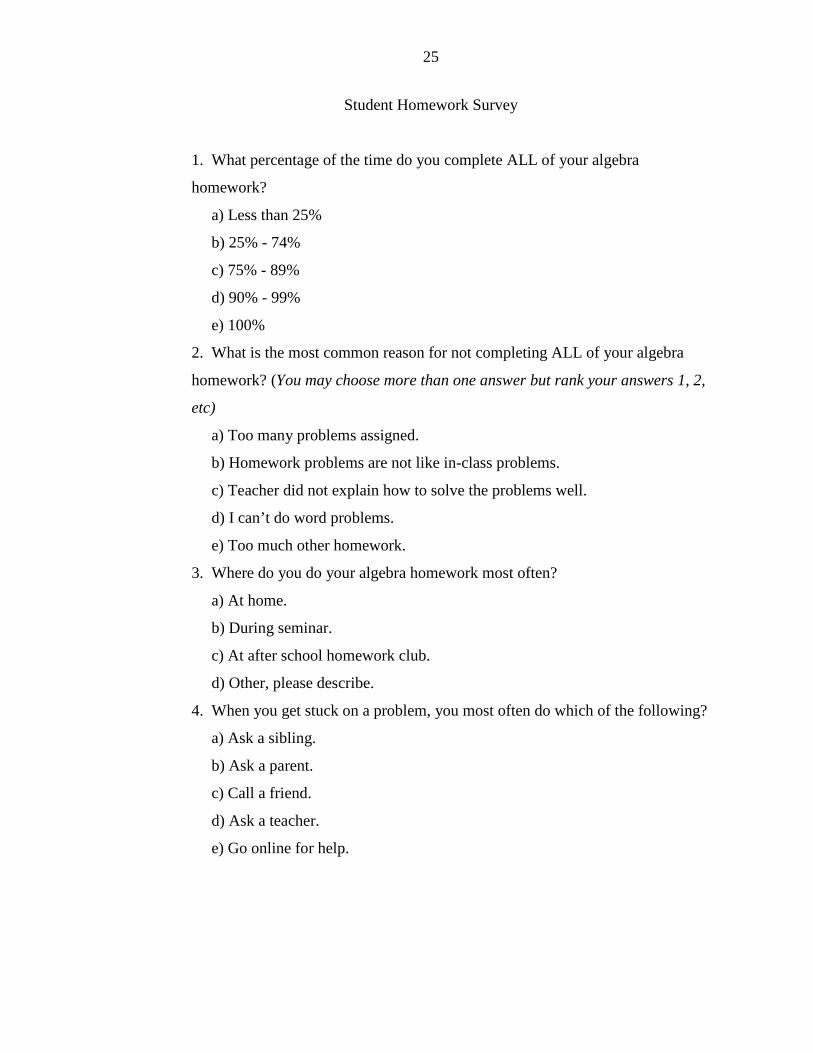
Student Homework Survey
1. What percentage of the time do you complete ALL of your algebra
homework?
a) Less than 25%
b) 25% - 74%
c) 75% - 89%
d) 90% - 99%
e) 100%
2. What is the most common reason for not completing ALL of your algebra
homework? (You may choose more than one answer but rank your answers 1, 2,
etc)
a) Too many problems assigned.
b) Homework problems are not like in-class problems.
c) Teacher did not explain how to solve the problems well.
d) I can’t do word problems.
e) Too much other homework.
3. Where do you do your algebra homework most often?
a) At home.
b) During seminar.
c) At after school homework club.
d) Other, please describe.
4. When you get stuck on a problem, you most often do which of the following?
a) Ask a sibling.
b) Ask a parent.
c) Call a friend.
d) Ask a teacher.
e) Go online for help.
26
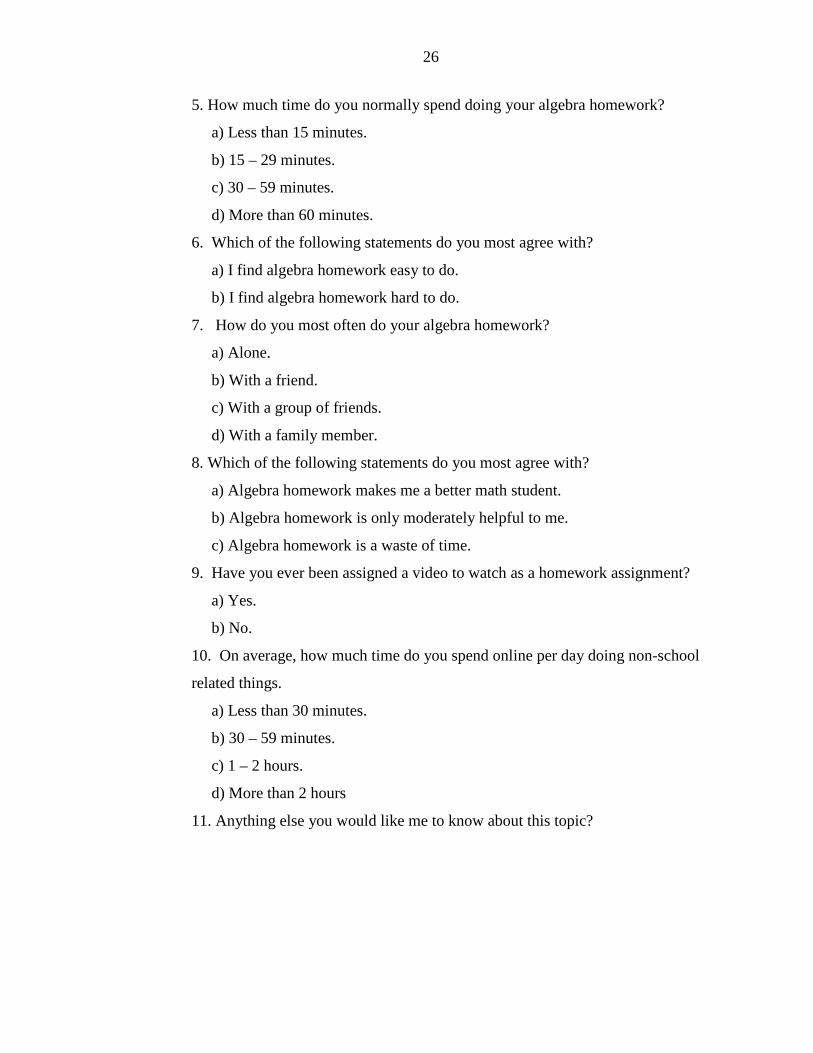
5. How much time do you normally spend doing your algebra homework?
a) Less than 15 minutes.
b) 15 – 29 minutes.
c) 30 – 59 minutes.
d) More than 60 minutes.
6. Which of the following statements do you most agree with?
a) I find algebra homework easy to do.
b) I find algebra homework hard to do.
7. How do you most often do your algebra homework?
a) Alone.
b) With a friend.
c) With a group of friends.
d) With a family member.
8. Which of the following statements do you most agree with?
a) Algebra homework makes me a better math student.
b) Algebra homework is only moderately helpful to me.
c) Algebra homework is a waste of time.
9. Have you ever been assigned a video to watch as a homework assignment?
a) Yes.
b) No.
10. On average, how much time do you spend online per day doing non-school
related things.
a) Less than 30 minutes.
b) 30 – 59 minutes.
c) 1 – 2 hours.
d) More than 2 hours
11. Anything else you would like me to know about this topic?
27
APPENDIX B
PRE AND POST STUDENT ALGEBRA CONFIDENCE SURVEY
28
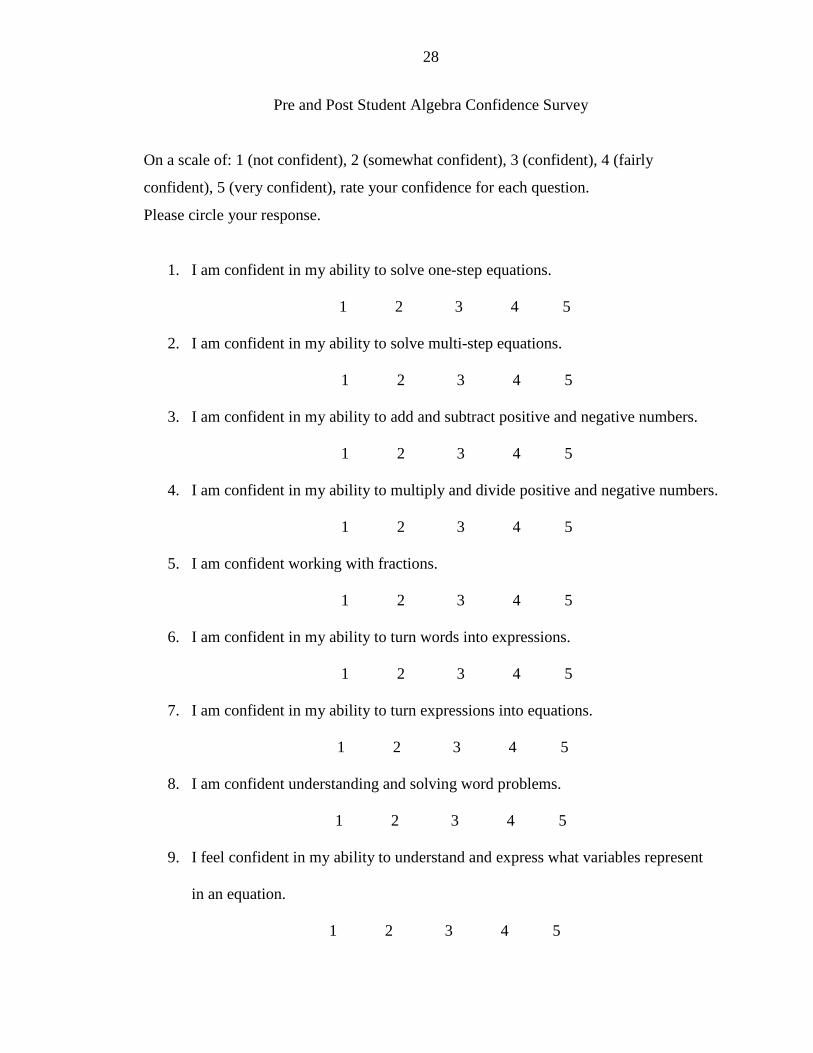
Pre and Post Student Algebra Confidence Survey
On a scale of: 1 (not confident), 2 (somewhat confident), 3 (confident), 4 (fairly
confident), 5 (very confident), rate your confidence for each question.
Please circle your response.
1. I am confident in my ability to solve one-step equations.
1 2 3 4 5
2. I am confident in my ability to solve multi-step equations.
1 2 3 4 5
3. I am confident in my ability to add and subtract positive and negative numbers.
1 2 3 4 5
4. I am confident in my ability to multiply and divide positive and negative numbers.
1 2 3 4 5
5. I am confident working with fractions.
1 2 3 4 5
6. I am confident in my ability to turn words into expressions.
1 2 3 4 5
7. I am confident in my ability to turn expressions into equations.
1 2 3 4 5
8. I am confident understanding and solving word problems.
1 2 3 4 5
9. I feel confident in my ability to understand and express what variables represent
in an equation.
1 2 3 4 5
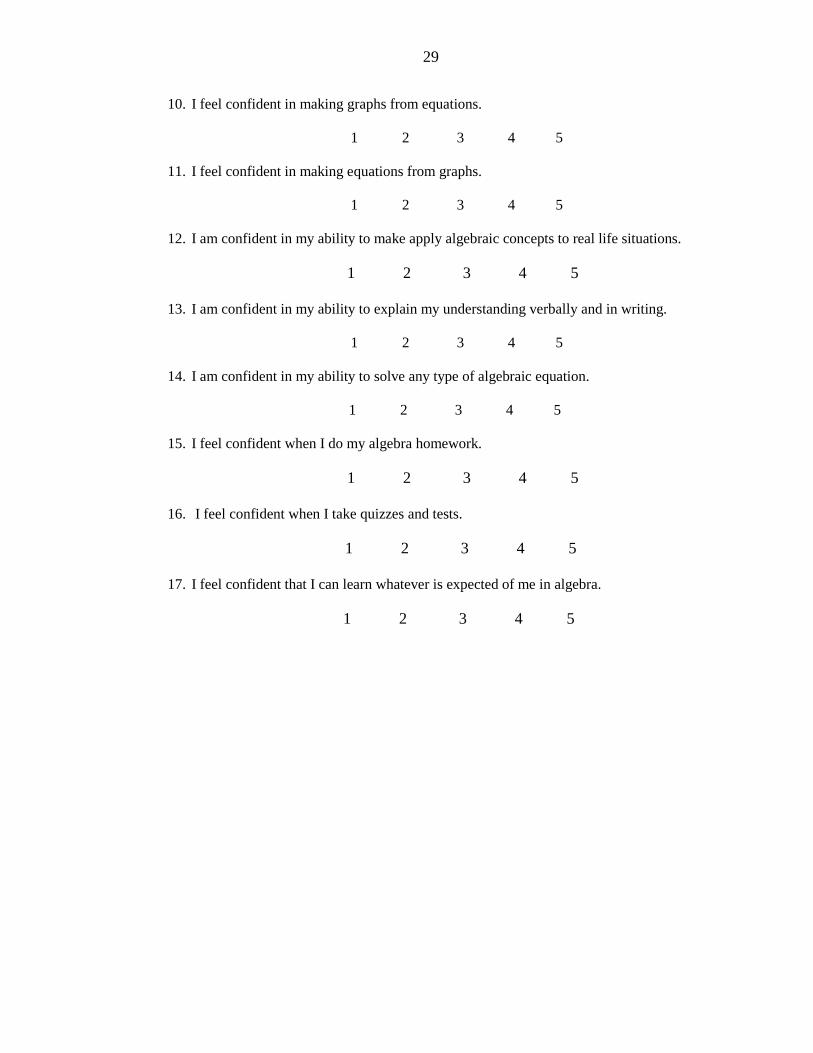
29
10. I feel confident in making graphs from equations.
1 2 3 4 5
11. I feel confident in making equations from graphs.
1 2 3 4 5
12. I am confident in my ability to make apply algebraic concepts to real life situations.
1 2 3 4 5
13. I am confident in my ability to explain my understanding verbally and in writing.
1 2 3 4 5
14. I am confident in my ability to solve any type of algebraic equation.
1 2 3 4 5
15. I feel confident when I do my algebra homework.
1 2 3 4 5
16. I feel confident when I take quizzes and tests.
1 2 3 4 5
17. I feel confident that I can learn whatever is expected of me in algebra.
1 2 3 4 5
30
APPENDIX C
STUDENT INTERVIEW QUESTIONS
31
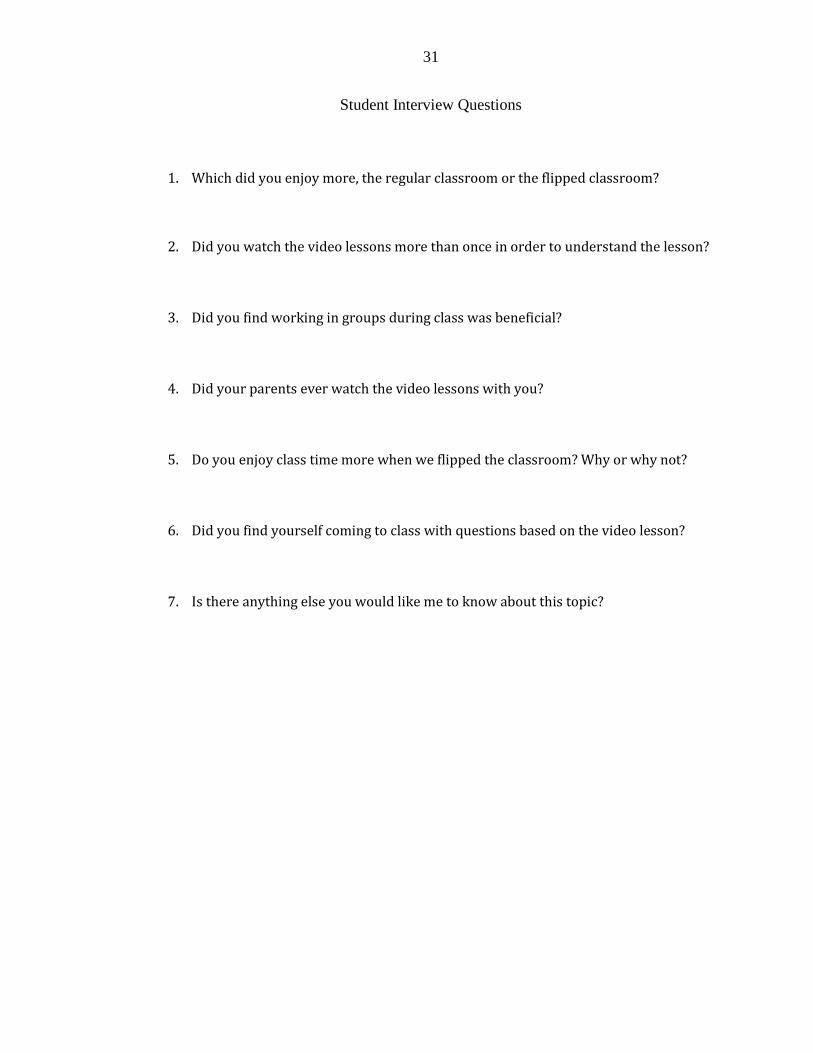
Student Interview Questions
1. Which did you enjoy more, the regular classroom or the flipped classroom?
2. Did you watch the video lessons more than once in order to understand the lesson?
3. Did you find working in groups during class was beneficial?
4. Did your parents ever watch the video lessons with you?
5. Do you enjoy class time more when we flipped the classroom? Why or why not?
6. Did you find yourself coming to class with questions based on the video lesson?
7. Is there anything else you would like me to know about this topic?