Embed Size (px)
Citation preview
The effects of chemical coagulants on the decolorization of dyes by electrocoagulation using response surface methodology (RSM)
Erick B. Butler1 • Yung-Tse Hung2 • Oliver Mulamba1
Abstract This study assessed the efficiency of electro- coagulation (ECF) coupled with an addition of chemical coagulant to decolorize textile dye. Tests were conducted using Box Behnken methodology to vary six parameters: dye type, weight, coagulant type, dose, initial pH and current density. The combination of electrocoagulation and chemical coagulation was able to decolorize dye up to 99.42 % in 30 min of treatment time which is remarkably shorter in comparison with using conventional chemical coagulation. High color removal was found to be contin- gent upon the dye type and current density, along with the interactions between the current density and the coagulant dose. The addition of chemical coagulants did enhanced treatment efficiency.
Introduction
The characteristics of dye wastewater from the textile industry include high color, organic content (Shelley et al. 1976; Tezcanli-Guyer and Ince 2003; Trifi et al. 2011), volatile organic compounds, biological oxygen demand (BOD), chemical oxygen demand (COD), and total
suspended solids (TSS) (World Bank Group, United Nations Environment Programme, and United Nations Industrial Development Organization 1999). Wastewater from the industry is generally produced during dyeing. In many cases, wastewater is then a consortium of various dyes that did not affix to the fabrics during the dyeing processes (Joshi et al. 2004). If untreated, discharge from textile plants into surface waters alters the dynamics within the stream, producing unwanted pollution, increased toxi- city, and eutrophication (Trifi et al. 2011).
Color removal is one of the most essential parameters that need to be addressed. Color in effluent is not preferred for several reasons (Joshi et al. 2004):
1. The presence of color changes the appearance of any water source such as a stream.
2. The chemical structure of the dyes interrupts biological and photosynthetic activity. Color has the potential of preventing light from penetrating into a water body.
3. Many dyes are hazardous and have the potential of being carcinogenic and mutagenic.
4. Color can impact the efficiency of wastewater treatment.
There are several methods employed to treat textile wastewater. One method of decolorizing dye wastewater is electrocoagulation. It is a technical process in which wastewater is cleaned through radio or short wave fre- quencies. The technology works as follows—a pair of aluminum or iron metal sheets is connected to a power supply. The anodes oxidize forming metal ions, while the cathodes disassociate water, forming hydroxide (OH-) and hydrogen gas (H+). The oxidized metal combines with the disassociated hydroxide forming metal hydroxides (Butler et al. 2011). The addition of metal hydroxides neutralizes and separates the dye from the wastewater and attaches it to
the complex. The dye hydroxide complex floats to the top of the reactor and is skimmed at high currents (Martinez- Huitle and Brillas 2009). Electrocoagulation replaces the need for a chemical coagulant. Overall, electrocoagulation has the advantage of reducing constituents at low retention times.
Nevertheless, while electrocoagulation is as an alterna- tive to the application of chemical coagulation for wastewater treatment, the prospect of considering the use of chemical coagulant as an additive to improve treatment is an important factor that needs to be considered. A search through the literature concludes that few authors have considered combined electrocoagulation and chemical coagulation (Can et al. 2006; Merzouk et al. 2011; Cani- zares et al. 2006; Taheri et al. 2013). When it has been employed, all authors with the exception of Taheri et al. 2013 have only used the traditional chemical coagulation jar tests and have not added chemical coagulants directly into the reactor. Therefore, a further study on effects of adding chemical coagulants to an electrocoagulation reac- tion for treatment of wastewater is warranted.
Response surface methodology (RSM) is a statistical method used to determine the minimum number of experiments conducted to still produce statistically signif- icant results (Wang et al. 2011). Based on the literature in the last decade, authors have preferred to employ RSM to treat textile wastewater by electrocoagulation. Appendix Table 5 provides a summary table considering the param- eters and the dye(s) treated. Upon further assessments, it is observed that only two authors considered varying dyes (albeit they are from the same classification) (Körbahti 2007; Murugan et al. 2009), while only one employed combined electrocoagulation/chemical coagulation using only one coagulant (powdered activated carbon) (Taheri et al. 2013). An investigation of several textile dyes is important because the physical and chemical nature of conventional textile dye wastewater can be very complex. Therefore, employing a study on several classifications of textile dyes will contribute to a general understanding of how well one can treat dyes from a given classification.
Box-Behnkenis an example of an RSM technique thatassigns a number to three treatments of a parameter-----+1for the highest treatment, —1 for the lowest, and 0 to the center (Tosik and Wiktorowski 2011) in a process known as coding. This computation is expressed in Eq. 1 (Ale- boyeh et al. 2008; Gürses et al. 2002; Tir and Moulai- Mostefa 2008; Zaroual et al. 2009; Amani-Ghadim et al. 2013; Taheri et al. 2012):x = X-Xcenter/(ΔX) (1)
where x = coded data value (—1, 0, 1)X — uncoded data pointXcenter = center point
\X = the distance between the two pointsBox-Behnken has been used in designing electrocoag-
ulation experiments to treat color using iron anodes, varying the current density, treatment time, and wash dilution (Prasad et al. 2008). Chavalparit and Ongwandee (2009) found Box-Behnken useful for determining the effects of pH, applied voltage, and reaction time to predict the removals of chemical oxygen demand (COD), oil and grease (O&G), and suspended solids (SS). Zodi et al. (2010) conclude that Box-Behnken is a viable statistical method for optimizing the treatment of industrial wastewater.
As previously stated, little research has been done on using this technique to design an experiment evaluating the impact of chemical coagulation addition to improve the performance of decolorizing dye wastes. The purpose of this experiment is to determine the effects of varying pH, dye weight, current density, applied coagulant, and dose on the color removal of azo dyes (Acid Yellow 11 (AY 11) and Acid Orange 7 (AO7)) and nitroso dye Naphthol Green B (NGB) by electrocoagulation using a Box Behnken experimental design.
Materials and methods
Synthetic wastewater was created by weighing and dis- solving powder forms of Acid Orange 7 (Santa Cruz Biotechnology, CA, USA), Acid Yellow 11 (Acros Organics, Thermo Fisher Scientific, NJ, USA), and Naph- thol Green B (Santa Cruz Biotechnology, CA, USA) into 1 L of distilled water. The wastewater was stirred for homogeneity, and then 25 g/L of sodium chloride (NaCl) and the respective coagulant was added to the solution. The presence of NaCl increases the conductivity and the elec- tric current through the reactor (Körbahti 2007).
The initial pH for each run was adjusted using nitric acid (HNO3) to decrease the pH of the solution, while sodium hydroxide (NaOH) increases the solution pH. After stirring, a sample was extracted and placed into a test tube vial. The remaining sample was then transferred to an 11.43 cm x 13.97 cm x 16.51 reactor with an average electrode spacing of 12.86 cm. The reactors consist of a setup with a power supply (YiHua DC Power Supply YH- 305D, Guangzhou YiHua Electronic Equipment Co., Ltd, Hong Kong) and aluminum electrodes with an average area of 16.05 cm2. The power supply was turned on and sam- ples were collected at detention times of 5, 10, 15, 20, and 30 min. Temperature and pH measurements were taken using a portable pH meter (Oakton Waterproof PC Tester 35 Multi-parameter pH Meter, Oakton Instruments, IL) within a few minutes after sample collection. The samples were then transferred to sample vials for color analysis
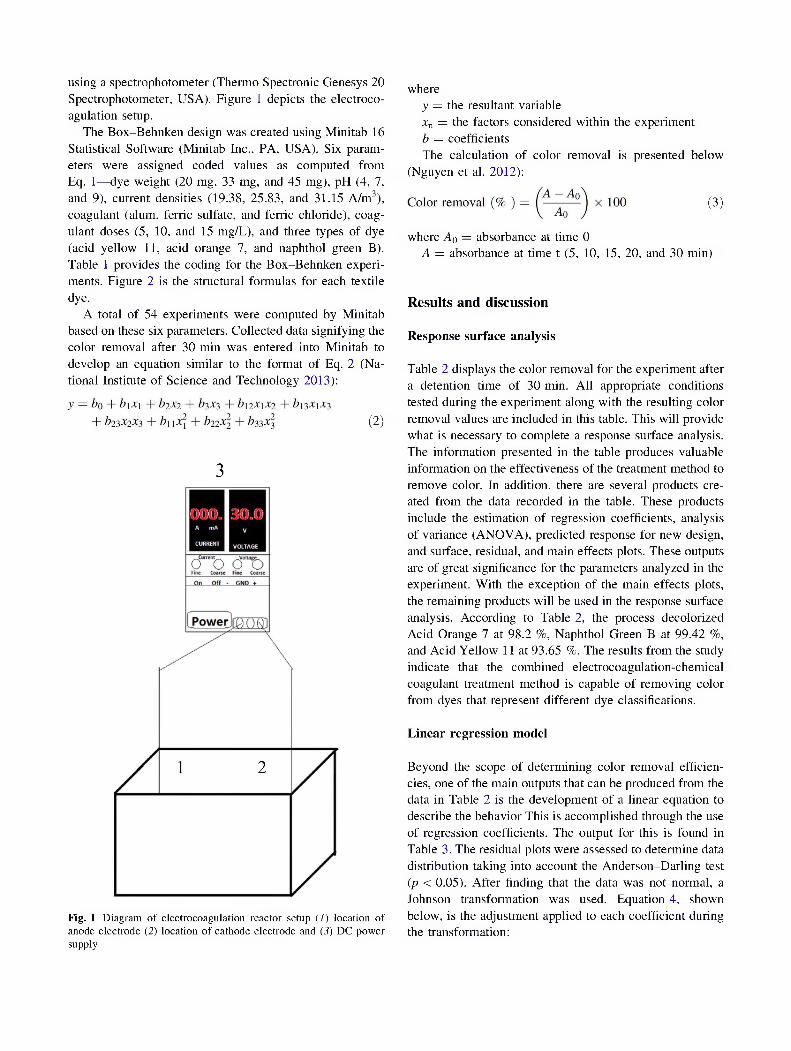
using a spectrophotometer (Thermo Spectronic Genesys 20 Spectrophotometer, USA). Figure 1 depicts the electroco- agulation setup.
The Box-Behnken design was created using Minitab 16 Statistical Software (Minitab Inc., PA, USA). Six param- eters were assigned coded values as computed from Eq. 1—dye weight (20 mg, 33 mg, and 45 mg), pH (4, 7, and 9), current densities (19.38, 25.83, and 31.15 A/m3), coagulant (alum, ferric sulfate, and ferric chloride), coag- ulant doses (5, 10, and 15 mg/L), and three types of dye (acid yellow 11, acid orange 7, and naphthol green B). Table 1 provides the coding for the Box-Behnken experi- ments. Figure 2 is the structural formulas for each textile dye.
A total of 54 experiments were computed by Minitab based on these six parameters. Collected data signifying the color removal after 30 min was entered into Minitab to develop an equation similar to the format of Eq. 2 (National Institute of Science and Technology 2013):
y = b0 + b1x1 + b2x2 + b3x3 + b12x1x2 + b13x1x3+ b23X2X3 + b11x2/1+ b22x2/2 + b33x2/3 (2)
3
Fig. 1 Diagram of electrocoagulation reactor setup (1) location of anode electrode (2) location of cathode electrode and (3) DC power supply
where
y = the resultant variablexn = the factors considered within the experiment b = coefficientsThe calculation of color removal is presented below
(Nguyen et al. 2012):
Color removal (% ) = x 100 (3)
where A0 = absorbance at time 0A = absorbance at time t (5, 10, 15, 20, and 30 min)
Results and discussion
Response surface analysis
Table 2 displays the color removal for the experiment after a detention time of 30 min. All appropriate conditions tested during the experiment along with the resulting color removal values are included in this table. This will provide what is necessary to complete a response surface analysis. The information presented in the table produces valuable information on the effectiveness of the treatment method to remove color. In addition, there are several products cre- ated from the data recorded in the table. These products include the estimation of regression coefficients, analysis of variance (ANOVA), predicted response for new design, and surface, residual, and main effects plots. These outputs are of great significance for the parameters analyzed in the experiment. With the exception of the main effects plots, the remaining products will be used in the response surface analysis. According to Table 2, the process decolorized Acid Orange 7 at 98.2 %, Naphthol Green B at 99.42 %, and Acid Yellow 11 at 93.65 %. The results from the study indicate that the combined electrocoagulation-chemical coagulant treatment method is capable of removing color from dyes that represent different dye classifications.
Linear regression model
Beyond the scope of determining color removal efficiencies, one of the main outputs that can be produced from the data in Table 2 is the development of a linear equation to describe the behavior This is accomplished through the use of regression coefficients. The output for this is found in Table 3. The residual plots were assessed to determine data distribution taking into account the Anderson-Darling test (p < 0.05). After finding that the data was not normal, a Johnson transformation was used. Equation 4, shown below, is the adjustment applied to each coefficient during the transformation:
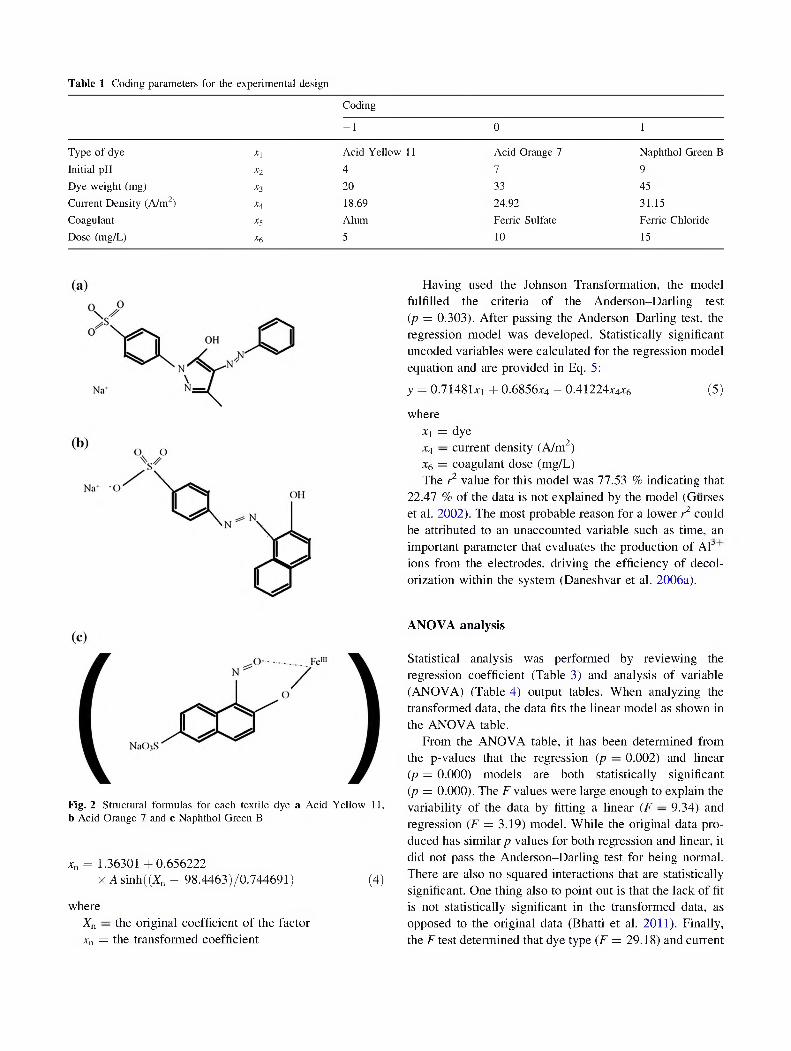
Table 1 Coding parameters for the experimental design
Coding
-1 0 1
Type of dye Xl Acid Yellow 11 Acid Orange 7 Naphthol Green BInitial pH X2 4 7 9Dye weight (mg) x3 20 33 45Current Density (A/m2) x4 18.69 24.92 31.15Coagulant x5 Alum Ferric Sulfate Ferric ChlorideDose (mg/L) x6 5 10 15
Fig. 2 Structural formulas for each textile dye a Acid Yellow 11, b Acid Orange 7 and c Naphthol Green B
Having used the Johnson Transformation, the model fulfilled the criteria of the Anderson-Darling test (p = 0.303). After passing the Anderson-Darling test, the regression model was developed. Statistically significant uncoded variables were calculated for the regression model equation and are provided in Eq. 5:y = 0.71481x1 + 0.6856x4 — 0.41224x4x6 (5)
wherex1 = dyex4 — current density (A/m2) x6 = coagulant dose (mg/L)The r2 value for this model was 77.53 % indicating that
22.47 % of the data is not explained by the model (Curses et al. 2002). The most probable reason for a lower r2 could be attributed to an unaccounted variable such as time, an important parameter that evaluates the production of Al3+ ions from the electrodes, driving the efficiency of decol- orization within the system (Daneshvar et al. 2006a).
xn = 1.36301 +0.656222x A sinh((Xn - 98.4463)/0.744691) (4)
whereXn — the original coefficient of the factor xn = the transformed coefficient
ANOVA analysis
Statistical analysis was performed by reviewing the regression coefficient (Table 3) and analysis of variable (ANOVA) (Table 4) output tables. When analyzing the transformed data, the data fits the linear model as shown in the ANOVA table.
From the ANOVA table, it has been determined from the p-values that the regression (p = 0.002) and linear (p = 0.000) models are both statistically significant (p = 0.000). The F values were large enough to explain the variability of the data by fitting a linear (F — 9.34) and regression (F = 3.19) model. While the original data pro- duced has similar p values for both regression and linear, it did not pass the Anderson-Darling test for being normal. There are also no squared interactions that are statistically significant. One thing also to point out is that the lack of fit is not statistically significant in the transformed data, as opposed to the original data (Bhatti et al. 2011). Finally, the F test determined that dye type (F = 29.18) and current
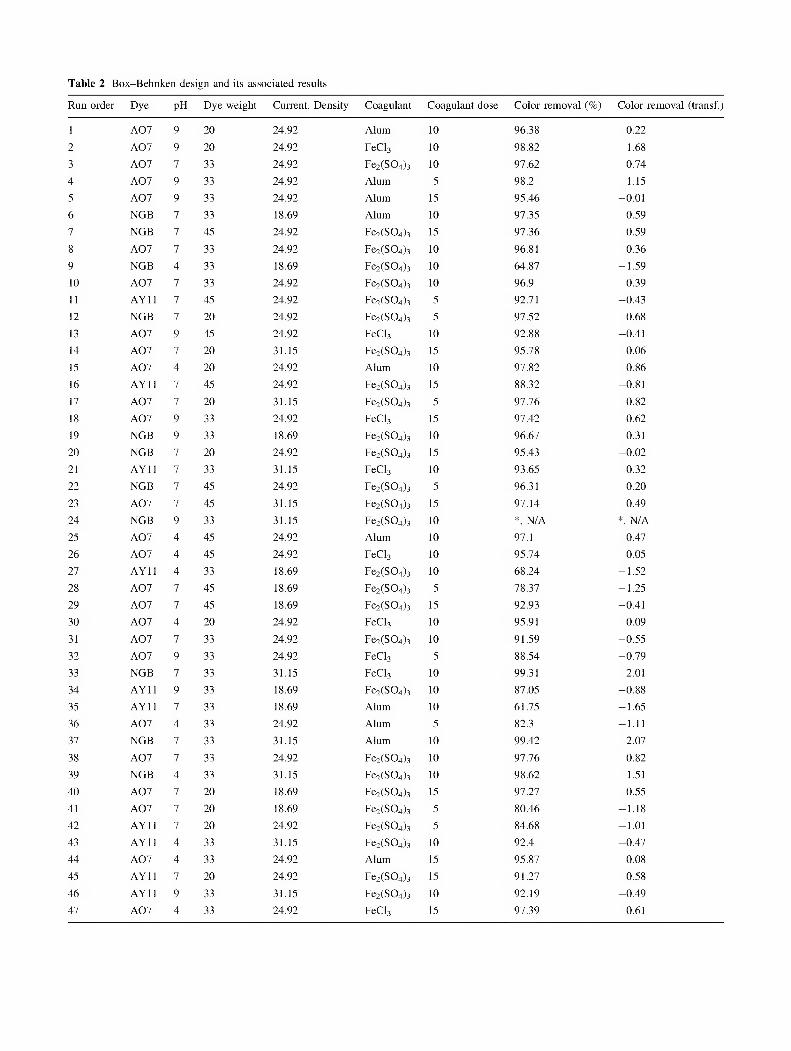
Table 2 Box-Behnken design and its associated results
Run order Dye PH Dye weight Current. Density Coagulant Coagulant dose Color removal (%) Color removal (transf.)
1 AO7 9 20 24.92 Alum 10 96.38 0.222 AO7 9 20 24.92 FeCl3 10 98.82 1.683 AO7 7 33 24.92 Fe2(SO4)3 10 97.62 0.744 AO7 9 33 24.92 Alum 5 98.2 1.155 AO7 9 33 24.92 Alum 15 95.46 -0.016 NGB 7 33 18.69 Alum 10 97.35 0.597 NGB 7 45 24.92 Fe2(SO4)3 15 97.36 0.598 AO7 7 33 24.92 Fe2(SO4)3 10 96.81 0.369 NGB 4 33 18.69 Fe2(SO4)3 10 64.87 -1.5910 AO7 7 33 24.92 Fe2(SO4)3 10 96.9 0.3911 AY11 7 45 24.92 Fe2(SO4)3 5 92.71 -0.4312 NGB 7 20 24.92 Fe2(SO4)3 5 97.52 0.6813 AO7 9 45 24.92 FeCl3 10 92.88 -0.4114 AO7 7 20 31.15 Fe2(SO4)3 15 95.78 0.0615 AO7 4 20 24.92 Alum 10 97.82 0.8616 AY11 7 45 24.92 Fe2(SO4)3 15 88.32 -0.8117 AO7 7 20 31.15 Fe2(SO4)3 5 97.76 0.8218 AO7 9 33 24.92 FeCl3 15 97.42 0.6219 NGB 9 33 18.69 Fe2(SO4)3 10 96.67 0.3120 NGB 7 20 24.92 Fe2(SO4)3 15 95.43 -0.0221 AY11 7 33 31.15 FeCl3 10 93.65 -0.3222 NGB 7 45 24.92 Fe2(SO4)3 5 96.31 0.2023 AO7 7 45 31.15 Fe2(SO4)3 15 97.14 0.4924 NGB 9 33 31.15 Fe2(SO4)3 10 *, N/A *, N/A25 AO7 4 45 24.92 Alum 10 97.1 0.4726 AO7 4 45 24.92 FeCl3 10 95.74 0.0527 AY11 4 33 18.69 Fe2(SO4)3 10 68.24 -1.5228 AO7 7 45 18.69 Fe2(SO4)3 5 78.37 -1.2529 AO7 7 45 18.69 Fe2(SO4)3 15 92.93 -0.4130 AO7 4 20 24.92 FeCl3 10 95.91 0.0931 AO7 7 33 24.92 Fe2(SO4)3 10 91.59 -0.5532 AO7 9 33 24.92 FeCl3 5 88.54 -0.7933 NGB 7 33 31.15 FeCl3 10 99.31 2.0134 AY11 9 33 18.69 Fe2(SO4)3 10 87.05 -0.8835 AY11 7 33 18.69 Alum 10 61.75 -1.6536 AO7 4 33 24.92 Alum 5 82.3 -1.1137 NGB 7 33 31.15 Alum 10 99.42 2.0738 AO7 7 33 24.92 Fe2(SO4)3 10 97.76 0.8239 NGB 4 33 31.15 Fe2(SO4)3 10 98.62 1.5140 AO7 7 20 18.69 Fe2(SO4)3 15 97.27 0.5541 AO7 7 20 18.69 Fe2(SO4)3 5 80.46 -1.1842 AY11 7 20 24.92 Fe2(SO4)3 5 84.68 -1.0143 AY11 4 33 31.15 Fe2(SO4)3 10 92.4 -0.4744 AO7 4 33 24.92 Alum 15 95.87 0.0845 AY11 7 20 24.92 Fe2(SO4)3 15 91.27 -0.5846 AY11 9 33 31.15 Fe2(SO4)3 10 92.19 -0.4947 AO7 4 33 24.92 FeCl3 15 97.39 0.61
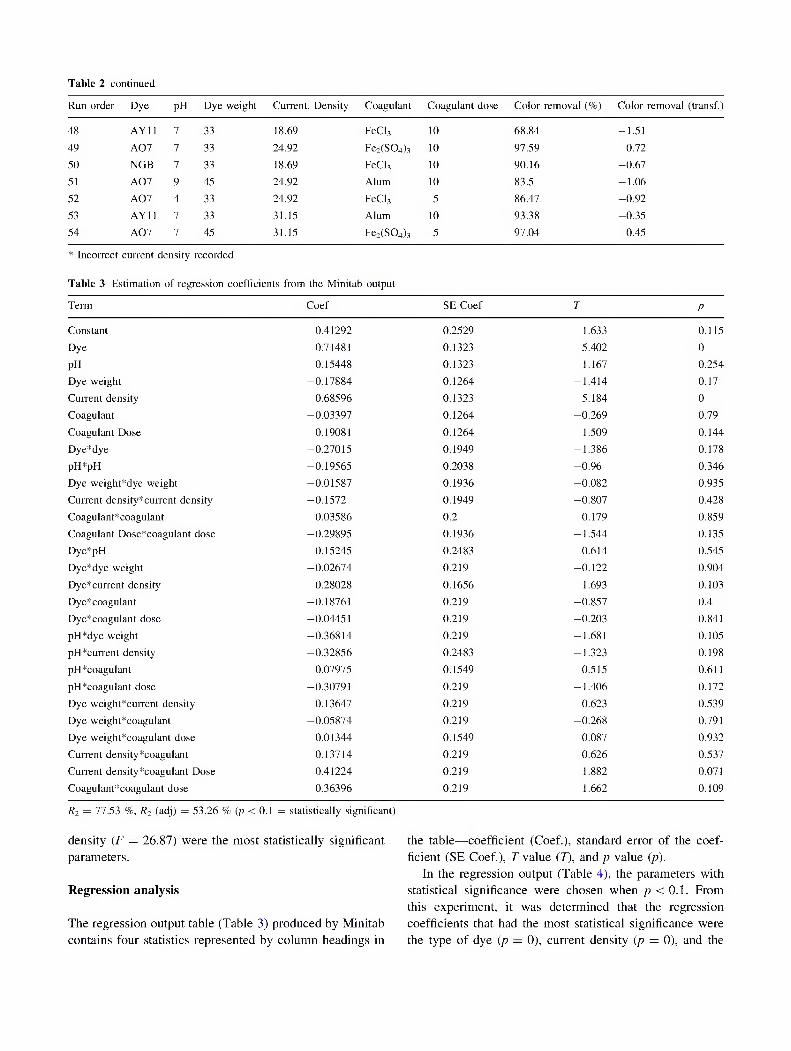
Table 2 continued
Run order Dye pH Dye weight Current. Density Coagulant Coagulant dose Color removal (%) Color removal (transf.)
48 AY11 7 33 18.69 FeCl3 10 68.84 -1.5149 AO7 7 33 24.92 Fe2(SO4)3 10 97.59 0.7250 NGB 7 33 18.69 FeCl3 10 90.16 -0.6751 AO7 9 45 24.92 Alum 10 83.5 -1.0652 AO7 4 33 24.92 FeCl3 5 86.47 -0.9253 AY11 7 33 31.15 Alum 10 93.38 -0.3554 AO7 7 45 31.15 Fe2(SO4)3 5 97.04 0.45
* Incorrect current density recorded
Table 3 Estimation of regression coefficients from the Minitab output
Term Coef SE Coef r P
Constant 0.41292 0.2529 1.633 0.115Dye 0.71481 0.1323 5.402 0pH 0.15448 0.1323 1.167 0.254Dye weight -0.17884 0.1264 -1.414 0.17Current density 0.68596 0.1323 5.184 0Coagulant -0.03397 0.1264 -0.269 0.79Coagulant Dose 0.19081 0.1264 1.509 0.144Dye* dye -0.27015 0.1949 -1.386 0.178pH*pH -0.19565 0.2038 -0.96 0.346Dye weight*dye weight -0.01587 0.1936 -0.082 0.935Current density*current density -0.1572 0.1949 -0.807 0.428Coagulant*coagulant 0.03586 0.2 0.179 0.859Coagulant Dose*coagulant dose -0.29895 0.1936 -1.544 0.135Dye*pH 0.15245 0.2483 0.614 0.545Dye* dye weight -0.02674 0.219 -0.122 0.904Dye*current density 0.28028 0.1656 1.693 0.103Dye*coagulant -0.18761 0.219 -0.857 0.4Dye*coagulant dose -0.04451 0.219 -0.203 0.841pH*dye weight -0.36814 0.219 -1.681 0.105pH*current density -0.32856 0.2483 -1.323 0.198pH*coagulant 0.07975 0.1549 0.515 0.611pH*coagulant dose -0.30791 0.219 -1.406 0.172Dye weight*current density 0.13647 0.219 0.623 0.539Dye weight* coagulant -0.05874 0.219 -0.268 0.791Dye weight*coagulant dose 0.01344 0.1549 0.087 0.932Current density*coagulant 0.13714 0.219 0.626 0.537Current density*coagulant Dose -0.41224 0.219 -1.882 0.071Coagulant*coagulant dose 0.36396 0.219 1.662 0.109
R2 = 77.53 %, R2 (adj) = 53.26 % (p < 0.1 = statistically significant)
density (F = 26.87) were the most statistically significant parameters.
Regression analysis
The regression output table (Table 3) produced by Minitab contains four statistics represented by column headings in
the table—coefficient (Coef.), standard error of the coef- ficient (SE Coef.), T value (T), and p value (p).
In the regression output (Table 4), the parameters with statistical significance were chosen when p < 0.1. From this experiment, it was determined that the regression coefficients that had the most statistical significance were the type of dye (p — 0), current density (p = 0), and the
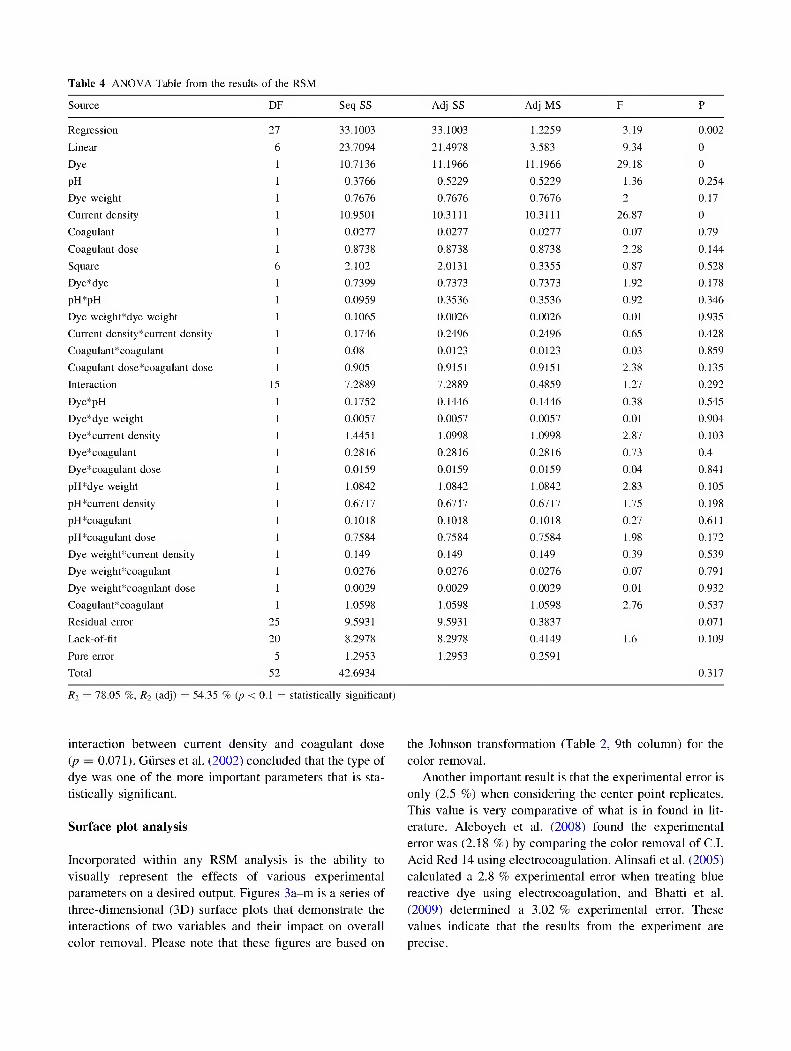
Table 4 ANOVA Table from the results of the RSM
Source DF Seq SS Adj SS Adj MS F P
Regression 27 33.1003 33.1003 1.2259 3.19 0.002Linear 6 23.7094 21.4978 3.583 9.34 0Dye 1 10.7136 11.1966 11.1966 29.18 0pH 1 0.3766 0.5229 0.5229 1.36 0.254Dye weight 1 0.7676 0.7676 0.7676 2 0.17Current density 1 10.9501 10.3111 10.3111 26.87 0Coagulant 1 0.0277 0.0277 0.0277 0.07 0.79Coagulant dose 1 0.8738 0.8738 0.8738 2.28 0.144Square 6 2.102 2.0131 0.3355 0.87 0.528Dye* dye 1 0.7399 0.7373 0.7373 1.92 0.178pH*pH 1 0.0959 0.3536 0.3536 0.92 0.346Dye weight*dye weight 1 0.1065 0.0026 0.0026 0.01 0.935Current density*current density 1 0.1746 0.2496 0.2496 0.65 0.428Coagulant * coagulant 1 0.08 0.0123 0.0123 0.03 0.859Coagulant dose*coagulant dose 1 0.905 0.9151 0.9151 2.38 0.135Interaction 15 7.2889 7.2889 0.4859 1.27 0.292Dye*pH 1 0.1752 0.1446 0.1446 0.38 0.545Dye* dye weight 1 0.0057 0.0057 0.0057 0.01 0.904Dye*current density 1 1.4451 1.0998 1.0998 2.87 0.103Dye*coagulant 1 0.2816 0.2816 0.2816 0.73 0.4Dye*coagulant dose 1 0.0159 0.0159 0.0159 0.04 0.841pH*dye weight 1 1.0842 1.0842 1.0842 2.83 0.105pH*current density 1 0.6717 0.6717 0.6717 1.75 0.198pH*coagulant 1 0.1018 0.1018 0.1018 0.27 0.611pH*coagulant dose 1 0.7584 0.7584 0.7584 1.98 0.172Dye weight*current density 1 0.149 0.149 0.149 0.39 0.539Dye weight*coagulant 1 0.0276 0.0276 0.0276 0.07 0.791Dye weight*coagulant dose 1 0.0029 0.0029 0.0029 0.01 0.932Coagulant*coagulant 1 1.0598 1.0598 1.0598 2.76 0.537Residual error 25 9.5931 9.5931 0.3837 0.071Lack-of-fit 20 8.2978 8.2978 0.4149 1.6 0.109Pure error 5 1.2953 1.2953 0.2591Total 52 42.6934 0.317
R2 = 78.05 %, R2 (adj) = 54.35 % (p < 0.1 = statistically significant)
interaction between current density and coagulant dose (p — 0.071). Gürses et al. (2002) concluded that the type of dye was one of the more important parameters that is sta- tistically significant.
Surface plot analysis
Incorporated within any RSM analysis is the ability to visually represent the effects of various experimental parameters on a desired output. Figures 3a-m is a series of three-dimensional (3D) surface plots that demonstrate the interactions of two variables and their impact on overall color removal. Please note that these figures are based on
the Johnson transformation (Table 2, 9th column) for the color removal.
Another important result is that the experimental error is only (2.5 %) when considering the center point replicates. This value is very comparative of what is in found in literature. Aleboyeh et al. (2008) found the experimental error was (2.18 %) by comparing the color removal of C.I. Acid Red 14 using electrocoagulation. Alinsafi et al. (2005) calculated a 2.8 % experimental error when treating blue reactive dye using electrocoagulation, and Bhatti et al. (2009) determined a 3.02 % experimental error. These values indicate that the results from the experiment are precise.
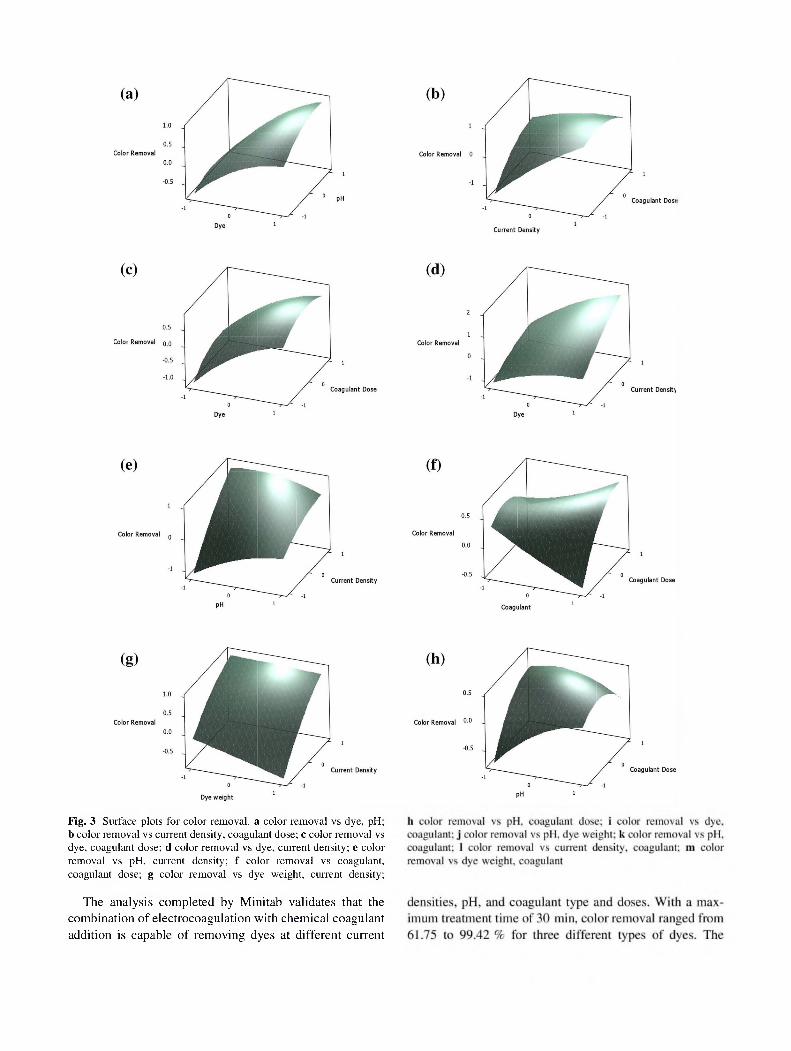
Fig. 3 Surface plots for color removal. a color removal vs dye, pH; b color removal vs current density, coagulant dose; c color removal vs dye, coagulant dose; d color removal vs dye, current density; e color removal vs pH, current density; f color removal vs coagulant, coagulant dose; g color removal vs dye weight, current density;
The analysis completed by Minitab validates that the combination of electrocoagulation with chemical coagulant addition is capable of removing dyes at different current
electrocoagulation results of Körbahti et al. (2011) required a retention time of 60 min to decolorize Acid Blue 29, Reactive Blue 4, Acid Red 98, and Reactive Red 2 (70.6 to 99.47 %). In comparison to previously documented studies, this work has substantially reduced the treatment time necessary for decolorization of dyes. The treatment time is half of the previously recorded times.
Effects of experimental parameters
It is important to determine the potential reasons as to how each experimental parameter effects the results discovered. Therefore, discussion must be made on the individual effects of current density, initial pH, textile dye type, and coagulation.
The effect of current density
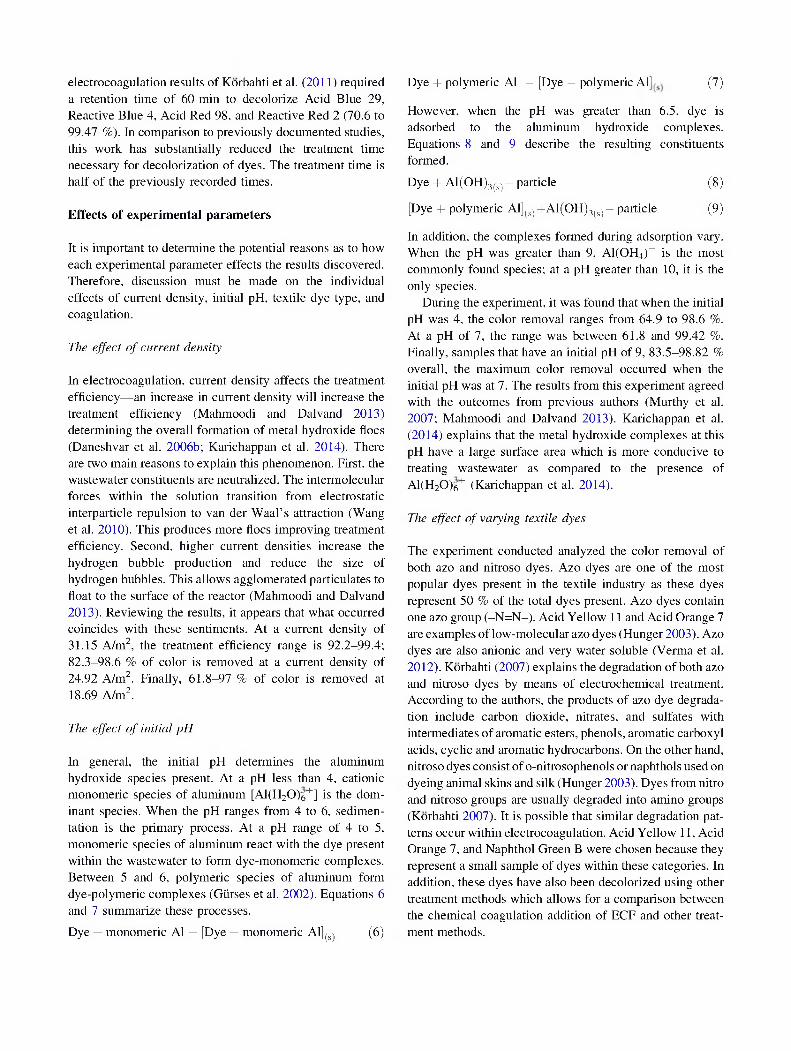
In electrocoagulation, current density affects the treatment efficiency—an increase in current density will increase the treatment efficiency (Mahmoodi and Dalvand 2013) determining the overall formation of metal hydroxide flocs (Daneshvar et al. 2006b; Karichappan et al. 2014). There are two main reasons to explain this phenomenon. First, the wastewater constituents are neutralized. The intermolecular forces within the solution transition from electrostatic interparticle repulsion to van der Waal’s attraction (Wang et al. 2010). This produces more flocs improving treatment efficiency. Second, higher current densities increase the hydrogen bubble production and reduce the size of hydrogen bubbles. This allows agglomerated particulates to float to the surface of the reactor (Mahmoodi and Dalvand 2013). Reviewing the results, it appears that what occurred coincides with these sentiments. At a current density of 31.15 A/m2, the treatment efficiency range is 92.2-99.4; 82.3-98.6 % of color is removed at a current density of 24.92 A/m2. Finally, 61.8-97 % of color is removed at 18.69 A/m2.
The effect of initial pH
In general, the initial pH determines the aluminum hydroxide species present. At a pH less than 4, cationic monomeric species of aluminum [A1(H2O)6+] is the dom- inant species. When the pH ranges from 4 to 6, sedimen- tation is the primary process. At a pH range of 4 to 5, monomeric species of aluminum react with the dye present within the wastewater to form dye-monomeric complexes. Between 5 and 6, polymeric species of aluminum form dye-polymeric complexes (Gürses et al. 2002). Equations 6 and 7 summarize these processes.Dye + monomeric Al — [Dye — monomeric Al](s) (6)
Dye + polymeric Al — [Dye — polymeric Al] (7)
However, when the pH was greater than 6.5, dye is adsorbed to the aluminum hydroxide complexes. Equations 8 and 9 describe the resulting constituents formed.Dye + A1(OH)3(s)— particle (8)
[Dye + polymeric Al](s)+A1 (OH)3(s)—particle (9)
In addition, the complexes formed during adsorption vary. When the pH was greater than 9, A1(OH4)_ is the most commonly found species; at a pH greater than 10, it is the only species.
During the experiment, it was found that when the initial pH was 4, the color removal ranges from 64.9 to 98.6 %. At a pH of 7, the range was between 61.8 and 99.42 %. Finally, samples that have an initial pH of 9, 83.5-98.82 % overall, the maximum color removal occurred when the initial pH was at 7. The results from this experiment agreed with the outcomes from previous authors (Murthy et al. 2007; Mahmoodi and Dalvand 2013). Karichappan et al. (2014) explains that the metal hydroxide complexes at this pH have a large surface area which is more conducive to treating wastewater as compared to the presence of A1(H2O)6+ (Karichappan et al. 2014).
The effect of varying textile dyes
The experiment conducted analyzed the color removal of both azo and nitroso dyes. Azo dyes are one of the most popular dyes present in the textile industry as these dyes represent 50 % of the total dyes present. Azo dyes contain one azo group (-N=N-). Acid Yellow 11 and Acid Orange 7 are examples of low-molecular azo dyes (Hunger 2003). Azo dyes are also anionic and very water soluble (Verma et al. 2012). Körbahti (2007) explains the degradation of both azo and nitroso dyes by means of electrochemical treatment. According to the authors, the products of azo dye degrada- tion include carbon dioxide, nitrates, and sulfates with intermediates of aromatic esters, phenols, aromatic carboxyl acids, cyclic and aromatic hydrocarbons. On the other hand, nitroso dyes consist of o-nitrosophenols or naphthols used on dyeing animal skins and silk (Hunger 2003). Dyes from nitro and nitroso groups are usually degraded into amino groups (Körbahti 2007). It is possible that similar degradation pat- terns occur within electrocoagulation. Acid Yellow 11, Acid Orange 7, and Naphthol Green B were chosen because they represent a small sample of dyes within these categories. In addition, these dyes have also been decolorized using other treatment methods which allows for a comparison between the chemical coagulation addition of ECF and other treat- ment methods.
Acid Yellow 11 was decolorized between 61.75 and 93.65 % after 30 min detention time. Four of the six values greater than 90 % occurred when the current density was 31.1 A/m2. The coagulant that produced the highest treatment efficiency was ferric sulfate, where the pH that produced color removal greater than 90 % was at an initial pH of 7. While electrocoagulation was never a mechanism used for the treatment of Acid Yellow 11, Guo et al. (2006) studied the use of electrochemistry. Xu et al. (2014) degraded Acid Yellow 11 by 90 % in 280 min.
Acid Orange 7 was decolorized 78.37-98.82 % in 30 min retention time. This is very comparable to what was seen in the literature. In many cases Acid Orange 7 has been near or completely decolorized, but at the expense of long retention times—6 h (Ong et al. 2012), 2 h (Wu et al. 2012), and even 50 h (Ong et al. 2008). Acid Orange 7 has been decolorized by Fenton-biological treatment at an optimum pH of 7 (Lodha and Chaudhari 2007), granulated activated carbon (GAC)-biofilm sequencing batch reactor (Ong et al. 2008), wet oxidation (Peng et al. 2008), membrane aerated biological reactor with Shewanella sp., and horseradish peroxidase (Gholami-Borujeni et al. 2011).
Naphthol Green B reported the highest treatment removal. When looking at the contour plots (Fig. 3) the dye weight vs dye plot indicated an optimum dye weight of 20 mg. In the current density vs dye plot, the optimum current density was 31.15 A/m2. When it comes to deter- mining the optimum coagulant, ferric chloride had the highest removal also at the highest current density (31.15 A/m2), along with having the highest dose (15 mg/ L). From the Box-Behnken summary table (Table 3), the coagulant dose is 5 mg/L and pH 9 (FeCl3 = 5 mg/L, pH 9, Color removal — 98.2 %).
When antimony trisulfide was used as a semiconductor, 96.5 % of Naphthol Green B was reduced in 60 min (Ameta et al. 2011). In addition, 10 % Al zinc oxide (ZnO) in sunlight exposure at a treatment time of 6 h (Saber et al. 2012) completely decolorized the dye. Metal hydroxides sludge (MHS) achieved 52 % removal at an optimum pH of 6 (Attallah et al. 2013). Using electrocoagulation, one is capable of having higher treatment efficiency with a shorter retention time as compared with other potential treatment methods.
The effects of coagulant addition—comparing alum and ferric chloride
From the results, it has been observed that the type of coagulant has an impact on color removal. To better discuss the results, assessments were made based on the initial pH. At an initial pH of 4, ferric chloride performed slightly better in removing AO7. There were two sets of runs that can be compared with similar initial conditions:
dye = AO7coagulant = alum coagulant dose = 5 mg/L current density 24.92 A/m2 color removal = 82.30%
It was found that dye removal can be expected in the acidic range for ferric chloride. This is because the surface charge of the coagulant is positive. A positive surface charge can allow for adsorption and removal of anionic species of dye (Moghaddam et al. 2010). Also, at a pH between 4 and 8, the ferric complexes formed are poten- tially more insoluble than alum. This provides an oppor- tunity to form more agglomerates. These agglomerates consist of ferric hydroxide complexes that can be easily adsorbed onto colloids (Kim et al. 2004a; Verma et al. 2012).
Coagulant dose also appears to be a significant factor in the removal of color. An increase in coagulant dose tremendously improves color removal regardless of coagulant. Coagulant dose changes the zeta potential. An increase in coagulant dose will increase the zeta potential, thereby reversing the charge of the coagulant. In many cases, the increase will reverse the charge of the coagulant to become positive. With the dye molecule having become positive, the solution becomes stable. It is also possible that the zeta potential during the process is closer to zero improving the removal of color (Kim et al. 2004a).
At a pH of 7, ferric chloride performed better in removing AY 11. However, alum performed better when in removing NGB. There are several possible reasons as to why this may have occurred. First, one should consider the initial current density where the first set of experiments occurred at the lowest current density (18.69 A/m2). As previously stated, optimum treatment occurred when the initial pH was 7. The supplement of coagulant enhanced the formation of aluminum hydroxide complexes, thereby enhancing treatment. In the second set of experiments, the current density was the highest (31.15 A/m2) providing more binding sites of aluminum hydroxide complexes. Second, the addition of coagulant was suitable for pro- viding more binding sites as compared to the presence of ferric chloride. Third, the difference in the treatment effi- ciency by ferric chloride is related to the type of dye being treated. Several authors found this to be case when
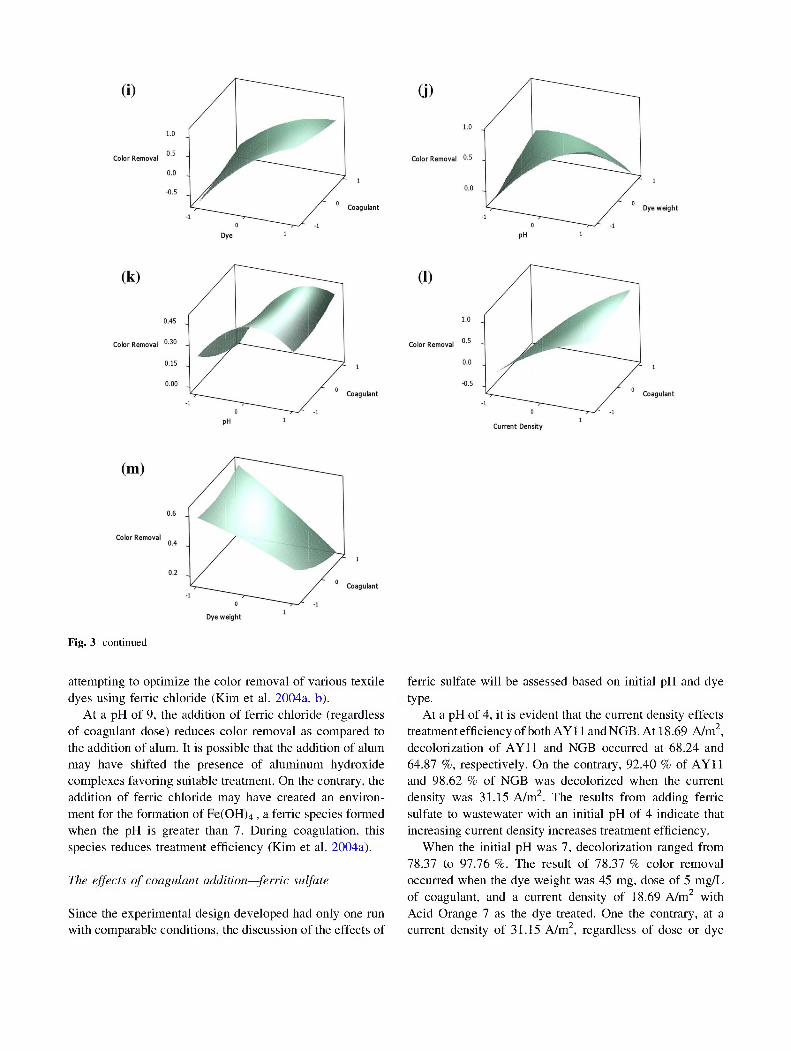
Fig. 3 continued
attempting to optimize the color removal of various textile dyes using ferric chloride (Kim et al. 2004a, b).
At a pH of 9, the addition of ferric chloride (regardless of coagulant dose) reduces color removal as compared to the addition of alum. It is possible that the addition of alum may have shifted the presence of aluminum hydroxide complexes favoring suitable treatment. On the contrary, the addition of ferric chloride may have created an environment for the formation of l’e(OH)4, a ferric species formed when the pH is greater than 7. During coagulation, this species reduces treatment efficiency (Kim et al. 2004a).
The effects of coagulant addition—ferric sulfate
Since the experimental design developed had only one run with comparable conditions, the discussion of the effects of
ferric sulfate will be assessed based on initial pH and dye type.
At a pH of 4, it is evident that the current density effects treatment efficiency of both AY11 and NGB. At 18.69 A/m2, decolorization of AY11 and NGB occurred at 68.24 and 64.87 %, respectively. On the contrary, 92.40 % of AY11 and 98.62 % of NGB was decolorized when the current density was 31.15 A/m2. The results from adding ferric sulfate to wastewater with an initial pH of 4 indicate that increasing current density increases treatment efficiency.
When the initial pH was 7, decolorization ranged from 78.37 to 97.76 %. The result of 78.37 % color removal occurred when the dye weight was 45 mg, dose of 5 mg/L of coagulant, and a current density of 18.69 A/m2 with Acid Orange 7 as the dye treated. One the contrary, at a current density of 31.15 A/m2, regardless of dose or dye
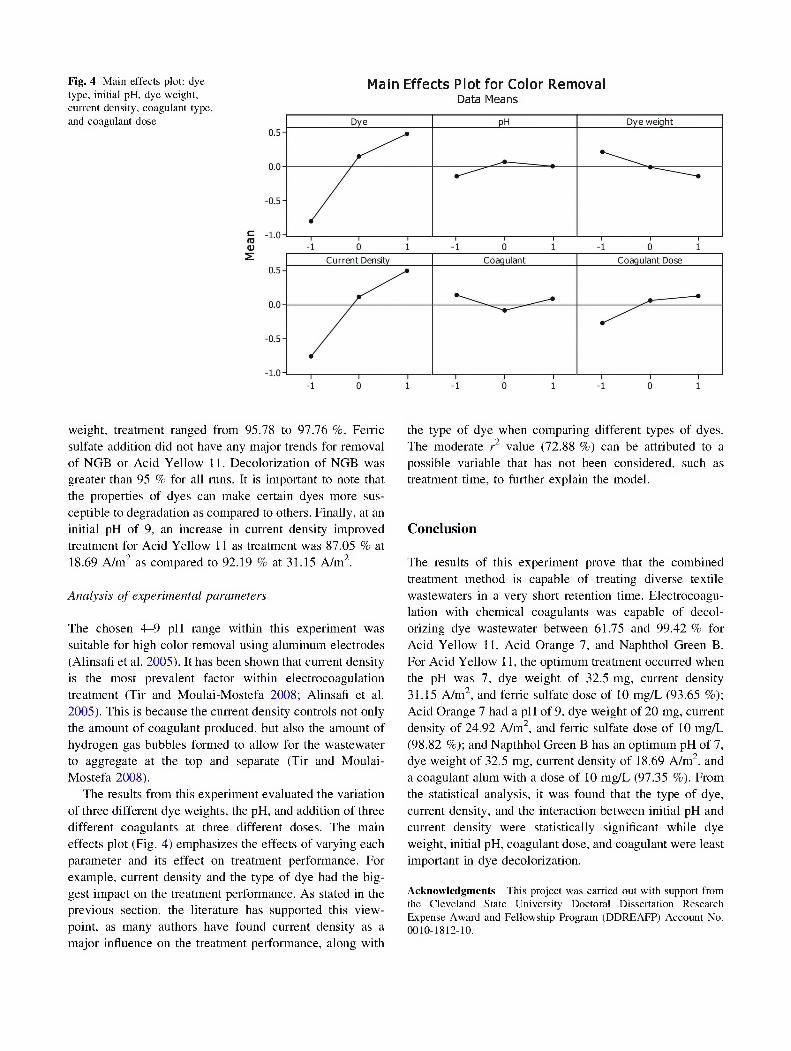
Fig. 4 Main effects plot: dye type, initial pH, dye weight, current density, coagulant type, and coagulant dose
Main Effects Plot for Color RemovalData Means
weight, treatment ranged from 95.78 to 97.76 %. Ferric sulfate addition did not have any major trends for removal of NGB or Acid Yellow 11. Decolorization of NGB was greater than 95 % for all runs. It is important to note that the properties of dyes can make certain dyes more sus- ceptible to degradation as compared to others. Finally, at an initial pH of 9, an increase in current density improved treatment for Acid Yellow 11 as treatment was 87.05 % at 18.69 A/m2 as compared to 92.19 % at 31.15 A/m2.
Analysis of experimental parameters
The chosen 4-9 pH range within this experiment was suitable for high color removal using aluminum electrodes (Alinsafi et al. 2005). It has been shown that current density is the most prevalent factor within electrocoagulation treatment (Tir and Moulai-Mostefa 2008; Alinsafi et al. 2005). This is because the current density controls not only the amount of coagulant produced, but also the amount of hydrogen gas bubbles formed to allow for the wastewater to aggregate at the top and separate (Tir and Moulai- Mostefa 2008).
The results from this experiment evaluated the variation of three different dye weights, the pH, and addition of three different coagulants at three different doses. The main effects plot (Fig. 4) emphasizes the effects of varying each parameter and its effect on treatment performance. For example, current density and the type of dye had the biggest impact on the treatment performance. As stated in the previous section, the literature has supported this viewpoint, as many authors have found current density as a major influence on the treatment performance, along with
the type of dye when comparing different types of dyes. The moderate r2 value (72.88 %) can be attributed to a possible variable that has not been considered, such as treatment time, to further explain the model.
Conclusion
The results of this experiment prove that the combined treatment method is capable of treating diverse textile wastewaters in a very short retention time. Electrocoagulation with chemical coagulants was capable of decolorizing dye wastewater between 61.75 and 99.42 % for Acid Yellow 11, Acid Orange 7, and Naphthol Green B. For Acid Yellow 11, the optimum treatment occurred when the pH was 7, dye weight of 32.5 mg, current density 31.15 A/m2, and ferric sulfate dose of 10 mg/L (93.65 %); Acid Orange 7 had a pH of 9, dye weight of 20 mg, current density of 24.92 A/m2, and ferric sulfate dose of 10 mg/L (98.82 %); and Napthhol Green B has an optimum pH of 7, dye weight of 32.5 mg, current density of 18.69 A/m2, and a coagulant alum with a dose of 10 mg/L (97.35 %). From the statistical analysis, it was found that the type of dye, current density, and the interaction between initial pH and current density were statistically significant while dye weight, initial pH, coagulant dose, and coagulant were least important in dye decolorization.
Acknowledgments This project was carried out with support from the Cleveland State University Doctoral Dissertation Research Expense Award and Fellowship Program (DDREAFP) Account No. 0010-1812-10.
Open Access This article is distributed under the terms of the Creative Commons Attribution 4.0 International License (http:// creativecommons.org/licenses/by/4.0/), which permits unrestricted use, distribution, and reproduction in any medium, provided you give appropriate credit to the original author(s) and the source, provide a link to the Creative Commons license, and indicate if changes were made.
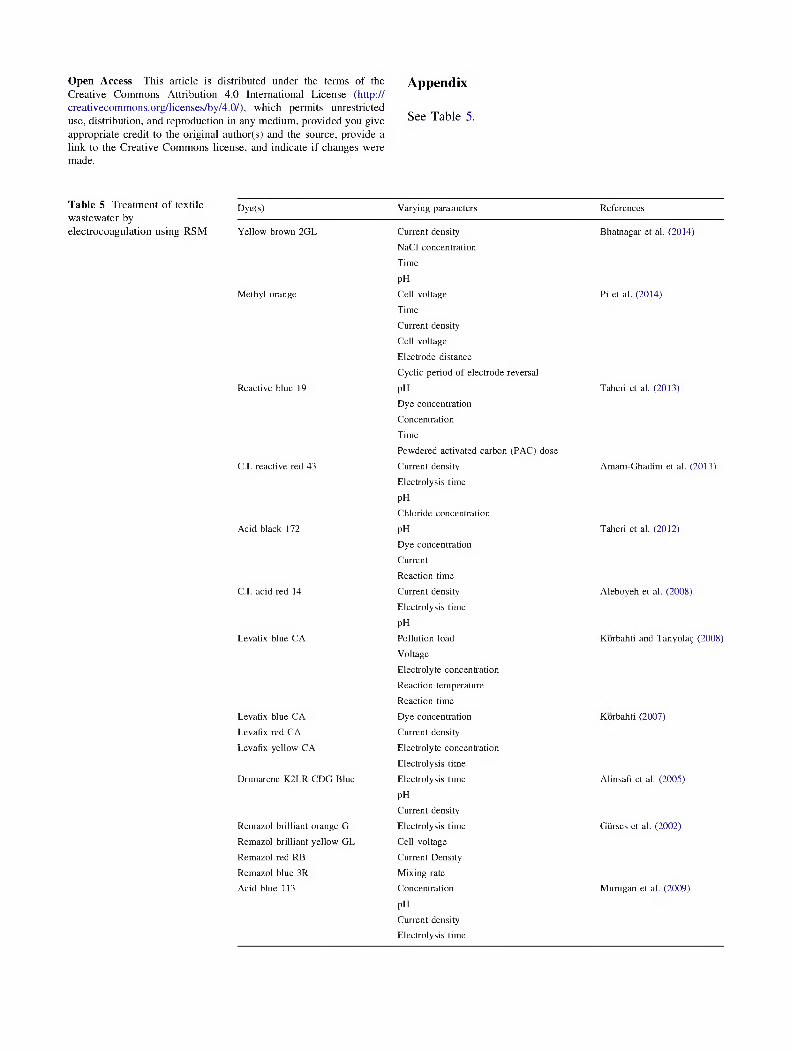
Appendix
See Table 5.
Table 5 Treatment of textile wastewater byelectrocoagulation using RSM
Dye(s) Varying parameters References
Yellow brown 2GL Current densityNaCl concentrationTime
pH
Bhatnagar et al. (2014)
Methyl orange Cell voltageTimeCurrent densityCell voltageElectrode distanceCyclic period of electrode reversal
Pi et al. (2014)
Reactive blue 19 pHDye concentrationConcentrationTimePowdered activated carbon (PAC) dose
Taheri et al. (2013)
C.I. reactive red 43 Current densityElectrolysis time
pHChloride concentration
Amani-Ghadim et al. (2013)
Acid black 172 pHDye concentrationCurrentReaction time
Taheri et al. (2012)
C.I. acid red 14 Current densityElectrolysis time
pH
Aleboyeh et al. (2008)
Levafix blue CA Pollution loadVoltageElectrolyte concentrationReaction temperatureReaction time
Körbahti and Tanyolaϛ (2008)
Levafix blue CA Dye concentration Körbahti (2007)Levafix red CA Current densityLevafix yellow CA Electrolyte concentration
Electrolysis timeDrimarene K2LR CDG Blue Electrolysis time
pHCurrent density
Alinsafi et al. (2005)
Remazol brilliant orange G Electrolysis time Gürses et al. (2002)Remazol brilliant yellow GL Cell voltageRemazol red RB Current DensityRemazol blue 3R Mixing rateAcid blue 113 Concentration
pHCurrent densityElectrolysis time
Murugan et al. (2009)
References
Aleboyeh A, Daneshvar N, Kasiri MB (2008) Optimization of C.I. Acid Red 14 azo dye removal by electrocoagulation batch response surface methodology. Chem Eng Process 47:827-832
Alinsafi A, Khemis M, Pons M, Leclerc J, Yaacoubi A, Benhammou A, Nejmeddine A (2005) Electrocoagulation of reactive textile dyes and textile wastewater. Chem Eng Process 44:461-470
Amani-Ghadim AR, Aber S, Olad A, Ashassi-Sorkhabi H (2013) Optimization of electrocoagulation process for removal of an azo dye using response surface methodology and investigation on the occurrence of destructive side reactions. Chem Eng Process 64:68-78
Ameta R, Punjabi PB, Ameta SC (2011) Photodegradation of naphthol green B in the presence of semiconducting antimony trisulphide. J Serb Chem Soc 76:1049-1055
Attallah MF, Ahmed IM, Hamed MM (2013) Treatment of industrial wastewater containing Congo red and naphthol green B using low-cost adsorbent. Env Sci Poll Res 20:1106-1116
Bhatnagar R, Joshi H, Mall ID, Srivastava VC (2014) Electrochem- ical treatment of acrylic dye-bearing textile wastewater: opti- mization of operating parameters. Desalin Water Treat 52:111-122
Bhatti MS, Reddy AS, Thukral AK (2009) Electrocoagulation removal of Cr(VI) from simulated wastewater using response surface methodology. J Hazard Mater 172:839-846
Bhatti MS, Reddy AS, Kalia RK, Thukral AK (2011) Modeling and optimization of voltage and treatment time for electrocoagula- tion removal of hexavalent chromium. Desalination 269:157-162
Butler E, Hung YT, Yeh RL, Suleiman Al Ahmad M (2011). Electrocoagulation in wastewater treatment [Online], Water 3:495-525. Available at http://www.mdpi.com/2073-4441/3/2/ 495/pdf, Creative Commons Attributions (http:// creativecommons.org/licenses/by/3.0/). Accessed 2 Aug 2013
Can OT, Kobya M, Demirbas E, Bayramoglu M (2006) Treatment of the textile wastewater by combined electrocoagulation. Chemo- sphere 62:181-187
Canizares P, Martinez F, Jimenez C, Lobato J, Rodrigo MA (2006) Coagulation and electrocoagulation of waste polluted with dyes. Environ Sci Technol 40:6418-6424
Chavalparit O, Ongwandee M (2009) Optimizing electrocoagulation process for the treatment of biodiesel wastewater using response surface methodology. J Environ Sci 21:1491-1496
Daneshvar N, Oladegaragoze A, Djafarzadeh N (2006a) Decoloriza- tion of basic dye solutions by electrocoagulation: an investiga- tion of the effect of operational parameters. J Hazard Mater B129:116-122
Daneshvar N, Khataee AR, Djafarzadeh N (2006b) The use of artificial neural networks (ANN) for modeling of decolorization of textile dye solution containing CI basic yellow 28 by electrocoagulation process. J Hazard Mater 137:1788-1795
Gholami-Borujeni F, Mahvi AH, Nasseri S, Faramarzi MA, Nabizadeh R, Alimohammadi M (2011) Enzymatic treatment and detoxification of acid orange 7 from textile wastewater. Appl Biochem Biotechnol 165:1274-1284
Guo J, Zhou J, Wang D, Xiang X, Yu H, Tian C, Song Z (2006) Correlation of anaerobic biodegradability and the electrochemical characteristic of azo dyes. Biodegradation 17:341-346
Gürses A, Yalchin M, Dogar C (2002) Electrocoagulation of some reactive dyes: a statistical investigation of some electrochemical variables. Waste Manage 22:491-499
Hunger K (ed) (2003) Industrial dyes: chemistry, properties, appli- cations. Wiley-VCH, Kelkhei
Joshi M, Bansal R, Purwar R (2004) Colour removal from textile effluents. Ind J Fibre Textile Res 29:239-259
Karichappan T, Venkatachalam S, Jeganathan PM (2014) Optimiza- tion of electrocoagulation process to treat grey wastewater in batch mode using response surface methodology. J Environ Health Sci Eng 12:29-36
Kim TH, Park C, Yang J, Kim S (2004a) Comparison of disperse and reactive dye removals by chemical coagulation and Fenton oxidation. J Hazard Mater 112:95-103
Kim TH, Park C, Shin EB, Kim S (2004b) Decolorization of disperse and reactive dye solutions using ferric chloride. Desalination 161:49-58
Körbahti BK (2007) Response surface optimization of electrochem- ical treatment of textile dye wastewater. J Hazard Mater 145:277-286
Körbahti BK, Tanyolaϛ A (2008) Electrochemical treatment of simulated textile wastewater with industrial components and levafix blue CA reactive dye: optimization through response surface methodology. J Hazard Mater 151:422-431
Körbahti BK, Artut K, Gecgel C, Ozer A (2011) Electrochemical decolorization of textile dyes and removal of metal ions from textile dye and metal ion binary mixtures. Chem Eng J 173:677-688
Lodha B, Chaudhari S (2007) Optimization of Fenton-biological treatment scheme for the treatment of aqueous dye solutions. J Hazard Mater 148:459-466
Mahmoodi NM, Dalvand A (2013) Treatment of colored textile wastewater containing acid dye using electrocoagulation pro- cess. Desalin Water Treat 51:5959-5964
Martinez-Huitle CA, Brillas E (2009) Decontamination of wastew- aters containing synthetic organic dyes by electrochemical methods: a general review. Appl Catal B 87:105-145
Merzouk B, Gourich B, Madani K, Vial C, Sekki A (2011) Removal of a disperse red dye from synthetic wastewater by chemical coagulation and continuous electrocoagulation. A comparative study. Desalination 272:246-253
Moghaddam SS, Moghaddam AMR, Arami M (2010) A comparison study on acid red 119 dye removal using two different types of waterworks sludge. Water Sci Technol 61:1673-1681
Murthy ZVP, Nancy C, Kant A (2007) Separation of pollutants from restaurant wastewater by electrocoagulation. Separ Sci Technol 42:819-833
Murugan AA, Ramamurthy T, Subramanian B, Kannan CS, Ganesan M (2009) Electrocoagulation of textile effluent: RSM and ANN modeling. Int J Chem React Eng 7:1-16
National Institute of Standards and Technology (2013). Response surface designs. [Online] http://www.itl.nist.gov/div898/ handbook/pri/section3/pri336.htm. Accessed 17 June 2015
Nguyen QP, Sun ZN, Hu XM (2012) Decolorization of CI. direct green 6 dye in aqueous solution by electrocoagulation using iron anode. Front Energy Environ Eng 2012:76-80
Ong SA, Toorisaka E, Hirata M, Hano T (2008) Granular activated carbon-biofilm configured sequencing batch reactor treatment of CI acid orange 7. Dyes Pigments 76:142-146
Ong S, Ho L, Wong Y, Min O, Lai L, Khiew S, Murali V (2012) Photocatalytic mineralization of azo dye acid orange 7 under solar light irradiation. Desalin Water Treat 48:245-251
Peng Y, Fu D, Liu R, Zhang F, Liang X (2008) NaNO2/FeCl3 catalyzed wet oxidation of the azo dye acid orange 7. Chemo- sphere 71:990-997
Pi KW, Xiao Q, Zhang HQ, Xia M, Gerson AR (2014) Decolorization of synthetic methyl orange wastewater by electrocoagulation with periodic reversal of electrodes and optimization by RSM. Process Saf Environ 92:796-806
Prasad RK, Kumar RR, Srivastava SN (2008) Design of optimum response surface experiments for electro-coagulation of distillery spent wash. Water Air Soil Poll 191:5-13
Saber O, El-Brolossy TA, Al Jaafari AA (2012) Improvement of photocatalytic degradation of naphthol green B under solar light using aluminum doping of zinc oxide nanoparticles. Water Air Soil Poll 223:4615-4626
Shelley ML, Randall CW, King PH (1976) Evaluation of chemical- biological and chemical-physical treatment for textile dyeing and finishing waste. J Water Pollut Control Fed 48:753-761
Taheri M, Moghaddam MRA, Arami M (2012) Optimization of acid black 172 decolorization by electrocoagulation using response surface methodology. Iranian J Env Health Sci Eng 9:1-8
Taheri M, Moghaddam MA, Arami M (2013) Techno-economical optimization of reactive blue 19 removal by combined electro- coagulation/coagulation process through MOPSO using RSM and ANFIS models. J Environ Manage 128:798-806
Tezcanli-Guyer G, Ince NH (2003) Degradation and toxicity reduc- tion of textile dyestuff by ultrasound. Ultrason Sonochem 10:235-240
Tir M, Moulai-Mostefa N (2008) Optimization of oil removal from oily wastewater by electrocoagulation using response surface method. J Hazard Mater 158:107-115
Tosik R, Wiktorowski S (2011) Color removal and improvement of biodegradability of wastewater from dyes production using ozone and hydrogen peroxide. Ozone-Sci Eng 23:295-302
Trifi B, Cavadias S, Bellakhal N (2011) Decoloration of methyl red by gliding arc discharge. Desalin Water Treat 25:65-70
Verma AK, Dash RR, Bhunia P (2012) A review on chemical coagulation/flocculation technologies for removal of colour from textile wastewaters. J Environ Manage 93:154-168
Wang CT, Chou WL, Huang KY (2010) Treatment of polyvinyl alcohol from aqueous solution via electrocoagulation. Separ Sci Technol 45:212-220
Wang T, Liang H, Yuan Q (2011) Optimization of ultrasonic- stimulated solvent extraction of sinigrin from Indian mustard seed (Brassica Juncea L.) using response surface methodology. Phytochem Anal 22:205-213
World Bank Group, United Nations Environment Programme, United Nations Industrial Development Organization (1999) Pollution prevention and abatement handbook 1998: toward cleaner production. World Bank Group, Washington DC
Wu J, Zhang H, Qiu J (2012) Degradation of acid orange 7 in aqueous solution by a novel electro/Fe2+/peroxydisulfate process. J Hazard Mater 215:138-145
Xu H, Yu T, Liu J (2014) Photo-degradation of acid yellow 11 in aqueous on nano-ZnO/bentonite under ultraviolet and visible light irradiation. Mater Lett 117:263-265
Zaroual Z, Chaair H, Essadki AH, El Ass K, Azzi M (2009) Optimizing the removal of trivalent chromium by electrocoag- ulation using experimental design. Chem Eng J 148:488-495
Zodi S, Potier O, Lapicque F, Leclerc J (2010) Treatment of the industrial wastewaters by electrocoagulation: optimization of coupled electrochemical and sedimentation processes. Desalina- tion 261:186-190
Post-print standardized by MSL Academic Endeavors, the imprint of the Michael Schwartz Library at Cleveland State University, 2018


![Cleaner Tannery Wastewater Using Chemical Coagulants · titration (Argentometria) [15]. Sulfate analysis was performed by precipitation with BaCl 2 to filtered effluent [15]. H2S](https://img.pdfslide.net/doc/110x75/5e37328e736fbd3cbe3ddecf/cleaner-tannery-wastewater-using-chemical-titration-argentometria-15-sulfate.jpg)