Embed Size (px)
Citation preview
The Effects of Computer-Assisted
Instruction on Middle School Mathematics
Achievement
John Edward Ash


Dedication
For the support and patience through a long and difficult process, I would like to dedicate this work to my family.
My parents taught me that a person is judged in life by what they give, not what they have. No child has ever been luckier to have the love and support that I was given. I pray that I will live my life in a way to honor them.
I hope my children will always believe that all things are available to them with education and enough hard work. Anything and everything is possible for them. Both are them are wonderful and I love them and will always be incredibly proud that they are mine.
All things in my life begin and end with my wife. Anything is possible as long as I have her. She has been my pillar of support and my inspira-tion to continue through this experience. With her, I will always feel that I am a success.
�
Chapter I – Introduction .....................................................................................................7 Overview..................................................................................................................7 Significance of the Study .........................................................................................7 Statement of the Problem ........................................................................................9 Purpose of the Study .............................................................................................10 Research Questions ..............................................................................................10 Null Hypotheses ....................................................................................................10 Limitations and Delimitations ................................................................................. 11 Definition of Terms ................................................................................................. 11Chapter II – Literature Review .........................................................................................13 Overview................................................................................................................13 Brief History of Computers in Education................................................................13 Mastery Learning ...................................................................................................14 Computer-Assisted Instruction ..............................................................................14 Studies of the Effects of Computer-Assisted Instruction .......................................16 Cost of Implementing Technology .........................................................................20 Summary ...............................................................................................................21Chapter III – Research Design ........................................................................................22 Overview................................................................................................................22 Research Design ...................................................................................................22 Null Hypotheses ....................................................................................................22 Population and Sample ........................................................................................22 Procedure ..............................................................................................................23 Instrumentation ......................................................................................................24 Internal Validity ......................................................................................................24 Statistical Techniques .............................................................................................25Chapter IV – Findings ......................................................................................................26Chapter V – Summary, Conclusions, and Recommendations .........................................29 Summary ...............................................................................................................29 Conclusions ...........................................................................................................31 Recommendations for Future Research................................................................31 Recommendations for the Profession ...................................................................32References ......................................................................................................................33Appendices ......................................................................................................................39 A Control Group’s Scores and Demographic Information .................................39 B Experimental Group’s Scores and Demographic Information .......................44 C Pre – Test 7th and 8th ...................................................................................48 D Post – Test 7th and 8th .................................................................................54 E Pre – Test 6th ...............................................................................................60 F Post – Test 6th ...............................................................................................70
Table of ConTenTs
�
Table 1. Basic Statistics of the Control Group .................................................................26
Table 2. Basic Statistics of the Experimental Group ........................................................26
Table 3. Results of the t-Test Comparing the Mean of the Difference from the Pre-test to the Post-test of the Control and Experimental Groups .......................................................................................................................27
Table 4. Percentage Gain of Each Ethnic Group .............................................................28
Table 5: Results of the t-Test Comparing the Mean of the Difference Female Subjects and the Male Subjects ..................................................................28
lisT of Tables
�
Success in mathematics is central to a good education in the modern world. The better educated a society the more successful the society. The United States is behind the world in mathematics education and must do everything to develop effective pedagogies for its instructions.
Proponents of computer technology in education argue that it makes learning easier, more ef-ficient, and more motivating (Schacter & Fagnano, 1999). Skeptics argue that there is a lack of experimental data obtained under rigorous scientific standards. Computer-assisted instruction (CAI) is an educational medium in which a computer delivers instructional content or activities. Many studies have been completed attempting to determine the effects of computer-assisted in-struction on academic achievement. Frank Brown (2000) found a 17% increase in achievement in mathematics during a study in North Carolina. A recent study by Traynor (2003) found that utilizing computer-assisted instruction improved instruction over only using traditional methods. Traynor found a significant increase in academic achievement.
For this study, a cause-effect linkage was suspected between the use of computer-assisted in-struction software and achievement in mathematics. A study was required to prove or disprove this relationship in which one can manipulate the variable of computer-assisted instruction. A quasi-experimental study was used with a two-group, pre-test post-test design. The control group was taught by traditionally accepted teaching methods throughout the study. The experi-mental group received the same traditional teaching methods plus one hour a week of computer assisted instruction in the form of Orchard software. The differences between the scores on the post-test and pre-test were calculated and the means of the differences from the experimental group and the control group were compared using a t-test. The results of the data analysis indi-cated that the use of computer-assisted instruction in addition to traditional teaching methods is more effective than traditional teaching methods alone. No difference was found between the genders of the subjects in the change of their academic achievement as measured by the differ-ence from the pre-test to the post-test.
absTraCT
7
INTRODUCTION
Overview
Since the beginning of time, cultures and societies have recognized the importance of mathemat-ics. Mathematics is more than a simple subject; it is a language that helps us describe ideas and relationships drawn from our environment. Mathematics is a tool of science and technology that enables people to explore concepts with idealized models before trying them in the real world (Clark and Fulton, 2003).
Despite the importance of mathematics, research has found that U.S. students rank lower than their peers from other countries. Students from the United States scored below the international average on the Third International Mathematics and Science Study. Twelfth grade students in the United States were the third country from the bottom on the test out of twenty-one nations tested (Lubell, 1998).
The world is firmly entrenched in a new century as well as a new millennium. In spite of the shortcomings of American students in mathematics, educators have been slow to embrace the rapid change that has engulfed other areas of our life. Enter most classrooms today and very little difference from a classroom of a hundred years ago would be observed in the methods of instruction. Despite the great amount of money that has been spent of technology, today’s teach-ers still primarily convey information to students in the form of lecture. Several billion dollars has been spent in the United States to ensure access to technology for all students (Johnson, 2000). Between the years 1997 and 2000, the federal government alone spent 1.25 billion dollars on the Technology Literacy Challenge Fund that provides funding for new computers, software, and teacher training (Johnson, 2000). Many groups have championed the cause for computers in America’s schools including the federal government. In March of 1997, the President’s Commit-tee of Advisors on Science and Technology recommended the federal government should spend 6 to 28 billion each year on a program to increase computer infrastructure, teacher training, and re-search (Panel on Educational Technology, 1997). Research indicates that the use of technology, especially computer-assisted instruction is superior to traditional methods of instruction alone. The research demonstrates that the benefit of computer-assisted instruction is generally true of different ages and abilities and for learning in different curricular areas (Cotton, 1991).
Mathematics instruction is too important to not utilize all available resources to their full poten-tial. America has invested large amounts of money on technology. We must ensure that the use of technology in instruction is effective in increasing student academic achievement. Research conducted on the effectiveness of computer-assisted instruction has not been extensive or conclu-sive. Further research is required to determine if the vast amounts of money spent is warranted.
Significance of the Study
Mathematics equips pupils with a uniquely powerful set of tools to understand and change the world. These tools include logical reasoning, problem-solving skills, and the ability to think in abstract ways. Mathematics is important in everyday life, many forms of employment, science and technology, medicine, the economy, the environment and development, and in public deci-sion-making (Clark and Fulton, 2003). The special emphasis on achievement in mathematics reflects the fact that competencies in these areas have important economic consequences for indi-
ChapTer 1
8
viduals and for the United States. For the individual, strong mathematics competencies improve the likelihood of employment, result in higher wages once employed, and improve on-the-job productivity. The overall productivity of a society’s citizens, in turn, has an important influence on the standard of living of members of that society.
Well-educated and economically productive citizens normally enjoy good living conditions. Given the important link between competencies in mathematics and economic outcomes, it is in the best interest of the United States to develop a world-class educational system in mathematics (Geary and Hamson, 2004). Generally, the higher the levels of education the higher the likeli-hood of employability and higher wages once employed. The benefits associated with education tend to increase with increases in the technical complexity of the associated school-taught com-petencies. In technologically complex societies, such as the United States, there is a particular premium associated with math-intensive skills (Geary and Hamson, 2004). Strong quantitative competencies influence employability and productivity in many blue collar and white collar jobs, above and beyond the influence of intelligence, reading ability, years of schooling, race, and gender (Geary and Hamson, 2004). Poor mathematical competencies restrict college major and later career choices for individuals pursuing post-secondary education. Moreover, the more math-intensive the occupation, the higher the entry-level and subsequent wages. These relatively high-paying occupations include engineering and the math-intensive physical sciences (Geary and Hamson, 2004).
Strong academic competencies in mathematics improve the chances of employment and result in higher wages and higher on-the-job productivity once employed. Not only do strong mathemati-cal competencies influence the economic well-being of individuals, through their relation to em-ployability and wages, they also have wider social consequences, as noted above. For instance, it has been estimated that the poor mathematical and literacy of the workforce will cost the U.S. economy nearly 170 billion dollars each year by the year 2000. Thus, a first-rate educational sys-tem provides individual and general social benefits (Geary and Hamson, 2004).
Educational outcomes in mathematics would appear to be especially important and beneficial in societies, such as the United States, where many jobs require some level of technical sophistica-tion. With this in mind, it is important to consider how the mathematics education of our children rate in terms of international standards. The first systematic cross-national assessment of math-ematical competencies was conducted in 1964 and included 13- and 17-year-olds from 12 indus-trialized nations. The results of this study indicated that American adolescents were among the most poorly educated mathematics students in the industrialized world. Of the 12 participating nations, the American 13-year-olds ranked 10th and 11th, across two comparisons. The assess-ment of the 17-year-olds was based on students who were enrolled in a math-intensive college preparatory high school curriculum, that is, each country’s best prepared students. The American 17-year-olds ranked last (New York State United Teachers , 2004).
The most recent cross-national study, conducted in 1994 and 1995, compared primary, middle, and high-school students in mathematics achievement across 45 nations. The assessment of 8th graders included 8 of the 12 nations that participated in the first multi-national assessment. Of these, U.S. 8th graders ranked 7th. American children and adolescents have scored below the international average in mathematics achievement for more than 30 years. In the most recent
ChapTer 1 (ConT.)
9
ChapTer 1 (ConT.)
study, about three out of five U.S. 7th and 8th graders scored below the international average in mathematics. Or, stated differently, just over two out of five U.S. students scored above the international average. However, only about 1 out of 100 U.S. students scored as well as the aver-age student in the top-ranked nation, Singapore. Thus, while this most recent study indicates that U.S. middle-school students are not substantially below the international average, they are far from being the best in the world (New York State United Teachers , 2004).
In all, while the rank of American children and adolescents is disturbingly low in mathematics, the real significance of these studies is found in the large gap between the mathematical compe-tencies of America’s students and their peers in most other nations. The mathematical competen-cies of the typical American student are below international standards and even the best educated mathematics students in the United States are, in most comparisons, no match for the best edu-cated students in many other industrialized nations (Geary and Hamson, 2004).
Research on the effects of computers on student academic achievement began in the 1960s. The early research that was done was inconclusive in determining the effectiveness of computers. Skinner (1965) felt that the use of computers could build confidence in education (p. 19). Lums-daine (1965) warned that an evaluation of computer-assisted instruction should be undertaken in many areas. These evaluations included how many students started and completed the program, average completion time, average level of performance on pre-test and post-test of achievement, and the variability of these measures (Lumsdaine, 1965). More recent studies are not any more conclusive than the early studies. Baker (1999), in a study of research done on computer-assisted instruction, claims there is a lack of controlled studies. Baker found that the majority of studies were conducted by surveying students’ and teachers’ attitudes and opinions toward computers. The surveys were not conducted in an experimental fashion with a control group and experimen-tal group.
In 1997, Harold Wenglinsky of the Educational Testing Service published a major study on computers and academic achievement. Wenglinsky used data obtained from the 1996 National Assessment of Educational Progress (NAEP) mathematics examination. He found that while a positive effect of computer technology did exist, students who only used computers for drill and practice, as opposed to using them in ways that would develop higher order, thinking, did worse on the NAEP test than the students who had not used the computers at all. The need for a study utilizing a control group is evident. Few studies have been conducted to demonstrate a relation-ship between computer-assisted instruction and increase in academic achievement. Christmann, Badgett, and Lucking (1997) suggested that further research is necessary to determine whether or not computer-assisted instruction is more effective in different subject areas. This study should reveal if computer-assisted instruction is more effective than traditional teaching methods in the teaching of middle school mathematics.
Statement of the Problem
The importance of mathematics education to America in a progressively more competitive world makes it imperative that all possible is done to ensure the best instruction available. Many educators and non-educators believe that the use of computer-assisted instruction as part of the curriculum is superior to other pedagogies (Kulik, 1994). This study is intended to determine the
10
effect of computer-assisted instruction on student achievement in mathematics as compared to classes using only traditional teaching methods. The study will concentrate on the mathemat-ics modules. The quasi-experimental study will determine whether or not the effectiveness of computer-assisted instruction is effective in improving middle school mathematics achievement as compared to traditional teaching methods.
If a positive relationship is found between the use of computer-assisted instruction and achieve-ment in mathematics, further investment in technology would be indicated. Too many school systems have implemented large amounts of technology not as a solution to improving learning but as a public relations ploy to reassure parents and the public that the system is cutting edged (Trautman, 2002). Money and time have been invested in the development of software and hardware for schools and the utilization of software in class. The school system in which the study was conducted spent $10,426,000 between the years of 1998 and 2002 on computers alone. Another $7,350,000 has been spent on peripheral devices, such as, scanners, digital cameras, and large screen televisions and staff development (Rutherford County Schools Technology Plan, 2003).
Purpose of the Study
The purpose of this study was to determine if instruction including computer-assisted instruc-tion in mathematics produces higher levels of academic achievement than traditional teaching methods alone. Mathematics instruction has changed very little over time. Mathematics teach-ers today use the same methods as their ancestors (Shellard & Moyer, 2002). Students have a concept introduced to them by the teacher; the students then practice the concept, and are tested. All students are expected to progress at the same rate. American students have continued to fall behind their counterparts throughout the world (TIMSS, 2003). Results on the Third Interna-tional Mathematics and Science Study, which tests eighth-graders, placed U.S. students 28th out of 41 countries in math (TIMSS, 2003). Great amounts of time, money, and efforts have been invested in computer usage in education.
Research Questions
The following research questions guided the study.
1. Will the use of a computer-assisted instructional software package once per week produce a higher level of academic achievement in mathematics by middle school students as measured by tests provided by the textbook publisher as compared to students that received only tradi-tional teaching methods?
2. Is there a difference in academic gains in mathematics as based on race or gender from the use of computer-assisted instruction as compared to students that receive only traditional teaching methods?
Null Hypotheses
H1 There will be no statistically significant differences between the level of achievement in mathematics as measured by pre-test and post-tests of an experimental group of middle school students who received computer-assisted instruction compared to a control group.
ChapTer 1 (ConT.)
11
ChapTer 1 (ConT.)
H2 There will be no statistically significant difference in mathematics achievement as measured by pre-test and post-tests of students based on their ethnicity of students that received com-puter-assisted instruction.
H3 There will be no statistically significant difference in mathematics achievement as measured pre-test and post-tests of male and female students that received computer-assisted instruc-tion.
Limitations and Delimitations
1. The results of the study may not generalize to other settings due to only two schools being involved. The schools have very similar socio-economic and racial makeup.
2. The limited number of schools will also limit the sample to approximately 400 students. A larger sample would increase the ability to generalize and possible eliminate some extraneous variables.
3. The computer skills of the students may not be equal. Some students may not benefit to the same degree by the use of the computers due to their struggles in using them.
4. The groups were obtained by random cluster sampling. A truly random sample is impossible in the school setting. This prevents the sample from being generalized to a greater extent.
5. The study was conducted over a twelve-week period. A longer period would give greater validity to the results and would eliminate some environmental factors. The longer period of time would ensure that the treatment of the study was the cause of any change.
Definition of Terms:
Bandwidth describes information-carrying capacity. Bandwidth is most accurately measured in cycles per second, or hertz (Hz), which is the difference between the lowest and highest frequen-cies transmitted (Computer Desktop Encyclopedia).
Computer infrastructure is the hardware, software, and necessary wiring to ensure connectivity on a wide area or local area network.
Computer-assisted instruction (CAI) is an educational medium in which instructional content or a computer delivers activities. Students learn by interacting with the computer and appropriate feedback is provided. Several acronyms represent the use of computers in educating students. These are:
CAI: Computer-assisted Instruction
CAL: Computer-assisted Learning
CaI: Computer Aided Instruction
CaL: Computer Aided Learning
CBI: Computer Based Instruction
CBL: Computer Based Learning (Mundane)
12
Learner directed instruction is when the student sets the pace, the direction, and depth of the instruction.
Lecture method of instruction is a way of teaching in which the teacher in an oral method pres-ents the majority of the course content.
A network is a group of two or more computer systems linked together to allow sharing of soft-ware (Computer Desktop Encyclopedia).
The traditional method of mathematics instruction involves the teacher presenting the material in a lecture method. The material is then reviewed by samples from the textbook or worksheets de-rived by the teacher, the textbook, or both. The teacher through observations, quizzes, and tests determines mastery of the material.
ChapTer 1 (ConT.)
13
LITERATURE REVIEW
Overview
The importance of academic achievement in mathematics indicates that any method that is suc-cessful should be encouraged. The limited amounts of funding available for education requires that no money should be wasted. Computer-assisted instruction has been hailed as a major step forward in education. Billions of dollars have been spent on technology in schools. The research on the effectiveness of computer-assisted instruction on academic achievement as compared to effects on achievement by traditional teaching methods is sparse and, in some cases, not of good quality (North Central Regional Laboratory, 2004).
Proponents of computer technology in education argue that it makes learning easier, more ef-ficient, and more motivating (Schacter & Fagnano, 1999). Skeptics argue that there is a lack of experimental data obtained under rigorous scientific standards. An argument is made that if the experiments were done using a more scientific method, the instructional
method would prove to be the controlling factor and not the media of the instruction (Clark, 1983; Neal 1998). This chapter will provide information on the history of computers in educa-tion and the costs associated with this technology. Finally, a review of other research on the effects of computer-assisted instruction on student achievement will be provided.
Brief History of Computers in Education
Computer use in classrooms has changed greatly since the inception of the medium. A great deal of the early computer-assisted instructional software was developed by Patrick Suppes at Stanford University during the 1960s. Dr Suppes systematically analyzed arithmetic courses and other subject courses. He designed highly structured computer systems that allowed for learner feedback, branching of the material, and student record keeping (Coburn et al. 1982).
Before the early 1980s, computers were too expensive to be used in K-12 education. The intro-duction of the Apple II and the Radio Shack TRS-80 allowed more widespread use. The comput-er was considered a subject area. Computers were a topic to be studied and not integrated into all areas of the curriculum. Students were taught computer literacy as well as BASIC computer language (Kinnaman 1990). The principal use of computers in school was record keeping.
The late 1980s saw a marked reduction in the cost of computers. Schools began to budget mon-ey for technology. Computers were still not fully implemented into the curriculum due to many factors. Money was not budgeted for teacher training or computer maintenance and limited software applications for education were available. The future need in the job place for skills associated with the use of technology was not yet determined (Christman & Badgett, 2000). The educational community had only begun to herald computers as being an effective teaching meth-odology (Christman & Badgett, 2000).
The emergence of computer-assisted instruction and incorporation of technology into all aspects of the curriculum began in the early 1990s. The Internet led to a quick proliferation of com-puters in the home. Students were more comfortable using computers allowing for a greater integration into their day. Computer-assisted instruction moved beyond simple drill and prac-
ChapTer 2
14
tice. Software became more effective by being more adaptive to each individual student’s needs (Christman & Badgett, 2000). The increased emphasis on the individual student and their learn-ing requirements caused a greater interest in computer-assisted instruction. As more research was completed on student learning, it was found that students benefited from the learning-cen-tered environment that computers made possible. The focus of computer use in the classroom shifted to quality of learning. Product based learning became more prevalent in the educational arena. Product based learning has a project as part of the assignment such as a research paper or presentation (North Central Regional Laboratory, 2004).
Mastery Learning
One of the basis for computer-assisted instruction is the theory that everyone can learn given enough time and personal attention (Bloom, 1984). Bloom’s model of Mastery Learning calls for students to receive individualized instruction as necessary until they master all the course material (Bloom, 1984). Mastery learning does not focus on content, but on the process of mastering it. Major objectives representing the course or unit define mastery of the subject. The material is divided into smaller, sequentially organized units. Mastery learning should include numerous opportunities for feedback to the instructor. Each unit is preceded by brief diagnostic test. The results of the diagnostic tests are used to determine supplementary instruction to help the students overcome problems. The students must demonstrate mastery of the individual units before moving on to other units (Huet, 1996).
Another model of mastery learning is Keller’s Personalized System of Instruction (Keller, 1968). Keller’s model has four distinguishing characteristics. First, the instructor presents the infor-mation utilizing more written materials than the traditional lecture method. Instead of the oral method of instruction the teacher selects and creates appropriate reading materials as well as provides the student with learning objectives and study questions. Secondly, students finish as-signments at their own pace. Third, students must demonstrate their mastery of objectives before they are allowed to proceed. Finally, the teaching resources are devoted to helping students over-come their deficiencies (Keller, 1968).
The concept of mastery learning has been further enhanced by the use of computers in educa-tion. The computer allows for very individualized instruction. Each child can work at his or her own pace. This is one of the cornerstones of mastery learning (Vockell, 1990). Computers allow for a great amount of testing and analysis of the data gained from the test. Each child can be tested before a concept is covered in the class. The students’ mastery of individual concepts in the lesson can be determined. This allows the teacher to concentrate on the shortcomings of the students. The time factor for the testing is greatly shortened. The information concerning the learner’s needs is easily accessible and understood by the instructor (Vockell, 1990). Mastery of a topic is easily determined by the computer. After the student has mastered the objective or concept the learner can continue on to the next topic.
Computer-Assisted Instruction
Computer-assisted instruction (CAI) is an educational medium in which a computer delivers instructional content or activities. The Association for Educational Communications and Tech-nology defined computer-assisted instruction as a method of instruction in which the computer is
ChapTer 2 (ConT.)
15
ChapTer 2 (ConT.)
used to instruct the student and contains the instruction designed to teach, guide, and test the stu-dent until a desired level of proficiency is attained (Association for Educational Communications and Technology, 1977). The level that the computer assists the learning process varies among programs. Students learn by interacting with the computer while using computer-assisted instru-citon (Parr, 2003). The computer analyzes the students’ responses and supplies proper feedback to the students. More advanced software packages adjusts the level and direction of the instruc-tion to best suit the individual user’s needs.
The general belief is that computer technology allows educators more options for communi-cating, facilitating the lesson, and enhancing the teaching and learning. Proponents claim that computer technology makes learning easier, more efficient, and more motivating (Schacter & Fagnano, 1999). These beliefs are supported by research that has found that learning with com-puter-assisted instruction added to the traditional teaching methods produces a higher level of academic achievement than traditional teaching methods only (Fletcher-Flinn & Gravatt, 1995).
Traynor (2003) suggests that computer-assisted instruction affects cognitive processes and in-creases motivation by the following ways:
1. personalizing information
2. animating objects on the screen
3. providing practice activities that incorporate challenges and curiosity
4. providing a fantasy context
5. providing a learner with choice over his/her own learning
The act of personalizing information allows computer-assisted instruction to increase learner interest in the given tasks (Padma and Ross, 1987). Another benefit is that new information can be more easily integrated into existing learning if a student’s name or other familiar contexts appear in a problem. The cognitive load on the learner’s memory is decreased by the animation of objects thus increasing learning thereby allowing the learner to perform search and recogni-tion processes and to make more informational relationships (Reiber, 1991). One of the sim-plest ways a computer aids in the learning process is that the computer makes it easy to provide challenges and increase curiosity. These activities are found to increase personal satisfaction and promote a positive perspective on lifelong learning (Kinzie, 1998). Parker and Lepper found that a fantasy context such as computer programs that produce an action-packed game environment instead of simple rote recitation of facts increased learning by placing the learner in a situation that was intrinsically motivating (1992). Finally, providing students with a choice over their own learning provides learner with controlled instruction that contributes to motivation (Kinzie, 1998; Traynor, 2003).
Researchers first divided computer-assisted instruction into four subcategories through the works of Atkinson (1968) and Watson (1972). The first is drill and practice sessions. Research-ers suggested that the computer can be an addition to the drill and practice method of traditional
16
instruction through relevant practical exercises. Drill and practice sessions provide feedback and practice on a topic taught to the student at a previous time. The computer has many advantages over the worksheet method of drill and practice. The computer can provide different questions for each at the proper developmental level. It can decrease the time required for the lesson by grading and providing more instantaneous feedback. The computer can increase the number of questions available for the lesson.
The second major category is tutorial sessions. The tutorial mode is a method for presenting new information to the student and then reinforcing it with appropriate questions. The student interacts with the computer much as a student would interact with a tutor in a one-to-one session. Concepts are presented to the student, the student’s grasp of the material is measured, and the computer then provides more instruction or remedial instruction based upon his or her response.
The third category is games. Games are a valuable way to teach concepts such as spelling and mathematics. Games allow students to learn repetitive material in different ways to elevate the tedium.
The final category is simulations. Computers can be used to simulate scenarios in which students can experience situations that are too dangerous or expensive for real life. The sciences and fine arts benefit most from simulation software (Mundane, 1996).
A study by Kitao on the effects of computer-assisted instruction on language classes in Japan found several advantages to computer-assisted instruction. The study was conducted by survey-ing the students’ attitudes in English classes. Kitao found that students study in a more active way when using a computer. The students could not passively sit in class and listen to the teach-er. They were forced to be involved. Immediate feedback was indicated as one of the major ben-efits of computer-assisted instruction. The instruction is individualized. Each student progresses at his/her own pace (1993).
Studies of the Effects of Computer-Assisted Instruction
Research on computers in education began in earnest in the 1960s. In a book by Skinner in 1965, he stated that using computers to teach could build “confidence in education” (p. 19). Controlled studies on the use of CAI to teach mathematics to K-12 students are very hard to find (Kulik, 1994). A 1997 report by Coley, Cradler, and Engel on the use of technology in the class-room was unable to cite one study on the effectiveness of CAI using a control group. Govern-ment studies such as those conducted by the National Science Foundation and the U.S. Depart-ment of Education suggest potential advantages from the use of technology in the classroom but cite no research to support their conclusions (Hoffer, Moore, Wuin, and Suter, 1996).
Several large-scale studies of computer-assisted instruction were conducted in the late 1960s and 1970s. The studies reported a gain of from one to eight months over students in control groups that received traditional instruction (Alderman, 1978; Atkinson, 1968; Suppes & Morningstar, 1968).
Another meta-analysis conducted during the 1970s assessed the effectiveness of drill-and-prac-tice, problem solving, simulation, and tutorial computer-assisted instruction programs. The study
ChapTer 2 (ConT.)
17
ChapTer 2 (ConT.)
found that computer-assisted instruction plus traditional instruction was more effective than traditional instruction alone (Jamison, Suppes, and Wells, 1974). The study found that students at the elementary level benefited from a combination of the traditional teaching methods with computer-assisted instruction. Another conclusion found in the study was that economically disadvantaged students benefited to an even greater extent academically from their more affluent peers (Jamison, Suppes, and Wells, 1974).
A meta-analysis by Niemiec and Walberg (1987) reviewed sixteen major studies between the years 1978 and 1985. The study found that students that received computer-assisted instruction as well as traditional instruction scored at the 66th percentile on tests of achievement compared to the control subjects who scored at the 50th percentile. The study suggested that computer-assisted instruction is approximately twice as effective as peer tutoring (Niemiec and Walberg, 1987).
Dalton and Hannafin (1986) conducted a study involving junior high students. The study found that computer-assisted instruction was the most effective instructional delivery system compared to video alone. In 1988, a large project integrating technology with the curriculum was studied. The study involved grades one through eight. All grades met the goals set forth in the study while several grades exceeded the predicted increase (Lore and Chamberlain, 1988).
John Kulik used meta-analysis to aggregate the findings from more than 500 individual research studies of computer-based instruction. He drew several conclusions from his 1994 work. Kulik determined that students who used computer-assisted instruction scored at the 64th percentile on tests of achievement compared to students in the control conditions without computers who scored at the 50th percentile. He also found that students learn more in less time when they re-ceive computer-based instruction. Finally, Kulik found that students like their classes more and develop more positive attitudes when their classes contain computer-assisted instruction (Kulik 1994).
Christman, Badgett, and Lucking (1997) conducted a study comparing the academic achievement of students in grade six through twelve who received traditional education only was compared to students of the same age that received traditional teaching methods supplemented with computer-assisted instruction. Students who received the computer-assisted instruction attained a higher academic achievement than 58.2% of the students only receiving traditional instruction (Christ-man, Badgett, and Lucking, 1997). Christman, Badgett, and Lucking (1997) also compared achievement of students across a twelve-year period. One group of secondary students received instruction utilizing computers while the other group did not. On average the secondary students that received computer-assisted instruction made greater gains in academic achievement than 57% of the students who only receiving traditional instruction (Christman, Badgett, and Lucking, 1997).
Another study on the effects of computer-assisted instruction on students was published by Ab-bas Johari (Johari, 1998). Johari’s subjects were 98 college undergraduate students in two sec-tions of a computer literacy class. The students were randomly assigned to one of two treatment groups to study linear function. One group received substantially more computer instruction. The other group was taught in the traditional lecture method. Johari gave each group a pre-test
18
and a post-test. The group that received the computer instruction scored significantly higher on the post-test. No significant difference was found on the pre-test. The students in the group receiving computer instruction scored significantly higher on posttests than the group that did not receive the computer instruction. The author draws the conclusion that a relationship exists between the use of computer-assisted instruction and a higher level of academic achievement (Johari, 1998).
Computers have been widely touted as a way to increase student motivation. Fox found in a sur-vey of current research in England that the most frequently cited motivating aspects of computer-assisted instruction include the novelty of working with a new medium (Fox, 1998). A study conducted by Relan on the effects of computer-based instruction found the individualized nature of the instruction as a major reason for the increase of motivation (Relan, 1997). Two other stud-ies also found a significant increase in motivation but found the chief cause as the opportunities for learner-directed instruction (Hicken, et al, 1992; Kinzie, et al 1998). The opportunities for rapid feedback were found to be a reason for improved motivation by two other studies (Armour-Thomas, et. al, 1997; Waldrop, 1996).
A study by Warschauer of the University of Hawaii supports these findings. Warschauer con-ducted a study on student attitude toward learning. Warschauer studied 167 English as second language students in twelve universities academic writing courses in Hong Kong, Taiwan, and the United States. He found significant increases in motivation of students using computers. One of the findings indicated that the greater the extent of computer-use in the class, the greater the increase in motivation. The study cited the greatest benefit in motivation obtained through the use of computer-assisted instruction as the increase in personal empowerment of the students (Warschauer, 1996).
A study by Lafayette Parish in Lafayette, Louisiana during the 1996-1997 school year and re-leased in 1998. Louisiana found that effective use of computer-assisted instruction can be utilized with a minimum of time. The school system has a program that allows for pullout of low-achiev-ing students. The program allows students to utilize a computer-assisted software program for ten minutes per day. In the initial stages of the program, the system allowed one group to use the software while another group did not. After a period of two months the school system found that the students using the program had increased in mathematics achievement by a statistically significant level as measured by a locally developed test. (Johnson, 2000)
A study conducted by High in 1998 supports this conclusion. He studied a group of students enrolled in introductory statistics at a four-year college in Long Island, New York. Four sec-tions of the same basic statistics class were used in the study. The professors for two of these sections utilized software to supplement their teaching. The students in these classes were required to carry out a series of computer exercises and projects during the semester as part of their assignments for the class. The remaining two classes were taught in the traditional lecture method. The students were surveyed one week before the final exam on their attitudes toward the class and their expected grade for the course. After the final exam, the survey responses and the grades were compared. A significant relationship was found between the student’s mathemat-ics average and their anticipated grade in the course for both groups. The class receiving the
ChapTer 2 (ConT.)
19
ChapTer 2 (ConT.)
computer instruction scores significantly higher on the final exam and had a much more positive feeling toward the class than the group receiving only the traditional lecture method of instruc-tion (High, 1998).
Another study of similar type was conducted by Sivin-Kachala in 1998. Sivin-Kachala re-viewed 219 research studies from 1990 to 1997 to assess the effect of technology on learning and achievement across all learning domains and all ages of learners. From these analyses, the researcher reported that students in technology-rich environments experienced positive effects on achievement in all major subject areas. Sivin-Kachala also stated that students in technology rich environments showed increased achievement in preschool through higher education for both regular and special needs children. He found students’ attitudes toward learning and their own self-concept improved consistently when computers were used for instruction (Sivin-Kachala 1998).
Brown (2000) conducted one of the more complete studies of the effect of computer-assisted instruction on learner achievement. Brown conducted a scientific study of the effect of comput-er-assisted instruction on mathematics achievement. The study was conducted in a large urban North Carolina public school system. The system had an enrollment of approximately 100,000. Overall 42% of the students in the school system were black, 50% were white, and 8% were from other racial and ethnic groups. The study divided the students into two groups, an experi-mental group that used the CAI program and a control group of students who were not exposed to the CAI program. The study involved students from three schools in eleven different classes. All the schools and teachers volunteered to participate in the study.
The effectiveness of the program was evaluated by making statistical comparisons of students’ mathematics achievement on the State of North Carolina’s required end of grade and end of course test. The study was conducted over a two-year period of 1997-1998 and 1998-1999. The majority of the use of the software occurred before school began for the day. Students were allowed access to the lab as soon as they arrived at school. The CAI program studied was FUNdamentally Math. It was chosen because of favorable reviews it received by independent evaluators in two journals published by the National Council of Teachers of Mathematics. The software covered all areas of mathematics except calculus and probability. Pretest and posttest scores on the state end of grade examination for the students were collected. The author of the study utilized a two-tailed T test to determine if a significant difference was present.
The study demonstrated that the students who utilized the computer-assisted instruction scored significantly higher than the students who did not participate. The algebra students using the CAI made a 17% jump in scores (Brown, 2000).
A recent study by Traynor (2003) found that utilizing computer-assisted instruction improved in-struction over only using traditional methods. The study compared the effects on many types of learners including special education, non-English proficient, and regular education. The students showed significant pretest-posttest gains (Traynor, June 2003).
Another recent meta-analytic study on the effects of computer-assisted instruction found that students who received instruction supplemented by CAI attained higher academic achievement
20
than did 63.31% of those receiving only traditional instruction. The study was a meta analysis (Christman and Badgett, 2003).
A very recent study by Powell, Aeby, and Carpenter, (2003) studied the effects on achievement of computer-based instruction as compared to instruction without the computer-based instruction. The experimental design included a pretest and posttest. The study used subjects that were char-acterized as disruptive by their school. The authors found that an improvement in the subjects’ academic achievement was found by the use of computer-based instruction (Powell, Aeby, and Carpenter, February 2003).
Cost of Implementing Technology
The use of computers has increased greatly in the last five years. A recent study by the United States government, as part of the 2000 census, indicated that in the United States there are 46.5 million youth between the ages of 6 and 17, and 32 million of them are using the Internet (U.S. Census, 1998). The report also indicates that 68.8% of school age children have access to com-puters outside of school. In school, the numbers are even higher. Another survey of schools in America indicates that 90% of public schools and 70 % of private schools have access to the Internet (Market Data Retrieval 1999). The use of computers in the classroom has increased dra-matically in the last few years. One study in 2001 by the United States Department of Education of American schools indicates that today 69% of teachers use computers on a daily basis in their classrooms. This number is up from 22% in 1998 (Johnson, 2000). Research indicates a large increase in computer use by students in the last decade. The use by students at school was only 27.4% in 1984. This number had grown significantly by 1997 to 74.7% (US Census, 1998).
The greater use of technology in the classroom has taken place at a large financial cost. One study indicated that school districts spent $4.8 billion on instructional technology and $895 mil-lion on administrative technology in 1997-98 (Quality Education Data 1999). This cost is only the hardware purchased. Research shows that the cost of technology in our schools represents over one percent of the total educational spending per child (Coley, Cradler, Engel 1997). A recent article in Electronic-School.com titled Taking TCO to the Classroom: A School Adminis-trator’s Guide to Planning for the Total Cost of New Technology listed several areas that must be taken into consideration when studying the total cost of implementing technology (Electronic-School.com, 1999).
Professional development is a major component of the cost of implementing technology. The United States Department of Education recommends 30% of technology expenditures should be in the area of staff development. If staff members are not properly trained, teachers will not understand how to integrate technology into the curriculum, support staff will not be up to date on hardware and software improvements, and the district will fail to achieve the maximum return on its technology investment.
Technical support is another consideration in the cost of implementing technology. By its very nature, technology is rapidly changing and becoming outdated. School systems must provide proper funding to maintain and replace computer technology as it becomes outdated or inoper-able (Fitzgerald, 1999).
ChapTer 2 (ConT.)
21
ChapTer 2 (ConT.)
Another consideration is connectivity. Enough funds must be budgeted in order to ensure proper bandwidth for proper functioning. As software becomes more complicated a large bandwidth is required for proper functioning. The system must also retrofit older buildings to take advantage of the latest advancements in the Internet, as well as, local area networks (Fitzgerald, 1999).
One of the most important investments is software. A great deal of study and thought must be placed into the proper selection of software for the specific needs of the system. Software must address the objectives needed to be covered and be easy to use (Fitzgerald, 1999).
Summary
Computer usage has increased tremendously over the last several years (Market Data Retrieval, 1999). Many billions of dollars have been spent on computers and related technology (Quality Education Data, 1999). Computers have great promise in education. The area with possibly the most promise for academic achievement is computer-assisted instruction. Computer-assisted instruction is an educational medium in which a computer delivers instructional content or activi-ties. The software has advanced quickly in the last few years from simply offering drill and prac-tice to a level that is adaptive for each child’s needs (Mundane, 1996).
Research generally shows a positive relationship between the use of computer-assisted instruc-tion and student achievement (Christman and Badgett, 2003, Brown 2000, & Johari, 1998)). A need for more quantitative research exists. Trautman’s work in 2000 suggests that more scien-tific methods should be utilized in the studies on computer-assisted instruction (Trautman, 2002).
22
RESEARCH DESIGN
Overview
Computers and computer-assisted instruction have been touted as the future of education in America and the world. However, limited scientific research has been done on the effectiveness of computer-assisted instruction on student achievement in mathematics. This study attempted to determine if the use of computer-assisted instruction in mathematics classes at two Middle Ten-nessee middle schools produced a significant effect on the differences in mathematics achieve-ment as measured by a pre-test post-test design utilizing tests provided by the publisher of the textbook. Due to the importance of achievement in mathematics and the amount of money and time that is being invested in technology, the results of the study are extremely important to the school and the school system in this study.
Research Design
A cause-effect linkage was suspected between the use of computer-assisted instructional software and achievement in mathematics. A study was required to prove or disprove this relationship in which one can manipulate the variable of computer-assisted instruction. A quasi-experimental study was
used due to the great limitations in the school setting of obtaining a random sample. The quasi-experimental research has the benefits of experimental research with the exception of the de-termination of the random sample. A two-group treatment, pre-test post-test design was used (Charles 1998). The following research questions will be answered and the following null hypotheses will be proved or disproved.
Null Hypotheses
H1 There will be no statistically significant differences between the level of achievement in mathematics as measured by pre-test and post-tests of an experimental group of middle school students who received computer-assisted instruction compared to a control group.
H2 There will be no statistically significant difference in mathematics achievement as measured by pre-test and post-tests of students based on their ethnicity of students that received com-puter-assisted instruction.
H3 There will be no statistically significant difference in mathematics achievement as measured pre-test and post-tests of male and female students that received computer-assisted instruc-tion.
Population and Sample
The population represented in this study is students in Middle Tennessee grades 6th – 8th. All students in the study ranged in age from 11 to 14 years. A majority of the subjects in the study live in a suburb of Nashville, Tennessee.
The subjects were chosen by a random clustered sampling method. Subjects were obtained from two Middle Tennessee middle schools consisting of grades 6 through 8. The sample was drawn from a pool of 1,733 students.
ChapTer 3
23
School A had an enrollment of 760 students. School A is located outside of Murfreesboro which is a suburb of Nashville. The school population consists of rural students as well as suburban. The student body was 85.8% white, 9.3% African American, 1.8% Hispanic, 2.7% Asian, and 0.3% Native American. The school had 19.4% of its students qualify for free or reduced lunch during the school year of the study, 2004.
School B consisted of a student body of 973 students. School B is located within the city limits of Murfreesboro a suburb of Nashville, a large Southern city. Virtually all of the students re-side within the city limits of Murfreesboro. The student body was 79.3% white, 16.7% African American, 2.4% Hispanic, 1.3% Asian, and 0.2% Native American. The school had 19.9% of its students qualify for free or reduced lunch during the school year of the study, 2004.
The sample consisted of 328 subjects. Ten sections of mathematics were chosen at School A and four sections were chosen at school B representing all levels of mathematics offered except Algebra and Geometry. These courses were omitted due to the limited sampling size. Students were placed in sections by the respective administration of the schools with the aid of Horizon, a school management software package. The sections of classes were chosen with regard to the time of day at which the meet.
The teachers selected for this study were determined to have sufficient computer skills to utilize the software to be studied. This was determined with the aid of the principal at each of the two schools. The teachers in this study had received instruction by the school system’s technology department in the use of the software packages. Five teachers participated at School A and two teachers participated in the study at School B.
Procedure
The study lasted for eleven weeks. The dates of the study were from August 9, 2004 until Oc-tober 22, 2004. This time period was chosen to coincide with the grading periods at the schools where the study was conducted. The study was approved by the Assistant Superintendent for Curriculum and Instruction for Rutherford County Schools. The graduate school of Tennessee State University also approved the study.
A pre-test was administered at the beginning of the study by the teachers of each section. The pre-test consisted of fifty multiple choice questions. The questions tested mastery of the objec-tives that were taught during the time of the study.
The experimental group was given one hour each week of computer-assisted instruction. The software used in this study adapts to the student’s achievement and reports progress for each student to the teacher (Orchard, 2004).
The Orchard software allows for more personal lessons for the students that target their particu-lar needs while reinforcing their strengths. The software adapts as a student answers to target individual weaknesses of the student. The software also increases the difficulty of the questions as correct answers are given.
ChapTer 3 (ConT.)
24
The remainder of the week the experimental group received traditional instructional methods. The control group received only traditional teaching methods. At the end of the study, a post-test was administered by the teacher of the section. The difference of each of the subjects scores on the post-test and the pre-test was calculated. The mean of this difference was then compared by the use of a t-test between the control group and the experimental group. A determination was made if the difference was statistically significant.
Instrumentation
The pre-test and post-tests were criterion-referenced tests developed by Prentice Hall, the pub-lisher of the mathematics textbook used by the classes participating in the study. The tests were developed for the 1999 publication of their texts, Middle Grade Math, Tools for Success; Course 1, Middle Grade Math, Tools for Success; Course 2, and Middle Grade Math, Tools for Suc-cess; Course 3. Prentice Hall conducts research to ensure the validity of the tests. Research was conducted longer-term research based on scientific, experimental designs under actual classroom conditions. This research identifies what works and what can be improved in revisions. Research was conducted involving longitudinal and control-group research. The test was also validated by research conducted by independent, third-party research using quasi-experimental and experi-mental research designs (Prentice Hall, 2004).
The pre-test and post-test consisted of 50 multiple-choice items each. The tests were developed with the goal of testing the objectives that will be part of the curriculum during the time period of the study. Each test was intended to test for mastery in the following areas: integers, fractions, decimals, measurement, algebraic operations, order of operations, number and number relations, rounding, computation in context, statistics, and problem solving strategies. The text and the test are currently being used by approximately 45% of the school systems in Tennessee.
Internal Validity
Internal validity is the extent that an experiment shows a cause-effect relationship between the independent and dependent variables (Grant, Mah, and Polson, 2003). Many factors exist that affect the internal validity of a study. Care was given to eliminate as many of these factors as possible.
In order to limit experimental mortality, students were not allowed to change sections at any time during the study to limit the possible effects on the results. Students were not added to these sec-tions except in extreme cases to limit added variables to the study.
Attention was given in the choice of levels of mathematics to participate in the study. The sec-tions chosen were selected due to having the same teacher in common and the time of day at which they meet. The effect of the teacher will be limited by having the sections selected at each level taught by the same teacher. The students in the experimental group will be compared to students in the control group that have the same teacher.
The teachers in the experimental and control groups were required to submit weekly lesson plans that detail the daily occurrences in the class. The lesson plans were checked to ensure that the experimental group was receiving the computer-assisted instruction and that the experimental
ChapTer 3 (ConT.)
25
ChapTer 3 (ConT.)
group was receiving the same traditional teaching with the exception of the computer-assisted in-struction. The classes were monitored daily to ensure adherence to the lesson plans. The classes were monitored daily for any event that would possibly interfere with the study. Maturation was not considered as a factor of concern due to the relatively short nature of the experiment.
Statistical Techniques
Statistical significance was determined for the research data. The difference was calculated and a t test was used to analyze the data to determine if any statistically significant difference exists between the class sets of data. The results of the t test was analyzed to determine if there is a statistically significant difference the difference between the pretest and posttest scores of the ex-perimental group that received computer-assisted instruction once a week and the control group that only received traditional teaching methods (Charles 1998).
SPSS was utilized to determine if a statistically significant difference exists between the scores of members of the different genders in the experimental group and the control group. SPSS was also utilized to determine if a statistically significant difference exists between the scores of stu-dents of different races in the experimental group and the control group.
26
FINDINGS
Mathematics is the cornerstone for a good education (Clark and Fulton, 2003). The United States’ economic prosperity is dependent on a population well educated in mathematics (Geary and Hamson, 2004). The students in the United States do not do well when compared to other students throughout the world, the students of the United States scored well below average on the last international test (Lubell, 1998). Every effective method for the teaching of mathematics must be utilized. The purpose of this study was to determine if instruction including computer-assisted instruction in mathematics produces higher levels of academic achievement than tradi-tional teaching methods alone.
A cause-effect linkage was suspected between the use of computer-assisted instructional soft-ware and achievement in mathematics. A quasi-experimental study was conducted. A two-group treatment, pre-test post-test design was used (Charles 1998). The control group received only traditional classroom instruction. The experimental group’s traditional instruction was supple-mented with one hour each week of computer-assisted instruction. The subjects were given a pre-test at the start of the study. The subjects
were then given a post test at the end of the study. The differences between the pre-test and post-test were compared using a t-test to determine if the experimental group scored statistically sig-nificantly different than the control group. The differences were compared between genders also using a t-test to determine if a statistically significant difference existed between the test scores of males and females. A determination was to be made if ethnicity played a role in the difference between the pre-test and the post-test. Not enough subjects of different ethnic backgrounds were used in the study to determine if a difference existed between ethnic groups
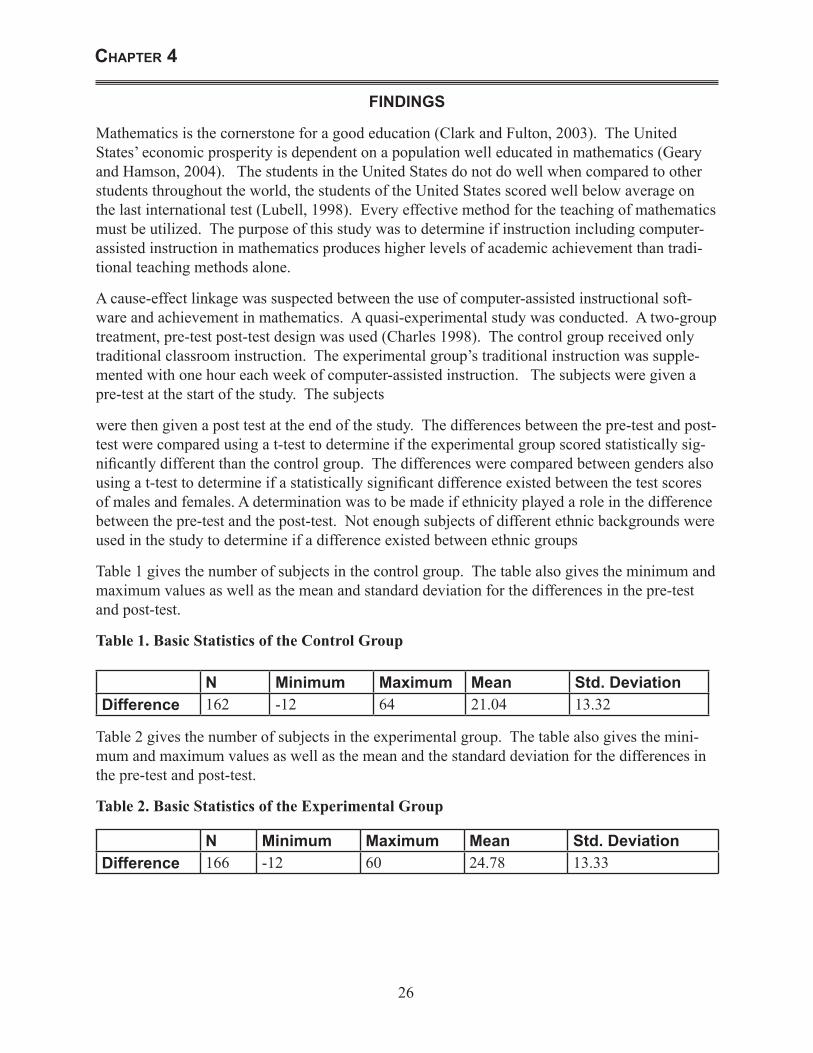
Table 1 gives the number of subjects in the control group. The table also gives the minimum and maximum values as well as the mean and standard deviation for the differences in the pre-test and post-test.
Table 1. Basic Statistics of the Control Group
N Minimum Maximum Mean Std. DeviationDifference 162 -12 �� 21.04 13.32
Table 2 gives the number of subjects in the experimental group. The table also gives the mini-mum and maximum values as well as the mean and the standard deviation for the differences in the pre-test and post-test.
Table 2. Basic Statistics of the Experimental Group
N Minimum Maximum Mean Std. DeviationDifference 166 -12 60 24.78 13.33
ChapTer 4
27
Null Hypothesis
H1 There will be no statistically significant differences between the level of achievement in mathematics as measured by pre-test and post-tests of an experimental group of middle school students who received computer-assisted instruction compared to a control group.
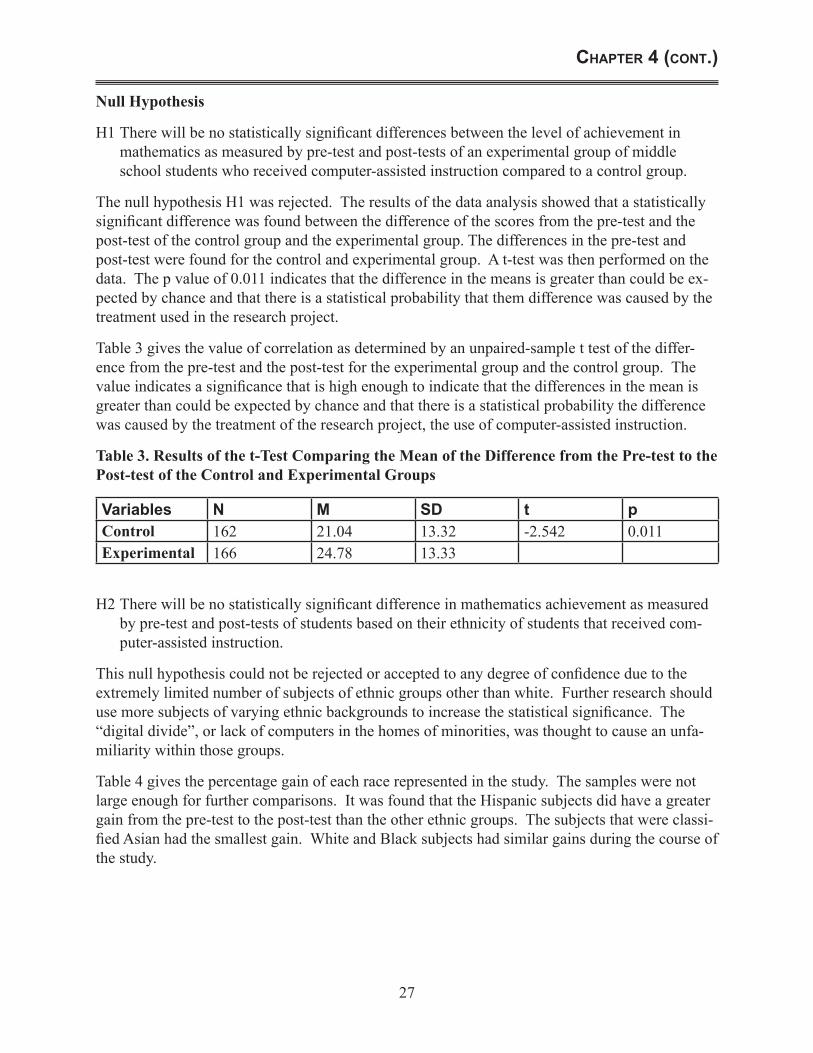
The null hypothesis H1 was rejected. The results of the data analysis showed that a statistically significant difference was found between the difference of the scores from the pre-test and the post-test of the control group and the experimental group. The differences in the pre-test and post-test were found for the control and experimental group. A t-test was then performed on the data. The p value of 0.011 indicates that the difference in the means is greater than could be ex-pected by chance and that there is a statistical probability that them difference was caused by the treatment used in the research project.
Table 3 gives the value of correlation as determined by an unpaired-sample t test of the differ-ence from the pre-test and the post-test for the experimental group and the control group. The value indicates a significance that is high enough to indicate that the differences in the mean is greater than could be expected by chance and that there is a statistical probability the difference was caused by the treatment of the research project, the use of computer-assisted instruction.
Table 3. Results of the t-Test Comparing the Mean of the Difference from the Pre-test to the Post-test of the Control and Experimental Groups
Variables N M SD t pControl 162 21.04 13.32 -2.542 0.011Experimental 166 24.78 13.33
H2 There will be no statistically significant difference in mathematics achievement as measured by pre-test and post-tests of students based on their ethnicity of students that received com-puter-assisted instruction.
This null hypothesis could not be rejected or accepted to any degree of confidence due to the extremely limited number of subjects of ethnic groups other than white. Further research should use more subjects of varying ethnic backgrounds to increase the statistical significance. The “digital divide”, or lack of computers in the homes of minorities, was thought to cause an unfa-miliarity within those groups.
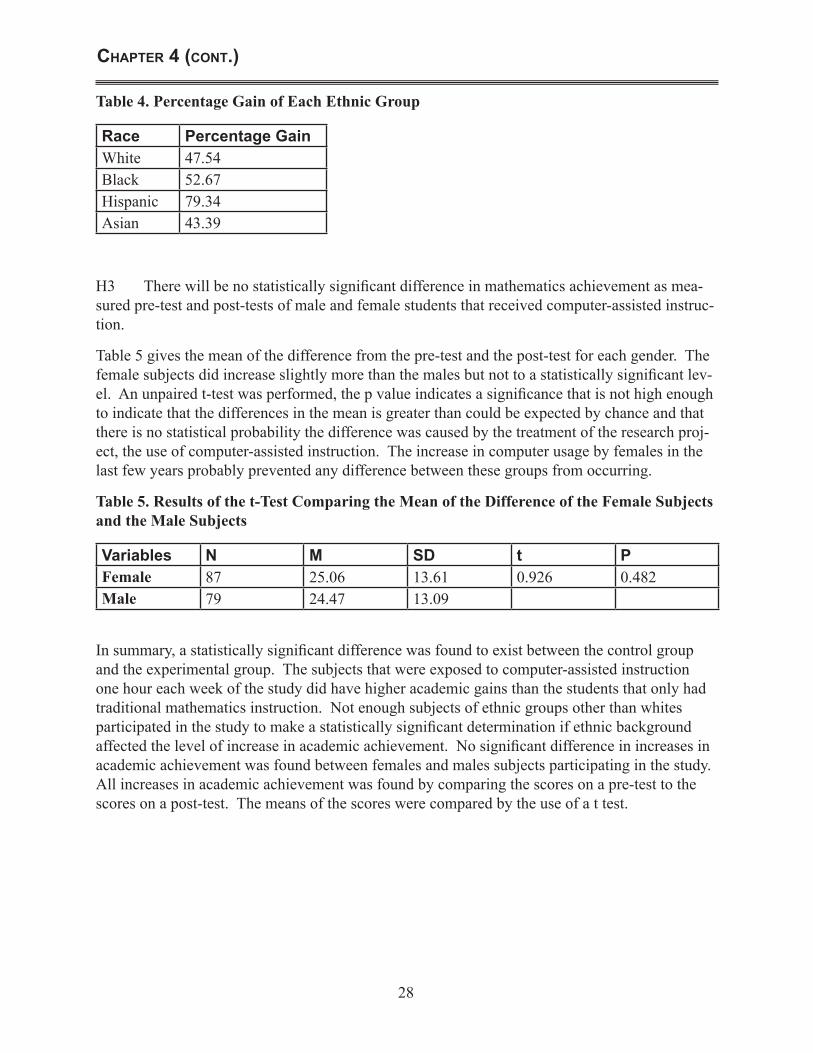
Table 4 gives the percentage gain of each race represented in the study. The samples were not large enough for further comparisons. It was found that the Hispanic subjects did have a greater gain from the pre-test to the post-test than the other ethnic groups. The subjects that were classi-fied Asian had the smallest gain. White and Black subjects had similar gains during the course of the study.
ChapTer 4 (ConT.)
28
Table 4. Percentage Gain of Each Ethnic Group
Race Percentage GainWhite 47.54Black 52.67Hispanic 79.34Asian 43.39
H3 There will be no statistically significant difference in mathematics achievement as mea-sured pre-test and post-tests of male and female students that received computer-assisted instruc-tion.
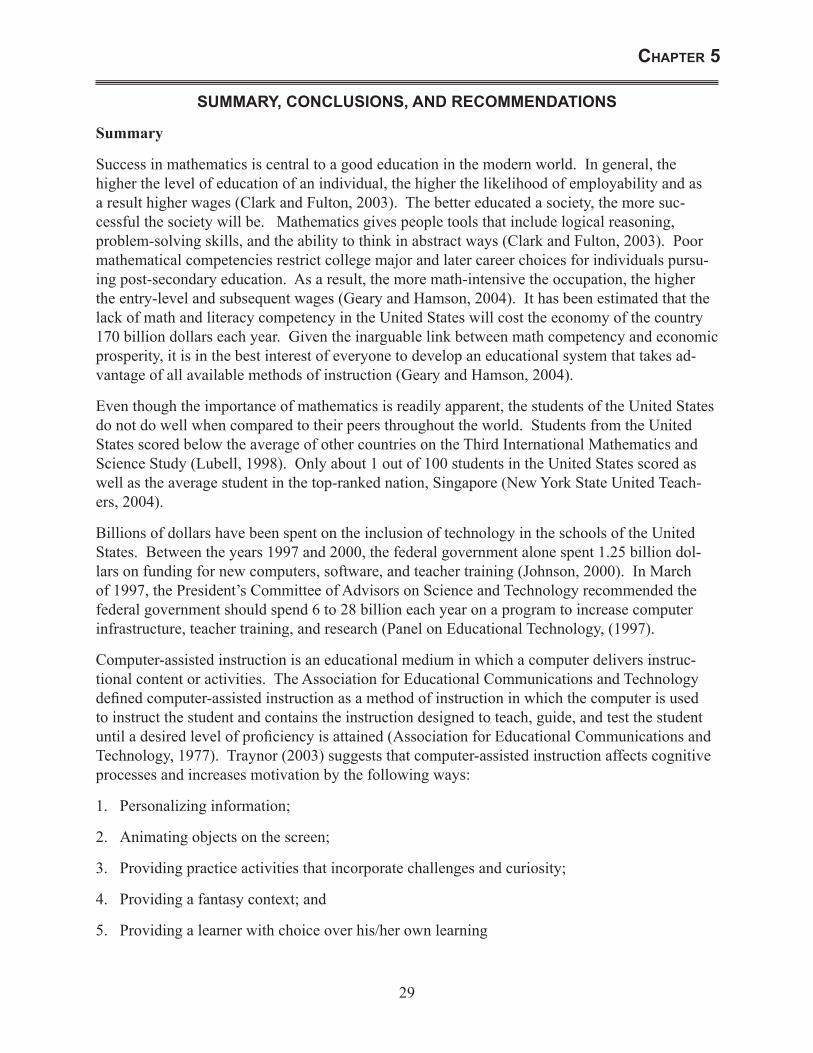
Table 5 gives the mean of the difference from the pre-test and the post-test for each gender. The female subjects did increase slightly more than the males but not to a statistically significant lev-el. An unpaired t-test was performed, the p value indicates a significance that is not high enough to indicate that the differences in the mean is greater than could be expected by chance and that there is no statistical probability the difference was caused by the treatment of the research proj-ect, the use of computer-assisted instruction. The increase in computer usage by females in the last few years probably prevented any difference between these groups from occurring.
Table 5. Results of the t-Test Comparing the Mean of the Difference of the Female Subjects and the Male Subjects
Variables N M SD t PFemale 87 25.06 13.61 0.926 0.482Male 79 24.47 13.09
In summary, a statistically significant difference was found to exist between the control group and the experimental group. The subjects that were exposed to computer-assisted instruction one hour each week of the study did have higher academic gains than the students that only had traditional mathematics instruction. Not enough subjects of ethnic groups other than whites participated in the study to make a statistically significant determination if ethnic background affected the level of increase in academic achievement. No significant difference in increases in academic achievement was found between females and males subjects participating in the study. All increases in academic achievement was found by comparing the scores on a pre-test to the scores on a post-test. The means of the scores were compared by the use of a t test.
ChapTer 4 (ConT.)
29
SUMMARY, CONCLUSIONS, AND RECOMMENDATIONS
Summary
Success in mathematics is central to a good education in the modern world. In general, the higher the level of education of an individual, the higher the likelihood of employability and as a result higher wages (Clark and Fulton, 2003). The better educated a society, the more suc-cessful the society will be. Mathematics gives people tools that include logical reasoning, problem-solving skills, and the ability to think in abstract ways (Clark and Fulton, 2003). Poor mathematical competencies restrict college major and later career choices for individuals pursu-ing post-secondary education. As a result, the more math-intensive the occupation, the higher the entry-level and subsequent wages (Geary and Hamson, 2004). It has been estimated that the lack of math and literacy competency in the United States will cost the economy of the country 170 billion dollars each year. Given the inarguable link between math competency and economic prosperity, it is in the best interest of everyone to develop an educational system that takes ad-vantage of all available methods of instruction (Geary and Hamson, 2004).
Even though the importance of mathematics is readily apparent, the students of the United States do not do well when compared to their peers throughout the world. Students from the United States scored below the average of other countries on the Third International Mathematics and Science Study (Lubell, 1998). Only about 1 out of 100 students in the United States scored as well as the average student in the top-ranked nation, Singapore (New York State United Teach-ers, 2004).
Billions of dollars have been spent on the inclusion of technology in the schools of the United States. Between the years 1997 and 2000, the federal government alone spent 1.25 billion dol-lars on funding for new computers, software, and teacher training (Johnson, 2000). In March of 1997, the President’s Committee of Advisors on Science and Technology recommended the federal government should spend 6 to 28 billion each year on a program to increase computer infrastructure, teacher training, and research (Panel on Educational Technology, (1997).
Computer-assisted instruction is an educational medium in which a computer delivers instruc-tional content or activities. The Association for Educational Communications and Technology defined computer-assisted instruction as a method of instruction in which the computer is used to instruct the student and contains the instruction designed to teach, guide, and test the student until a desired level of proficiency is attained (Association for Educational Communications and Technology, 1977). Traynor (2003) suggests that computer-assisted instruction affects cognitive processes and increases motivation by the following ways:
1. Personalizing information;
2. Animating objects on the screen;
3. Providing practice activities that incorporate challenges and curiosity;
4. Providing a fantasy context; and
5. Providing a learner with choice over his/her own learning
ChapTer 5
30
Research on the effectiveness of computers on student academic achievement began as early as the 1960s (Skinner, 1965). The early research was inconclusive. More recent studies have varied in their results. Baker (1999) makes the claim that there is a lack of controlled studies. Baker found that most studies centered on students’ and teachers’ attitudes and opinions toward computers. Kulik (1994) found that controlled studies conducted in a scientific manner on the effects of computers on students’ academic achievement are hard to find. A report by Coley, Cradler, and Engel on the use of technology in the classroom was unable to cite one study on the effectiveness of computer-assisted instruction using a control group (Coley, Cradler, and Engel, 1997).
The research that has been conclusive generally indicates a positive relationship between the use of computer-assisted instruction and student academic achievement. A meta-analytic study con-ducted in 1987 reviewed sixteen major studies. The study found that students receiving comput-er-assisted instruction scored at the 66th percentile on tests while the control group scored at the 50th percentile (Niemiec and Walberg, 1987). Another study found that students in grades sixth through twelfth that received computer-assisted instruction attained higher levels of academic achievement that 58.2% of students only receiving traditional teaching methods (Christman, Badgett, and Lucking, 1997). One of the most thorough studies was conducted by Frank Brown. Brown studied students in a large urban North Carolina public school system. The population of the system was 50% white, 42% black, and 8% other. The subjects were divided into a control group that was not exposed to CAI and an experimental group utilizing CAI. The study analyzed the results from the North Carolina end of the course test. A 17% higher level of achievement was found in the group that was exposed to computer-assisted.
For this study, a cause-effect linkage was suspected between the use of computer-assisted in-struction software and achievement in mathematics. A study was required to prove or disprove this relationship in which one can manipulate the variable of computer-assisted instruction. Due to limitations in obtaining a random sample, a quasi-experimental study was used. A two-group, pre-test post-test design was used in the study (Charles, 1998).
The study was conducted between the dates of August 9th, 2004 and October 15th, 2004. The control group was taught by traditionally accepted teaching methods throughout the study. This consisted of primarily lecture with the addition of worksheets, quizzes, and other teacher directed activities. The experimental group received the same traditional teaching methods plus one hour a week of computer-assisted instruction in the form of Orchard software.
A pre-test was given to subjects involved in the study. The pre-test was appropriate to the level of mathematics in which the subject was enrolled. (Appendix III). The pre-test consisted of fifty multiple choice questions that tested the mastery of the objectives covered during the study. A post-test was given at the end of the study to all subjects involved in the study. The post-test was also appropriate for the level of mathematics in which the subjects were enrolled. (Appendix IV). The post-test consisted of fifty multiple choice questions that determined the mastery of the objectives covered during the study.
The differences between the scores on the post-test and pre-test were calculated. The means of the differences from the experimental group and the control group were compared using a t-test
ChapTer 5 (ConT.)
31
ChapTer 5 (ConT.)
to determine if a statistically significant difference existed. The differences were also calculated by gender. These differences were compared using a t-test to determine if a statistically signifi-cant difference existed between the genders of the subjects. The sample did not have enough subjects of different ethnicities to make a statistically significant determination of whether differ-ent ethnic groups would have their mathematics achievement affected differently by the addition of computer-assisted instruction. Only nine Hispanic and eleven Asian subjects were included in the study. Fifty-six black subjects participated in the study. 251 of the subjects were white.
The results of the data analysis data analysis resulted in the rejection of H1. The data indicated that the treatment of the study, the use of computer-assisted instruction, did cause a statistically significant level of difference between the pre-test and the post-test of the control group and the experimental group. The results of the data analysis resulted in the acceptance of H3. The data indicated that the difference in change between subjects of different gender was not statistically significant. H2 could not be accepted or rejected with any level of confidence due to the limited sample size of different ethnic groups other than white.
Conclusion
The research indicates that the use of a computer-assisted instructional software package once per week did produce a higher level of academic achievement in mathematics by middle school students. There was a statistically significant difference between the control group and the ex-perimental group. The p value of 0.011 indicates a high level of confidence that the treatment in the study was responsible for any gain made. The conclusion that the treatment, the use of com-puter-assisted instruction for one hour a week in addition to traditional teaching methods, caused the increase in academic achievement was found to a level exceeding the 0.05 confidence level. The analysis of the data disproved the null hypothesis, H1.
The research study indicated that the female subjects made greater gains than the male subjects, but the difference was not statistically significant enough to ensure that the difference was caused by the treatment of the study and not chance. The p value of 0.77 did not indicate any statistical significant difference in achievement gains by males or females to a 0.05 level. The null hypoth-esis, H3, was retained.
Not enough subjects of different ethnic groups were used in the study to determine to any level of statistically significance if the differences in scores could be attributed to the treatment of the study. It was found that the Hispanic subjects that participated in the study had academic gains of 79.34%. This was higher than the other ethnic groups. Black subjects had gains of 52.67% while white subjects gained 47.54%. Asian students had the lowest gains of any ethnic group that participated in the study of 43.35%.
Recommendations for Future Research
Further study is intended. A larger sample size would be preferred to eliminate the effects of ran-dom occurrences. A more ethnically varied population must be used to allow for a statistically significant determination of differences between ethnic groups. A greater number of schools should be used. Care should be taken to ensure that urban, suburban, and rural schools are repre-sented to allow for greater generalization of the findings.
32
Future studies should include background information on the subjects such as prior levels of computer usage. This would help determine if the novelty of using a computer increased or decreased its effectiveness as a teaching tool. A determination could also be made as to whether having a greater comfort level with the computer affects its effectiveness at increasing student achievement.
The subjects past scores in mathematics should also be included in future studies. With this in-formation, a determination of whether different amounts of increase would be found at different levels the academic spectrum.
A survey to determine learning style should also be utilized. This would allow a comparison of the change in levels of academic achievement in the different learning styles. A determination could be made if certain learning styles benefited from the use of computer-assisted instruction more than others.
Recommendations for the Profession
The research project produced even greater differences between the control group and the experi-mental group than expected. The cause of the higher gains was determined to be attributed to the treatment in the study, the use of computer-assisted instruction, with a high degree of confidence. As technology is increasingly added to schools the use of the computer-assisted instruction becomes more available and practical. The study indicates that computer-assisted instruction should be a more widely used pedagogy in middle schools. The investment in technology should include monies for not only the software for computer-assisted instruction but training for the proper use in all areas of the curriculum.
A great amount of resources have been invested in the addition of computers and other types of technology to classrooms. The research in this study offers promise and suggests that this invest-ment was well spent. Computer-assisted instruction offers differentiated education that is easy to plan and implement. It offers opportunities for remediation and reinforcement of concepts and ideas. Computer-assisted instruction is effective for both genders and indications are that it is effective for different ethnic groups. Computer-assisted instruction is an effective way to person-alize instruction to ensure that all subgroups are reached.
ChapTer 5 (ConT.)
33
Alderman, D. L. (1978). Evaluation of the TICCIT computer-assisted instruction system in the community college. Princeton, NJ: Educational Testing Service.
Armour-Thomas, E. et al. (April 1997). The motivational effects of types of computer feedback on children’s learning and retention of relational concepts. Educational Technology Research and Development, 60(5), 25-36.
Association for Educational Communications and Technology retrieved January 4, 2004, from http://www.aect.org/
Astleitner, H., & Keller, J.M. (1995) A model for motivationally adaptive computer-assisted instruction. Journal of Research on Computing in Education, 27, 3, 270-280.
Atkinson, R. (1968). Computerized Instruction and the Learning Process. American Psycholo- gist, 23, 225-239.
Baker, E.L. (1994) Evaluating the Apple Classrooms of Tomorrow. Technology assessment in education and training. Hillsdale, NJ: Lawrence Erlbaum.
Bloom, B. S. (1984). The 2 sigma problem: The search for methods of group instruction as ef- fective as one-to-one tutoring. Educational Researcher, 13, 4-16.
Brown, Frank (2000). Computer Assisted Instruction in Mathematics Can Improve Students’ Test Scores: A Study. ERIC Middle Tennessee State University microfilm ED443688.
Charles, C. M. (1998) Educational Research, (3rd Edition). New York: Addison Wesley Long man, Inc.
Christmann, E. P., & Badgett, J. L. (2000). The comparative effectiveness of CAI on collegiate academic performance. Journal of Computing in Higher Education, 11(2), 91-103.
Christmann, Edwin P., Badgett, John L. (2003). A Meta-Analytic Comparison of The Effects of Computer-Assisted-Instruction on Elementary Students’ Academic Achievement. Infor mation Technology in Childhood Education, 91-104.
Christmann, E., Badgett, J., & Lucking, R. (1997). Microcomputer-based computer-assisted in struction within differing subject areas: A statistical deduction. Journal of Educational Computing Research, 16(3), 281-296.
Clark, R. E. (1983). Reconsidering research on learning from media. Review of Educational Research, 53, 4445-4460.
Clark, J. and Fulton, R. (2003), Elementary Mathematics Performance-Based Assessment, Ob- tained May 2, 2004, from www.cudenver.edu/NR/rdonlyres/evszdz3xg52qbadx7yeukh itqqtud7eudmg44nbfzqor3vxsxf7ur5qaysibessgqj7pn5 .
CNET Glossary, http://www.cnet.com/Resources/Info/Glossary
Coburn, Peter et. al. (1982). Practical Guide to Computers in Education. Addison-Wesley Pub- lishing Company, Inc., pp. 52-56, 174-175.
referenCes
34
Coley, Cradler, Engel (1997). Computers and Classrooms, The Status of Technology in US Schools. Education Testing Service, Princeton, NJ.
Cotton, Kathleen, (May 1991), Computer Assisted Instruction, School Improvement Research Series, http://www.nwrel.org/scpd/sirs/5/cu10.html.
Dalton, D. W., & Hannafin, M. J. (1986, January). The effects of video-only, CAI only, and in teractive video instructional systems on learner performance and attitude: An exploratory study. Paper presented at the Annual Convention of the Association for Educational Com- munications and Technology, Las Vegas, NV. Retrieved January 5, 2004 from http://lpsl. coe.uga.edu/hannafin/vitaold.html
Davis. S. J. H. (November 1997) How Mastering Technology Can Transform Math Class. Edu- cational Leadership, Volume 55, Number 3, 49-51.
Electronic Schools.com (1999). Taking TCO to the Classroom: A School Administrator’s Guide to Planning for the Total Cost of New Technology. Retrieved 1999 from http://www.elec tronic-school.com/199909/0999sbot.html
Fitzgerald, Sarah, (1999). “Taking TCO to the Classroom: A School Administrator’s Guide to Planning for the Total Cost of New Technology.” Electronic-School.com. http://www. electronic-school.com/199909/0999sbot.html
Fletcher-Flinn, C. M., & Gravatt, B. (1995). The efficacy of computer assisted instruction (CAI): A meta-analysis. Journal of Educational Computing Research, 12(3), 219-242.
Fox, M. (1998). A report on studies of motivation teaching and small group interaction with special reference to computers and to the teaching and learning of arithmetic. Milton Keynes, U.K.: The Open University, Institute of Educational Technology. ERIC, Middle Tennessee State University microfilm ED383615
Friske, J.S. (1988) Using Computer Graphing Software Packages in Algebra Instruction. In A. F. Coxford, The Ideas of Algebra, K-12 National Council of Teachers of Mathematics, 181- 184
Geary, David and Hamson, Carmen, (2004). Improving the Mathematics and Science Achieve ment of American Children: Psychology’s Role, Education Directorate. Retrieved May 2, 2004 from http://www.apa.org/ed/geary.html.
Grant, Mah, and Polson, (2003), Internal Validity Tutor, retrieved from http://psych.athabascau. ca/html/Validity/ May 5, 2004.
Hicken, et al, (1992) Learner control modes and incentive variations in computer-delivered in struction. Educational Technology Research and Development, 40(4), 15-26.
High, Robert V. (1998) Some Variables in Relation Students’ Choice of Statistics Classes; Tradi- tional versus Computer-Supported Instruction. ERIC, Middle Tennessee State University microfilm ED427762.
referenCes (ConT.)
35
referenCes (ConT.)
Hoffer. T. B., Moore, W., Wuin, P., and Suter. L.E. (1996) High School Seniors’ Instructional Experiences in Science and Mathematics. In Science and Mathematics. NCES Publi- cation Number 95-278. Washington, DC: US Department of Education, Office of Educa- tional Research and Improvement.
Huitt, W. (1996). Mastery learning. Educational Psychology Interactive. Valdosta, GA: Valdosta State University. Retrieved [date], from http://chiron.valdosta.edu/whuitt/col/instruct/ mastery.html.
Jamison, Suppes & Wells. The effectiveness of alternative instructional media: A survey. Review of Educational Research, 44, 1-67.
Johari, Abbas (1998), Effects of Inductive Multimedia Programs Including Graphs on Creation of Linear Function and Variable Conceptualization, Arizona State University, Proceed ings of Selected Research and Development Presentations at the National Convention of the Association for Educational Communications and Technology (AECT) Sponsored by the Research and Theory Division (20th, St. Louis, MO, February 18-22, 1998).
Johnson, K., (2000). Do Computers in the Classroom Really Boost Academic Achievement, The Heritage Foundation, Retrieved May 2, 2004 from http://www.heritage.org/Research/Ed- ucation/CDA00-08.cfm.
Kinnaman, D.E. (1990). Staff development: How to build your winning team. Technology and Learning, 11(2).
Kinnaman, D. E. (1990) “What’s the Research Telling Us?” Classroom Computer Learning, 31- 35; 38-39.
Keller,F. S. (1968). Goodbye, teacher... J. Applied Behavioral Analysis, 1, 79-89.
Kinzie, M., Sullivan (1998). Learner control and achievement in science computer-assisted in struction. Journal of Educational Psychology, 80, 299-303.
Kitao, K. (1993) Organizing a CAI Program, http://www. Ling.lancs.ac.uk/staff/visitors/kenji/ kitao/instruct.html
Kulik, J.A. (1994) Meta-analytic studies of findings on computer based instruction. In E.L. Baker and H.F. O’Neil, Jr. Technology assessment in education and training. Hillsdale, NJ: Lawrence Eribaum.
Lore, R., & Chamberlain, E. (1988). Language development component, compensatory language experiences and reading program 1987-88. Final evaluation report. Final evaluation re- port for Columbus Public Schools, OH, Department of Evaluation Services.
Louisiana Challenge: A Systemic Model To Enhance Student Achievement By Networking Underserved Communities, Retrieved May 2 2004 from http://www.challenge.state.la.us/ eval/report/98report.html
Lubell, Samuel, (1998), Third International Math and Science Study - International Comparisons
36
of U.S. 12th graders, Retrieved May 1, 2004 from http://mathforum.org/epigone/k12. ed.math/quutumpon/[email protected]
Lumsdaine, A. A. (1965) Assessing the Effectiveness of Instructional Programs in Robert Glaser, Teaching Machines and Programmed Learning, II: Data and Directions, National Educa- tion Association of the United States, 267-320.
Market Data Retrieval, 1998-99 School Technology Survey, http://www.schooldata.com/
National Assessment of Educational Progress, retrieved September 30, 2003 from http://nces. ed.gov/nationsreportcard/
New York State United Teachers, (2004). Latest TIMSS Study Shows U.S. 12th Graders Lagging in Science, Math, Retrieved from http://www.nysut.org/research/bulletins/9802timss.html May 1, 2004.
Mundane, Dianne. Auburn University,http://www.auburn.edu/~mundecd/cai.html
Neal, E. (1998). Does using technology in instruction enhance learning? Or the artless state of comparative research. Available: http://horizon.unc.edu/ts/commentary/1998-06.asp [2000, June 2].
Niemiec, R., & Walberg, H. J. (1987). Comparative effects of computer-assisted instruction: A synthesis of reviews. Journal of Educational Computing Research, 3, 19-37.
North Central Regional Educational Laboratory, Retrieved July 2, 2004 from http://www.ncrel. org/tplan/cbt/phase2.htm.
Oppenheimer, Ted (1995, July), The Computer Delusion, The Atlantic Monthly, 45-62.
Orchard Software, http://www.orchardsoftware.com/
Padma, A. G. , Ross, S. M., (1987), Using computer-assisted-instruction Personalize Arithmetic Materials for Elementary School Children, Journal of Educational Psychology, 72-78.
Panel on Educational Technology, Report to the President on the Use of Technology to Strength en K-12 Education in the United States, Washington, DC. U.S. Government Printing Of fice, March 1997
Parker, L.E., Leper, M.R. (1992), Effect of Fantasy Contexts on Children’s Learning and Motiva- tion, Journal of Personality and Social Psychology, Volume 62, 625-633.
Parr, Judy M. (September, 2003), A Review of the Literature on Computer-Assisted Learning, particularly Integrated Learning Systems, and Outcomes with Respect to Literacy and Numeracy, retrieved March 28, 2004 from http://www.minedu.govt.nz/index.cfm.
Powell, Aeby,, & Carpenter, (2003). A comparison of student outcomes with and without teacher facilitated computer based instruction. Computers & Education: An International Jour nal, 40, 183-191.
referenCes (ConT.)
37
referenCes (ConT.)
Prentice Hall Publishing, (2004), Prentice Hall Mathematics Research Overview retrieved from http://www.phschool.com/Research/math/research
Quality Education Data, (1999), Technology Purchases in the 1997-98 School Year, http://www. qeddata.com/
Relan, Anju (1997), Learning from Hypermedia: A Study of Situated versus Endemic Learning Strategies. Journal of Educational Multimedia and Hypermedia, v5, 3-21
Reiber, L.P. (1991). Animation, Incidental Learning and Continuing Motivation, Journal of Edu- cational Psychology, Volume 83, 318-328.
Rutherford County School System, Technology Plan, retrieved October 16, 2003 from http:// www.rcs.k12.tn.us/TSS/TSS%20Frames/tss_frameset.htm
Schacter, J., & Fagnano, C. (1999). Does computer technology improve student learning and achievement? How, when, and under what conditions? Journal of Educational Comput- ing Research, 20(4), 329-343.
Shellard, Elizabeth, & Moyer, Patricia S. (2002). What principals need to know about teaching mathematics. Alexandria, VA: National Assocaiton of Elementary School Principals/Edu- cational Reserch Services.
Sivin-Kachala, J. (1998) Report on the effectiveness of technology in schools, 1990-1997. Soft ware Publisher’s Association. ERIC, Middle Tennessee State University ED413875
Skinner, B. F. (1965). Reflections on a Decade of Teaching Machines, in Robert Glaser. Teach ing Machines and Programmed Learning II: Data and Directions, National Education As- sociation of the United States, 5-20.
Third International Mathematics and Science Study retrieved January 5, 2004 from http:// ustimss.msu.edu/
Traynor, Patrick, L. (June, 2003), Effects of Computer-Assisted-Instruction on Different Learn ers, Journal of Instructional Psychology, Volume 30, Number 2, 137-143.
Trautman, T. (2003), The Scientific Research Basis for the A+dvanced
Learning System® and the A+nyWhere Learning System® Instructional Software Programs, Oklahoma City, OK: The American Education Corporation
Suppes, P., & Morningstar, M. (1968). Evaluation of three computer-assisted instruction pro- grams (Technical Report: Psychology Series No. 142). C.A.: Stanford Univ., CA. Inst. for Mathematical Studies in Social Science (ED 031 408).
U.S. Bureau of the Census. Statistical Abstract of the United States, 1998 (Washington D.C. Government Printing Office) Table No. 281.179
Vockell, Edward, (September, 1990), Instructional Principles behind Computer Use, Computer Teacher, volume 18, p. 10-15.
38
Waldrop, P. (1996) Behavior reinforcement strategies for computer-assisted instruction: Pro- gramming for success. Educational Technology, 24(4), 38-41.
Warschauer, M. (1996). Computer Learning Networks and Student Empowerment. (Research Note No. 10) University of Hawaii, Second Language Teaching and Curriculum Center.
Watson, P. (1972). Using the Computer in Education. Englewood, NJ: Educational Technology Publications.
Weir. S. (February 1989) The Computer in Schools: Machine as Humanizer. Harvard Education Review, Volume 9, Number 1, 61-73.
Wenglinsky, H. (September 1998).Does it Compute? The Relationship Between Educational Technology and Student Achievement in Mathematics, ETS Policy Information Center, Educational Testing Service, Princeton, NJ, 1-38.
Williams, C. (2000). Internet Access in U.S. Public Schools and Classrooms: 1994-99 (NCES 2000-086). U.S. Department of Education. Washington, DC: National Center for Educa- tion Statistics.
referenCes (ConT.)
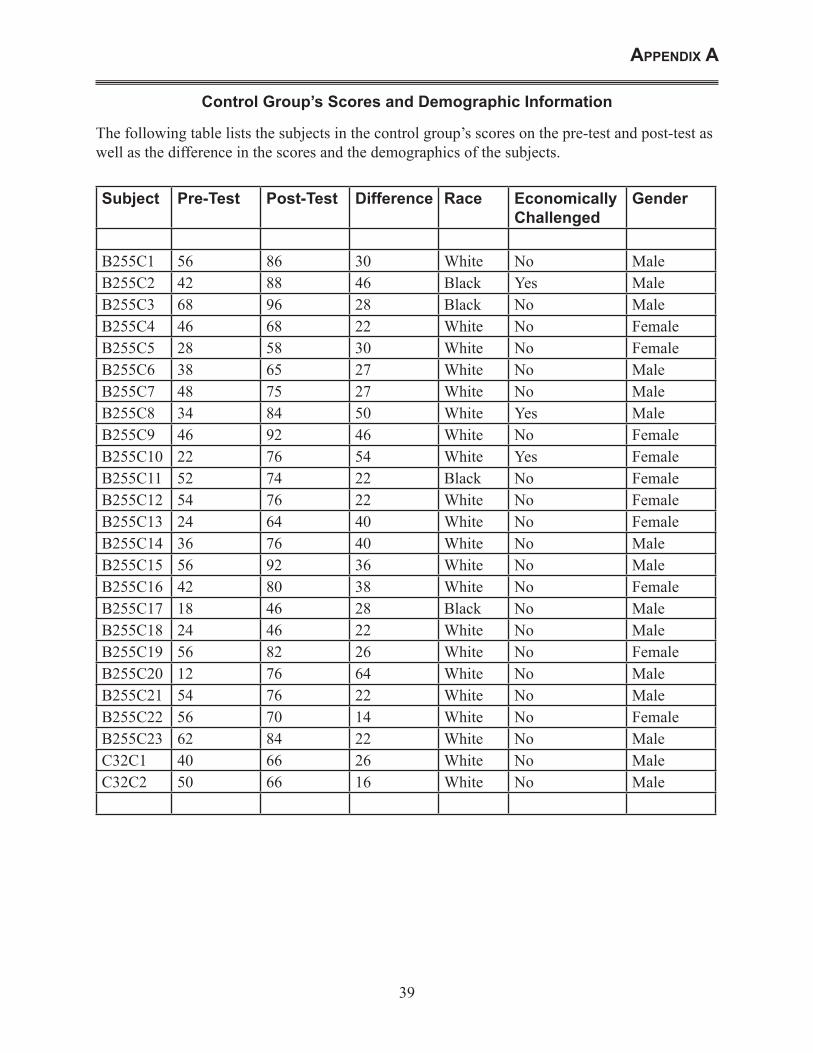
39
Control Group’s Scores and Demographic Information
The following table lists the subjects in the control group’s scores on the pre-test and post-test as well as the difference in the scores and the demographics of the subjects.
appendix a
Subject Pre-Test Post-Test Difference Race Economically Challenged
Gender
B255C1 �� 86 30 White No MaleB255C2 42 88 �� Black Yes MaleB255C3 68 96 28 Black No MaleB255C4 �� 68 22 White No FemaleB255C5 28 58 30 White No FemaleB255C6 38 �� 27 White No MaleB255C7 48 75 27 White No MaleB255C8 34 84 50 White Yes MaleB255C9 �� 92 �� White No FemaleB255C10 22 76 �� White Yes FemaleB255C11 52 74 22 Black No FemaleB255C12 �� 76 22 White No FemaleB255C13 24 �� 40 White No FemaleB255C14 36 76 40 White No MaleB255C15 �� 92 36 White No MaleB255C16 42 80 38 White No FemaleB255C17 18 �� 28 Black No MaleB255C18 24 �� 22 White No MaleB255C19 �� 82 26 White No FemaleB255C20 12 76 �� White No MaleB255C21 �� 76 22 White No MaleB255C22 �� 70 14 White No FemaleB255C23 62 84 22 White No MaleC32C1 40 �� 26 White No MaleC32C2 50 �� 16 White No Male
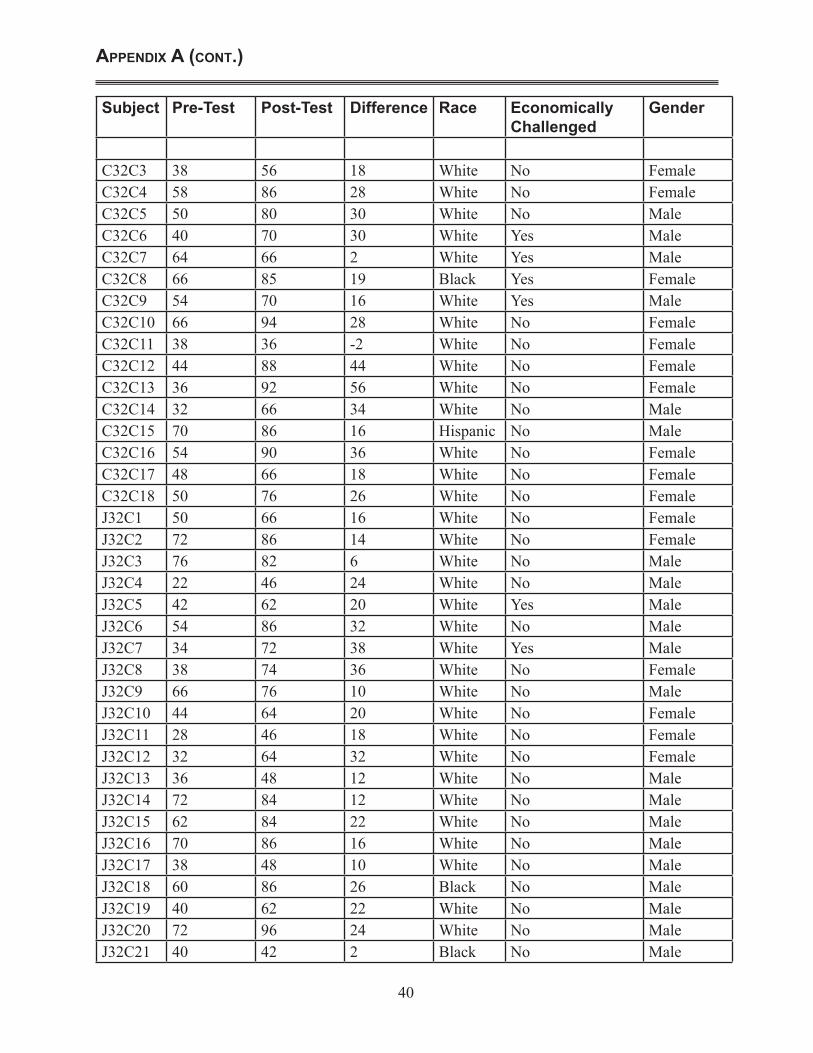
40
Subject Pre-Test Post-Test Difference Race Economically Challenged
Gender
C32C3 38 �� 18 White No FemaleC32C4 58 86 28 White No FemaleC32C5 50 80 30 White No MaleC32C6 40 70 30 White Yes MaleC32C7 �� �� 2 White Yes MaleC32C8 �� 85 19 Black Yes FemaleC32C9 �� 70 16 White Yes MaleC32C10 �� 94 28 White No FemaleC32C11 38 36 -2 White No FemaleC32C12 �� 88 �� White No FemaleC32C13 36 92 �� White No FemaleC32C14 32 �� 34 White No MaleC32C15 70 86 16 Hispanic No MaleC32C16 �� 90 36 White No FemaleC32C17 48 �� 18 White No FemaleC32C18 50 76 26 White No FemaleJ32C1 50 �� 16 White No FemaleJ32C2 72 86 14 White No FemaleJ32C3 76 82 � White No MaleJ32C4 22 �� 24 White No MaleJ32C5 42 62 20 White Yes MaleJ32C6 �� 86 32 White No MaleJ32C7 34 72 38 White Yes MaleJ32C8 38 74 36 White No FemaleJ32C9 �� 76 10 White No MaleJ32C10 �� �� 20 White No FemaleJ32C11 28 �� 18 White No FemaleJ32C12 32 �� 32 White No FemaleJ32C13 36 48 12 White No MaleJ32C14 72 84 12 White No MaleJ32C15 62 84 22 White No MaleJ32C16 70 86 16 White No MaleJ32C17 38 48 10 White No MaleJ32C18 60 86 26 Black No MaleJ32C19 40 62 22 White No MaleJ32C20 72 96 24 White No MaleJ32C21 40 42 2 Black No Male
appendix a (ConT.)
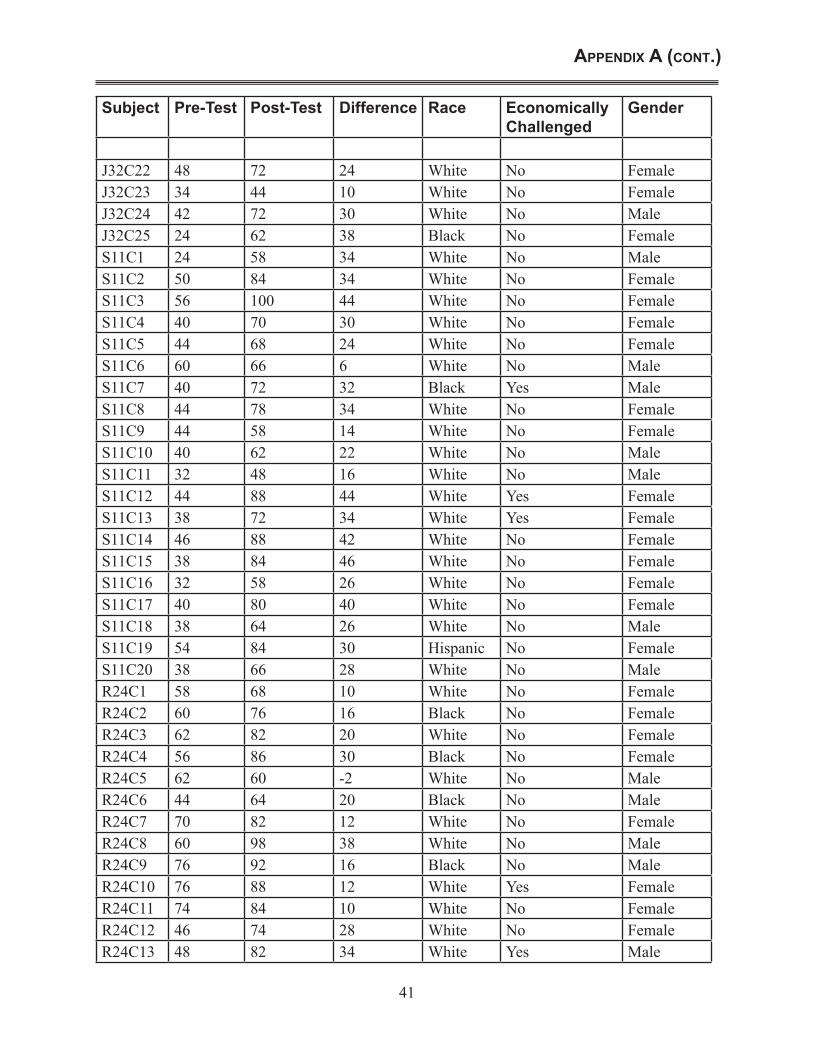
41
Subject Pre-Test Post-Test Difference Race Economically Challenged
Gender
J32C22 48 72 24 White No FemaleJ32C23 34 �� 10 White No FemaleJ32C24 42 72 30 White No MaleJ32C25 24 62 38 Black No FemaleS11C1 24 58 34 White No MaleS11C2 50 84 34 White No FemaleS11C3 �� 100 �� White No FemaleS11C4 40 70 30 White No FemaleS11C5 �� 68 24 White No FemaleS11C6 60 �� � White No MaleS11C7 40 72 32 Black Yes MaleS11C8 �� 78 34 White No FemaleS11C9 �� 58 14 White No FemaleS11C10 40 62 22 White No MaleS11C11 32 48 16 White No MaleS11C12 �� 88 �� White Yes FemaleS11C13 38 72 34 White Yes FemaleS11C14 �� 88 42 White No FemaleS11C15 38 84 �� White No FemaleS11C16 32 58 26 White No FemaleS11C17 40 80 40 White No FemaleS11C18 38 �� 26 White No MaleS11C19 �� 84 30 Hispanic No FemaleS11C20 38 �� 28 White No MaleR24C1 58 68 10 White No FemaleR24C2 60 76 16 Black No FemaleR24C3 62 82 20 White No FemaleR24C4 �� 86 30 Black No FemaleR24C5 62 60 -2 White No MaleR24C6 �� �� 20 Black No MaleR24C7 70 82 12 White No FemaleR24C8 60 98 38 White No MaleR24C9 76 92 16 Black No MaleR24C10 76 88 12 White Yes FemaleR24C11 74 84 10 White No FemaleR24C12 �� 74 28 White No FemaleR24C13 48 82 34 White Yes Male
appendix a (ConT.)
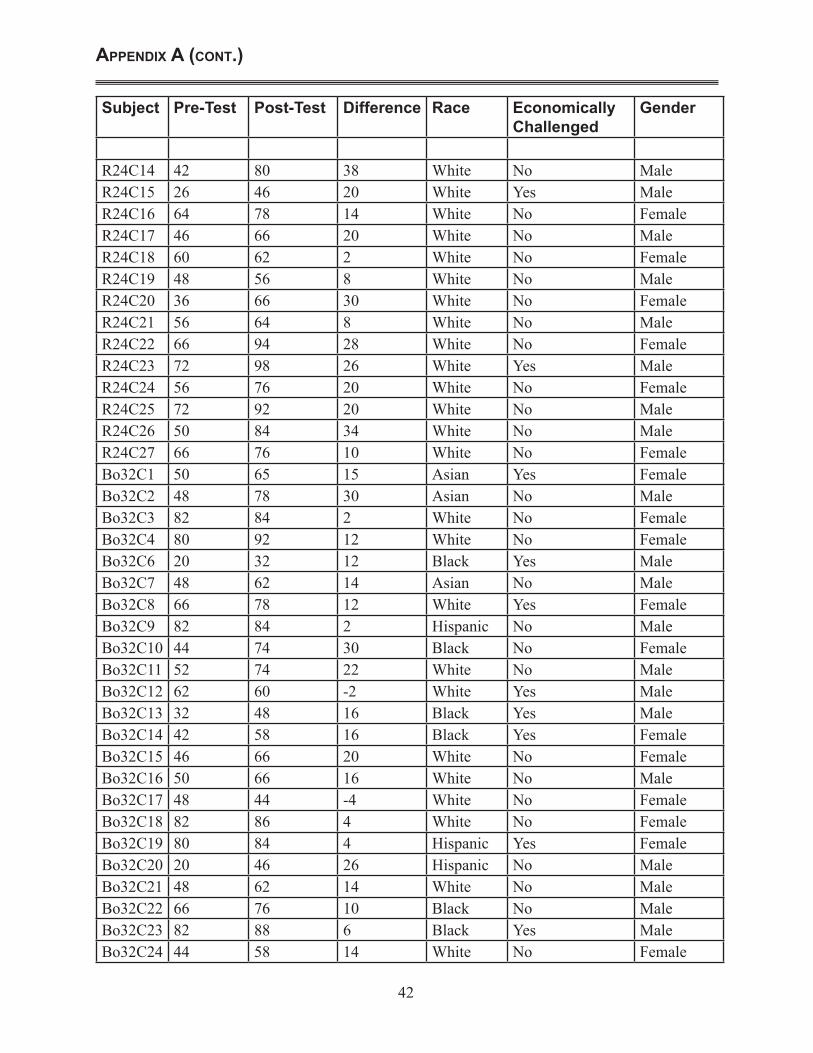
42
Subject Pre-Test Post-Test Difference Race Economically Challenged
Gender
R24C14 42 80 38 White No MaleR24C15 26 �� 20 White Yes MaleR24C16 �� 78 14 White No FemaleR24C17 �� �� 20 White No MaleR24C18 60 62 2 White No FemaleR24C19 48 �� 8 White No MaleR24C20 36 �� 30 White No FemaleR24C21 �� �� 8 White No MaleR24C22 �� 94 28 White No FemaleR24C23 72 98 26 White Yes MaleR24C24 �� 76 20 White No FemaleR24C25 72 92 20 White No MaleR24C26 50 84 34 White No MaleR24C27 �� 76 10 White No FemaleBo32C1 50 �� 15 Asian Yes FemaleBo32C2 48 78 30 Asian No MaleBo32C3 82 84 2 White No FemaleBo32C4 80 92 12 White No FemaleBo32C6 20 32 12 Black Yes MaleBo32C7 48 62 14 Asian No MaleBo32C8 �� 78 12 White Yes FemaleBo32C9 82 84 2 Hispanic No MaleBo32C10 �� 74 30 Black No FemaleBo32C11 52 74 22 White No MaleBo32C12 62 60 -2 White Yes MaleBo32C13 32 48 16 Black Yes MaleBo32C14 42 58 16 Black Yes FemaleBo32C15 �� �� 20 White No FemaleBo32C16 50 �� 16 White No MaleBo32C17 48 �� -� White No FemaleBo32C18 82 86 � White No FemaleBo32C19 80 84 � Hispanic Yes FemaleBo32C20 20 �� 26 Hispanic No MaleBo32C21 48 62 14 White No MaleBo32C22 �� 76 10 Black No MaleBo32C23 82 88 � Black Yes MaleBo32C24 �� 58 14 White No Female
appendix a (ConT.)
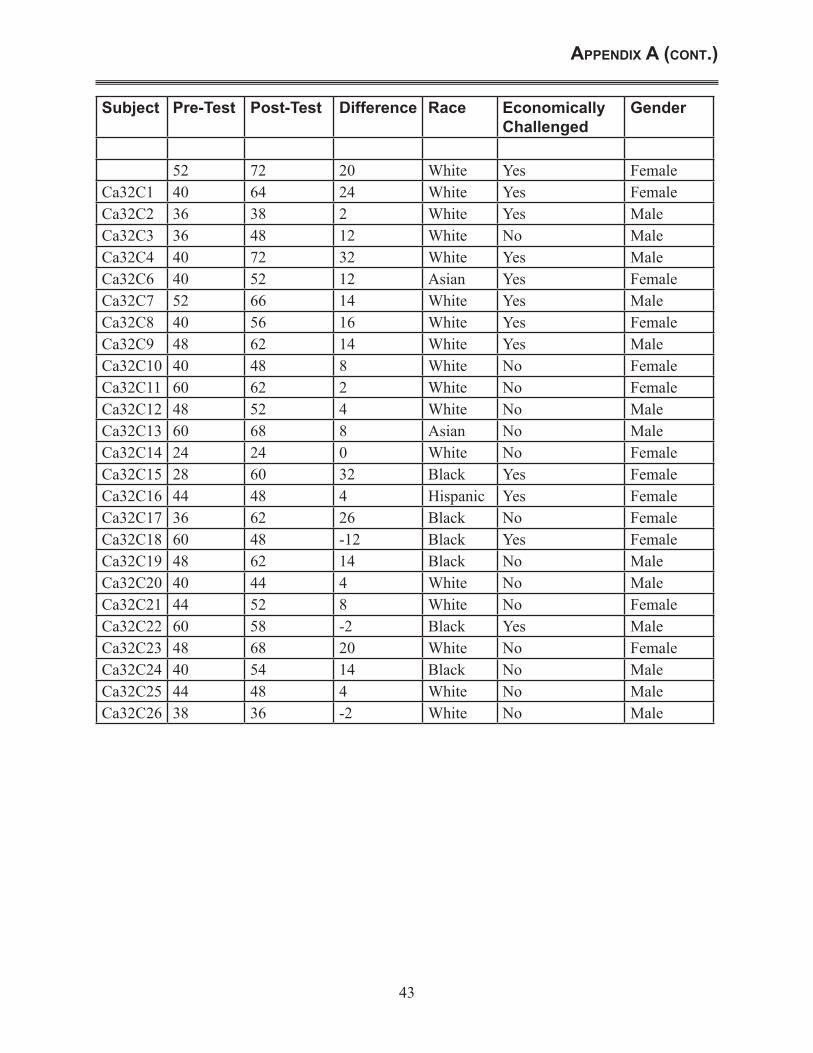
43
Subject Pre-Test Post-Test Difference Race Economically Challenged
Gender
52 72 20 White Yes FemaleCa32C1 40 �� 24 White Yes FemaleCa32C2 36 38 2 White Yes MaleCa32C3 36 48 12 White No MaleCa32C4 40 72 32 White Yes MaleCa32C6 40 52 12 Asian Yes FemaleCa32C7 52 �� 14 White Yes MaleCa32C8 40 �� 16 White Yes FemaleCa32C9 48 62 14 White Yes MaleCa32C10 40 48 8 White No FemaleCa32C11 60 62 2 White No FemaleCa32C12 48 52 � White No MaleCa32C13 60 68 8 Asian No MaleCa32C14 24 24 0 White No FemaleCa32C15 28 60 32 Black Yes FemaleCa32C16 �� 48 � Hispanic Yes FemaleCa32C17 36 62 26 Black No FemaleCa32C18 60 48 -12 Black Yes FemaleCa32C19 48 62 14 Black No MaleCa32C20 40 �� � White No MaleCa32C21 �� 52 8 White No FemaleCa32C22 60 58 -2 Black Yes MaleCa32C23 48 68 20 White No FemaleCa32C24 40 �� 14 Black No MaleCa32C25 �� 48 � White No MaleCa32C26 38 36 -2 White No Male
appendix a (ConT.)
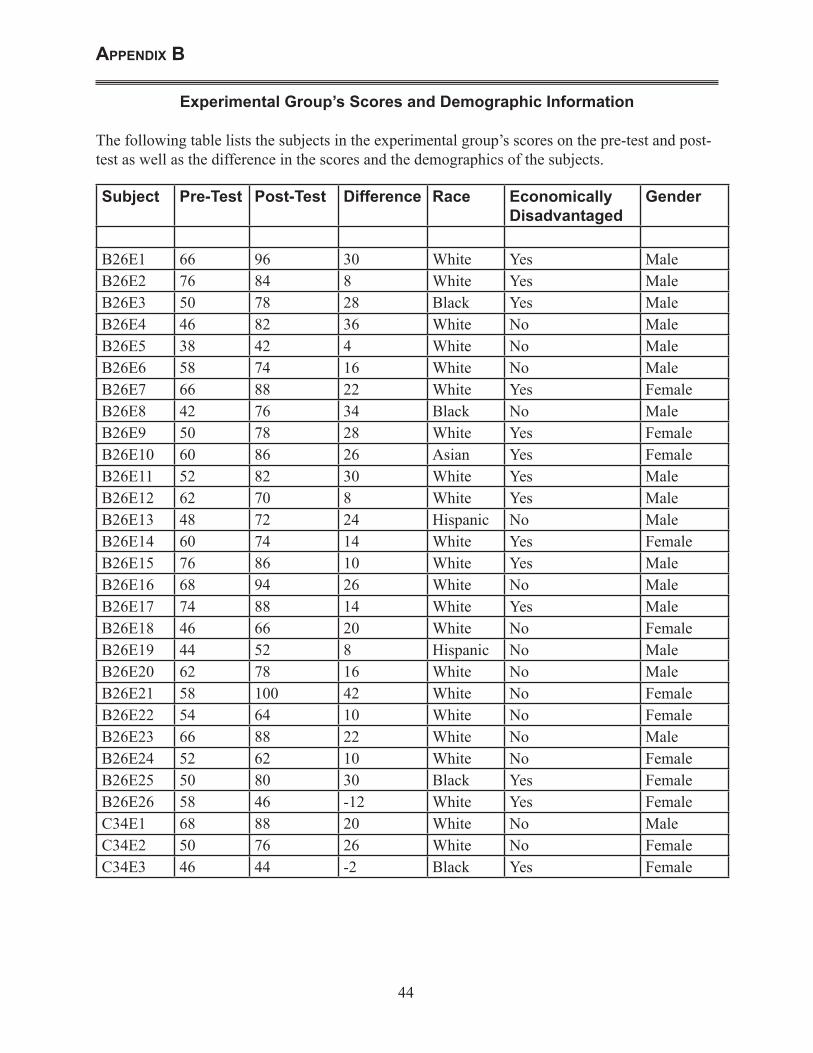
��
appendix b
Experimental Group’s Scores and Demographic Information
The following table lists the subjects in the experimental group’s scores on the pre-test and post-test as well as the difference in the scores and the demographics of the subjects.
Subject Pre-Test Post-Test Difference Race Economically Disadvantaged
Gender
B26E1 �� 96 30 White Yes MaleB26E2 76 84 8 White Yes MaleB26E3 50 78 28 Black Yes MaleB26E4 �� 82 36 White No MaleB26E5 38 42 � White No MaleB26E6 58 74 16 White No MaleB26E7 �� 88 22 White Yes FemaleB26E8 42 76 34 Black No MaleB26E9 50 78 28 White Yes FemaleB26E10 60 86 26 Asian Yes FemaleB26E11 52 82 30 White Yes MaleB26E12 62 70 8 White Yes MaleB26E13 48 72 24 Hispanic No MaleB26E14 60 74 14 White Yes FemaleB26E15 76 86 10 White Yes MaleB26E16 68 94 26 White No MaleB26E17 74 88 14 White Yes MaleB26E18 �� �� 20 White No FemaleB26E19 �� 52 8 Hispanic No MaleB26E20 62 78 16 White No MaleB26E21 58 100 42 White No FemaleB26E22 �� �� 10 White No FemaleB26E23 �� 88 22 White No MaleB26E24 52 62 10 White No FemaleB26E25 50 80 30 Black Yes FemaleB26E26 58 �� -12 White Yes FemaleC34E1 68 88 20 White No MaleC34E2 50 76 26 White No FemaleC34E3 �� �� -2 Black Yes Female
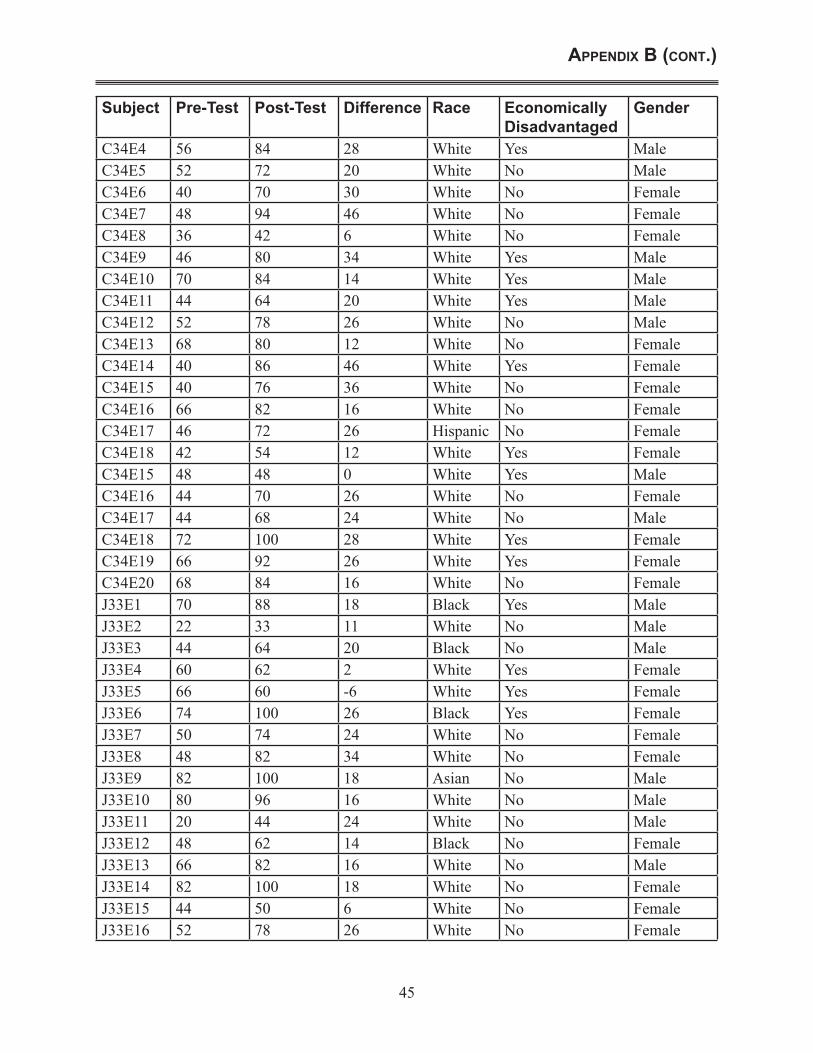
��
Subject Pre-Test Post-Test Difference Race Economically Disadvantaged
Gender
C34E4 �� 84 28 White Yes MaleC34E5 52 72 20 White No MaleC34E6 40 70 30 White No FemaleC34E7 48 94 �� White No FemaleC34E8 36 42 � White No FemaleC34E9 �� 80 34 White Yes MaleC34E10 70 84 14 White Yes MaleC34E11 �� �� 20 White Yes MaleC34E12 52 78 26 White No MaleC34E13 68 80 12 White No FemaleC34E14 40 86 �� White Yes FemaleC34E15 40 76 36 White No FemaleC34E16 �� 82 16 White No FemaleC34E17 �� 72 26 Hispanic No FemaleC34E18 42 �� 12 White Yes FemaleC34E15 48 48 0 White Yes MaleC34E16 �� 70 26 White No FemaleC34E17 �� 68 24 White No MaleC34E18 72 100 28 White Yes FemaleC34E19 �� 92 26 White Yes FemaleC34E20 68 84 16 White No FemaleJ33E1 70 88 18 Black Yes MaleJ33E2 22 33 11 White No MaleJ33E3 �� �� 20 Black No MaleJ33E4 60 62 2 White Yes FemaleJ33E5 �� 60 -� White Yes FemaleJ33E6 74 100 26 Black Yes FemaleJ33E7 50 74 24 White No FemaleJ33E8 48 82 34 White No FemaleJ33E9 82 100 18 Asian No MaleJ33E10 80 96 16 White No MaleJ33E11 20 �� 24 White No MaleJ33E12 48 62 14 Black No FemaleJ33E13 �� 82 16 White No MaleJ33E14 82 100 18 White No FemaleJ33E15 �� 50 � White No FemaleJ33E16 52 78 26 White No Female
appendix b (ConT.)
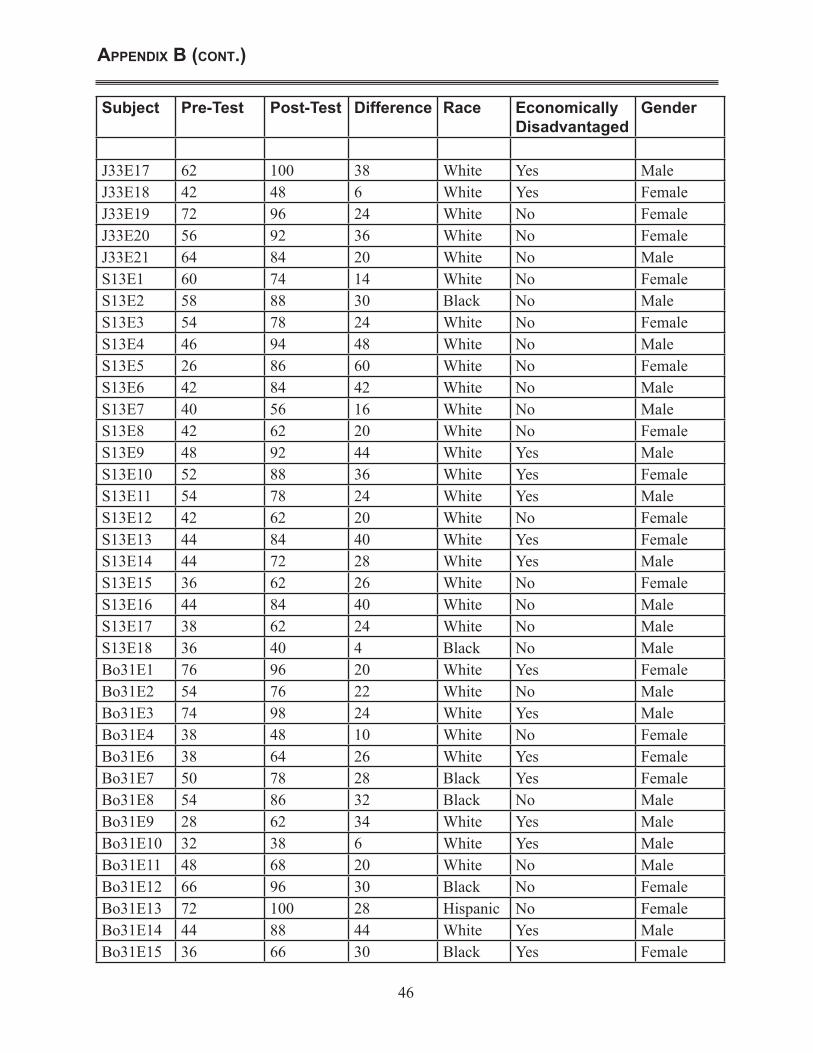
��
Subject Pre-Test Post-Test Difference Race Economically Disadvantaged
Gender
J33E17 62 100 38 White Yes MaleJ33E18 42 48 � White Yes FemaleJ33E19 72 96 24 White No FemaleJ33E20 �� 92 36 White No FemaleJ33E21 �� 84 20 White No MaleS13E1 60 74 14 White No FemaleS13E2 58 88 30 Black No MaleS13E3 �� 78 24 White No FemaleS13E4 �� 94 48 White No MaleS13E5 26 86 60 White No FemaleS13E6 42 84 42 White No MaleS13E7 40 �� 16 White No MaleS13E8 42 62 20 White No FemaleS13E9 48 92 �� White Yes MaleS13E10 52 88 36 White Yes FemaleS13E11 �� 78 24 White Yes MaleS13E12 42 62 20 White No FemaleS13E13 �� 84 40 White Yes FemaleS13E14 �� 72 28 White Yes MaleS13E15 36 62 26 White No FemaleS13E16 �� 84 40 White No MaleS13E17 38 62 24 White No MaleS13E18 36 40 � Black No MaleBo31E1 76 96 20 White Yes FemaleBo31E2 �� 76 22 White No MaleBo31E3 74 98 24 White Yes MaleBo31E4 38 48 10 White No FemaleBo31E6 38 �� 26 White Yes FemaleBo31E7 50 78 28 Black Yes FemaleBo31E8 �� 86 32 Black No MaleBo31E9 28 62 34 White Yes MaleBo31E10 32 38 � White Yes MaleBo31E11 48 68 20 White No MaleBo31E12 �� 96 30 Black No FemaleBo31E13 72 100 28 Hispanic No FemaleBo31E14 �� 88 �� White Yes MaleBo31E15 36 �� 30 Black Yes Female
appendix b (ConT.)
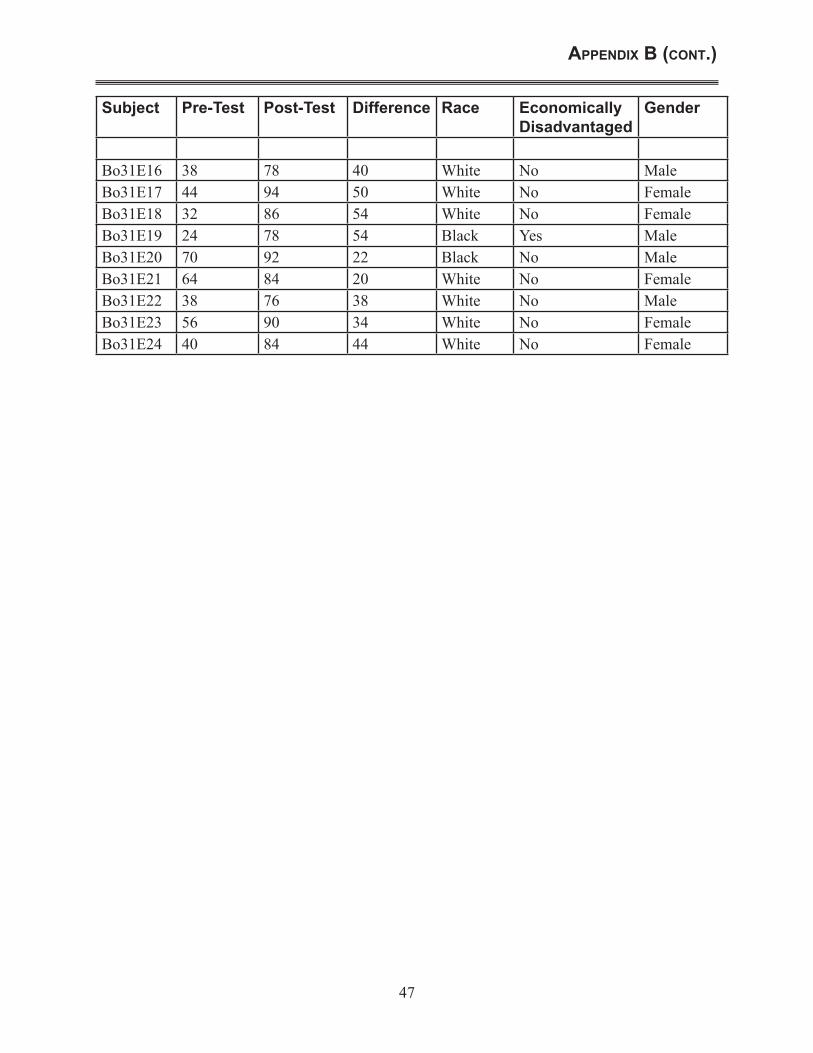
47
Subject Pre-Test Post-Test Difference Race Economically Disadvantaged
Gender
Bo31E16 38 78 40 White No MaleBo31E17 �� 94 50 White No FemaleBo31E18 32 86 �� White No FemaleBo31E19 24 78 �� Black Yes MaleBo31E20 70 92 22 Black No MaleBo31E21 �� 84 20 White No FemaleBo31E22 38 76 38 White No MaleBo31E23 �� 90 34 White No FemaleBo31E24 40 84 �� White No Female
appendix b (ConT.)
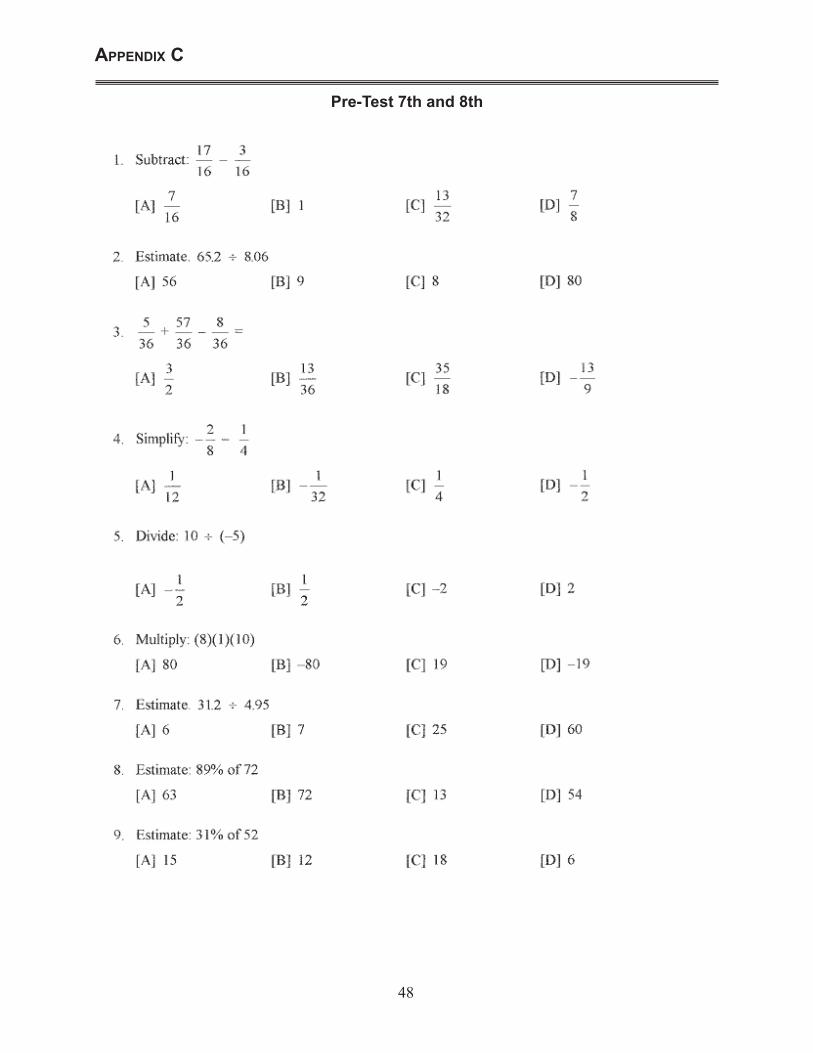
48
appendix C
Pre-Test 7th and 8th
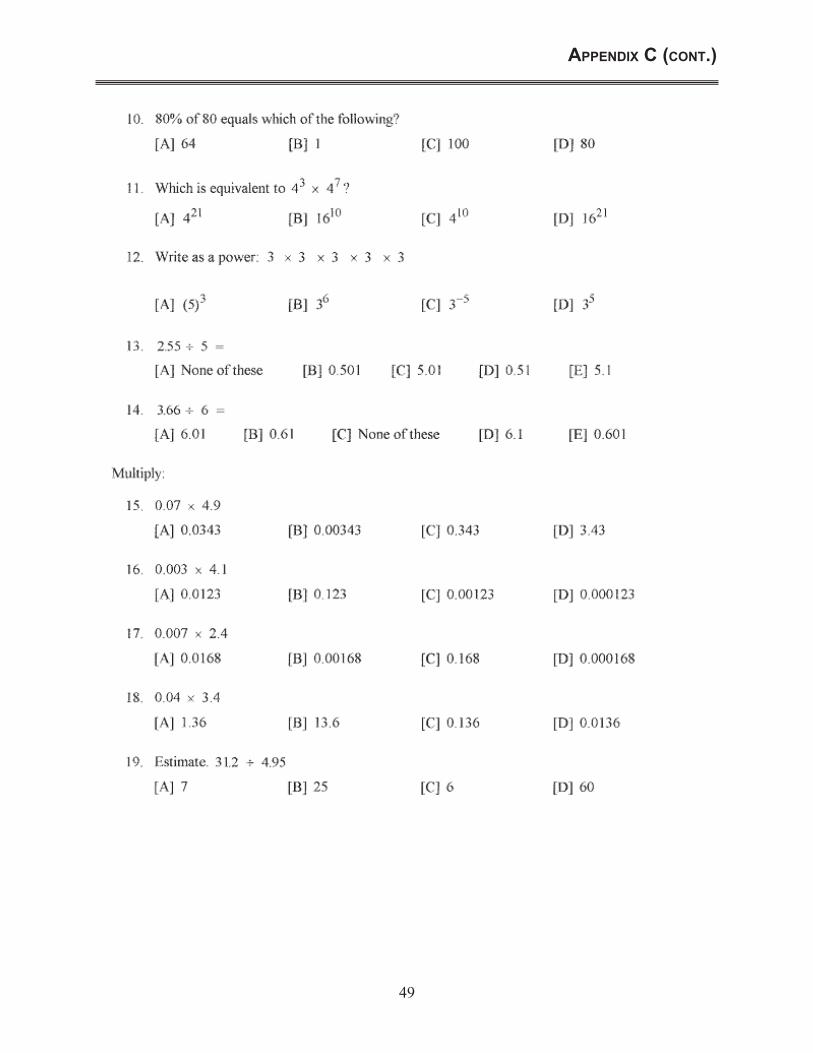
49
appendix C (ConT.)
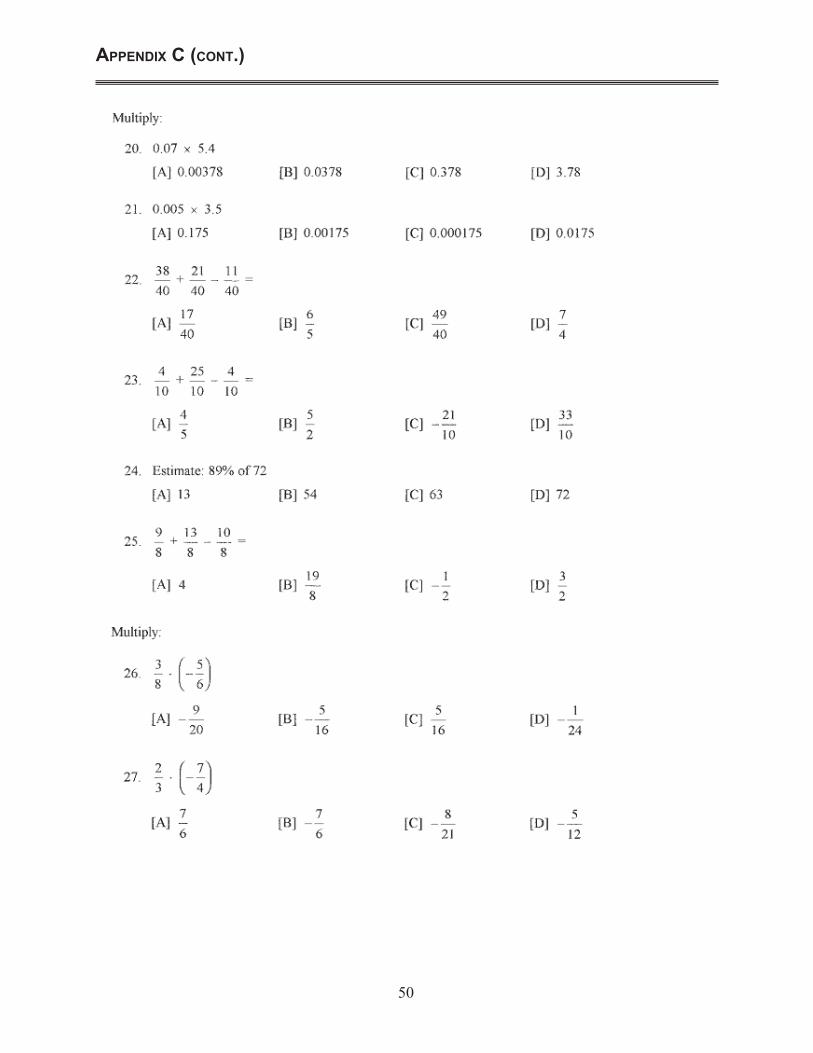
50
appendix C (ConT.)
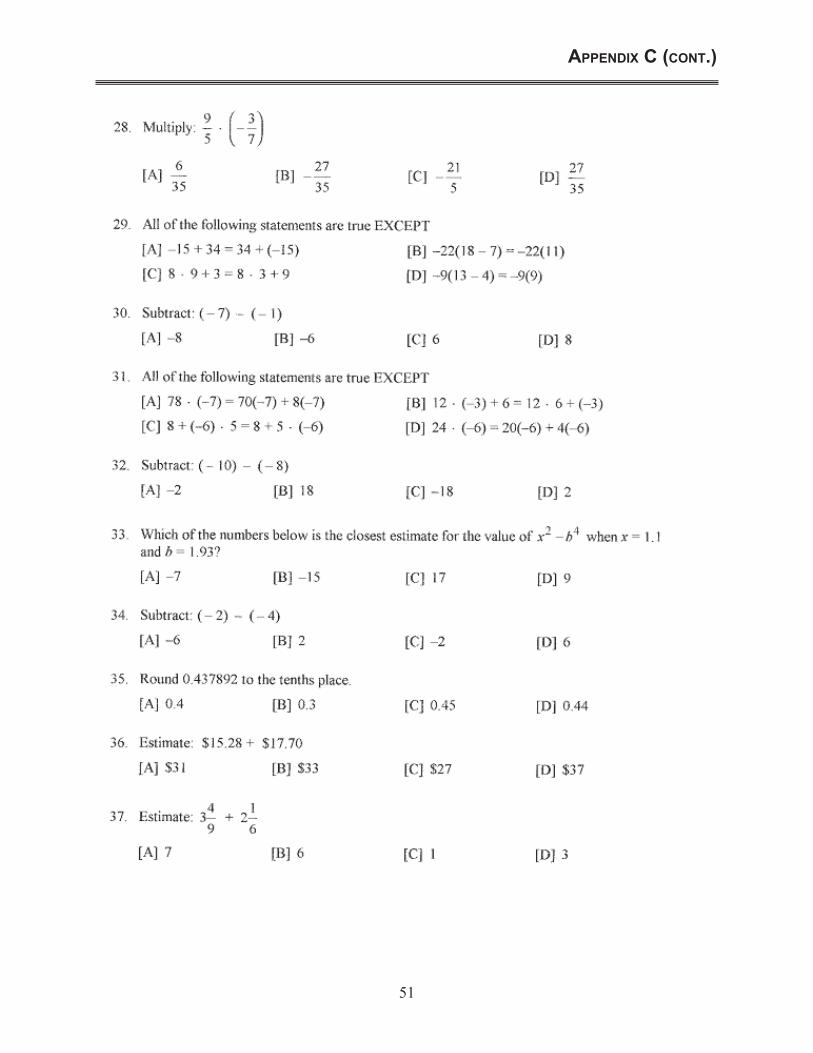
51
appendix C (ConT.)
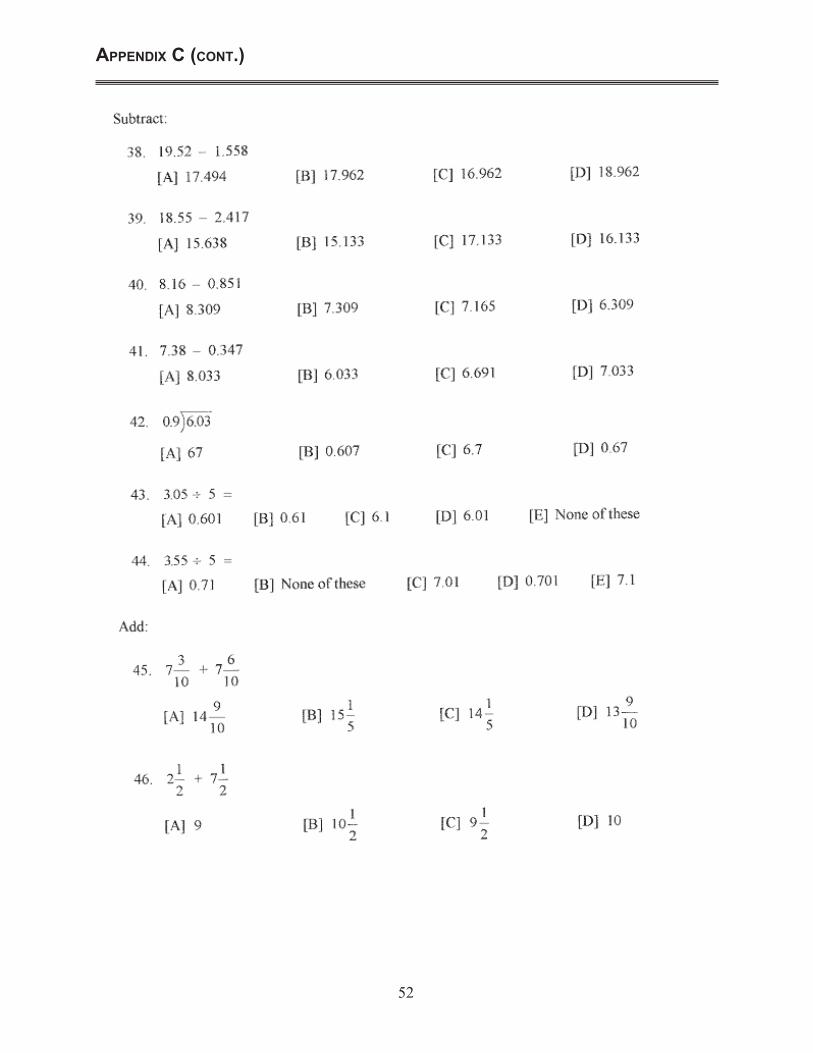
52
appendix C (ConT.)
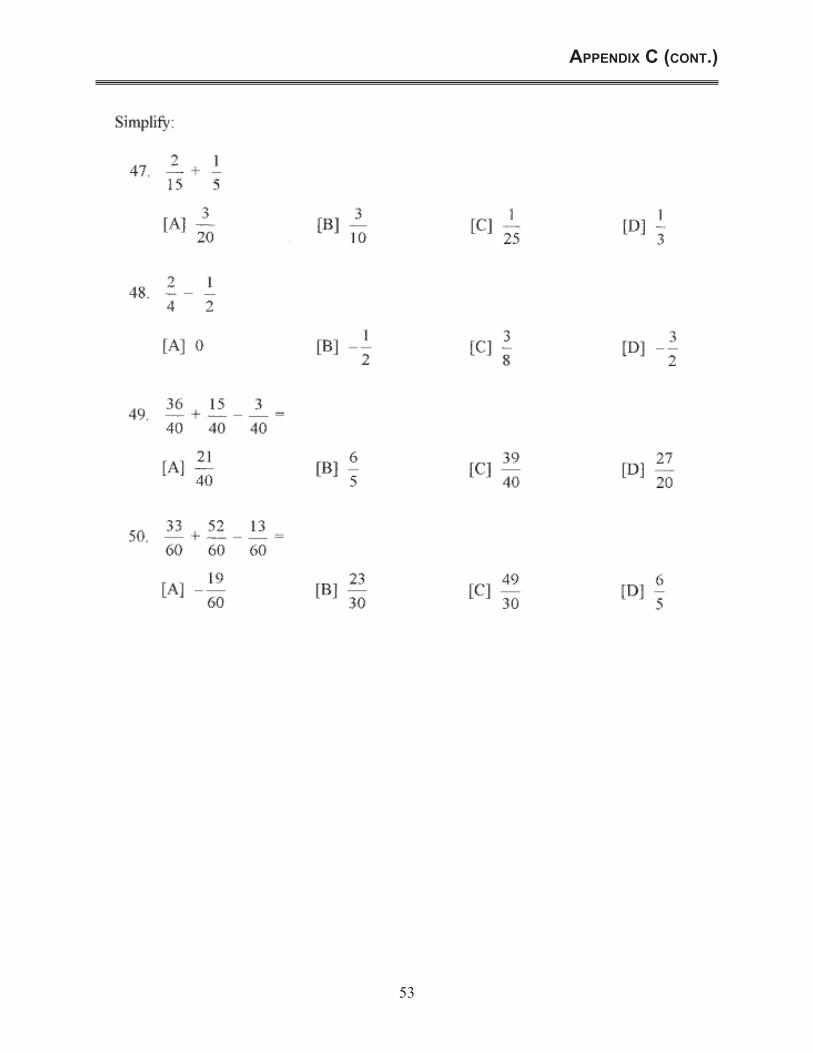
53
appendix C (ConT.)

��
Post-Test 7th and 8th
appendix d
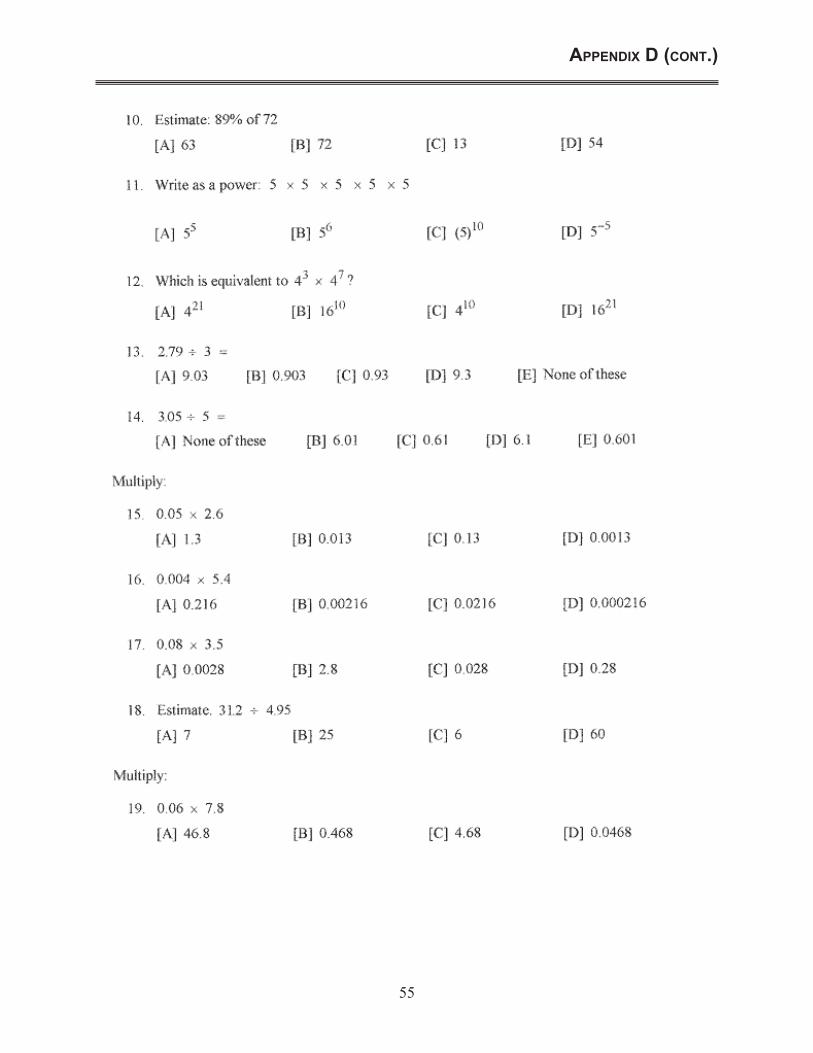
��
appendix d (ConT.)
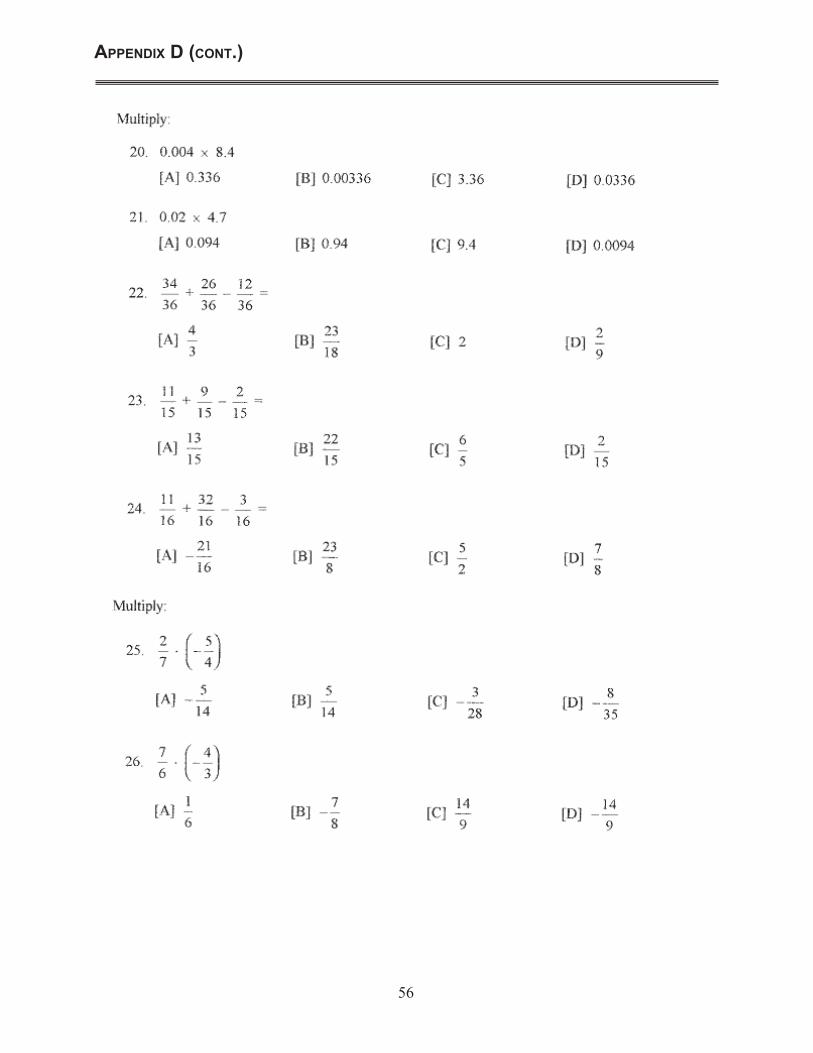
��
appendix d (ConT.)
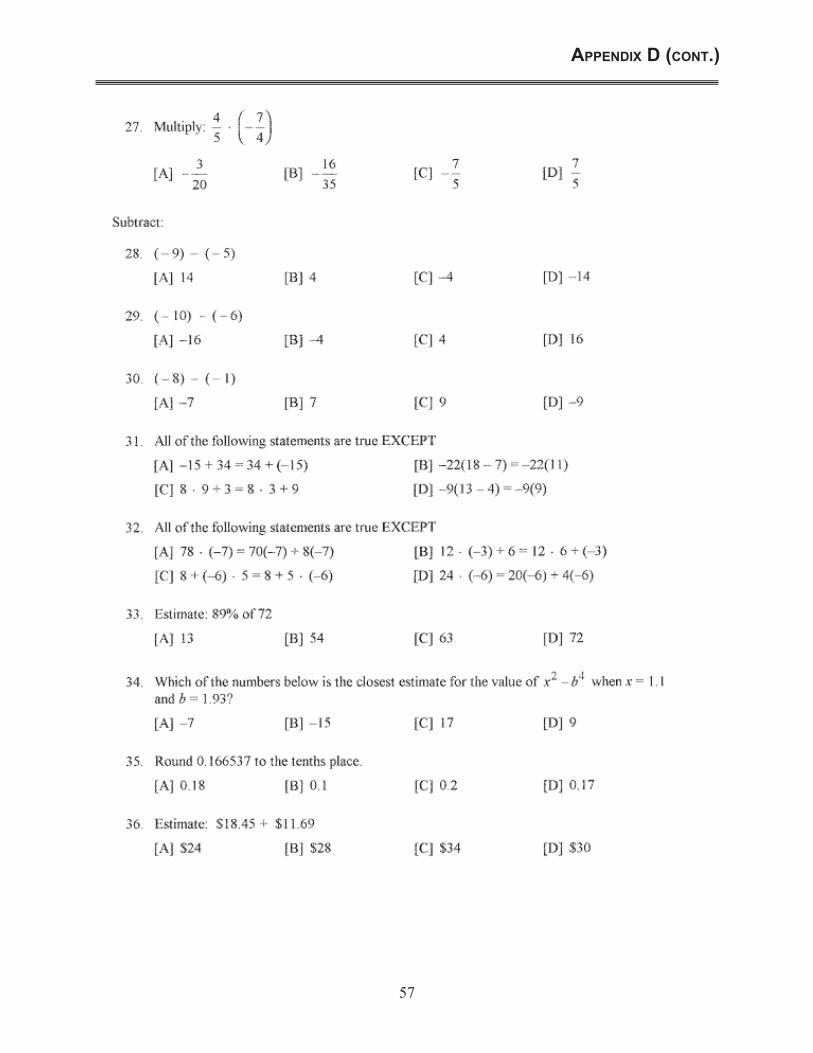
57
appendix d (ConT.)
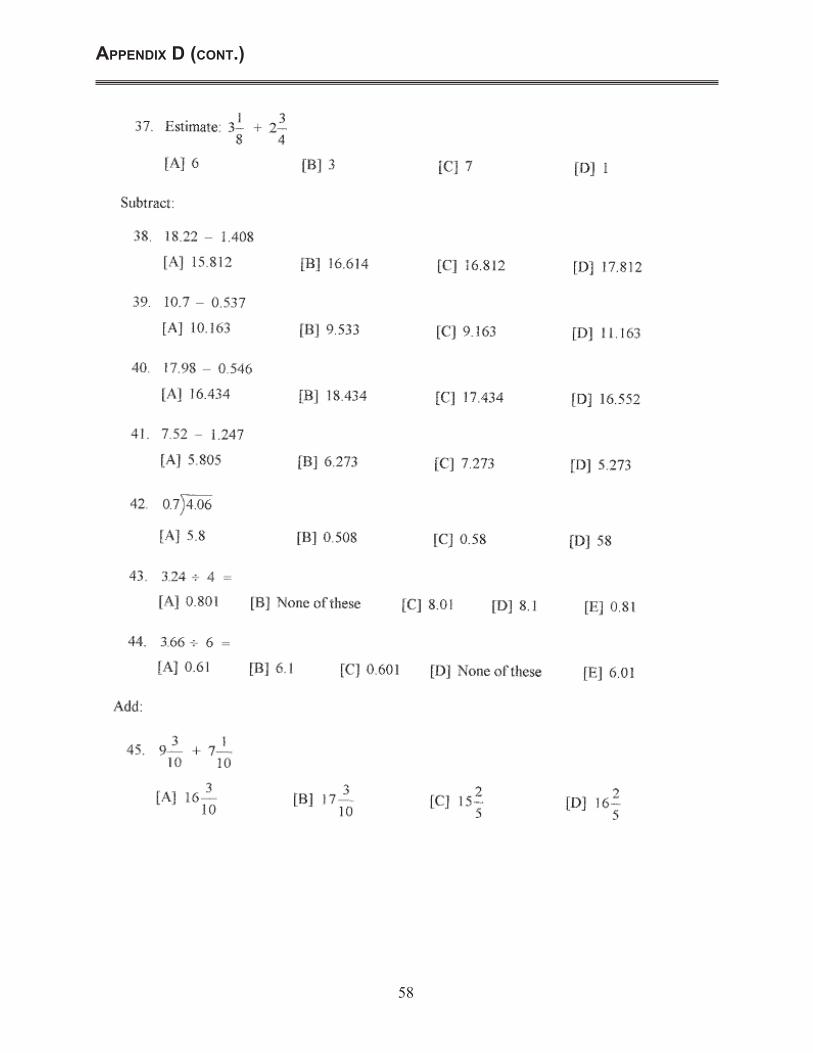
58
appendix d (ConT.)
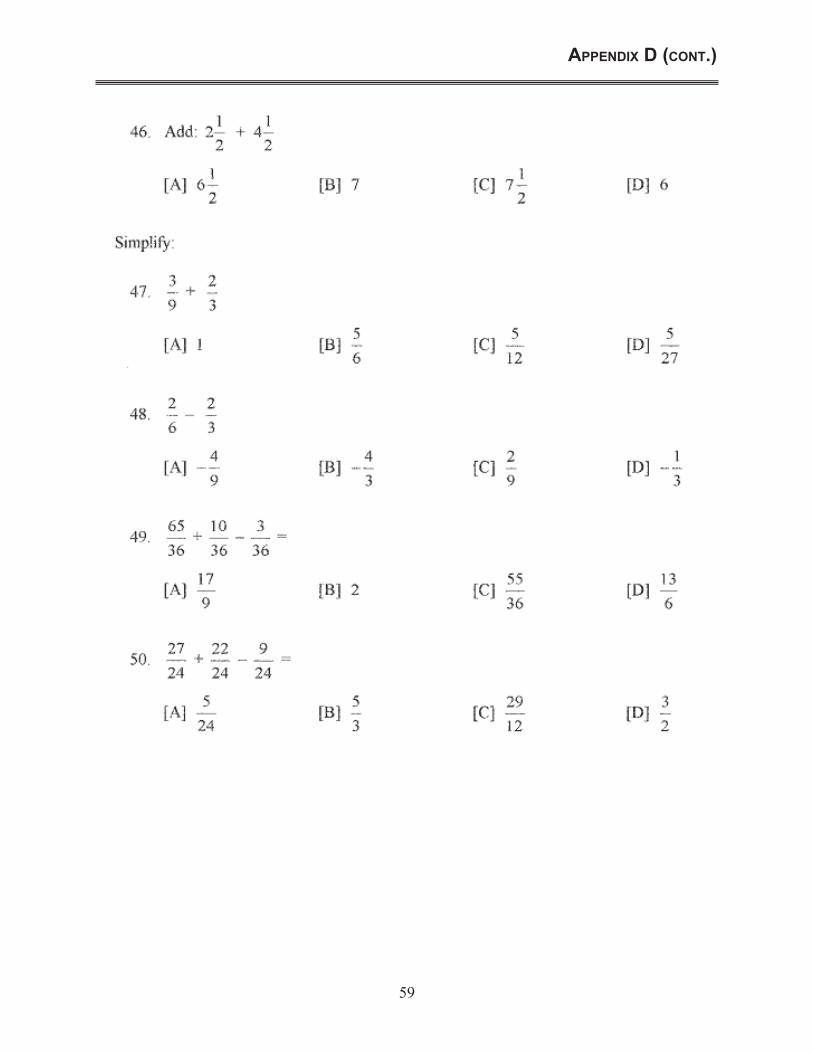
59
appendix d (ConT.)

60
Pre – Test 6th
appendix e
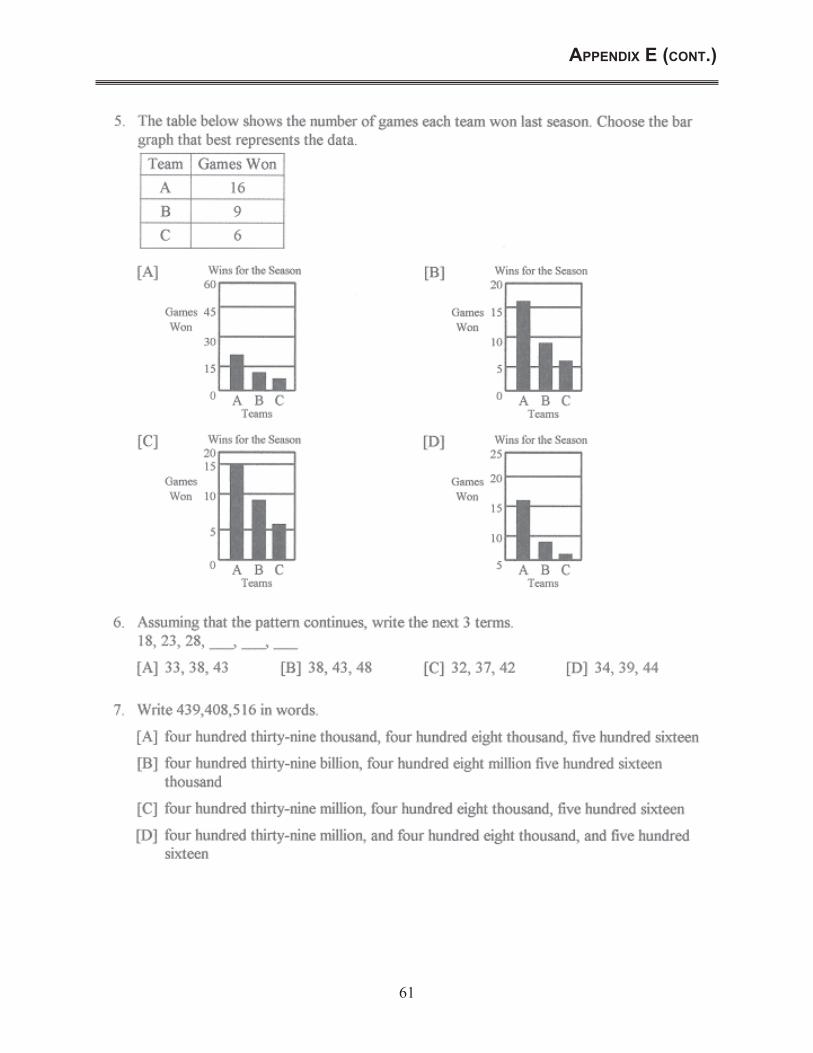
61
appendix e (ConT.)
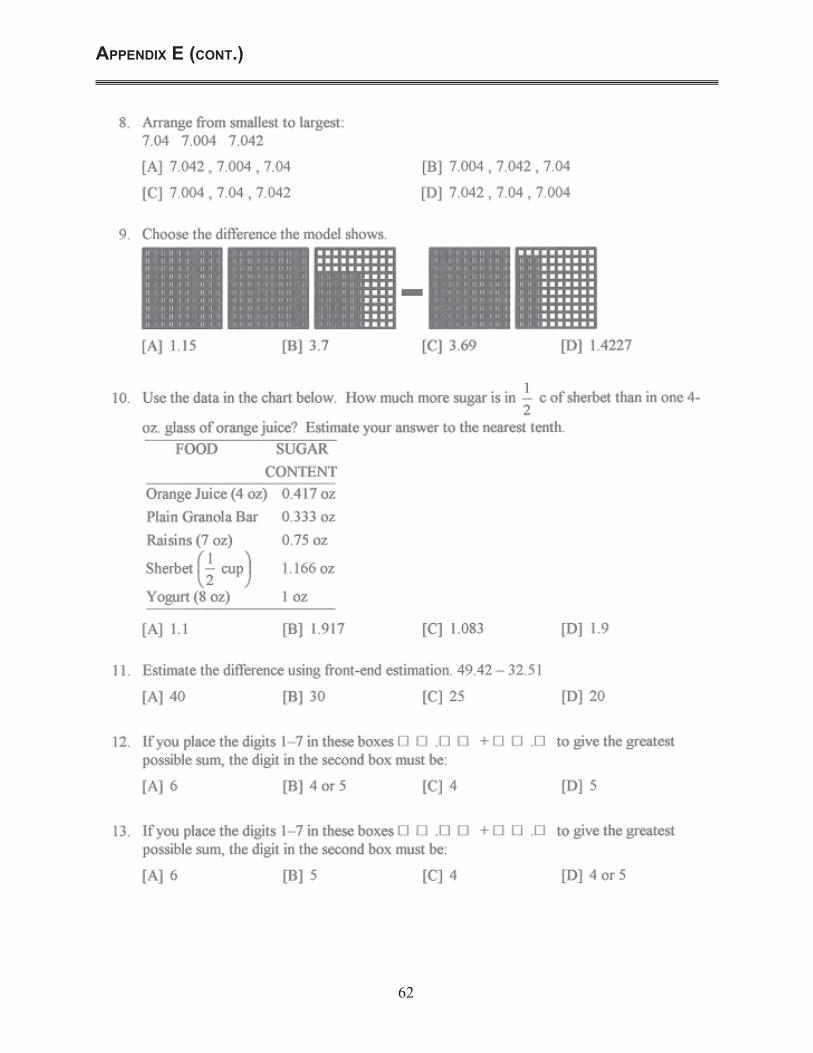
62
appendix e (ConT.)
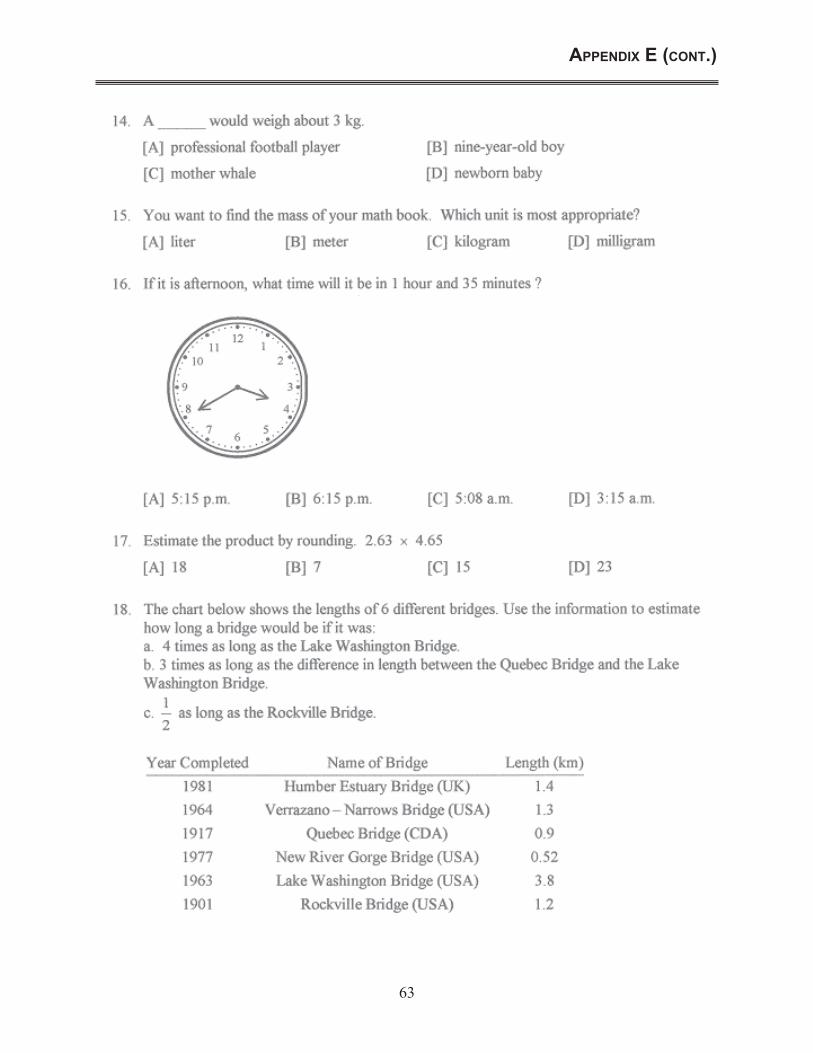
63
appendix e (ConT.)
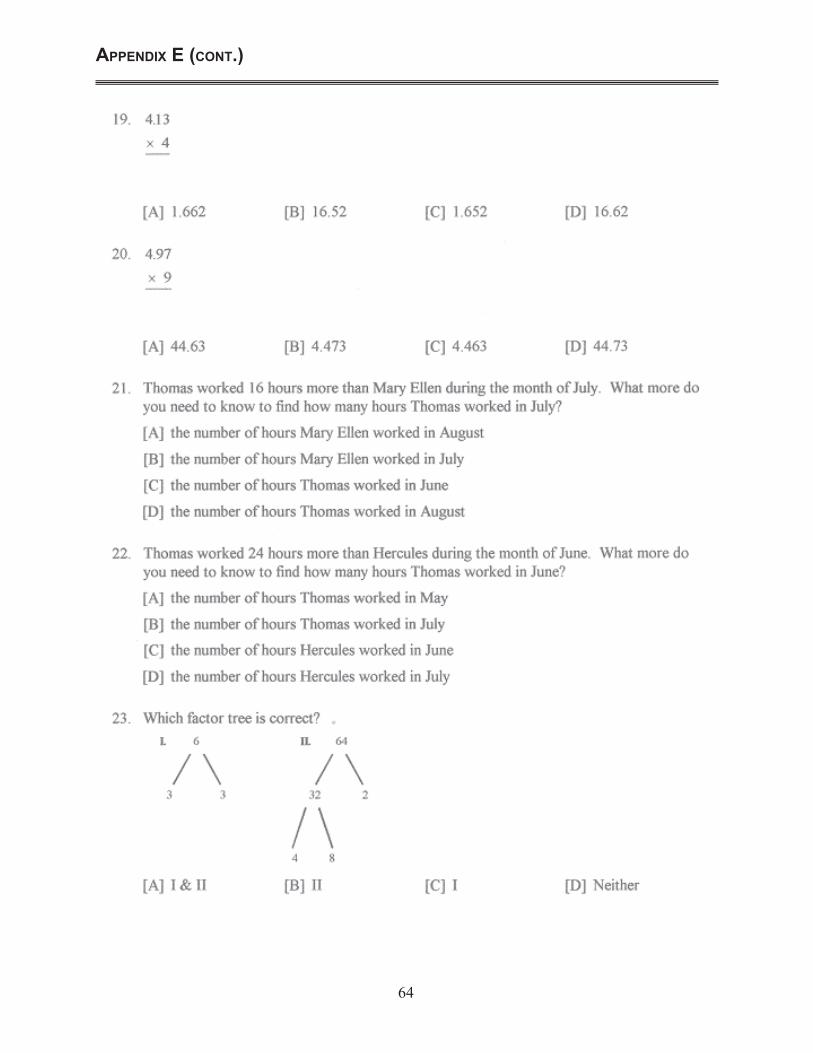
��
appendix e (ConT.)
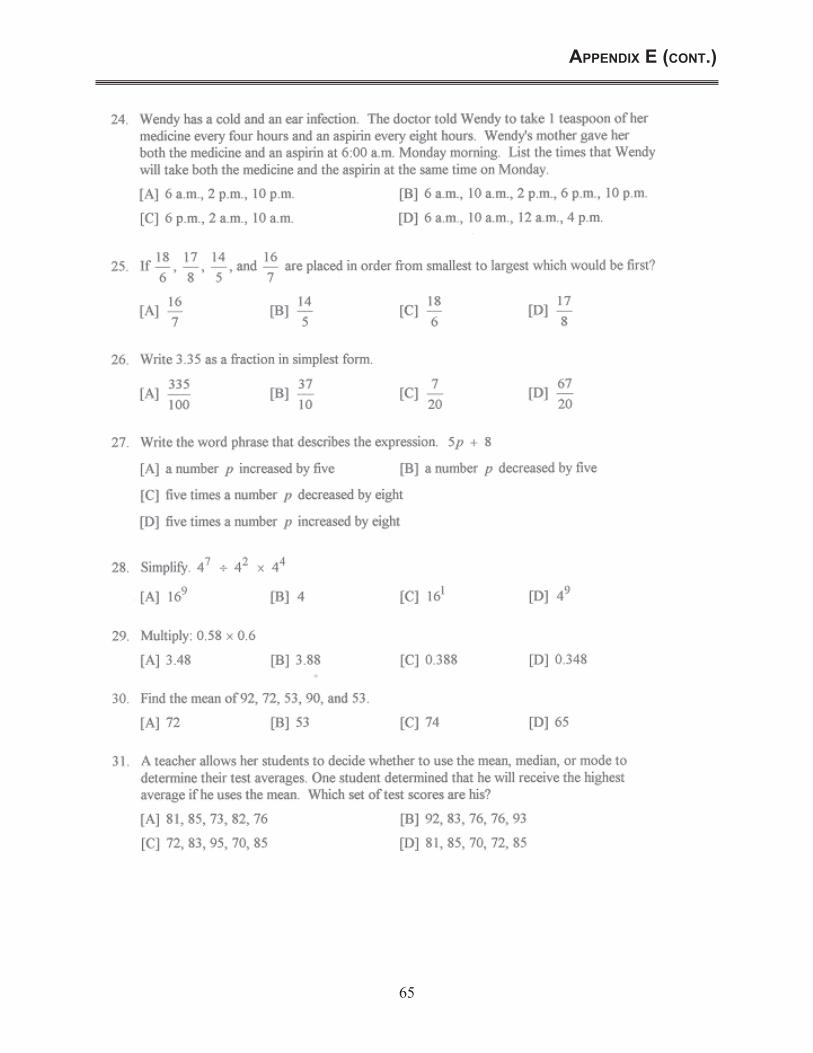
��
appendix e (ConT.)
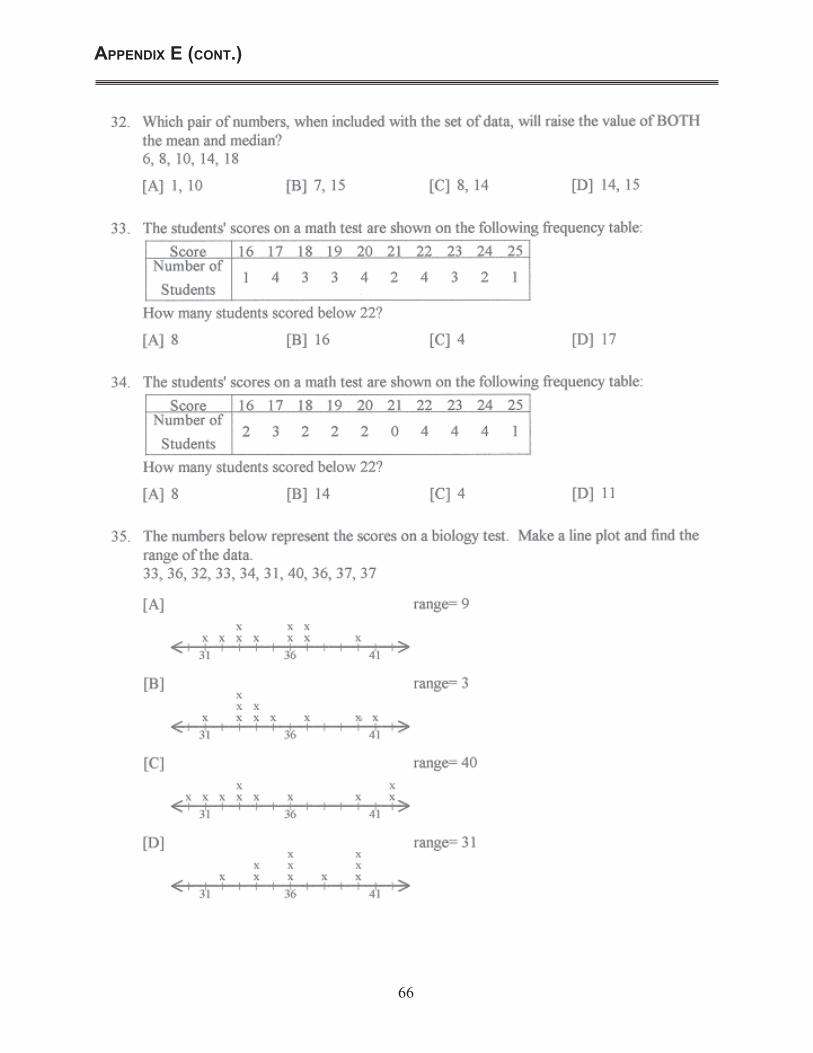
��
appendix e (ConT.)
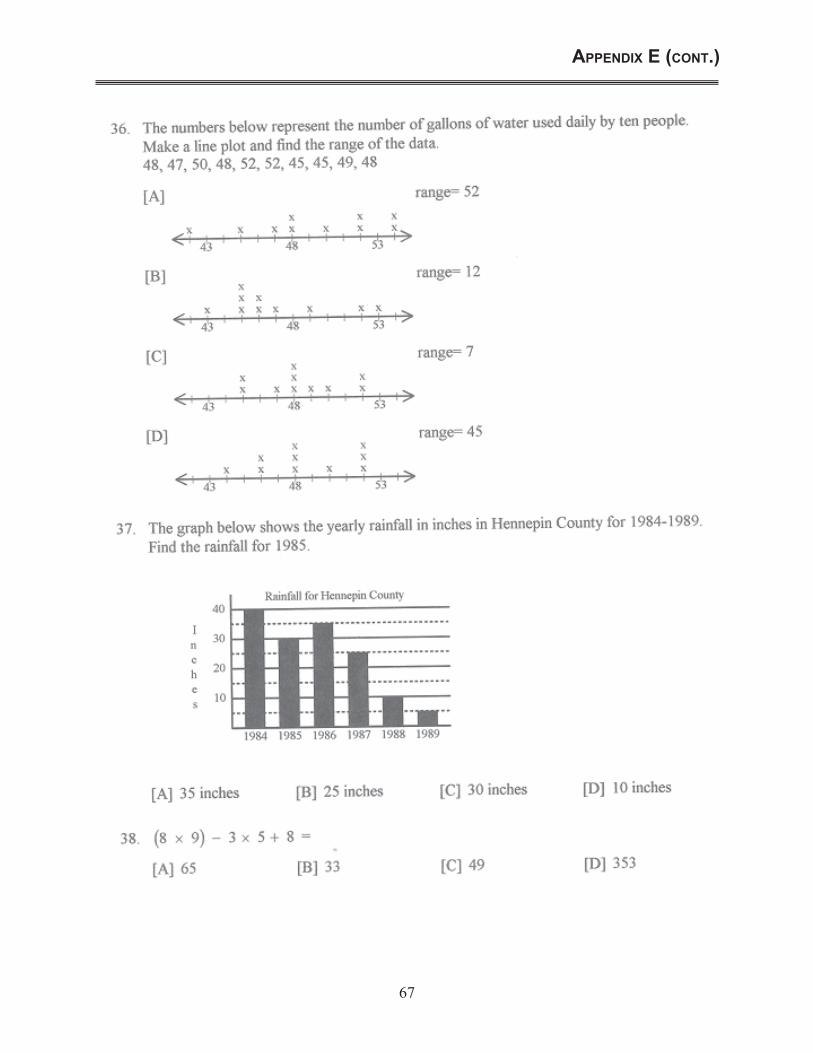
67
appendix e (ConT.)
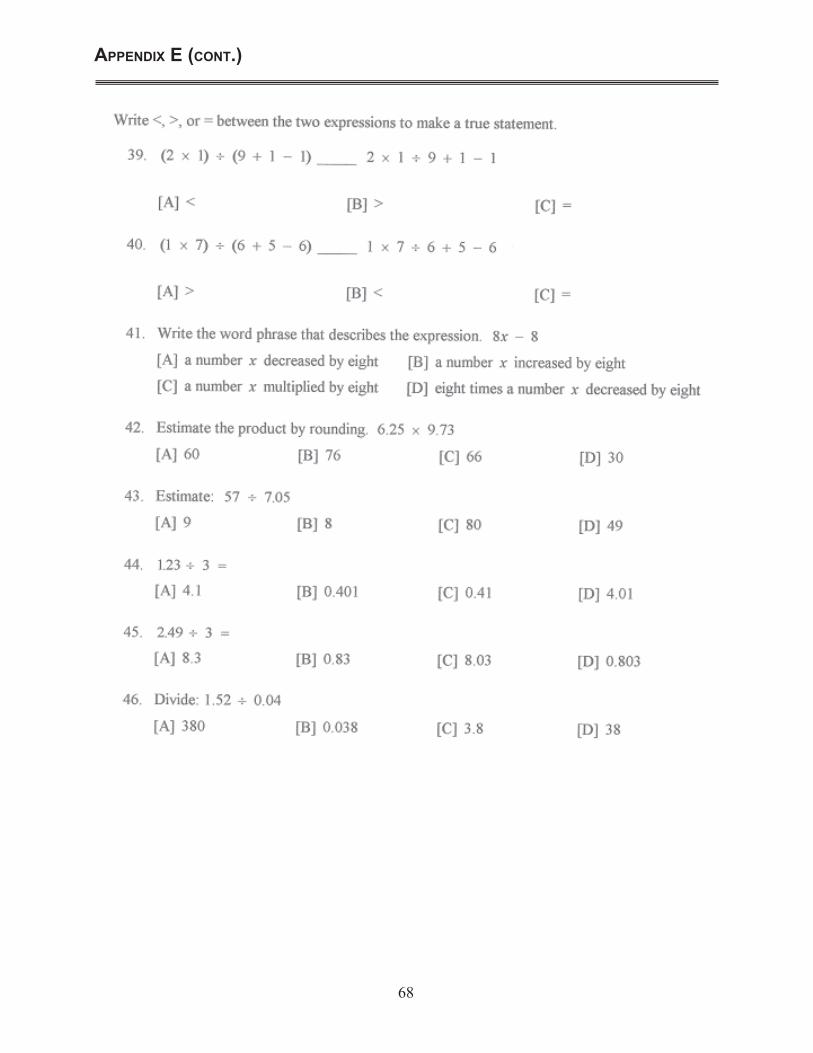
68
appendix e (ConT.)
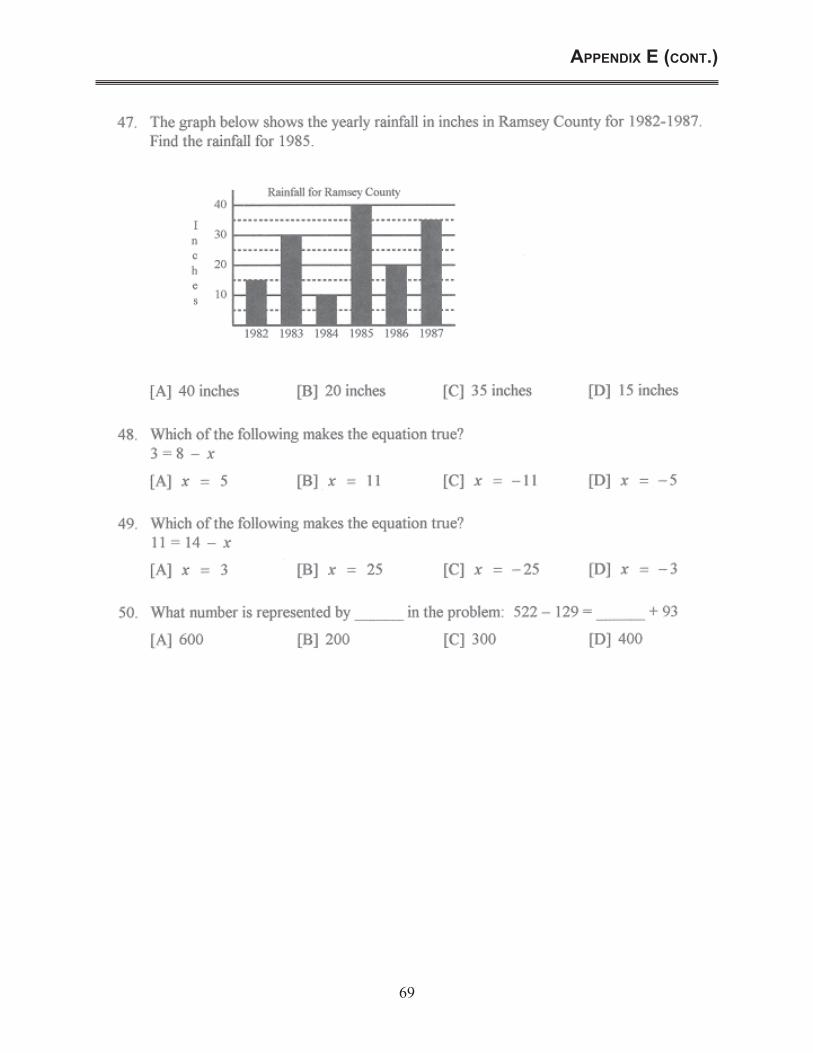
69
appendix e (ConT.)
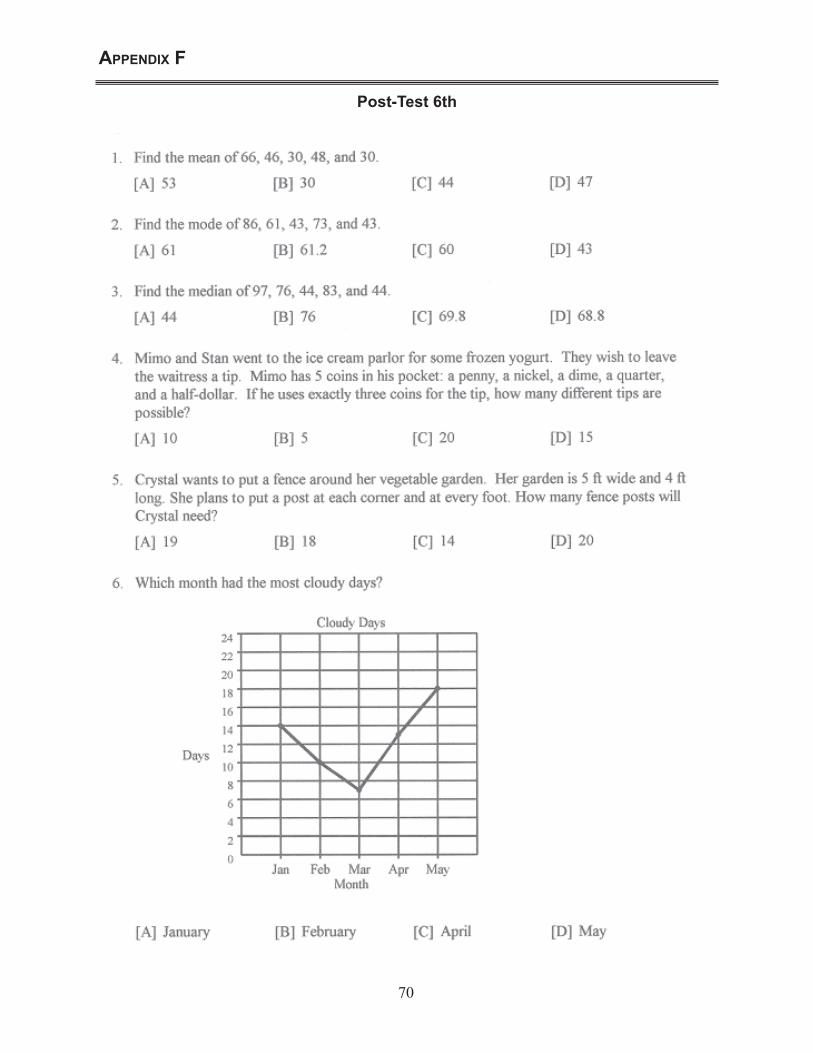
70
Post-Test 6th
appendix f
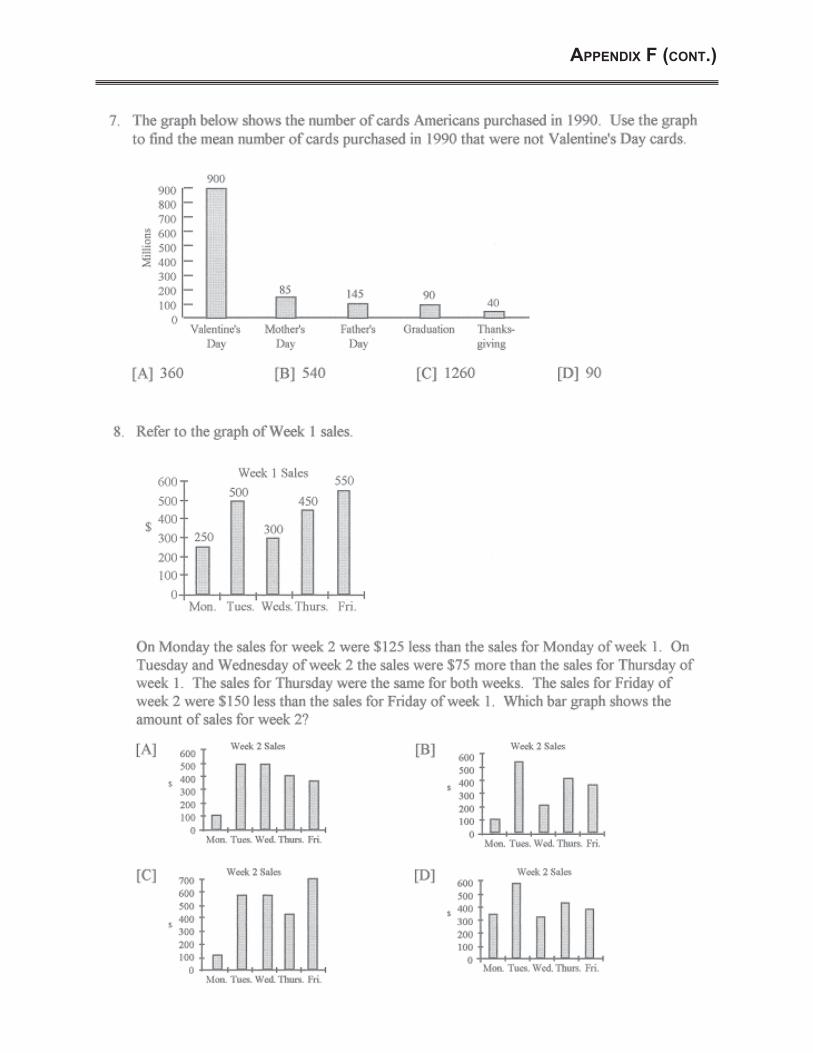
71
appendix f (ConT.)
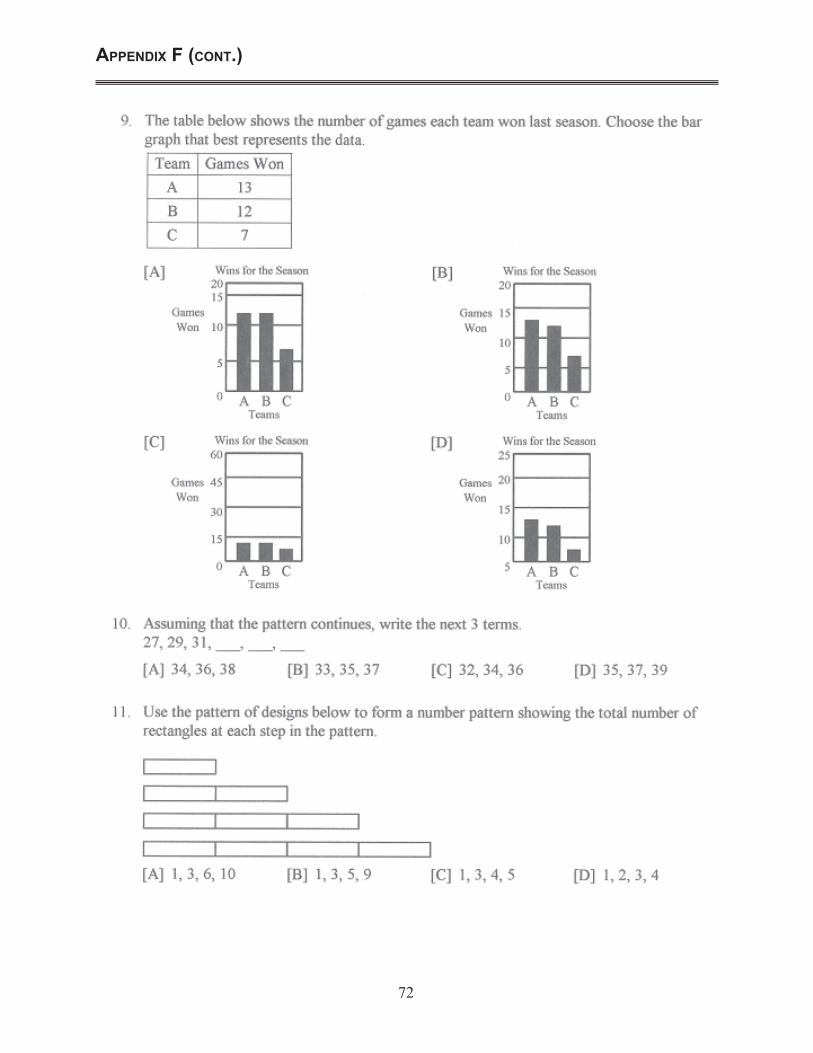
72
appendix f (ConT.)
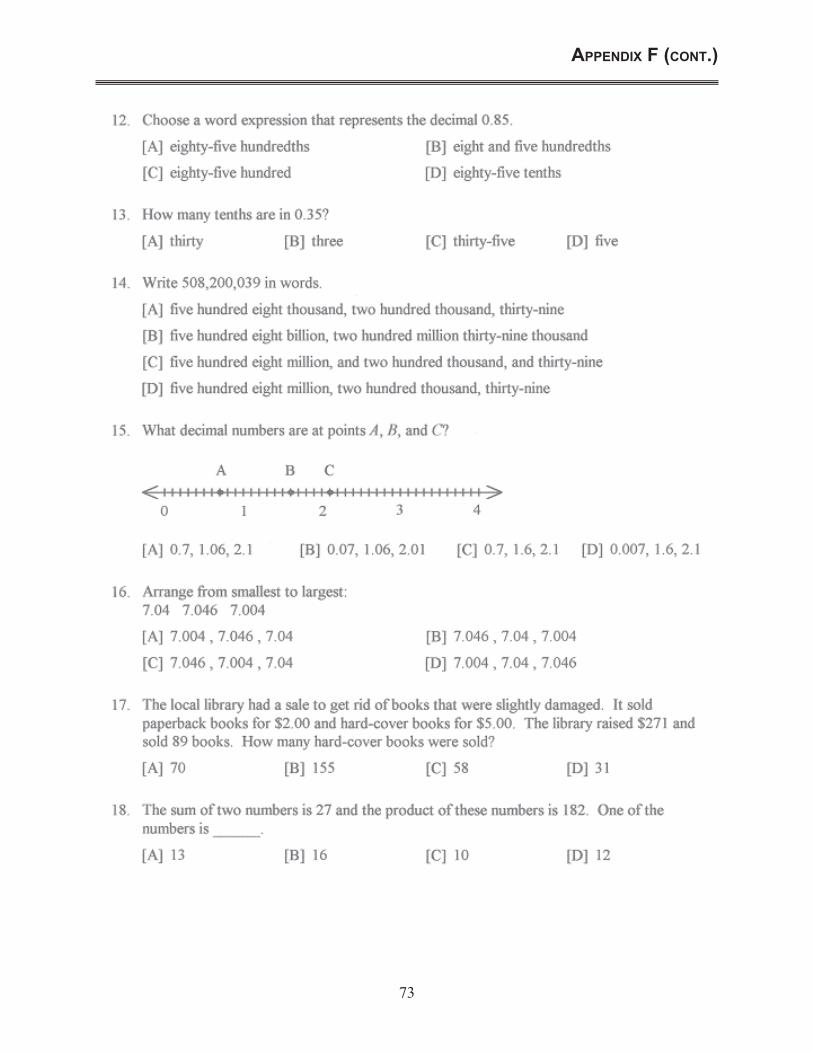
73
appendix f (ConT.)
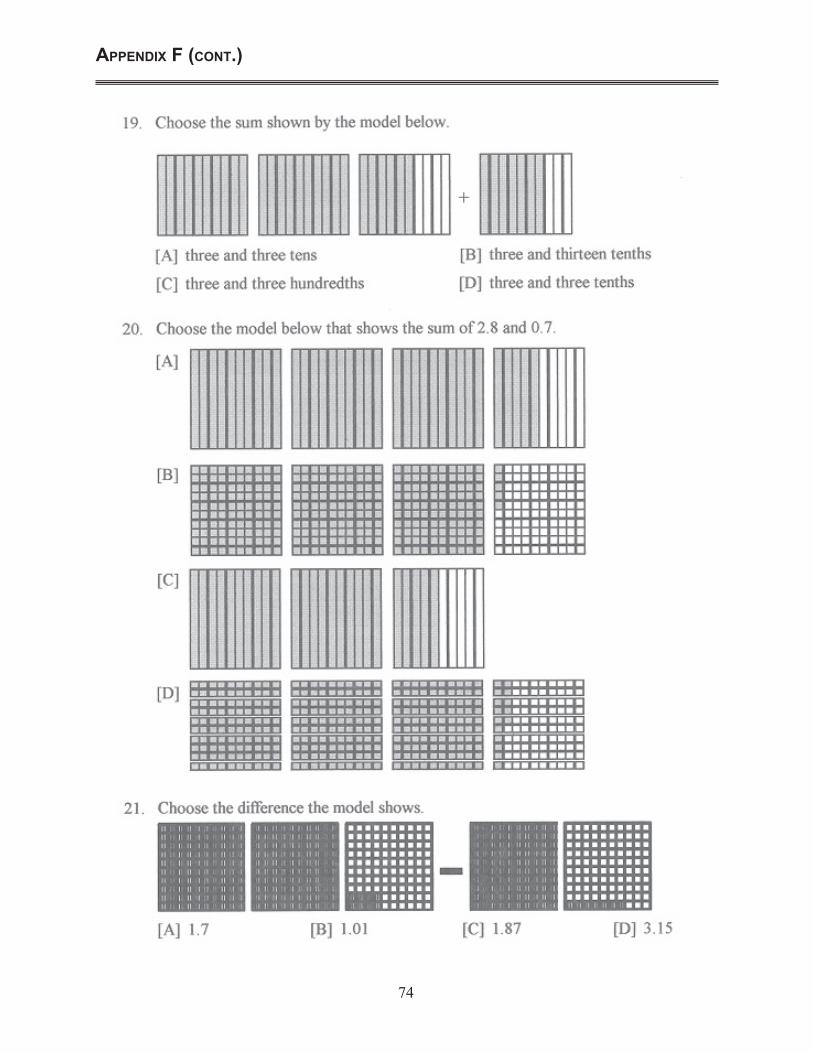
74
appendix f (ConT.)
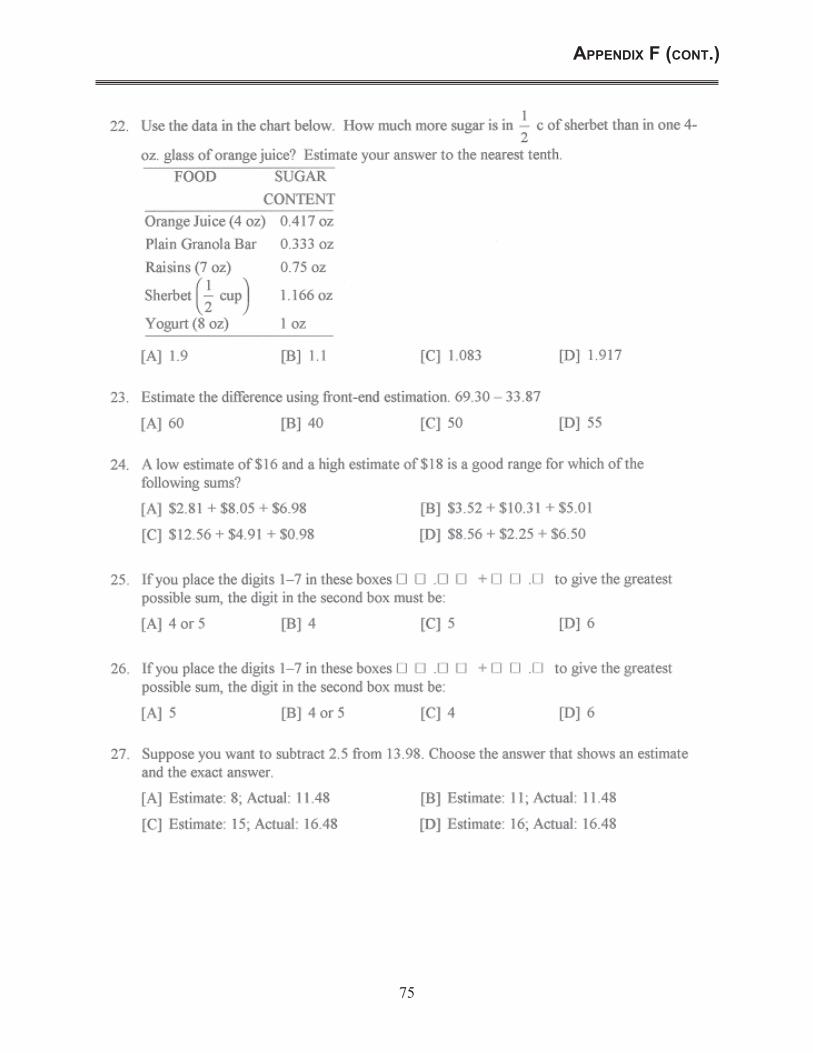
75
appendix f (ConT.)

76
appendix f (ConT.)
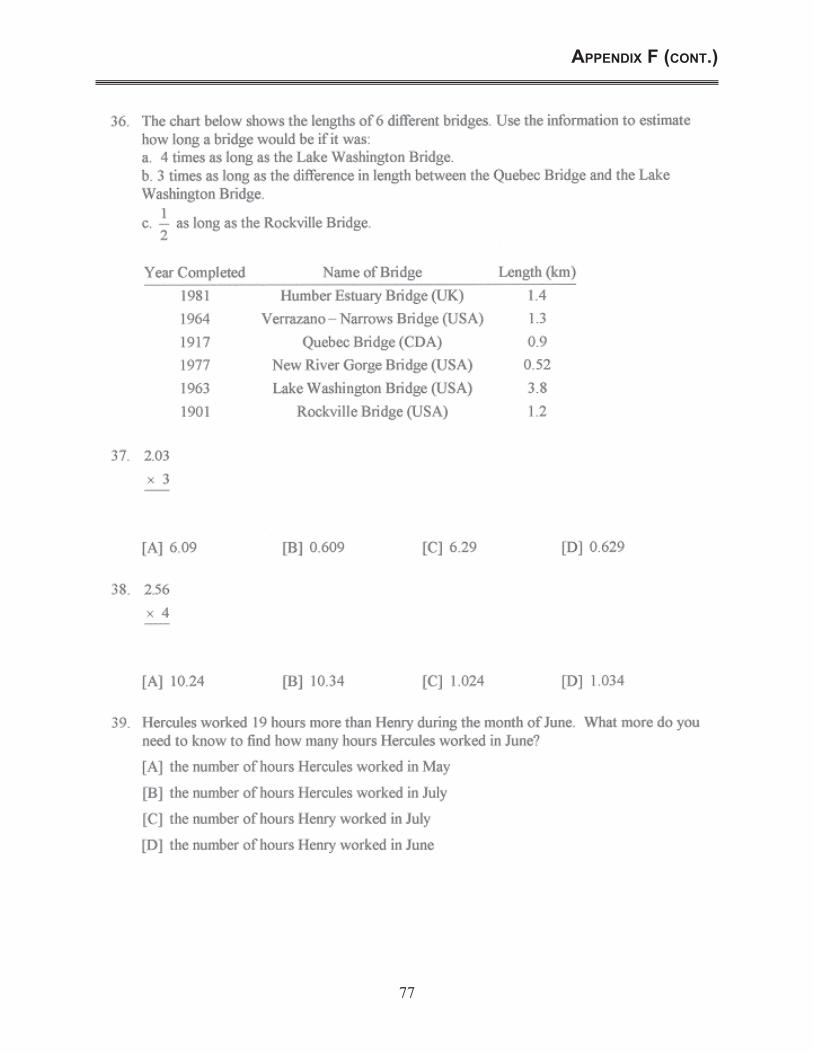
77
appendix f (ConT.)
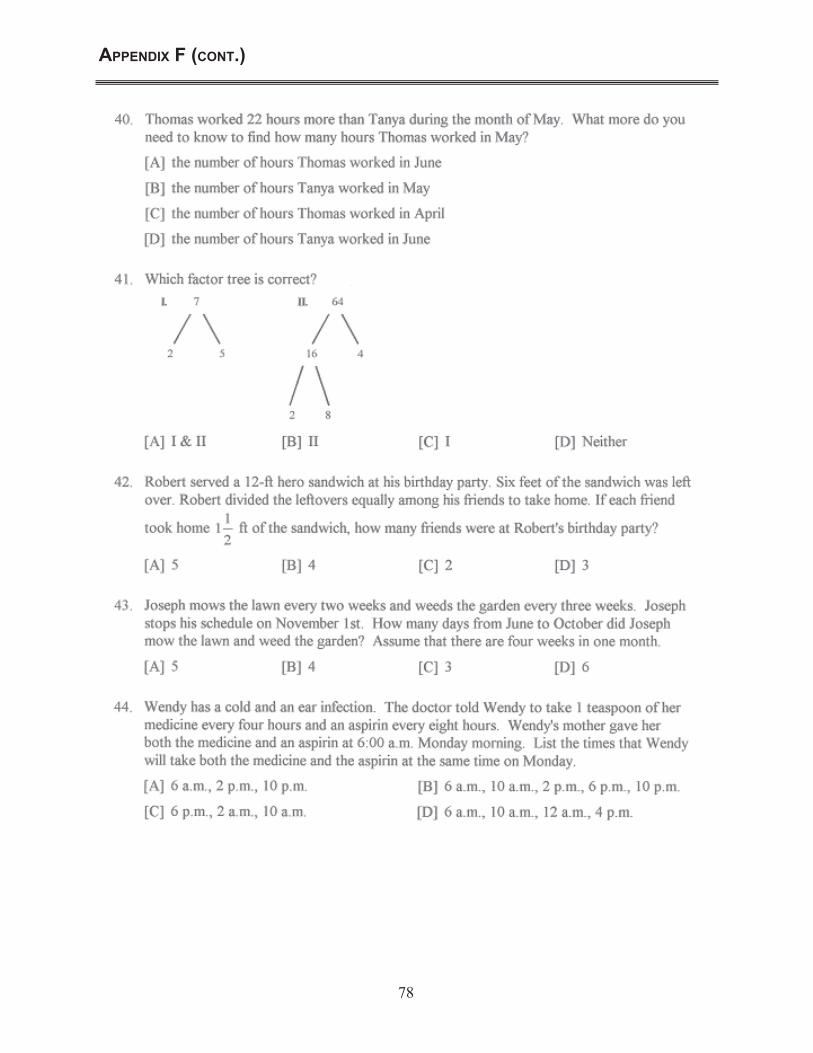
78
appendix f (ConT.)
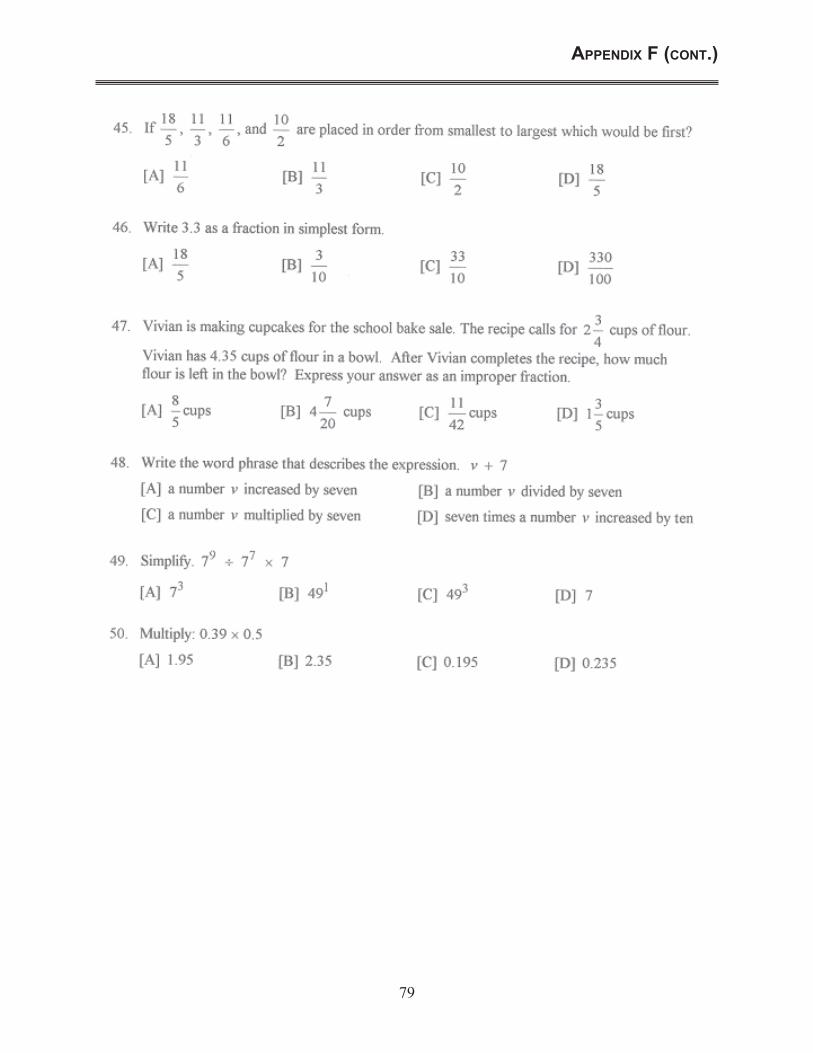
79
appendix f (ConT.)


Copyright © 2004 John Edward AshAll Rights Reserved