Embed Size (px)
Citation preview
The Effects of Corruption on FDI Inflows Ali Al-Sadig
The surge in foreign direct investment (FDI) flows during the1990s has motivated a host of recent studies into their determinants.Recently, the level of corruption in the host country has been intro-duced as one factor among the determinants of FDI location. Froma theoretical viewpoint, corruption—that is, paying bribes to corruptgovernment bureaucrats to get “favors” such as permits, investmentlicenses, tax assessments, and police protection—is generally viewedas an additional cost of doing business or a tax on profits. As a result,corruption can be expected to decrease the expected profitability ofinvestment projects. Investors will therefore take the level of corrup-tion in a host country into account in making decisions to investabroad.The empirical literature on the effects of the host country’s cor-
ruption level on FDI inflows, however, has not found the commonlyexpected effects. Some empirical studies provide evidence of a neg-ative link between corruption and FDI inflows, while others fail tofind any significant relationship. Most existing studies use a cross-sectional rather than a panel data
analysis to examine the effects of a complex phenomenon. Such amethod cannot control for the unobserved country-specific effects
Cato Journal, Vol. 29, No. 2 (Spring/Summer 2009). Copyright © Cato Institute. All rightsreserved.
Ali Al-Sadig is an economic researcher at the Saudi Arabian Monetary Agency(SAMA). He thanks Timothy Hatton and George Symeonidis for supervising his dis-sertation, upon which this article draws. He also acknowledges helpful commentsfrom Santos Silva and from participants at the Research Student Seminar,Department of Economics, University of Essex. The views expressed in this articleare those of the author and not necessarily those of SAMA.
267
18485_CATO-R2(pps.):Layout 1 8/7/09 3:55 PM Page 267
268
Cato Journal
that may vary across countries and may be correlated with corrup-tion. Even if a panel data analysis is implemented, those studies haveignored the fact that corruption is not necessarily an independentvariable. It is a consequence of economic and noneconomic variablesand so must be treated as an endogenous variable.Motivated by these issues, the main objective of this article is to
empirically reexamine the effects of corruption on FDI inflows byincorporating an econometric method based on panel data from 117host countries over the period 1984–2004. More precisely, this arti-cle intends to answer the following question: Does a corrupt hostcountry receive less or more FDI inflows after controlling for otherdeterminants of FDI location?Our results show that the corruption level in the host country has
an adverse effect on FDI inflows: a one-point increase in the corrup-tion level leads to a reduction in per capita FDI inflows by about 11percent. However, after controlling for other characteristics of thehost country such as the quality of institutions, the negative effects ofcorruption disappear and sometimes it becomes positive but statisti-cally insignificant.In fact, the results show that the country’s quality of institutions is
more important than the level of corruption in encouraging FDIinflows into the country. For instance, ceteris paribus, a country withsound institutions is able to attract as much as 29 percent more percapita FDI inflows than a country with poor institutions.
FDI Inflows and CorruptionDue to the various forms that corruption can take, including prac-
tices such as bribery, extortion, influence, fraud, and embezzlement,corruption has been defined in different ways. Yet, since we are con-cerned only with corruption that affects the costs of investment oper-ations, we use Macrae’s (1982: 679) definition. He defines corruptionas an “arrangement” that involves “a private exchange between twoparties (the ‘demander’ and the ‘supplier’), which (1) has an influ-ence on the allocation of resources either immediately or in thefuture, and (2) involves the use or abuse of public or collectiveresponsibility for private ends.” The demanders in our case may bethe public officials and the suppliers are foreign investors. The debate on the adverse effects of the level of corruption on
FDI inflows has been analyzed in context of the costs of doing busi-
18485_CATO-R2(pps.):Layout 1 8/7/09 3:55 PM Page 268
269
The Effects of Corruption
ness. Since foreign investors have to pay extra costs in the form ofbribes in order to get licenses or government permits to conductinvestment, corruption raises the costs of investment. Such addition-al costs decrease the expected profitability of investment and so cor-ruption is generally viewed as a tax on profits (Bardhan 1997).Moreover, corruption increases uncertainty because corruptionagreements are not enforceable in the courts of law.It has been shown that corruption has adverse effects on econom-
ic performance.1 Corruption has a negative impact on the level ofinvestment and economic growth (Mauro 1995), on the quality ofinfrastructure and on the productivity of public investment (Tanziand Davoodi 1997), on health care and education services (Gupta,Davoodi, and Tiongson 2000), and on income inequality (Gupta,Davoodi, and Alonso-Terme 1998; Li, Xu, and Zou 2000). All thosefactors are found to be important determinants of FDI location.Therefore, foreign investors would tend to avoid investing in coun-tries with high levels of corruption.However, there may exist positive effects of corruption on FDI
inflows. In the presence of a rigid regulation and an inefficientbureaucracy, corruption may increase bureaucratic efficiency byspeeding up the process of decisionmaking (Bardhan 1997).However, this view has been rejected empirically. Kaufman and Wei(1999) using firm level data covering more than 2,000 firms find thatfirms paying more bribes spend more time negotiating with bureau-crats. But two recent studies show that the effects of corruptiondepend on the country’s rule of law and economic freedom. Houston(2007), studying the effects of corruption on a country’s economicperformance, finds that corruption has positive effects on economicgrowth in countries with a weak rule of law, while it has negativeeffects in countries with sound institutions. Also, Swaleheen andStansel (2007) find that corruption enhances economic growth incountries with high economic freedom, while it hinders economicgrowth in countries with low economic freedom.
Previous Empirical StudiesThe empirical literature on the relationship between corruption
and FDI has not reached the commonly expected conclusion that a 1The World Bank identifies corruption as “the most single obstacle to economicdevelopment.”
18485_CATO-R2(pps.):Layout 1 8/7/09 3:55 PM Page 269
270
Cato Journal
perceived high level of corruption in the host country deters FDI. Ina study of foreign investment by U.S. firms, Wheeler and Mody(1992: 70) did not find a significant relationship between the size ofFDI and the host country’s risk factor, and they concluded that theimportance of the risk factor should “be discounted, although itwould not be impossible to assign it some small weight as a decisionfactor.” Wei (2000a), however, argues that the reason why Wheelerand Mody (1992) failed to find a significant relationship between cor-ruption and FDI is that corruption is not explicitly incorporated intotheir model. They combined corruption with 12 other indicators toform one variable, but some of these indicators may be marginallyimportant for FDI. Hines (1995) examines the effect of the U.S. anti-bribery legisla-
tion (Foreign Corrupt Practices Act of 1977) on the operation of U.S.firms in countries where corruption is high. He uses the growth rateof U.S. FDI flows into 35 host countries over the period 1977 to 1982as the dependent variable and the Business International Index as ameasure of corruption. His finding suggests that the CorruptPractices Act significantly reduced U.S. FDI flows into more corrupthost countries after 1977.2
Abed and Davoodi (2000) use a cross-sectional as well as a paneldata analysis to examine the effects of levels of corruption on percapita FDI inflows to transition economies. They find that countrieswith a low level of corruption attract more per capita FDI. However,once they control for the structural reform factor, corruptionbecomes insignificant. They conclude that structural reform is moreimportant than reducing the level of corruption in attracting FDI. Wei (2000a: 1) examines the effects of taxation and corruption on
FDI using bilateral FDI flow data from 12 source countries to 45host countries. Using three different measures of corruption, he con-cluded that an increase in either the tax rate on multinational firmsor the level of corruption in the host countries would reduce inwardFDI. “An increase in the level of corruption from that of Singaporeto that of Mexico would have the same negative effect on inwardFDI as raising the tax rate by 50 percentage points.” By again usingsurvey data on countries’ investment environments, Wei (2000b) alsoexamines corruption’s effects on the composition of capital flows
2In 1997, OECD countries signed an agreement governing the use of bribery to winforeign business.
18485_CATO-R2(pps.):Layout 1 8/7/09 3:55 PM Page 270
271
The Effects of Corruption
using bilateral capital flow data from 14 source countries to 53 hostcountries. His findings suggest that there is indeed a negative rela-tionship between corruption and FDI and that the reduction in FDIcaused by corruption is greater than the negative impact of corrup-tion on other types of capital inflows.3
Focusing on only developing countries, Akçay (2001) uses cross-sectional data from 52 developing countries with two differentindices of corruption to estimate the effects of the level of corruptionon FDI inflows. He fails to find evidence of a negative relationshipbetween FDI and corruption. He concludes that the most significantdeterminants of FDI are market size, corporate tax rates, labor costs,and openness. Smarzynska and Wei (2002) use a firm-level data set from transi-
tion economies to investigate the effects of corruption in terms offirms’ decision not to enter a particular market, rather than in termsof reduced bilateral investment flows. Conditional on FDI takingplace, their results show that FDI entry strategy in a corrupt hostcountry is to enter into joint ventures with a domestic partner to savethe transaction costs of dealing with local government officials ratherthan to establish a wholly owned subsidiary.Habib and Zurawicki (2002) analyze the effects of corruption on
bilateral FDI flows using a sample of seven source countries and 89host countries. They hypothesize that the greater the absolute differ-ence in the corruption level between the source and the host coun-tries, the smaller the FDI inflows for the host country. Theyregressed bilateral FDI on a set of control variables including theabsolute difference between the corruption levels in the source andthe host countries. They find that foreign firms tend to avoid situa-tions where corruption is visibly present because corruption is con-sidered immoral and might be an important cause of inefficiency.Using a single source country, Voyer and Beamish (2004) use
cross-sectional regressions to investigate the effects of the level ofcorruption on Japanese FDI in 59 (developed and emerging) hostcountries. They find that Japanese FDI is negatively related to thelevel of corruption especially in emerging countries. Further, theirresults show that in emerging countries where a comprehensive legal
3Wei (2000b) finds that a corrupt host country tends to receive less FDI relative tobank loans and portfolio capital.
18485_CATO-R2(pps.):Layout 1 8/7/09 3:55 PM Page 271
272
Cato Journal
system is underdeveloped or does not exist to effectively reduce ille-gal activities, corruption serves to reduce Japanese FDI inflows.All these studies, with the exception of Abed and Davoodi’s (2000)
study, use a cross-sectional methodology to test the relationshipbetween corruption levels and FDI inflows and ignore the fact thatcorruption is a complex phenomenon. Corruption is correlated withmany other characteristics of the host country such as the quality ofinstitutions, lack of competition, and cultural values. Also, there maybe time-invariant unobserved effects that vary across countries andare correlated with corruption. Obviously, failing to hold all these fac-tors constant, the estimated effects may be biased in either direction.These studies also have ignored the fact that corruption is not neces-sarily an independent variable. In particular, the level of corruptionmay be affected by other variables in the host country such as thelevel of development, quality of institutions, and cultural values. This article complements the literature on the effects of corrup-
tion on FDI location. It distinguishes itself from the existing litera-ture by incorporating a panel data econometric model that controlsfor the unobserved country-specific effects that are correlated withthe level of corruption. Thus, we control for the country-specificfixed effects while estimating the effects of corruption on FDI loca-tion by means of fixed effects (FE) model estimations.
The ModelSince the aim of this article is to empirically disentangle the role
of the corruption level in the host country on the volume of FDIinflows, the investigation will start using a cross-sectional analysis asan initial step to confirm the findings of previous studies. Then apanel data analysis will be employed. Such an approach has distinctadvantages. With panel data use, the sample size is much larger thanwould be the case if just pure time-series or cross-sectional data wereemployed, and so more degrees of freedom and more efficiencyresults in an increase in the reliability of the estimates of the regres-sion coefficients (Baltagi 2005: 5). Thus, our benchmark FDI equa-tion may be built up in the following linear form:
(1) log (FDI / POP)i,t = β0 + �β1 ICRGi,t–1 + �β2 RISKi,t–1+ �β3 log (GDPPC)i,t–1 + β4 GDPGi,t-1+ �β5 OPENi,t–1 + �β6 INFi,t–1 + β7 SCHi,t–1
18485_CATO-R2(pps.):Layout 1 8/7/09 3:55 PM Page 272
273
The Effects of Corruption
+ �β8 POPGi,t–1 + �β9 UPOPGi,t–1+ �β10 AGGLOi,t–1 + β11 LAWi,t–1+ β12 DEMOCi,t–1 + ηi + εi,t.
Where i is the country subscript, t is the time subscript, �βs areunknown parameters to be estimated, ε� is the usual random distur-bance term, and �η is the unobserved country-specific effects. Allexplanatory variables are lagged one year in order to avoid simultane-ity with the dependent variable and taking into account that deci-sions to invest abroad take time. Only the dependent variable andGDP per capita are in logarithm form. (See the Appendix for defini-tions of the variables and data sources.)The main interest of this empirical exercise is the sign and the
magnitude of �β1 (i.e., the marginal effect of corruption on the FDIinflows), while the effects of the control variables are of a secondaryinterest. The dependent variable is total FDI inflows a host countryreceives at time t divided by the host country’s total population (i.e.,FDI per capita).4 The key explanatory variable is the corruption levelin the host country as measured by the International Country RiskGuide (ICRG) corruption index. According to ICRG, “The corrup-tion index measures the financial corruption in the form of demandsfor special payments and bribes connected with import and exportlicense, exchange controls, tax assessments, police protection orloans.” The choice of the control variables is motivated by the related
existing empirical studies and the availability of data. In particular,this article focuses on the host country-locational advantages ofDunning’s (1988) “eclectic paradigm.” Further, Chakrabarti (2001)examines the robustness of the independent variables most com-monly employed in the literature on the determinants of FDI. Heconcludes that the only variable that passes the robustness test is themarket size of the host country measured by GDP per capita. Hethen ranks the country’s openness to trade as the most likely variableto be correlated with FDI, followed by wages, net exports, GDPgrowth rates, tax rates, tariffs, and exchange rates.
4The difference between total FDI inflows and net FDI flows should be clear. Theformer is the total FDI inflows a country has received in a given year, while the lat-ter is defined by total FDI inflows minus total FDI outflows in a given year.
18485_CATO-R2(pps.):Layout 1 8/7/09 3:55 PM Page 273

274
Cato Journal
Thus, to control for the host country’s market size and marketpotential, I use GDP per capita (GDPPC), the growth rate of GDP(GDPG), and the growth rate of population (POPG). The argumentabout the growth rate of population is straightforward. If a country’spopulation is growing very fast, this may serve as a catalyst for FDIinflows. I expect that FDI inflows are positively associated with thesefactors. The degree of openness (OPEN) is measured by the sum ofexports and imports as a percentage of GDP and its effect is expect-ed to be positive. Economic stability is controlled by the inflation rate(INF) in the host countries and we would expect a negative relation-ship. I control for the quality of human capital by the host country’ssecondary school enrollment (% gross) (SCH) and the illiteracy rate(ILL). Stable social and political environment strongly affects FDIand so we control for political risk (RISK). Also, a high degree ofurbanization will tend to encourage FDI inflows since it may alsoimply a high quality of infrastructure and concentrated consumers. Iuse the growth rate of urban population (UPOPG) as a proxy forurbanization. Foreign investors may be attracted to a host countrythat has large existing FDI stocks. It may be viewed as a signal forgood investment environment. Thus, I use the existing FDI stocks asa percentage of GDP in the host country as a proxy for agglomera-tion effects (AGGLO). Finally, I control for the quality of institutions(LAW) and for democratic institutions (DEMOC). I expect that theywill play a positive role in determining the location of FDI.5
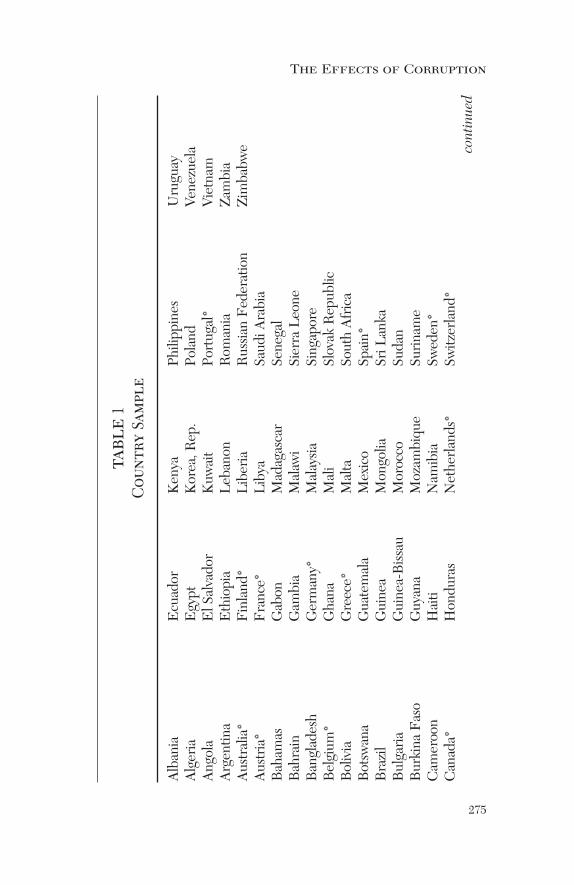
The DataThis article employs panel data for 117 countries (see Table 1)
over the period 1984–2004. All countries (developed and develop-ing) for which data are available over this period are included in thisstudy. I use FDI inflows measured in current U.S. dollars divided bythe host country’s total population as the dependent variable, anddata come from UNCTAD. With respect to the control variables,data on GDP per capita (measured in current U.S. dollars), thegrowth rate of GDP, the degree of openness, the inflation rate, and
5It would have been desirable to control for other institutional variables such as thetime required to start up a new business and the extent of regulations governingmarket entry, but panel data for such variables are not yet available.
18485_CATO-R2(pps.):Layout 1 8/7/09 3:55 PM Page 274
275
The Effects of Corruption
table1
Cou
ntry Sam
ple
Albania
Ecuador
Kenya
Philippines
Uruguay
Algeria
Egypt
Korea, Rep.
Poland
Venezuela
Angola
El Salvador
Kuwait
Portugal*
Vietnam
Argentina
Ethiopia
Lebanon
Romania
Zambia
Australia*
Finland*
Liberia
Russian Federation
Zimbabwe
Austria*
France*
Libya
Saudi Arabia
Bahamas
Gabon
Madagascar
Senegal
Bahrain
Gambia
Malawi
Sierra Leone
Bangladesh
Germany*
Malaysia
Singapore
Belgium
*Ghana
Mali
Slovak Republic
Bolivia
Greece*
Malta
South Africa
Botswana
Guatemala
Mexico
Spain*
Brazil
Guinea
Mongolia
Sri Lanka
Bulgaria
Guinea-Bissau
Morocco
Sudan
Burkina Faso
Guyana
Mozambique
Suriname
Cameroon
Haiti
Namibia
Sweden*
Canada*
Honduras
Netherlands*
Switzerland*
continued
18485_CATO-R2(pps.):Layout 1 8/7/09 3:55 PM Page 275
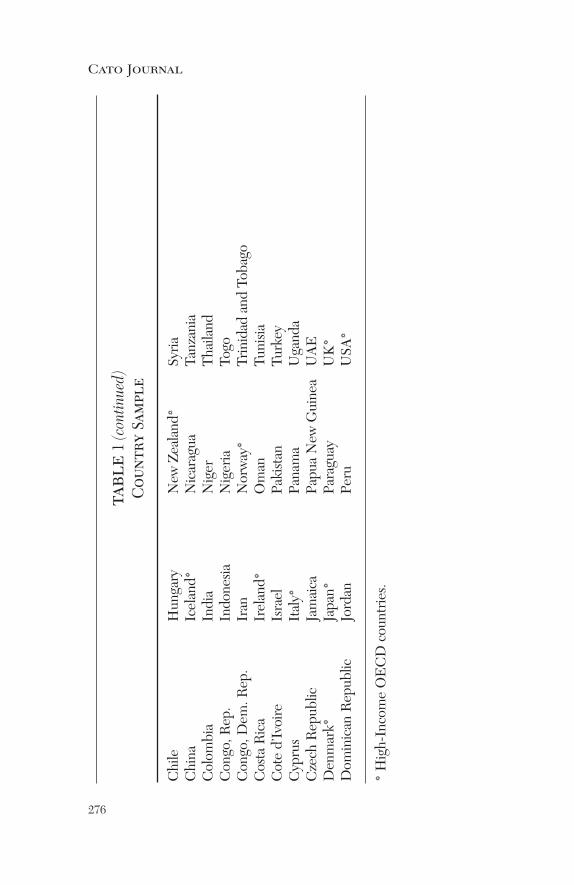
table1 (continued)
Cou
ntry Sam
ple
Chile
Hungary
New Zealand*
Syria
China
Iceland*
Nicaragua
Tanzania
Colombia
India
Niger
Thailand
Congo, Rep.
Indonesia
Nigeria
Togo
Congo, Dem. Rep.
Iran
Norway*
Trinidad and Tobago
Costa Rica
Ireland*
Oman
Tunisia
Cote d’Ivoire
Israel
Pakistan
Turkey
Cyprus
Italy*
Panama
Uganda
Czech Republic
Jamaica
Papua New Guinea
UAE
Denmark*
Japan*
Paraguay
UK*
Dominican Republic
Jordan
Peru
USA*
* High-Income OECD countries.
Cato Journal
276
18485_CATO-R2(pps.):Layout 1 8/7/09 3:55 PM Page 276
277
The Effects of Corruption
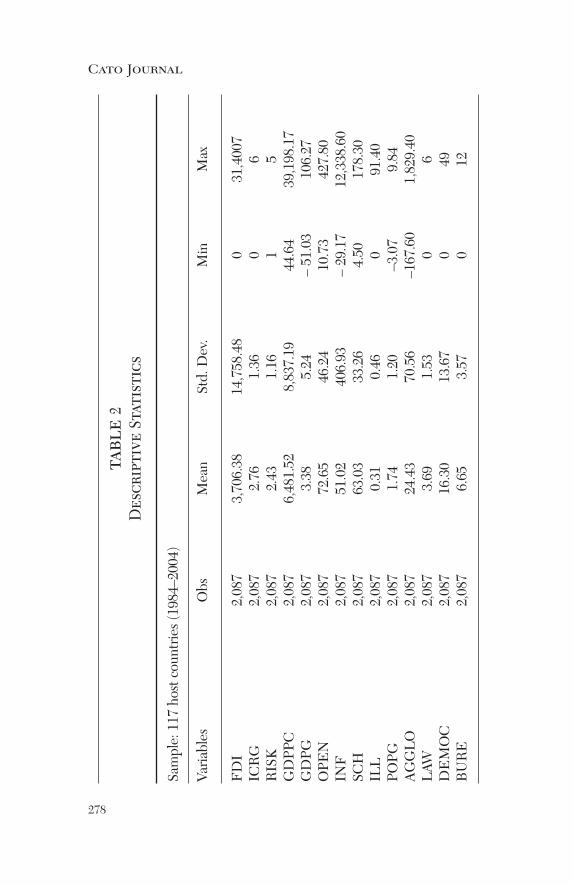
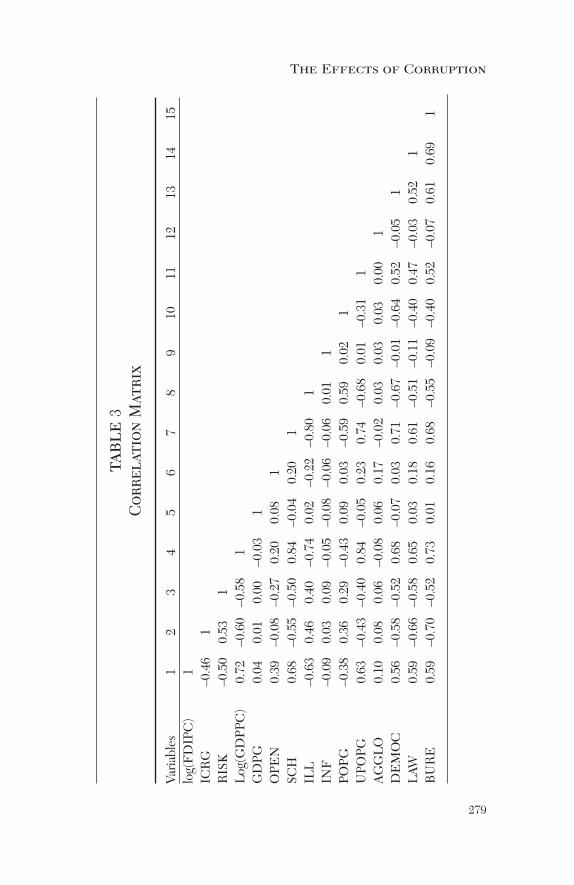
the illiteracy rate come from the World Bank’s World DevelopmentIndicators (WDI 2006). Data on secondary school enrollment comefrom Easterly (2001) and WDI (2006). Corruption (ICRG) is anindex scaled from 6 (highly corrupt) to 0 (highly clean).6 To capturethe institutional quality, I use a law and order index scaled from 0(very low) to 6 (very high). Data on those indices come fromInternational Country Risk Guide. To capture the effects of politicalrisk (RISK), I use an index ranking countries based on a scale of 1(very safe) to 5 (very risky), and data come from Gibney and Dalton(1996). Democracy index (DEMOC) scales countries from 100 (fulldemocracy) to 0 (no democracy), and data come from the Quality of Government Institute. A full description of the data and theirsources is in the Appendix. Table 2 reports the descriptive statisticsand Table 3 reports the correlation matrix for the variables used inthis article.
Empirical ResultsI start with the cross-sectional analysis, as an initial step to confirm
previous studies, using averages for the entire period 1984–2004.Also, to achieve worthwhile results about the impact of corruption, Iwill first sketch out the model without specifying whether the hostcountries are developed or developing. Then I will exclude the highincome-OECD countries from the sample.7
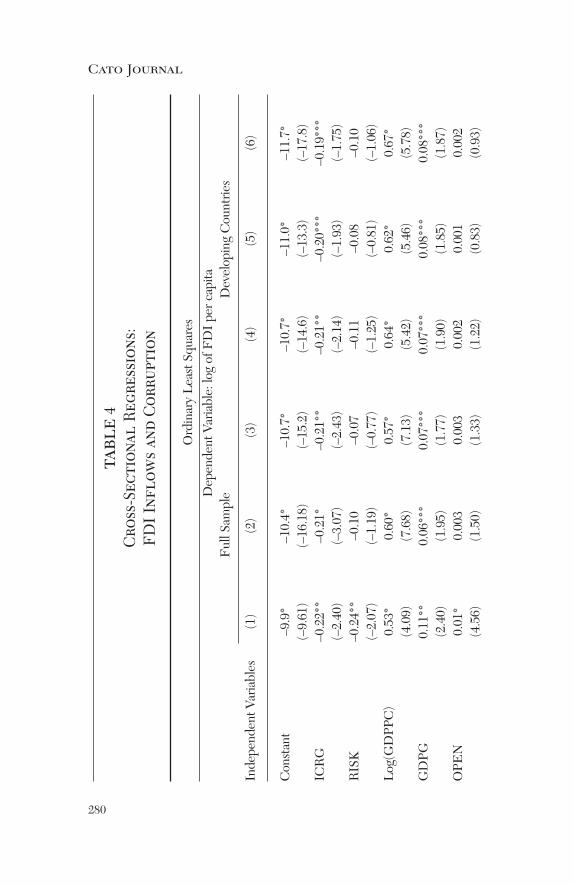
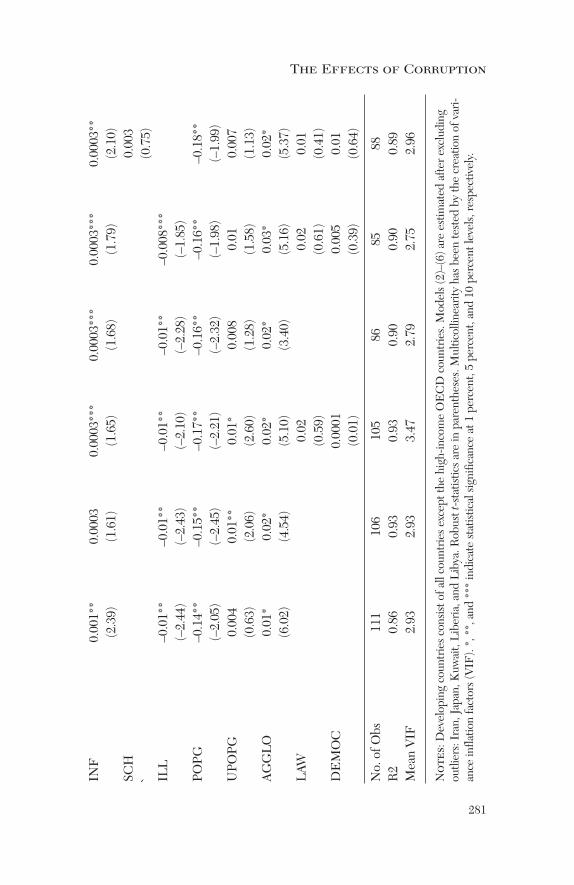
The OLS cross-sectional regression results are presented in Table4. Six different regressions are run. Model (1) employs our full sam-ple (developed and developing countries). Model (2) reports theresults after excluding the outlier observations. Model (3) reports theresults after we add the quality of institution and democracy variablesinto Model (2). Model (4) estimates the model for a sample contain-ing only developing countries. Model (5) reports the results afteradding the quality of institution and democracy variables into Model
6The ICRG index is used rather than other corruption measures because of its wide-spread country coverage. To avoid any confusion in the interpretation, I rescaled themeasure of corruption by 6 minus the ICRG index—therefore zero means highlyclean, while 6 means highly corrupt. 7The high income-OECD countries are Australia, Austria, Belgium, Canada,Denmark, Finland, France, Germany, Greece, Iceland, Ireland, Italy, Japan,Netherlands, New Zealand, Norway, Portugal, Spain, Sweden, Switzerland, UnitedKingdom, and United States.
18485_CATO-R2(pps.):Layout 1 8/7/09 3:55 PM Page 277
278
Cato Journal
table 2
Descriptive Statistics
Sample: 117 host countries (1984–2004)
Variables
Obs
Mean
Std. Dev.
Min
Max
FDI
2,087
3,706.38
14,758.48
031,4007
ICRG
2,087
2.76
1.36
06
RISK
2,087
2.43
1.16
15
GDPPC
2,087
6,481.52
8,837.19
44.64
39,198.17
GDPG
2,087
3.38
5.24
–51.03
106.27
OPEN
2,087
72.65
46.24
10.73
427.80
INF
2,087
51.02
406.93
–29.17
12,338.60
SCH
2,087
63.03
33.26
4.50
178.30
ILL
2,087
0.31
0.46
091.40
POPG
2,087
1.74
1.20
–3.07
9.84
AGGLO
2,087
24.43
70.56
–167.60
1,829.40
LAW
2,087
3.69
1.53
06
DEMOC
2,087
16.30
13.67
049
BURE
2,087
6.65
3.57
012
18485_CATO-R2(pps.):Layout 1 8/7/09 3:55 PM Page 278
279
The Effects of Corruption
table 3
Cor
relation
Matrix
Variables
12
34
56
78
910
1112
1314
15log(FDIPC)
1ICRG
–0.46
1RISK
–0.50
0.53
1Log(GDPPC)
0.72
–0.60
–0.58
1GDPG
0.04
0.01
0.00
–0.03
1OPEN
0.39
–0.08
–0.27
0.20
0.08
1SCH
0.68
–0.55
–0.50
0.84
–0.04
0.20
1ILL
–0.63
0.46
0.40
–0.74
0.02
–0.22
–0.80
1INF
–0.09
0.03
0.09
–0.05
–0.08
–0.06
–0.06
0.01
1PO
PG–0.38
0.36
0.29
–0.43
0.09
0.03
–0.59
0.59
0.02
1UPO
PG0.63
–0.43
–0.40
0.84
–0.05
0.23
0.74
–0.68
0.01
–0.31
1AGGLO
0.10
0.08
0.06
–0.08
0.06
0.17
–0.02
0.03
0.03
0.03
0.00
1DEMOC
0.56
–0.58
–0.52
0.68
–0.07
0.03
0.71
–0.67
–0.01
–0.64
0.52
–0.05
1LAW
0.59
–0.66
–0.58
0.65
0.03
0.18
0.61
–0.51
–0.11
–0.40
0.47
–0.03
0.52
1BURE
0.59
–0.70
–0.52
0.73
0.01
0.16
0.68
–0.55
–0.09
–0.40
0.52
–0.07
0.61
0.69
1
18485_CATO-R2(pps.):Layout 1 8/7/09 3:55 PM Page 279
280
Cato Journal
table4
Cro
ss-Section
al Reg
ressions:
FDI Inflow
s an
d Cor
ruption
Ordinary Least Squares
Dependent Variable: log of FDI per capita
Full Sample
Developing Countries
Independent Variables
(1)
(2)
(3)
(4)
(5)
(6)
Constant
–9.9*
–10.4*
–10.7*
–10.7*
–11.0*
–11.7*
(–9.61)
(–16.18)
(–15.2)
(–14.6)
(–13.3)
(–17.8)
ICRG
–0.22**
–0.21*
–0.21**
–0.21**
–0.20***
–0.19***
(–2.40)
(–3.07)
(–2.43)
(–2.14)
(–1.93)
(–1.75)
RISK
–0.24**
–0.10
–0.07
–0.11
–0.08
–0.10
(–2.07)
(–1.19)
(–0.77)
(–1.25)
(–0.81)
(–1.06)
Log(GDPPC)
0.53*
0.60*
0.57*
0.64*
0.62*
0.67*
(4.09)
(7.68)
(7.13)
(5.42)
(5.46)
(5.78)
GDPG
0.11**
0.06***
0.07***
0.07***
0.08***
0.08***
(2.40)
(1.95)
(1.77)
(1.90)
(1.85)
(1.87)
OPEN
0.01*
0.003
0.003
0.002
0.001
0.002
(4.56)
(1.50)
(1.33)
(1.22)
(0.83)
(0.93)
18485_CATO-R2(pps.):Layout 1 8/7/09 3:55 PM Page 280
281
The Effects of Corruption
INF
0.001**
0.0003
0.0003***
0.0003***
0.0003***
0.0003**
(2.39)
(1.61)
(1.65)
(1.68)
(1.79)
(2.10)
SCH
0.003
`(0.75)
ILL
–0.01**
–0.01**
–0.01**
–0.01**
–0.008***
(–2.44)
(–2.43)
(–2.10)
(–2.28)
(–1.85)
POPG
–0.14**
–0.15**
–0.17**
–0.16**
–0.16**
–0.18**
(–2.05)
(–2.45)
(–2.21)
(–2.32)
(–1.98)
(–1.99)
UPO
PG0.004
0.01**
0.01*
0.008
0.01
0.007
(0.63)
(2.06)
(2.60)
(1.28)
(1.58)
(1.13)
AGGLO
0.01*
0.02*
0.02*
0.02*
0.03*
0.02*
(6.02)
(4.54)
(5.10)
(3.40)
(5.16)
(5.37)
LAW
0.02
0.02
0.01
(0.59)
(0.61)
(0.41)
DEMOC
0.0001
0.005
0.01
(0.01)
(0.39)
(0.64)
No. of O
bs111
106
105
8685
88R2
0.86
0.93
0.93
0.90
0.90
0.89
Mean VIF
2.93
2.93
3.47
2.79
2.75
2.96
Notes:Developing countries consist of all countries except the high-income OECD countries. Models (2)–(6) are estimated after excluding
outliers: Iran, Japan, Kuwait, Liberia, and Libya. Robust t-statistics are in parentheses. M
ulticollinearity has been tested by the creation of vari-
ance inflation factors (VIF). *, **, and *** indicate statistical significance at 1 percent, 5 percent, and 10 percent levels, respectively.
18485_CATO-R2(pps.):Layout 1 8/7/09 3:55 PM Page 281
282
Cato Journal
(4). Model (6) uses a different measure of the quality of human cap-ital (secondary school enrollment).As can be seen from all regression results, the coefficient of cor-
ruption is negative and significant at the 5 percent level, supportingthe findings of Wei (2000a, 2000b), Habib and Zurawicki (2002), andVoyer and Beamish (2004), who find a statistically significant nega-tive relation between the corruption level in the host country and theamount of FDI it receives. The results reported under column (5)show that a one-point increase in the corruption level causes a reduc-tion in per capita FDI inflows by about 20 percent. Thus, ceterisparibus, countries with high levels of corruption over the period1984–2004 have received less FDI per capita.8
Moreover, with the exception of the coefficients produced for theinflation and population growth rate variables, which have the oppo-site signs,9 all the control variables have the expected sign and are sig-nificant at the 5 percent level. As such, they are consistent with theliterature of the determinants of FDI location.Indeed, the cross-sectional regressions show that the levels of cor-
ruption have a negative effect on FDI inflows, and this result is robustto the including of most variables used in the determinants of FDIlocation. Although the cross-sectional analysis is useful to study a long-run relationship, we cannot control for unobserved country-specificeffects which may be correlated with the included independent vari-ables in the model. Therefore, our results, as well as previous existingstudies on the influence of the level of corruption on FDI inflows,which employ cross-sectional regressions, may well reflect otherunmeasured influences that vary across countries but not over time.Our panel data regression results are presented in Table 5. Six dif-
ferent regressions are run. Model (1) employs our full sample (devel-oped and developing countries). Model (2) reports the results after
8Since our dependent variable (FDI per capita) is logged while corruption variableis not, a one-unit changes in the corruption index leads to a proportionate change inper capita FDI inflows. 9One reason for this result may be due to the fact that I employ the average data forthe period 1984–2004. For instance, most Latin American countries had high infla-tion rates during the 1990s but very low rates since 1998. Taking the average of thisvariable would lead to high inflation rates for those countries. However, LatinAmerica has had an increasing growth rate of FDI inflows since the 1990s, whichleads to the wrong sign of this factor. Plausibly, the same argument may be appliedto all variables in our regressions and so we cannot heavily rely on a cross-sectionalanalysis.
18485_CATO-R2(pps.):Layout 1 8/7/09 3:55 PM Page 282

283
The Effects of Corruption
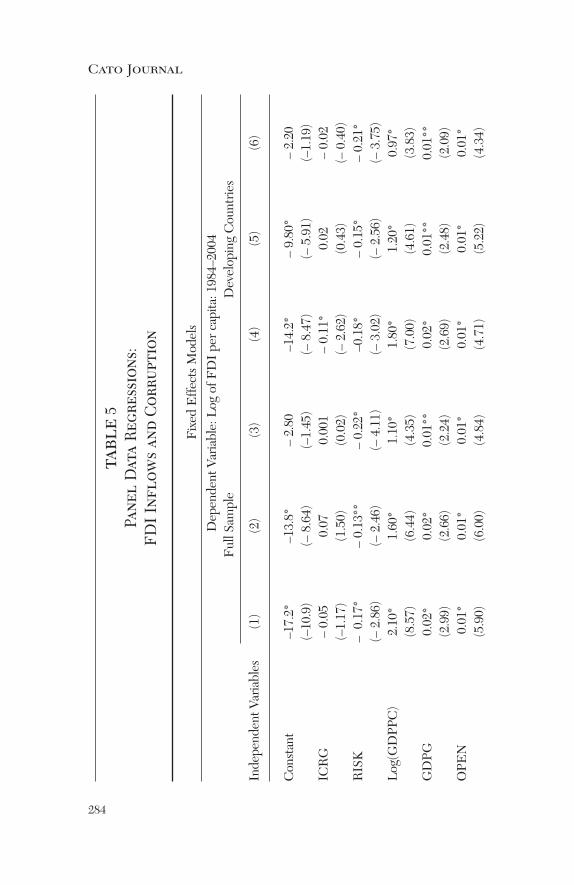
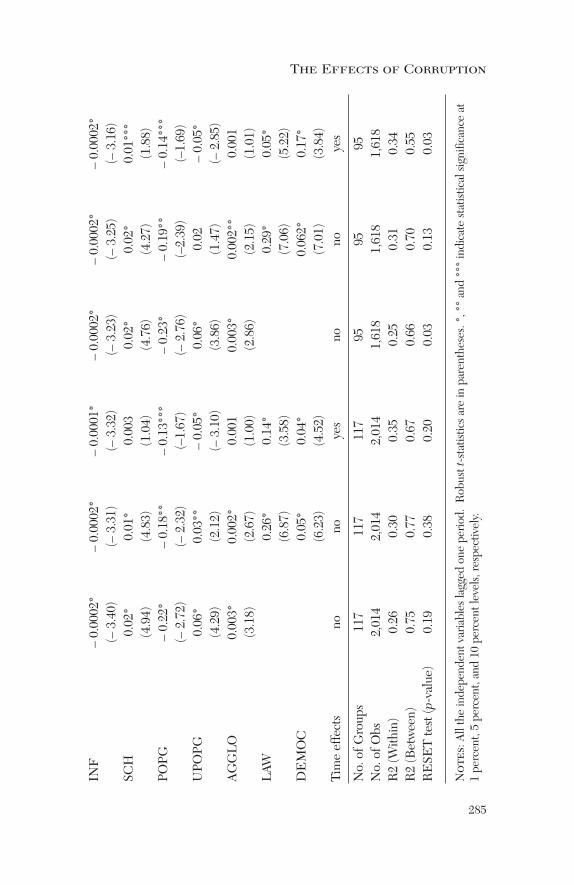
adding the quality of institution and democracy variables into Model(1). Model (3) reports the results after adding time-specific effectsinto Model (2). Model (4) reports the results after excluding thehigh-income OECD countries. Model (5) adds the quality of institu-tion and democracy variables into Model (4). Finally, Model (6) esti-mates Model (5) after adding time-specific effects. The overallmodels are statistically significant and explain about 30 percent of thevariance. Further evaluation of the models is undertaken by applyingthe Ramsey RESET test.10 The results show that we could not rejectthe null hypothesis of the test suggesting no evidence of misspecifi-cation of functional forms except in Models (4) and (6). The corre-sponding p-values of the test are reported at the bottom of Table 2.
The Effects of Corruption
As can be seen from Models (1) and (4) the coefficient of corrup-tion is negative although insignificant in Model (1), but highly signif-icant when we exclude the high-income OECD countries from oursample. Again, this result confirms the previous work, which finds anegative association between the corruption level in the host countryand FDI inflows. That is, ceteris paribus, a one-point increase in thecorruption index causes a reduction in per capita FDI inflows by 11percent, which is lower than the cross-sectional regression effect.Apparently, the correction for unobserved country-specific effectshas a substantial impact on the estimates. Based on the resultsreported under column (4), the estimated coefficient of corruptiondeclined from 0.21 in the OLS regression to 0.11 in the FE regres-sion. However, once we control for the quality of institutions in thehost country, the negative effect disappears. Surprisingly, the effectbecomes positive although insignificant in Models (2) and (5). Oneexplanation to this result is that the negative relationship between thecorruption level and FDI inflows can be attributed to the failure tocontrol for the quality of institutions in previous studies. However,the results should not be interpreted as evidence that the corruptionlevel in the host country does not reduce the amount of FDI it
10The Ramsey regression equation specification error test (RESET) is a generalspecification test to test whether nonlinear combinations of the estimated valueshelp explain the dependent variable. The idea behind the test is that, if nonlinearcombinations of the explanatory variables have any power in explaining the depend-ent variable, then the model is misspecified (Wooldridge 2002: 281–83).
18485_CATO-R2(pps.):Layout 1 8/7/09 3:55 PM Page 283
284
Cato Journal
table5
Pane
l Data Reg
ressions:
FDI Inflow
s an
d Cor
ruption
Fixed Effects Models
Dependent Variable: Log of FDI per capita: 1984–2004
Full Sample
Developing Countries
Independent Variables
(1)
(2)
(3)
(4)
(5)
(6)
Constant
–17.2*
–13.8*
– 2.80
–14.2*
– 9.80*
– 2.20
(–10.9)
(– 8.64)
(–1.45)
(– 8.47)
(– 5.91)
(–1.19)
ICRG
– 0.05
0.07
0.001
– 0.11*
0.02
– 0.02
(–1.17)
(1.50)
(0.02)
(– 2.62)
(0.43)
(– 0.40)
RISK
– 0.17*
– 0.13**
– 0.22*
–0.18*
– 0.15*
– 0.21*
(– 2.86)
(– 2.46)
(– 4.11)
(– 3.02)
(– 2.56)
(– 3.75)
Log(GDPPC)
2.10*
1.60*
1.10*
1.80*
1.20*
0.97*
(8.57)
(6.44)
(4.35)
(7.00)
(4.61)
(3.83)
GDPG
0.02*
0.02*
0.01**
0.02*
0.01**
0.01**
(2.99)
(2.66)
(2.24)
(2.69)
(2.48)
(2.09)
OPEN
0.01*
0.01*
0.01*
0.01*
0.01*
0.01*
(5.90)
(6.00)
(4.84)
(4.71)
(5.22)
(4.34)
18485_CATO-R2(pps.):Layout 1 8/7/09 3:55 PM Page 284
285
The Effects of Corruption
INF
– 0.0002*
– 0.0002*
– 0.0001*
– 0.0002*
– 0.0002*
– 0.0002*
(– 3.40)
(– 3.31)
(– 3.32)
(– 3.23)
(– 3.25)
(– 3.16)
SCH
0.02*
0.01*
0.003
0.02*
0.02*
0.01***
(4.94)
(4.83)
(1.04)
(4.76)
(4.27)
(1.88)
POPG
– 0.22*
– 0.18**
– 0.13***
– 0.23*
– 0.19**
– 0.14***
(– 2.72)
(– 2.32)
(–1.67)
(– 2.76)
(–2.39)
(–1.69)
UPO
PG
0.06*
0.03**
– 0.05*
0.06*
0.02
– 0.05*
(4.29)
(2.12)
(– 3.10)
(3.86)
(1.47)
(– 2.85)
AGGLO
0.003*
0.002*
0.001
0.003*
0.002**
0.001
(3.18)
(2.67)
(1.00)
(2.86)
(2.15)
(1.01)
LAW
0.26*
0.14*
0.29*
0.05*
(6.87)
(3.58)
(7.06)
(5.22)
DEMOC
0.05*
0.04*
0.062*
0.17*
(6.23)
(4.52)
(7.01)
(3.84)
Time effects
nono
yes
nono
yes
No. of G
roups
117
117
117
9595
95No. of O
bs2,014
2,014
2,014
1,618
1,618
1,618
R2 (Within)
0.26
0.30
0.35
0.25
0.31
0.34
R2 (Between)
0.75
0.77
0.67
0.66
0.70
0.55
RESET test (p-value)
0.19
0.38
0.20
0.03
0.13
0.03
Notes:All the independent variables lagged one period. Robust t-statistics are in parentheses. *, ** and *** indicate statistical significance at
1 percent, 5 percent, and 10 percent levels, respectively.
18485_CATO-R2(pps.):Layout 1 8/7/09 3:55 PM Page 285
286
Cato Journal
receives. Rather, one should view the results as an indication of theimportance of the quality of institutions. In other words, as we dis-cussed above, corruption is an illegal activity and so the willingnessto engage in corrupt activities depends on the penalty imposed andon the probability of being caught (Becker 1968). Therefore, if acountry has good-quality institutions, it may still be able to attractmore FDI inflows despite its level of corruption.
The Effects of the Control Variables
All the control variables have the expected effects and are signifi-cant at the 1 percent level. The population growth rate still has anopposite sign though. The results are consistent with the existing lit-erature. The host country’s market size measured by per capita GDPis positive and highly significant at the 1 percent level. The growthrate of GDP, which is a proxy for market potential, is also positivelyand statistically significant at the 1 percent level, which implies thatforeign investors are forward-looking. This finding is consistent withthe hypothesis that market-seeking FDI is attracted to a country withlarge market size and its economy is growing over time. On the otherhand, the growth rate of population is found to have a negative effectcontrary to the hypothesis set forth. The effect of the degree of open-ness is also positive and statistically significant at the 1 percent level.The quality of human capital is also positive and significant at the 1percent level, so FDI is attracted to a country with high levels ofskilled labor.11
The results show strong support for the existence of the expectednegative relationship between FDI inflows and political risk. Also,macroeconomic instability measured by the inflation rate negativelyaffects FDI inflows. Both variables are statistically significant at the1 percent level in all models. The degree of urbanization measuredby the urban population growth appears to positively affect theinvestment decisions of FDI location although the effect sometimesis not significant. Moreover, agglomeration effects exhibit a highdegree of statistical significance and have positive impacts on FDIinflows, implying that past FDI in the host country attracts new FDIinflows. Finally, the coefficients of the institutional quality and dem-
11Also, in unreported regressions, the illiteracy rate was used as another proxy for thequality of human capital. The coefficient was negative and statistically significant atthe 1 percent level. The full results are available from the author upon request.
18485_CATO-R2(pps.):Layout 1 8/7/09 3:55 PM Page 286
287
The Effects of Corruption
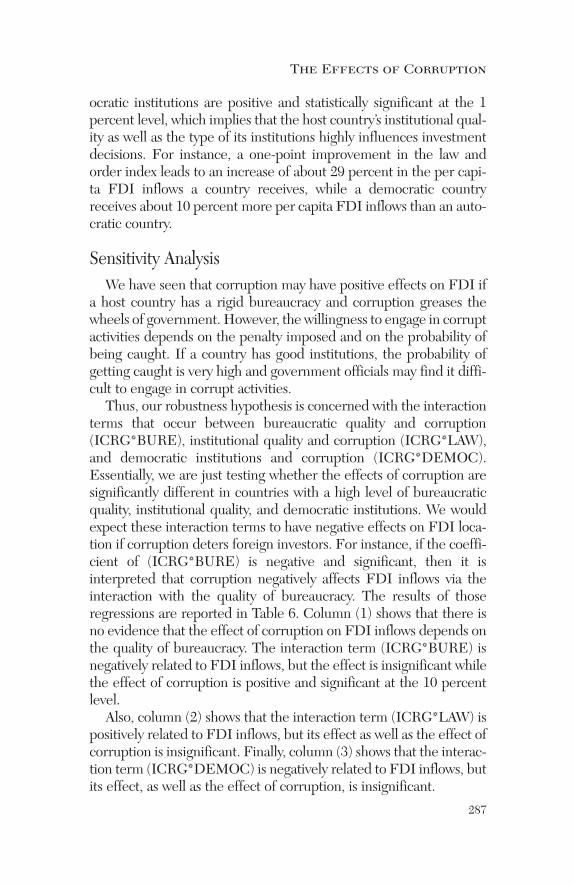
ocratic institutions are positive and statistically significant at the 1percent level, which implies that the host country’s institutional qual-ity as well as the type of its institutions highly influences investmentdecisions. For instance, a one-point improvement in the law andorder index leads to an increase of about 29 percent in the per capi-ta FDI inflows a country receives, while a democratic countryreceives about 10 percent more per capita FDI inflows than an auto-cratic country.
Sensitivity AnalysisWe have seen that corruption may have positive effects on FDI if
a host country has a rigid bureaucracy and corruption greases thewheels of government. However, the willingness to engage in corruptactivities depends on the penalty imposed and on the probability ofbeing caught. If a country has good institutions, the probability ofgetting caught is very high and government officials may find it diffi-cult to engage in corrupt activities.Thus, our robustness hypothesis is concerned with the interaction
terms that occur between bureaucratic quality and corruption(ICRG*BURE), institutional quality and corruption (ICRG*LAW),and democratic institutions and corruption (ICRG*DEMOC).Essentially, we are just testing whether the effects of corruption aresignificantly different in countries with a high level of bureaucraticquality, institutional quality, and democratic institutions. We wouldexpect these interaction terms to have negative effects on FDI loca-tion if corruption deters foreign investors. For instance, if the coeffi-cient of (ICRG*BURE) is negative and significant, then it isinterpreted that corruption negatively affects FDI inflows via theinteraction with the quality of bureaucracy. The results of thoseregressions are reported in Table 6. Column (1) shows that there isno evidence that the effect of corruption on FDI inflows depends onthe quality of bureaucracy. The interaction term (ICRG*BURE) isnegatively related to FDI inflows, but the effect is insignificant whilethe effect of corruption is positive and significant at the 10 percentlevel.Also, column (2) shows that the interaction term (ICRG*LAW) is
positively related to FDI inflows, but its effect as well as the effect ofcorruption is insignificant. Finally, column (3) shows that the interac-tion term (ICRG*DEMOC) is negatively related to FDI inflows, butits effect, as well as the effect of corruption, is insignificant.
18485_CATO-R2(pps.):Layout 1 8/7/09 3:55 PM Page 287
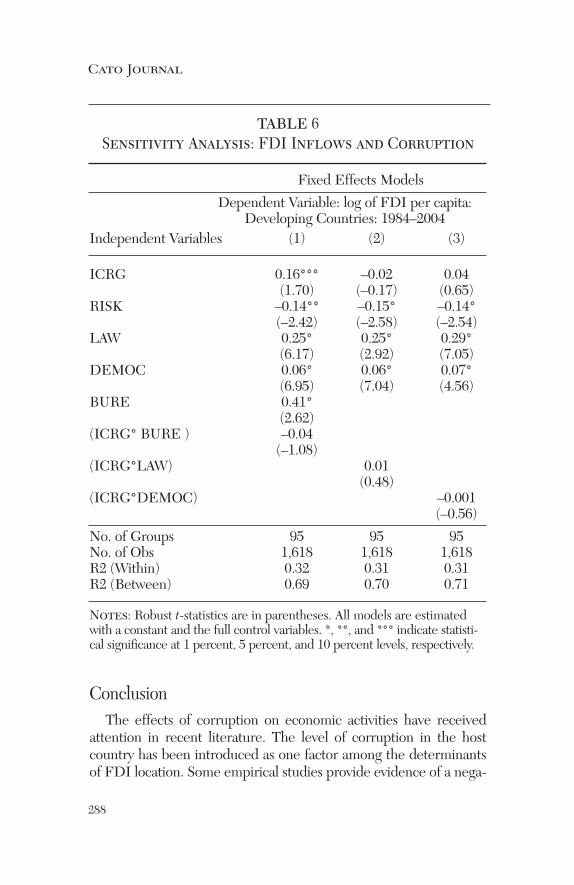
table 6Sensitivity Analysis: FDI Inflows and Corruption
Fixed Effects Models
Dependent Variable: log of FDI per capita:Developing Countries: 1984–2004
Independent Variables (1) (2) (3)
ICRG 0.16*** –0.02 0.04(1.70) (–0.17) (0.65)
RISK –0.14** –0.15* –0.14*(–2.42) (–2.58) (–2.54)
LAW 0.25* 0.25* 0.29*(6.17) (2.92) (7.05)
DEMOC 0.06* 0.06* 0.07*(6.95) (7.04) (4.56)
BURE 0.41*(2.62)
(ICRG* BURE ) –0.04(–1.08)
(ICRG*LAW) 0.01(0.48)
(ICRG*DEMOC) –0.001(–0.56)
No. of Groups 95 95 95No. of Obs 1,618 1,618 1,618R2 (Within) 0.32 0.31 0.31R2 (Between) 0.69 0.70 0.71
Notes: Robust t-statistics are in parentheses. All models are estimatedwith a constant and the full control variables. *, **, and *** indicate statisti-cal significance at 1 percent, 5 percent, and 10 percent levels, respectively.
ConclusionThe effects of corruption on economic activities have received
attention in recent literature. The level of corruption in the hostcountry has been introduced as one factor among the determinantsof FDI location. Some empirical studies provide evidence of a nega-
Cato Journal
288
18485_CATO-R2(pps.):Layout 1 8/7/09 3:55 PM Page 288

tive link between corruption and FDI inflows, while others fail tofind such a relationship. Most existing studies are largely based on across-sectional analysis that cannot account for unobserved country-specific effects with which the corruption level is correlated. In addi-tion, the simultaneity between corruption and FDI is ignored.This article has sought to answer the following question:
Controlling for other determinants of FDI location, does a corrupthost country receive less or more FDI inflows? To test this hypothe-sis, I employ data for 117 countries over the period 1984–2004 andintroduce two different econometric methods, different panel datasets, and a much wider set of control variables. The empirical evidence presented in this article can be summa-
rized as follows: The cross-sectional regressions are consistent withthe argument that corruption deters foreign investors. However, aswe move to panel data methods, the negative impacts of corruptiondisappear once we control for the host country’s institutional quality,suggesting that foreign investors value the quality of institutionsmore than the level of corruption in the location selection. However,the results should not be interpreted as evidence that the corruptionlevels in the host country do not reduce the amount of FDI itreceives. Rather, the results should be seen as an indication of theimportance of the quality of institutions.This study has some limitations. First, FDI inflows can be nega-
tive, so the logarithm of FDI may be problematic because the nega-tive observations would be automatically dropped. Excluding thoseobservations from our sample may bias our results. Another limita-tion of this study is that it uses aggregated data on FDI inflows.Foreign investors operating within the same host country may havedifferent degrees of sensitivity to changes in the host country’s cor-ruption level, so one should examine the effects of corruption onFDI inflows based on the nature of different sectors and industries.Development of sectoral and industrial data would prevent potentialbiases in evaluating the effects of corruption on FDI inflows. I believe the potential for future research along these lines is warranted.
Appendix: Definitions of Variables and Their SourcesForeign Direct Investment (FDI), (in millions of current US$):
FDI is defined as investment that is made to acquire a lasting man-
The Effects of Corruption
289
18485_CATO-R2(pps.):Layout 1 8/7/09 3:55 PM Page 289
290
Cato Journal
agement interest (usually 10 percent of voting stock) in an enterpriseoperating in a country other than that of the investor (definedaccording to residency), the investor’s purpose being an effectivevoice in the management of the enterprise. It is the sum of equitycapital, reinvestment of earnings, other long-term capital, and short-term capital as shown in the balance of payments (UNCTAD 2006). GDPPC: Gross Domestic Product (in current US$) divided by
midyear population (WDI 2006). GDPG: Growth rate of GDP (annual %) (WDI 2006).INF: Inflation, GDP deflator (annual %) (WDI 2006). POPG: Growth rate of Urban population (Annual %) (WDI
2006).UPOPG: Growth rate of urban population: urban population is
the midyear population of areas defined as urban in each country andreported to the United Nations (WDI 2006).AGGLO: FDI stock and a percentage of GDP. FDI stock is the
value of the share of their capital and reserves (including retainedprofits) attributable to the parent enterprise, plus the net indebted-ness of affiliates to the parent enterprises. (UNCTAD 2006).SCH: School Enrollment, Secondary (% gross). Gross enrollment
ratio is the ratio of total enrollment, regardless of age, to the popula-tion of the age group that officially corresponds to the level of edu-cation shown. Secondary education completes the provision of basiceducation that began at the primary level, and aims at laying thefoundations for lifelong learning and human development, by offer-ing more subject- or skill-oriented instruction using more specializedteachers. Ratios above 100 percent in some cases suggest that somestudents are attending this school at ages outside the student ranges.For the years from 1982 to 1998, data are obtained from WorldBank’s Global Development Network Growth Database provided byEasterly (2001). And from 1999 to 2004, data are obtained from(WDI 2006).ILL: Illiteracy rate of persons aged 15 years and over. Adult liter-
acy rate is the percentage of people ages 15 and above who can, withunderstanding, read and write a short, simple statement on theireveryday life (International Labour Organization). OPEN: Trade (% of GDP): Trade is the sum of exports and
imports of goods and services measured as a share of gross domesticproduct (WDI 2006).
18485_CATO-R2(pps.):Layout 1 8/7/09 3:55 PM Page 290
291
The Effects of Corruption
ICRG: International Country Risk Guide corruption index: Thedata are yearly, and cover the period 1984–2004. The index indicatesthe opinion of analysts on each country regarding the extent to which“high government officials are likely to demand special payments”and “illegal payments are generally expected throughout lower levelsof government” in the form of “bribes connected with import andexport licenses, exchange controls, tax assessment, policy protectionor loans” (Knack and Keefer 1995: 225). Countries are scored from0 (very corrupt) to 6 (very clean). I transformed the data to make theresults easier to follow by subtracting the index from 6, so that highvalues of the index mean a higher level of corruption).LAW: An index from 0 (very low) to 6 (very high), measuring the
strength of Law and Order. The Law subcomponent is an assessmentof the strength and impartiality of the legal system, while the Ordersubcomponent is an assessment of popular observance of the law.Thus, a country can enjoy a high rating (3) in terms of its judicial sys-tem, but a low rating (1) if it suffers from a very high crime rate of ifthe law is routinely ignored without effective sanction—for example,widespread illegal strikes (Knack and Keefer 1995: 225).RISK: Political Terror Scale: 1 (very safe) and 5 (very risky).
Countries are coded on a scale of 1 to 5 according to their level ofterror the previous year according to the descriptions of these coun-tries provided in the Amnesty International and U.S. StateDepartment Country Report. These levels are:
• Level 1: Countries under a secure rule of law, people are notimprisoned for their views, and torture is rare or exceptional.Political murders are extremely rare.
• Level 2: There is a limited amount of imprisonment for nonvio-lent political activity. However, few persons are affected, tortureand beatings are exceptional. Political murder is rare.
• Level 3: There is extensive political imprisonment, or a recenthistory of such imprisonment. Execution or other political mur-ders and brutality may be common. Unlimited detention, withor without a trial, for political views is accepted.
• Level 4: The practices of level 3 are expanded to larger num-bers. Murders, disappearances, and torture are a common partof life. In spite of its generality, on this level terror affects thosewho interest themselves in politics or ideas.
18485_CATO-R2(pps.):Layout 1 8/7/09 3:55 PM Page 291

292
Cato Journal
• Level 5: The terrors of level 4 have been expanded to the wholepopulation. The leaders of these societies place no limits on themeans or thoroughness with which they pursue personal or ide-ological goals.
DEMOC: Index of Democratization: the index combines twobasic dimensions of democracy—competition and participation—measured as the percentage of votes not cast for the largest party(competition) times the percentage of the population who actuallyvoted in the election (participation). This product is divided by 100to form an index that could vary from 0 (no democracy) to 100 (fulldemocracy). Competition is calculated by subtracting the percentageof the votes won by the largest party from 100. Participation isdefined as the percentage of the total population who actually votedin the election.
ReferencesAbed, G., and Davoodi, H. (2000) “Corruption, Structural Reformsand Economic Performance in the Transition Economies.” IMFWorking Paper No. 132. Washington: International MonetaryFund.
Akçay, S. (2001) “Is Corruption an Obstacle for Foreign Investors inDeveloping Countries? A Cross-Country Evidence.” Yapi KrediEconomic Review 12 (2): 27–34.
Baltagi, B. (2005) Econometric Analysis of Panel Data. 3rd ed.Hoboken, N.J.: John Wiley.
Bardhan, P. (1997) “Corruption and Development: A Review ofIssues.” Journal of Economic Literature 25: 1320–46.
Becker, G. (1968) “Crime and Punishment: An EconomicApproach.” Journal of Political Economy 76 (2): 169–217.
Chakrabarti, A. (2001) “The Determinants of Foreign DirectInvestment: Sensitivity Analyses of Cross-Country Regression.”Kyklos 54 (1): 89–114.
Dunning, J. (1988) “The Eclectic Paradigm of InternationalProduction: A Restatement and Some Possible Extensions.”Journal of International Business Studies 19: 1–29.
Easterly, W. (2001) “The Lost Decades: Developing Countries’Stagnation in Spite of Policy Reform 1980–1998 Dataset.” SeeGlobal Development Network Growth Database, World Bank(www.worldbank.org/research/growth).
18485_CATO-R2(pps.):Layout 1 8/7/09 3:55 PM Page 292
Gibney, M., and Dalton, M. (1996) “The Political Terror Scale.” In S.S. Nagel and D. L. Cingranelli (eds.) Human Rights andDeveloping Countries. Greenwich, Conn.: JAI Press.
Gupta, S.; Davoodi, H.; and Tiongson, E. (2000) “Corruption and theProvision of Health Care and Education Services.” IMF WorkingPaper No. 116. Washington: International Monetary Fund.
Gupta, S.; Davoodi, H.; and Alonso-Terme, R. (1998) “DoesCorruption Affect Income Inequality and Poverty?” IMFWorking Paper No. 76. Washington: International MonetaryFund.
Habib, M., and Zurawicki, L. (2002) “Corruption and Foreign DirectInvestment.” Journal of International Business Studies 33 (2):291–307.
Hines, J. (1995) “Forbidden Payment: Foreign Bribery andAmerican Business after 1977.” NBER Working Paper No. 5266.
Houston, D. (2007) “Can Corruption Ever Improve an Economy?”Cato Journal 27 (3): 325–42.
IGRG (2006) International Country Risk Guide: Political Risk. PRSGroup. Available at www.icrgonline.com/default.aspx.
Kaufmann, D., and Wei, S. (1999) “Does ‘Grease Money’ Speed Upthe Wheels of Commerce?” NBER Working Paper No. 7093.
Knack, S., and Keefer, P. (1995) “Institutions and EconomicPerformance: Cross–Country Tests Using Alternative InstitutionalMeasures.” Economics and Politics 7: 207–27.
Li, H.: Xu, L. C.; and Zou, H. F. (2000) “Corruption, IncomeDistribution, and Growth.” Economics and Politics 12 (2): 155–82.
Macrae, J. (1982) “Underdevelopment and the Economics ofCorruption: A Game Theory Approach.” World Development 10(8): 677–87.
Mauro, P. (1995) “Corruption and Growth.” Quarterly Journal ofEconomics 110 (3): 681–712.
Smarzynska, B., and Wei, S. (2002) “Corruption and theComposition of Foreign Direct Investment: Firm-levelEvidence.” NBER Working Paper No. 7969.
Swaleheen, M., and Stansel, D. (2007) “Economic Freedom,Corruption, and Economic Growth.”Cato Journal 27 (3): 343–58.
Tanzi, V., and Davoodi, H. (1997) “Corruption, Public Investmentand Growth.” IMF Working Paper No. 139. Washington:International Monetary Fund.
The Effects of Corruption
293
18485_CATO-R2(pps.):Layout 1 8/7/09 3:55 PM Page 293
294
Cato Journal
Teorell, Jan; Holmberg, S.; and Rothstein, B. (2006) The Quality ofGovernment Dataset, version 15 (November). GöteborgUniversity: The Quality of Government Institute. Available atwww.qog.pol.gu.se.
UNCTAD (2006) World Investment Report. Geneva, Switzerland:United Nations Conference on Trade and Development.Available at www.unctad.org/sections/dite_dir/docs/wir2006_inflows_en.xls.
Voyer, P., and Beamish, P. (2004) “The Effect of Corruption onJapanese Foreign Direct Investment.” Journal of Business Ethics50: 211–24.
WDI (2006) World Bank, World Development Indicators 2006.Washington: World Bank.
Wei, S. (2000a) “How Taxing Is Corruption on InternationalInvestors.” Review of Economics and Statistics 82: 1–11.
________ (2000b) “Local Corruption and Global Capital Flows.”Brookings Papers on Economic Activity 2: 303–46.
Wheeler, D., and Mody, A. (1992) “International InvestmentLocation Decisions: The Case of U.S. Firms.” Journal ofInternational Economics 33: 57–76.
Wooldridge, J. (2002) Introductory Econometrics: A ModernApproach. 2nd ed. New York: South-Western.
18485_CATO-R2(pps.):Layout 1 8/7/09 3:55 PM Page 294