Embed Size (px)
Citation preview

WRRC Bulletin 59
The Effects of Enrichment on Lake Superior Periphyton
By
Robert R ~elson
Assistant Professor Environmental Health Department of Allied Health
University of Visconsin - Eau Claire
Theron O Odlaug Professor and Head
Department of Biology University of finnesota Duluth
Blanchard O Krogstad Professor of Biology
Department of Biology University of ~Iinnesota Duluth
Orlando R Rusehmeyer Assistant Professor of Publie Health Biology
School of Public Health University of Minnesota ~Iinneapolis
Theodore A Olson Professor of Public Health Biology
School of Public Health University of ~linnesota ~linneapolis
The work upon which this publication is based was supported by funds provided by the United States Department of the Interior as
authorized under the Water Resources Research Act of 1964 Public Law 88-379
May 1973 Minneapolis Minnesota
WATER RESOURCES RESEARCH CENTER UNIVERSITY OF MINNESOTA
GRADVATE SCHOOL
FOREWORD
This Bulletin is pub1i in furtherance of the purposes of the Federal Water Resources Research Act of 1964 The purposf of the Act is to stimulate sponsor provide for and supplement present programs for the conduct of research investigtions experiments and the trainshying of scientists in the field of ~ater and resources which affect water The Act is promoting 1 more aCHlultJte National program of water resources research by furnishing nancial assistance to non-Federal research
The Act provides for stab] ishment f Jater Resources Research Censhyters at Universiticmiddots throughollt the Nation On Septtmber 1 1964 a Water Resources Research (111 Let ws es tab 1 i shed in Gradult1te School as an Interdisciplinarv component of the University Minnesota Tht Center has the responsibili for unifying and stimulilt ing University water resources research through the administration of funds covered in the Act and made avail ]gtl bv sources coordinating liniversity research with waler resources programs or local State and Federal agenshycies and private organi ions throughout the State and isting in training additiolwl scicnlis for ork in the field of ater reSOtlrcts through research
This Bulletin is numher 59 in il sed f pub iOllS designCd present information benri on wnter resources rescarch in Hinnesota and the results of some of the res(gt1rch sponsored bv the Center Thi letin
ois concerned with the possiblc changes which would take place in Superior periphyton i[ Iluling or enriching substances were added to the lake water A means for ass(ssing thl possible changes taking pial is described to assist water mmwgers i monitoring tIlE water qual tv of Lake Superior
This Bulletin serves the Res(nrch Project Technical (ompletion Report for the fo11olting C-nter project
No 14-J-OOOl-109S
Ecol of Ncnrshore Periphvton of Superior
1 A Olson Schoo 1 of Pub Health Hlliv of Minn June 1n ] 972
Pub1 Abstract
The primary obj () r t111 s research as carried out in tlw summer fall of 1969 and 1970 ~ltlS to rmine the possible changeS which ould take place in Lake Superior peri phvton hen pollut ing or enriching substaIH~es were added to the Jake Hater To end two naturl rock basins constructed at the lakes long tllL north shore at Castle Danger Minneshysota for the purpos( of exposing naturcll1y grown and regrot4th periphyton
05-A
to higher-than-normal levels of phosphate and nitrate At weekly intervals samples were collected and productivity was measured by enumeration of organisms chlorophyll analysis and weight dry and organic
Lake Superi or periphyton responds draJlk1t ical1 y to increased additi ons of phosphorus and nitrogen If the ncar-shore area of Lake Superior ever received nutrients such 85 those added to the experimental test pool at Castle Danger a drastic change in the Lakes biota could occur For exshyample as enrichment increased the predominant clean-water diatom forms could eventually be replaced by the more tolerant green or blue-green algae In addition the very composition of the macrobenthic forms found in Lake Supertor could be altered as a result of their dependence on the periphyton which as primary producers form the first link in the food chain Likeshywise certain fish which depend on henthic organisms for their food may be dverse Iy affected as an indirect result of a changing periphyton community
Having established that enrichment of Lake Superior water will drnmshyaticlly change the normal periphyton growth another baseline has been pstablished for future reference in the event that phosphorus and nitrogen r 1ch wastes should be adden to the 1 ake certain types of algae appear as replacements of the normal flora now characterizing the periphyton and the productivity increases one will have a means [or assessing the posshysible changes taking place j the water quality of Lake Superior
liltation Descrlptor~ Periphyton Nutrients Lake Superior Producshytivity Minnesota Algae Phosphates Nitrates Pollution
ion ltComplete Nutrient Media Control Pool Test Pool
TAllLE OF mNTENTS
CHAPTER PAGE
1 INTRODUCTION 1
II bull REVIEW OF THE LITERATURE J
Significance of Periphyton 1
Basic J
ann the food web 3
Periphyton as a source of plankton organisms 4
a pollution indicator 4
Some Environmental [-actors 5
Types of periphyton environments
Periphyton and the physical environment 5
Periphyton anli the chemical environment 6
Ieriphyton and the biological environment
Tchnl1ue
Peripilyton removal
Direct observations
Observations on artificial suhstrate
~aturl substrata bullbull
Quantitative measurements
Chemical Factors GrmJth
Basie nutrient requirements for algae
Sources of nutrients
The effect of [nrlcbment on Il]nkton and
Field Observations
ii i
6
7
7
8
)
10
11
12
13
17
Periphyton 17
18
11
CHAPTER PAGE
Artificial enrichment experiments 19
Xethod of nutrient delivery 24
Nutrient Levels in Lake Superior 24
III MATERIALS AND HETHODS 29
Project Site Selection 29
Construction of Experimental Pools 29
General layout and construction details bull 29
Water circulating system 31
Construction of pumphouse and instrument shelter 33
Calibration of pool system bull 33
Field and Laboratory Procedures 1969 35
Chemical procedures 35
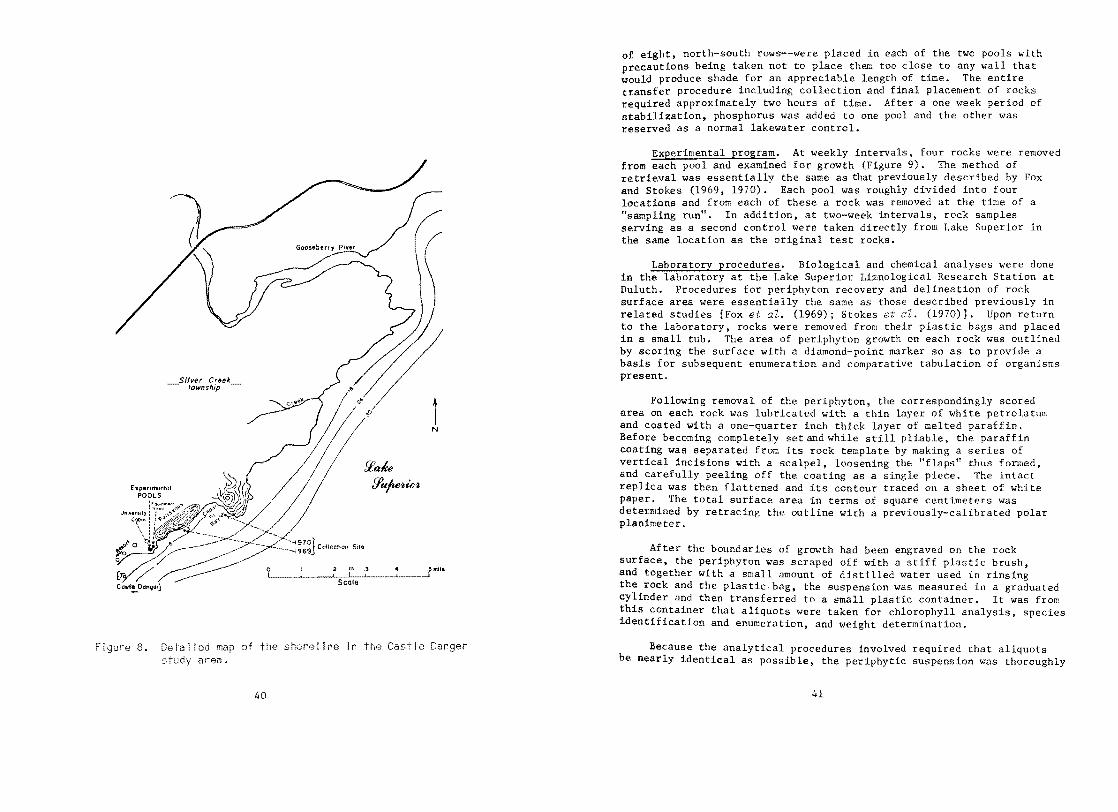
Collection of field materials for enrichment studies 39
Experimental program 41
Laboratory procedures 41
Chlorophyll analysis 43
Gravimetric analysis 44
Identification and enumeration of organisms 44
Field and Laboratory Procedures 1970 45
Xodification and improvement of the facility 45
Chemical procedures 46
Collection of field materiRls fClr enrichment studies 48
Experimental program 49
Laboratory procedure 49
iv
ctLPTER PAGE
Laboratory studies 50
Field records and observations 51
IV RFSlLTS AND DISCUSSION 53
Description of Sa~pling Area 53
rinding~ 1969 53
Ceneral program 53
atural periphyton Castle Danger 54
Nlturl1 Per iphyton experimental pools 61
Supplementary observations 71
indinf~ 1)70 76
Ceneral program 76
Incukltor studies 77
iatural periphyton Castle Danger 79
Naturl pcri11vtcn experimental pools 80
lCefymth periphyton ecperimental pools 113
h1ater tcrlperatures Castle Danger 142
Supp1 emen tary 01serva tions 118
l SUlllIARY AiD COCUJSICJNS 152
Possible Future Studies 156
])IJLIOGRAPHY bull bull bull 157
APPENDIX A (Calculations for ArrivinK at Chemical DosRKe RRtes Rt Castle Danger) 171
APPENDIX )j (SumI~ary of Phosphate Analysis Castle DRnger 1969) 176
APPENDIX C (Tables 1 and 11) SUTIlIarV of later Chemistry in Fxperirental Pools Castle Danger l07() 177
v
LIST OF TABLES CHAPTER PAGE
TABLE PACE
APPENDIX D (Mounting Media Instruction) 178 I A Comparison of Total Concentrations and
Component Carbon in a Variety ofAPPENDIX E (Checklist of Periphyton Organisms Found in Lake Freshwater Lakes bull bull bullbullbull 16Superior and Experimental Pools at Castle Danger
1969-1970) 179 II Average Chemical Characteristics of Great Lakes
Waters bull bull bull bull bull bull 25
III Chemical Analysis from Knife River - Larsmont Station 1958-1959 bull 26
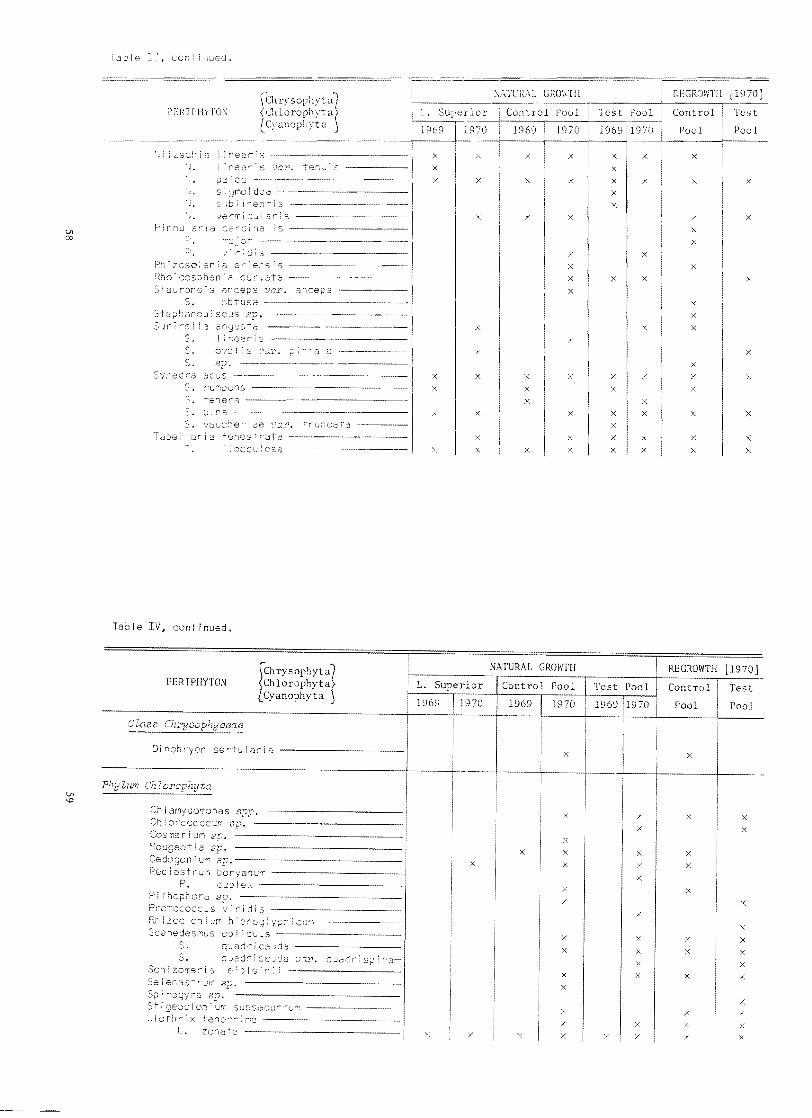
IV Periphyton Organisms Observed in Lake Superior and Experimental Pools During the Samp) ing Periods of 1969 and 1970 Lake Superior - Castle Danger Minn (1969 1970) bull 55
V Total Counts of Naturally-Occurring Periphyton in Control Pool Lake Superior - Castle Danger Minn (1969) bull bull bull bull bull bull bull bull bull bull 63
VI Total Counts of Naturally-Occurring Periphyton in Test Pool Lake Superior Castle Danger Minn (1969) bull 64
2VII Pigment Concentrations [mg (MSPU) per 100 em rock
surface] of Naturally-Occurring Periphyton in Experimental Pools Lake Superior - Castl Daneer Minn (1969) 66
VIII Dry Weights of Naturally-Occurring Periphyton in Experimental Pools Castle Danger Lake Superior (1969) bull bull bull bull bull 72
IX Total Counts of Naturally-Occurring Periphyton in Control Pool Lake Superior - Castle Danger Minn (1970) R2
X Total Counts of Naturally-Occurring Periphyton in Tes t Pool Lake Superior Castle Danger l1i nn (1970) li3
XI Average Abundance and Population Magnitude of Predominant Genera Among Naturally-Occurring Periphyton in Experimental Pools Lake Superior - Castle Danger (1970) bull bull bull bull bull bull bull bull bull 88
v vii
TABLE PACE
ZIt Pigl1cnt COl1ccoctraticns [mil per IOO COl roclr surface] of aturally-Occurring Feriphyton ill
lmenral Pools Superior Castle Danfer nn (J 97[) bullbull
XIII llrv and Organic leight [mgcmshy rock surfacE Xatundlv-Occurring PeuroriphyLon in ExperinlC-ntl
LIke Superior - Cast Danger ~1inn (1970) bull J 12
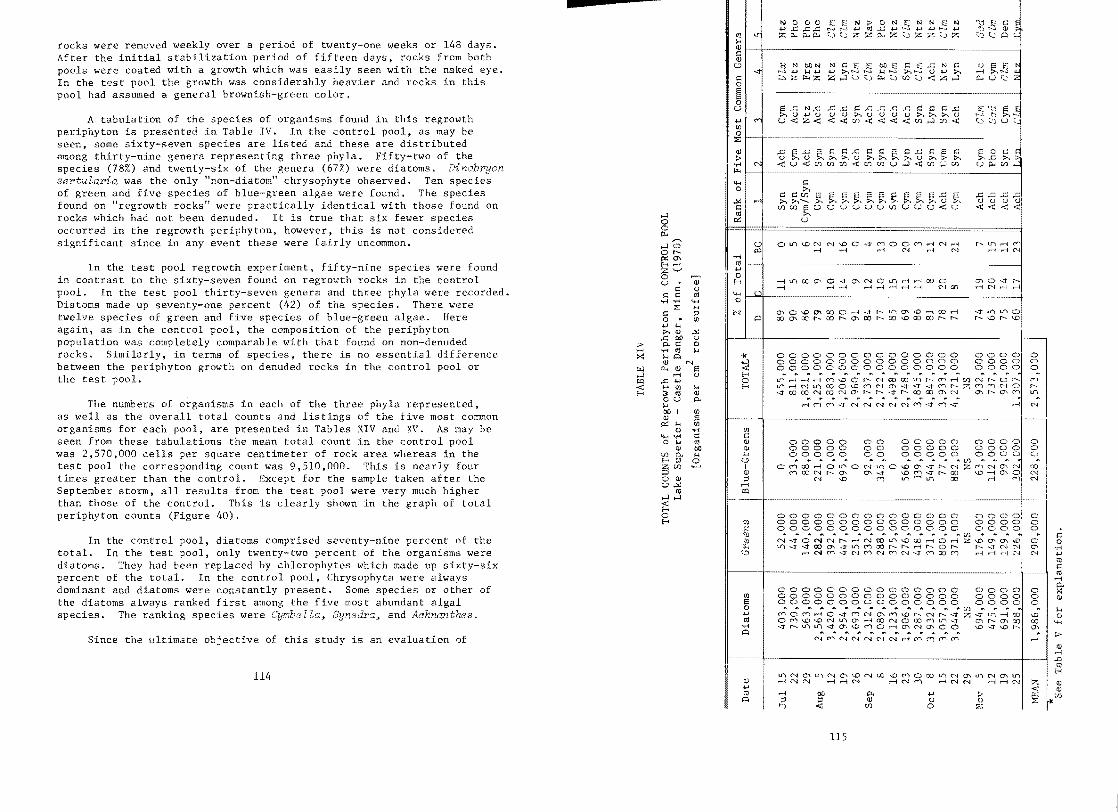
X1 Total Counts Superi
Pgrm-th Periphyton in Contrnl Castle ltnn (1q7(middot)
Ponl
xv 1 Counts pf lake Superior
Regrorth -
Per i phvton Danger
in lest PD(ll (lq7 n) lUi
AVClage hundiHWe rredCl111ntnt
tJll in Castle Danger
and Popnlatinn 1agni l)cCurr as K()~rnrt
Pools L1k(1 SurclriclY
inn ( 97 1l ) I1q
XVIT Pli~pfgtnt Conepntrat if
surflcel R0~~ro~tt)
Pocl ~- 1 SUrH-rior
(~Sln per
q
WTII ilnd C1rgallic [nwcl1 rock surfa 1 () tli Ifriphv In-enta] PCHJ- 11k(
lor - asll j1angel 1t[nn (1 (17t) bullbullbull l
XIX AVEr~lle hcC-kJy (gtmperaturc Prcced i te Llkc Superi Castle
Laclt lil111 (117fl) lifJ
vi i 1
LIST OF FIGURES
FIGURE PACT
1 Western arm of Lake Superior showing the pas it i on of Castle Danger site of periphyton studies bull 2
2 Shoreline site at Castle Danger Minn it appeared before experimental pool construction lq6q bull ]0
3 Construc tion of forms in experimental pools l e Danger 1969 bullbullbullbullbullbull 30
4 Modified plan view of experimental pools a stJ e Ilaner 32
5 Experimental pools 011 the North ShoTe Superior shyCastle Danger Minn 1969
6 Capillary tube delivery rate studies Lake Superior Castle Danger Unn 311
7 Chemical feed technique used
8 Detailed IT3p of the shoreline in the Danger area MJ
9 Collection of rock samples from experLmuntal Castle Danger Lake Superior l f)
10 Proportioning pump used [or chemi doage Castle Danger Lake Superior 1970 17
11 Portable analyzer used for on-site nitrnte det~rmj tions at Castle Danger Lake Superior 1970
12 Naturally-occurring periphyton dry ts (per unit an1) in experimental pools tIe Dal1f(er Llt1ke S1l[Hrior 1969
13 Total counts of naturally-occurring perilhyton in expershyimental pools Castle Danger Tclke Superior 19119 bullbullbull
14 Naturally-occurring periphyton chlorophyll concentrations (per unit area) in control pool tIe Danger Lake Superior 1969 bull bull bull bull 67
15 Naturally-occurring periphyton chlorophylJ conccntrati (per unit area) in test pool Castle Danger Lake Superior 1969 bull bull bull bull bull
ix
FIGURE PAGE
16 periphyton total chlorophyll concentrations unit area) in experimental pools Castle Danger Lake Superior 1969 69
17 Naturally-occurring chlorophyll concenshytrations (per unit in experimental incubators at 100 foot candles and 5deg C June 1970 70
18 Naturally-occurring periphyton carotenoid concenshytrations (per unit area) in experimental pools Castle Danger Lake Superior 1969 70
19 Regression line counts versus chlorophyll naturallyshyoccurring periphyton control pool Castle Danger Lake Superior 1969 bull 73
20 Regression line counts versus chlorophyll natnral1yshyoccurring periphyton test pool Castle Danger Lake Superior 1969 bull 73
21 November Jrd Northeaster at Castle Danger Lake Superior 1970 78
22 DestJuction pump house following December 3rd 1970 Northeaster bull bull bull bull bull 78
23 Succession of algal groups as naturally-occurring periphytoll in t(st pool Castle Danger - Lake Superior ]970 bull 85
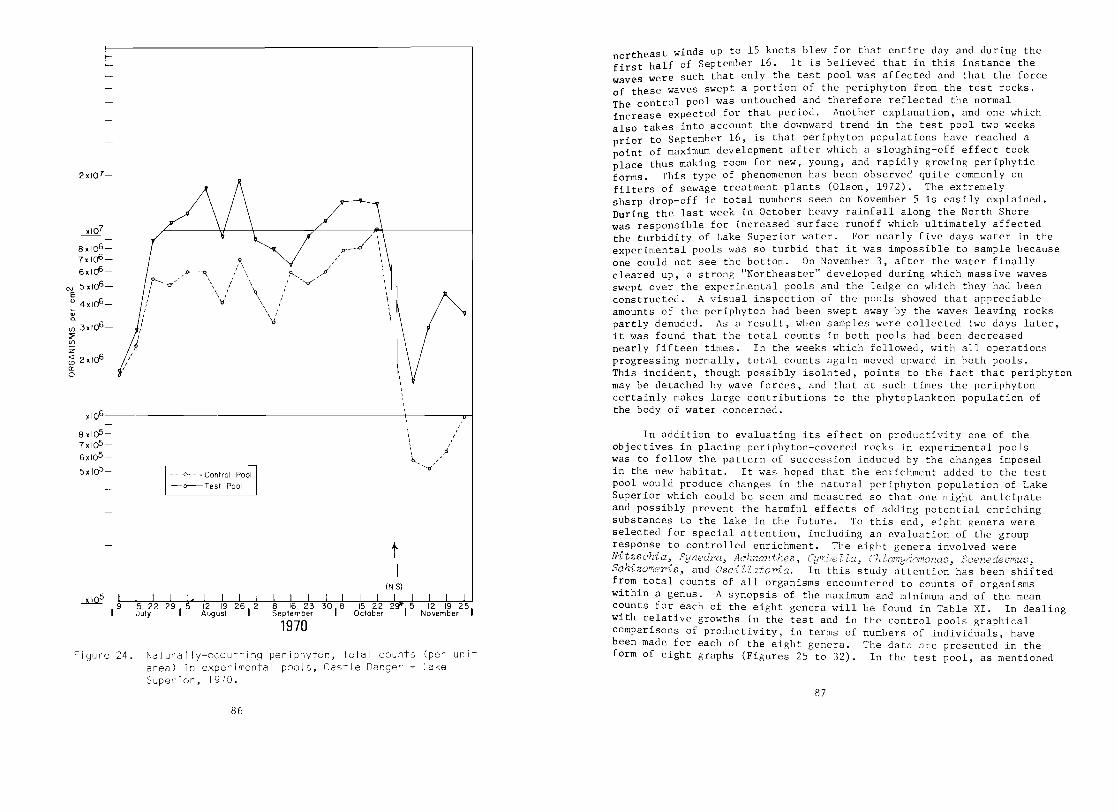
24 Naturally-occurring periphyton total counts (per unit area) in experimental pools Castle Danger - Lake Superior 1970 bull bull bull bull 86
25 Development of periphyton
26 Development of periphyton
27 Development of periphyton
28 Development of periphyton
29 Development of periphyton
in naturally-occurring Castle Danger - Lake Superior 1970 89
in naturally-occurring Castle Danger Lake Superior 1970 90
in naturally-occurring Castle Danger Lake Superior 1970 9]
in naturally-occurring Castle Danger - Lake Superior 1970 92
Castle Danger in naturally-occurring Lake Superior 1970 93
x
FIGURE
30 Development of 8aenedemmw periphyton Castle Danger
31 Development of periphyton Castle Danger
32 Development of UatorirI periphyton Cas tIe Danger
33 Seasonal succession of the
PAGE
in na tur a11 y-occurr ing - Lake Superior 1970 94
in naturally-occurring - Lake Superior 1970 95
in naturally-occurring - Lake Superior 1970 96
three most prominant genera natural growth test pool Castle Danger shyLake Superior (1970) bullbull 101
34 Naturally-occurring periphyton total chlorophy1l concentrations (per unit area) in experimental pools Castle Danger - Lake Superior (l970) lOS
35 Naturally-occurring periphyton chlorophyll pigment (per unit area) in experimental pools Castle Danger Lake Superior (1970) bull 106
36 Natually-occurring periphyton carotenoid concentrations (per unit area) in experimental pools Castle Danger Lake Superior (1970) 109
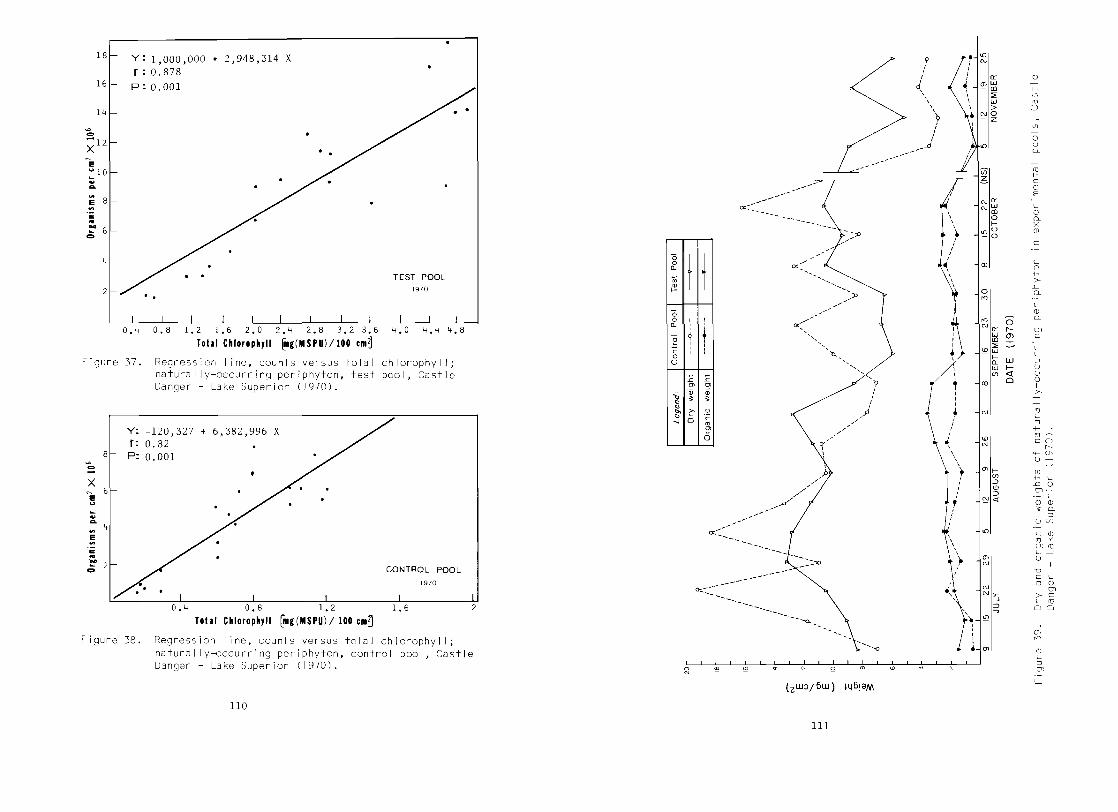
37 Regression line counts versus total chlorophyll naturally-occurring periphyton test pool Castle Danger - Lake Superior (1970) 110
38 Regression line counts versus total chlorophyll naturally-occurring periphyton control pool Castle Danger - Lake Superior (1970) 110
39 Dry and organic weights of naturally-occurring periphyton pools Castle Danger - Lake Superior
111
40 Regrowth periphyton total counts (per unit area) in experimental pools Castle Danger shy(1970) bullbullbullbullbullbull
41 Development of occurring as experimental pools Castle Danger shy(1970)
42 Development of Cymbe la occurring as experimental pools Castle Danger shy(1970) bullbullbullbullbullbullbullbullbullbullbullbull
xi
Lake Superior 117
regrowth in Lake Superior
120
regrowth in Lake Superior
121
FIGURE
i3 Developmen t of occurring as regrowth in experimental pools Castle Danger Lake Superior (1170)
44 Development of occurring as regrowth in experimental pools Castle Danger - Lake Superior (1970) bull bull bull bullbullbullbullbullbullbullbullbullbullbullbullbullbullbullbull
45 Development of occurrIng as regrowth in experimental pools Castle Danger Lake Superior (J 97(1) bull bull bull bull bull bull bull bull bull bull bull bull bull bull bull bull bull bullbull
Development occurring as regrowth in experirlcntal pools Castle Danger - Lake Superior (lQ70) bullbullbull bull bullbull
l 7 Succession of algal groups as regrowth periphyton In test pool Castle Danger Lake Superior (1970)
48 Regrowth perlphyton total chlorophyll concentrations (per 11nit arpa) expprimental pools Castle Danger - L~ke Supelior (197() bullbullbullbullbullbull
per iphytn chlorophyll pigment concentrntions tlnit~ arCa) in (gtxperimental p001 C(1stle
Danger Lake Superior (J 970) bull
50 Rklgressiou ine) count versus total chlorophyll ngrOlltth peri test pool Castle Danger LAke Superior
51 Regression 1 irw counts v(rsus total chlorophyll regrown iphyton cnntrol pool tIe nanger Lake Suoednr (197() bull
52 Regrowth 1(r iphyton carotenoid concenUatiolls (per unit area) ill (~xperimentLll pool Cslle nanger-Lake Superior (1970) bull
53 RegrOlvtil lwr iphyt(n weight (per nIl it arc) in experimen pool Castle Oanger - Lake Superior (1970) bull bull bull bull bull bull bull bull bull
5t RegrDlvth periphytn organic Heights (per unit area) in experimental pools Castle nanger - Lke Superior (1970) bull bull bull bull bull bull bull bull bull bull bull bull bull bull
x~i
PAGE
122
123
125
126
127
FICDIU
55 N1turCl11y-occurr rtriphyton versus regrcnrth periphvton total counts in test pool restle Danger - Lake Superior (1970)
56 NatlJrally-oc(urring per ipllytnl1 versus rcgroth peliphytll total C011I1 in control I CastlE nanger Laic Superior (1(170) bullbull
57 Hater temperature data Castle Danper Minn
July 19 Lake Supcr
SR Hater temperature data August 1970 Lake Superior - Cast Danger Htnn
59 ~ater temperature c1ata - Septemher Lake Superior - Castle Danger Minn
60 Hater tel1peraturc data - Octoher Novemher 1971 Lake Superior C~stle n~nger Minn
PAce
lifO
141
lid
14 ~)
146
130
bull 131
112
132
133
136
137
xiii
CHAPTER I
INTRODUCTION
In Lake Superior as in most lakes one of the first areas to be affected by man-made waste discharges is the near-shore region In this zone a prolific array of life exists characterized by fish immature insects zooplankton aquatic plants and attached algae Since attached algae (periphyton) along the shore are fixed to the rock structure and cannot move they are constantly washed by waves and water currents It is therefore logical that the composition of this algal community should reflect the quality of the water masses passing by A close monitoring of the periphyton ill therefore provide information relating to water quality and changes in water quality
In the literature some confusion exists over the precise meaning of periphyton Here the term periphyton follows the generally accepted definition proposed by Young in 1945 By periphyton is meant that assemblage of organisms growing upon free surfaces of submerged objects in water and covering them with a slimy coat It is that slippery brown or green layer usually found adhering to the surfaces of water plants wood stones or certain other objects il1lmersed in water and may gradually develop from a few tiny gelatinous plants to culminate in a wooly felted coat tha t may be slippery or crus ty Ii th can tained marl or sand Although pltriphyton defined in the above manner includes both plant and animals it is known that this community is composed mostly of plant material which is mainly algal in nature This investigation therefore deals only with the members of the periphyton belonging to the plant kingdom In a more restrictive sense only ep ilithic periphyton or periphyton growing on rocks was studied
In 1965 a five-year project was initiated to study the periphyton in western Lake Superior The overall project was aimed at the detershymination of the extent of periphyton growth in selected areas of Lake Superior the composition of periphyton growth in selected areas of Lake Superior the biota of periphyton mass in terms of animal and plant components the possihle interrelationships existing between the periphyton in relation to the typical productivity of water in the open lake the importance of changing seasons on the characteristics of the periphyton the principaJ changes ~Iich would take place in the periphyton when polluting naterials were introduced into the lake and the speed and the phases of growth demonstrated by periphyton in re-establishing itself on an artificially denuded area
Many of the above mentioned ohjectives have been fulfilled by Fox (1969) and Stokes (1969) One of the remaining objectives however which formed the bulk of this investiGation was the determination of changes which would take place in the periphyton when polluting materials were added to the lake To this end studies were directed to an isolated shore area near Castle Danger Minnesota (See Figure 1) where a controlled simulation of the lake environment was created
I
~-~ p-of- 0lt
v qlt 0
o I
Stohl lin t At
Figure I Western of Lake Super showing the ition of Castle Danger the site of periphyton studies
2
CHAPTER II
REVIEW OF THE LITERATURE
Prior to 1956 American researchers had paid little attention to periphyton Prescott (1956) in considering this point states that while the periphyton community should be of obvious concern to the ecologist and the limnologist the habitat and life history of the attached algae have been largely ignored A similar viewpoint was expressed in 1962 by Alena Sladeckova in her excellent review of the methodology involved in studying the periphyton She pointed out that while research was relatively impressive for the phytoplankton very little had been done with the periphyton community
The periphyton has been studied a little more extensively by European investigators however even here the studies have been limited when compared with the plankton and benthos Perhaps the reason for lack of research on periphyton is the great diversity of its community structure and the difficulties encountered in sampling
Significance of Periphyton
Basic productivity One of the most important aspects of periphyton is its significance in primary productivity of a body of water In a flowing water ecosystem as Grzenda and Brehmer (1960) pointed out periphyton is virtually the only primary producer In his studies of Lake Superior Stokes (1969) concluded that in the same general area periphyton may be five to six times more important in production than the plankton of the open water In his studies of Stony Point Bay Stokes found that the standing crop of periphyton was 555 tons or about 156 grams of dry weight per square meter This if converted to yield per acre would be 1400 pounds Similarly Odum in 1957 found the standing crop of attached algae in Silver Springs Florida to be 175 grams per square meter or 1560 pounds per acre of dry weight Westlake (1965) after reviewing many other pertinent studies concluded that the biomass of luxuriant periphyton usually will range from 100-500 grams of dry weight per square meter He feels quite strongly that the periphyton make an important contribution to overall productivity and must thereshyfore always be considered
Periphyton and the foci web Many scientists have recognized the importance of periphyton in the aquatic food web Cavanaugh and Tilden (1930) for example stated that the larva of the midge fly Tanytarsus dissimiZis relies entirely upon periphyton algae for food Knudson (1957) and Douglas (1958) in their ecological studies stated on the basis of gut contents that other aquatic insects such as caddisflies mayflies and stoneflies feed on periphyton algae and that a correlation exists between algal populations and the insect crop Other organisms
3
which feed on periphyton are fish (Neel 1968 Foerster and Schlichting 1965 Young 1945 and Bakus 1966) snails (Young 1945 Perkins 1958 and Castenholz 1961) amphipods or scuds (Marzolf 1965 and Rosin 1955) zooplankton such as copepods cladocerans and rotifers (Foerster and Schlichting 1965 Perkins 1958 Anderson 1958 Brook 1954 and Neel 1953) protozoa (Perkins 1958 Neel 1953 Brook 1952 and 1954) and enchinoderms (Lat-kum al 1967 and Lebour 1922)
Since constituents to components of the free
phytoplankton it hilS been suggested by some thilt ttl( periphyton community can be an important contributor to the phytoplankton Fritsch (1931) suggested that spores or of the plankton when not found in the open water probably existed at the bottom or in the littoral zone H~
helieved that the majority if not all of the typical constitutents of the pelagic plankton would be found at the bottom during tl1Pir period of absen~e Codward (1937) considering the possible origin of the plankton in Lake Windermere concluded on the basis of simple correlations that a considerable part of the plankton must in fact be recruited from the littoral region of that lake After four and one-half years of observations on Ahbots Pond and Priddy Pool in Sommersetshire Fngland Moss and Karim (1969) concluded that many species were introduced into the open water by disturbance of benthic habitats Since this logically can be related to the hydraulic forces which are applied the vork of llarnes and Topinka (1969) would seem to be pErtinent Depending on the substrate involved these investigators found that periphyton algae may be detached with varied amounts of force In working with the germlings of Fueus they found significant clifferencE~s and they have rated various substrates in reference to this detilchability factor
Many types of ptriphytic algile may as ty Palmer (1962) in his publication points out thut ordinarily a single algal cannot il reliable indicator of pollution Ins tead one should look a t the enti re phytopJ ankton community or group of species Many algal species have heen reported in the literature as species commonly found in tvater containing high concentrations of organic wastes Palmer (1962) has reviewed thE reports of more than fifty different workers and has compiled a pollution tolerant list totaling 500 species From this list ho has selected and published a tahulation of tIn forty-seven most important species Palmer (1969 1971) extended his compilatjon to ten tab1es listing additional species of algae in a ranked series of tolerances This infonnation vas based on the reports ot 165 authors Among the diatoms according to forty-iive Buthors Nitz8c~ia is one of the most resistant and tolerant of all Blum in discussing this species states that it is a bull eurytopic euryhaline eurythermic form which grows conspicuously in polluted water where it forms a rich brown surface layer on rocks of rapids as well as in quiet water on sbnJlotv silt hanks
4
It is often used as an indicator of polluted water although its ubiquitoustendencies permit it to grow throughout the entin gamut of water purityPhilipose (1960) stated that spp and
ulna ere favored by pollution A filamentous green alga tenue which usually is an attached form has been mentioned
by Blum (1957) Mackenthun et al (1960) and Palmer (1962 1969 1971) as an important pollution indicator Other reported indicator species are
~ a~ According to Ravera and Vollenweider (1968) and Blum
blue-green algae Z spp and indicative of an enriched environment
In the above references it should he remembered as Palmer and others have pointed out that a siTgle algal species should not be relied upon as a pollution indiciator Hany so-called pollution tolerant genera of algae also include species which are sensitive or intolerant to my type of enrichment Similarly within a species there may be strains or varieties which are intolerant For example Fjerdingstad (Palmer 1926) has found that there are two separate strains of tht species zonata on2 tolerant to pollution and the other a cleaner water type
Some
Studies on tll(1 occurrence distri shyas an important first step in any
overall ecological study For the past forty years many varied types of environments have heen studied for instance Ahdin in 1949 studied periphyton growing in the Aswan Reservoir in Egypt and hl 1950 Flint studied such growths in a British reservoir Tn flritain Brook (1954 1955) investigated the periphyton of slow sand filters in a ater-Horks plant In Iowa the periphyton of a stl1bilization pond was studied by Raschke (1970) Periphyton occurring in streams and rivers lws been studied by a great many European and American researchers Among these Douglas (1958) lutcher (1932a 1932b 1947) Jones (J949) and fllum (1957 1960) may be considered representative In lakes and ponds the periphyton has received attention by such investigiltors as Codward (1937) Fritsch (1931) Knudson (1957) Young (1945) Newcombe (1950) fox (1969)and Fox al (1969)
A great deal of information has factors which may influence the periphyton factors have included studies on the effect of light of water temperature of current velocity of dcpth ilnd of the nature of substrate on periphyton grmth The effect of light [WS
been investigated by such peorle as Godward (1937 Flint (1950) Brauner (1956 hitford (1968) Stokes (1969) and Stoves
5
ei (1970) Investigators who have concerned themselves with water temperature are Patrick (1948 1949) Wallace (1955) Bellis (1968) Brock (1967) Stockner (1968) Phinney (1965) Round (1960) Cairns (1956) and Stokes et aZ (1970) McIntire (19660) has studied currentshyvelocity effects in artificial laboratory streams whereas vihitford (1960) has carrieti such studies into the field Stokes (1969) Round (1961) Godward (1937) and Fox (1969) have examined the relation of water depth to periphyton production All of the physical factors mentioned above play an important role in determining the composition and population of a periphyton community
The influence of the chemical environment on discussed in a number of studies For exampJe Komorvasky Roa (1953) clnd hhipp1e and Parker (1902) have dIscussed in detail the importance of nitrates
diatoms Kevern and RaIL (1965) Round (1960) and Munawar (1970) have dEa1 t wi th other chemical factors stlch as phosphates s iJ icates and potassium
Some investigators believe that the overall growth characteristics or iphyton Duuglas (19Sg) suggested thDt one of the factors controlling the popul1tion in small stream was
hy various types of insect larvae Larkllltl and his associates (1967) til their studies of undenlater vcmiddottieill cliff in Halta feJt that grad by echinoderms 1lt1 pI 1 account for the reduced biomass ot th( perilhyton on that cJiff On the Or1go11 coast Castenholz (196]) ohsErved that other marine organisms such as the littorines and Jimpets heLl the cpt] ithic diatom populiltlon ill check Jhen grazers ere removed and excluded r ] givpn ~rea diatom slicks developed on the rock subs tra te wi thill UfO or three Jeeb in 8reas previollsly d ia tom-f ree Brook (1952) ohserving that protozoa fed on tlw bottom-living algae of J slow-sand fU ter concluded t]lt the periodicity of diatom numbers could indeed he af f ectpd by grad ng
Round (1960) suggests that in a periplryton community there may be an interaction or competition between sped o[ the gronp and between species of different groups He suggests that competition for nutrients 11H] l)e factor of ome importance since the larger species with a slower rate of division will not reacll high numhers hefore nutrients an depleted This plobahly accounts for the preponderance fliUlfehia over
and over a
It is generally agrpec1 that in an enriched hody of water there will be fewer typcs of sped but grEater numbers of individuals In contrast a cipan body of water vould llave many diverse spfccies but only a small nUlrher of individuals Yount (1956) in his investigation of the attached diotoms in Silver Springs florida found thot the above contention holds true fo the periphyton as 1 as for the plrmkton and the benthos
6
The annual succession of periphyton has been studied by several workers several of whom have been cited earlier Brook (1955) for instance studied the succession and colonization of attached algae on glass slides placed in the slow sand filters of water-works Flint (1950) studying the periodicity of phytoplankton and periphyton in a British water reservoir was able to specifically relate algal periodicity to phosphate and nitrate levels In Lake Windermere Godward (1937) investigated the periodicity of littoral algae over a period of three years while Douglas (1958) studying a small English stream similarly carried out studies on periodicity of attached diatoms over a four-year period In this country Castenholz (1960) in a two year study observed seasonal changes and periodicity of the attached algae of freshwater and saline lakes in the lower Grand Coulee Using an artificial stream Kevern and Ball (1965) studied the successive changes which took place in periphyton under controlled laboratory conditions
Some investigators have been more specific in that they have followed the seasonal succession of an individual species Knudson (1957) for example carefully followed the succession of the diatom fZoaaulosa in an English lake Hunawar (1970) noted in particular the development and succession of Chlamydomonas spp and Saenedesmus spp in two freshwater ponds in India
Nany investigators who have studied phytoplankton refer to the spring and autumn maxima phenomenon Periphyton as pointed out by Round (1953) also demonstrates the same spring-autumn maxima
In dealing with the ecology of any organism or group of organisms it is essential that the identity of each organism is known Many investigators have simply concerned themselves with the establishment mataxonomic list of the locale studied Several new species of river periphyton were described by Butcher (1932c) after he suspended glass slides in six English rivers for a month Other scientists such as Godward (1937) Douglas (1958) and Stockner and Armstrong (1971) have compiled detailed toxonomic lists of the respective areas which they studied Brock (1968) discusses the taxonomic confusion which exists among certain filamentous blue-green algae Fox (1969) reported on the species of periphyton that occurred as regrowth on natural rocks placed in the western end of Lake Superior In addition to his taxonomic work he also determined the biomass and total numbers characterizing the accumulated growth Taxonomic lists such as those compiled by the above mentioned investigators serve as a valuable aid in the overall ecological characteristics of the periphytoncommunity
Sampling Techniques
Periphyton removal Unlike phytoplankton periphyton is difficult to quantitate and as a result most of the inVestigations have been qualitative in nature In such studies investigators have simply scraped
7
or pulled the periphyton off the substrate and have examined it under a microscope Where quantitative studies have been made periphyton has ordinarily been collected from a known surface area of either a natural or an artificial substratum and subjected to one or more of the following procedures 1) volume determination 2) gravimetric analysis 3) direct enumeration 4) pigment determination and 5) carbon fixation potential
Several unique methods for the removal of periphyton have been employed Young (1945) quantitatively sampled bulrush stems and stones by firmly pressing a sharp edged square hollow instrument of known area against the objects on which the growth occurred The surfaces outside the square were then scraped free of periphyton leaving only the known area covered with growth and ready to be transferred to a collecting bottle Foerster and Schlichting (1965) removed leaves from the submerged plants of lallisneria Myriophyllum jarvelZIi and sp The leaves covered with epiphytes were placed in screw-top jars and periphyton was washed from the leaves by agitation The surface area of each leaf was then determined Knudson (1957) collected periphyton samples by cutting the stems of various submerged aquatic plants into ten-centimeter lengths Periphyton growth on these sections was removed and examined with an inverted microscope Neel (1968) in his studies of periphyton on large rocks used a rectangular brass frame to enclose a three square inch area from which he then either scraped or pulled the periphyton Claflin (1958) studying a reservoir in South Dakota removed periphyton from the submerged trees by pruning the branches and twigs The cuttings were then placed in jars of filtered water Tn the laborashytory the surface growth was removed and total counts of organisms and pigment analyses were related back to the surface area of each twig In a riffle of the West Gallatin River Montana Gumtow (1955) using a brass ring to delineate a one square centimeter area removed the periphyton with a scalpel Douglas (1958) using a modification of the same procedure scraped the periphyton directly from the area delimited by her sampling apparatus in this case a bottomless polyethylene bottle A very unique method was employed by Margalef (1948) to remOve periphyton from stones After first preserving the rock in fonlalin and staining it he simply coated a periphyton-covered rock with dissolved collodion After the collodian had dried it was peeled off monnted in balsam and examined microscopically Margalef states til] t a good image of the stone surface including all of the epilithic vegetation was obtained by this procedure Fox (1969) and Stokes (1969) removed periphyton from rocks by scrubbing off the growth with a short bristled brush The results obtained in analyses of the slurry which was obtained were subsequently related to the surface area of the rock covered by periphyton growth
Rather than removing the periphyton growth from ts some investigators have made direct observations by placing the periphyton-covered object directly on a stereoscopic microshyscope stage Tn some cases natural substrate may be viewed directly Ordinarily t11is method is used with a transparent artifIcial substrate
8
such as a microscope slide or flat pieces of cellulose or plexiglass Sladeckova (1962) describes amos t in teres ting direc t method for examination and quantitation It is the method of Rehbronn (1937) According to Sladeckova the procedure is as follows Plants with thin layered and transparent l(aves such as Elodea canadens-[J are placed directly under the microscope When such a leaf contains so many chloroplasts that it is not perfectly transparent the technique of Rehbronn can be applied In proceeding with this method bull the cleaned side of the leaf is dipped carefully into a solution of chloral hydrate as long as necessary for chlorophyll extraction Then direct counting of the epiphyton becomes easy Little leaves can be examined over thd r total area larger leaves are usually observed tlrrough an auxiliary glass slide provided with ruled or engraved grids or with the help of ocular micrometers bullbullbull
In the majority of periphyton is usually used The
types of substrate are varied depending upon the investigators needs and the sampling locale Artificial materials offer fin advantage in that
are easy to use and manipulate and also that one can use predetermine( uniform surface areas One of the most common forms of artificial
substrate is glass in the form of a microscope slide These slides may be placed in simple plastic or wood frames and suspended in the water at any desired place Bissonette (1930) who was interested in collecting bryozoans is usually credited as being the first to devise a glass slidE rack that could be suspended in water From his original concept have come many variations and revisions Smyth (1955) for example secured five to eight 3 x 1 slides together in a wooden template The rack was fitted with a wire handle allowing the device to be lowered to the bottom A cork was then used to buoy a line attached to the handle Patrick and her associates (1954) utilized a device known as a cliatometer to support the glass slides they used in their periphyton studies This instrument was designed to float at any depth desired Reynolds (]950) used submerged glass slides as a means for collecting algae to culture an agar Flint (1950) fitted glass slides to metallic photographic frames te study periphyton of a British water reservoir Other investi gators vho have used the glass slide method are Godward (1937) Butcher (1947) Jolly and Chapman (1966) Aleem (1958) Whitford (1956) Yount (1956) and Castenho] (1960)
Another transparent material utilized by some yorkers is plexiglass Aleem (1958) used plexig1ass mounted in a frame to study the succession of marine fouling organisms at La Jolla California Crzenda and Brehmer (1960) also used this material in their studies of periphyton populations in the Red Cedar River in Michigan They attached two plates of plexiglass to a horizontal crossbar which was supported by a vertical post driven into the stream bottom Jackson (1967) used plexishyglass to study in Lake Ontario while Whi tford (1956) used this type of substrate collecting periphyton in a Florida spring
9
A variety of other artificial substrates have been utilized McConnel and Sigler (1959) in their studies on the Logan River in Utah utilized concrete blocks as a substratum In a similar fashion Waters (1960) used concrete cylinders to study periphyton in a small creek in Minnesota Asbestos shingles were sed by Fuller in 1946 during the course of his studies on the role of marine periphyton as a ship fouling factor Inaddition marine fouling organisms were also studied in La Jolla California by Aleem (1958) In his work he used a variety of substrates including wood vinyl acetate brass zinc stainless steel and copper These he ranked according to their relative suitability Beers and his colleagues (1968) produced a new type of growth support by pouring two coats of boiling paraffin over a concrete substrate The coated block was then exposed in the stream being studied After sufficient colonization the paraffin coating along with its attached periphyton was removed and plant pigments were extracted According to Abdin (1949) Hentschel used ping-pong balls and pieces of celluloid as early as 1916
Artificial substrate has a distinct disadvantage in that certain materials may be selective or restrictive to certain types of algae For instance Foerster and Schlichting (1965) observed that growth on glass slides tended to give a false indication of the genera since only certain types of algae seemed to attach to it Sladeckova (1962) states bull for some organisms mostly blue-green algae glass is not a very acceptable substratum Hohn and Hellerman (1963) in are-evaluation of Patricks diatometer found that organisms growing on the glass slides were different from the population of organisms growing on the styrofoam float The also found that when water temperatures were below sixteen degrees centigrade diatoms did not grow and adhere as well to the glass slides as they did to the styrofoam Flemer (1969) in discussing what he terms a significant error in chlorophyll am lysis states that this problem is especially likely to occur when a solid substrate such as a glass slide is used
Natural materials procured from the body of water are recommended and utilized by some investigators Godward (1937) for example removed periphyton-covered stones from Lake Windermere for the purpose of identifying their characteristic growth Similarly Jolly and Chapman (1966) removed natural rock in a small creek in New South Wales for periphyton analyses In his study of the colonization of periphyton Blum (1957) placed sterilized stones in a small stream the Saline River Michigan All of the above studies were qualitative in nature however McConnell and Sigler (1959) extended the use of natural rock to a quantitative study of periphyton chlorophyll productivity in the Logan River Utah Fox (1969) and Stokes (1969) used a more refined natural rock technique in their comprehensive quantitative studies of the periphyton of western Lake Superior Stockner and Armstrong (1971) quantitatively sampled the periphyton occurring on natlral rocks in an Ontario lake In their method which was somewhat different from that used by Fox and Stokes periphyton growth was removed from only a small portion of the rock
10
guantitative measurements A number of parameters may be used for the quantitation of periphyton growing either on artificial or natural substrata A method commonly employed involves counting and identifying the individual members of the periphyton community under a microscope The count obtained in this manner may then be related back to the specific surface area of the substratum covered by the growth While this method does give the investigator a good picture of the species or the types of organisms involved as well as an idea of the physiological condition of the growth as a whole it is extremely laborious and time-consuming In his studies on the taxonomy and distribution of Lake Superior periphyton Fox (1969) relied almost exclusively on the enumeration method
When time is a limiting factor many investigators have resorted to less demanding and less time consuming quantitative procedures In such procedures some general attribute of the periphyton sample is measured rather than counting individuals within categories Thus if volume or weight is to be used as a parameter the biomass is determined in terms of milligrams or milliliters and related to the area covered by the growth Biomass may be measured as wet weight dry weight or ash-free dry weight Investigators such as Castenholz (1960) Kevern and Ball (1965) Stokes (1969) and Fox (1969) have used this procedure
Another type of quantitation involves the measurement of carbon fixa tion by photosynthesis This can be determined by measuring oxygen evolution during the photosynthesis process The Gilson differential respirometer was utilized by McIntire (1966b) to evaluate factors which affected periphyton respiration in a laboratory stream Since he also determined the ash-free dry weight of the priphyton he was ab] e to express his results as the rate of respiration per unit of organic weight Stokes (1969) using the same method correlated depth light intensity and water temperature and the role these factors play in photosynthesis of Lake Superior periphyton
Pigment analysis has long been recognized as a fast and conventional procedure for estimating the standing crop of plankton The original spectrophotometric method was proposed by Richards and Thompson (1952) They stated that chlorophyll and carotenoid pigments should yield (a) a measure of the potential of the plankton for absorbing radIant energy for photosynthesis (b) some measure of the extent and stage of development of the phytoplankton and (c) a pOssible measure of the presence of animals grazing on the crop Since members of the various phyla contain different ratios of chlorophylls a b and c varying concentrations of these chlorophyl1s will also reflect-to a certain degcee the composition of an algal community The method although originally proposed for phytoplankton is just as applicable to the periphyton community and can therefore be used to determine the standing crop of this assembly of organisms Stokes (1969) made extensive use of this method in his work on Lake Superior
11
In any plankton or periphyton analysis a measur3hle quantity of pigments other than the chloropbylls w111 usually be found Tbese pigments lre ordinarily desiGnated as astacin and ncn-astacin carotenoids The involvement of these accessory pigments in energy transfer during photosynthesis has been by Chance and Sagar (1957) They showed that a mutant of ~inho~~tii can carrv out photosynshythesis wIthout any evidence participation of carotenoids Dutton and Ilanning (1941) based on their work with 11 tsch~a take the opposite view inasmuch as they found that fucoxanthin the main carotenoid 0f ~rown algae was just as efficient in as chlor()phyll Tanada (1951) Ierking Iith this effectiveness of fucoxanthin EmerSln (1l5P) who hRd previously questioned the iuportance of carotenoids eventually ccmiddotncluder that efficient photosynthesis could not be achieved in organisms lacking these accessory pigments Tn iscussing productivity measurements Stokes (1)69) suhscrihes to this viewpoint hy suggesting that in pigment measurements the carotenoid must be included
Alrouih simple satis actory onp finds as Stokes (1969) has so aptly it ons of standinR crop of perjphyron producers hy uant tative rrtHsurtments of chlorophyll ccntent hove befm measer Yount (l in his studies on diatoms of Florida strcam used ch10ro1h)11 lles tairHd fron periphyton accumulations on gJ1BS slide as an index 0 productivl tv Crzendil and Brphmer (lQ(iO) collected peTiphyton em p10xiglass pIaUS an(1 quantitated chlorophyll aters (1960) determined the pigment concentration of periphyton gromiddoting on concrete cylinders hlcli had heen exposed ill a smilll creek in ~1innesota Dutter and Doris (IQ66) did n inllar study in tho Blue Riv~r of Ohlahoma In Japan Ho~ etsll and I chimun (195) remolJed per i phyton from tandeHd areas of reck snrf1cls and enacted the chlorophyll Ilso in Tapan Kobayasi (1961) found linear corrclaticn hcUeen cell numhers and chlorophyll content of sessile 81gae on rocks in a river In the l~gan River in Ctah gt1ltConnll nnd Sigler 1959) in measuring tllC chlorophyll content of the attached algal found thelt the average chlorophyll quantit per square meter hot tc be 030 grams Other investipators who bwe felt tlat pigment analysiS WClS important and have included it in their studies are McIntire anrl rhinney (1965) ~ln used it in their laboratory streams anel (1969) determined the chloropbyll ontent of epjpe 1ic a 1 gaC n t-o SOTIlerseLshi rc pools in r~ngland Dur ing the course of his study on Superior periphyton Stokes (1969) not only measured the total chlnrophyl1 hut deatl quit specifically Jjth all or
carctenolds Chlorophyll pi ~ments were quantitate( 1v lise 01 1 Beckman Dk-2A Rat to Recording Spectrophotometer
Research(rs ]ve long ealized that algal pHcil1ctlvity in a body of Hater may J great Iv enhanced when certain chemicals arr increased through either natural or man-made pllution However in order to adequately
12
understand the relationship between water fertiHty and algal productivity one must know hat chemicals are important To this end early workers such as Chu (1942 1943) Rodbe (1948) and Gerloff t 0 7 bull (1950) have examined through laboratory studies the importance of various chemical elements in algal nutrition and in each instance have determined thE range of concentrations which might be considered essential to optimum growth
Although nearly all of the investigations concerning algal nutrition have dealt i th studies on phytoplankton it may logically be assumed that results of such work also can be related to the periphyton algaE
Of all the nutrients required hy most attention are phosphorus and nitrogen In his Ii terature review on phytoplankton ecology Lund (1965) concluded that litrogen and phosphorus can still be considered as two of tlle major elements limiting primary production In some tropical and highly eutrophic temperate lakes nitrogen may be a mon important linliting factor than phosphorus In many other lakes phosphorus is present in very low concentrations and seems to be the major factor limiting production Thus if a body of water receives excessive amounts of nitrogen and phosphorus a general state of eutrophicotion may eventually be expected
In an aquatic system phosphorus occurs in three forms incrganic phosphorus particulate organic phosphorus and dissolved organic phosphorus According to Korrnomly (1969) the inorganic phosphorus is typically orthophosphate (P0 ) which is generally thE form preferrec1 by
4plants Particulate organic phosphnte is that which occurs in suspension in living and dead protoplasm whereas the dissolved or soluble organic pbosphorus is that portion derived from the particulilte motter by excretion and decomposition The total phosphorus includes all thr~e categories The varying states of phosphorus and the differing terminologies used has led to some confusion in academic circles Mackenthun (1967) in attempting to simplify the matter has compiled all Known phosphorus terminologies and has carefully delineated each term so that the exact meaning will be clear to practical workers in the field
Inorganic sources 0t nitrogen in a of water usualy occur in the form of amm()nium (NH ) nitrate and nitrite (-0)4Investigators such as Chu (1942 1943) (1948) and Ryther (1954) have found that algae readily absorb ammonia and nitrate however they conclude that only a limited number of algal species can assimilate nitrite Elemental nitrogen (N ) can he used by certain species of algae2only Many of tbe blue-green algae are of doing this
Since nitrogen and phosphorus often are considered the most important plant nutrients the question of what their crItical concenshytrations in natural waters may be is an important issue According to Lee (1970) it is possible to contTol the degree of eutrophication by
13
the expedient of keeping the nutrients below a critical level Sawyer 1947) proposed certain critical concentrations of nitrogen and phosphorus which would be limiting These levels are probably the best general estimates available today In his studies of Wisconsin lakes he found that when the inorganic nitrogen content of the water at the beginning of the growing season equalled or was greater than 03 mgl and the orthophosphate content was equal to or greater than 001 mgl P then the lake was likely to have excessive crops of algae and other aquatic plants In a study of several Bavarian Alp lakes Hamm (1969) found that waters with levels above 002 mgl P were eutrophic and those below 001 mgl P were oligotrophic His findings therefore correlate closely with Sawyers original estimate The work of McKee and Wolf (1963) likewise lend support to Sawyers figures They found that in general when the phosphorus content was kept below 001 mgl nuisance algal blooms would not develop
While the critical nutrient levels proposed by Sawyer are very useful in solving eutrophication problems it must be remembered that other factors often playa role Addressing himself to this point Lee (1970) sugges~that (1) Productivity depends on other nutrient factors besides nitrogen and phosphorus (2) Nitrogen and phosphorus have influences which may be different depending upon the time of the year (3) the stoichiometric concentrations of some of the primary elements in algae vary within fairly wide limits (4) Some algae have specific phosphorus and nitrogen requirements which are markedly different from those of other algae and that (5) Sawyers phosphorus value fails to take into account all of the factors which are involved in the complex aqueous environmental chemistry of phosphorus
Because of the volt~inous literature and the stress placed on nitrogen and phosphorus it is often easy to overlook the importance of other macronutrients Eyster (1964) in discussing macronutrients lists carbon hydrogen sulfur potassium magnesium calCium and sodium as representative this category of nutrients Although Lee (1970) stated that the above elements are generally present in sufficient quantity there are several workers who now feel that carbon can be limiting and this nutrient has therefore been given increasing attention According to King (1970) carbon may be present in water as free carbonic acid bicarbonate ion or monocarbonate ion The various of carbon are linked together in accordance with a well known equilibrium reaction and changes in the amounts of each may be reflected in the hydrogen ion concentration (pH) The average ratio of CNP atoms in an aquatic system as mentioned by Stumm and Morgan (1962) is 106161 There are some investigators namely Lange (1970) and Kuentzel (1969) who feel that carbon may be more of a limiting factor to excessive algal growth than phosphorus or nitrogen Kuentzel in particular cites examples where certain large lakes containing more than 001 mg1 soluble P but relatively small amounts of carbon did not as might be expected develop algal problems On the other hand he mentions lakes characterized by high carbon and a very low P laquo001 mgl) which produced massive blooms
14
of algae In essence he has concluded that unless carbon is controlled it is fruitless to be concerned with other nutrients such as phosphorus Investigators such as Shapiro (1970) and Schindler (1971) strongly disagree with this conclusion Shapiro for example states that Kuentzels examples relating excessive algal growths directly to high carbon and inversely to phosphorus levels are meaningless Shapiro explains quite simply that when algae grow they take up phosphorus and when they do not grow they do not take up phosphorus Hence water around the organisms during the period of a heavy bloom may be expected to contain no phosphorus or very low levels of phosphorus because this nutrient has been incorporated into the existing algal mass He concludes that bull if any relationship at all exists between the abundance of algae and the concentration of soluble phosphorus at the same moment it will be an inverse relationship Thus it is clear that Shapiro remains firm in his conviction that the removal of phosphorus alone will slow down the eutrophication process
After conducting fertilization experiments in an Ontario lake Schindler (1971) also concluded that in almost any situation carbon is unlikely to limit the standing crop of phytoplankton He points out that in Lake 227 which had been enriched by additions of nitrate and phosphate a distinct and lasting bloom was produced even though the carbon content of the water was low Apparently Lake 227 belongs to a group of small lakes which exhibit bull total CO concentrations lower than any previously reported group of natural lakes in the world bullbullbull (See Table I)
During a two week period of intensive experiments in August 1970 Schindler calculated that the carbon dioxide invasion from the atmosphere into the epilimnion of Lake 227 was 216 mg cO
2-Clm2day In summing up
Schindler stated It is clear from the data presented here that addition of nitrogen and phosphorus can produce dense standing crops of phytoplankton even when CO2 concentrations are low enough to temporarily limit primary production With regard to Lake 227 he states further If the carbon supply in Lake 227 is sufficient to produce and maintain a phytoplankton standing crop of eutrophic proportions it seems unlikely to be responsible for increased algal abundance in the St Lawrence Great Lakes or in any other body of freshwater
Certain inorganic elements have been referred to as micronutrients because they are utilized by in very minute quantities These elements according to Sawyer and Eyster (1964) are iron manganese copper zinc molybdenum vanadium boron chloride cobalt and silicon
Mackenthun (1967) states that manganese is one of the key elements in photosynthesis and that manganese-deficient cells may be expected to have a smaller amount of chlorophyll and a reduced level of photosynthesis Iron according to Goldman (1969) may be considered as much a macro- as a
15
A comparison of total C02 concentrations and componentTable 1 carbon species in a variety of freshwater lakes (From Schindler 1971)
Gaseous CO 2+ C0 = pH
3
0025 0017 0000004 00077 1003Lake 227
b C101 0089 0016 0000051 710Lake 239
00079 802Lake Eriec 185 180 0011
d 0013 0027 851Lake Ontario 193 189
Fayet tevi 1] e Creen Lake NY (marl)e 1 78 171 0022 0011 827
Averafe 099 096 0023 0001 8
Pil carbon data are in millimolesliter Values are for midsummer
(ekcept for world averaee freshwater) and corrected to 20C 2C02 = llCO- + + C03=
ELA lake Schindler unpublished data 1969
1969 unpublished data Note the similarity in all C02
fractions to Lakes Erie and Ontario The precipitation of CaC03 in Creen Lake appears to be duE to the higher concentration of cajLc~u[~ and higher total ionic stnngth
LIVIngston 1963 gAssllmed value
micronutrient It is important in algal photosynthesis and in nitrogen metabolisnl Arnon (1958) states thnt chloride is a coenzyme of photoshysynthesis and that it is specifically concerned with oxygen evolution Zinc and vanadium according to Goldman (1969) and Mackenthun (1967) are needed for photosynthesis and in carbon assimilation Mackenthun (17) reported that nitrate utllizaticn and nitrogen fixation may be dependent on the presence of boron and molybdenum Holm-Hansen (1954) and his CO-Iorkers showed that cobalt is required by blue-green algae Goldman (lq69) supplemented this statement by adding that cobalt is associated with the nutritional functions of vitamin Last but certainly not least in importance is silicon In where diatom
populations predominate silicon may well become a limiting factor according to Kilham (1971) and Schelske and Stoermer (1971) The latter investigators have stated that the limiting concentration for silicon dioxide in natural water is 01 mgl In their studies of Lake Michigan they concluded that silicon depletion can be attributed to phosphorus pollution and that for this reason diatoms have been largely replaced during summer stagnation by blue-green algae The investigators explained by stating that increased phosphorus brought about extensive diatom blooms which stripped the water of its silica When this happens biological competition is reduced and the blue-green algae which do not require silica grow profusely
Sources of nutrients Sewage effluent is one of the principal sources of nutrients In a study of twelve separate sewage sources Rudolfs (1947) concluded that the annual per capita contribution of phosphorus (P) from this source ranged from 06 to 15 pounds In the Madison Wisconsin area in 1960 the annual per capita contribution of nutrients by sewage effluent after secondary treatment amounted to 85 pounds of inorganic nitrogen and 35 pounds of soluble phosphorus (P) (Mackenthun et al 1960) The population of the area was 135000
Bush and Mulford (1954) investigating the nutrient values of domestic sewage in fifteen California communities found that nitrogen ranged from 20 to 40 mgl whereas phosphorus ranged from 53 to 106 rngfl Engelbrecht and Morgan (1959) in their study of the effluents of three tricking filter sewage treatment plants and one activated sludge plant in Illinois found that the mean orthophosphate concentration ranged from 51 to 106 mgl P and that the annual per capita contributions of phosphorus ranged from 15 to 39 pounds Oswald (1960) stated that the elementary chemical composition of average domestic sewage is 613 total nitrogen (N) and 107 mgl phosphorus
Other nutrients in a body of water may originate from agricultural and urban runoff (Lackey and Sawyer 1945 Sylvester 1960 Smith 1959 Engelbrecht and Morgan 1961 and Sawyer 1947) preCipitation on lake surface (Hutchinson 1957 McKee 1962 Lee 1970 and Voigt 1960) ground water (Juday and Birge 1931 and Lee 1970) nitrogen fixation (Lee 1970) release from bottom sediments (Hasler 1957 and Lee 1970) and waterfowl (Sanderson 1953 and Sylvester and Anderson 1964)
Although a great deal of work involving algal nutrition has been performed in the controlled environment of a laboratory the fact remains that when an alga is studied under natural field conditions a truer picture of its growth potential may be obtained Field studies may simply involve observations of algal populations which develop in waters enriched as a result of mans activities or the addition of
17
16
nutrients to containers tanks or pools which have been filled with water from the immediate area or the addition of fertilizers to natural bodies of water such as streams lakes reservoirs and lochs The objective in each instance being an evaluation of the eutrophication process
This method is an excellent one if a reliable body available to provide a good baseline which shows what the condition of the water was before pollution began For instance the addition of sewage to a previously clean river or lake offers a good opportunity for the effect of eutrophication Butcher (1947) used this method in his studies of the attached algae in four polluted rivers in England Only a short time earlier these streams had been unpolluted He noted that as one proceeded downstream repurification took place and that this was accompanied by the development of a succession of different communities of algae For example Stgeoclonium typical of the polysaprobic zone Ni tzschia and of the mesosaprobic zone and (occoneis pZacentula spp of the oligosaprobic portion of the stream
Mackenthun and his colleagues (1960) studied the effect of diverting sewage from a city lake to a nearby stream Following this diversion the previously unpolluted stream became literally choked with long streamers of Stlgeoclonium and Rhizoc7(1r1ium The intertwined filaments formed long streamers that in some instances were estimated to be fifty feet in length They also found that Chci llatoria covered the bottom of the stream in its upper reaches I t was concluded that severe stream degradation observed was a result of the diverted sewage The effect of sewage effluent in the Potomac estuary has been evaluated and described by Shapiro and Ribeiro (1965) They fonnd that sewage additions greatly increased the growth of green and blue-green algae
A body of water is in a constant state of aging which eventually will lead to greater and greater eutrophication Left untouched by man this process may go on for decades or centuries before the uninitiated detect the changes which have occurred However in a number of instances as a result of the activities of man such a change may proceed very rapidly and a previously oligotrophic lake may in a relatively short time become highly eutrophic A classic example described by Hasler (1947) is that of Lake Zurich in Switzerland In this lake there are two basins the Obsersee and Untersee which are separated by a narrow channel In less than 100 years the Untersee a deep and originally oligotrophic lake has become strongly eutrophic as a result of domestic pollution while the Obsersee has remained oligotrophic The eutrophishycation of the Untersee is clearly reflected by changes in the type and quantity of phytoplankton In the state of Washington Edmondson and his associates (1956 1961 1968) also have observed an advancing eutroshyphication In their work on Lake Washington studies in 1933 and 1950 showed the dominant algal forms were diatoms The lake at that time was considered to be oligotrophic In the mid-fifties however
11)
domestic sewage began flowing into the lake Since that time algal populations have shifted to more undesirable and eutrophic types of organisms such as the blue-green algae Oscillatoria rubescens is a species which has been reported as being very abundant
Even in the pristine waters of Lake Tahoe small signs of eutrophication have already been noted Smith and Ludwig and Smith (1968) have reported localized blooms of and Ulothrix in Lake Tahoe while Goldman and Armstrong during the past few years what they consider to be the first signs of eutrOphication The evidence for this was an observed increase in growths of littoral periphyton in which the predominating species was a diatom constrctum Var capitatum
The deterioration of Lake Erie has been followed by many inVestigators throughout the years Casper (1965 for instance has noted from past data and from his own that shifts have taken place in the dominant algal genera--from diatoms to greens to blue-greens Beeton (1965) found that the dominant plankters were Aphaniaomenon and MampeIOCUA~ All of these are indicators of eutrophic conditions The has also responded to increased enrichment According to Herbst (1969) and Neil and Owen (1964) this is demonstrated by the great proliferation of which is now seen in great masses along theshoreline
Artificial enrichment experiments Many studies have been reported upon wherein various kinds of nutrients have been added to waters held in artificial containers or directly to the natural environment itself Here again most of the studies deal with the effect of the enrichment on phytoplankton In contrast relatively little work has been done with periphyton in experimental field situations
One of the simpler outdoor enrichment experiments phytoplankton was carried out by Ansell and his They used fifteen-liter battery jars filled with water and a known amount of and phosphorus to grow Phaeodaetylum The jars placed on the of a building were exposed to natural light At selected intervals samples from each jar were analyzed for chlorophyll and total cell counts were made Abbott (1967 1969) in his investigation of the bloom potential of phytoplankton in estuarine waters enriched with N03 and used nineteen-liter carboys He concluded that in such waters elements must have been l~liting since he found no excessive blooms or oxygen production
Outdoor tanks or containers of varying sizes have also been employedin
studies In Dorset England Ansell and associates(1963b) used 1000 liter steel tanks which were centimeters deepThese tanks
were covered with polythene to prevent contaminationby dust and dilution by rainwater Edmondson 1947) impounded
19
seawater in tanks and then artificially enriched the water with phosphorus and nitrogen to note the effect of these additions on the algal population Skulberg (1968) utilized outdoor tanks in his enrichment experiments His results indicated that it was necessary to add botb N03 and P04 to the Akershus River water he was using in his experiments in order to significantly increase the biomass Strickland and his co-workers (1969) used outdoor tanks to study the composition of marine phytoplankton crops at low nutrient levels The tanks were three meters in diameter and ten meters deep An artificial light source was used
Near the Tuttle Creek Reservoir in Kansas Ewing and Dorris (1970) nine artificial ponds each having an area of 034 hectares The ponds lined with black polyethylene were filled with
Iater from a nearby lagoon Each pond was subjected to various combinations of organic enrichment Their findings were that under the conditions of this experiment chlorophytes predominated
Outdoor aquariums have also been used Kott (1968) using such aquariums aml a citrus waste effluent substrate to which he had added Fertilizers found that nitrate or phosphate by itself did not stimulate growth however the combination of the two good growth response llis optimal growths were ohtained at 50 N03 and 20 mgl P04 Concentrations greater than these brought about a reduction of the phytoplankton
The above methods exemplified by the impounding of water in artificial tanks has been criticized by McAllister et (1961) They contend that due to the shallowness of most tanks the lighting is unrealistic and usually undesirable temperature increases will occur Furthermore according to them no precise balance of dissolved oxygen or ca rbon dioxide can be readily computed because suci a large surface area of water is in contact with the atmosphere To overcome these difficulties NcAllister and his co-workers devised a free-floating thin plastic sphere twenty feet in diameter The sphere placed in the waters off of Vancouver Ioland was sllspended so that its center was 55 meters beneath the sea surface A long narrow neck extending to the surface of the water from this large bag served as an opening through which samples could be taken Their studies showed that water in the sphere closely approximated that of the surrounding sea water both in temperature and in illumination No artificial sources of fertilizer were used however to remove metabolites and to replenish nutrients water from the immediate environment outside the sphere was pumped into the bag after a filtration process which rmnoved its phytoplankton and zooplankton A culture of coastal phytoshyplankton was inoculated into the sphere in order to seed it and the resulting growth patterns were then followed
Another fertilization experiment employing three large plastic
20
pools which were floated in a lake has heen reported upon hy Brice and Powers (1969) In this study carried out on Shagawa Lake near Ely Minnesota various mixtures of domestic sewagp effluent were pUDped continuously into two of the pools the third which received only lake and municipal water served as a control Each of the pools had a capacity of 135000 gallons (510 m3) Influent was supplied to each at the rate of seventy gallons per minute Proportioning equipment made it possible to closely regulate nutrient inputs into each test pool The ultimate goal of this study was to determine on a controlled basis what effects various types of sewage effluent would have on algal growth Megard (1969) in his initial study on the algae and photosynthesis of Shagawa Lake found that certain concentrations of sewage effluent were stimulating whereas others were inhibiting He states The effects of different amounts of effluent from secondary and tertiary sewage treatshyment plants on the photosynthetic capacity of algae were measured Photosynthetic capacity was stimulated 40 by 5 and 10 secondary sewage effluent but inhibited by 20 secondary effluent Photosynthesis was stimulated slightly hy tertiary effluent but 20 municipal water stopped photosynthesis
Fish ponds have been llsed by some to study the effec t of end chmen t For example Hepher (1962) applied superphospha te and ammonium sulfa to to one fish pond while another was left as a control Each pond was 01 hectars (1000 m2) in area and seventy to ninety centimeters deep His results utilizing ~le light and dark bottle method showed a carhon increase of four to five Umes in the fertilized pool as compared to the control Swingle Gooch and Rabanal (1963) also make use of fish ponds in carrying out fertilization experiments They found that the addition of nitrogen and potassium produced no Significant increase in plankton biomass or fish yield When phosphate alone was used it was again discovered that no significant increase occurred in the yield In fact in some instances the phosphate additions tended to delay algal response
One of the first reported lake fertilization experiments as conducted by Einsele (Brezonik et al 1969) He applied slug doses of superphsophate to a small German lake in 1937 and 1938 Temporary increases in the phytoplankton of th lake was observed hut in each instance the lake soon returned to normal
Another early lake fertilization experiment was conducted by Smith (1945) He added one ton of mono-ammonium phoBphate and 500 pounds of potassium chloride to Crecy Lake in New Brunswick After this addition of fertilizer the twenty hectare lake which previously hnd been unproductive developed a heavy growth of plankton and the benthic biomass increased greatly Heavy blooms of Agtzalxwna and whiel1 previously had not heen seen in the lake were observed after lization Also the record aquatic vegetation increased Hence since Crecy Lake was sufficiently self-regulating the effects of enrichment were temporary and the artificially induced eutrophication was found to he largely reversihle
0middot l
Langford (1948) another Canadianvesearcher investigated the effect of enrichment on five lakes in Algonquin Park Ontario He fertilized four lakes and left one as a control In order to determine the fate of the augmenting inorganic nutrients in the biomass detailed analyses were made to assess changes in dissolved chemicals the plankton bottom organisms forage fish and game fish His results showed that as a consequence of fertilization a marked increase occurred in the net phytoplankton within three weeks Diatoms and flagellate protozoans showed the greatest increase
An interesting experiment has been carried out by Brezonik and his co-workers (1969) on two small Florida lakes To study eutrophication they artificially enriched one lake at a controlled rate and measured parameters that characterized the condition of the water The other lake one-half mile away was used as a control Both lakes were similar in physical chemical and biological characteristics At the beginning of the experiment they were both considered to be oligotrophic Nitrogen and phosphorus were added to the experimental lake in amounts which in one year would raise the N content 050 mgl and phosphorus 00427 mg1 Each week to achieve this 300 gallons of sewage effluent suitably enriched with nitrogen and phosphorus were added to the lake at the rate of 1 8 gallons per hour Although in the enriched lake a large and diverse number of species and genera were still present carbon fixation increased greatly and the quantity of chlorophyll rose as additions went on
In contrast Schindler (1971) working with northern lakes added nitrogen and phosphorus in their inorganiC form to an experimental lake in northwestern Ontario In his study which covered the summer periods of 1969 and 1970 nutrients were distributed throughout the epilimnion of the lake on a weekly basis During the 1969 was added in quanti ties which resulted in a dosage of 03
added to produce a dosage of 504 g and 629 g Nm2yr were added On the basis of this work
Schindler concluded Phytoplankton standing crop increased greatly after fertilization as indicated by cell volume or chlorophyll concenshytrations Species changed from the cryptophycean and chrysophycean genera which are common in most unfertilized lakes of the area of chlorophytes in summer of 1969 Cyanophytes appeared in large numbers for the first time in August 1970
Reservoirs such as that of the Tennessee Valley Authority at Norris as well as lakes have been artificially fertilized Wood and Sheddan (1968) fertilized six coves of the Norris Reservoir with mono ammonium phosphate and ammonium sulfate Two of the coves served as controls Phosphorus was added at the rate of 25 or 50 and nitrogen at the rate of 50 and 100 fJgl Three zooplankton blooms were observed after fertilization They noted no increase of game fish in the fertilized coves
22
Nany European orkers have actively carried on enrichment studies Gross and his co-workers (1946) added nitrates and phosphates to various arms of a sea loch in Argyll Loch Sween According to Smyth (1955) nutrient addition did not produce any observable changes in the periphytic diatom population He suggested that the natural phosphate concentration may not be a limiting factor to the extent that it is for planktonic forms This he states could be due to a higher phosphate concentration at the mud surface then in overlying water or to the fact that bottom diatoms may have a lower phosphate requirement Further mention of this specific work has been made by Raymont (1949) Marshall and Orr (1947) have similarly investigated the question of enrichment but on an entirely different sea loch Loch Craiglin Brook and Holden (1957) and Holden (1959) have similarly reported on tbeir experiments in Scottish freshwater lochs in Sutherland Brook and Holden added calcium superphosphate to a 166 hectare loch to the extent that it gave them a concentration of approximately 330 lgl of They observed an eight-fold increase in phytoplankton abundance in first two years Holden (1959) enriched four lochs on five different occasions between June 1954 and August 1955 Two other lochs were untreated and studied as controls This fertilization led to a large increase in phytoplankton especially in the two lochans treated witb nitrogen-phosphorus-potassium (NPK) fertilizer Both of these developed blooms of Chloroccales and blue-greens Pbytoplankton increased to as much as 60000 cellSTIll in enriched waters compared with maxima of 500 and 1800 cells in the controls The plankton species in the treated lochs changed to those more characteristic of eutrophic waters
In order to study the enriching effect on aquatic macrophytes Caines (1965) artificially fertilized a loch in Pertshire by dropping bags of superphosphate fertilizer over approximately half of the lochs area A specific analysis was made on the effect of this enrichment on Zlwn altcTnijZorwn and In this instance only aquatic weeds were made of phytoshyplankton or periphyton fluctuations
An interesting study relating to marine enrichment has been done by Roels and his co-workers from the Lamont-Doherty Geological Observatory of Columbia University Their work as revie~led by Pinchot (1970) consisted of pumping deep ocean water heavily charged with nutrients into a coral atoll on the Island of St Croix in the Virgin Islands They found that selected plant life would grow twenty-seven times faster in ocean water from greater depths than in that from the surface The concentration of nitrogen and phosphorus compounds in the ocean according to Roels reaches maximum values at depths of from 2000 to 3000 feet In the Pacific and Indian Oceans phosphate reaches 90 (297 rug Pm3) at this de~th and at meters in thf Atlantic Ocean phosphate reaches 60 mgm- (198 mg ) In the Pacific Ocean at 1000 meters nitrate reaches approximately 50 lngm3 (1125 mg Nm 3) Pinchot suggested that this technique could be used for the enrichment of lagoons and to fertilize such areas as Long Island Sound for oyster production
23
Methods of nutrient delivery In artificial fertilizing techniques Table II Average Chemical Characterisitcs of Great Lakes Waters (USthe common method for the delivery of the nutrients is the batch method Bureau of Commercial Fisheries data unless designated other-In this approach a certain number of pounds of chemicals are simply added wise Data based on samples from various depths) periodically to the experimental container or body of water Another method employed by Caines (1965) and Huntsman (1948) was to place permeable bags of fertilizer directly into the water where the chemical Totalwould then slowly dissolve and be released into the surrounding water Lake Calcium Magnesium Potassium Sodium alkalinityIn a number of these fertilizing experiments it was difficult to (ppm) (ppm) (ppm) (ppm) (ppm CaC03)quantify the amount of nutrient which was administered Improvements in this technique have been made by Brezonik et al (1969) and Brice and Powers (1969) who have used proportioning equipment to deliver Superior 124 28 06 11 46known quantities of chemicals or sewage into the incoming water
Huron 226 63 10 23 82
Nutrient Levels in Lake Superior Michigan 315 104 09 34 113
Beeton (1965) has compiled chemical data on the Great Lakes from Erie 367 89 14 87 95thirty-four references one of which goes back to samples taken in 1854 In evaluating these he observed a progressive increase in the concentrations Ontario 393 91 12 108 93of various major ions and total solids in all of the lakes except Lake Superior Beetons collection of data indicates that the total dissolved solids in Lake Superior have remained constant at 60 ppm
The chemical characterisitcs of Lake Superior have been compared with the other four Great Lakes by Chandler (1964) These data Specific
Chloride Sulfate Silica Totalpresented in Table II clearly show that Lake Superior contains the conductance lowest nutrient concentration of any of the Great Lakes Lake (ppm) (ppm) (ppm) phosphorus - pH (micromhos
(ppb) at 18 C) One of the most comprehensive studies on nutrient levels in western
Lake Superior has been carried out by Putnam and Olson (1959 1960) Superior 19 32 21 5 74In their work a large number of samples were collected from a variety 787
of locations and depths A location which perhaps best reflects the Huron 70 97 23 10water quality found at the Castle Danger project is the Knife Rivershy 81 1683
Larsmont area The values they obtained for several chemical parameters Michigan 62 155 31 13from July 1958 to March 1959 are presented in Table III of the following 80 2258
page It will be noted from this Table that phosphorus values are Erie 210 211 15 61reported in microgram atoms per liter If desired these values may be 83 2418
converted to parts per million or parts per billion as follows Ontario 235 324 63 85 2723
lg atoms x 31parts per million (ppm) 1000
Ayers Anderson Chandler and Lauff 1956parts per billion (ppb) lg atoms x 31 From Chandler (1964)New York State Dept Health 1958
Inorganic phosphorus as may be seen from this Table never was higher than 007 microgram atoms per liter (2ppb) The average for all samples at the surface and at 200 feet was 0029 lgAl (09 ppb) Total phosphorus ranged from 010 to 046 lgAl (3-14 ppb) The most common value appearing over thirty percent of the time was 024 lgAl (74 ppb) This figure is only slightly higher than the average total phosphorus
2524
C
0
00
(lJ
gt 7
u C) rj
CF
t
s u
u
_shy
(j)
gt
10 L Q~
0 v
0 ~
()
co lt-t
c)
co
0 01
c) V
co v
C) v
cl-
(
c) v
0 v
[shy
0
C) v
0 v
c
C ID OJ L ()
Gl t ~
0 ()
0
r-~
0
0
rr 0
C)
j
N
0
ltt
c
()
c
Ul
26
CJ In
0
tn
LD
CJ
Li]
VI
N
r
C)
N
0
0
0
0 C)
a)
O~
0
0
C) D
(~
c j
(~ 1U j
~rl If)
C-J
N
0 C-J
t
C C
) cJ 0
Ql +shy(0
l 10 +shy0 fshy
gt +shy
0 Ul
IU +shy0 f-
Ln
r-
0
~~
C)
r~ [I
0
rshy
DIn 0
Lr
r~ lt~
0 0
Ln
r
[ c
r-middotshy
r-
C
r j
tIl
I~~
I
0
r 0shy
0
c 0
D L llJ
0
l
Ql CJ_
t r1J
u
u c
m lJl
ell ugt ell
c J
e 0
m +shyL
c
Ql L
J
Ul () J
values expressed by Chandler (1964) At the Knife River Station nitrates ranged from 084 to LIS ppm with a mean of 103 ppm Only traces of ammonia nitrogen organic nitrogen and nitrite were detected The mean chemical values reported by Putnam and Olson (1960) for the period July 15 to September 10 1959 may be summarized as follows
~
lJ2olimnion
Silica Carbon dioxide Nitrate (N03) Organic nitrogen Inorganic phosphorus Total phosphorus pH Alkalinity
204 128 159 014
lt0003 0012 79
385
(lt3 ppb) (102 ppb)
213 233 196 013
lt0003 0013 77
laquo3 ppb) (136 ppb)
These results are very similar to those reported earlier by Putnam and Olson (1959) Values for nitrates and total phosphorus in 1960 are slightly higher than those of 1959 Routine analyses performed during the sunnners of 1964 to 1971 by School of Public Health students showed that the results obtained by Putnam and Olson (1959 19(0) have remained essentially the same The supporttng chemical data collected by Fox (1969) Stokes (1969) and Parkos (1969) are also in close agreement with the original study
Winter (1971) has provIded additional cbemical data on Lake Superior In his work samples were collected from a total of twenty-two stations in the Duluth-Superior Harbor area the open water of Lake Superior the Apostle Islands and Chequamegon Bay Ashland Wisconsin Six of his sampling sites were located on a center transect running from the Dulllth-Superior Harbor to a point north of the Apostle Islands Distances of the sampling points from the harbor ranged from 16 km (10 miles) to 113 km (70 miles) Another sampling site was located among the Apostle Island group near Devils Island The average chemical values for tbe above mentioned stations along the transect and from the Apostle Island area representing a total of seven samples are presented below
~
Organic nitrogen 014 Ammonia nitrogen 0036 Nitrite-Nitrogen 0002 Nitrate-Nitrogen 023 (101 mglTotal inorganic N 027 Soluble phosphorus 0007 (7 ppb) Total phosphorus 002 (20 ppb)
27
The above averages compiled from Winters data show that nitrogen values are closely comparable to those reported by Putnam and Olson Total phosphorus ~lich ranged from 14 to 28 ppb in the seven collection areas was slightly higher than the averages of Putnam and Olson
28
CHAPTER III
MATERIALS AND METHODS
Project Site Selection
To provide an aquatic environment for periphyton growth which would be natural and which would lend itself to experimental modification a field station consisting of two rock-basin pools a piping system and a small building to house the pumps meters and other necessary equipment was established on a relatively isolated stretch of shoreline near Castle Danger Minnesota This particular section of shoreline comprises part of a 50-acre tract of lakeshore property owned by the University of Minnesota It is located about 40 miles from the Lake Superior Limnological Research Station at the Lester River which served as a base during these studies (See Figure 1)
The best site for pool construction was determined on the basis of a preliminary survey which encompassed approximately one-third mile of shoreline north of the Castle Haven resort The specific site eventually chosen was a flat rocky ledge approximately fifteen feet above the lake at the southernmost boundary of the University property This site met nearly all of the conditions set up in the original research plan and the following criteria were satisfied (1) The rock stratum was sufficiently level and large enough to assure exposure of both pools to equal amounts of insolation (2) The elevation above lake level was high enough to prevent ordinary or moderately-sized waves from splashing water into the pools (3) The bank above the pools was adequately sloped to minimize the possibility of seepage and surface runoff into the pools (4) The area was fairly well protected from the effects of periodic storms (5) The rock substrate itself was solid with only a few fine fissures and little evidence of crumbling (6) The pools were near a source of electricity which would provide power for the pumps and lastly (7) The area could only be reached by driving through the Castle Haven resort and thus satisfied the requirement of being isolated--a necessary condition for the prevention of vandalism
General layout and construction details The shoreline site as it appeared prior to construction of the pools is shown in Figure 2 The site was laid out to determine the approximate dimensions needed to provide space for two pools each containing about 3000 gallons of water With the aid of a heavy-duty air hammer the basalt rock bed was shaped into a large basin with a capacity of about 6000 gallons Rock fragments were chiseled out and removed from the middle however any rocks which could be utilized in the formation of a wall were left in place In those areas ~ere natural rock could not serve as a wall a low cement
29
site at 10 Oanger Minnesota asFi beforo oxperirnenlal pool construction
gu r~e Construction of forms in experimental pool bull I e Danger~ 1969
30
foundation was constructed as a basis for a cement-block wall Before the foundation was laid 9-inch deep holes were drilled into the solid rock at two-foot intervals l2-inch steel reinforcement rods were then anchoredlin the holes thus providing the needed strength and wall support
Because of the irregular contour of the rock bed the foundation had to be stepped to permit the construction of a all which would be level at the top Figure 3 shows the type of form used in the construction of the foundation and all of the cement used in the walls and foundation was mixed at the site with a small portable mixer Concrete blocks were subsequently laid upon the foundation to form the front and center walls whereas the back and side walls were almost entirely composed of natural rock The center cavities in each 8 x 12 block were filled with small rocks plus a 31 mixture of cement steel rods were then inserted to bind the blocks together and add further strength to the wall
Upon completion of the front and side walls a center wall of monolithic concrete was constructed which in effect divided the basin into two separate pools of approximately similar dimensions and volume To minimize leaching of calcium from the cement blocks and center wall the pools were scrubbed with a solution of technical grade hydrochloric acid After filling with water to test for leaks the pools were again drained and any small cracks or fissures judged to be a potential problem were patched with an inert hydraulic cement sealer known commercially as ThoroseaZ
Because natural rock had been used in their construction the general shape of the pools tended to be slightly irregular The control pool was roughly rectangular in shape whereas the test pool was more triangular in outline The exact layout and dimensions of the pools are shown in Figure 4
Water circulating system Initially a 13 hp continuous-duty centrifugal pump with one-inch delivery piping was installed on a platform at the edge of the control pool (15 feet above the lake level and approximately 20 feet inland) A 25-foot suction line--firmly anchored to the rocky ledge in four places--connected the pump to an underwater intake pipe which was equipped with a foot-valve and extended eight feet into the lake A tee-joint coupled to the discharge line directed the incoming water into both pools and each feeder pipe was provided with a valve to permit manual control of the flow into each pool
After several days of pumping the screen in the foot-valve became clogged and as a result the starving pump overheated burning out
lThe anchoring material was a specially-compounded substance known as Pour Rock
31
w-~ z
~
-0gt lt1J
0 r- g ~ ~ a
~ 0 ~ ~ Q) ) 0 11 t shy
2C1 ~~CEr 41 (1) 11 a OJ tJC i-OEiL
4) 0 0 0 ~ c ~oct(n-Il~~ ~ ~o OII~
~~~~sect~~~ JU)asClW~O
I laquo lt1l ltgt 0 W lL () x
a seal It was replaced by a more powerful 12 hp centrifugal pump however this pump required the use of 1 l2-inch suction and discharge pipes and consequently all of the previous piping had to be replaced The capacity of the new pump was approximately 61600 gallons per day [~ 428 gallonsminutel a volume far greater than the amount needed Therefore since it is not recommended that centrifugal pumps be throttled because of the production of dangerous back-pressures a simple by-pass was installed allowing the excess water to flow across the ledge and back into the lake In time the rock surface over which this excess water flowed also developed a periphytic growth which was later examined and the information obtained is included with the basic data presented in this study
c Q) Unfortunately installation of the new and more powerful pump did Ul
not eliminate all of the preliminary problems The foot-valvesc m D continued to clog with predictable regularity When these were replaced Q) by a gate-valve it was found that without the foot-valve small stones
some as big as marbles were sucked into the pump and jammed the ~ ~ impeller blades This problem was eventually resolved by capping the end of the intake pipe and randomly drilling a series of thirty 38-inchtshy
ro holes within the distal three-foot section At least three layers of U) l4-inch hardware cloth were loosely wrapped around this portion of
the intake pipe and this was apparently sufficient to reduce the8 - velocity of water entering the pipe to a point where small pebbles could
no longer be picked upltU t-c Q)
E Construction of pump house and instrument shelter As shown in L
Figure 5 a small building (6 x 8 x 8 feet) was constructed at the edge C) CL
of the pools to house the pumps chemical supplies and recording X instruments and to provide a place for laboratory work The floor of
C)
the sturcture was exactly 15 vertical feet above the lake surface and 0
~ was supported at each corner by a cement foundation tied with reinforcing
3 C)
rods to the underlying rock In addition to the shingled roof and
gt tiled double floor it was completely insulated and furnished with fluorescent light a fold-up work bench and a small space heater whichc
ro helped to maintain relatively constant temperatures during cold weather CL
Calibration of pool system The exact capacity of each pool when filled with water to a level about two inches below the rim was
C) calculated by measuring the flow rate of the incoming water and the 0 time required to fill the pools For this preliminary determinationE
flow meters were temporarily installed on each branch of the pump
~ discharge pipe The pool with the largest capacity designated as the control pool contained 394 cubic feet (2950 gallons) of water the test pool slightly smaller contained 337 cubic feet (2520 gallons) The water level in both pools was regulated and maintained by means of
LL two overflow pipes These pipes were 2 inches in diameter and drew water from the bottom of each pool discharging it on the outside of the pool wall at a point adjacent to the lake [Figure 4) The overflow ran
33
32
r-I
over the rock ledge before entering the lake and once again a periphytic growth was This growth was also examined and the information obtained has been included in the present study
As shown in Figure 5 the control pool was built at a slightly higher elevation than the test pool This was done to eliminate any possible diffusion of water from the test pool into the control pool
L Although there was no cause to believe that any appreciable water QJ exchange would occur through the eight-inch central wall since it haden c fl been treated with Thoroseal and every possible precaution had been il taken to construct an impervious wall by maintaining a higher level in (J) the control pool--eight inches in this case--the hydraulic head produced In would be sufficient to guarantee that if diffusion were to occur it () (0 would proceed from the control to the test pool This is an important
consideration because the test pool water was experimentally enrichedL o and any diffusion in the reverse direction would have altered the I quality of the natural 1akewater in the larger pool thus invalidatingQ)
- CL its use as a control U)
ill -
Field and Laboratory Procedures 1969
Phosphate as K2HP04 was delivered to the test pool concentration of 50 ppm (parts per million)
equivalent to 163 ppm phosphorus Although the amount of phosphorus added was recognized as being much greater than the optimum this dosage was chosen because it was high enough to be easily measured and yet presUlllably low enough to produce a rapid growth without exceeding the threshold of inhibition
As was true with other facets of the study the exact method to be used for delivering preselected chemical dosages had not been determined
o and it was first necessary to develop such a scheme on a trial-and-error 00cuD basis The methodology and apparatus finally adapted for use during the
0 fall experimental period is described below ltD t-CC ltD (J) tshy The method chosen can be described in general as a IC 0
In system The phosphate was delivered to the test pool through TygonL ltD Q c tubing and the dosage regulated by a 14-mil1imeter bore capillary CLC X -shy tube Since it is well known thac the amount of fluid which will pass
Ul ~ through a capillary can be altered by changing sHch factors as the length of the tube the hydraulic head applied to the system or the temperature delivery rates can therefore be altered in an otherwise stable system by simply changing the length of the tubing Figure 6 shows the relationships which exist between the length of tubing and milliliters per minute delivered under field conditions prevailing at Castle Danger since 1969
A satisfactory nutrient level could thus be maintained by knowing the (1) volume and overturn rate of the test pool (2) stock phosphate
34 35
laquo)
OJ laquo)
11 Q o L
0
E
CD o
o 0
(J
TJ
~ ~
tn o tn 0 ltXl CO r-middotmiddot f- shy
~~~l__---_----- 5
cl 9J n-lI2Jedw81o
o
L1) 01) C) If) 0 L1)o o -l rl (gtj N m
(W~) 4-l5U9l 5uqnl
36
(0
(1)
L1)
GJ +~ tJ c
E E
L1)
i
L1)
C)
concentration and (3) drops per minute from the capillary tube (I)
(Qifgt During this experiment the volume of water flowing through both +shyo
Q) o pools was kept constant at two overturns per day or roughly 5000 (n u ill gallons in the test pool and 6000 gallons in the control pool The c c
c stock phosphate solution was made by dissolving 1680 grams KHPO in ~ L 355 liters distilled water l This amount was sufficient to
e gt for seven days at the delivery rate produced by a 1 LIZ-inch capillary Q)
L tube This delivery rate (47 dropsminute or 5 lite~rsday) was maintained(J)
OJDshy c throughout the duration of the experiment Since the object of the studyE (Q
o was to maintain a constant level of phosphate in the pool the strength~ ill of the stock solution was kept at the level indicated above At this
~ +shy juncture it should be pointed out that the system is quite flexible in (Q
(1)
U1 terms of changing dosages inasmuch as it is only necessary to alter
U-o the concentration of the stock solution being delivered to the capillarya gt o
L The general arrangement of the chemical delivery system is shown in
~ gt Figure 7 Delivery through the capillary tube worked well however Q)
in order to maintain a regular rate it was essential that the temperature o remain fairly constant Higher temperatures tended to increase the
(j) dripping rate whereas the rate was decreased at lower temperaturesx (Figure 6)
The chemical feed technique is schematically illustrated in -)CT
Figure 7 From a 40-liter carboy the stock solution flows to a plasticOJ
basket containing a float mechanism which serves to maintain a constant head and thereby insure a constant drip rate from the capillary tube The measured stock solution then enters a modified toilet tank which
u functions as the holding and mixing reservoir The tank float controls +- incoming water from the main pump and keeps the water in the tank at a ltJl
constant level Sufficient pressure is thus maintained to cause the pound +shy
ill chemical solution to flow steadily and freely through thirty feet of
(Q
a L 38-inch Tygon tubing into the test pool The measured chemical is delivered at the point where incoming water from Lake Superior enters
o
gt ~
(I) the pool During the months of November and December the tubing was gt wrapped with an electric heating tape and fiberglas insulation to-(1) provide protection from the freezing temperatures0
0tr ill
Analyses for orthophosphate using the stannous chloride-molybdate gt r method were made on a routine basis during the first few days when
~ nutrients were initially being added to the test pool This was donecgt ltc Q)
to evaluate the efficiency of the dosing technique as well as to ascertain -1 whether the chemical was being evenly distributed throughout the test
Q) pool To check the circulation water samples were collected from four
0 representative areas of the test pool and results were then compared ~
gtD
ill L tJ lvalues are given in the Appendix A en
lo
37
L (j) I +- -~ c
c _- U IU 11J (Q
I +- t (j) ltgt pound oct gtshy
c n (l J
C fj (j)
0 U Jl
+- C J 1J
IT o gt C X (f) 0
_0 L +- -
C YI
u 1J t1J (0 - r-i shy
o U ()+- o L I +- co In U
lt en
+- L (Q (j)
O+shy1J
lt
r+ +shylt c
_L 0 c If)
] shyU
U) 0 c +shy- Ul X~
LLJ
Since the results indicated that phosphate levels were the same at all points and at different depths it was concluded that adequate mixing was taking place The same procedure was followed in the control pool
(j)
+- a to detect the possibility of diffusion from the test pool there was no 1l ill evidence of such diffusion and results were uniform throughout Finally
a number of samples were taken from the lake near the water intake and from an area some distance up shore This was done to determine whether
Q or not the phosphate-rich overflow from the test pool had affected the E
quality of the intake water No differences were observed in either theJ Ll Il- lake water samples collected at the intake or those obtained up shoreshy
All analyses indicated that no cross-contamination had occurred c 0 en gt- Values from the test pool were extremely close to the calculated cmiddot and desired value of 50 ppm phosphate Following the shakedown period
and for the remaining seven weeks phosphate determinations were done on IL
a weekly basis The data obtained during this period using the previously described method are presented in the Appendix [Section BJ
C gtD (1 By the middle
of tests were begun c This program of per lphyton-covered rocks from the lake
and the strategic placement of these rock in tle pools As shown inU ill If)
Figure 8 the collection area for 1969 was situated along the shoreline J a short distance from the experimental pools Hithin this area the natural Q) J
protection from rough water afforded by huge boulders extending outward IT into the lake allowed periphyton to grow profusely on the submerged rock c substrate Ideally rocks for use in thi tYJlE of a study should bec U approximately uniform in size and fairly smooth and rounded in shapeill + However since rough water during the preceding three weeks in those areas JQ)
where ideal rocks were availabl ( had vi r tuall y removed all periphytic (j) growths it became necessary to use the periphytnn-covered rocks in the
designated collection area although they were irregular in both size and ro shape and often quite jaggedu
E ill The rocks were collected by simply reaching into the water at variousc U depths and selecting those vlhi eh showerl eood ped phytic grOlrth The
procedure followed was essentially the same as that described by Fox r--shy et al (1969) and Stokes et (1970) After placing the hand and forearm
L Q) into a two-gallon size plastic bag the collector grasps the preselected J rock then rhile firmly gripping the four to six inch specimen the plasticOJ
LL bag is pulled down over the wrist dnd thEe rock and the specimen enveloped in its plastic bag is removed from the Welter and placed in a small plastic bucket In the present study the plas tic pail s with their contained rocks were transferred from point to point in a Sportynk dinghy
Af ter an appropriate number of rocks ha d heen co llectd they were brought back to the pools in the small elinehy The plastic bags were removed and the rocks were planted in the partially-filJed pools each rock being carefully repositioned in a manner sifli1ar to that which it had occupied on the lake bottom forty-eight rocks--rranged in a series
39
38
Sliver Cre~ - township -
Experimental POOLS
poundak middotw~ict
N
F 8 Detailod map of the shorel ire in the Castlo Danger study area
40
of eight north-south rows--were placed in each of the two pools with precautions being taken not to place them too close to any wall that would produce shade for an appreciable of time The entire transfer procedure including collection final placement of rocks required approximately two hours of time After a one week period of stabilization phosphorus was added to one pool and the other was reserved as a normal lakewater control
Experimental program At weekly intervals four rocks were removed from each pool and examined for growth (Figure 9) The method of retrieval was essentially the same as that previously described by Fox and Stokes (1969 1970) Each pool was roughly divided into four locations and from each of these a rock was removed at the time of a
run In addition at two-week intervals rock samples serving as a second control were taken directly from Lake Superior in the same location as the original test rocks
Laboratory procedures Biological and chemical analyses were done in the laboratory at the Lake Superior Limnological Research Station at Duluth Procedures for periphyton recovery and delineation of rock surface area were essentially the same as those described previously in related studies [Fox et aZ (1969) Stokes et at (1970raquo) Upon return to the laboratory rocks were removed from their plastic pags and placed in a small tub The area of periphyton growth on each rock was outlined by scoring the surface with a diamond-point marker so as to provide a basis for subsequent enumeration and comparative tabulation of organisms present
Following removal of the periphyton the correspondingly scored area on each rock was lubricated with a thin layer of white petrolatum and coated with a one-quarter inch thick layer of melted paraffin Before becoming completely set and while still pliable the paraffin coating was separated from its rock template by making a series of vertical incisions with a scalpel loosening the flaps thus fonned and carefully peeling off the coating as a single piece The intact replica was then flattened and its contour traced on a sheet of white paper The total surface area in terms of square centimeters was determined by retracing the outline with a previously-calibrated polar planimeter
After the boundaries of growth had been engraved on the rock surface the periphyton was scraped off with a stiff plastic brush and together with a small amount of distilled water used in rinsing the rock and the plastic-bag the suspension was measured in a graduated cylinder and then transferred to a small plastic container It was from this container that aliquots were taken for chlorophyll analysis species identification and enumeration and weight detennination
Because the analytical procedures involved required that aliquots be nearly identical as possible the periphytic suspension was thoroughly
41
I
r agitated prior to the removal of each sample The method of m~x~ng used was developed in this laboratory and is a relatively simple procedure involving only the container itself and a glass funnel approximately oneshyhalf the diameter of the sample container After the mixture is transferred to the specified container the glass funnel is inver-ted and slowly pumped up and down within the slurry until the suspension appears to be unifornlly distributed throughout the container At this point the aliquot is quickly removed
Chlorophyll analysis The procedure used was that recommended by Creitz and Richards (1955) in conjunction with certain modifications
1 which had been developed in this laboratory in 1965 The basic steps~ in this modified method are described as follows l The aliquot is
filtered through a Gelman type A glass filter and residue washed with 15 ml of a saturated magnesium carbonate solution The filter isJ then ground in a Teflon tissue-grinder along with 6 ml of 90 spectroshygrade acetone The ground material plus supernatant is transferred to a graduate centrifuge tube and 90 acetone is used to adjust the final volume to 10 mililiters After the stoppered tube has been centrifuged for ten minutes the clear supernatant is pipetted into a l-cm quart7 absorption cell and analyzed in a Beckman DK-2A ratio-recording spectrophotometer with 90 acetone as the reference standard Equipped with a cooling device for maintaining a constant sample temperature of 24deg C this instrument automatically scans the visible spectrum from 350 to 700 millimicrons while simultaneously tracing the results on a chart Hence by repeating this procedure in exactly the same manner a series of curves characteristic of each sample aliquot can be obtained
To be useful in a study of this type the values represented by the curves msut be translated into terms applicable to the problem at hand This is done as follows The first step involves the examination of each curve to determine the absorbance values at 665 645 630 510 and 480 millimicrons With the aid of specific formulae developed by Richards and Thompson (1952) these absorbance values can be used as a basis forr the calculation of chlorophylls a b and c as well as the concentrationI of astacin and non-astacin carotno1ds The formulae used in the present study are given as follows
[D = absorbance at a given wavelength D residual absorbance at a given wavelength minus res the absorbancies of the chlorophylls
MSPU Millispecific Pigment Unit It represents a specific but undetermined weight of the pigment
lAliquot size in this determination varied according to the concentration of the sample
2The carbonate acting as a buffer prevents the conversion of chlorophyll to phaeophytin
[
43
i (Ju roe f
and should be about 1 mg based on the weights and absorption coefficients of related compounds (Richards and Thompson 1952)
Chlorophyll ~ (mgl) 156 D665 - 20 D645 08 D630
Chlorophyll b 254 D - 44 D 103645 645
Chlorophyll ~ (MSPUl) 109 D630 - 125 D665 - 287 D645
D 510 D - 00026 C - 00035 C 00021 C res SIO a b c
D 480 - 00019 C - 00136 C 00054 C res a b c
Astacian carotenoids (MSPUl) ~ 2 (44 Dres5l0-Dres480)
Non-astacian carotenoids (MSPUl) ~ 76 (D 480 - 149 D 510)res res
Results obtained by the above calculations are next converted to milligrams (or MSPU) of pigment per 100 square centimeter of rock surface Values for chlorophyll a b and c may be added together to express total chlorophyll In the present study chlorophyll values of the four rocks from each pool were added and an average total chlorophyll production for a given week was recorded Along with the total chlorophyll production for a given week values were also compiled for the total production of the specific pigments
For the determination of dry weights a was removed from the periphyton slurry and
filtered through a previously weighed four centimeter Whatman (No 41) filter paper The filter was dried at 103 degrees centigrade for one hour cooled in a desiccator for one hour and then reweighed To obtain organic weight the above filter together with a previously weighed crucible was placed in a muffle furnace at 600 degrees centigrade for fifteen minutes cooled for one hour in a desiccator and then the crucible with its contained ash was reweighed After deductions are made for the weight of the crucible the results expressed as milligrams per square centimeter of rock represents the weight of the ash (inorganic materials) If this is subtracted from the original dry weight organic weight is obtained This is usually referred to as the ash-free dry weight However for practical purposes in this report the term organic weight will be used in place of the indirect expression ash-free dry weight
Identification and enumeration of organisms From the combined slurry suspension derived from the four rocks collected from each pool a 100 milliliter aliquot was removed for the purpose of the identification and enumeration of the organisms which made up the periphyton growth
44
This sample was preserved with five percent formalin Due to the concentrated nature of each sample it was necessary to make dilutions of the basic suspension to avoid overlapping of organisms in the counting cell and attendant inaccuracies After a suitable dilution had been found a dropper was used to transfer one milliliter of the sample into a Sedgwick-Rafter counting cell The sample was allowed to settle for ten minutes before the slide was examined A binocular microscope provided wlth a calibrated Whipple disk was used and then random fields were counted Organisms were examined at a magnification of 200 diameters and were identified to genus By knowing the total volume of the peri shyphyton-water suspension rock surface and dilution factors the counts obtained were converted to numbers or organisms per square centimeter of rock area The taxonomic decisions made at this time were re-evaluated a year later and after detailed studies of each organism under high powers
Field and Laboratory Procedures 1970
Modifications and improvements of the facility In the spring of 1970 a number of physical adjustments and general improvements were made of the project complex at Castle Danger The first major improvement was a re-location of the intake pipe In 1969 the submerged intake pipe was situated at the waters edge in such a way that waves from the northshyeast would hit it broadside along its entire length During heavy seas the resultant wave pressure on this pipe was so extreme that on two occasions the terminal eight feet of the intake was broken off For this reason the intake was re-located in such a way that its length formed a ninety degree angle with the crests of the incoming Iaves during a northeaster Furthermore rather than have the pipe extend straight into the lake it was bent downward into a deep depression near the edge Thus water could be drawn from a depth of eight feet The suction line leading from the edge of the lake to the pump was securely anchored to the rock ledge as it had been in 1969
To more accurately determine the amount of water going into each pool two flow-meters were permanently added to the plumbing system These meters made it possible to obtain an accurate flow-rate and provided a cumulative total for each pool The meters registered directly in gallons They were installed in such a way that removal for servicing could be accomplished by the simple expedient of opening one valve and closing another By this procedure the water was diverted into a by-pass
Flow-rate into each pool was increased from two overturns per day in 1969 to six overturns per day in 1970 This increased the twentyshyfour hour flow to 15000 gallons in the test pool and 18000 gallons in the control pool The change in overturn rate was instituted in order to maintain a temperature level in the experimental pools that was more closely aligned with the actual lake temperature Even at six overturns
45
per day which was the maximum pumping capacity a water temperature difference between the pools and the lake of as much as ten degrees could occur on extremely hot and sunny days However this phenomenon was observed on only one occasion during the season
Chemical procedures The capillary tube method as used in 1969 for the delivery of chemical to the test pool was replaced with a motorized proportioning dispenser This device an American Series Proportioning Pump (Figure 10) was installed in such a way that it injected the selected chemical directly into the test pool feeder line Chemical delivery rates were easily controlled by adjusting the length of the piston stroke The maximum amount of solution that could be delivered in one day was thirty-two liters whereas the minimum to which the device could be adjusted was somewhat less than one liter per day A forty liter carboy placed four feet above the proportioning pump was used as storage for the stock chemical solution A section of Tygon tubing delivered the solution by gravity to the proportioning pump which was adjusted to deliver exactly five liters per day or thirty-five liters over a one week period
In 1970 the nutrients added to the test pool consisted of a comhinshyation of nitrogen and phosphorus in the classical ratio mentioned by Cooper (1937) Redfield (1958) Menzel and Ryther (1961) and Carpenter and his colleagues (1965) This ratio represents fifteen atoms of nitrogen and one atom of phosphorus Nitrogen was supplied as nitrate in the form of NaN03 whereas phosphorus was provided as phosphate in the form of K2HP04 bull The phosphorus level chosen for this study was based on levels reported in the literature as generally conducive to the production of algal blooms Sawyer (1947) studied sixteen Wisconsin lakes and came to the conclusion that 001 ppm of inorganic phosphorus (p) would be enough to produce a bloom Even though this value is the most widely quoted figure other investigators such as Dryden and Stern (1968) and Taylor (1967) feel that a slightly higher value namely 005 ppm P is the critical level which must be reached before distinct blooms can occur Neos (1966) found that some algae responded to as little as 00025 ppm phosphorus Weiss (1969) indicates that a value of 0005 ppm P was capable of stimulating aeruginosa whereas AsterioneZZa formosa could be stimulated by concentrations as low as 0001 ppm P All of these values of course assume no limitation by nitrogen or other elements
In 1969 phosphate was added at a rate to produce a final P concentration in the pool of 16 ppm It was ultimately decided in order to avoid excess dosages which might be inhibitory that this value should be reduced ten fold that is to 016 ppm This reduced value was still considerably higher than the minimum figures suggested by the authors cited above
The nitrogen level used in this study was derived by simply multiplying the selected phosphorus dosage by a factor of fifteen In doing this the atoms were maintained at the desired 151 ratio A slight correction had
46
dosageigure Iv X I Q70
r i)
on-5 i te n i hate determinations ~t e Danger la ke lor 1970
47
Figure I I Portable analyzer
to be made for the amount of nitrogen already existing in the form of field station See Figure 8 In contrast to the patchiness observed nitrate in Lake Superior water However the amount of inorganic previously the periphyton at this location was uniform and the rocks phosphorus present in the lake was so small that no special correction were heavily coated with the wooly brown growth characteristic of was necessary The nitrogen dosage determined on this basis was 245 diatoms ppm or 871 ppm in terms of nitrate The calculations used to arrive at this rate as well as the calculations made to determine the strength Rocks from this site were collected by the same method used in of the stock solution and the dosage rate are presented in the Appendix 1969 However since the depth of the water at this new collecting(Appendix A) site was twelve feet SCUBA gear had to be used by the collector
As soon as the test chemicals had been added a sampling and testing program was initiated to determine the respective levels of nitrogen and phosphorus in each pool Nitrates were ulonitored on a daily basis throughshy f out the summer and fall period An Orion Ion Analyzer provided with a nitrate specific electrode (Figure 11) was used for the routine determinations of nitrogen This instrument had been previously calibrated at the base laboratory at tester River The analyzer provided immediate information on nitrogen concentrations which allowed the investigator to make prompt adjustments of the chemical proportioning pump to maintain the desired chemical levels Since Nand P were administered in the same solution and their concentrations had a ratio of exactly 151 the nitrogen values could be used to simultaneously determine the concentration of phosphorus In order to check the accuracy of the Orion Analyzer duplicate water samples were anlayzed by the Standard Method procedure in the base laboratory at Lester River The phenoldisulfonic-acid method was used and tests were usually made once every week Along with this procedure samples were also analyzed for phosphate using the stannous chloride method Nitrate and phosphate values for the incoming lake water were obtained also using the same procedures Once every month throughout the sampling period which extended from July 9 to November 25 pH and dissolved oxygen were determined All results obtained in these analyses are presented in the Appendix (Appendix C Tables I and II)
Collection of field materials for enrichment studies In 1969 as described earlier the periphyton-covered test rocks were collected from water two to three feet deep and from a relatively sheltered area along the shore However many of these rocks were extremely jagged and irregular a condition which made subsequent handling and measurements rather complex For this reason in 1970 a search was made to find an area in which the rocks would be more uniform in terms of shape size and the character of the periphyton growth This search was based on underwater exploration made possible by the use of SCUBA diving gear As a consequence the bottom could be thoroughly examined for considerable distances outward from the shore In this instance the region examined included depths from three to twenty feet
Rocks of adequate size were frequently noted at depths of five to eight feet but their surfaces often were uneven in terms of the usual periphyton growth being interrupted by patches of long filamentous green algae Such rocks were rejected in the interest of uniformity A suitable area was finally located in a small bay about one-quarter mile from the
48
Within a period of two hours a total of 120 rocks similar in shape and approximately four to six inches in diameter were selected and repositioned in the experimental pools These rocks equally divided between each pool were then spaced eight to twelve inches apart and aligned in six north-south rows In a similar manner an equal number of scrubbed and autoclaved rocks were positioned in the pools in alternating rows These denuded rocks were subsequently used to study regrowth potential of periphyton With the addition of these rocks each pool thus contained a total of 120 rocks in a series of twelve rows In order to distinguish throughout the season what category of rock sample (regrowth or natural) was contained in each row an identifying mark was inscribed on the top of the pool wall corresponding with and identifying each row
Experimental program At weekly intervals four rocks were removed from each pool Two of these were rocks which had been introduced into the pool with their original and natural growth the other two were denuded rocks which now were showing varying degrees of regrowth Collections were made by the technique described for the 1969 studies although in some cases the investigator waded into the pool to retrieve the rock sample Samples were as far as possible randomly collected from various areas of both pools Collections were usually made in the late morning and samples were promptly returned to the base laboratory where they were processed within four hours
Laboratory procedures In the laboratory samples were processed in the same way as they had been in 1969 Again parameters used in measuring growth were chlorophyll production number of organisms and dry and organic weights In 1970 the conventional procedure consisting of an examination of preserved material was supplemented by an examinshyation of live samples This was done to further improve the taxonomic work It was especially useful for the identification of green and blue-green algae and certain flagellate forms such as Chlamydomonaa In carrying out this procedure a live portion of each periphytonshyslurry was examined immediately Another modification which was also extended to the 1969 samples involved the ashing of a portion of each sample The follOWing technique was employed A few drops of each sample were placed on a glass slide and incinerated in a muffle furnace for fifteen minutes at 350 degrees centigrade After cooling the aehed samples were covered with a glass cover slip using balsam as the counting medium This procedure produced a slide which could be
49
examined under the high powers of a microscope including oil immersion Only diatoms survived this procedure however since they represented a very important part of the periphyton growth and are difficult to identify unless the details of sculpture can be clearly seen this technique turned out to be extremely valuable
Although at the outset balsam was used exclusively as a mounting medium other substances were later found to have certain advantages One of these was substituted for the balsam after it had been thoroughly checked This mounting medium was a substance formulated by Czarneki and Williams (1970) It consists of a combination of polystyrene toluene and methylene iodide This material has a higher refractive index than Hyrax a widely used commercial preparation Instructions for the preparation of this medium are given in the Appendix (Appendix D)
Permanent slides prepared with balsam or Czarnekis medium were examined under oil immersion Diatoms which could not be identified immediately were photographed with a Polaroid Land Photomicrographic Camera This photograph was later used as a reference and a basis for final identification The basic references consulted in arriving at the identity of an organism were Tiffany and Britton (1951) Hustedt (1930) Prescott (1962) Smith (1950) Patrick (1966) Tilden (1910) and Whitford and Schumacher (1969) In addition outside consultation was sought for special cases
Laboratory studies were carried out at the growth response which could be attained in the
using dosages which corresponded to those which had been selected for use in the test pool at Castle Danger To this end rocks covered with periphyton and collected from the same location in Lake Superior later used as a source for experimental rocks in the Castle Danger pool were brought to the laboratory In the laboratory these rocks were placed in special incubators (modified by Stokes 1969) which simulated lakeshore conditions All four were conventional BOD incubators with variable temperature controls which had been modified as follows a ten-liter plastic tub which served as the sample container replaced the shelves Banks of fluorescent laraps had been installed to serve as a light source Light intensities within each incubator could be altered by adding removing or masking the lamps As slow flow of water could be maintained through the sample container a circulating pump The circulating system consisted of a variable-speed peristaltic pump mounted on the top of the incubator which was connected to a reservoir and the sample c(mtainer by tvo lengths of three-eighths inch Tygon tubing The inlet tube which came directly from the reservoir reached slightly below the surface of the water of the sample container
of Dr Alan Brook and Mr Colingsworth is gratefully acknowledged
50
The outlet tube was anchored to the container bottom in the opposite corner A four-liter plastic aspirator bottle was suspended above the sample container inside the incubator and tied into the inlet line This bottle serving as a reservoir could be disconnected and removed at selected intervals with another bottle full of fresh water This exchange of bottles if carried out on a routine basis provided a means for maintaining a practically constant level of nutrients in the test container throughout an experiment
All four incubators were maintained at a light intensity of 100 foot candles and a temperature simulating that of the lake namely six degrees centigrade The peristaltic pumps were set to recirculate the water at a rate of 600 milliliters per minute Two of the incubators which served as controls had no nutrients added to the circulating water and the water itself came from Castle Danger The remaining incubators served as the dosage test chambers Nitrate and phosphate were added to the Castle Danger water circulating in each of these at the rate which would subsequently be used in the test pool During all experiments the nutrients were replenished every other day by replacing the old aspirator bottle with one filled with fresh nutrients
At weekly intervals during the next twenty-six days samples were removed and examined for total chlorophyll production Production rates of the test and control incubators were then compared
Each day upon arrival the form Included in this report were
visual observations surface waves wind direction and speed water turbidity water temperature air temperature and sunlight During the first part of the summer and throughout the fall period the effluent temperature of each pool was checked with a mercury thermometer In a similar manner the temperature of the incoming lake water was checked Surface temperature of the lake was also recorded for much of the summer During the latter part of the summer a YSI continuous monitoring scanning telethermometer was used During this period temperature probes were installed in the effluent discharge of each pool and in the influent line The latter represented incoming lake water Since temperatures were being continuously recorded on a three-inch strip chart it was possible by this method to follow temperature differences between the pools and lake throughout the day and night
As a supplement to the main study relating to periphyton on experimental rocks an examinatiun was made of the profuse periphytic growth occurring on the vertical walls of the experimental pools and distinct from the rocks Limited periphyton growth also developed on the outside of the pools at the point outside each pool where waste water from the pools overflowed onto the rock ledge The area between this outlet point and the lake was kept constantly wet by a thin layer
51
of water coming from this source This well-illuminated rock surface appeared to be ideal for a periphyton growth which was apparent within a period of two weeks To assess the importance of this growth and its characteristics it was sampled on a tri-weekly basis It also occurred to the investigator that the test pool effluent which had been enriched by the addition of Nand P might have some effect on the natural periphyton at the point where it entered the lake To evaluate this properly samples were again collected at intervals of three weeks and visual checks were made each week This examination was supplemented further by a careful underwater examination made by the SCUBA technique Two such examinations were taken All of the collections made in these miscellaneous areas were qualitative in nature
CHAPTER IV
RESULTS AND DISCUSSION
The experimental area at Castle Danger is located on the north shore of western Lake Superior some forty miles northeast of Duluth Minnesota and 110 miles southwest of the Canadian border at Pigeon River For practical purposes the specific area from which samples were collected may be considered to be uninhabited and thus generally free from domestic pollution The only conceivable source of such pollution is potential seepage from the septic tanks associated with the half dozen or so small summer resort cabins located several hundred yards southwest of the experimental pools (Figure 8) Unpublished chemical and bacteriological observations by Takumi (1971) tend to dispel any suspicion that seepage of this sort is reaching the area Even if some seepage reached the lake the counter-clockwise water circulation which exists at this point in Lake Superior (Ruschmeyer et aZ 1958) would carry such pollutants away
The Gooseberry River is located nearly a mile above the experimenlal pools at Castle Danger (Figure 8) After a very heavy rainfall and the voluminous surface runoff which followed the near-shore water at Castle Danger has turned brown as a result of the turbidity produced by suspended particles swept in by the flood-lVatfrs of the Gooseberry River This phenomenon was observed on two occasions only
In general the entire area lying outward from and to the northeast of the Castle Danger pool area is characterized by remarkably clear water For example in the near shore area where periphyton-covered rocks were collected for use in the experimental pools visibility was extremely good Ordinarily water quality at noon was such that observers at the surface could easily follow the movements and detailed work of the SCUBA divers 20 to 25 feet below
In 1969 the early summer was devoted to the cons testing of the experimental units and collection of actual data pertinent to this study was limited to a seven-week period between October 30 and December 14 This fall season was characterized by mild weather and considering the time of year calm lake conditions Originally the plan had been to extend the sampling program to the end of December However this schedule was decisively terminated by a Northeaster which carried away the intake pipe As a result of the interruption of flow and the sub-zero temperatures which accompanied
52
the storm a total freeze-up of the system occurred
Natural periphyton Castle Danger To provide a baseline and a frame of reference for the experimental studies routine examinations were made of the natural periphyton population characterisitic of the Castle Danger area As indicated in Figure 8 samples were collected near the shoreline in approximately three feet of water Observations were made on three occasions during October and November
A tabulation of the periphytic organisms identified during the course of this study is presented in Table IV It will be noted that a total of thirty-four species representing nineteen genera and three phyla were found in these in-shore waters Except for the green alga Ulothrix zonata and the blue-green Phormidiwn foveolarwn diatoms made up the entire population The average total count was four million cells per square centimeter of rock area Of this total diatoms comprised eighty-one percent or an average of 3450000 cells per square centimeter The relatively high count reported for PlOrmidiwn (601000 per square centimeter) is misleading unless one remembers that the cells of this species are very small and that the actual volume of this alga per 100 cells will be much less than the corresponding volume of 100 cells of Ulothrix or many of the diatoms The five most common diatoms in order of abundance were Synedra acus Achnanthes microcephaZa Cymbe lla spp Gomphonema spp and Tribe llaria floccu losa Synedra acus being the mos t common constituted the bulk of the growth and averaged two million cells per centimeter squared of rock area
In addition to cell counts the other parameters used to measure productivity were total chlorophyll and dry weight The results of the chlorophyll study are presented below
Mg (MSPU) Chlorophyll Per 100 Square Centimeters
Date
J0-22
11-12
11-25
Total Chlorophyll a Chlorophyll b Chlorophyll c Chlorophyll
0644 0040 0265 0949
1153 0410 0269 1832
1 262 0192 0511 1965
Mean 101 02l4 0348 1 582
54
0 x x x x x x x x x x xr--shy til 0 Q) 0m
(J) f-lt P -0 0
L [ 03ill H Dshy ~ 0
CJ 0Ol 0 Pc
U~ (l
E 0ITI~ r--shyif) 0 0 m0r--shy
PillQ r shy Q)+shy x x x x x x x x x x x x x-Dtil
Q) m010 c-D f-lt - 0 L shyJ~
0r-0 x x x x x x x x x x x x x x xr--shy0t 0)(J) C 0 - C Pis
cro shyCJ02 0CL
l Him-DL ltgt Q)(0 ill cr 0J+- 01
C C urshyltgtill ID
0 Ulr- tl Q)-0 tl2U N c
bullc N0 +shy +shy cltP 0cr ~)gtshy IDCgt c ctl 0 P c~ Xl UL ltC0~ Q) () 0CL tl
~
()~ N
IC ~
55
x x x x x x x x x x x x x x
x x x x x x x x x x x x
x x x x x x x x x x x x
EO
L ill illshy(l +shyx Ul
W ITI U
D C IID
L L 0 o shy
x x x x x x x x x x
x x x x x x x x x x x gt H
z -I-shy
0H r--shy0 mM
H 0)
P l
U)I~ l
W --l OJ ltC f-shy
L L Q) Q) (l
0J Jif)
if) Q)
Q)Y Y ID (0 --l
--l
c 0
-or--shyQ)Q gtshyL
illD Ul C 0 ITI 0
0 Ul-D EO Ul shy
C +shyID 0 01 L
~ oj oj oj
gt gt c c gt p Pc o 0 P til H 0 gt 0 H oj
c c gt ~
0
rl
[0 m +- c
ll (lJ (l Zl lIDm I rJ)(1
C u ltJ ll
Q) 0 U L C U
c
ID shyP ECgt ~
mu 0 tJ E (0 shy ~_ If)
L - 0 _) L Q) If) 1- U o Cl L0shy
-fUm (0 (1J shy
mLgt tD L J 0 CD o CD C ill L - mOe ClClL_ 0 - - 0 L +shy
m rD ru [0 l0 ID--JJ((luml +--1
-f- J 1) Ul (0 L0shy
- -1 cue - rn -- (j)0shy
CD U CD -- m 0 - 0 U X U +- -J In) ill 0 m0shy
CD Zj (1 C 0 +- U () j- shyCD-(1J00JVJ[OcrrL u n L L (u CD0- (1J
m JUOi--Cl tIl CD
- m Q) bullbull Q) bull (l- bullbullbull
cL)U+-U O-~)C)UU 0 0 +- Q)
cc~Q)m() (]0 Cl Cl () +- l U U E E EEE=U)Q)O gt-raquo
ltt ltr ltr laquo U () u ~ L)
Tab 13 t i iJed
al~e5trs
)2~ r-i nor
croto1ansis rrisonii
eala acrr na7U1 n-~
natUr1 7Jat
angustatum lJar obtusarum 1 Cfum
constri ctum val ca-i
Var d cotm-IQ
PERIPHYTON
Cymba I a p rost ra~a ventricosa
I a the r-rns I s ancaps
8 eongatum hi Ie
V1 CJ D v~1 ra x
x
leo
var
cragl aria capGcina x x x
F vridJ a
he red x x x
( shyv
x
G G gerrira~~T x x x G 9 r ac
x x
x
x
x
x x
x
x
x x
x x
x
x
x x
x
x x
x
X
x
x x
x
x
x
x X
x
X
x
x x
x x
x x x
x
X
x x x x
x x
x x
Table IV continued
rysophyta PERIPHYTON Chlorophyta
Cyanophyta
iCh 1 Gomphonema he I vel- cum tenu 15 --- shy
G irtri catuM G montarum G ollvaceum G 0 I I vaceum var ca I carea -- shyG parvulum
V1 G sphaerophorUM --------Melosira grarula7a
-1 variatls i d i on c i rcu I ar-e lJal I cta ---
Navi I arvensis N dicephala N dicephala elnersis N Mnirra ~ c~longa
N pupula N radiosa N reinhardtl i N tusc~ a N vereCc1ca N vi ridula ----------- shy
Nil angusto val N den~icula
N dissipota N filforrris
~ungar-ca
L Superior
1969 1970
x x
x
x x
x x
x
x x
NATURAL GROWTH
Control Pool
1969 1970
x x x x x
x x
x x x x
x
x x x
x x
x
x x x
x
Test Pool
1969 1970
x x x
x
x
x x
x x
x x x
x x x
x
x x
I
REGROWTH [1970]
Control I Test
Pool I Pool
x x
x
x x
x
x
x
x
x x
x
x
I
Ta I cont i
Vgt
X
X X
X X
P dupl PiThophora sp ~~I x
Table IV continued
PERIPHYTON
1970
x X C~ I arrydO1onas spp x x
8p
Fediastrum boryaum
x x
x x
x x
x x x
X X
X X
A X
x x
x x
x x x x x x x
x x x x
x x x
x x x x x x
s viridis
)Jr Schi Ie Ie r
Jadrisvashy
lenastJm sp
S-t- IcTnrix
G
On the basis of mean averages the ratio of chlorophyll abc was approximately 612 In two of the three samples reported above chlorophyll ~ had a greater concentration than chlorophyll b This is to be expected since nearly the entire population of periphyton consisted of diatoms and diatoms are characterized by their high chlorophyll values The higher chlorophyll ~ value occuring on November 12 ordinarily be attributed to the presence of great numbers of green algae However in microscopic examinations green algae were never prominant on this date and another explanation must be found A reasonable explanation is that the separate aliquot used for chlorophyll determination may have contained a small of UlothPix filaments
Non-astacian carotenoid values for the three samples collected ranged from 0241 on October 22 to 0568 MSPU per 100 square centimeters on the 25th of November The mean value for this pigment was 0443 MSPU per 100 square centimeters Since diatoms contain a significant amount of carotenoids these relatively high values are to be expected Astacian carotenoids having a mean of 003 MSPU per 100 square centimeters may be attributable to the presence of animal grazers in the samples
On the basis of the periphyton samples collected from Lake Superior it was found that dry weight values ranged from 1107 to 1112 mg per square centimeter of rock area The mean for this parameter was 1110 mg per square centimeter or 111 grams per square meter This figure compares favorably with standng crop levels that Stokes (1969) found in Stony Point Bay Lake Superior some twenty miles southwest of the Castle Danger area In 1966 he determined the standing crop of periphyton to be 104 grams per square meter whereas in 1967 it was 156 grams per square meter
Periphyton-covered rocks area in Lake Superior were placed
in the experimental pools on October 16 After a two-week period of stabilization during which untreated Lake Superior water was pumped into the pools at a rate which produced two overturns per day additions of phosphorus to the test pool were begun At the dosage used a concenshytration of 163 ppm P was reached in all parts of the pool The second pool served as a control At weekly intervals thereafter periphyton samples were removed from each pool for microscopic examination Growth parameters such as total counts chlorophyll content and dry weight were also monitored
In the course of the microscopic examination forty species were found in the control pool These species were distributed among twentyshyone genera In species composition and makeup the test pool was quite similar For example the number of genera was the same and the only difference was a slight increase in the number of species For details consult Table IV
In quantitating the samples removed from the pools growth parameters were simply related back to the surface area of the rock sample Total cell counts per square centimeter in the control pool ranged from one
61
0
0
0
million to four million with a mean count of 2384000 The five most common organisms in order of abundance together with the corresponding total count for all species are listed in Table V It will be seen that Synedra is the predominant alga on every occasion Usually Achnanthes is next in abundance It will also be observed that diatoms comprise ninety-one percent of the mean total counts for the seven-week period Green and blue-green algae when they appeared were represented exclusively by Ulothrix 2onata Mougeotia and Phormidium foveolarum In the test pool enriched with nutrient total counts ranged from 668000 to four million cells per square centimeter (Table VI) The mean count from these seven totals was 2570000 cells per square centimeter of rock area Again for practical purposes Synedra was the predominant organism Diatoms composed eighty-one percent of the total population The blueshygreen alga Phormidium appeared among the five most common organisms during the last four sampling weeks Its highest number was reached on November 25 when it ranked first in cell abundance Ulothrix 2onata although never appearing as one of the five most abundant organisms was seen on one occasion November 19 The weekly trends of total counts in each pool are indicated in Figure 13 As will be seen from this graph total counts in both pools demonstrated a gradual increase but there was no indication of any significant growth difference between the test and control pool This anomaly can be explained on the basis of overfertilization a factor which is discussed in detail later
The chlorophyll pigment concentrations on a unit area basis for each pool are shown in Table VII In the control pool total chlorophyll concentrations ranged from 1173 to 2548 mg (MSPU) per 100 square centimeters of rock area with a mean value of 1081 The chlorophyll pigment components found in the control pool during 1969 are shown in Figure 14 Chlorophyll~ which is the predominant pigment shows a rather gentle but steady increase after the second week Chlorophyll pound on the other hand although showing an increase after the first week remains rather consistent through the remainder of the season Chloroshyphyll c it will be observed falls off sharply during the second and third ~eek but then climbs rapidly during the remaining weeks The average ratio of chlorophyll abc was approximately 613 In the test pool chlorophyll concentrations ranged from 1147 at the onset to a final high of 2346 mg (MSPU) per 100 square centimeters The mean of 1762 was actually 004 mg (MSPU) less than the control pool average The pigment ratio was approximately 522 a ratio which was nearly the same as the control pool except for the fact that chlorophyll b was somewhat higher The higher chlorophyll pound values are attributed to the fact that there was a greater abundance of green algae in the fertilized pool The original microscopic examination did not reveal the presence of an unusual number of green algae however the possibility existed that very small organisms might be undetectable when the counts were made at 200 power To resolve this question the preserved samples were re-examined under 430 power and this revealed that small green algae were in fact being missed in the counting procedure Test pool pigment trends
62
r-l 0 0 P-lt
r-l 0p H Z~ OeyU-D
ey
~ ~
o UJ U gt lt1lc4-lt 0 I-lt
bull lI-lt I-lt Ul UJ UJ
P-lt bOgt gt
ubll lt1l 0 0Cl Cl I-ltr-l H UJN ~ H~ S H I - u
u Ul U lt1l I-lt o U UJ I 0 gt ~ Ul ~ S
lt1l I-lt Ul H Omiddotr- l I-lt lt1l lt1l UJ bO
Z 0 I-lt
l 0 4-ltCI)~
0 UJ
ugtgt H rn sectsectr-l 0 U
r-l ~ H 0 H
lt1l
~I~ 0
0 ~j 0 U
- Ul() 0
UJ gt ~N1 4-lt 0
gt
II ~I~
0 ~
c sc gt 0 bOb U o U lt1l c I-lt I-lt ~U~ZP-lt~~
gt ND S S lt1l - (1j o 0 ~~ ZZH00UU
55 ~~~]] 0~UUUP-ltP-lt
~~E5555 uu~~~~~
gtgtgtgtgtgt gt (j)(j)(f)(j)(f)(f)(j)
ooooccC)o ~ ~
~I
CI) Z0 H H ~ H gt ~ ~ 0 H
gtlt 0Cl ~
I
I
0 Ul-~ ~ lt1l
lt1l 0 - - Ul 0 o ~ H
H rn
bOUlO UJr-r- en O~UJ I-lt o~ rn 0D bO rn lt1l UJ H I-lt Ul
bO o 0 r-r-
r- jJ 0 - rn UJ (1jr- OJe gt UUJ U o I-lt l
4-lt D Ul D Ul
r- ltt If) jJ
Q) 0 OJ l ccoE-i (1jjJ u
UJ c -
ljlt
o
Sl Ul
UJ c jJ
0 UJ UJ
- Q) Q) U c ~ jJ
Ul 0
Ul - ~ lt1l 0 jJr- o - jJr-
0 U 0
tJr- (1jX - Q) Q) ~
rl r- gtgt CO c U)
UJ lt1l bO
~ (1jM
jJ 0
UJrngt
r- (1j S I-lt
tl 0 UJ H CO 0
-4-lt Q) c gt bO
r- M H ljlt H OJ
0 Q) OJ H
S oUJcc l
~~~ (1j (1j
- l 00 jJr-
gt 00r-
r- 0 c E-i r-
(1j
gt en I-lt Q) gt 0tJ
UJU
(1j 0
1 DCO
- - bO
ljlt jJ ~
0 lt1l 0
en 0 ~
~ UJ UJ (1j jJ tJ jJ U) en 0 UJ jJ rl 0
Ul
UJ UJ
Ul I-lt S Ul bO 0 I
- UJ UJ lt1l UJ l
M H rl 0 bOD
II II
Cl00
lt1l rn
rn - 0
000000()0H0 ~ ~
4-lt 0
~O
~
lt1l - 0 H
Ul
UJ UJ I-lt 0 I
UJ l ~
Ul ~
~
Ul S 0 - rnCl
oooacor---D 0000000000 ---1-1-1---1
0000000 0000000 0000000 t 00 t r--- If) Q N ttt 0000 00 0 -I C)t r--- 0 N 0 -1-1 rirlNtC)
000 000 000
OOOO-lr---C) ~~o N ~j
o 001oo 0 0000middot bull
~o ey o ~ ~ ~
0000000 0000000000000 ~~ tCOtr---OONO ttt co 0 C)N tMtr---C)r---t -I-IrlrlNMC)
O-D N ey ~ N 01UJ C) rl-lN -I - lt1l - gt UCl U 0 UJI
OZ P
63
0 0 0 j
00 ()
N
0 0 0
~ ~
0 0 0
00 ()
0 0 0 ey ~
N II
gt lt1l
UJ
II
Ul
UJ UJ I-lt 0 I UJ l ~
~I1
Ul S 0
P
- (1j
lt1l
I-lt Ei lt1l 0 l S
UJ lt1l lt1l 0
- ~rl r- 0
D ~ Ei - bJ)r-I H U
U 0 UJ
gt-cncrl r-l0P-ltP-lt
II II II II
u 0 u ~(flcrl
r-l0P-ltP-lt
Ul lt1l
Ul Ul l o rn S I-lt S I-lt 0 0 Ul UJ X Oc UJ S gt 00 o I-lt S 0 UJ Nc rnc jj -r- jJ
~ - UJ c 0 c u U~ up(j)(f)~
II II II
EC s -1 tJN+JjNNc) ~ CJ) U) -)
Ul lt1l lt1l UJ rn S c rn ~ H OJ -~ l lt1l gt gt~ U ~ 0 rn Q) r- r- c
(1jr- I-lt ~ c lt1l rn l tJ H rl tJ en 0 rl
gt D - bO pr- N OJ OJ c S gt rn S gt - gtDU gt UJ I-lt o COmiddotr- ~ (1j ~UP~0ZZCl)H
II II II II II II II II II
c S gt bO S gt N gt D tJ ~ Q) H 0 CO -4-J ~ CO ~uP~0ZZCI)H
TABLE VI
TOTAL COUNTS of Naturally-Occurring Periphyton in TEST POOL Lake Superior -- Castle Danger Minn (1969)
[Organisms per cm 2 rock surface]
Date Diatoms Greens Blue-Greens
shyTOTA of Total
D G BG Rank of Five ~ost Common Genera
1 2 3 4 5
Oct 30 1233000 0 0 1233000 100 0 deg Syn Tab Cym Ach floc
Gom
Nov 6 668000 0 0 668000 100 0 0 Syn Cym Ach Ntz Gom
Nav
crshy Nov 12 1458000 deg deg 1458000 100 0 0 Syn Cym Ach Nav Ntz
Gom
Nov 19 2435000 44000 779000 3258000 75 1 24 Syn Pho Ach Cym Gom
Nov 25 2260000 0 1169000 3429000 66 deg 34 Pho Syn Ach Cym Ntz
Dec 2 3262000 0 612000 3874000 84 0 16 Syn Ach Pho Cym Gom
Dec 10 3854000 deg 2l6000 4070000 95 0 5 Syn Ach Ntz Pho Gom
MEAN 2167000 6000 397000
See Table V for explanation
10 [ 1_ Control Pool I I-VV Il- shy
n-
l-
I shy
f shy
4If-
pshy~ r ~1Vf shy
6
crshyLn 1 6
0gt
~ ~5 o
o 12 19 25 2oyeni- fJnv IF Dote (1969)
Figure 2 latJra Iy-occurring Jerpry-or d v-eigrts (per uni- area) In expe r I pools Cas~ie
I ~ake Superr 1969
2570000
1 x I
1
5 x 10⁶
- 4 x I
i ~
x ~ g o
2 x
i~----~~----------
-+____+shy ____________
~--------________________
J6~------------____
1~6 I
~
61 I I I 10 x I J u __ u_ u 25 Oec 2 Dec -- 969
lt ore rn I i ormiddot I 668
gune 13 Total counts of naturallyshyoccurring peniphyton mental pools Castle Lake Superior 1969
Cym
TABL VII
of Igmer7 Concentra7ions
0 0
r~ov
lov i 2 O 0 235
iJov 19 I I 104 o
73
I
I
I
2
13 13
12
12
11 11
r-1~ 10 E 10 B u
o g 09o
08 OB - shy
(J) CONTROL POOL (J)
07 ~ 07 0
~ - 06 06 i 05 i 05
o (o
c B04u
01
02
01
I _ 19 25 2 10
NOV-( 1969)shy
o I I~ _I _ _~ I
--DECshy
TEST POOL
1 12
---- shy
gure 4 Natu phy 1 1
r i phy 7 0n
iers (per ~~i7 Cas+le Danger
Superior
loro- Fi I bull ratu a I I I ng per i phyton I I concentrations (per unl- aeal
r Test Pool J Castle Danger ~ake
i or 969
were essentially similar to those of the control pool This may be clearly seen in Figure 15 If the chlorophylls are lumped as total chlorophyll it will be found that total values in the control pool were significantly higher than in the test pool during the first two weeks (Figure 16)
In light of the fact that total counts of organisms for both pools ere quite similar the wide difference in chlorophyll concentration at the outset is an intriguing phenomenon Several explanations are possible but none can be substantiated and there is no reason to suspect the analytical procedure or the sampling technique Therefore it is assumed that the chlorophyll level shown is reliable The rapid decrease of chlorophyll in the control pool followed by a subsequent and very large increase is a point which needs to be considered One possible explanshyation would be that the lake periphyton which had been transferred to the control pool required a three week adjustment period During this perjod of adjustment chlorophyll concentrations declined possibly as a result of sub-lethal effects of increased sunlight This condition could have been created as a result of water depths in the experimental pools being slightly shallower than that found in the original collection area of the lake Weather data for the two weeks during which chlorophyll levels declined in the control pool shows that bright sunny conditions prevailed for the majority of the time In the test pool on the other hand there was no decline in chlorophyll probably as a result of the stimulating effect of the large amounts of fertilizer added Thus while certain organisms in the test pool were adversely affected others were responding favorably and the result was demonstra ted as shOlVD in Figure 16 by a net increase of chlorophyll After November 12 chlorophyll concentrations increased markedly in both pools and followed the same general pattern By November 25 the total chlorophyll concentration in the control pool was identical with that found in the lake at Castle Danger Although after November 25 total chlorophyll concentrations in the test pool dropped below those in the control the difference between the two values was not great On the basis of chlorophyll conce71tration therefore the phosphate-treated pool was no more productive than the control This is shown 1n Table VII where the mean values cited for the control pool and test pool were 180 and 176 mg (MSPU) per 100 square centimeters respectively
During this test period the pattern of non-astacian carotenoid production was quite similar to that observed for chlorophyll with the exception that values for the latter were much higher Non-astacian carotenoids in the control pool varied from 043 to 059 MSPU per 100 square centimeters whereas those in the test pool ranged from O 065 MSPU The mean value for the test pool was 0496 MSPU per clllL and
2that for the control was slightly lower 0489 MSPU per cm The astacian carotenoids Gid not follow the pattern of the chlorophylls and non-astacian carotenoid pigments Compared to other pigments they were very low The mean concentratton in the control pool was 0065 MSPUcm2 that in the test pool was 0059 MSPUcm2 (Figure 18)
68
Control Pool
Test Pool
M
N E o o shy3 shyltf)
i
I - - )0shy
r shyo a o - r u
- ~ o I shy
L I nLm I I 30 Nov 6 Nov 12 Noy 19 Nov 25 Dec 2 Dec 10
-1969 shy
Figure IJ pool
69
~ ~
~ bulli
0
~------- ~~~~J)
[) N
() In addition to microscopic counts and chlorophyll analysis dry C L 0 weight can be used to express productivity Results of dry weight o OJ 0 t-- 0 0 L analyses for both pools at Castle Danger are presented in Table VIII gt-shyr
0 and Figure 12 Dry weight values remained fairly constant in both pools 0 U) m L - C +- Q) with a mean of 736 mg per square centimeter in the control and 687 mg L 0 C 0
-1 CL+- E tn 0)- ill in the test pool However there was a slight increase in both pools
(1J - by the end of the period of observation and the control pool slightlyUlLLQ) C+-Q)Y exceeded the test pool in dry weight Expressed in terms of dry weight
C Q (1J
L Q) X-J the standing crop of periphyton in the control pool was 74 grams and L U OJ
c that in the test pool 69 grams per square meter These values are o C L Umiddot- III somewha t 10vler than the values obtained for comparable periphyton collec ted
OJ o ~ C in the lake In making these comparisons it must be remembered that
(1J (1J N oWCJ periphyton samples were collected from the lake on three occasions only
--- C L l] () ill G) Also one must consider the fact that in the manipulations involved in L f shy_-10+-+-0gt transferring periphyton-covered rocks from the lake to the Castle Danger~~ -t-- L lfl0
CrD ((J
0--
m G pools mechanical dislodgement of a portion of the growth occurred and Z U J ()
that this in itself would result in an initial dry weight reduction lake periphyton remained remarkahly constant (1107 shy
ltD and at levels which were never regained by the rocks
QJ placed in the experimental pools Since for practical purposes dryL -J weight values were the same in each pool it may be concluded that the OJ
high phosphorus dosage applied to the test pool was not effective in promoting an accelerated rate of periphyton production This conclusion is supported by the results obtained in studies of total counts and the chlorophyll concentrations If one considers the final observations only there is an indication although a very slight one that periphyton growth was a little better in the control pool In order to determine
o I +-0 whether or not the parameters above are comparable correlation coefficients
L ~ 0 Oro+- were calculated for total counts and total chlorophyll values from eache QJ CLO experimental pool In addition to facilitate future estimations ofuroG
numbers of periphyton organisms based on total chlorophyll concentrationC+shy0middotmiddotmiddot +- regression lines were constructed using the least squares method Total I C ro c)gt ~ r--- counts (y axis) were plotted against total chlorophyll values (x axis)
pound (J) 0 n L L_ The two regression lines are presented in Figures 19 and 20 along with
QJ 0 t a +- Q) the correlation coefficients (r) the probability values (p) and the ill - 1J C Q 1JJ equations for the slope of each lines In both pools the two parameters
cn -J J
Oeu were found to be positively correlated with the correlation coefficients (r)C 0 C(f) ranging from 086 (p = 001) in the control pool to 0885 (p = 001) in thegtshy L +- () l ((]laquo test poolo -) L rD 0
U +- +- fl U L C o ill Q) D iJith 6000 to 8000 I () E c gt- c to and approximately 20 o
0-
L U tV U1 returned as by-pass water a series of small scale were
(1J Cl ill L - x- formed which cascaded dmvn the rocky shore and in to the lake These J l)ufgt- c streamlets although extremely shallow provided an environment very roc C m
Z n- U favorable for the growth of algae The predominant species found in the bY-pass water was Ulothrvix zonata In the fringe area of the same flow where water did not move so swiftly diatoms by 8ynedra and grew profusely The growth of increased
Q)
as weather approached Even during the last few weeks when a crustl J l)j
U
71
001 I (1ldS~l) I I AydoJO I Yl
70
gtlt 0 0 0
+
00
0 -D -D 0 00 0
N 0 0 I
0 0 Q
- 0 a f-z 0 0
m CD m lNI
TABLE VIII ~-----------------------------------------------------l~
gtlt 0 0 0
N
+
N 0
0gt 0 Lf)
00 0 00 0
N I 0 0
gt- n
Q sect f shyrJJ UJ f-
gt0N L 0
(l CLDry Weights of Naturally-Occurring Periphyton o - o
L+shyIn Experimental Pools Castle Danger Lake Superior 1969 o m o co QlO
C -f- 0 U 0
~ ltJl CEMILLIGRAMS PER SQUARE CENTIMETER OF ROCK SURFACE u J 0
CD
N
DATE
October 30
November 6
November 12
November 19
November 25
December 2
December 10
MEAN
CONTROL POOL
670
642
661
664
679
905
934
736
72
Ul +- L Cgt L gt 0 Cgt OJ --c shy
gt rr L - QlTEST POOL
L0 L rrgt -f- CD J
Vgt C rru)
E o Ol(l) U C_L751 0shy 1) sect _ L --
ill L_ c ~480 U L
c - U OJ o OJ
~ C I C666 () gt- iJ Cogt cn
UJ rtl Q) Ql Lshy
672 -~1 t shy ei) +- (J)
I shy QJ rJ (T]700 (y r- (_)
707 C) CJ
Q)832 l 1
0) N
901 X ZW3 lad swsudJO LL
687
CD -
In - +shy1 L_ Ii
tIl L m 1_ ) C) 0 CD ( - W gt (j (l
0- shy(f) I () I- gt- (I r - rr t_ 0IN~ o (Jshy
Vgt ~ () L ) L Q)~ 1 I- c
ill m r )csectJ c L 0 l
() Q)
-x - L r rn o 0 _J ~ c
r+ U) rrgt-- In 0 c I
Cogt Q) l Ll Q) ()- 0 0) -- l~ C OJL Q) (J
PL U rr CI shy
0gt- n Q)
J 0)
901 X ZW3 lad SWSudJO
73
L
lL
of ice formed on the rocks this hardy alga grew nicely in the water which flowed under the ice This agrees with observations made by Castenholz (1960) He found growing under similar ice coatings along the shoreline of Falls Lake Michigan Ulothrix is also favored by water movement This is demonstrated by the fact that it is found in abundance along the North Shore at the waters edge where constant wave action provides the needed agitation In the experimental pools Ulothrix was scarce One reason for this may have been the reduced velocity of water flow
In 1969 water temperatures Jere taken twice a week Temperatures in the pools and the lake were for all practical purposes the same During the first five weeks of the experiment the average temperature was 42 degrees Fahrenheit (56 degrees C) During this period there was never a serious temperature variation between the pools and the lake For this reason it was concluded that at this time of year the comparatively slow overturn rate of 6000 to 8000 gallons per day was sufficient Cold water although favorable fa r the growth of certain diatoms and is inhibiting to the development of certain green or blue-green algae This is supported by Cairns (1956) who concluded that the optimum temperature [or most green algae in an unpolluted stream was 30-35 degrees C (86-95 degrees F) and for blue-green 35-40 degrees C (95-110 degrees f)
Accor1ing to Lake Superior data presented by Stokes (1969) periphytic algae in cleeper water (20-35 feet) tend to have an increased chlorophyll concentration in response to lower light intensities He found that total chlorophyll concentrations per unit area were greater at thirty-five feet than they were at 25 feet -Ihil( this can be explained on the hasis that in the deep water area with low light intensities a compensatory amount of chlorophyll is produced by algae another explanation is applicable in very shallow water At depths of three feet or less for instance differences in chlorophyll concentration can be explained on the basis that in shallow water the near ultra-violet rays may exert a lethal effett or on the basis that wave action during storms or unusual and temporary currents have swept the rocks clean and there are actually fewer organisms present At Clst1e Danger light penetration into the relatively shallow pools could have limited total chlorophyll production by its lethal effect but there was no possibility that wave action or strong currents would even pnrtially denude the rocks Other factors such as ice formation and the lower sun angle hrought on by the advancing season could presumably affect the production of chlorophyll and the numher of organisms for example the formation of a physical barrier which would reduce effective light penetration The first hard freeze occurred on November IS at which time a one-inch layer of ice was formed over approximately one-half of each pool Since there was no accumulation of snow on the ice it was assumed tbat sunlight was not drastically cut In the following weeks ice gradually increased in thickness and had to be removed whenever samples were taken By December 2 it was almost three-inches thick and covered with a fluffy half-inch layer
74
of snow However at no time were the pools covered completely with ice At least one-third of the surface in each pool was always open as a result of the constant flow of lake water An inspection of the data obtained gave no evidence that there had been any limitation of growth ascribable to light reduction by the ice cover Chlorophyll did increase at the end of the season however so did the count of organisms In this connection it should be recalled (Round 1965) that at low tempershyatures it is the light intenSity rather than a temperature change which affects the photosynthesis and the productivity In the Castle Danger pools organisms continued to increase as did chlorophyll until the end of the period of observation It is apparent therefore that enough light was available for continued growth even after a partial ice covering had formed
The data collected in 1969 indicated that phosphate additions at the level used did not increase periphyton production In terms of numbers per square centimeter the mean total counts were only 200000 cells per cm 2 higher in the test pool than in the control pool furthershymore mean total chlorophyll and dry weight values were actually higher in the control pool than in the tes t pool One explanation for this anomaly is that phosphorus which was being added at a rate which produced a final concentration 320 times greater than that nonnal for Lake Superior may be an inhibiting factor This possibility has been shown to he true by Rodhe (1948) He found that when inorganic phosphorus levels were greater than lOlg pil (001 ppm P) the grmth of certain algal species namely and was inhibited He discovered moreover that other species may tolerate higher levels
Also of interest is the work of Hamilton (1969) wbo used a complete nutrient media solution formulated by Rodhe in 19l18 Hamilton found in laboratory enrichment experiments on water from Cayuga Lake New York that when the medium was added to Cayuga water there was no algal growth enhancement Ultimately he discovered that when phosphorus as K2HP04 was removed frolll the medium grmvrh enhancement did occur In this instance the phosphorus level of the complete nutrient media was 29 pg-atomsl (0899 ppm P) This is a value at least thirty times higher than that found in Cayuga Lake Hamilton concluded that this was a case of phosphorus inhihition although he admitted that other components of the medium might also have been involved in terms of some unrecognized interaction Since at Castle Danger the only addition made to the water was P any inhihition which occurred must be attributed to the presence of this element in excess or limitation imposed by the lack of ni trogen In the latter instance even though phosphorus enrichment had oecurred growth would he ] ind ted by the absence of the nitrogen Further support for the contention tllat phosphate was the limiting factor in the Castle Danger experiments during the Fall of 1969 may be found in the f ollmbulling reports Fitzgerald (1969) found that growth of was delayed when P04-P values exceeded 5 ppm Similarly Swingle and his co-workers (1963)
75
found that algal response in a fish pond was delayed for 30-60 days when phosphate alone was added as a fertilizer Another explanation for the lack of response to heavy phosphate enrichment in the Castle Danger experiment is that there was a highly disproportionate ratio of N to P In this case the eatio was 310 rather than the more commonly accepted figure of 151 In suppoet of this view it should be pointed out that Whipple (1902) Patrick (1948) and Munawar (1970) have indicated that nitrates are extremely important to diatoms Furthermore Kott (1968) and Christie (1969) working with algae have established that phosphate must be combined with nitrate if growth enhancement is to take place
Visual inspections of the Castle Danger pools supported the quantitative studies and revealed no apparent differences between the t]O pools Periphyton-covered rocks retained the original br01vn color characteristic of diatoms in Lake Superior In no way subtle or othershywise could one tell that one pool was heing heavily enriched with nutrients while the other received lake water only
The principal diatom genera encountereu in 1969 were similar to those found by Fox (1969) In his studies of several North Shore stations on Lake Superior Fox found that the most predominant genera were lelmonllteD Nav1(u7a and Total mean counts from eleven stations studied him ranged from 1460000 oeganisms to four million organisms per These figures are almost identical with those found at Castlo Danger where counts in the control pool ranged from one million organisms to four million organisms per square centimeter of rock surface The test pool results were only a trifle lower namely 61i8OOO to four million organisms per cm 2 bull
As a result of the experience gained and the in 1969 the research program was modified and
greatly expanded in 1970 Because the sanplinr season was longer it was possible to follow seasonal trends in addition to instituting modifications of various physical and chemical procedures essential to the experimental design Weather and lake conditions dueing the sampling peeiod extending from July 9 to November 25 were unusual For example durin the months of July and August the ambient air temperature was cons iderably higher than the average Clima tolorieal data obtained from the Heather Bureau at Duluth Hinnesota showed that noon-time temperatures exceeded degrees 17 nearly fifty percent of the time Also during these months there Has little wind and the lake was extremely calm inds [rom the northeast or east were reported on only four occasions and velocities never exceeded 17 knots Northeast and east winds represented only six percent of the total In September and the ensuing falJ period however a number of severe storms developed dueing which
76
high waves were produced and the lake became exceedingly rough One such storm occurring on November 3 not only washed waves over the pool walls (Figure 21) but also damaged the pumphouse by pushing out its back wall On November 23 strong northwesterly winds and the attendant cold temperatures resulted in a temporary shut-down of all operations Strong winds reaching velocities of 20-25 knots broke down power lines and produced a power outage in the Castle Danger area which lasted some fifteen hours As a consequence of the exceedingly cold air temperatures and the interruption of water flow brought about by the power outage most of the pipes froze solid and cracked Efforts were directed immediately to the replacement of the frozen pipes and to the rtepair of the pump After several days all facilities were repaired and operations again resumed Unfortunately on the very next day Decembee 3 a violent storm churned the waters of Lake Superior into waves which were estimated to be at least twenty feet high These huge waves through constant pounding eventually demolished the small 6 by 8 pump house which served as the control center for the project (Figure 22) For practical purposes this brought the project to an end on December 4th Because of the advanced season and the propsect of additional storms no attempt Vas made to rebuild the structure and start anew
FOe greater clarity and convenience in reporting the remainder of this chapter has been divided into six parts each dealing with a slightly different aspect of the periphyton study The first section is concerned with laboratory or so called bench studies Lake Superior periphyton The second section deals with the istics of the natural lake periphyton occurring on rocks with those placed in the control and test pools The third part deals with the growth and characteristics of natural periphyton undee conditions found in the experimental pools and the fourth is concerned with the regrowth of periphyton on rocks introduced into the same pools The fifth and sixth sections deal with water temperature data and certain supplementary observations
Incubator studies To arrive at some idea relative to the effect various nutrient levels might have on Lake Superior periphyton and to determine the dosage to be used in 1970 preliminary laboratoey studies were undertaken using specially modified BOD incubators Phosphate and nitrate levels comparable to the dosages which had been theoeetically calculated as desirable for the experimental pool at Castle Dangee were maintained in two of the test incubators Two other incubators served as controls and these were supplied with normal unenriched Lake Superior water collected at Castle Danger
Several periphyton-covered rocks were collected from Castle Danger placed in enriched and control circulating water systems in the incubators and allowed to grow for a period of twenty-six days at a constant tempshyerature of five degrees centigrade and a light intensity of one hundred foot-candles At weekly intervals samples were removed and total chlorophyll analyses were made As indicated eaelier no enriching substances were
77
Figure I Novnmber Northedster at Ie [langer Lilke Super 970
house ng December 3n1Fiqure
78
added to the lake water used in the control However in the test incubator the Castle Danger water was sUP~lemented with 0163 ppm P (05 ppm P04) and 245 ppm N (871 ppm NO) The growth trends of
based on chlorophyll values during the 26 day period is shown in Figure 17 p 70 The mean chlorophyll value for the control was 0529 while that for the enriched water was 118 mg (MSPU) per 100 square centimeters Thus it will be seen that on the basis of this parameter the periphyton growth in the enriched water was more than twice as great as that in the control On the basis of this preliminary study it was apparent that the proposed nutrient level was satisfactory and this dosage was therefore adapted for the subsequent field tests which were carried out at Castle Danger during the 1970 season
The collection area for samples one-quarter mile from the
experimental pools (See Figure 8 p 40) Periphyton-covered rockswere collected in twelve feet of water using SCUBA technique and then brought back to the pools to be incubated for the summer and fall periods A general examination was n~de on a portion of the original samples collected Two such series of collections were made one on June 5 and the other on July 1 Microscopic examina tions revealed that periphyric organisms had changed very little from those f0und in 1969 (See Table IV) Synedra was the most common organism followed by Achnanthes CymbeUa and Nitzschia Total counts per square centimeter of rock area 600000) Ivere nearly identical with that found in 1969 Total and individual chlorophyll contents for qhe two samples collected are presented belDlV
Mg (MSPU) Chlorophyll Per 100 Square Centimeters
Total Date Chlorophyll ~ Chlorophyll b Chlorophyll ~ Chlorophyll
June 5 0379 0019 0150 0548
July 1 0423 0021 0193 0637
Mean 0401 0020 0171 0592
The chlorophyll values are lower than the averages found in 1969 This most likely is due to seasonal differences as well as differences in water depths from where the samples were collected The high chlorophyll c values are to be expected since the majority of the organisms (91) observed were diatoms Dry weight analyses on the samples collected (989 m~cm2) revealed a slight decrease from that observed in the fall
79
of 1969 Here again comparisons are at best only estimates since so few samples were collected In general it could be concluded that the 1970 samples obtained from the lake were nearly identical to 1969 in terms of species composition and total counts ParMleters such as chlorophyll and dry weight were lower than that of 1969
Natural periphyton experimental pools Periphyton-covered rocks collected from the lake were placed in the experimental pools on July 1 After a five day period of stabilization nutrients were introduced with the intake water into the test pool The other pool received untreated lake water only and served as a control Thereafter sample rocks were collected from each pool on a weekly basis and periphyton was removed in the laboratory for quantitation The data obtained covers the period from July 9 to November 25
Organisms were first identified and species were recorded in the form of a checklist (See Table IV) From this tabulation it will be seen that the organisms are grouped in three phyla forty-five genera and some seventy-three species Twenty-seven of the genera that is sixty percent are diatoms Diatoms also make up seventy-three percent of the species found Except for seltulana no species of chrysophytes other than diatoms were seen in the periphyton samples Chlorophytes green algae were represented by eleven genera There were only thirteen species which represents eighteen percent of the total number of algal species identified Six species of blue-green algae were found and these were distributed among six genera If one examines that tabulation in more detail it will be found that almost twice as many species were reported in 1970 as in 1969 The most obvious explanation is that the period of observation in 1969 was seven weeks only as compared to twenty weeks in 1970 and a greater number of samples were examined over a period which varied somewhat with the advancing season Further inspection of the data will reveal that a significant number of green and blue-green algae developed in the periphyton of the control pool whereas only five species were observed in the lake itself In this connection it should be realized that a certain element of unnaturalness exists in the control pool when comparisons are made directly with the lake These factors involve such things as shallowness of the water slightly elevated temperatures and difference in water movements In spite of minor differences the species make-up of the lake and the control pool is essentially the same and both can therefore serve as a baseline for the evaluation of the changes which have taken place in the test pool Organisms identified and encountered in the test pool are also presented in Table IV In this instance a total of thirty-eight genera and sixtyshyone species were recognized Fifty-eight percent of the genera and seventy percent of the species identified were diatoms Except for a slightly smaller number of genera and species the test pool resembled the control pool and the lake in diversity of diatom species It will be seen that the blue-green algae and the green algae follow this same diversity
80
When growth parameters such as nlmber individuals chlorophyll and weights are related to the surface area of the rock covered by periphyton the findings are as follows Total counts in the control pool ranged from 518000 to a high of ten million cells per square centimeter The mean for the twenty-week period was 4600000 cells This value is approximately two times higher than that found for the same pool in 1969 Tn Table IX a listing is made of the five most conunon organisms Also included in this Table are total counts including all the organisms and a count of organisms by groups (phyla) As can be seen from this Table diatoms formed the largest group This was true not only at the beginning but throughout the experiment On only six occasions was the most predominant form something other than a diatom and on five of these it was that appeared as the abundant organism In a sense this could be misleading inasmuch as the particular species involved was very small and individual cells were counted Thus in terms of actual volume this form made up only a small part of the total growth The importance of two other blue-greens Phormiriium and Plee I~onema should also be viewed cautiously because of their small cell size Surprisingly
appeared as the most abundant organism on July 29 This alga is usually associated with warm water and was therefore not an expected part of the periphyton growth As a matter of record after its appeArance on the 29th it dropped to fifth place on August 5 and never again appeared in the leading five species As far as can be determined from the literature Pithophola has not been reported as a component of Lake Superior periphyton Among the five most common organisms and 1ehnanthet were the predominant forms in fourteen out of the twenty sampling periods This is in agreement with the control pool results of 1969 and with the results obtained by Fox (1969) in his studies of Lake Superior periphyton in Stony Point Bay
In the test pool much higher results were obtained Total counts ranged from one to nineteen million cells per square centimeter The highest count was recorded during the eighth week (August 26) when a corresponding count in the control pool stood at slightly less than seven million The mean count for all test pool samples during the twenty week period was nine million cells per square centimeter or nearly twice the number (4600000) found in the control pool In the test pool the five leading organisms followed a definite succession in their development At the outset 8ynedpoundoa was dominant as it had been at the time of collection of the rocks from the lake However during the third week July 22 N1tzscmCl palea replaced as the most abundant form and it maintained this position for another week After that the green algae or moved into first position For the remainder of the season in terms of numbers these green algae ranked first as may be seen in Table X This table also presents certain details with regard to group and total counts Numbers of green algae it will be seen ranged fronl 67000 to almost 13000000 cellscm2 The mean value was 5540000 which is more than two times the mean value recorded for diatoms During the twenty-week period of
81
TABLE IX
TOTAL COlmTS of Naturally-Occurring Periphyton in CONTROL POOL Lake Superior Minn (1970)
[Organisms per surface]
--shy of Total Rank of Five Most Common Genera
Date Diatoms Greens Blue-Greens TOTAL D G BG 1 2 3 4 5
Jul 9 1696000 deg deg 1696000 100 0 deg Syn Ach Cym Gom rtzTal 15 1968000 189000 235000 2392000 82 8 10 Syn Ach Pho Ulx Frg 22 4435000 123000 914000 5480000 81 2 17 Syn Pho Ach Ntz Frg 29 3083000 1987000 64000 5155000 60 39 1 Pth Syn Ach Ntz Cym
Aug 5 4159000 515000 1396000 6069000 69 8 23 Syn Pho Ach Ntz Pth 12 5384000 367000 266000 6017000 89 6 5 Syn Ach Cym Pho Clm 19 3945000 114000 61000 4120000 95 3 2 Syn Ach Cym Frg Ntz
(J) ~
26 Sep 2
8 16 23 30
4669000 121000 3430000 237000 2862000 153000 3774000 229000 3574000 339000 4369000 414000
Oct 8 15 22 29
Nov 5 12 19 25
6537000 456000 4609000 291000 5988000 1339000
NS NS 432000 123000 356000 105000 555000 98000 528000 119000
I
I
1701000 1016000
184000 2076000 1283000 1180000
943000 3518000 2771000
S 33000 57000
deg358 000
6994000 4683000 3198000 6078000 5196000 5964000 7936000 8309000
10159000 NS
588000 518000 653000 995 000
67 73 89 62 69 73 82 55 59
73 69 85 53
9 5 5 4 6 7 6 3
13
21 20 15 11
24 22
6 34 25 20 12 42 28
6 11
deg36
Syn Ach Syn Lyn Lyn Syn Syn Lyn Lyn
Ach Ach Ach Lvn
Ach Syn Ach Syn Syn Lyn Frg Ach Den
Clm Clm Frg Ach
Lyn Pho Cym Ach Ach Ach Ach Den Syn
Cym Pho Clm Clm
Pho Cym Cym Frg Pho -Iav Pho Frg Cym enNt2 Cym Ntz Cym Lyn Syn Cym Ach PIc
Syn Ntz Cym Syn Syn ymNt2
CvmiSvn -Itz MEA 3318000 361000 903 000 4 610000
See Table V for explanation
TABLE X
TOTAL COUNTS of Naturally-Occurring Periphyton in TEST POOL Lake Superior -- Castle Danger Minn (1970)
[Organisms per cm2 rock surface]
of Total Rank of Five Most Common GenerTOTALDate Diatoms Blue-GreensGreens D G 2BG 1 43 5
Jul 9 1764000 Pho89000 91 4 Syn Ach Ntz Cym1608000 67000 5
(J) w
240000015 570600022 683800029 5959000Aug 5 806900012 425200019 516800026 2488000Sep 2 19480008 121800016 151300023 104300030
Oct 8 950000 166500015 156500022
29 NS Nov 5 323000
12 343000 19 770000 25 820000
177 000 2316000 3864000 4162000 7378000 3378000 9601000 5479000 5452000 5432000 7575000
10231000 12090000 12785000 11975000
KS 1166000 2314000 3329000 2050000
354000 811 000 438000
2331000 2588000 1641000 4082000 1052000
425000
328000 54000
1143000 148000 479000
NS 76000
313000 538000 733000
deg
2931000 8902000
11154000 12452000 17022000 9283000
18851000 9018000 7916000 6650000 9417000
11329000 14197000 1459fl000 14019000
NS 1565000 3000000 4637000 3603000
82 64 61 48 47 46 27 28 25 18 16
9 7
11 11
21 11 17 23
6 26 35 33 43 36 51 61 69 82 80 90 85 88 85
74 77 72 57 bull
12 10
4 19 10 18 22 11
6
deg4 1 8 I 4
5 12 11 20
Syn Ach Ntz Ach Ntz Syn CZm Ntz elm Szm elm Ach elm Szm Sed CZm Scd elm Scd n~
G m Scd elm Scd elm Sed elm Scd Szm Scd Szm
Sed elm Sed CZm Sed elm Sed Ose
Pho Ntz Cym Szm Syn elm elm Pth Ach Osc Syn Ach Ntz Ach Syn Osc SZTII Syn Lyn Ntz Osc Ntz SZTII Lyn Szm Ntz Ach Ntz 5zm Syn Szm Ntz Lyn Szm Cym Ach Szm Ose Ntz elm Ntz Cym elm Ntz Ose
Ntz Cym Ach Szm Lyn Osc Ntz Pho Osc elm Vlx Ach
MEAN 2732000 5541000 881000 9115000
See Table V for explanation
observation blue-green algae counts were highly variable For example while on August 26 a count of four million was recorded the count on September 2 had dropped to one million and on September 16 to less than ten thousand One explanation for these variations and the unstable population of blue-greens which resulted is that at certain growth levels mats of Ovcillatoria and are formed and that photosynthetic oxygen entrapped in these mats buoy them up to the point where they break loose from the substratum and float to the surface This leaves the periphyton with a low blue-green count until the mat is replenished by regrmlth For much of July and virtually all of August blue-green mats were observed floating as small fragments of scum on the water in the test pool Examination of these scum fragments revealed that they were made up almost exclusively of filaments of Osc-illatoria This phenomenon is similar to that reported by Blum (1957) In his studies of the polluted Saline River in Michigan he observed what he called flakes of Dsci floating on the water Although variable the blue-greens were generally present in sufficient numbers to be included in a listing of the five most abundant organisms and taken together they were included in twelve out of twenty lists or sixty percent of the time
In terms of succession (See Figure 23) diatoms which were the predominant forms at the outset reach their peak during the first two weeks of August and were characterized thereafter by a progressively decreasing abundance During the first weeks green algae increased sharply and by the eighth week they had finally passed the diatoms in terms of numbers They were the predominant forms for the remainder of the season The blue-green algae never achieved first place
As a first step in the evaluation of the data relating to productivity as it is expressed in terms of total numbers of organisms without reference to any given species a graph has been prepared pre8enting the data obtained from the test and the control pool on the same chart This then can serve as a basis for simple comparison This information is presented as Figure 24 It will be seen that after the third week productivity in the test pool which was receiving nitrogen and phosphorus enrichment greatly outstripped that in the control pool Actually after the first week counts in the test pool were higher than the control and they remained consistently higher throughout the period of experimentation In some instances the growth in the test pool was almost three times greater than that recorded for the control pool The downward dip taking place from September 8 to September 16 when there was a rise in the control pool may be explained on the basis that it was a period of northeast winds and high waves On several occasions it has been observed that northeast or east winds can produce waves which may spillover into the pools and on two occasions it was seen that the waves affected the test pool only As lake conditions worsened the control pool was also included This slight differential treatment of the pools resulted from the phY8ical contour of the shoreline No observation was actually made at Castle Danger on September 15 however weather bureau data reveals that
84
20
101 K
lt x
N E ~
~ c
i 0
a 6
4
08
06
04
02
005
0011-1--shy
-----~middotmiddot
bDiatoms --6shy
Greens --Q --shy Test Pool
Blue-~~__~~ --_
OCT
F i gure Tl
85
northeast winds up to 15 knots blew for that entire day and during the first half of September 16 It is believed that in this instance the waves were such that only the test pool was affected and that the force of these waves swept a portion of the periphyton from the test rocks The control pool was untouched and therefore reflected the normal increase expected for that period Another explanation and one which also takes into account the downward trend in the test pool two weeks prior to September 16 is that periphyton populations have reached a point of maximum development after which a sloughing-off effect took place thus making room for new young and rapidly growing periphytic forms This type of phenomenon has been observed quite commonly on filters of sewage treatment plants (Olson 1972) The extremely sharp drop-off in total numbers seen on November 5 is easily explained During the last week in October heavy rainfall along the North Shore was responsible for increased surface runoff which ultimately affected
2xl07
7 I~I the turbidity of Lake Superior water For nearly five days water in the
8xl06 ~ 7x 10⁶ experimental pools was so turbid that it was impossible to sample because one could not see the bottom On November 3 after the water finally~ 6xl06 cleared up a strong Northeaster developed during which massive waves~Jgt---~~
swept over the experimental pools and the ledge on which they had beenp- - --0 I15X106 I I I constructed A visual inspection of the pools showed that appreciable
4xl06 I Ii amounts of the periphyton had been swept away by the waves leaving rocks 0shy partly denuded As a result when samples were collected two days later
rf) 3xl06 I lt I it was found that the total counts in both pools had been decreased rf)
~ nearly fifteen times In the weeks which followed ltlith all operationsz I
I~ 2xl06 progressing normally total counts again moved upward in both pools0 This incident though possibly isollt1 ted points to the f ac t that periphyton
may be detached by wave forces and that at such times the periphyton certainly makes large contributions to the phytoplankton population of the body of water concerned
o
~6
8 xlo5 In addition to evaluating its effect on productivity one of the 7xl05 objectives in placing periphyton-covered rocks in experimental pools~ ~d 6xl05 was to follow the pattern of succession induced by the changes imposedbd 5xl05 in the new habitat It was hoped that the enrichment added to the test- - - - - Control Pool
pool would produce changes in the natural periphyton population of Lake Superior which could be seen and measured so that one might anticipate and possibly prevent the harmful effects of adding potential enriching substances to the lake in the future To this end eight genera were selected for special attention including an evaluation of the group response to controlled enrichment The eight genera involved were
-o---T05t Pool
t Nitzschia Synedra Aehnanthes Cyrrl)[lla 8cenedesmus Schizomeris and ()scillatoria In this study attention has been shifted from total counts of all organisms encountered to counts of organisms
II (N S)
within a genus A synopsis of the maximum and minimum and of the mean counts for each of the eight genera will be found in Table XI In dealing with relative growths in the test and in the control pools graphical comparisons of productivity in terms of numbers of individuals have been made for each of the eight genera The data are presented in the
Figure 24 Natura Ily-occurring periphyton tota I counts (per unit form of eight graphs (Figures 25 to 32) In the test pool as mentioned area) in experimental pools Castle Danger - Lake Superior 1970
87
86
----
Organism
CHRYSOPHYTA
Nitz8chia
en (Xl
CHLOROPHYTA
CYAIWPHYTA
Oscillatoia
Overall Mean
ABLE XI
Average Abundance and Population ~agnitude of Predominant Genera amoung Naturally-Occurring Periphyton in Experimental Pools
Lake Superior - Castle Danger ~inn (1970)
Counts expressed in terms of cm- rock surface
euro1 0 0 0 0 Orgonisms per
ltgt
ro N
Di ltD
lt0 u 0 c r(D rN laquod = N
N
J 0 to bull ~ ~ Q oro -1 UJ ~a tfl -t- N - - -+ 1gt _ () C 1l1l
00 0 Gi(i5 co gtD a pound
~ t~ (C ~ +m ~ ~ Q ~ CDshy ~
r s if) shy
0 ~ (J)
~ N CJ)
~
en ill c -+ 0 u c ~] CD o _ 00 lt n
I -I N t-X Nshy
~ () N c to 0
co
z u 0 ~ lt to
Control Pool
Range lean
22000 - 9ll000 302000 38000 - 2442000 1052000
144000 - 1954000 815000 41000 974000 369000
0 0 0
369000 246000 570000
150000 34000 35000
deg 277 000 15000
347000
Test Pool
Range
61000 3000000 45000 1896000 76000 2266000 40000 488000
0 4772000 0 9344000 0 4015000
0 1481000
2 6 cm X 10
0
-~
~ gtshy~ - shy_-r-
Hean
939000 531000 644000 196000
1598000 2715000 1373000
402000
1050000
4
SlNEDRA
2
~
) ()B 8
5
06
amp f 04
x )(
N
1~ ~
a Q 0 bull 2
E~
L
C a 0
0gt
0 2
0 111 bull 1
06
004
Control Pool -_ Test Pool
(1 002
JUL AUG OCT NOV
oi
in ndiur-ally-occuITinq i- Figure 27 Deve ~uper-iorl 1 per i
91
ill o x
I I I
-----i
bull o
J
2
i--Jbull G I
08
6
~ 01
X
~
bull
1 u
v- Ifv shy
~ c o
I I
I I
0 I ~J
004 Control Pool --~-shy
Test Pool -- shy003
------ shyUU2
002
Control Pool Test Pool--
00
JUL AUG SEP OCT NOV
Ii iopmont of Ua in naturaily-occurr-ing pei Figure 29 opmont natur-a ~tlo [Janger - La POI-jor- i97(L pnyton
92 93
q t IQ gt~ 0 Ie 12 21 t t shy
JUL
6
4
2shy
SCENEDESMlJS
08
06
O B
~ 06 ~ 04 x x
(J
E~ 04 Q Co~ Ugt 02
25 1 1 1 L 1 I I I_ __ _ _ __ ~ I J
OCT NOV
~ -E~ 0
~ f) 2 ~ 0 ~
0
-shyO l
1)081
OOG
004-shy
0011 j bull III J 1 I I 1 1 J 1 J 1 I I 1 I J 1011 l l L 9 22 ~ -shy~ 15
JUL
Figure 31 Development of Scfdzomens in gure 30 Development of Scenedesmuc i natural I urrlng periphyton Castle Danger - ke
periphyton Castle Danger - Lake peri
94 95
+
3
2
004
002
I I I I I
Control Pool -shy Test Pool
I I I I
II 1 I I I I I
Nfl
v c o 0 o
8
1
I I I
OSCILLAlORIA
Control Pool Test Pool
gure 32 Govel of OsailZatoY1a in natura periphyton Castle Gangor - ke Super
96
earlier Nitasahia was the diatom which generally predominated As Figure 25 shows Nitasahia increased tremendously during the first two weeks and reached its peak by July 29 The growth was essentially similar in both pools but was definitely higher in the test pool The mean in the latter count was more than three times greater than the control Thi s could be expected for the tolerance and adaptability of Ni~z8arlia to polluting conditions has been widely reported (Butcher 1947 Blum 1960 Philipose 1960 Allanson 1961 Palmer 1969 and Munawar 1970) After compiling a list of eighty of the most tolfrant algal forms Palmer (1969) shows that N was the second-most tolerant species and that Nitz[lciria was the sixth-most tolerant genus The success of Nitzsahia in polluted situations according to many investigators is closely tied in with the nutrient requirements of the alga as indicated by Chu (1943) He found the optimum N03-N level for Nitzschia to be one to three parts per million and established that the phosphorus limitation varied widely (0018 to 89 ppm) At Castle Danger nitrate-nitrogen was added to the test pool at the rate of 196 ppm whereas phosphorus was added to produce 0163 ppm This dosage is well within the optimum limits as indicated by Chu and therefore it seems logical that Nitzsah1a should have reached very high numbers in the tfst pool It will bf seen from Table XI that this organism actually reached a concfntration of 3000000 per cm2 bull The highest previous figure for pfriphyton in Lake Superior is that reported by Fox (1969) His maximum was 129000 organisms per square centimeter
In contrast to Nitzschia which was highly stimulated by conditions in the test pool SynedYa Achnanthes and Cymbe Za were inhibited Synedrgta for example was nearly two times as abundant in the control pool as in the enriched pooL This can be verified by consulting Table XI In this connection it is interesting to note tlwt the
maximum growth of in the control pool 2442000 organismscm is almost identical with the figure of 2523000 organisms found by Fox (1969) in Stony Point Bay Take Superior The means are also very close (1100000 to 1400000) Since the maximum value reported by Fox was from a depth of 25 feet it i[ directly camparable with the depths of the experimental pools Thus one can conclude that with counts so similar the conditions in the control pool were as it had been hoped extremely close to the conditions encountered in Lake Superior itself So far only the mean values have been dealt with however the week to week changes which took place would not alter the conclusion expressed above The details relating to the week by week counts are presented graphically in Figure 26 From this Figure it can be seen that for the first four weeks total counts were not very much different for the two pools However after this initial period one will note that populations in the test pool decreased rapidly The extreme drop which occurred in November and was shared by the control pool is attributable to the effects of a violent ~orthshyeaster
If we now turn to Aehnanthes we find that it too was inhibited in
97
the test pool This is demonstrated by the fact that the mean concenshytration in the test pool 644000 is twenty-six percent less than the growth in the control pool (8l5000cm2) This difference although small is believed to be a significant one This view is based on the fact that although to begin with counts in the two pools were very similar (See Figure 27) the difference became marked at the beginning of September If the period September 2 to October 22 alone is considered which represents the growth period preceding the November storm it will be found that growth in the control pool was more than three times as great as that in the test pool Again if comparisons are made with Foxs data it will be found that in the Castle Danger studies counts are higher In this case 815000 as compared to 300000 cellscm2 bull This difference may be explained on the basis that Foxs studies relate to a wave-swept bay in Lake Superior itself where the effects of even a small storm may be quite drastic At any rate ignoring possible seasonal variations the difference between the natural environment and the control pool is less than one log cycle
Although Za does not as frequently rank with the first five organisms as other diatoms mentioned it is still among the first eight Growth in the tes t pool for some unknown reason went through a series of up and down oscillations which can only be accounted for on the basis that these organisms having attained a certain level of growth are automatically and periodically sloughed off the rock surface to which they have been attached Once more the very low point reached in November can be associated with the effects of the very strong Northeaster on November 3 If reference is now made to the control pool curve shown in Figure 28 it will be seen that rather than reaching its maximum at the end of the first six weeks as was true with and Achnanthes progressively increased for fourshyteen weeks to an eventual maximum of 954OOOcm 2 in the control pool on October 8 It Seems apparent thRt Synedra and Achnanthes demonstrate a preference for the lower nutrient levels which characterize the control pool whereas being less sensitive to higher nutrient levels responded favorably except for certain oscillations which were attributed to sloughing-off The general reduction observed in the diatoms of the test pool which on the basis of the first impression might be ascribed to the harmful effects of high levels of enrichment could also be explained on the basis of competition on the part of green and blue-green algae
Ch10rophytes the experimental pools exhibited tremendous growth differences The involved Jere Seenedesmus and Sehizomeris were the first to appear As one will see in Figure 29 its numbers in the test pool increased tremendously after the first week and a high point of 4700000 organisms was reached on August 26 After that time numbers decreased to an eventual low of 373000cm2 which was reached after the severe storm of November 3 Development of in the control pool although signficantly lower showed a increase which reached a maximum of 369000
98
organisms on October 22 This is eight weeks later than the maximum observed in the test pool The mean count of in the test pool was over ten times greater than that in the control (See Table XI) The strong development of this alga in the enriched pool is not surprising since it is widely known that it grows well in sewage stabilization ponds and other highly enriched aquatic systems (Palmer 1969 Singh 1969 and Munawar 1970) Palmer (1969) for example has ranked the genus Chlamydomonas as the third most tolerant genus of all algae Fox (1969) does not report this genus probably because the organism was present in very small numbers only Because of this there is no basis for a comparison of his data with those at Castle Danger It should also be noted that the periphyton collected directly from the lake during the present study did not contain a sufficient number of to be listed among the first five organisms As a matter of fact it was never seen The possibility exists that ChZamydomonas is always present in small numbers in the periphyton and that when a more sheltered environment such as the experimental pools is provided it may be expected to appear in sufficient numbers to be counted
By the time Chlamydomonas had reached its peak Scenedesmus made its first appearance in the test pool As will be seen in Figure 30 this alga was characterized by an almost unbelievable growth increment which was observed in the test pool but not in the control pool At the time that the control pool finally reached a count of 110000 organismscm2 (October 8) the test pool count stood at nearly nine million Again the drop which occurred in November can be ascribed to the storm which was reported earlier Counts in the control pool were generally low and Scenedesmus did not appear until September 2 Its cyclic appearance after that date has not been explained Mean counts for the control pool and test pool are presented in Table XI They are 2715000 for the test pool and 34000 cells per controL As with Nitzschia and ChZamydomonas Seenedesmus is considered by many as a pollution tolerant organism Palmer (1969) ranks it fourth Godward (1937) observed that Scenedesmus quadricauda was definitely associated with the reed-swamp habitat and the presence of excessive amounts of organic matter Brook (1965) in summarizing some of Naumanns data stated that bullbullbull the green alga Seenedesmus is not a significant constituent of the pelagic plankton of oligotrophic waters although it is often common or even abundant in eutrophic waters Although it may be present in the littoral region of oligotrophic lakes the lack of adequate nutrients prevents it from establishing itself in deeper regions bull In a previous study by Fox (1969) the highest mean count recorded for Seenedesmus quadr-ieauda was 28000 cells per square centimeter of rock surface This was recorded in 1966 for periphyton collected at a depth of five feet in Stony Point Ray Lake Superior The fact that the enriched pool at Castle Danger reached a count of more than nine million organisms indicates tbat Scenedesmus is one of the organisms found in Lake Superior which responds very favorably to phosphorusand nitrogen enrichment
99
If one now combines the growth curves of all three genera an interesting succession of will be seen (Figure 33) Three separate peaks of increasing heights are visible in this graph of the results from the test pool It should be realized at this point however that succession is an extremely complicated phenomenon which brings into play many important biological chemical and physical factors In order to make valid conclusions several years of observation may be necessary For these reasons the succession noted in the periphyton at Castle Danger should be viewed with caution and the realization that a more in-depth and lengthy study would be needed However to add support to the seemingly apparent succession pattern observed in the test pool investigators such as Singh and Saxena (1969) have similarly noted the succession of by Scenede[JmUIl On a seasonal hasis they observed a consistent cycle in the grmgtth and disappearance of these algae in sewage stabilization ponds in India
Another alga seen in this study and one not previous Iv renorted for Lake Superior periphyton was the filamentous green alga LeibleinU Although this is the only spec ies reported in the United States and is widely distribu ted it is not a common alga It is interesting to ohserve therefore that in the enriched test pool this organism reached a concentration which in terms of numbers ordinarily exceeded that of
llatoria For example in the test pool counts of [J averaged 1370000 cells per cm 2 and on August 26th reached its maximum of fou r million This organism was observed in the control pool on only three occasions Based on this limited number of saJl1ples the control 35000 and never reached a count greater than 570000 cells per SchizomeIB was never observed in samples taken directly from the lake It is presumed that SeJd zomeris in very small numbers did occur in the lake but that the water movement and currents characteristic of the inshore areas kept ita t a very low level Upon entering the tes t pool violent water movements were eliminated and consequently the organism thrived Another explanation and the one favored by the author is that
was present in Lake Superior water in undetected quantities but that upon encountering the favorably enriched environment found in the test pool it responded rapidly to the high nitrogen and phosphorus levels which existed there The latter view is supported hy Prescott (1964) who stated There is some evidencE that the plant favors ater rich in nitrogenous matter ltmd is to he looked for in shallow water of lakes near the entrance of drains effluent of sewage treatment plants etc~n
It should he menttoned that especiaLly at one period in its growth closely resembles is sometimes confused with that genus However a ~JOrker who observes these two genera on a continuing basis has no difficulty in separating the two and in the event that as is stated by some [ichizomerlB merely is a growth form of the separa tion is s ti1 1 valid and useful because it ref]ec ts a maj or change in the environment In the Castle Danger studies the typical UZothl1X
100
61shy
4
Y-
2
08
~ - 06 x
N~ 04
c
~ g 02
o
005 I
I
A
01 f-I--t-----
--~
~~
r
NOV
Figure 33 n ( I
i-he
I
lCll
was observed in both pools In the test pool it occurred very sparingly however in the control pool while it was never abundant it could always be found The details of the Schizomeris response in the study of the pools are presented in Figure 31 It will be seen that after a two week lag Schizomeris LeibZeinii numbers increased very rapidly By the third week counts had reached one and one-half million and by the eighth week its maximum of four million was reached As one looks at the graph one detects two periods of major growth one on August 26 and the other near the end of October It is believed that the sharp decline seen on the 16th of September can be ascribed to a storm on the 15th during which time large waves breaking over the test pool wall produced a certain amount of scouring in the test pool This theory is supported by the fact that following another severe storm on November 3 another precipitous decline in numbers can be seen on the graph As pointed out earlier Schizomeris organisms were present in the control pool on three occasions only July 22 September 2 and October 22 Between these periods the organism was not seen No explanation is offered for this phenomenon inasmuch as the inspection of the experimental records reveals no incident which can be related to the sporatic growth of SehizomeYis in the control pool
Although OsciUatoria was observed on only one occasion in the intake water coming directly from Lake Superior (Adess et aZ 1971) observed rarely in periphyton from the control pool it grew the test pool As one will see from Figure 32 the growth of
and
seem to be cyclic This is probably due to a periodic sloughing-off which takes place when the OBeiZZatoria growth has produced a mat which will imprison bubbles of oxygen produced in photosynthesis When this happens the algae mat is buoyed up by the 3xygen bubbles and portions are torn loose and float to the surface This effectively reduces the count on the rock substrate Since llatoria is notorious for its favorable response to enrichment it is not surprising that it should reach high levels of concentration in the test pool In this instance the
2maximum was 1480000 and the mean was 402000 cells per cm Palmer (1969) places OsciZlatoria in the second position in his long list of pollution tolerant algae He considers the species O tenuis as the second most tolerant species of the group Although two or three species of Oscillatoria were observed at Castle Danger only the most common O tenuiB was identified to species It was felt that for the purpose of this study identification to genus was sufficient for species that were very rare The highest OscilZatoria counts coincided with the period in July and August when water temperatures were at their highest While other blue-greens such as Phormidiwn and contributed importantly to the total overall counts these algae were so small that for practical purposes their total cell counts although exceedingly high actually represented a much smaller contribution in terms of algal biomass This should be kept in mind ~vhen the tabula tions are examined
Another growth parameter monitored throughout the course of these experiments was the level of chlorophyll reached by each sampling date
102
A ummation of these findings will be found in Table XII On the basis ofSthiS tabulation it will be seen that in the control pool total chlorophyll values ranged from 002 to 2167 mg (MSPU) perlOO square centimeters with a mean value of 0846 In the test pool ~t ranged from 0561 to 4861 and the mean was 281 The details presented in Table XII are also presented in graphical form from Figure 34 to 35 inclusive Figure 34 shows a comparison of the results obtained in observations of the total chlorophyll values for the entire period of the experiment Chlorophyll concentrations on August 12 it will be noted were at a near maximum in both pools During the next week chlorophyll values dropped dramatically in each pool The best explanation is that temperature shock is involved Evidence for this can be found in the records for the week August 12 to August 19 which indicated that the lake water temperature which on August 12 was 70deg F had plummeted to 48deg F one day later A low of 44deg F was reached on August 17 By the second samplirg date August 19 the temperature had risen to 49deg F only Mindful of the very considerable drop of 21deg which occurred during this week and the fact that temperatures had not returned to their original levels even at the end of this time one can with some degree of assurance say that the drop in chlorophyll on this occasion was largely due to the reduced metabolism of the algae in the periphyton Another possible explanation which might have been responsible for a part of this drop is that the organisms sloughed off and lost to the plankton were not replaced by new individuals under the low temperature condition which prevailed
During the week which followed chlorophyll values in the test pool again reached their normal levels Values in the control pool however never reached their original level On September 16 another precipitous drop occurred in the chlorophyll values of the test pool This is attributed to the purging action of a Northeaster It is believed that high waves produced by this storm on September IS the day preceeding the taking of the sample swept up the face of the rocky ledge and spilled into the test pool where they produced a current of sufficient velocity to partly denude the test rocks The control pool as can be seen was not affected This is in keeping- with earlier observations that at the wind velocities involved on September 15 (21 knots) waves will not spill over into the second pool By October 8 the test pool had recovered from this purging and chlorophyll levels had reached 486 mg (MSPU) At this time ScenedeBrTlus was the predominant organism On November 3 another Northeaster even more severe than the first (wind velocity 30-35 knots) swept waves into both pools A corresponding reduction can be seen in chlorophyll levels in both the test and control pool By this time the weather was quite cold and in terms of chlorophyll levels neither pool recOvered from this episode
The data for the control pool presented in graphical form in Figure 35 represent a refinement of the information presented in the previous Figure In this instance the total chlorophyll value has been translated into corresponding values assignable to chlorophyll a chlorophyll Q and chlorophyll c Chlorophyll averaged 0552 mg per
103
COC8tiai ltSgtL) - S of Na~urall i1g agte SlJcer-or Cas-- e Danger ~inr 970)
125
678 bull Lt8+
O O
O 76 D Jlf
L
1 L
91
26J
2~38
2258 ~
bull [+7
3311
026
21(1
81 J=-S7
115
0]85 ill O 056i 0237 0161 O 121 O 263 3 i+6 2023
37 211 0747 J780 G 32 0324 2 =-67 706
043 3 1189 4329 052 J317 08 i l bull OS
022J J700 I 581 0184 0844 O 4594 J188 388 3607 13 0070 1064 2825
082 1 i22 2 D 082 2892
037 O 1 297 L861 127 O 0872 4570 112 0281 1 690 4717
I- 290
~~ug
13
8 13 23
TOTAL CHLOROPHYLL [m9(MSPU) per 100 cm2]1
0 N N 0J 0J (It
r 0) 0gt i i i
9 gt gt- CO ltgt c t1l
()lt-(] 0VI
-lt ~ ~ 2shy
g 1(j n z OJ cD - 9
U1 J -t -t n c U1
Ql 0 ru I- (1)
I
-t JgtN (D J Q
C ccJ OJ -lt J -t I shyco 0 ill (1I- (1o m
shyen c
rv - c () J F(Q m (7)
c U (f) (IiJ 1) C - - ~m
--0 -t - (7) -u I OJ r - lt o 0 -t 1 W 0
J
o -t
iD (l ~A
T (1) 0 shy
~i
CONTROL POOL
tbt==t===yen 11 19 5
--lUI 1
1970
36
32 TEST POOL (1
28
24 N I E
u
) 04 ~~0~~ o -~~~-f---=lt~--cL_____ J 1 1 1 1 ~ ~
Inl Z3 22OCTshy2~1_28 16 I 30ILI 8 I5 291~5NOVshySEP-
pigment irnental Is
106
100 cm2 and ranged from 0017 to 1255 mg Chlorophyll indicative of a diatom population ranged from an value on November 19 to a maximum of 083 MSPU per unit area on August 5 Chlorophyll ~ which remained low throughout the period averaged 0066 mg per 100 square centimeters The relation of chlorophylls ~~~ to one another are represented by the respective ratios of 914 On the basis of the algae present this ratio seems reasonable
In the test pool as may be seen from Figure 35 chlorophyll ~ was by far the most important pigment Its concentration varied from 0427 mg at the outset (July 9) to 3447 mg per unit area on October 8 The average value for the test pool during the season was 1858 mg This is a level three times higher than that in the control pool Since green algae made up the largest percentage of organisms in the test pool it is not surprising that chlorophyll b values are relatively high Chlorophyll l values ranged from 0009 on July 15 to 131 mg per unit area on September 2 The average 063 mg is almost ten times that recorded for the control pool in which diatoms were the dominant forms In general except for absolute values there is a good correspondence between the chlorophyll l levels and the numbers of green algae They tend to run a parallel course For the most part the test pool pigment with the lowest concentration was chlorophyll c During the twenty-week period chlorophyll ~ ranged from 001 to 097 MSPU per unit area The highest values occurred as might be expected between the fourth and ninth week which in the test pool was also the period of maximum diatom growth Diatoms as it will be remembered have a relatively high chlorophyll c value The chlorophyll ratio in the test pool was 621 as compared to 914 in the control This means that chlorophyll band c were completely switched around a finding which was completely supported by the microscopic examination of the samples
Control pool values in terms of mean total chlorophyll in 1970 was less than half that observed in 1969 A combination of factors ranging from the location and depth of original sample collection in the lakes to the seasonal weather differences may have been responsible for this difference Stokes (1969) value from all depths in Stony Point Bay Lake Superior was 136 mg (MSPU) per 100 square centimeters a value which falls exactly midway between those found at Castle Danger in 1969 and 1970 (180 and 085)
Test pool chlorophyll values were fairly high and the 1970 results were sixty percent higher than those reported in 1969 No valid comparisons can really be made between the 1969 and 1970 results because of the differences in procedure and dosages used Especially important is the fact that the dosage of phosphorus used in 1969 was so high that it appeared to be inhibiting and that no nitrogen supplementation was provided This imbalance in the nutrients was corrected in 1970 so that the final ratio including the phosphorus and nitrogen present in the lake water itself was fifteen parts of nitrogen to one part of phosphorus
107
The dosage was also reduced so that phosphorus was added at a rate one tenth of that used in 1969
In addition to the chlorophylls determinations were made of the carotenoid pigments For a better understanding these were separated further into non-astacian (plants) carotenoids and the astacian (animal) carotenoids Values for non-astacian carotenoids in the experimental pools are presented graphically in Figure 36 In general it is evident that values throughout the season except for their amplitude closely follow those given for chlorophyll In the test pool the average 2 concentration of non-astacian carotenoids was 072 MSPU per 100 cm as contrasted to 281 mg (MSPU) for the chlorophylls In the control the mean was 020 MSPU per 100 cm 2 as compared to 085 mg (MSPU) for the chlorophylls
As will be seen in Figure 36 the astacian carotenoids did not follow the same pattern of the chlorophylls and non-astacian carotenoid pigments For example in tbe test pool the mean concentration was 03 MSPU per 100 cm 2 while that in the control pool was more than twice as great or 007 tlSPU This would seem to indicate that animal grazers preferred the periphyton in the control pool to that found in the test pool The two sharp peaks of astacian carotenoids which occurred on August 12 and October 22 correspond nicely with observations recorded in the research journal for those days hich indicate that Chironomidae larvae in the periphyton samples were also most abundant at thltlt time
In summing up the data related to the 1970 chlorophyll pigments and total counts a comparison as made of these two parameters Correlation coefficients and regression lines were calculated by the least squares method for total counts and total chlorophyll values from each pool Counts (y axis) were plotted against total chlorophyll values (x axis) The regression lines arrived at by this procedure are presented in Figures 37 and 38 It can be seen that the correlation between these two parameters is excellent with the correlation coefficients (r) ranging from 082 (P = 0001) in the control pool to 0878 (P = 0001) in the test pool
The results of dry weight analysis obtained in this study during a twenty-week sampling period are presented in a graphical form in Figure 39 This information is backed-up by a tabulation (Table XIII) whid lists the specific individual results together ith the calculated means If these sources are consulted it will be seen that the overall average dry weight for the control pool was 989 mg w[lile the test pool
2average was 926 mg per cm This result is difficult to explain but it must be remembered that it is an average and a detailed examination of Figure 39 shows that there is a considerable fluctuation in the samples For this reason no close interpretation seems to be justified
If we now turn to the results obtained tn the study of ash-free dry
108
CAROTENOIDS -----~ - - ----shy1970
Astoclan I Non-Asfoclon - -=-===l===
- IContra 1 Poo 1
Test Pool
~ j
J
I
1 Y bull p
~
I[I I
I 2 i
0 II ~ j
I ___e-___ --- F-a bull I~ ~Q) (5 gt B u
c ~-~ I
~ ltn a o
-1 I
I
OJ J
J
11E u l 0
I -
0
~
o I
r-J Q) C shy I
1
=l D-if)
n
o
~
I I I
I I I
~~I ~~~~J1 ----------- 12 19 26 12 8 16 23 30 18 15 22 29 15 12 19 25
19
AUG SEP OCT NOV
Figure 36 Naturally-occurring periphyton carotenoid concentrations (per unit area) in experimental pools Castle Danger shyLake Superior (1970)
109
--
-------
18 Y 1000000 + 2948314 X r 0878
12 X E E
c
o
14
10
~ 6
4
2
04 08 12 16 20
Total Chlorophyll
Figure
81shyCgt
X 6
~ ~ 4 E
c ~ ~ 2
Cgt
Figure
37 Regression line counts versus total chlorophyll naturally-occurrinq periphyton test pool Castle Danger - Lake Superior (1970)
Y -120327 + 6382996 X r 082 P 0001
CONTROL POOL 1970
08 12 16 2
Total Chlorophyll [mg (MSPU) 100 cm~
38 Regress i on line counts versus tota I ch Iorophy I I naturally-occurring periphyton control pool Castle Danger - La ke Super i or (1970)
110
9 I
~
Ipound)
N
aob-CD
~I~
1pound)1
0 W
7 gt
----- ~
-
gl 0lt--------shy ~I~
CD 0 f shy
- -shy
-t) ~I~ shy
--shy0 0 cx 001a
00 t t
~I 0 0 lt~~gt 0a ~Io I shy
w (J)CD 0
c
~ 2 t ~w 0 0 f shyu
-
c c lt
0gt
u
I
j -J 0 c
0gt J
0
1
0
-------IX--=-_
_X)
~~------------- 0
N ~ o (lw~6w) 14 DI8M
III
Q)
+shyUJ ru
U
ltJ)
0 0 Q
ru +shyc Q)
E
L Q) Q x Q)
c
c 0 +shyCgtshyr Q
L Q) Q
OJ c
L L J U U 0 I
Cgtshy
ru L l +shyru co
r shy+- ( 0shy
UJ +- L L 0 OJmiddotshy
L Q) Q) Q
J UUJ
c Q)
rugt OJru L -- 0
D C L ru Q)
OJ cgt-c L ru 00
( r)
Q) L J 0)
LL
W I shyltl 0
a w (f)
00+I N bull wJ N
~f-(f) r gt ltJ gt
~laquo
Ipound)
~I
~Igt-J
jgt ~
1 J
----
Ul --lt o o
Polt
H til w ~ Q)
-rlt Q) p lt ~
~ -rlt
o ~
w
c ~ p
-rlt Q)~
Polt 0 Oilcy ~--lt -rlt~ l ~ U to U -rlt0gt I ~
--lt
--lt Q)
til bJ ~
H l til H Wp H til gtlt gtlt Q)
--lt ~ H W H 0 Ul
til-lt ~u E-lt Q)
U I til
H 0 l -rlt Ul
Q) - p U l OVl
Q)
N -
UHtil
DO
Ul w c DO
-rlt Q)
3
U -rlt ~ til DO o D ~ til
~ P
w c DO
-rlt Q)
~ MN~N~~~~OOM~~O~~~~~~OO o
U ~O~OMNN~~NOO~~~M~~O~OO~ cy -rlt ~
middotz ~~~NNNNNMM~~~NNN~OO~O H
til DO o
H o81---+----shyE-lt
~I~ DO
-rlt Q) OOOOOO~~~~~OO~~OOM~O~~~~MO 3 MO~N~~~M~~~~~~N~~~~~~ N
middotz ~ OO~OMN~O~NOO~~~O~O~oo~oo~ cy
p
w c DO
-rlt
~ ~~O~~~~~MOO~~NOO~~~~~M ~~NNN~~~OO~~NMN~NM~~ C)
U -z -rlt OONNNNN~OOOO H ~ til DO
Hie o o Polt
c31pO 1---1-------shyE-lt z oulw
c DO
-rlt Q) ~OO~~OMO~OON~M~O~~~N~N j
~ O~OOMM~~~~~MM~O~M~~~ 00 -z
~ ~~OOOMOO~~~NOONOO~~MNMM cy p H
~ ~~N~~N~~NOO~MOOO~N~~N~~
~ -lNN -lNN -lNM -lNN r--1r--1N ~ p
H l DO
~ p Q)
w U o
gt o Z
~
112
weight (organic weight) of the periphyton we find that the mean organic weight for the control pool was 137 mg compared to 190 mg per cm2 for the test pool In the test pool biomass production increased steadily to a maximum value of 3497 mg per cm 2 (September 2) This is clearly indicated in Figure 39 which is a graph summarizing organic weights In the interpretation of this graph the two storms previously mentioned (September 15 and November 3) should be remembered for they have influenced counts and chlorophyll values and could therefore be expected to affect the organic weights If the graph is examined carefully it will be noted that there is a very large drop in values in the test pool on both of these dates This strongly reinforces the theory advanced earlier and based on other parameters that reductions on these dates are related to the high wave activity which accompanied the storm If the effect of these two storms were to be ignored it will be seen that for practical purposes the test pool organic weights were at all times higher than those found in the control pool No ready explanation is at hand for the isolated value observed in the control pool on July 22
With certain up and down variations the results obtained from the control pool were rather consistent until November 3 At that time the storm which has been described earlier was so severe that waves splashed over into the control pool as well as the test pool which resulted in a serious reduction of the periphyton During the sixteen weeks before the November 3 storm organic weights in the control pool ranged from 0464 mg to 2248 mg per cm 2 The overall twenty-week average of 1371 mg per cm 2 was fifteen percent lower than the average occurring in the test pool (190 mgcm 2)
If the results of the organic weight studies are reported in another way namely in terms of grams per square meter we find that the growth in the control pool at Castle Danger reached an overall mean of thirteen percent of the total dry weight while in the test pool the organic weight average was nineteen grams representing 204 percent of the total dry weight For comparison reference to reports of Stokes (1969) and Fox (1969) on their studies of the periphyton in Stony Point Bay is interesting The average organic weight reported by them for the natural lake environment was twelve grams per square meter which was 97 percent of their total dry weight determination On the basis of organic weight therefore the growth in the control pool at Castle Danger (13 grams) is for all intents identical with the results reported by Fox and Stokes for periphyton growth (12 grams) occurring in Lake Superior ltself
Regrowth periphyton experimental pools At the same time that periphyton-covered rocks from the lake were placed in the pools an equal number of denuded autoclaved rocks were introduced for the purpose of observing the speed with which a new periphyton population is established The predominant rock types used in this regrowth study were indigenous to the area and consisted of Gabbro Granite Basalt and Rhyolite Beginning with day 15 in order to follow the progress of regrowth
113
rocks were removed weekly over a period of twenty-one weeks or 148 days After the initial stabilization period of fifteen days rocks from both pools were coated with a growth which was easily seen with the naked eye In the test pool the growth was considerably heavier and rocks in this pool had assumed a general brownish-green color
A tabulation of the species of organisms found in this regrowth periphyton is presented in Table IV In the control pool as may be seen some sixty-seven species are listed and these are distributed among thirty-nine genera representing three phyla Fifty-two of the species (78) and twenty-six of the genera (67) were diatoms seltulana was the only non-diatom chrysophyte observed Ten species of green and five species of blue-green algae were found The species found on regrowth rocks were practically identical with those found on rocks which had not been denuded It is true that six fewer species occurred in the regrowth periphyton however this is not considered significant since in any event these were fairly uncommon
In the test pool regrowth experiment fifty-nine species were found in contrast to the sixty-seven found on regrowth rocks in the control pool In the test pool thirty-seven genera and three phyla were recorded Diatoms made up seventy-one percent (42) of the species There were twelve species of green and five species of blue-green algae Here again as in the control pool the composition of the periphyton population was completely comparable with that found on non-denuded rocks Similarly in terms of species there is no essential difference between the periphyton growth on denuded rocks in the control pool or the test pool
The numbers of organisms in each of the three phyla represented as well as the overall total counts and listings of the five most common organisms for each pool are presented in Tables XIV and XV As may be seen from these tabulations the mean total count in the control pool was 2570000 cells per square centimeter of rock area whereas in the test pool the corresponding count was 9510000 This is nearly four times greater than the control Except for the sample taken after the September storm all results from the test pool were very much higher than those of the control This is clearly shown in the graph of total periphyton counts (Figure 40)
In the control pool diatoms comprised seventy-nine percent of the total In the test pool only twenty-two percent of the organisms were diatoms They had been replaced by chlorophytes which made up sixty-six percent of the total In the control pool Chrysophyta were always dominant and diatoms were constantly present Some species or other of the diatoms always ranked first among species The ranking species were
Since the ultimate objective of
114
the five most abundant algal and Achnanthes
this study is an evaluation of
-l 0 0 p
-l0 0 ~ ~j 0 u V
~ lt)
C C C1 H
C J a ~ J)
u I-lt gt(l) coo lt)
0- PC a H OM tU Igtlt HQ
(l) p (l)
-l -I ~
IQ cu J) I-lt
(l)bi ~ tU au P 001 J) (l) g ~ H Ul
a C a H tU
(l) 00 Ul P bi J 0 SUl
~
o (l) U
tU -l-l
~ 0 bi
NOOO gtONtJccc Nr-j +J CIjc +-IN 4J 1ls~~4Jl~tJ
zppp ~))ZZpzZZZ IJ)QC~ 1 U
(l) C (l)
CCcNCCl-IliN4J ampoJ gt--1 N ~N U - gt()1 Z z~~t) Ul-lZ-lC
a
~ 8cNcccCccccCCCcu lt) lt) lt) lt) gt lt) lt) lt) lt) gtgtgt lt) UZUlUl-lUl
J)
i1 ~
rf---+-shy
a ~ I rlmiddot
C Ul tU ~
o IQ
rl 31-+ ~~a bi
iNlt Q
oj(
~ E-lt o bi
J)
C ltU ltU H ()
I (l)
J -I IQ
Ol
ll ~
ltJ
J)
8 o C1
oM Q
(l) tU
C
B ~~~B ~~~~B ~~ ~ UlUlUlUlUlU-lUlUOO
ccc~~~~~~~~~~B~ u u u UUUUUUUlUUUU
OI1JION N100 T(lOOM-INl1-Ij l1 N j N
l1 uCCOOtoNOtr)jr-OOO-I l1j l1-1r-rlj NCO
oOOoCOO--ftr-tr)OO-ICOj OOOCCCOr-OCOr-ooOCOCO
000000000000000 000000000000000 000000000000000
~-Irlrl~~O~NroOO~~~rlOON~O~ tr)jNtr)COOoMNO~~~~r---~MMNO-tCOOONCONmtooromN Or-OM
l1~~tNNNNN(Tj-t(Tjt
00000 00 0000000000 00 00000 00000 00 00000
O~OO--~~O~~O-N
(TjCO~r-~ 0 ~~~
N +J z
S c~ ~ t) tt) U
g a C Cgt c gtgt U~U~
r---tr)-I M rl rl N
~ 0 0 -t r-shyjNjri
ttr)ttlO r- 0
0000 0000 0000
OOOOi 00000 0 0000 0
~M N ~N 00
O~O~ ~
000000000000000 OOOOf000000000000000 0000 000000000000000 0000
~-tONN~~Na)~on~OCJl1O--f~~~aQ lt)-ttCOOtIl)(TjCXjr-r-jr---or- r-~NN
--fNC)-tNC)NT)Nt~COti jjjN
000000000000000 OOOOi000000000000000 0000 000000000000000 0000
~ ~ () (V10ti--fOj~No()oNtZ~lt)--fCO O~OONttlm--fCONOCOT)ttl-t Or---OCO jr---ttlIl)-tOO~O--foNoOO o1or-
N~NNNNN--f~~MM
~N~~N~~Noo~~Oro~N~~N~~ ~NN MMN MNM MNN MMN
-I J
00 l
P (l)
Ul
lt)
o 5 z
115
00 a C0 a 0 -rl N
tU C tU
-I 0shy
0 ilt0 (l) 0
H on 000 0
gtrl
(l) rl D tU
H
z (l) (l)
fcOO
-l
TABLE XV
TOTAL COLNTS of Regrowth Periphyton in TEST POOL Lake Superior - Castle Danger Hinn (1970)
2[Organisms per cm rock surface)
Date Diatoms
342000 22
Ju1 15 2829000
29 7869000 Aug 5 6845000
12 6677 000 I- 19 3030000I-
26 3246000 Sep 2 1643000
8 926000 16 484000 23 482000 30 718000
Oct 8 830000 15 926000 22 1457000 29 NS
Nov 5 277 000 12 244000 19 389000 25 421000
MEAN 2086000
-- 0
to c - (j) 13i 4- -N 0 ON
N ltJl
~(j)lJ - x (j) 0 -0 co --J (j) - 0-0 ~ ~- lgt
3 C o CJ G1_ J ltJ) 0 ru (j) N
0gt f- 0 IN--J r
lt coU 0 J
~mill -+ iJl 0
VI
-0
(j) shy VI 0
co
I 0 -iN ([) 0 N
ltJ)T f(J c
J () - C ~t
-0 ([) - - ~I
ltshyltJl
N (Jgt
6101000 1225000 9510000I
C Qunts per cm2 X 106 0 o o o
~ N ofgt (raquo agt (5 iii o
f Total0 Rank of Five Most Common GeneraGreens I Blue-Greens n G BG
244000 346000I 1133 1340000 I 279000 4454000 630 4841000 1164000 I 13891000 57 835 7086000 1579000 15510000 46 1044 8229000 2738000 17645000 47 1538
39180005693000 14641000 45 3124 10681000 3257000 17184000 62 1919
7358000 997000 10007000 74 1016 7675000 487000 I 9089000 84 610 3058000 194000 3740000 81 613 6902000 489000 7873000 88 66 9407000 338000 10464000 90 37 8399000 1482000 10719000 78 148
14628000 992000 16546000 66 I 88 12218000 490000 14165000 410 86
NS KS I
NS 2416000 1246000 3940000 7 61 I32 2024000 1322000 3590000 7 56 37I 1699000 749000 2837000 14 (0 26 2025000 1213000 3659000 11 55 44I
21 3 4 5
Ntz SynPho elm Ulx Ntz PIc Synelm Szm Ntz CZm Pho8zm Fth
Frgelm ScmNtz Lyn Osc Lynelm Ntz S2m
Szm Ntz AchOsc elm Ntz Frgelm 82m Osc
~tz I FrgClrr Sed Osc Ntzelm SZrr Sed Ntz LynSea Szm elm Pho OscSea elm S2m Ntz AchSea elm S2m Osc NtzScd S2m elm
PhoScd elm I Szm Lyn Frgelm 3zm I Ntz
Osci SzmClm ScdLyn OscScdPho elm
~ Phooca 3zm elmOsc OscSed elm S2mPho
gt
the effect which additions of phosphorus and nitrogen may have on Lake Superior and it has been seen that periphyton in general responds positively to such enrichment the next logical step is a consideration of the nature of the response of certain individual species or at least genera within the complex which makes up the algal ecosystem As a first step in such an approach attention will now be focused on the three first genera found in the control pool namely Cymbella Synedra and If the counts of individuals representing each of these genera is plotted on a weekly basis we will have a record which can be the basis for an evaluation of the effect of enrichment on periphyton growth Figures 41 to 43 represent a series of such graphs A tabulation Table XVI includes additional information which will be helpful in making certain comparisons between the various algal genera which charshyacterize growth in the experimental pools during 1970
If the weekly totals for SynedIa in the experimental pools are examined it will be seen that counts in one pool are always higher than the other however unexpectedly it will be found that it is the control pool rather than the fertilized pool which has the highest count This is also true for the next two genera that is Cymbella and Achnanthes Apparently these diatoms seem to favor Lake Superior waters which have received no additional nitrogen and phosphorus enrichment The correlation of these three genera in terms of the species represented with increased fertility is definitely negative The species principally involved were S acus S ulna C ventricosa C lanceolata and A micTocephala
In the test pool the only diatom consistently present in listings of the first five organisms was Ntzschia As indicated in Table XVI the mean count for this genus in the test pool was approximately eight times higher than that in the control pool Nitzscha was most abundant during the first few weeks of the experiment After that numbers diminished (Figure 44) This finding is a complete reversal of the situation found with the other three diatoms which have just been discussed since it is the test pool growth which is highest TIle extent of this difference is demonstrated clearly by the graph of Nitzschia growth shown in Figure 44 It is apparent that Nitzschia unlike the Achnanthes and species which were present responded in an extremely favorable way to enrichment of phosphorus and nitrogen This is not surprising inasmuch as a number of investigators (Palmer 1969 Blum 1960 Allanson 1961 and Munawar 1970) have indicated that it is an organism which responds favorably to eutrophication The decline which occurred during August is probably a reflection of the competition exerted by green and blue-green algae
In the test pool green algae were present throughout the entire test period and their numbers usually ranked high In listings of the first five the principal genera were Scenedesmus domonas and Among these ch Zamudomonas and Scenedesmus
118
laquoI H ltlJ
~ ltJl 0 11 0 laquoI Po 11 -
middotjliO5 laquoII0 011 ltlJltlJ~
Po bull H P III P o 0lt) ltlJJl
0 gt p - ltlJ (lJ) 11 11 P
I-l (lJ) 0 laquoI laquo1 lt=1 ~ lZltlJ
zl Po l o -11 +J
H ltJl ~ ltlJ rn Eolt rnPou
gtc 0
o ~ Po 0 0 0 (lJ) H 11 ltlJ ltlJ lttI p 0
gt ltlJ ltJl Vl W lttIP ltlJ lttI (lJ)gt
0 P lttI 11 l gt H
0 lt11 gt w
ltlJ W (lJ)O rn H
ltlJ
aeao 000 C DaDe
0010gt0 co lIj a 0) Il r-I r-I
0 0
DaDe0 0000 0000-
ltIl III 0 0 () C)
COCOM-tH I 1itON
shy
0000 0000 ODOf
jOr-If--
oeoo 00 00 0000
0 r- r-I0 r- r- () r-I-tt-o
-l 0 0
p
0 P 0
U
0000 00 00 oeee l)()r-ICh rlChr-lC tOCCOM
ltlJ oc P rn p oeo
ceo a a a
e Lf) t 0 1 M C
ltJl 11 laquoI 00
0
i c
lt11 E-lt ~j
gtlt lt0 r ltQPo c c Vl gtlt
~
r u
000 000 000
NN 0 M-lcn N MM
NN
000 o oe 000
00 if)
0 OUj
r_ 0 (I)
a 0 0
u0 a M -l
000 a a a 00 a N shyof -l
000 coo 00 0
M 000 M
a 0 a 0 a a
ltfJ )1
0 j--) I-j
~ ~_l lt11 H
pound () laquo
i
~
~ 0 0p 0
ltQ ~- ~
Cf
H gtltr 0 C
~ Olc)
l r u
~ gtltu
119
ltlJ W rn
-lt H gt U)
gt u 0
4-lt 0
lfJ 5 ltlJ +J
P
0 ltlJ lfJ lfJ ltlI H 0 lt ltlJ
lfJ - 11 l 0
U
0
(
0
(
~08
II
I
I
06
I
04
x t (J IE Iu
0 2 ~~ I 0 i~ ~c
o en o
g
008
006
004
002
JUL
Conrol Pool ---+--shyTes Pool ----+-- SMiDPA
Ol~----~------------------~---f-4--~~--~~----~--t
AUG SEP OCT NOV
Figure 4 Development of occur-ring as regrolth experirnenta poo s Ci1~tle Danger - Lake Super (1970) bull
120
--
- r i Vmiddot I V
I I I I I
I I
~ II bull
15
fmiddot I
I ~ I V-
I
-~ 08 I
I I I06 I I ~ I
~
4
~
x (J
E lt)
~ o ~ ~c
g o
011-----+
008
o bull 0 6 ~-
004
002 Control Pool Test Pool
JUL AUG SEP OCT NOV
Figure 42 loprnent of CymbelZa occurring as regrowth imental pools I Danger - Lake Super
970)
121
I
I
I
j shy+ I I I I I I
0
004
002
00
I I I I I I I
NITZSCI
OCT
10Ft----------------------------------shy
8
G
4
8
05 Control Pool -----shy
Test Pool --shy2-shy
04-shy
o X
N E
06 u 02 g ~
0 e
--~ 0 4 ~ E I ~ o f~ ~ 1 o
u
I
I E I I
C o O2 08 o
006shy
004
v2
OOlmiddot-~5222~~Ti~~~~~~~~~~~~~L-U JUL AUG OCT NOV
5 12 19 25Figure lt13 Devel of Achnanthes occurrin9
NOV experimental pool Castle Danger shy(1970) as regrowth In
experimental pools I Figure 44 Development of Nitzschia
ke Superior (1970)122
123
k
I I I
I I
l0l=------------------~
8 reached the greatest concentrations The maximum for Seenedesmus was ten million 7200000 and Schi20meris 3500000 per 6 If the graphs representing weekly counts of the two leading genera (Figures 45 and 46) are examined it is seen that growth in the test pool in all instances far that found in the control pool 4
For example in the case of the mean cell count in the test pool was fifteen times the control Scenedesmus counts on the same basis were even higher and the test pool population was forty-five times as great as that encountered in the control pool
2
It will be noted again as it was in the case of naturally occurring periphyton that Scenedesmus followed in terms of its importance in the periphyton growth A type of succession was also noted in the test pool when the importance of each of the three phyla chrysophytes chlorophytes and cyanophytes was examined on a seasonal basis See Figure 47 If this graph is examined in detail it will be 08 seen that diatoms represented mainly by reached a maximum on July 29 (29 days regrowth) afterwhich they declined steadily On
CD 06 August 5 the green algae after thirty-six days of regrowth succeeded O
the diatoms in terms of abundance and slowly increased to an ultimate )(
maximum on October 15 Blue-green algae although never able to reach NO4 the population level of the other two phyla did reach their own maximum i about August 19 approximately two weeks after the green algae had superceeded the diatoms Since water temperatures during the first half of August were at their highest level for the year this factor is E probably an important consideration although enrichment is certainly ~ 02 the basic consideration for OseiIJatoria growth o
Results of chlorophyll analyses for regrowth periphyton are presented in Table XVII In the control pool total chlorophyll ranged from 077 at the outset to a maximum of 0840 mg (MSPU) per 100 square 011
centimeters on October 22 representing 114 days of regrowth The mean 008 value for all samples was 0419 Total chlorophyll in the test pool
2on the other hand ranged from 0264 to 4153 mg (MSPU) per 100 cmduring an identical time period The mean value 2564 was more than six times greater than that of the control pool A graph showing the
005
total chlorophyll values for the two pools is presented in Figure 48 Total chlorophyll in the test pool increased rapidly during the first few weeks dropped slightly in the first part of August and then on Augu~t 26 soared to a high of 408 mg (MSPU) per 100 square centimeters The precipitous drop must of course be ascribed to the September 15 storm From the Iowan September 16 chlorophyll concentrations quickly 002 recovered and shot up to its highest level 4153 mg (MSPU) on October 22 (114 days of
Chlorophyll concentrations in the control pool showed a rather OQIsteady and uniform increase up until August 12 The
which occurred on August 19 is attributed to a temperature
Figure 45 Development124 in imental 5 Castle Oanger - Lake Superior
( I
125
~-
CflINf] lOHOIW
Control Pool ---+--shyTest Poolshy
occurring as regrowth
------------------
10
41shy
~ 08
lti) 6 0
x 04 E ltgt
Q Q
E ~ O 0
0
n 1
08
006
004
002
00
IControl Pool -----Tes Pool
igt~ t ~ I
~ ~ I I
L
I I-l I I I
=- shy1 ~J
I
V
j1
~ 1 I
SCENEDJSMUS
SEP OCT
46 Development of Scenedesmus occurring as regrowth in 127 experimental pools Castle Danger Lake Superior (1970)
126
I
ltt
~
I L--shyO _ lti) I - shy2 o --~ IIIIIJ~I I
- 6 lti)---lshy0 LL
90 X ZWl ad 0 0 SWSuoBJO 0
ltlJ 01
I 0
f ~
ltlJ
I
+ U1 ill t-
e
L (lJ [)
r t shy
0 l O OJ L
U)
ru tD 0
(~
I tJ-~I L
IUtI OJr ~ C1 gtE - poundI~
a lt)- -- onliii
L G)
() Cl~I U)
NNI~ r-
t t N r--shy r--l O -=t co l- 0 rl tf) l) en 0)
+-1 w t (Y) 0 0 0 CD N rl (f) IT) 0~ 1- (D Lf) N(Y)t(y)Ol--OriUlCJo)Ol-tTIr-I
0 r-I (Y) (Y) (Y) 0J _T rl rl (Y) N (Y) t
o 1--+------shy
[-middot00) J QrltDO COOt~rlCD r-I (Y) (0 t V)
01 [--(Y)o DN(Y)
00000 00000 bull
J co ill=shyto (X)
()N o-----f en lshy t ~ GO UJ tn uJ to 00 --I en (f) If)wc--
1 rl 0 o (Dj CJ 0 (Y) rl 0
00 000000 00
r~~ r-I (Y) (f) rl f-shy co 1 N (Y) r-shya rlrimC)oo riOCJr-i bullbull
0 10) 1-tlf)NlOt l-IDCQf-
DO ooon 000
o (fl LD 0) N Lt) (oJ (Y)
0 (lt) Lf) CC 0) t lO 0) +-1 to rl CD (Yj lD T t If)
bullbull bull 0 C) 0 0 r~i rl 0 a --I ()
e
ta)N0l[-
NCJmo(r)
00 c)
CDtOOOlt
0 0~ 0~ --j c- ~ r-1 -i r~i r~ rl ~ ()
wn~rl ro~r-N NM~~
0000 Coon
tD N 0) (0 ( -I
(l~ Q)
(1
This phenomenon has been discussed earlier After August 19 chlorophyll concentrations increased rather uniformly until October 22 As a result of the November 3 storm chlorophyll values again declined sharply
The concentrations of chlorophyDs-a-b-c are individually reported in Figure 49 In general the results-obtained in these regrowth studies were similar to those obtained in studies based on non-denuded rocks (See Figure 35 p 106) However average values were somewhat lower The ratio of chlorophyll abc in the control pool was 712 whereas that in the test was 631 From these ratios it is apparent that diatoms should have prevailed in the control pool and chlorophytes in the test pool This observati0n was fully supported by the actual counts made of individual organisms See Tables XIV and XV
The maximum total chlorophyll concentration in both pools it will be remembered occurred on October 22 This represented a period of 114 days of regrowth If one divides the maximum chlorophyll values by this incubation time daily production rates are produced The daily rate for the build-up of chlorophyll in the test pool was 0036 grams and that for the control pool 00073 grams per square meter per day The difference in daily chlorophyll production was therefore nearly five fold
As a test of the adequacy of the chlorophyll concentration as a measure of biomass accumulation correlation coefficients were calculated for total chlorophyll and total numbers of organisms in each pool Again as had been true in the experiments with naturally grown periphyton on rocks that had not been denuded it was found that the two parameters correlated very well The correlation coefficients ranged from 076 (P = 0001) in the control pool to 083 (P = 0001) in the test pool When a regression analysis was made and regression lines were plotted as shown in Figures 50 and 51 it was obvious that on this basis as well one could say that total chlorophyll or total counts may on a practical basis be used interchangeably
In the control pool non-astacian carotenoid values for the regrowth samples which stood at 003 MSPU per 100 square centimeters at the outset reached a concentration of 026 MSPU on the 22nd of October 114 days later The average for the nineteen week period was 013 MSPU per 100 cm2bull
In the test pool the average value for non-astacian carotenoids was five times that of the control or 065 MSPU Concentrations ranged from a July value of 01 MSPU fift2en days after the beginninp of the experiment to 116 MSPU per 100 cm on October 22 114 days later See Figure 52
The pattern of non-astacian carotenoid production was for practical purposes a repetition of that observed for chlorophyll This is demonstrated graphically if Figure 52 is compared with Figure 48 The astacian carotenoids however did not follow such a pattern Compared to other pigments they were very low and if Figure 52 is consulted it
128
c 0 +shygtshyr 0shy
LO ()r-Q(]
r~
+shy3 o C L C CJ) shy()E
a L o (j)
CJ) nc
(j) eo UCl eo
lt- ltll L gt+shytil til
eopoundu
151 L
H L H E -0
5lt U L ltll
W 00shyJ 0gt CD U)
laquor- L ltll ltllpound O-eo
J
J ~ U)
E -til
0 0
Q til c-o eo
+shy+-c eo ltll L E +- shyC L (j) ltll U 0shyC x 8 w
c +- shyc (l) E CJ)
(L
gtshy U1 s= Q) a I-o L
r U
ro L +shyo Cr-Io+shy
u
~) 1]1 gtshyc a o L o
c L +shyU C o
U
Q I If) (j) Ishy
gtshyL a o L o
lt1U +shy
8 c
OCJOCJ
t +-10tl U) (I
~ ~ gtshyc 0shy
t o c U
129
I P hy Jon
12
8
14
10
Chlorophyll f~Lc
o I K )~ ~n
II
1970
concentrashypool CQstle
gur-e 49 Regrowth (per unlishy- La
131
OS
06
04
02
2
Control Pool -- --0- -_ o
o o
~
CL Ul ~
~O LJ
I 28o o l ltgt 26
gtshyL
8-24 L o ~c 22 u
-1 J 20 gtshyI shyo a o -1 16r o
-1
~ o f-shy
08A)--o
06
in experimental ior- (1970)
04
ri orophy I I concent 02
pool tie
CONrROLP~~
~ ~ ~ _0 ~ a
~ ~
130
CAROTENOI DS
18
16
4 ~
X 12
1200 IS
10 0
~ 1000IS 8
800c ~
600~ 6co
400 I~1+lt-_
1 -2 b
1 o o
~ =gt shy(f)
]~
x E
0
IS
CO ~
co
Y -1944844 + 4334617 X
r 083
P 0001
50 I [ogrowth por
Superior
~
i
j ~
~ -4
~
+ 5099704 X
CONTROL POOL
02 04 Db Total Chlorophyll [mg (MSPU) 1100 em1]
)1 [ino nts phy I I regrowth i phyton
10 Danger ke Superi
132
F un it r LJ
133
----
will be seen that with one exception values were always below 05 MSPU per 100 cm2 The mean in the control pool was 0024 and that for the test pool 0002 MSPU per 100 square centimeters
As will be remembered dry and organic weights were also used as a parameter in this study The results of the dry and organic weight determinations for both pools are summarized in Table XVIII and are presented in a graphical form in Figures 53 and 5~ It will be seen that the overall average dry weight was 387 mg per ern in the test pool and and that this is thirty-three percent higher than the average for the
2control The maximum for the test pool 648 mg per cm was reached on August 26 fifty-seven days after the beginning of the experiment The peak value in the control pool was not reached before October 15 the 107th day of regrowth The value at that time was 463 mg per cm 2bull If averages are used and these figures are converted into conventional standing crop values it will be found that the standing crop was thirty-nine grams per square meter in the test pool and twenty grams per square meter in the control
A parameter which is perhaps superior to simple dry weight is ashshyfree dry weight This will be referred to here as organic weight In most aspects this is a good yardstick except for the fact that it does not take into account the weight of diatom shells thus the siliceous frustule of these algae are included w1th the inert matter Organic weight values for the experimental pools are presented 1n Table XVIII 2 and Figure 54 It will be noted that a biomass maximum of 265 mg per em was reached in the test pool in fifty-seven days Tn the control pool the highest organic weight value was reached a bit later that is on September 2 which represented the 64th day of regrowth While the organic weight results from the test pool varied rather considerably at times as a result of temperature storms and other factors the results from the control pool where metabolism had not been so strongly stimulated were relatively uniform and oscillations that affected the test pool greatly tended to be strongly damped The average standing crop in the test pool 14 grams per square meter was nearly three times greater than that of the control which reached a level of only 57 grams
As pointed out earlier the maximum organic weight result was observed in the test pool after fifty-seven days and after sixty-four days in the control During these periods which for practical purposes represented items of most rapid growth the daily production rate in terms of organic weight was 046 grams per square meter in the test pool and 017 grams per m2 in the control pool
To properly evaluate these data one can refer to values obtained by other investigators in their studies of growth of periphyton in a variety of environments For example in a northwestern Ontario lake Stockner and Armstrong (1971) observed a daily increase in organic weight of 250 mg (025 grams) per square meter The samples on which these results were
134
XVIII
Pools )
surface]
DATE CONTFOL TEST POOL
Or-gan i c Dry We
o
3O
12761O 120OlJ52
24 30
301206
10
I
I
o
1564I1
4921o100
O 11
7000
1
112
_J
41]43
I n04O4
I45029
274147e
74402 I
31
O
I
No sample
135
Aug 5
i9
Sep
30
15
29~
Nov
12
bull (OL6 ) JO J8Gn S - J8bU8J
8[ 5jOOO r I2+U8W JedX8 U ( 128j +LC J8d) s+~6 gt JO+liO Jed L+MOJD8U 17lt ~6 ~
ION LJO d3S 9nl1 lnr ~Z 61 21 S 62 Z2 91 B Opound pound2 91 B lt0 92 61 21 g 62 (2 gl
0
Q p -
~~ 3deg Cl
~ Q t shy
0) -
~ 2
shy3-v----- IOOd IS 91 N
---(7-- IOOd 10JIYOJ
OL61-HJMOI1l93tJ
L-__________________________________________________________________________________~pound
N
ltraquo 0
~z
o
t ~ ~ InI
l ~ g15 I shy
U
Igoampj DO m~ ~ t IX)
o u
deg I)
I)
0_w ()
IX)
N
N
mt) l
ltI
5 L
1J ill ill CgtshyL J lt1J()
+- ill - lt C flJ Jl
L ill OJ c+shy
L lt1J 01
ill ill 3shy
gtshyL
C 0 ([)
+shygtshy COL 0 -
II
(j) L
8i
shy
based were taken at a depth of one meter and fifty-seven days were required to reach the maximum reported Interestingly this is exactly the time required to reach a maximum value in the Castle Danger test pool However although time was the same values were not Actually the value of 025 grams is closer to that of the control pool at Castle Danger which was 017 grams In the test pool at Castle Danger as might be expected the production rate was almost twice as high (046 grams)
The values for maximum periphyton growth in the control pool at Castle Danger are also similar to Falls Lake production rates as
by Castenholz (1960) Castenholz found considerably higher spring growth rates (0 S in more saline lakes In referring to the above studies it must be pointed out that Stockner and Armstrong and Castenholz used glass slides as a substrate and that growths on this material are not strictly to those growing on native rock Tn experiments conducted by Fox (1969) and Stokes (1969) and in which natural rock substrate was identical with that used at Castle da Uy per iphyton growth rates averaged 0067 grams organic weigh t per per day in Stony Point Bay Lake Superior This average is based on the standing crop reached at the end of a period consisting of forty-six days It was obtained by dividing the organic weight of periphyton on the last day of collection by the number of days during which regrowth had occurred The stamlinr crop represents the level of organic material reached in one short summer season in Lake and therefore represents the
end result of the growth under the special situations which characterized the period of study It is a reflection of the effect of strong wave action currents and other factors including storms which may affect the periphyton grovth in more-or-Iess open waters Tn no sense does it ref1ect the maximum growth for the season Because of this if the control pool at Castle Danger is actually a representation of growth which would occur when the effects of strong physical water movements have been removed the dai ly average production figure presented by Stokes and Fox should be vory much lower than the results reported for the control pool at Castle Danger If the maxima at Castle Danger are compared with the average for Stony Point Bay it ill be seen that this theory bolds in practice Castle Daner control pool results were twice as high as those reported for the Bay
weight results obtained in this study ofOn the basis of organic denuded n)cks it is clear that atthe regrowth of per iphyton on
5 ppm N03-N Lake Superior waterconcentrations of 163 ppm ohel compared to growths taking placeis highly stimulating to p
in Lale Superior water without artificial enrichment It was also observed that if allowances are mode for tlle effect of waves and currents the control pool is for purposes comparable to that of the lake
In general especially in the test pool regrowth as extremely rapid within a very short time the oriinal peripryton-covered rocks wereand
indistinguishahle from the Jenuded rocks on hieh regrowth had
138
occurred Identification of individual rocks was made on the basis of coded marks The growths differed very little even in terms of total number of algal species identified By the end of the season the regrowth rocks in the test pool had a growth characterized by fifty-nine species whereas rocks that had never been denuded had sixty-one species This difference is considered unimportant A difference of six species observed in the control pool is also considered insignificant In the test pool it was observed that N-itzschia palea was the first major colonizer on denuded rocks After fifteen days this species had reached a concentration of 220000 organisms per cm2 bull Npalea was accompanied by
which reached a number of 130000 organisms on the same day These two organisms along wi th SchizomeYis and Osci llatoYia and on the basis of a seasonal average eventually reached slightly higher numbers on the regrowth rocks than on the others
In the control pool the original colonizers were and which during the first fifteen days increased at approximately the same rate N was present in the control pool at the end of the first fifteen days but no appreciable population of individuals until the 2lnd day increased quite rapidly in comparison to the other diatoms and eventually reached a high of 1370000 organisms per cm2 bull This was the highest numher reached in the control pool by any organism observed during this regrowth experiment (See Tahle XVI) The seasonal average for Cymbe ta in the regrowth periphyton exceeded its
na tural grmrth by to times This alga along wi th domonas was more successful in terms of average total numbers
the regrowth periphyton than in the naturally occurring periphyton
If all organisms in the test pool rather than a representative few are considered the total average number of organisms found on regrowth rocks slightly exceeded that found on rocks which had not heen denuded See Tables X and XI The ratio of diatoms greens blue-greens in regrowth periphyton was 271 whereas a ratio of 361 was ohserved in periphyton on the other rocks in the test pool This slight difference is explained on the basis that original growth on the pcriphyton-covered rocks collected from the lake consisted nearly entirely of diatoms On this basis there seems to be evidence for a succession from diatoms to green and blue-green algae in the natural growth It will be seen in Figure 55 that total counts of regrowth periphyton slightly exceeded the natural growth in twenty-nine days however after that time the lines representing total counts are in rather close agreement
Average counts for regrowth periphyton in the control pool constituted about half of that characterizing the natural growth In regrowth periphyton the ratio of diatoms greens hlue-greens was 8 1 whereas for the natural growth it was 712 This indicated that diatoms were clearly predominant If the regrowth periphyton is compared with the natural growth in the control pool (See Figure 56) it will be seen that
139
TEST POOL
ReCjrowth Periphyton
200--shy
150
80
X
N
lt= U
IL (j) I Cl I
I I
I I
10 I I
8 9
6
4
CONTROL POOL
2 Natura Iy-Occurr-ing Per-jphyton ----4-shy
Regrowth Per- j phyton
JUl AUG
ur(=J) I i- Figure 56 Nat ) ly-occurr-inO per-iphyton siphyton per- i shyphyt tEt phyton total counts in conlTol I
Danger lake Superior (1970)l
141140
iii
although the growth on the denuded rocks is somewhat slower at the outset the two populations reached similar numbers after a total of fifty days regrowth (August 19) After this date regrowth values for the most part remained consistently below that of the natural growth
In terms of average chlorophyll concentrations regrowth periphyton c c
in the test pool closely approximated that found in growth Regrowth values starting at 0264 mg (MSPU) per 100 after fifteen
~ days reached a value of 343 by the 29th day at which point it exceeded -
J gt-the chlorophyll concentration which characterized natural growth After
that date chlorophyll concentrations remained rather constant for both Hol OJ U)regrowth and natural periphyton 4-1 +J bl
H ol gt i H M
f) Cgt 0In the control pool on the other hand average chlorophyll values pol
l) e Q) ~ Q) ~for the regrowth periphyton were less than half of those characterizing ol -the natural growth
It is apparent that regrowth of periphyton in the test pool was L (j)tremendously successful and proceeded at a rapid rate At times it Cl OJeven exceeded the natural growth A possible explanation for this is
(f) L J I I i __ L_i__L-l1 I -L
that in the natural periphyton there was more active competition on the I (J) Imiddotmiddotmiddot
ltpart of other algae and resident grazers The clean substrate of the denuded rocks provided an immediate attachment point for the more -
fIJ
prolific green and bluegreenalgae Whereas the rocks already covered with a natural growth of clean-water diatoms could not provide such an advantageous attachment area Possihly as diatoms such as
(j ()nchnanthes and Cymbella succumbed to the highly enriched waters of
Y -- i L ~t In co D r-- cO ro L I q ~t m In ~ L0 l 1(
the test pool they were eventually detached and in sloughing-off I (j)
- Jprovided spaces which allowed green and bluegreen algae to invade and U1
take over the area This accounts for the eventual equilibrium which was established for the two populations (natural and regrowth) I
Regrowth in the control pool based on a consideration of all 3 rei ~ II I I I bull I I I I I I parameters was significantly lO~Jer than the natural growth It appeared that the natural growth consistently maintained itself at a level which was about two times higher than that of the regrowth periphyton c) tf1 ID 0
lS 41 Lr- 0
One of the hasic objectives in the Cas tIe Danger was to create a system which was closely similar to natural lake environment One Cl
w N lf1 Lf q
Q) 0 0 til 0 0 N 0J l) I shy -q In L[ If ID ~o 0 tIlphysical condition which was important to the success or failure of this laquo
project was water temperature control For example it was desired that 3 water temperatures in both pools be nearly identical with that of the lake and more importantly it was ahsolutely necessary that similar (j) 000000 0000 temperatures be maintained in the two pools As a result it was deemed lt- 000000 0000
NNN~~~
necessary to accurate records of the temperature This information I-
is in a series tabulations and graphs as Figures 57 to 60 From these L (j)
Figures it will he seen that water temperatures in the control and test J gt CJ) -N~~ rna N v
-NNN N NN~LL
142
143
(J Ln In I) In 0
f41 0 0 In
Figure 58 14TER TE1middot1PERATURE DAB AUGUST 1970 Lake Superior - Castle Danger Minn
6 1400 52 1200 7
8 1200 9 1200 64
1400 7110 II 1630 71 12 1000 71 13 1830 51 14 1200 55
4917 0900 18 1000 47
5419 1730 IZOO 5020
5 ZI middotZOO
Figure 59
Sept TIMe
I 2
WATER TEMPERATURE DATA SEPTEMBER 1970
IntakePool Pool 120C
2 1200 7 J 1200 4 1200 5 1200 6 1200
i- 7 1200 lJ1 1200
12]0 I 1200 II 1200 I 1200 I 1200 14 200 15 1200
1200 7 1200 18 1200 I 1200 20 1200 21 1200 22 1200
ZOO Z]O
29 1200 ~Q i2CC
72
Ishy
(I Intake Temperature
6 a t-
Readings
I
4L 46 it 6 J I
I52 59
ltll64 L
I 64 62
72 + 068 (Q71 69 70 L
70 (l)7 70 i I I
shyE48 53 (l)51 1 i52 fshy55 I OJ)II I4 I I I~j 48 I I4547
I I
54 49 4750 J
4447 4751 - V
to uJL1 1 I I Iii I I I I I I I I I I I I I I I I I I
56 57 59 59 58 60 60 60 61 61 57 -I
55 55 55 54 55 50 50 51 51 45
56 58 59 59 58 60 60 60 61 61 57 57 55 55 55 54 55 r-v
50 51 51 45
52 56 57 57 57 59 60
60
-I
55
54 53
5 47 48 42
68
6 1+
60
LL
I 0 56
(l) L 0 + ro
52 L (l) Cl E Q 48f-shy
4~
40
4 6 B 10 12 14 16 18 20 22 24 26 2B
AUGUST
Lake Super I or Castle Danger Minn
Intake Temperature
Readings
__-shy --
j I
1 shy
I I
43 43 41 2 4 643 46 8 10 12 14 16 IB
L9 49 4L SEPTEHBER 45 45
I
ltlJ
ell
H
o Cshyr
y w m L 2c Wmiddotmiddot gt2 o 7 ~
bull (j)om lLJ L m ro on fshyUltJ)C) shy
+shyI iij
() lt
0
Ishy
ltlJ
ell
0
H
_ ~CJl
f - u0
ro Ishy
fshylt o L
o J0lt J ltJ)1-0 ltt ~1 O~ U) LU CL ltJ)
~-jo 6J npJ6dw6J
Lc U1 laquot(Q ~ Ilti li j ~ -q lLJ I1J f--
of laquot
LL
+shyC
Zt ~ gtltT ot t ltj
0 w
o
fshylt ltJ) +shy3 L
J +
lOOfshy(J) 0 laquot f- CL
f4 ~
Ifrlul-j~ oT laquoj ltY ot ltZt
I1J
~ CD - ~
eLi co
~ 9
m
If)
~~W~~~Nrn ~~~~V~~~
til r-- r-- in j- ilt N 0 gtltt-tZtot-tZtgttfll
~I~~~~middot~~~~~t------------~~~middot~~~~--------------t-t-----------------~
CL E 0
u r--middot r-- lCoJ rr N 0~ t 01 ~ ~ g ~ ~ ~ ~ ~ ~n ot 0 J ~- ltj ~ --t ff1-[ c 0
OlL (j) U L J OJ
00000000(1)10 00000000E 0 Or-tlC)CgtrltlC) C)() ~O~~OOOO
N ~) L ) rl r) tl 0 VC-V~N~~N
gtIN oNc-rornololv~~rnNrorn~
-NNNNN~Z N
146
pools are for practical purposes the same When temperature did vary it was never more than one degree Fahrenheit This data shows quite clearly that any growth difference occurring in these pools could not readily be attributed to differences in relative pool temperatures The temperature difference which existed between the pools and the lake itself may also be seen from these Figures The greatest temperature disparities between 1ake and pools occurred in the months of July and August On the average these amounted to a difference of only three to four degrees F From September through November temperature variations were very slight During the entire month of July as will be seen from the graphs water temperatures in the lake increased steadily In August two dramatic drops of temperature were recorded These occurred on August 2 and August 13 (See Figure 58) Both of these drops were brolght about by the same weather phenomenon namely strong off-shore winds from the northwest Apparently these off-shore winds blow the warm surface water outward and bring about an upwelling of deeper and co1der waters By the middle of September the beginning of a fall decrease in temperature was seen and by October and November lake temperatures hovered uniformly at or near forty-four degrees F
In the months of July and August as mentioned earlier temperature variations between the pools and lake averaged three to four degrees It should be realized however that this difference usually occurred at mid-afternoon when ambient air temperatures were at their highest In order to establish more accurately the complete temperature variation over a twenty-four hour period a continuous recording thermometer was installed for a period of some thirty days It was dis~over~d as expected that at this time of the year (August) lake water temperatures remained constant during a typical twenty-four hour period In general it was found that during days of high water temperature the disparity between the lake and tbe pools was at a maximum during the middle of the afternoon (330-430 PM) By 900 or 1000 PM temperatures in the pools and in the lake were at their closest correspondence By late morning (1100 AM) a small temperature dif ference was usually observed between the pools and the lake Evenshytually this difference reached its maximum in the late afternoon By pooling this information it is possible to calculate the average tempshyerature variation over a twenty-four hour period In summation it can be stated that for eight hours (33 of the time) of a given day temperatures were exactly the same in the lake and in the pools for four hours (16 of the time) the dlfference was 35 degrees F and for the remaining twelve hours of the time) temperature difference was about two degrees F Thus over a twenty-four hour span the average temperature in the experimental pools was 15 degrees higher than the lake This minor difference was all but eliminated during September October and November
For the purpose of relating the temperature information to the sample co11ecting program an average was made of daily temperatures
147
ltJ) ~y
re Preceding Each Sampl i
for the week preceding each sample collection date This information has been tabulated and is presented here in Table XIX As will be seen some of the highest weekly averages occurred in late July and early August Interestingly it was at this time that green and blue-green algae were
profusely It is also interesting to note that on August 19 the temperature was 168 degrees F lower than it had been the
preceding week (476 and 644 degrees F) growth parameters such as chlorophyll concentration and total counts were also reduced This phenomenon was referred to earlier as a shock Other than this no other specific examples can be found which definitely indicate temperature effects which can be considered as having been important to the experimental work
As mentioned earlier a number of areas in and around the perlmeter of the experimental pools complex supported heavy populations of periphyton These areas of periphyton growth occurred on the rock surface of the shelf on which the pools were built and represented areas kept moist by the by-pass water [rom the intake and by the overflow from each of the experimental pools At various times during the season periphyton specimens were collected from each area and identified microscopically On one occasion this sampling program was extended by a SCUBA diving survey of the inshore area immediately adjacent to the pools These samples were all qualitative in nature
Intake lake water not needed in the experimental pools was allowed to flow hack over the rocky ledge to the lake As it did so the thin film of water was constantly wetting the rock surface and thus provided a suitable place for periphyton growth This was one of the study areas In less than a week and for the remainder of the season a heavy growth of UlothYix zonata was established on the rock surface in this area In various pOCkets where water did not flow quite so rapidly a scattering of diatoms developed The representive genus was Synedra Directly beneath the overflow of each experimental pool a profuse growth of periphyton also appeared At the test pool outlet where enriched water flowed over the rock substrate and cascaded into the lake populations of zonata I ) were found in abundance In a few isolated instances glomeYata and Rhlzoelonium sp were also identified In the control pool outflow the predominant growth was again Ulothr-ix zonata Also represented were 8unedYa Cymbella and Aahnanthe13 NS
As indicated in the section on materials and methods scuba )
diving techniques were used to obtain materials directly from Lake Superior itself When the technique was used to obtain samples immediately above the point of influx of the pool effluent numerous circular patches of OsaillatoYia were observed at the point where the pool effluent entered the lake By far however the most abundant algal forms were diatoms which seemingly covered every square inch of the lake bottom in that area At the edge of the shoreline or the air-water interface populations of and
148
56
b
[i
56
GSS
51 2
S1 ij
~ bull
IU
iII
lll
L~r) 3
XIX
56
596
5gt2
064
G6S
S1 2
b1 L)
5
- ci
4 11
iii)3
1~) bull
yin Ithough
lee
b7 GI
ilmiddot7
i) fJ 1
i)
1
0
149
were again apparent The outfall area beneath the control pool supported only diatoms with the exception of Ulothrix zonata which occurred at the air-water interface No apparent growths of Oscillator~a were noted nor was any visible difference seen between this area and other areas some distance from the test pool outfall
The inside portions of the concrete walls in both pools offered another interesting collection area for periphyton On September 3D periphyton scrapings from walls in the control pool consisted mainly of diatoms with the exception of one specimen of In the test pool abundant populations of Schizomeris and Nitzschia
were found whereas Oscillator~a Chlamudomonas and Ulothrix were noted in lesser amounts
Visual inspections of the Castle Danger pools supported the quantitative studies and revealed a significant difference between the two pools For example after two weeks of enrichment (July 15) there was a very distinct growth difference noted In this case the test pool periphyton took on a greenish to yellow-brown color whereas the control pool periphyton maintained a rather subdued dark-brown to gray color By July 23 records in the inves tigator s daily field log described growth differences as tremendous and by July 25 the description advanced to phenomenal By July 20 the first floating scum was observed in the test pool and for the remainder of July and all of August this scum prevailed For practical purposes the test pool can be described as resembling a small polluted pond or an enriched horsewatering trough whereas the control pool resembled a normal rocky in-shore area of Lake Superior With the exception of some of the days following the November 3 Northeaster when much of the growth was removed this marked difference in the appearance of the pools prevailed for the entire sampling period As a matter of interest it should be reported that in 1969 no such color differences were noted
One of the objectives of the Castle Danger study was to design pools which would nearly duplicate the natural lake enVirOTInlent In the main this objective was fulfilled inasmuch as the natural substrate and water temperatures were very similar to that found in the lake Another point of interest is that the water movement provided by six overturns per day in the experimental pools compares favorably with the daily movement in the lake itself at that point The latter contention was established by a simple calculation which took into account the volume f10wrate and dimensions of each pool It was determined that the maximum water movement in the control pool was 294 feet per second or 48 miles per day In the test pool the movement was 195 feet per second or approximately 32 miles per day These values compare very favorably with surface water movements established in the Castle Danger vicinity by Ruschmeyer and Olson (1958) In their work it was
150
established that the flow was approximately three to four miles per day
In the experimental pools a counterclockwise current was characteristic with maximum movement occurring around the outer edges of each In contrast movement of water masses would decrease in areas progressively closer to the center and theoretically the exact center of each pool would have no movement at all In calculating maximum values no allowance was made for friction of water on the walls and bottom substrate therefore it should be realized that movement would be slightly less than that reported This information in addition to bei~g of general interest does point out quite simply that there is a constant flow of water past the periphyton-covered substrate whether this growth be in the lake or in the pools and that the rate at which it is passing any given point is approximately the same in the pools as it is in the lake itself This constant renewal of the water is a unique feature of the experimental facility which has been set up at Castle Danger
151
CHAPTER V
Su~Y AND CONCLUSIONS
The primary objective of this research as carried out in the summer and fall of 1969 and 1970 was to determine the possible changes which would take place in Lake Superior periphyton when polluting or enriching substances were added to the lake water To this end two natural rock basins were constructed at the lakeside for the purpose of exposing naturally grown and regrowth periphyton to higher-than-normal levels of phosphate and nitrate In 1969 P04-P in the test pool was maintained at 163 ppm which is 320 times the mean concentration of total phosphorus generally reported for the lake In the following year 1970 the P04-P level in the test pool was lowered to one-tenth of that used the previous year (32 times average concentration of P04-P in the lake) and nitrogen was also added to the test pool In the concentrations added this resulted in a NP ratio of 151
The basalt rock basins situated in a clean area along the north shore at Castle Danger Minnesota received a constant flow of fresh Lake Superior water and were exposed to the same insolation and general climatic conditions as the lake itself One pool served as a normal lake water control whereas the other served as a test pool to which the nutrient-enriched lake water was constantly added At weekly intervals samples were collected and productivity was measured by enumeration of organisms chlorophyll analysis and weight dry and organic
Detailed microscopic examinations were made of each sample to observe changes in the periphyton organisms By this means it was possible to determine the effects of phosphorus and nitrogen enrichment on species composition as well as numbers This information could then be translated into a prediction of changes which might be expected in the future if phosphorus and nitrogen were added in appreciable amounts to Lake Superior Some of the more important findings and conclusions derived from this study were
1 A near-simulation of the near-shore lake environment was achieved in the experimental pools
2 Two successful systems for the delivery of a constant and well-mixed source of nutrients were developed during the course of these studies
3 Natural periphyton collected directly from the lake near Castle Danger during 1969 and 1970 consisted almost exclusively of diatoms The most important representatives were S~nedra acus and Aahnanthes
152
miaroaephala Two other generaCymbeZla and (jompnonema occurred in somewhat smaller numbers Total counts for all organisms were nearly identical for both years and averaged 3800000 cells per cm 2 of rock surface
[ Data collected during 1969 indicated that P04-P additions of 163 ppm did not increase periphyton production On the contrary it seemed to inhibit growth Thus while mean counts were 200000 cells higher in the test pool than in the control other parameters such as total chlorophyll and dry weight values were actual1y higher in the control than in the test pool
5 Laboratory studies in 1970 undertaken prior to the period of field study indicated that the periphyton adhering to rocks collected from the lake at Castle Danger responded positively to enrichment ma intained at one tenth of the 1969 level As a result the phosphorus eosage utilized in the 1970 summer season was reduced to 163 ppm P04-P and nitrogen was added to produce a 151 nitrogen to phosphorus ratio
6 Using the new concentration the results obtained during the summer season of 1970 indicated a distinct difference he tween the test and control pools Organisms in the fertilized pool were two times as numerous as in the control Total chlorophyll was more than three times greater and organic weight was nearly half as great
7 When test rocks were denuded and regrowth was observed total counts were four times higher in the test than in the control pool and the total chlorophyll was more than six times higher Organic weights were three times higher in the test pool than in the control
8 A regression analysis of the data demonstrated that in all cases a high positive correlation existed between total chlorophyll and total cell numbers and that either of these two parameters can be employed as a measure of productivity
9 Based on the dry and organic weight measurements it was observed that periphyton growth in the control pool proceeded at a rate very comparable to that found in Lake Superior itself or in other oligotrophic waters
153
10 Organisms which responded most and phosphorus enrichment were
5cenedesmus and Gsci ltatori tenuis
11 Organisms norma lly abundant in Lake Superior periphyton which responded unfavorably to enrichment were acus Achnanthes m1ClOCeDhala and
Ua spp
12 During the 1970 tests it was observed that there was a definite succession of Ni and Sceneclesmus in the test pool
13 An active competition between algal groups appeared to take place in the test pool during the 1970 season Diatoms appeared first as dominant forms but were eventually replaced by green and blue-green algae which assumed the greatest importance at thE end of the summer
14 The overall seasonal ratio of diatornsgreensblue-greens for both regrowth and undennded rocks was 271 in the test pool In the control pool the ratio was 8 1 1
15 In terms of tIle chlorophyll parameter the prowth rate in the test pool was five times as high as that in the control The specific growth rates were 0036 grams total chlorophyllm2day in the test pool and 00073 grams total chlorophyllm2day in the control
16 On the basis of oreanic weight the test pool daily production rate was more than twice as high as that observed in the control pool or 046 grams as contrasted to 017 gramsm2day
17 Regrowth proceeded at a rapid rate in the test pool during 1970 and after 29 days total chlorophyll and total counts exceeded the natural groveth of periphyton in the same pool After that period the growth leveled off
18 In the control pool on the contrary the periphyton regrowth was less than that of the natural periphyton placed originally jn the pool In fact the natural periphyton parameters were nearly always twice the value of those characterizing the regrowth rocks
19 A supplementary study showed that U7othY1x zonata
154
would grow nicely in by-pass water which contained no enrichment This growth continued into the cold weather season and occurred even under ice during the months of November and December
20 On the basis of small differences in the astacian carotenoid values it would appear that animal grazers did better in the unenriched water of the control pool
21 A dramatic color difference was always observed between the two pools The test pool had a general dark green color and a floating greenish scum which reminded one of an old horsewatering trough or a small polluted pond In terms of color the control pool resembled the typical near-shore area around Castle Danger
On the basis of the foregoing conclusions it is apparent that Lake Superior periphyton responds dramatically to increased additions of phosphorus and nitrogen It could be expected therefore that if the near-shore area of Lake Superior ever received nutrients such as those added to the experimental test pool at Castle Danger a drastic change in the Lakes biota could occur For example as enrichment increased the predominant clean-water diatom forms could eventually be replaced by the more tolerant green or blue-green algae In addition the very composition of the macrobenthic forms found in Lake Superior could be altered as a result of their dependence on the periphyton which as primary producers form the first link in the food chain Likewise certain fish which depend on benthic organisms for their food may be adversely affected as an indirect result of a changing periphyton community
Having established that enrichment of Lake Superior water will dramatically change the normal periphyton growth another baseline has been establ ished for future reference in the event that phosphorus and nitrogen rich wastes should be added to the lake If certain types of algae appear as replacements of the normal flora nm characterizing the periphyton and the produc tivi ty increases one will have a means for assessing the possible changes taking place in the water quality of Lake Superior
155
POSSIBLE FUTURE STUDIES
1 How would periphyton respond to other concentrations and variations of nitrogen and phosphorus What would be the minimal levels of nutrients required in order to noticeably stimulate growth
2 What would be the effect of other macro and micronutrients used in combination with phosphorus and nitrogen
3 To what extent ~ould elevated temperatures affect periphyton
4 How important is periphyton as a source of food to aquatic organisms Would grazing play any significant role in the fluctuation of periphyton populations
5 How effective would the periphyton be as bioassay indicators of insecticide or radioactivity concentrations
6 How feasible would C-14 be as a method for measuring periphyton primary productivity
156
BIBLIOGRAPHY
Abbott W 1967 Microcosm studies on estuarine waters IT The effects of single doses of nitrate and phosphate
113-122
1969 High levels of nitrate and phosphate in a carboy microcosm 1748-1751
Abdin C 1949 Biological productivity of reservoirs (with special reference to the Aswan Reservoir) Hydrobio1 118-133
Adess M R Nelson L Schlottman and W Parkos 1971 A study of the potential of periphyton organisms as components of Lake Superior plankton 1-25
Aleem AA 1958 Succession of marine fouling organisms on test panels immersed in deep-water at La Jolla California 1140-58
Allanson BR 1961 Investigations into the ecology of polluted inland waters in the Transvaal I 1-94
Anderson CC 1958 Seasonal characteristics of two saline lakes in Washington 2 51- 68
Ansell AD IE Raymont KF Lander 1963a Studies on the mass culture of ThaeodactyZum III Small-scaJe experiments __------ ~207-213
Ansell An IE Raymont Kr Lander E and P Shackley 1963b Studies on tho mass culture of Zum II The
rnmO(aitu Iwn and other species tn outdoor tanks 8184-206
APHA 1965 Standard methods for the examination of water and wastewater (12th ed) APHA Tnc New York 769 p
Arnon D I 1958 The role of micronutrients in plant nutrition with special reference to photosynthesis and nitrogen assimilation In Trace Elements Academic Press Inc bullbull New York
Bakus CJ 1966 Some relationships of fishes to benthic organisms on coral reefs 280-284
Barnes H and JA Topinka 1969 Effect of the nature of substratum on the force required to detach a Common littoral algae Am Zool
753-755
Beers CD and I M Neuho1d 1968 Measurement of stream periphyton on paraffin-coated substrates Oceanogr13559-565
157
of the St Lawrence Great LakesBeeton AM 1965 Oceanogr
Bellis VJ 1968 Unialgal cultures of Cladophora glomerata (L) Katz I Response to temperature ~19-23
Bissonette TH 1930 A method of securing marine invertebrates 71464-465
Blum J L 1957 An ecological study of the algae of the Sal ine River Michigan Hydrobiol936l-408
1960 Algal populations in flowing waters In The Ecology of the pymatuning Symposia in Ecology Special Publ No2 Universi ty of Pittsburgh pp 11-21
Brauner T 1956 Die beeinflussung des stoffaustausches durch das licht In Handbuck der Pflanzen-Physiologie (W Ruhland ed) Vol II pp 381-397 Springer Berlin
Brezonik PL WH Morgan EE Shannon and HD Putanm 1969 Eutrophication factors in North Central Florida lakes Florida Engineering and Industrial Experiment Station University of Florida Gainesville Florida 101 pp
Brice RM and C F Powers 196() The Shagawa Lake Minnesota eutrophication research project Proc of the EutrophicationshyBiostimulation assessment workshop Calif Univ Berkeley Sanitary Fngr Res Lab and National Eutrophication Res Progr Corvallis Oregon Pacific Northwest Water Laboratory pp 258-269
Brock TD 1967 Microorganisms adapted to high temperatures Nature 214882-885
Taxonomic confusion concerning certain filamentous algae J 178-179
Brook AJ 1952 Some observations on the feeding of protozoa on freshwater algae HydrobioL 281-293
1954 The bottom-living algal flora of slow sand filter beds of waterworks lIydrobiol 333-351
1955 The attached algal flora of slow sand filter beds of waterworks Hydrobiol 7103-117
1965 Planktonic algae as indicators of lake types with references to the Desmidiaceae Oceanogr 10 403-411 bull
158
Brook AJ and R Colingsworth 1971 Personal Communication Univershysity of Minnesota Minneapolis Minnesota February 1971
Brook AJ and AV Holden 1957 Fertilization experiments in Scottish hill lochs I Loch Kinardochy Sci Freshwa ter Fish
17 30
Bush AF and SF Hulford 1954 Studies of waste water reclamation and utilization Calif State Water Poll Cont Bd Sacramento Publ No9 82 pp
Butcher RW 1932a Studies in the ecology of rivers II The microshyflora of rivers with special reference to algae on the riverbed Ann Bot L6813-86l
1932b Studies in the ecology of rivers IV Observations on grmJth and distribution of the sessile algaE in the River Hull Yorkshire Ecol 28210-223
1932c Notes on ne and little known a18ae from the beds of rivers New Phytol 31289-309
1947 Studies in the ecology of rivers VIII The algae or8anically enriched waters J Ecol bull 35 186-191
Caines JA 1965 The phosphate content of some aquatic macrophytes with special reference to seasonal fluctuations and applications of phosphate fertilizers Hydrobiol 25289-301
Cairns J 1956 Effects of increased temperatures on aquatic organisms Wastes 1150-152
Carpenter JH DW Pritchard and RC hlla1ey 1969 Observations of eutrophication and nutrient cycles in some coastal plain estuaries Eutrophication Causes Consequences Corrections National of Sciences Washington DC 661 PI
Casper VI 1965 A phytoplankton bloom in western Lake Erie Great Lake-2 Res Div Univ Micb 1329-35
Castenholz RW 1960 Seasonal changes in the attached algae of freshwa ter and saline lakes in the 10wer Grand Coulee l~ashington Limnol Oceanogr 1-28
The effect of grazing on marine littoral diatom 783-794
WJ and JE Tilden 1930 Algal food feeding and ease habits of the larva of the midge fly Tanylarsus
11 281-287
159
light induced oxidation ofChance B and R Sagar 1957 Oxygen and nucleotide in a Chlamydomonascytochrome flavoprotein and pyridine
mutant Plant 32548-560
Chandler DV 1964 The St Lawrence Great Lakes Intern Ver 1559-75 ----- shy
Christie AE 1969 In vitro responses of soft water algae to fertilization Ontario Water Resources Commission Toronto Division of Research Paper No 2024 16 pp
Chu SP 1942 The influence on the mineral composition of the
medium on the growth of planktonic algae 1 Methods and culture
media ~ 284-125
1943 The influence of the mineral composition of the medium on the growth of planktonic algae II The influence of the concentration of inorganic nitrogen and phosphate phosphorus J 31109-148
Claflin TO 1968 Reservoir aufwuchs on inundated trees Trans Amer Micr Soc 8797-104
On the rado of nitrogen to phosphorus in theCooper LRN 1937 sea Jour Marine Assn UK 177-182
Crei tz G I and FA Richards 1955 The estimation and characteri shyzation of plankton populations by pigment analysis Ill A note on the use of millipore membrane filters in the estimation of plankton pigments ~ Har Res 14211-216
Czarneki D and R Williams 1970 Personal Communication Bemidji State College Bemidji Hinnesota August 1970
Douglas B 1958 The ecology of the attached diatoms and other algae in a small stony stream J 295-322
Dryden FD and G Stern 1968 Renovated waste water creates recreational lake Sci and 2268
Duffer HR and TC Dorris 1966 Primary productivity in a southern Great Plains stream Limnoi Ocean0B 11143-151
Dut ton H L and WM Nanning 1941 Evidence for carotenoid-sensi tized photosynthesis in the diatom Nitzschia cZosterium ~ Bot 28516-526
Edmondson HT 1947 Measurement of production in fertilized salt water J Mar 6228-246
160
196L Changes in Lake Washington following an increase in the nutrient income Verh Intern 14167-175
Edmondson WT 1968 Lake eutrophication and water quali ty management The Lake Washington case In Hater Quality ControL Univ of Wash Press Seattle
Edmondson WT GC Anderson and DR Peterson 1956 Artifical eutrophication of Lake Washington Oceanogr 147-53
Emerson R 1958 The quantum yield of photosynthesis Ann Plant 91-24
Engelbrecht R and JJ Morgan 1959 Studies on the occurrence and degradation of condensed phosphate in surface waters Sew Ind Wast 31458-478
196L Land drainage as a source of phosphorus waters Algae and Metropolitan Wastes
US Public Health Service pp 74-79
Ewing MS and TC Dorris 1970 Algal community structure in artificial ponds subjected to continuous organic enrichment Amer Hidi Nat ~565-582
Eyster C 1964 Micronutrient requirements for green plants especially algae Algae and Han DF Jackson led] Plenum Press New York p 86
Federal Water Pollution Control Administration 1969 fin Apprais[d of Water Pollution in the Lake Superior Basin Covernment Printing Office Washington DC
Fitzgerald GP 1969 Field and laboratory evaluations of bioassays for nitrogen and phosphorus with algae and aquatic weeds Limnoi Ocean0B 14206-212
Flemer DA 1969 Chlorophyll acalysis as 11 method of evaluating the standing crop phytoplankton and primary productivity Sci 10301-306
Flint EA 1950 An investigation of the distribution in time and space of the algae of a British water reservoir Hydrobio1 2 217-240
Foerster JW and HE Sch1icting 1965 Phycoperiphyton in an oligotrophic lake Trans Amer 84485-502
Fox JL 1969 The Ecology of Epilithic Periphyton of Lake Superior PhD Thesis University of Minnesota Hinneapolis Hinnesota
161
Fox JL TO Odlaug and TA Olson 1969 The ecology of periphyton in western Lake Superior Part I Taxonomy and Distribution Water Resources Center University of Minnesota Minneapolis Minnesota
Fritsch FE 1931 Some aspects of the ecology of freshwater algae (with special reference to static waters) 19233-272
Fuller JI 1946 Season of attachment and growth of sedentary marine organisms at Lamoine Maine 27150-158
Gerloff GC GP Fitzgerald and F Skoog 1950 The mineral nutrition of CoccochiZopis peniocystis ft~er Bot ]L835-890
Godward M 1937 An ecological and taxonomic investigation of the littoral algal flora of Lake Windermere 1 Eco1 ~496-568
Goldman CR 1969 Micronutrient limiting factors and their detection in natural phytoplankton populations In Primary Productivity in Aquatic Environments CR Goldman [edT Mem 1st Ital Idrobiol 18 Supp] Univ of Calif Press Berkeley pr 123-135
Goldman C and R Armstrong 1969 Productivity primary productivity studies in Lake Tahoe California Verh Ver Limnol 1749-71 -- shy
Gross F FEG Raymont SR Nutman and DT Gauld 1946 Application of fertilizers to an open sea loch Nature ~483
Grzenda AR and ML Brehmer 1960 A quantitative method for the collection and measurement of stream periphyton Limnol Oceanogr 5190-194
Gumtow RB 1955 An investigation of the periphyton in a riffle of the West Gallatin River lontana Trans Amer Micr Soc 74278-292
Hamilton nR Jr 1969 Nutrient limitation of sunnner phytoplankton growth in Cayuga Lake Limn01 Oceanogr 579-590
Hamm A 1969 vater quality of the lakes in the Bavarian Alps Fish Flussbiol (Germany) 44
7153388 (1969)
Hasler AD 1947 Eutrophication of lakes by domestic drainage Ecol 383-395
1957 Natural and artificially (air-plowing) induced movement of radioactive phosphorus from the muds of lakes Inter Conf Radioisotopes Res 1-16
162
Hepher B 1962 Primary production in fishponds and its application to fertilization experiments Oceanogr 2 131-136
Herbst RP 1969 Ecological factors and the distribution of gZomepata in the Great Lakes Amer MidI Nat 8290-98
Hogetsu K and S Ichimure 1954 Studies on the biological production of Lake Suwa IV The ecological studies on the production of phytoplankton ~ 1 Bot 280-303
Hohn MH and J Hellerman 1963 The taxonomy and structure of diatool populations from three Eastern North American rivers using three sampling methods Amer Soc 82250-329
Holden AV 1959 Fertilization experiments in Scottish freshwater lochs II Sutherland 1954 Invest Freshwater Fish
42 ---- shy
Holm-Hansen 0 GC Gerloff and F Skoog 1954 Cobalt as an essential element for blue-green algae Physiol ~um 2 665-675
Huntsman AG 1948 Fertility and fertilization of streams J Fish Res Bd Can 248-253
Hustedt F 1930 Bacil1ariophyta (Diatomeae) Heft 10 Die Swsswassershyflora Mitte1europas Herausgegeben von Prof Dr A Pascher Gustave Fischer Jeno Deutschland 446 pp
Hutchinson GE 1957 A Treatise on Limnology John Wiley and SonsNew York 1015 pp
Ishac MM and nM Bishai 1968 The possible role of the algaeCZadophopa oZomepotn the biological control of BiomphaZa~abnissY1 of Schistosoma mansoni Hydrobiol 32168-180
Jackson DF 1967 A study of the periphyton organisms of the eastern end of Lake Ontario Proc 10th Conf on Great Lakes Res International Association for Great Lakes Research Ann ArborMichigan pp 31-36
Jolly VH and MA Chapman 1966 A preliminary biological study of the effects of pollution on Farmers Creek and the Coxs River New South Wales 160-187
Jones JRE 1949 An ecological study of the River Rheidol North Cardiganshire Wales J ~67-88
163
-- --
Juday C and EA Birge 1931 A second report on the phosphorus content of Wisconsin lake waters of Arts Lett 353-382
Devern NR and RC Ball 1965 Primary productivity and energy relationships in artificial streams Limnol 1074-87
Kilham P 1971 A hypothesis concerning silica and the freshwater planktonic diatoms 1610-18
King nL 1970 The role of carbon in eutrophication I 422035-2051
Knudson B 1957 the epiphytic diatom TabellaYia [Zoccnil-osa(Roth) Kutz in three English lakes 1 Eco1
93-112
Kobayasi H 1961 Productivity in sessile algal community of Japanese mountain river Bot 74 331-341
Komarvosky B 1953 A comparative study of the phytoplankton of several fish ponds in relation to some of the essential chemical constituents of the water Bull Res Coun 379-410
Kormondy EJ 1969 Concepts of Ecology Prentice-Hall Inc Englevood Cliffs New Jersey
Kott Y 1968 Effect of nitrogen and phosphorus on algal growth in citrus wastes experimental oxidation pond 161-167
Kuentzel LE 1969 Bacteria carbon dioxide and algal blooms 41 1737-1747
Lackey JB and CN Sawyer 1945 Plankton productivity of certain southeastern Wisconsin lakes as related to fertilization I Surveys Works 1 573-585
Lange W 1970 Cyanophyta-bacteria systems Effects of added carbon compounds or phosphate on algal growth at low nutrient concentrations J 230-234
Langford RR 1948 Fertilization of lakes in Algonquin Park Ontario Soc 78133-144
Larkum AWD EA Drew and RN Crossett 1967 The vertical distribution of attached marine algae in Malta J Ecol 22 361-371
Lebour MV 1922 The food of plankton organisms J Mar BioI Assn ~ Q644-677
164
Lee C 1970 Eutrophication Occasional paper No2 Eutrophication Information Program University of Wisconsin Madison
Lund JWG 1965 The ecology of freshwater phytoplankton BioI Rev 231-293
Mackenthun KM and lt1M Ingram 1967 Biological Associated Problems in Freshwater Environments Their Identification Investigation and Control US Dept of the Interior pp 1-287
Mackenthun KM LA Lueschow and cn McNabb 1960 A study of the effects of diverting the effluent from sevage treatment upon the tEceiving streams Trans Wise Sci Art Let~ 51-72
Margalef R 1948 A new lirrmological method for the investigation of thin-layered epilithic communities Trans Amer ~1icr Soc 67153-154 -- -- -shy
Marshall SM and AP Orr 1947 Further experiments on the fertil zation of a sea loch (Loch Craiglin) The effect of different plant nutrients on the phytopl ankton J Mar BioI Assn ~ 27 360
Marzolf CR 1965 Substrate relations of the burrowing amphipod in Lake Michigan Rcol 46579-592
McAllister CD TR Parsons K Stevens and JDH Strickland 1961 Measurements of primary production in coastal SEa water using a large-volume plastic sphere Limno1 6237-258
McConnell WJ and WF Sigler 1959 Chlorophyll and productivity in a mountain river Limn_ol Oceanog 4315-351
McIntire Cn lQ66a Some effects of current velocity on periphyton communities in laboratory streams Hydrohiol 559-570
Some factors affecting respiration of periphyton in lotic environments 918-930
HcIntire CD and ILK Phinney 1965 Laboratory studies of periphyton production and community metabolism in lotic environments Ecol Nono~ 35217-258
NcKee BS 1962 Nitrogen Hetabolism in Plants Clarendon Press Oxford England 78 pp
McKee IE and HW Wolf 1963 Water quality criteria California State Water Quality Control Board Publication 3-A Sacramento California
165
------
36Meeks R L 1968 The accumulation of C1 ring-labeled DDT in a freshwater marsh J Manag 376-379
Megard RO 1969 Algae and photosynthesis in Shagawa Lake Minnesota Limnol Res Center Dniv of Minn Interim Rept No5
Menzel DW and JH Ryther 1961 Nutrients limiting the production of phytoplankton in the Sargasso sea with special reference to iron Deep Res 276-281
Moss B 1969 Algae of two Somersetshire pools standing crops of phytoplankton and epipelic algae as measured by cell numbers and chlorophyll a l Phycol 2158-167
Moss B and AG Karim 1969 Phytoplankton associations in two pools and their relationships with associated benthic flora Hydrobiol
587-600
Munawar M 1970 Limnological studies on freshwater ponds of Hyderabad shyIndia II The biocenose distribution of unicellular and colonial phytoplankton in polluted and unpolluted environments
105-128
Neel JK 1953 Certain limnologica1 features of a polluted irrigation stream Soc 72119-135
Seasonal succession of benthic algae and their macroshyresidents in a headwater limestone stream JWPCA
RIO-R30 - - - - shy
Neil JH and GK Owen 1964 Distribution environmental requirements and significance of in the Great Lakes Great Lakes
Di Mich 113-121
Nelson R T Olson and T Odlaug 1971 Taxonomy of North Shore periphyton Lake Superior Castle Danger studies - 1970-1971
129-36
Neos C 1966 The removal of phosphate by algae in river water Water
Newcombe CL 1950 A quantitative study of attachment materials in Sodon Lake Hichigan 204-215
Oborn ET and EC Higginson 1954 Biological corrosion of concrete Joint Rept Field Crops Res Branch Agric Res Service US Dept Agric and Bur Reclamation US Dept Interior 8 pp
166
Odum HT 1957 Trophic structure and productivity of Silver Springs Florida Monogr
Olson TA 1972 Personal Communication University of Minnesota Minneapolis Minnesota April 1972
Oswald WJ 1960 Metropolitan wastes and algal nutrition Algae and Metropolitan Wates Trans 1960 Seminar Robt A Taft San Eng Center Cincinnati Ohio pp 88-95
Palmer CM 1962 Algae in Water Supplies US Dept of Health Education and Welfare Public Health Service Robert A Taft Sanitary Engineering Center Cincinnati Ohio Publication No 657
1969 A composite rating of algae tolerating organic pollution J 78-83
1971 A composite rating of algae tolerating organic pollution Selected Papers in Phycology JR Rosowski and BC Parker reds] of Botany Dniv of Nebraska Lincoln pp 33-37
Parkos WG 1969 An Analysis of the Primary Productivity of the Surface Waters of Lakes Superior Michigan Huron and Irie Using the C-14 Technique PhD Thesis University of Minnesota Minneapolis Minnesota
Patrick R 1948 Factors effecting the distribution of diatoms Bot Rev
Patrick R and Chi Reimer 1966 The Diatoms of the United States Livingston Publishing Company Philadelphia 688 pp
Patrick R MH Hohn and JH Wallace 1954 A new method for determining the pattern of the diatom flora Not Naturae No 259 12 pp
Perkins EJ 1958 The food relationships of the microbenthos with particular reference to that founct at Whitstable Kent Ann ~ Nat (ser 13) 164-77
Philipose MT 1960 Freshwater phytoplankton of inland fisheries Proc leAR New Delhi272-291
Phinney HK 1965 Effect of temperature on metabolism of periphyton communities developed in laboratory streams Toimnol Oceanogr 10341-344
Pinchot GB 1970 Narine farming Sci Amer 15-21
167
Prescott GW 1956 A guide to the literature on ecology and life histories of the algae Bot Rev 22167-240
Prescott GW 1962 Algae of the ~estern Great Lakes Area Rev ed Wm C Brown Co Inc Dubuque Iowa 977 pp
1964 How to Know the Freshwater Algae Im C Brown Co Iowa 272 pp
Putnam HD and TA Olson 1959 A Preliminary Investigation of Nutrients in Western Lake Superior 1958-1959 School of Public Health University of Minnesota Minneapolis Minnesota 20 pp
1960 An investigation of Nutrients in School of Public Health University of
Minnesota Minneapolis Minnesota 25 pp
Raschke RL 1970 Algal periodicity ami water reclamation in a stabilization pond ecosystem 2~ fE 42518-530
Ravera O and RA Vollenweider 1968 an indicator of Lago Maggiore eutrophication 30374-380
Raymont FEG 1949 Further observations on changes in the bottom fauna of a fertilized sea loch J Har BioI Assn lS 9-19
Redfield C 1958 The biological control of chemical factors in the environment Amer bull 46205-221
Rehbronn E 1937 X Beitrage zur Fischereibiologic merkischer seen II Das naturliche Nahrungsangebot insbesondere der Aufwuchs und die Ernahrung der Fischnahrtiere im Litoral eines eutrophen sees 1 and n-IV f Fischerei 35(2) 233-282 283-345 (Sladeckova - shy
Reynolds N 1950 Methods of culturing epiphytic algae New 155-162
Richards LA with T G Thompson 1952 The estimation and characteri shyzation of plankton populations by pigment analyses II A spectroshyphotometric method for the estimation of plankton pigments J Mar Res 156-172
Roa CB lQ53 On the distribution of algae in a group of six small ponds J 62-71
Rodhe W 1948 Environmental requirements of freshwater plankton algae Symb Bot 1-149
168
Rose FL and CD McIntire 1970 Accumulation of dieldrin by benthic algae in laboratory streams Hydrobiol 481-493
Rosine WN 1955 The distribution of invertebrates on submerged aquatic plant surfaces in Muskee Lake Colorado 308-314
Round FE 1953 An investigation of two benthic algal communities in Ma1ham Tarn Yorkshire J Ecol 41174-197
1960 Studies on bottom-living algae in some lakes of the lake district IV The seasonal cycles of the Bacillarioshy
phyceae J Ecol 48529-547
1961 Studies on bottom-living algae in some lakes of the English lake district VI The effect of depth on the epipelic algal community T Ecol 49245-554
1965 The Riology of the Algae St Martins Press New York 269 pp
Rudolfs II 1947 Phosphates in sewage and sludge treatment Sew 2 19 43
Ruschmeyer OR and LA Olson 1958 Water Movements and Temperatures of estern Lake Superior School of Public Health University of Minnesota Hinneapolis Hinnesota 21 pp
Ryther JH 1954 The ratio of photosynthesis to respiration in marine plankton algae and its effect upon the measurement of productivity
Deep Sea Res bull 2134-139
Sanderson WW 1953 Studies of the character and treatment of wastes from duck farms Proc 8th Ind ~aste Conf Purdue Univ Ext Ser 83170-176
Sawyer CN 1947 Fertilization of lakes by agricultural and urban drainage 2 New ~ Water Works Assn 61109-127
1965 Problem of phosphorus in water supplies J Amer Water Works 571431-1439
Sche1ske CL and Ebull Stoermer 1971 Eutrophication silica depletion and predicted changes in algal quality in Lake Michigan
423-424
Schindler DW 1971 Carbon nitrogen and phosphorus and the eutroshyphication of freshwater lakes 2 Phyco1 2321-329
Shapiro J lQ70 A statement on phosphorus 2~~I 42772-775
169
Shapiro J and R Ribeiro 1965 Algal growth and sewage effluent in the Potomic estuary I1~ 1034-1042
Singh VP and PN Saxena 1969 Preliminary studies on the algal succession in rm stabilized sewage Hydrobio1 34503-512
Skulberg OM 1968 Some experimental investigations of self-purification processes Gruntorbattring2l25-37 In BioI Abstr 1969 No 5681
Sladeckova A 1962 Limnologica1 investigation methods for the periphyton (Aufwucbs) community Bot Rev 286-350
Smith GM 1950 The Fresh-Water Algae of the United States McGraw-Hill Book Co Inc New York 719 pp
Smith HI 1945 Preliminary observations upon the fertilization of Crecy Lake New Brullfndck Tran Amer Fish Soc lfl5-l74
1959 Phosphorus enrichment of drainage waters from farm ~ Fish Res ~an 887-895
Smith R F bull 1968 mechanisms at Lake Tahoe IT Source of an endogenous bloom on the south shore July 1967 ~ater Res 2625-630
Smith RF and HF Ludwig 1968 Eutrophication mechanisms at Lake Tahoe (USA) 1 Source of an exogenous SiPUQl-llYl bloom on the south shore January 1967 Hater Res 2
STlyth JC 1955 A study of the benthic diatoms of Loch Sween J Ecol 43149-171
Slokes LW 19f19 The Productivity of Lake Superior Periphyton as Reflected oy Pi11lent Analysis and Respirometry PhD Thesis llniversi ty of r1innesota Hinneapolis Minnesota
Stokes LW TA Olson and TO Odlaug 1970 The Photosynthetic Pigments of Lake Superior Perlphyton and Their Relation to Primary Productivity Water Resources Center University of Minnesota Hinneapolis Ninnesota
Stockner JC 1968 Algal growth and primary productivity in a thermal stream J Res Can 2037-2058
Stockner JC and FAJ Armstrong 1971 Periphyton of the experimental lakes areel northwestern Ontario J Fish Res Can 28215-229
Strickland J DH O Holm-Hansen RH Eppley and RJ Linn 19f19 The US2 of a deep tank in plankton ecology T Studies of the growth and composition of phytoplankton crops at low nutrient levels
23-34
170
Stumm H and JJ Morgan 1962 Stream Pollution by Algal Nutrients Twelfth Annual Conference on Sanitary Engineering University of Kansas pp 16-26 (Harvard University Sanitary Engineering Reprint No 45)
swingle HS BC Gooch and HR Rabanal 1963 Phosphate fertilization of ponds Proc Ann Conf ~~ Assn Game~ Fish Comm 17213-218
Sylvester RO 1960 Nutrient content of drainage water from forested urban and agricultural areas Algae and Metropolitan Hastes Robt
A Taft San Eng Center Cincinnati Ohio pp 80-87
Sylvester RO and GC Anderson 1964 A lakes response to its environment 1 San ~ Div ASCE 1-22
Takumi J 1971 Personal Communication University of Ninnesota Duluth nuluth Minnesota August 1971
Tanada T 1951 The photosynthetic ef ficiency of carotenoid pigments in Naviouta rrrpoundrlima Am J le 27fl-283
Taylor AW 1967 Phosphorus and ater pollution J Soil ~ater Cons26 228-231 -- -- ~~~ shy
Tiffany LH and ME Britton 1951 The Algae of Illinois University of Chicago Press Chicdfo Illinois 407 pp
Tilden J 1910 The Nyxophyceae of North America and Acljacent Regions Vol I of ~finnesotCl AlgCle TIepuhlished by J Cramer Bibliotheca Phycologica Authorized nprint 19f18 Printecl in Germany Verlag von Cramer
Voigt GK 19f1O Alteration of the composition of L1inwater hy trees Amer M~ Nat 63J2]-176
Wallace NM 1955 The effect of temperature on the growth of some freshwater diatoms ]ot Nat Acad Sci Phi1 No 28011 pp
Waters Tr ]960 otes on the chlorophyll method of estimating the photosynthetic capacity 01 stream periphyton Limnol Oceanogr 5486-488
Weiss CM 1969 Relation of phosphate to eutrophication J Amer Water ~Iorks Assn bull 61 387-391
Westlake nF ]965 Some basic data for investigations of the productivity of aquatic macrophytRS pp 231-248 In Primary Productivity in Aquatic Environments CR Goldman [dj Mem 1st Ita1 Idrobio1 18 SuppJ University of California Press Berkeley
Iii
Whipple CG and HN Parker 1902 On the amount of oxygen and carbonic acid dissolved in natural waters and the effect of these gases upon the occurrence of microscopic organisms Trans Amer Microsc Soc pound103-144 --- ---
Whitford LA 1956 Communities of algae in sprIngs and spring streams of Florida Ecol 37433-442
1960 The current effect and growtll of fresh-water algae Trans Amer Microsc Soc 79302-309
Whitford LA and GJ Schumacher 1968 Notes on the ecology of some species of fresh-water algae Hydrobio1 225-236
1969 A Manual of the Fresh-Water Algae in Carolina Agricultural Experimental Station
313 pp
Winter DR 1971 Water Quality and Trophic Condition of Lake Superior (Hisconsin Haters) Research Report No 68 Dept of Natural Resources Madison Hisconsin 24 pp
Wood CE and TL Shedden 1968 Effects of fertilizer on food chain organisms and fish production in Norris Reservoir Tennessee
and Wildlife Branch Pub 19 pp
Young nw 1945 A llmnological investigation of periphyton in Douglas Lake Michigan Amer 641-20
Yount JL 1956 Factors that control species numbers in Silver Springs Florida Oceanogr 286-295
172
APPENDIX A
Calculations for Arriving at Chemical Dosage Rates at Castle Danger
(1) Desired nutrient level 50 mgL (163 mgL
(2) Amount of water flowing through test pool in one day 20000 Liters (2 overturns)
(3) Desired stock solution delivery rate from capillary tube 5 Litersday
(4) Size of stock reservoir 35 Liters
(5) Molecular weights of chemical used
(a) 3H 02
22823
(b) 95
(6) Amount of needed LO obtain 50 mg in one liter of water
grams of needed 005 g P04 012
38 0 in one liter of water will give the
Thus 0012 grams of value2 of 50 mgL P04
(7) Flow-thru in the test pool was 20000 liters thus in one day 240 grams (012 x 20000) of was released uniformly into the water Since the delivery rate was 5 liters per day 240 grams of stock chemical was dissolved in that volume The stock chemical Has mixed in a large 35-liter carboy vlbjch wouJd then provide sufficient solution for a 7-day period Thus in the 35-liter carboy of distilled wa ter 1680 grams of K HPO4 31LO was mixed
2
(1) Desired phosphorus rate 163 (5 mgL
(2) Amount of Hater flowing through test pool in one day 60000 liters (6 overturns)
73
(3) Desired stock solution delivery rate from proportioning pump 5 Litersday
(4) Size of stock solution reservoir 35 Liters
(5) Molecular weights of chemical used
(a) K~HPO bull 22823
(b) PO 4 = 95
(6) Amount of K2HP04 needed to obtain 5 mg P04 in one liter of is exactly 10 times less that of 1969 Thus 0012 grams
K2HPO in one liter of water will give the desired value of 5 mgL P04
(7) Flow-thru in the test pool was 60000 liters thus in one day 72 grams (0012 x 60000) of K2HP04 was released uniformly into the water Since the desired solution delivery rate was 5 liters per day 72 grams of this stock chemical was dissolved in that volume In the 35-liter carboy of distilled water 504 grams of KHPO was mixed
After the appropriate phosphorus dosage was determined the following steps were used to incorporate nitrogen (as NaN0 3) into the same solution at a 151 ratio
0) Assume the use of 163 mg P04-PL (05 mg
(2) P to N ratio of 115 thus 163 x 15 245
(3) Average va]ue of at Larsmont Station in Lake Superior is 049 mg N03-NL 245 049 - 196 mg N03-NL (871 mg N0 3L) This is thf amount to be added in combination with phosphorus
(4) Holecular weights of chemical used
(a) NaNO 8499
(ll) N0 = 623
(5) Iulotmtsof NaN03 needed to produce 871 mg in one liter of water
grams needed 00871 g [~] 0119
Thus 0119 grams of in one liter of water wi1] give the desired value 87] mg
174
IJ Flow-thru in the tes t pool was 60000 liters thus in one day(6) 714 grams (0119 x 60000) of NaN03 was released uniformly into the water Since the desired solution delivery rate was 5 liters per day 714 grams of this stock chemical was dissolved in that volume Thus in the 35-liter carboy of distilled water 4998 grams of NaN03 was mixed This was combined in the same 35-liter solution which contained the phosphorus
(7) Thus the 35-liter container of stock solution which would last for one week contained the following components
(a) 504 grams of K2HPO
(b) 4998 grams of
175
AII[ND
Summary of Phospha lysis
CasTI Danger 1969
LakG~-
APPEND I X
Ie
Summary lf Wa Chemistry lesl POll Danger
DaTe P04 (ppm) tm J (ppm) pH
7-22 17 6 N r
1-30 4 794
8-5 52 92 NS NS
8-1 49 90 NS N S
8shy 55 J I 0 Nbullbull Nbullbull
8-26 I 8 i
9-2 46 0
9-1 61 150 r~ s r )
9-30 48 9 I 13 0 I
0-8 N Nbullbull
0-15 101 NS
10-22 47 81 22
-) 42 e5 NS rL
-2 7 J 1 Nbullbull N
I I () 2 8
i~ ClndUCTed by the Stannous j()[ide-r~olybdate thod whereas was Iyzed by the Phenoldisulphonic-Acid Method
means no Ie collected
177
0-30 54
II 1
-6 4
-3 489
1-19
I 1-23 )
)
005 005
lt bull
lt005 NS
lt005
005 lt005
00 005
lt 00)
les room
I
f TWl (~d f Plo I
76
APPENDIX DAPPlNDIX C
Mounting Media InstructionsII
the floo I and Lake The mounting medium as formulated by David Czarnecki and 19
Harvey Williams in 1970 is prepared as follows If bullbullbull 1575 grams of polystyrene is added to 50 ml of toluene This solution is
pH allowed to stand until clear then thoroughly mixed with 200 g of methylene iodide In our preparation we used seven fragmented 6-7 f1 oz styrocup brand styrofoam cups ohtainable at most P ke C Lake grocery stores Other polystyrene sources should work equally
NS well 7-22 005 lt005 136 N
21 09 24 14 176 7 In evaluating their mounting medium Czarnecki and Williams7-30 concluded that refractive index of the solid medium determined by comparisons with reference refractive oils was 1 75 at 24deg C and 97 Nbullbull N~8-gt
~
tungsten light Resolution of detail in the finished mounts exceeded that in Hyrax mounts147 I Nbullbull N
NS(J- I I N
I 1 J 12 194 92B-2() S I 1489-L
Col- I) I N N
11) i 2 I gt II 8g 859-30
N 08 o N10-8
0-1 09 2 N N
7 bull I 70 o _13 N C N
Nbull J-2 o r
o o 1 6 I) gO 8
he tent both Coni Pool andyenIn every kc was tt1a n
means no es I
179
178
---APPENDIX E
Checklist of Periphyton Organisms Found In Lake Superior and Experimental Pools
At Castle Danger 1969-1970
PHYLU11 CHRYSOPHYTA
Achnanthes 1anceo1ata (Brebisson) Grunow A Microcepha1a (Kuetzing) Cleve
Amphiprora ornata Bailey Amphip1eura pellucida Kuetzing Amphora ovalis Kuetzing Asterione11a formosa Hassall Ceratoneis arcus (Ehrenberg) Kuetzing Cocconeis flexella (Kuetzing) Cleve
C pediculus Ehrenberg C placentula Ehrenberg
Cyclotella antiqua Wm Smith C bodanica Eulenstein
Cymatopleura solea (Brebisson) Wm Smith Cymbella cistult (Hemprich) Grunow
C gracilis (Rabh) Cleve C lanceolata (Ehrenberg) van Heurck C leptocerus (Ehrenberg) Grunow C parva (Wm Smith) Cleve C prostrata (Berkeley) Cleve C ventricosa Kuetzing
Denticula thermalis Kuetzing Diatoma anceps (Ehrenberg) Kirchner
D elongatum Agardh D hiemale (Lyngbye) Heiberg D vulgare Bory
Diploneis elliptica (Kuetzing) Cleve D puella (Schuman) Cleve
Epithemia argus alpestris (Wm Smith) Grunow E turgida (Ehrenberg) Kuetzing
Eunotia monodan (Ehrenberg) Wm Smith E pectinalis Val minor (Kuetzing) Rabenhorst L vJOleirolii Rabenhorst
Fragilaria capucina Desmazieres F crotonensis Kitton F harrisonii (Hm Smith) Grunow
Frustulia viridula (Brebisson) Detoni Gomphoneis herculeana (Ehrenberg) Cleve Gomphonema acuminatum vaT coronatum Rabenhorst
G acuminatum vaT turris (Ehrenberg) Cleve G angus tatum VaT obtusatum (Kuetzing) van Heurck C constrictum Ehrenberg
180
Gomphonema constrictum Val capitatum Grunow c geminatum (Lyngbye) CA Agardh G gracile Val dicotoma (Kuetzing) Grunow C helveticum Val tenuis Hustedt G intricatum Kuetzing C montanum Grunow C olivaceum (Lyngbye) Kuetzing G olivaceum Val calcarea Cleve G parvulum (Kuetzing) Grunmv G sphaerophorum Ehrenberg
Melosira granulata (Ehrenberg) Ralfs M varians CA Agardh
Neridion circulare VaT constricta (Ralfs) Hustedt Navicula arvensis Husted t
N dicepl1ala (Ehrenberg) Hm Smith N dicephala val elinensis (Gregory) Cleve N minima Grunow N oblohga Kuetzing N pupula Kuetzing N radiosa Kuetzing N reinhardtii (Grunow) van Heurck N tuscula Ehrenberg N verecunda Uustedt N viridula Kuetzing
Nitzschia angusta val acuta Hustedt N denticula Grunow N dissipata (Kuetzing) Crunow N filiformis Hustedt N hungarica Grunow N linearis (Agardh) I)m Smith N linearis val tenuis (Hm Smith) Grunow N palea (Kuetzing) Wm Smi th N sigmoidea (Nitzsch) Jm Smith N sublinearis Hustedt N vermicularis (Kuetzing) Hatzsch
Pinnularia cardinalis (Ehrenberg) Hm Smith P major (Kuetzing) Hm Smith P viridis (Nitzsch) Ehrenberg
Rhizosolenia eriensis HL Smitb Rhoicosphenia curvata (Kuetzing) Grunow Stauroneis anceps va anceps Ehrenberg
S obtusa Lagerst Stephanodiscus Ehrenberg Surirella angusta Kuetzing
S linearis In Smith S ovalis VaT pinnata Hm Smith
Synedra aeus Kuetzing S rumpens Kuetzing S tenera Kuetzing S ulna (Nitzsch) Ehrenberg S vaucheriae vaT truncata Kuetzing
181
Tabellaria fenestrata T flocculosa
Chlamydomonas Ehrenberg Chlorococcum Fries Cosmarillm Corda Hougeotia Agardh Oedogoniulll Link Pediastrum boryamUll (Turpin) Heneghini
P duplex Heyen Pithophora Wittock Protococcus viridis Agardh Rhizoclonium hierglyphiculll (Agardh) Klletzing Scenedesmus obliqUllS (Turpin) Kuetzing
S quadricauda (Turpin) Brebisson S qlladricauda var quadrispina (Chodat) CM Smith
Schizomcris leibleinii Kuetzing Selenastrum Reinsch Spirogyra Link Stigeoc]oniulll sllbsecuntum Kuetzing Ulothrix tenerrima Kuetzing
U Zonata (Weber amp fohr) Kuetzing
Aphanothece lllicrospora (Menegh) Rabenhorst ChroococcllS minor (Klletzing) Naegeli Lyngbya lllartensiana var calcarea Tilden Merislllopedia convoluta Brebisson Oscillatoria tenius CA Agardh Phormidiulll foveolarum (Montagne) Gomont Plectonellla wollei Farlow
182

FOREWORD
This Bulletin is pub1i in furtherance of the purposes of the Federal Water Resources Research Act of 1964 The purposf of the Act is to stimulate sponsor provide for and supplement present programs for the conduct of research investigtions experiments and the trainshying of scientists in the field of ~ater and resources which affect water The Act is promoting 1 more aCHlultJte National program of water resources research by furnishing nancial assistance to non-Federal research
The Act provides for stab] ishment f Jater Resources Research Censhyters at Universiticmiddots throughollt the Nation On Septtmber 1 1964 a Water Resources Research (111 Let ws es tab 1 i shed in Gradult1te School as an Interdisciplinarv component of the University Minnesota Tht Center has the responsibili for unifying and stimulilt ing University water resources research through the administration of funds covered in the Act and made avail ]gtl bv sources coordinating liniversity research with waler resources programs or local State and Federal agenshycies and private organi ions throughout the State and isting in training additiolwl scicnlis for ork in the field of ater reSOtlrcts through research
This Bulletin is numher 59 in il sed f pub iOllS designCd present information benri on wnter resources rescarch in Hinnesota and the results of some of the res(gt1rch sponsored bv the Center Thi letin
ois concerned with the possiblc changes which would take place in Superior periphyton i[ Iluling or enriching substances were added to the lake water A means for ass(ssing thl possible changes taking pial is described to assist water mmwgers i monitoring tIlE water qual tv of Lake Superior
This Bulletin serves the Res(nrch Project Technical (ompletion Report for the fo11olting C-nter project
No 14-J-OOOl-109S
Ecol of Ncnrshore Periphvton of Superior
1 A Olson Schoo 1 of Pub Health Hlliv of Minn June 1n ] 972
Pub1 Abstract
The primary obj () r t111 s research as carried out in tlw summer fall of 1969 and 1970 ~ltlS to rmine the possible changeS which ould take place in Lake Superior peri phvton hen pollut ing or enriching substaIH~es were added to the Jake Hater To end two naturl rock basins constructed at the lakes long tllL north shore at Castle Danger Minneshysota for the purpos( of exposing naturcll1y grown and regrot4th periphyton
05-A
to higher-than-normal levels of phosphate and nitrate At weekly intervals samples were collected and productivity was measured by enumeration of organisms chlorophyll analysis and weight dry and organic
Lake Superi or periphyton responds draJlk1t ical1 y to increased additi ons of phosphorus and nitrogen If the ncar-shore area of Lake Superior ever received nutrients such 85 those added to the experimental test pool at Castle Danger a drastic change in the Lakes biota could occur For exshyample as enrichment increased the predominant clean-water diatom forms could eventually be replaced by the more tolerant green or blue-green algae In addition the very composition of the macrobenthic forms found in Lake Supertor could be altered as a result of their dependence on the periphyton which as primary producers form the first link in the food chain Likeshywise certain fish which depend on henthic organisms for their food may be dverse Iy affected as an indirect result of a changing periphyton community
Having established that enrichment of Lake Superior water will drnmshyaticlly change the normal periphyton growth another baseline has been pstablished for future reference in the event that phosphorus and nitrogen r 1ch wastes should be adden to the 1 ake certain types of algae appear as replacements of the normal flora now characterizing the periphyton and the productivity increases one will have a means [or assessing the posshysible changes taking place j the water quality of Lake Superior
liltation Descrlptor~ Periphyton Nutrients Lake Superior Producshytivity Minnesota Algae Phosphates Nitrates Pollution
ion ltComplete Nutrient Media Control Pool Test Pool
TAllLE OF mNTENTS
CHAPTER PAGE
1 INTRODUCTION 1
II bull REVIEW OF THE LITERATURE J
Significance of Periphyton 1
Basic J
ann the food web 3
Periphyton as a source of plankton organisms 4
a pollution indicator 4
Some Environmental [-actors 5
Types of periphyton environments
Periphyton and the physical environment 5
Periphyton anli the chemical environment 6
Ieriphyton and the biological environment
Tchnl1ue
Peripilyton removal
Direct observations
Observations on artificial suhstrate
~aturl substrata bullbull
Quantitative measurements
Chemical Factors GrmJth
Basie nutrient requirements for algae
Sources of nutrients
The effect of [nrlcbment on Il]nkton and
Field Observations
ii i
6
7
7
8
)
10
11
12
13
17
Periphyton 17
18
11
CHAPTER PAGE
Artificial enrichment experiments 19
Xethod of nutrient delivery 24
Nutrient Levels in Lake Superior 24
III MATERIALS AND HETHODS 29
Project Site Selection 29
Construction of Experimental Pools 29
General layout and construction details bull 29
Water circulating system 31
Construction of pumphouse and instrument shelter 33
Calibration of pool system bull 33
Field and Laboratory Procedures 1969 35
Chemical procedures 35
Collection of field materials for enrichment studies 39
Experimental program 41
Laboratory procedures 41
Chlorophyll analysis 43
Gravimetric analysis 44
Identification and enumeration of organisms 44
Field and Laboratory Procedures 1970 45
Xodification and improvement of the facility 45
Chemical procedures 46
Collection of field materiRls fClr enrichment studies 48
Experimental program 49
Laboratory procedure 49
iv
ctLPTER PAGE
Laboratory studies 50
Field records and observations 51
IV RFSlLTS AND DISCUSSION 53
Description of Sa~pling Area 53
rinding~ 1969 53
Ceneral program 53
atural periphyton Castle Danger 54
Nlturl1 Per iphyton experimental pools 61
Supplementary observations 71
indinf~ 1)70 76
Ceneral program 76
Incukltor studies 77
iatural periphyton Castle Danger 79
Naturl pcri11vtcn experimental pools 80
lCefymth periphyton ecperimental pools 113
h1ater tcrlperatures Castle Danger 142
Supp1 emen tary 01serva tions 118
l SUlllIARY AiD COCUJSICJNS 152
Possible Future Studies 156
])IJLIOGRAPHY bull bull bull 157
APPENDIX A (Calculations for ArrivinK at Chemical DosRKe RRtes Rt Castle Danger) 171
APPENDIX )j (SumI~ary of Phosphate Analysis Castle DRnger 1969) 176
APPENDIX C (Tables 1 and 11) SUTIlIarV of later Chemistry in Fxperirental Pools Castle Danger l07() 177
v
LIST OF TABLES CHAPTER PAGE
TABLE PACE
APPENDIX D (Mounting Media Instruction) 178 I A Comparison of Total Concentrations and
Component Carbon in a Variety ofAPPENDIX E (Checklist of Periphyton Organisms Found in Lake Freshwater Lakes bull bull bullbullbull 16Superior and Experimental Pools at Castle Danger
1969-1970) 179 II Average Chemical Characteristics of Great Lakes
Waters bull bull bull bull bull bull 25
III Chemical Analysis from Knife River - Larsmont Station 1958-1959 bull 26
IV Periphyton Organisms Observed in Lake Superior and Experimental Pools During the Samp) ing Periods of 1969 and 1970 Lake Superior - Castle Danger Minn (1969 1970) bull 55
V Total Counts of Naturally-Occurring Periphyton in Control Pool Lake Superior - Castle Danger Minn (1969) bull bull bull bull bull bull bull bull bull bull 63
VI Total Counts of Naturally-Occurring Periphyton in Test Pool Lake Superior Castle Danger Minn (1969) bull 64
2VII Pigment Concentrations [mg (MSPU) per 100 em rock
surface] of Naturally-Occurring Periphyton in Experimental Pools Lake Superior - Castl Daneer Minn (1969) 66
VIII Dry Weights of Naturally-Occurring Periphyton in Experimental Pools Castle Danger Lake Superior (1969) bull bull bull bull bull 72
IX Total Counts of Naturally-Occurring Periphyton in Control Pool Lake Superior - Castle Danger Minn (1970) R2
X Total Counts of Naturally-Occurring Periphyton in Tes t Pool Lake Superior Castle Danger l1i nn (1970) li3
XI Average Abundance and Population Magnitude of Predominant Genera Among Naturally-Occurring Periphyton in Experimental Pools Lake Superior - Castle Danger (1970) bull bull bull bull bull bull bull bull bull 88
v vii
TABLE PACE
ZIt Pigl1cnt COl1ccoctraticns [mil per IOO COl roclr surface] of aturally-Occurring Feriphyton ill
lmenral Pools Superior Castle Danfer nn (J 97[) bullbull
XIII llrv and Organic leight [mgcmshy rock surfacE Xatundlv-Occurring PeuroriphyLon in ExperinlC-ntl
LIke Superior - Cast Danger ~1inn (1970) bull J 12
X1 Total Counts Superi
Pgrm-th Periphyton in Contrnl Castle ltnn (1q7(middot)
Ponl
xv 1 Counts pf lake Superior
Regrorth -
Per i phvton Danger
in lest PD(ll (lq7 n) lUi
AVClage hundiHWe rredCl111ntnt
tJll in Castle Danger
and Popnlatinn 1agni l)cCurr as K()~rnrt
Pools L1k(1 SurclriclY
inn ( 97 1l ) I1q
XVIT Pli~pfgtnt Conepntrat if
surflcel R0~~ro~tt)
Pocl ~- 1 SUrH-rior
(~Sln per
q
WTII ilnd C1rgallic [nwcl1 rock surfa 1 () tli Ifriphv In-enta] PCHJ- 11k(
lor - asll j1angel 1t[nn (1 (17t) bullbullbull l
XIX AVEr~lle hcC-kJy (gtmperaturc Prcced i te Llkc Superi Castle
Laclt lil111 (117fl) lifJ
vi i 1
LIST OF FIGURES
FIGURE PACT
1 Western arm of Lake Superior showing the pas it i on of Castle Danger site of periphyton studies bull 2
2 Shoreline site at Castle Danger Minn it appeared before experimental pool construction lq6q bull ]0
3 Construc tion of forms in experimental pools l e Danger 1969 bullbullbullbullbullbull 30
4 Modified plan view of experimental pools a stJ e Ilaner 32
5 Experimental pools 011 the North ShoTe Superior shyCastle Danger Minn 1969
6 Capillary tube delivery rate studies Lake Superior Castle Danger Unn 311
7 Chemical feed technique used
8 Detailed IT3p of the shoreline in the Danger area MJ
9 Collection of rock samples from experLmuntal Castle Danger Lake Superior l f)
10 Proportioning pump used [or chemi doage Castle Danger Lake Superior 1970 17
11 Portable analyzer used for on-site nitrnte det~rmj tions at Castle Danger Lake Superior 1970
12 Naturally-occurring periphyton dry ts (per unit an1) in experimental pools tIe Dal1f(er Llt1ke S1l[Hrior 1969
13 Total counts of naturally-occurring perilhyton in expershyimental pools Castle Danger Tclke Superior 19119 bullbullbull
14 Naturally-occurring periphyton chlorophyll concentrations (per unit area) in control pool tIe Danger Lake Superior 1969 bull bull bull bull 67
15 Naturally-occurring periphyton chlorophylJ conccntrati (per unit area) in test pool Castle Danger Lake Superior 1969 bull bull bull bull bull
ix
FIGURE PAGE
16 periphyton total chlorophyll concentrations unit area) in experimental pools Castle Danger Lake Superior 1969 69
17 Naturally-occurring chlorophyll concenshytrations (per unit in experimental incubators at 100 foot candles and 5deg C June 1970 70
18 Naturally-occurring periphyton carotenoid concenshytrations (per unit area) in experimental pools Castle Danger Lake Superior 1969 70
19 Regression line counts versus chlorophyll naturallyshyoccurring periphyton control pool Castle Danger Lake Superior 1969 bull 73
20 Regression line counts versus chlorophyll natnral1yshyoccurring periphyton test pool Castle Danger Lake Superior 1969 bull 73
21 November Jrd Northeaster at Castle Danger Lake Superior 1970 78
22 DestJuction pump house following December 3rd 1970 Northeaster bull bull bull bull bull 78
23 Succession of algal groups as naturally-occurring periphytoll in t(st pool Castle Danger - Lake Superior ]970 bull 85
24 Naturally-occurring periphyton total counts (per unit area) in experimental pools Castle Danger - Lake Superior 1970 bull bull bull bull 86
25 Development of periphyton
26 Development of periphyton
27 Development of periphyton
28 Development of periphyton
29 Development of periphyton
in naturally-occurring Castle Danger - Lake Superior 1970 89
in naturally-occurring Castle Danger Lake Superior 1970 90
in naturally-occurring Castle Danger Lake Superior 1970 9]
in naturally-occurring Castle Danger - Lake Superior 1970 92
Castle Danger in naturally-occurring Lake Superior 1970 93
x
FIGURE
30 Development of 8aenedemmw periphyton Castle Danger
31 Development of periphyton Castle Danger
32 Development of UatorirI periphyton Cas tIe Danger
33 Seasonal succession of the
PAGE
in na tur a11 y-occurr ing - Lake Superior 1970 94
in naturally-occurring - Lake Superior 1970 95
in naturally-occurring - Lake Superior 1970 96
three most prominant genera natural growth test pool Castle Danger shyLake Superior (1970) bullbull 101
34 Naturally-occurring periphyton total chlorophy1l concentrations (per unit area) in experimental pools Castle Danger - Lake Superior (l970) lOS
35 Naturally-occurring periphyton chlorophyll pigment (per unit area) in experimental pools Castle Danger Lake Superior (1970) bull 106
36 Natually-occurring periphyton carotenoid concentrations (per unit area) in experimental pools Castle Danger Lake Superior (1970) 109
37 Regression line counts versus total chlorophyll naturally-occurring periphyton test pool Castle Danger - Lake Superior (1970) 110
38 Regression line counts versus total chlorophyll naturally-occurring periphyton control pool Castle Danger - Lake Superior (1970) 110
39 Dry and organic weights of naturally-occurring periphyton pools Castle Danger - Lake Superior
111
40 Regrowth periphyton total counts (per unit area) in experimental pools Castle Danger shy(1970) bullbullbullbullbullbull
41 Development of occurring as experimental pools Castle Danger shy(1970)
42 Development of Cymbe la occurring as experimental pools Castle Danger shy(1970) bullbullbullbullbullbullbullbullbullbullbullbull
xi
Lake Superior 117
regrowth in Lake Superior
120
regrowth in Lake Superior
121
FIGURE
i3 Developmen t of occurring as regrowth in experimental pools Castle Danger Lake Superior (1170)
44 Development of occurring as regrowth in experimental pools Castle Danger - Lake Superior (1970) bull bull bull bullbullbullbullbullbullbullbullbullbullbullbullbullbullbullbull
45 Development of occurrIng as regrowth in experimental pools Castle Danger Lake Superior (J 97(1) bull bull bull bull bull bull bull bull bull bull bull bull bull bull bull bull bull bullbull
Development occurring as regrowth in experirlcntal pools Castle Danger - Lake Superior (lQ70) bullbullbull bull bullbull
l 7 Succession of algal groups as regrowth periphyton In test pool Castle Danger Lake Superior (1970)
48 Regrowth perlphyton total chlorophyll concentrations (per 11nit arpa) expprimental pools Castle Danger - L~ke Supelior (197() bullbullbullbullbullbull
per iphytn chlorophyll pigment concentrntions tlnit~ arCa) in (gtxperimental p001 C(1stle
Danger Lake Superior (J 970) bull
50 Rklgressiou ine) count versus total chlorophyll ngrOlltth peri test pool Castle Danger LAke Superior
51 Regression 1 irw counts v(rsus total chlorophyll regrown iphyton cnntrol pool tIe nanger Lake Suoednr (197() bull
52 Regrowth 1(r iphyton carotenoid concenUatiolls (per unit area) ill (~xperimentLll pool Cslle nanger-Lake Superior (1970) bull
53 RegrOlvtil lwr iphyt(n weight (per nIl it arc) in experimen pool Castle Oanger - Lake Superior (1970) bull bull bull bull bull bull bull bull bull
5t RegrDlvth periphytn organic Heights (per unit area) in experimental pools Castle nanger - Lke Superior (1970) bull bull bull bull bull bull bull bull bull bull bull bull bull bull
x~i
PAGE
122
123
125
126
127
FICDIU
55 N1turCl11y-occurr rtriphyton versus regrcnrth periphvton total counts in test pool restle Danger - Lake Superior (1970)
56 NatlJrally-oc(urring per ipllytnl1 versus rcgroth peliphytll total C011I1 in control I CastlE nanger Laic Superior (1(170) bullbull
57 Hater temperature data Castle Danper Minn
July 19 Lake Supcr
SR Hater temperature data August 1970 Lake Superior - Cast Danger Htnn
59 ~ater temperature c1ata - Septemher Lake Superior - Castle Danger Minn
60 Hater tel1peraturc data - Octoher Novemher 1971 Lake Superior C~stle n~nger Minn
PAce
lifO
141
lid
14 ~)
146
130
bull 131
112
132
133
136
137
xiii
CHAPTER I
INTRODUCTION
In Lake Superior as in most lakes one of the first areas to be affected by man-made waste discharges is the near-shore region In this zone a prolific array of life exists characterized by fish immature insects zooplankton aquatic plants and attached algae Since attached algae (periphyton) along the shore are fixed to the rock structure and cannot move they are constantly washed by waves and water currents It is therefore logical that the composition of this algal community should reflect the quality of the water masses passing by A close monitoring of the periphyton ill therefore provide information relating to water quality and changes in water quality
In the literature some confusion exists over the precise meaning of periphyton Here the term periphyton follows the generally accepted definition proposed by Young in 1945 By periphyton is meant that assemblage of organisms growing upon free surfaces of submerged objects in water and covering them with a slimy coat It is that slippery brown or green layer usually found adhering to the surfaces of water plants wood stones or certain other objects il1lmersed in water and may gradually develop from a few tiny gelatinous plants to culminate in a wooly felted coat tha t may be slippery or crus ty Ii th can tained marl or sand Although pltriphyton defined in the above manner includes both plant and animals it is known that this community is composed mostly of plant material which is mainly algal in nature This investigation therefore deals only with the members of the periphyton belonging to the plant kingdom In a more restrictive sense only ep ilithic periphyton or periphyton growing on rocks was studied
In 1965 a five-year project was initiated to study the periphyton in western Lake Superior The overall project was aimed at the detershymination of the extent of periphyton growth in selected areas of Lake Superior the composition of periphyton growth in selected areas of Lake Superior the biota of periphyton mass in terms of animal and plant components the possihle interrelationships existing between the periphyton in relation to the typical productivity of water in the open lake the importance of changing seasons on the characteristics of the periphyton the principaJ changes ~Iich would take place in the periphyton when polluting naterials were introduced into the lake and the speed and the phases of growth demonstrated by periphyton in re-establishing itself on an artificially denuded area
Many of the above mentioned ohjectives have been fulfilled by Fox (1969) and Stokes (1969) One of the remaining objectives however which formed the bulk of this investiGation was the determination of changes which would take place in the periphyton when polluting materials were added to the lake To this end studies were directed to an isolated shore area near Castle Danger Minnesota (See Figure 1) where a controlled simulation of the lake environment was created
I
~-~ p-of- 0lt
v qlt 0
o I
Stohl lin t At
Figure I Western of Lake Super showing the ition of Castle Danger the site of periphyton studies
2
CHAPTER II
REVIEW OF THE LITERATURE
Prior to 1956 American researchers had paid little attention to periphyton Prescott (1956) in considering this point states that while the periphyton community should be of obvious concern to the ecologist and the limnologist the habitat and life history of the attached algae have been largely ignored A similar viewpoint was expressed in 1962 by Alena Sladeckova in her excellent review of the methodology involved in studying the periphyton She pointed out that while research was relatively impressive for the phytoplankton very little had been done with the periphyton community
The periphyton has been studied a little more extensively by European investigators however even here the studies have been limited when compared with the plankton and benthos Perhaps the reason for lack of research on periphyton is the great diversity of its community structure and the difficulties encountered in sampling
Significance of Periphyton
Basic productivity One of the most important aspects of periphyton is its significance in primary productivity of a body of water In a flowing water ecosystem as Grzenda and Brehmer (1960) pointed out periphyton is virtually the only primary producer In his studies of Lake Superior Stokes (1969) concluded that in the same general area periphyton may be five to six times more important in production than the plankton of the open water In his studies of Stony Point Bay Stokes found that the standing crop of periphyton was 555 tons or about 156 grams of dry weight per square meter This if converted to yield per acre would be 1400 pounds Similarly Odum in 1957 found the standing crop of attached algae in Silver Springs Florida to be 175 grams per square meter or 1560 pounds per acre of dry weight Westlake (1965) after reviewing many other pertinent studies concluded that the biomass of luxuriant periphyton usually will range from 100-500 grams of dry weight per square meter He feels quite strongly that the periphyton make an important contribution to overall productivity and must thereshyfore always be considered
Periphyton and the foci web Many scientists have recognized the importance of periphyton in the aquatic food web Cavanaugh and Tilden (1930) for example stated that the larva of the midge fly Tanytarsus dissimiZis relies entirely upon periphyton algae for food Knudson (1957) and Douglas (1958) in their ecological studies stated on the basis of gut contents that other aquatic insects such as caddisflies mayflies and stoneflies feed on periphyton algae and that a correlation exists between algal populations and the insect crop Other organisms
3
which feed on periphyton are fish (Neel 1968 Foerster and Schlichting 1965 Young 1945 and Bakus 1966) snails (Young 1945 Perkins 1958 and Castenholz 1961) amphipods or scuds (Marzolf 1965 and Rosin 1955) zooplankton such as copepods cladocerans and rotifers (Foerster and Schlichting 1965 Perkins 1958 Anderson 1958 Brook 1954 and Neel 1953) protozoa (Perkins 1958 Neel 1953 Brook 1952 and 1954) and enchinoderms (Lat-kum al 1967 and Lebour 1922)
Since constituents to components of the free
phytoplankton it hilS been suggested by some thilt ttl( periphyton community can be an important contributor to the phytoplankton Fritsch (1931) suggested that spores or of the plankton when not found in the open water probably existed at the bottom or in the littoral zone H~
helieved that the majority if not all of the typical constitutents of the pelagic plankton would be found at the bottom during tl1Pir period of absen~e Codward (1937) considering the possible origin of the plankton in Lake Windermere concluded on the basis of simple correlations that a considerable part of the plankton must in fact be recruited from the littoral region of that lake After four and one-half years of observations on Ahbots Pond and Priddy Pool in Sommersetshire Fngland Moss and Karim (1969) concluded that many species were introduced into the open water by disturbance of benthic habitats Since this logically can be related to the hydraulic forces which are applied the vork of llarnes and Topinka (1969) would seem to be pErtinent Depending on the substrate involved these investigators found that periphyton algae may be detached with varied amounts of force In working with the germlings of Fueus they found significant clifferencE~s and they have rated various substrates in reference to this detilchability factor
Many types of ptriphytic algile may as ty Palmer (1962) in his publication points out thut ordinarily a single algal cannot il reliable indicator of pollution Ins tead one should look a t the enti re phytopJ ankton community or group of species Many algal species have heen reported in the literature as species commonly found in tvater containing high concentrations of organic wastes Palmer (1962) has reviewed thE reports of more than fifty different workers and has compiled a pollution tolerant list totaling 500 species From this list ho has selected and published a tahulation of tIn forty-seven most important species Palmer (1969 1971) extended his compilatjon to ten tab1es listing additional species of algae in a ranked series of tolerances This infonnation vas based on the reports ot 165 authors Among the diatoms according to forty-iive Buthors Nitz8c~ia is one of the most resistant and tolerant of all Blum in discussing this species states that it is a bull eurytopic euryhaline eurythermic form which grows conspicuously in polluted water where it forms a rich brown surface layer on rocks of rapids as well as in quiet water on sbnJlotv silt hanks
4
It is often used as an indicator of polluted water although its ubiquitoustendencies permit it to grow throughout the entin gamut of water purityPhilipose (1960) stated that spp and
ulna ere favored by pollution A filamentous green alga tenue which usually is an attached form has been mentioned
by Blum (1957) Mackenthun et al (1960) and Palmer (1962 1969 1971) as an important pollution indicator Other reported indicator species are
~ a~ According to Ravera and Vollenweider (1968) and Blum
blue-green algae Z spp and indicative of an enriched environment
In the above references it should he remembered as Palmer and others have pointed out that a siTgle algal species should not be relied upon as a pollution indiciator Hany so-called pollution tolerant genera of algae also include species which are sensitive or intolerant to my type of enrichment Similarly within a species there may be strains or varieties which are intolerant For example Fjerdingstad (Palmer 1926) has found that there are two separate strains of tht species zonata on2 tolerant to pollution and the other a cleaner water type
Some
Studies on tll(1 occurrence distri shyas an important first step in any
overall ecological study For the past forty years many varied types of environments have heen studied for instance Ahdin in 1949 studied periphyton growing in the Aswan Reservoir in Egypt and hl 1950 Flint studied such growths in a British reservoir Tn flritain Brook (1954 1955) investigated the periphyton of slow sand filters in a ater-Horks plant In Iowa the periphyton of a stl1bilization pond was studied by Raschke (1970) Periphyton occurring in streams and rivers lws been studied by a great many European and American researchers Among these Douglas (1958) lutcher (1932a 1932b 1947) Jones (J949) and fllum (1957 1960) may be considered representative In lakes and ponds the periphyton has received attention by such investigiltors as Codward (1937) Fritsch (1931) Knudson (1957) Young (1945) Newcombe (1950) fox (1969)and Fox al (1969)
A great deal of information has factors which may influence the periphyton factors have included studies on the effect of light of water temperature of current velocity of dcpth ilnd of the nature of substrate on periphyton grmth The effect of light [WS
been investigated by such peorle as Godward (1937 Flint (1950) Brauner (1956 hitford (1968) Stokes (1969) and Stoves
5
ei (1970) Investigators who have concerned themselves with water temperature are Patrick (1948 1949) Wallace (1955) Bellis (1968) Brock (1967) Stockner (1968) Phinney (1965) Round (1960) Cairns (1956) and Stokes et aZ (1970) McIntire (19660) has studied currentshyvelocity effects in artificial laboratory streams whereas vihitford (1960) has carrieti such studies into the field Stokes (1969) Round (1961) Godward (1937) and Fox (1969) have examined the relation of water depth to periphyton production All of the physical factors mentioned above play an important role in determining the composition and population of a periphyton community
The influence of the chemical environment on discussed in a number of studies For exampJe Komorvasky Roa (1953) clnd hhipp1e and Parker (1902) have dIscussed in detail the importance of nitrates
diatoms Kevern and RaIL (1965) Round (1960) and Munawar (1970) have dEa1 t wi th other chemical factors stlch as phosphates s iJ icates and potassium
Some investigators believe that the overall growth characteristics or iphyton Duuglas (19Sg) suggested thDt one of the factors controlling the popul1tion in small stream was
hy various types of insect larvae Larkllltl and his associates (1967) til their studies of undenlater vcmiddottieill cliff in Halta feJt that grad by echinoderms 1lt1 pI 1 account for the reduced biomass ot th( perilhyton on that cJiff On the Or1go11 coast Castenholz (196]) ohsErved that other marine organisms such as the littorines and Jimpets heLl the cpt] ithic diatom populiltlon ill check Jhen grazers ere removed and excluded r ] givpn ~rea diatom slicks developed on the rock subs tra te wi thill UfO or three Jeeb in 8reas previollsly d ia tom-f ree Brook (1952) ohserving that protozoa fed on tlw bottom-living algae of J slow-sand fU ter concluded t]lt the periodicity of diatom numbers could indeed he af f ectpd by grad ng
Round (1960) suggests that in a periplryton community there may be an interaction or competition between sped o[ the gronp and between species of different groups He suggests that competition for nutrients 11H] l)e factor of ome importance since the larger species with a slower rate of division will not reacll high numhers hefore nutrients an depleted This plobahly accounts for the preponderance fliUlfehia over
and over a
It is generally agrpec1 that in an enriched hody of water there will be fewer typcs of sped but grEater numbers of individuals In contrast a cipan body of water vould llave many diverse spfccies but only a small nUlrher of individuals Yount (1956) in his investigation of the attached diotoms in Silver Springs florida found thot the above contention holds true fo the periphyton as 1 as for the plrmkton and the benthos
6
The annual succession of periphyton has been studied by several workers several of whom have been cited earlier Brook (1955) for instance studied the succession and colonization of attached algae on glass slides placed in the slow sand filters of water-works Flint (1950) studying the periodicity of phytoplankton and periphyton in a British water reservoir was able to specifically relate algal periodicity to phosphate and nitrate levels In Lake Windermere Godward (1937) investigated the periodicity of littoral algae over a period of three years while Douglas (1958) studying a small English stream similarly carried out studies on periodicity of attached diatoms over a four-year period In this country Castenholz (1960) in a two year study observed seasonal changes and periodicity of the attached algae of freshwater and saline lakes in the lower Grand Coulee Using an artificial stream Kevern and Ball (1965) studied the successive changes which took place in periphyton under controlled laboratory conditions
Some investigators have been more specific in that they have followed the seasonal succession of an individual species Knudson (1957) for example carefully followed the succession of the diatom fZoaaulosa in an English lake Hunawar (1970) noted in particular the development and succession of Chlamydomonas spp and Saenedesmus spp in two freshwater ponds in India
Nany investigators who have studied phytoplankton refer to the spring and autumn maxima phenomenon Periphyton as pointed out by Round (1953) also demonstrates the same spring-autumn maxima
In dealing with the ecology of any organism or group of organisms it is essential that the identity of each organism is known Many investigators have simply concerned themselves with the establishment mataxonomic list of the locale studied Several new species of river periphyton were described by Butcher (1932c) after he suspended glass slides in six English rivers for a month Other scientists such as Godward (1937) Douglas (1958) and Stockner and Armstrong (1971) have compiled detailed toxonomic lists of the respective areas which they studied Brock (1968) discusses the taxonomic confusion which exists among certain filamentous blue-green algae Fox (1969) reported on the species of periphyton that occurred as regrowth on natural rocks placed in the western end of Lake Superior In addition to his taxonomic work he also determined the biomass and total numbers characterizing the accumulated growth Taxonomic lists such as those compiled by the above mentioned investigators serve as a valuable aid in the overall ecological characteristics of the periphytoncommunity
Sampling Techniques
Periphyton removal Unlike phytoplankton periphyton is difficult to quantitate and as a result most of the inVestigations have been qualitative in nature In such studies investigators have simply scraped
7
or pulled the periphyton off the substrate and have examined it under a microscope Where quantitative studies have been made periphyton has ordinarily been collected from a known surface area of either a natural or an artificial substratum and subjected to one or more of the following procedures 1) volume determination 2) gravimetric analysis 3) direct enumeration 4) pigment determination and 5) carbon fixation potential
Several unique methods for the removal of periphyton have been employed Young (1945) quantitatively sampled bulrush stems and stones by firmly pressing a sharp edged square hollow instrument of known area against the objects on which the growth occurred The surfaces outside the square were then scraped free of periphyton leaving only the known area covered with growth and ready to be transferred to a collecting bottle Foerster and Schlichting (1965) removed leaves from the submerged plants of lallisneria Myriophyllum jarvelZIi and sp The leaves covered with epiphytes were placed in screw-top jars and periphyton was washed from the leaves by agitation The surface area of each leaf was then determined Knudson (1957) collected periphyton samples by cutting the stems of various submerged aquatic plants into ten-centimeter lengths Periphyton growth on these sections was removed and examined with an inverted microscope Neel (1968) in his studies of periphyton on large rocks used a rectangular brass frame to enclose a three square inch area from which he then either scraped or pulled the periphyton Claflin (1958) studying a reservoir in South Dakota removed periphyton from the submerged trees by pruning the branches and twigs The cuttings were then placed in jars of filtered water Tn the laborashytory the surface growth was removed and total counts of organisms and pigment analyses were related back to the surface area of each twig In a riffle of the West Gallatin River Montana Gumtow (1955) using a brass ring to delineate a one square centimeter area removed the periphyton with a scalpel Douglas (1958) using a modification of the same procedure scraped the periphyton directly from the area delimited by her sampling apparatus in this case a bottomless polyethylene bottle A very unique method was employed by Margalef (1948) to remOve periphyton from stones After first preserving the rock in fonlalin and staining it he simply coated a periphyton-covered rock with dissolved collodion After the collodian had dried it was peeled off monnted in balsam and examined microscopically Margalef states til] t a good image of the stone surface including all of the epilithic vegetation was obtained by this procedure Fox (1969) and Stokes (1969) removed periphyton from rocks by scrubbing off the growth with a short bristled brush The results obtained in analyses of the slurry which was obtained were subsequently related to the surface area of the rock covered by periphyton growth
Rather than removing the periphyton growth from ts some investigators have made direct observations by placing the periphyton-covered object directly on a stereoscopic microshyscope stage Tn some cases natural substrate may be viewed directly Ordinarily t11is method is used with a transparent artifIcial substrate
8
such as a microscope slide or flat pieces of cellulose or plexiglass Sladeckova (1962) describes amos t in teres ting direc t method for examination and quantitation It is the method of Rehbronn (1937) According to Sladeckova the procedure is as follows Plants with thin layered and transparent l(aves such as Elodea canadens-[J are placed directly under the microscope When such a leaf contains so many chloroplasts that it is not perfectly transparent the technique of Rehbronn can be applied In proceeding with this method bull the cleaned side of the leaf is dipped carefully into a solution of chloral hydrate as long as necessary for chlorophyll extraction Then direct counting of the epiphyton becomes easy Little leaves can be examined over thd r total area larger leaves are usually observed tlrrough an auxiliary glass slide provided with ruled or engraved grids or with the help of ocular micrometers bullbullbull
In the majority of periphyton is usually used The
types of substrate are varied depending upon the investigators needs and the sampling locale Artificial materials offer fin advantage in that
are easy to use and manipulate and also that one can use predetermine( uniform surface areas One of the most common forms of artificial
substrate is glass in the form of a microscope slide These slides may be placed in simple plastic or wood frames and suspended in the water at any desired place Bissonette (1930) who was interested in collecting bryozoans is usually credited as being the first to devise a glass slidE rack that could be suspended in water From his original concept have come many variations and revisions Smyth (1955) for example secured five to eight 3 x 1 slides together in a wooden template The rack was fitted with a wire handle allowing the device to be lowered to the bottom A cork was then used to buoy a line attached to the handle Patrick and her associates (1954) utilized a device known as a cliatometer to support the glass slides they used in their periphyton studies This instrument was designed to float at any depth desired Reynolds (]950) used submerged glass slides as a means for collecting algae to culture an agar Flint (1950) fitted glass slides to metallic photographic frames te study periphyton of a British water reservoir Other investi gators vho have used the glass slide method are Godward (1937) Butcher (1947) Jolly and Chapman (1966) Aleem (1958) Whitford (1956) Yount (1956) and Castenho] (1960)
Another transparent material utilized by some yorkers is plexiglass Aleem (1958) used plexig1ass mounted in a frame to study the succession of marine fouling organisms at La Jolla California Crzenda and Brehmer (1960) also used this material in their studies of periphyton populations in the Red Cedar River in Michigan They attached two plates of plexiglass to a horizontal crossbar which was supported by a vertical post driven into the stream bottom Jackson (1967) used plexishyglass to study in Lake Ontario while Whi tford (1956) used this type of substrate collecting periphyton in a Florida spring
9
A variety of other artificial substrates have been utilized McConnel and Sigler (1959) in their studies on the Logan River in Utah utilized concrete blocks as a substratum In a similar fashion Waters (1960) used concrete cylinders to study periphyton in a small creek in Minnesota Asbestos shingles were sed by Fuller in 1946 during the course of his studies on the role of marine periphyton as a ship fouling factor Inaddition marine fouling organisms were also studied in La Jolla California by Aleem (1958) In his work he used a variety of substrates including wood vinyl acetate brass zinc stainless steel and copper These he ranked according to their relative suitability Beers and his colleagues (1968) produced a new type of growth support by pouring two coats of boiling paraffin over a concrete substrate The coated block was then exposed in the stream being studied After sufficient colonization the paraffin coating along with its attached periphyton was removed and plant pigments were extracted According to Abdin (1949) Hentschel used ping-pong balls and pieces of celluloid as early as 1916
Artificial substrate has a distinct disadvantage in that certain materials may be selective or restrictive to certain types of algae For instance Foerster and Schlichting (1965) observed that growth on glass slides tended to give a false indication of the genera since only certain types of algae seemed to attach to it Sladeckova (1962) states bull for some organisms mostly blue-green algae glass is not a very acceptable substratum Hohn and Hellerman (1963) in are-evaluation of Patricks diatometer found that organisms growing on the glass slides were different from the population of organisms growing on the styrofoam float The also found that when water temperatures were below sixteen degrees centigrade diatoms did not grow and adhere as well to the glass slides as they did to the styrofoam Flemer (1969) in discussing what he terms a significant error in chlorophyll am lysis states that this problem is especially likely to occur when a solid substrate such as a glass slide is used
Natural materials procured from the body of water are recommended and utilized by some investigators Godward (1937) for example removed periphyton-covered stones from Lake Windermere for the purpose of identifying their characteristic growth Similarly Jolly and Chapman (1966) removed natural rock in a small creek in New South Wales for periphyton analyses In his study of the colonization of periphyton Blum (1957) placed sterilized stones in a small stream the Saline River Michigan All of the above studies were qualitative in nature however McConnell and Sigler (1959) extended the use of natural rock to a quantitative study of periphyton chlorophyll productivity in the Logan River Utah Fox (1969) and Stokes (1969) used a more refined natural rock technique in their comprehensive quantitative studies of the periphyton of western Lake Superior Stockner and Armstrong (1971) quantitatively sampled the periphyton occurring on natlral rocks in an Ontario lake In their method which was somewhat different from that used by Fox and Stokes periphyton growth was removed from only a small portion of the rock
10
guantitative measurements A number of parameters may be used for the quantitation of periphyton growing either on artificial or natural substrata A method commonly employed involves counting and identifying the individual members of the periphyton community under a microscope The count obtained in this manner may then be related back to the specific surface area of the substratum covered by the growth While this method does give the investigator a good picture of the species or the types of organisms involved as well as an idea of the physiological condition of the growth as a whole it is extremely laborious and time-consuming In his studies on the taxonomy and distribution of Lake Superior periphyton Fox (1969) relied almost exclusively on the enumeration method
When time is a limiting factor many investigators have resorted to less demanding and less time consuming quantitative procedures In such procedures some general attribute of the periphyton sample is measured rather than counting individuals within categories Thus if volume or weight is to be used as a parameter the biomass is determined in terms of milligrams or milliliters and related to the area covered by the growth Biomass may be measured as wet weight dry weight or ash-free dry weight Investigators such as Castenholz (1960) Kevern and Ball (1965) Stokes (1969) and Fox (1969) have used this procedure
Another type of quantitation involves the measurement of carbon fixa tion by photosynthesis This can be determined by measuring oxygen evolution during the photosynthesis process The Gilson differential respirometer was utilized by McIntire (1966b) to evaluate factors which affected periphyton respiration in a laboratory stream Since he also determined the ash-free dry weight of the priphyton he was ab] e to express his results as the rate of respiration per unit of organic weight Stokes (1969) using the same method correlated depth light intensity and water temperature and the role these factors play in photosynthesis of Lake Superior periphyton
Pigment analysis has long been recognized as a fast and conventional procedure for estimating the standing crop of plankton The original spectrophotometric method was proposed by Richards and Thompson (1952) They stated that chlorophyll and carotenoid pigments should yield (a) a measure of the potential of the plankton for absorbing radIant energy for photosynthesis (b) some measure of the extent and stage of development of the phytoplankton and (c) a pOssible measure of the presence of animals grazing on the crop Since members of the various phyla contain different ratios of chlorophylls a b and c varying concentrations of these chlorophyl1s will also reflect-to a certain degcee the composition of an algal community The method although originally proposed for phytoplankton is just as applicable to the periphyton community and can therefore be used to determine the standing crop of this assembly of organisms Stokes (1969) made extensive use of this method in his work on Lake Superior
11
In any plankton or periphyton analysis a measur3hle quantity of pigments other than the chloropbylls w111 usually be found Tbese pigments lre ordinarily desiGnated as astacin and ncn-astacin carotenoids The involvement of these accessory pigments in energy transfer during photosynthesis has been by Chance and Sagar (1957) They showed that a mutant of ~inho~~tii can carrv out photosynshythesis wIthout any evidence participation of carotenoids Dutton and Ilanning (1941) based on their work with 11 tsch~a take the opposite view inasmuch as they found that fucoxanthin the main carotenoid 0f ~rown algae was just as efficient in as chlor()phyll Tanada (1951) Ierking Iith this effectiveness of fucoxanthin EmerSln (1l5P) who hRd previously questioned the iuportance of carotenoids eventually ccmiddotncluder that efficient photosynthesis could not be achieved in organisms lacking these accessory pigments Tn iscussing productivity measurements Stokes (1)69) suhscrihes to this viewpoint hy suggesting that in pigment measurements the carotenoid must be included
Alrouih simple satis actory onp finds as Stokes (1969) has so aptly it ons of standinR crop of perjphyron producers hy uant tative rrtHsurtments of chlorophyll ccntent hove befm measer Yount (l in his studies on diatoms of Florida strcam used ch10ro1h)11 lles tairHd fron periphyton accumulations on gJ1BS slide as an index 0 productivl tv Crzendil and Brphmer (lQ(iO) collected peTiphyton em p10xiglass pIaUS an(1 quantitated chlorophyll aters (1960) determined the pigment concentration of periphyton gromiddoting on concrete cylinders hlcli had heen exposed ill a smilll creek in ~1innesota Dutter and Doris (IQ66) did n inllar study in tho Blue Riv~r of Ohlahoma In Japan Ho~ etsll and I chimun (195) remolJed per i phyton from tandeHd areas of reck snrf1cls and enacted the chlorophyll Ilso in Tapan Kobayasi (1961) found linear corrclaticn hcUeen cell numhers and chlorophyll content of sessile 81gae on rocks in a river In the l~gan River in Ctah gt1ltConnll nnd Sigler 1959) in measuring tllC chlorophyll content of the attached algal found thelt the average chlorophyll quantit per square meter hot tc be 030 grams Other investipators who bwe felt tlat pigment analysiS WClS important and have included it in their studies are McIntire anrl rhinney (1965) ~ln used it in their laboratory streams anel (1969) determined the chloropbyll ontent of epjpe 1ic a 1 gaC n t-o SOTIlerseLshi rc pools in r~ngland Dur ing the course of his study on Superior periphyton Stokes (1969) not only measured the total chlnrophyl1 hut deatl quit specifically Jjth all or
carctenolds Chlorophyll pi ~ments were quantitate( 1v lise 01 1 Beckman Dk-2A Rat to Recording Spectrophotometer
Research(rs ]ve long ealized that algal pHcil1ctlvity in a body of Hater may J great Iv enhanced when certain chemicals arr increased through either natural or man-made pllution However in order to adequately
12
understand the relationship between water fertiHty and algal productivity one must know hat chemicals are important To this end early workers such as Chu (1942 1943) Rodbe (1948) and Gerloff t 0 7 bull (1950) have examined through laboratory studies the importance of various chemical elements in algal nutrition and in each instance have determined thE range of concentrations which might be considered essential to optimum growth
Although nearly all of the investigations concerning algal nutrition have dealt i th studies on phytoplankton it may logically be assumed that results of such work also can be related to the periphyton algaE
Of all the nutrients required hy most attention are phosphorus and nitrogen In his Ii terature review on phytoplankton ecology Lund (1965) concluded that litrogen and phosphorus can still be considered as two of tlle major elements limiting primary production In some tropical and highly eutrophic temperate lakes nitrogen may be a mon important linliting factor than phosphorus In many other lakes phosphorus is present in very low concentrations and seems to be the major factor limiting production Thus if a body of water receives excessive amounts of nitrogen and phosphorus a general state of eutrophicotion may eventually be expected
In an aquatic system phosphorus occurs in three forms incrganic phosphorus particulate organic phosphorus and dissolved organic phosphorus According to Korrnomly (1969) the inorganic phosphorus is typically orthophosphate (P0 ) which is generally thE form preferrec1 by
4plants Particulate organic phosphnte is that which occurs in suspension in living and dead protoplasm whereas the dissolved or soluble organic pbosphorus is that portion derived from the particulilte motter by excretion and decomposition The total phosphorus includes all thr~e categories The varying states of phosphorus and the differing terminologies used has led to some confusion in academic circles Mackenthun (1967) in attempting to simplify the matter has compiled all Known phosphorus terminologies and has carefully delineated each term so that the exact meaning will be clear to practical workers in the field
Inorganic sources 0t nitrogen in a of water usualy occur in the form of amm()nium (NH ) nitrate and nitrite (-0)4Investigators such as Chu (1942 1943) (1948) and Ryther (1954) have found that algae readily absorb ammonia and nitrate however they conclude that only a limited number of algal species can assimilate nitrite Elemental nitrogen (N ) can he used by certain species of algae2only Many of tbe blue-green algae are of doing this
Since nitrogen and phosphorus often are considered the most important plant nutrients the question of what their crItical concenshytrations in natural waters may be is an important issue According to Lee (1970) it is possible to contTol the degree of eutrophication by
13
the expedient of keeping the nutrients below a critical level Sawyer 1947) proposed certain critical concentrations of nitrogen and phosphorus which would be limiting These levels are probably the best general estimates available today In his studies of Wisconsin lakes he found that when the inorganic nitrogen content of the water at the beginning of the growing season equalled or was greater than 03 mgl and the orthophosphate content was equal to or greater than 001 mgl P then the lake was likely to have excessive crops of algae and other aquatic plants In a study of several Bavarian Alp lakes Hamm (1969) found that waters with levels above 002 mgl P were eutrophic and those below 001 mgl P were oligotrophic His findings therefore correlate closely with Sawyers original estimate The work of McKee and Wolf (1963) likewise lend support to Sawyers figures They found that in general when the phosphorus content was kept below 001 mgl nuisance algal blooms would not develop
While the critical nutrient levels proposed by Sawyer are very useful in solving eutrophication problems it must be remembered that other factors often playa role Addressing himself to this point Lee (1970) sugges~that (1) Productivity depends on other nutrient factors besides nitrogen and phosphorus (2) Nitrogen and phosphorus have influences which may be different depending upon the time of the year (3) the stoichiometric concentrations of some of the primary elements in algae vary within fairly wide limits (4) Some algae have specific phosphorus and nitrogen requirements which are markedly different from those of other algae and that (5) Sawyers phosphorus value fails to take into account all of the factors which are involved in the complex aqueous environmental chemistry of phosphorus
Because of the volt~inous literature and the stress placed on nitrogen and phosphorus it is often easy to overlook the importance of other macronutrients Eyster (1964) in discussing macronutrients lists carbon hydrogen sulfur potassium magnesium calCium and sodium as representative this category of nutrients Although Lee (1970) stated that the above elements are generally present in sufficient quantity there are several workers who now feel that carbon can be limiting and this nutrient has therefore been given increasing attention According to King (1970) carbon may be present in water as free carbonic acid bicarbonate ion or monocarbonate ion The various of carbon are linked together in accordance with a well known equilibrium reaction and changes in the amounts of each may be reflected in the hydrogen ion concentration (pH) The average ratio of CNP atoms in an aquatic system as mentioned by Stumm and Morgan (1962) is 106161 There are some investigators namely Lange (1970) and Kuentzel (1969) who feel that carbon may be more of a limiting factor to excessive algal growth than phosphorus or nitrogen Kuentzel in particular cites examples where certain large lakes containing more than 001 mg1 soluble P but relatively small amounts of carbon did not as might be expected develop algal problems On the other hand he mentions lakes characterized by high carbon and a very low P laquo001 mgl) which produced massive blooms
14
of algae In essence he has concluded that unless carbon is controlled it is fruitless to be concerned with other nutrients such as phosphorus Investigators such as Shapiro (1970) and Schindler (1971) strongly disagree with this conclusion Shapiro for example states that Kuentzels examples relating excessive algal growths directly to high carbon and inversely to phosphorus levels are meaningless Shapiro explains quite simply that when algae grow they take up phosphorus and when they do not grow they do not take up phosphorus Hence water around the organisms during the period of a heavy bloom may be expected to contain no phosphorus or very low levels of phosphorus because this nutrient has been incorporated into the existing algal mass He concludes that bull if any relationship at all exists between the abundance of algae and the concentration of soluble phosphorus at the same moment it will be an inverse relationship Thus it is clear that Shapiro remains firm in his conviction that the removal of phosphorus alone will slow down the eutrophication process
After conducting fertilization experiments in an Ontario lake Schindler (1971) also concluded that in almost any situation carbon is unlikely to limit the standing crop of phytoplankton He points out that in Lake 227 which had been enriched by additions of nitrate and phosphate a distinct and lasting bloom was produced even though the carbon content of the water was low Apparently Lake 227 belongs to a group of small lakes which exhibit bull total CO concentrations lower than any previously reported group of natural lakes in the world bullbullbull (See Table I)
During a two week period of intensive experiments in August 1970 Schindler calculated that the carbon dioxide invasion from the atmosphere into the epilimnion of Lake 227 was 216 mg cO
2-Clm2day In summing up
Schindler stated It is clear from the data presented here that addition of nitrogen and phosphorus can produce dense standing crops of phytoplankton even when CO2 concentrations are low enough to temporarily limit primary production With regard to Lake 227 he states further If the carbon supply in Lake 227 is sufficient to produce and maintain a phytoplankton standing crop of eutrophic proportions it seems unlikely to be responsible for increased algal abundance in the St Lawrence Great Lakes or in any other body of freshwater
Certain inorganic elements have been referred to as micronutrients because they are utilized by in very minute quantities These elements according to Sawyer and Eyster (1964) are iron manganese copper zinc molybdenum vanadium boron chloride cobalt and silicon
Mackenthun (1967) states that manganese is one of the key elements in photosynthesis and that manganese-deficient cells may be expected to have a smaller amount of chlorophyll and a reduced level of photosynthesis Iron according to Goldman (1969) may be considered as much a macro- as a
15
A comparison of total C02 concentrations and componentTable 1 carbon species in a variety of freshwater lakes (From Schindler 1971)
Gaseous CO 2+ C0 = pH
3
0025 0017 0000004 00077 1003Lake 227
b C101 0089 0016 0000051 710Lake 239
00079 802Lake Eriec 185 180 0011
d 0013 0027 851Lake Ontario 193 189
Fayet tevi 1] e Creen Lake NY (marl)e 1 78 171 0022 0011 827
Averafe 099 096 0023 0001 8
Pil carbon data are in millimolesliter Values are for midsummer
(ekcept for world averaee freshwater) and corrected to 20C 2C02 = llCO- + + C03=
ELA lake Schindler unpublished data 1969
1969 unpublished data Note the similarity in all C02
fractions to Lakes Erie and Ontario The precipitation of CaC03 in Creen Lake appears to be duE to the higher concentration of cajLc~u[~ and higher total ionic stnngth
LIVIngston 1963 gAssllmed value
micronutrient It is important in algal photosynthesis and in nitrogen metabolisnl Arnon (1958) states thnt chloride is a coenzyme of photoshysynthesis and that it is specifically concerned with oxygen evolution Zinc and vanadium according to Goldman (1969) and Mackenthun (1967) are needed for photosynthesis and in carbon assimilation Mackenthun (17) reported that nitrate utllizaticn and nitrogen fixation may be dependent on the presence of boron and molybdenum Holm-Hansen (1954) and his CO-Iorkers showed that cobalt is required by blue-green algae Goldman (lq69) supplemented this statement by adding that cobalt is associated with the nutritional functions of vitamin Last but certainly not least in importance is silicon In where diatom
populations predominate silicon may well become a limiting factor according to Kilham (1971) and Schelske and Stoermer (1971) The latter investigators have stated that the limiting concentration for silicon dioxide in natural water is 01 mgl In their studies of Lake Michigan they concluded that silicon depletion can be attributed to phosphorus pollution and that for this reason diatoms have been largely replaced during summer stagnation by blue-green algae The investigators explained by stating that increased phosphorus brought about extensive diatom blooms which stripped the water of its silica When this happens biological competition is reduced and the blue-green algae which do not require silica grow profusely
Sources of nutrients Sewage effluent is one of the principal sources of nutrients In a study of twelve separate sewage sources Rudolfs (1947) concluded that the annual per capita contribution of phosphorus (P) from this source ranged from 06 to 15 pounds In the Madison Wisconsin area in 1960 the annual per capita contribution of nutrients by sewage effluent after secondary treatment amounted to 85 pounds of inorganic nitrogen and 35 pounds of soluble phosphorus (P) (Mackenthun et al 1960) The population of the area was 135000
Bush and Mulford (1954) investigating the nutrient values of domestic sewage in fifteen California communities found that nitrogen ranged from 20 to 40 mgl whereas phosphorus ranged from 53 to 106 rngfl Engelbrecht and Morgan (1959) in their study of the effluents of three tricking filter sewage treatment plants and one activated sludge plant in Illinois found that the mean orthophosphate concentration ranged from 51 to 106 mgl P and that the annual per capita contributions of phosphorus ranged from 15 to 39 pounds Oswald (1960) stated that the elementary chemical composition of average domestic sewage is 613 total nitrogen (N) and 107 mgl phosphorus
Other nutrients in a body of water may originate from agricultural and urban runoff (Lackey and Sawyer 1945 Sylvester 1960 Smith 1959 Engelbrecht and Morgan 1961 and Sawyer 1947) preCipitation on lake surface (Hutchinson 1957 McKee 1962 Lee 1970 and Voigt 1960) ground water (Juday and Birge 1931 and Lee 1970) nitrogen fixation (Lee 1970) release from bottom sediments (Hasler 1957 and Lee 1970) and waterfowl (Sanderson 1953 and Sylvester and Anderson 1964)
Although a great deal of work involving algal nutrition has been performed in the controlled environment of a laboratory the fact remains that when an alga is studied under natural field conditions a truer picture of its growth potential may be obtained Field studies may simply involve observations of algal populations which develop in waters enriched as a result of mans activities or the addition of
17
16
nutrients to containers tanks or pools which have been filled with water from the immediate area or the addition of fertilizers to natural bodies of water such as streams lakes reservoirs and lochs The objective in each instance being an evaluation of the eutrophication process
This method is an excellent one if a reliable body available to provide a good baseline which shows what the condition of the water was before pollution began For instance the addition of sewage to a previously clean river or lake offers a good opportunity for the effect of eutrophication Butcher (1947) used this method in his studies of the attached algae in four polluted rivers in England Only a short time earlier these streams had been unpolluted He noted that as one proceeded downstream repurification took place and that this was accompanied by the development of a succession of different communities of algae For example Stgeoclonium typical of the polysaprobic zone Ni tzschia and of the mesosaprobic zone and (occoneis pZacentula spp of the oligosaprobic portion of the stream
Mackenthun and his colleagues (1960) studied the effect of diverting sewage from a city lake to a nearby stream Following this diversion the previously unpolluted stream became literally choked with long streamers of Stlgeoclonium and Rhizoc7(1r1ium The intertwined filaments formed long streamers that in some instances were estimated to be fifty feet in length They also found that Chci llatoria covered the bottom of the stream in its upper reaches I t was concluded that severe stream degradation observed was a result of the diverted sewage The effect of sewage effluent in the Potomac estuary has been evaluated and described by Shapiro and Ribeiro (1965) They fonnd that sewage additions greatly increased the growth of green and blue-green algae
A body of water is in a constant state of aging which eventually will lead to greater and greater eutrophication Left untouched by man this process may go on for decades or centuries before the uninitiated detect the changes which have occurred However in a number of instances as a result of the activities of man such a change may proceed very rapidly and a previously oligotrophic lake may in a relatively short time become highly eutrophic A classic example described by Hasler (1947) is that of Lake Zurich in Switzerland In this lake there are two basins the Obsersee and Untersee which are separated by a narrow channel In less than 100 years the Untersee a deep and originally oligotrophic lake has become strongly eutrophic as a result of domestic pollution while the Obsersee has remained oligotrophic The eutrophishycation of the Untersee is clearly reflected by changes in the type and quantity of phytoplankton In the state of Washington Edmondson and his associates (1956 1961 1968) also have observed an advancing eutroshyphication In their work on Lake Washington studies in 1933 and 1950 showed the dominant algal forms were diatoms The lake at that time was considered to be oligotrophic In the mid-fifties however
11)
domestic sewage began flowing into the lake Since that time algal populations have shifted to more undesirable and eutrophic types of organisms such as the blue-green algae Oscillatoria rubescens is a species which has been reported as being very abundant
Even in the pristine waters of Lake Tahoe small signs of eutrophication have already been noted Smith and Ludwig and Smith (1968) have reported localized blooms of and Ulothrix in Lake Tahoe while Goldman and Armstrong during the past few years what they consider to be the first signs of eutrOphication The evidence for this was an observed increase in growths of littoral periphyton in which the predominating species was a diatom constrctum Var capitatum
The deterioration of Lake Erie has been followed by many inVestigators throughout the years Casper (1965 for instance has noted from past data and from his own that shifts have taken place in the dominant algal genera--from diatoms to greens to blue-greens Beeton (1965) found that the dominant plankters were Aphaniaomenon and MampeIOCUA~ All of these are indicators of eutrophic conditions The has also responded to increased enrichment According to Herbst (1969) and Neil and Owen (1964) this is demonstrated by the great proliferation of which is now seen in great masses along theshoreline
Artificial enrichment experiments Many studies have been reported upon wherein various kinds of nutrients have been added to waters held in artificial containers or directly to the natural environment itself Here again most of the studies deal with the effect of the enrichment on phytoplankton In contrast relatively little work has been done with periphyton in experimental field situations
One of the simpler outdoor enrichment experiments phytoplankton was carried out by Ansell and his They used fifteen-liter battery jars filled with water and a known amount of and phosphorus to grow Phaeodaetylum The jars placed on the of a building were exposed to natural light At selected intervals samples from each jar were analyzed for chlorophyll and total cell counts were made Abbott (1967 1969) in his investigation of the bloom potential of phytoplankton in estuarine waters enriched with N03 and used nineteen-liter carboys He concluded that in such waters elements must have been l~liting since he found no excessive blooms or oxygen production
Outdoor tanks or containers of varying sizes have also been employedin
studies In Dorset England Ansell and associates(1963b) used 1000 liter steel tanks which were centimeters deepThese tanks
were covered with polythene to prevent contaminationby dust and dilution by rainwater Edmondson 1947) impounded
19
seawater in tanks and then artificially enriched the water with phosphorus and nitrogen to note the effect of these additions on the algal population Skulberg (1968) utilized outdoor tanks in his enrichment experiments His results indicated that it was necessary to add botb N03 and P04 to the Akershus River water he was using in his experiments in order to significantly increase the biomass Strickland and his co-workers (1969) used outdoor tanks to study the composition of marine phytoplankton crops at low nutrient levels The tanks were three meters in diameter and ten meters deep An artificial light source was used
Near the Tuttle Creek Reservoir in Kansas Ewing and Dorris (1970) nine artificial ponds each having an area of 034 hectares The ponds lined with black polyethylene were filled with
Iater from a nearby lagoon Each pond was subjected to various combinations of organic enrichment Their findings were that under the conditions of this experiment chlorophytes predominated
Outdoor aquariums have also been used Kott (1968) using such aquariums aml a citrus waste effluent substrate to which he had added Fertilizers found that nitrate or phosphate by itself did not stimulate growth however the combination of the two good growth response llis optimal growths were ohtained at 50 N03 and 20 mgl P04 Concentrations greater than these brought about a reduction of the phytoplankton
The above methods exemplified by the impounding of water in artificial tanks has been criticized by McAllister et (1961) They contend that due to the shallowness of most tanks the lighting is unrealistic and usually undesirable temperature increases will occur Furthermore according to them no precise balance of dissolved oxygen or ca rbon dioxide can be readily computed because suci a large surface area of water is in contact with the atmosphere To overcome these difficulties NcAllister and his co-workers devised a free-floating thin plastic sphere twenty feet in diameter The sphere placed in the waters off of Vancouver Ioland was sllspended so that its center was 55 meters beneath the sea surface A long narrow neck extending to the surface of the water from this large bag served as an opening through which samples could be taken Their studies showed that water in the sphere closely approximated that of the surrounding sea water both in temperature and in illumination No artificial sources of fertilizer were used however to remove metabolites and to replenish nutrients water from the immediate environment outside the sphere was pumped into the bag after a filtration process which rmnoved its phytoplankton and zooplankton A culture of coastal phytoshyplankton was inoculated into the sphere in order to seed it and the resulting growth patterns were then followed
Another fertilization experiment employing three large plastic
20
pools which were floated in a lake has heen reported upon hy Brice and Powers (1969) In this study carried out on Shagawa Lake near Ely Minnesota various mixtures of domestic sewagp effluent were pUDped continuously into two of the pools the third which received only lake and municipal water served as a control Each of the pools had a capacity of 135000 gallons (510 m3) Influent was supplied to each at the rate of seventy gallons per minute Proportioning equipment made it possible to closely regulate nutrient inputs into each test pool The ultimate goal of this study was to determine on a controlled basis what effects various types of sewage effluent would have on algal growth Megard (1969) in his initial study on the algae and photosynthesis of Shagawa Lake found that certain concentrations of sewage effluent were stimulating whereas others were inhibiting He states The effects of different amounts of effluent from secondary and tertiary sewage treatshyment plants on the photosynthetic capacity of algae were measured Photosynthetic capacity was stimulated 40 by 5 and 10 secondary sewage effluent but inhibited by 20 secondary effluent Photosynthesis was stimulated slightly hy tertiary effluent but 20 municipal water stopped photosynthesis
Fish ponds have been llsed by some to study the effec t of end chmen t For example Hepher (1962) applied superphospha te and ammonium sulfa to to one fish pond while another was left as a control Each pond was 01 hectars (1000 m2) in area and seventy to ninety centimeters deep His results utilizing ~le light and dark bottle method showed a carhon increase of four to five Umes in the fertilized pool as compared to the control Swingle Gooch and Rabanal (1963) also make use of fish ponds in carrying out fertilization experiments They found that the addition of nitrogen and potassium produced no Significant increase in plankton biomass or fish yield When phosphate alone was used it was again discovered that no significant increase occurred in the yield In fact in some instances the phosphate additions tended to delay algal response
One of the first reported lake fertilization experiments as conducted by Einsele (Brezonik et al 1969) He applied slug doses of superphsophate to a small German lake in 1937 and 1938 Temporary increases in the phytoplankton of th lake was observed hut in each instance the lake soon returned to normal
Another early lake fertilization experiment was conducted by Smith (1945) He added one ton of mono-ammonium phoBphate and 500 pounds of potassium chloride to Crecy Lake in New Brunswick After this addition of fertilizer the twenty hectare lake which previously hnd been unproductive developed a heavy growth of plankton and the benthic biomass increased greatly Heavy blooms of Agtzalxwna and whiel1 previously had not heen seen in the lake were observed after lization Also the record aquatic vegetation increased Hence since Crecy Lake was sufficiently self-regulating the effects of enrichment were temporary and the artificially induced eutrophication was found to he largely reversihle
0middot l
Langford (1948) another Canadianvesearcher investigated the effect of enrichment on five lakes in Algonquin Park Ontario He fertilized four lakes and left one as a control In order to determine the fate of the augmenting inorganic nutrients in the biomass detailed analyses were made to assess changes in dissolved chemicals the plankton bottom organisms forage fish and game fish His results showed that as a consequence of fertilization a marked increase occurred in the net phytoplankton within three weeks Diatoms and flagellate protozoans showed the greatest increase
An interesting experiment has been carried out by Brezonik and his co-workers (1969) on two small Florida lakes To study eutrophication they artificially enriched one lake at a controlled rate and measured parameters that characterized the condition of the water The other lake one-half mile away was used as a control Both lakes were similar in physical chemical and biological characteristics At the beginning of the experiment they were both considered to be oligotrophic Nitrogen and phosphorus were added to the experimental lake in amounts which in one year would raise the N content 050 mgl and phosphorus 00427 mg1 Each week to achieve this 300 gallons of sewage effluent suitably enriched with nitrogen and phosphorus were added to the lake at the rate of 1 8 gallons per hour Although in the enriched lake a large and diverse number of species and genera were still present carbon fixation increased greatly and the quantity of chlorophyll rose as additions went on
In contrast Schindler (1971) working with northern lakes added nitrogen and phosphorus in their inorganiC form to an experimental lake in northwestern Ontario In his study which covered the summer periods of 1969 and 1970 nutrients were distributed throughout the epilimnion of the lake on a weekly basis During the 1969 was added in quanti ties which resulted in a dosage of 03
added to produce a dosage of 504 g and 629 g Nm2yr were added On the basis of this work
Schindler concluded Phytoplankton standing crop increased greatly after fertilization as indicated by cell volume or chlorophyll concenshytrations Species changed from the cryptophycean and chrysophycean genera which are common in most unfertilized lakes of the area of chlorophytes in summer of 1969 Cyanophytes appeared in large numbers for the first time in August 1970
Reservoirs such as that of the Tennessee Valley Authority at Norris as well as lakes have been artificially fertilized Wood and Sheddan (1968) fertilized six coves of the Norris Reservoir with mono ammonium phosphate and ammonium sulfate Two of the coves served as controls Phosphorus was added at the rate of 25 or 50 and nitrogen at the rate of 50 and 100 fJgl Three zooplankton blooms were observed after fertilization They noted no increase of game fish in the fertilized coves
22
Nany European orkers have actively carried on enrichment studies Gross and his co-workers (1946) added nitrates and phosphates to various arms of a sea loch in Argyll Loch Sween According to Smyth (1955) nutrient addition did not produce any observable changes in the periphytic diatom population He suggested that the natural phosphate concentration may not be a limiting factor to the extent that it is for planktonic forms This he states could be due to a higher phosphate concentration at the mud surface then in overlying water or to the fact that bottom diatoms may have a lower phosphate requirement Further mention of this specific work has been made by Raymont (1949) Marshall and Orr (1947) have similarly investigated the question of enrichment but on an entirely different sea loch Loch Craiglin Brook and Holden (1957) and Holden (1959) have similarly reported on tbeir experiments in Scottish freshwater lochs in Sutherland Brook and Holden added calcium superphosphate to a 166 hectare loch to the extent that it gave them a concentration of approximately 330 lgl of They observed an eight-fold increase in phytoplankton abundance in first two years Holden (1959) enriched four lochs on five different occasions between June 1954 and August 1955 Two other lochs were untreated and studied as controls This fertilization led to a large increase in phytoplankton especially in the two lochans treated witb nitrogen-phosphorus-potassium (NPK) fertilizer Both of these developed blooms of Chloroccales and blue-greens Pbytoplankton increased to as much as 60000 cellSTIll in enriched waters compared with maxima of 500 and 1800 cells in the controls The plankton species in the treated lochs changed to those more characteristic of eutrophic waters
In order to study the enriching effect on aquatic macrophytes Caines (1965) artificially fertilized a loch in Pertshire by dropping bags of superphosphate fertilizer over approximately half of the lochs area A specific analysis was made on the effect of this enrichment on Zlwn altcTnijZorwn and In this instance only aquatic weeds were made of phytoshyplankton or periphyton fluctuations
An interesting study relating to marine enrichment has been done by Roels and his co-workers from the Lamont-Doherty Geological Observatory of Columbia University Their work as revie~led by Pinchot (1970) consisted of pumping deep ocean water heavily charged with nutrients into a coral atoll on the Island of St Croix in the Virgin Islands They found that selected plant life would grow twenty-seven times faster in ocean water from greater depths than in that from the surface The concentration of nitrogen and phosphorus compounds in the ocean according to Roels reaches maximum values at depths of from 2000 to 3000 feet In the Pacific and Indian Oceans phosphate reaches 90 (297 rug Pm3) at this de~th and at meters in thf Atlantic Ocean phosphate reaches 60 mgm- (198 mg ) In the Pacific Ocean at 1000 meters nitrate reaches approximately 50 lngm3 (1125 mg Nm 3) Pinchot suggested that this technique could be used for the enrichment of lagoons and to fertilize such areas as Long Island Sound for oyster production
23
Methods of nutrient delivery In artificial fertilizing techniques Table II Average Chemical Characterisitcs of Great Lakes Waters (USthe common method for the delivery of the nutrients is the batch method Bureau of Commercial Fisheries data unless designated other-In this approach a certain number of pounds of chemicals are simply added wise Data based on samples from various depths) periodically to the experimental container or body of water Another method employed by Caines (1965) and Huntsman (1948) was to place permeable bags of fertilizer directly into the water where the chemical Totalwould then slowly dissolve and be released into the surrounding water Lake Calcium Magnesium Potassium Sodium alkalinityIn a number of these fertilizing experiments it was difficult to (ppm) (ppm) (ppm) (ppm) (ppm CaC03)quantify the amount of nutrient which was administered Improvements in this technique have been made by Brezonik et al (1969) and Brice and Powers (1969) who have used proportioning equipment to deliver Superior 124 28 06 11 46known quantities of chemicals or sewage into the incoming water
Huron 226 63 10 23 82
Nutrient Levels in Lake Superior Michigan 315 104 09 34 113
Beeton (1965) has compiled chemical data on the Great Lakes from Erie 367 89 14 87 95thirty-four references one of which goes back to samples taken in 1854 In evaluating these he observed a progressive increase in the concentrations Ontario 393 91 12 108 93of various major ions and total solids in all of the lakes except Lake Superior Beetons collection of data indicates that the total dissolved solids in Lake Superior have remained constant at 60 ppm
The chemical characterisitcs of Lake Superior have been compared with the other four Great Lakes by Chandler (1964) These data Specific
Chloride Sulfate Silica Totalpresented in Table II clearly show that Lake Superior contains the conductance lowest nutrient concentration of any of the Great Lakes Lake (ppm) (ppm) (ppm) phosphorus - pH (micromhos
(ppb) at 18 C) One of the most comprehensive studies on nutrient levels in western
Lake Superior has been carried out by Putnam and Olson (1959 1960) Superior 19 32 21 5 74In their work a large number of samples were collected from a variety 787
of locations and depths A location which perhaps best reflects the Huron 70 97 23 10water quality found at the Castle Danger project is the Knife Rivershy 81 1683
Larsmont area The values they obtained for several chemical parameters Michigan 62 155 31 13from July 1958 to March 1959 are presented in Table III of the following 80 2258
page It will be noted from this Table that phosphorus values are Erie 210 211 15 61reported in microgram atoms per liter If desired these values may be 83 2418
converted to parts per million or parts per billion as follows Ontario 235 324 63 85 2723
lg atoms x 31parts per million (ppm) 1000
Ayers Anderson Chandler and Lauff 1956parts per billion (ppb) lg atoms x 31 From Chandler (1964)New York State Dept Health 1958
Inorganic phosphorus as may be seen from this Table never was higher than 007 microgram atoms per liter (2ppb) The average for all samples at the surface and at 200 feet was 0029 lgAl (09 ppb) Total phosphorus ranged from 010 to 046 lgAl (3-14 ppb) The most common value appearing over thirty percent of the time was 024 lgAl (74 ppb) This figure is only slightly higher than the average total phosphorus
2524
C
0
00
(lJ
gt 7
u C) rj
CF
t
s u
u
_shy
(j)
gt
10 L Q~
0 v
0 ~
()
co lt-t
c)
co
0 01
c) V
co v
C) v
cl-
(
c) v
0 v
[shy
0
C) v
0 v
c
C ID OJ L ()
Gl t ~
0 ()
0
r-~
0
0
rr 0
C)
j
N
0
ltt
c
()
c
Ul
26
CJ In
0
tn
LD
CJ
Li]
VI
N
r
C)
N
0
0
0
0 C)
a)
O~
0
0
C) D
(~
c j
(~ 1U j
~rl If)
C-J
N
0 C-J
t
C C
) cJ 0
Ql +shy(0
l 10 +shy0 fshy
gt +shy
0 Ul
IU +shy0 f-
Ln
r-
0
~~
C)
r~ [I
0
rshy
DIn 0
Lr
r~ lt~
0 0
Ln
r
[ c
r-middotshy
r-
C
r j
tIl
I~~
I
0
r 0shy
0
c 0
D L llJ
0
l
Ql CJ_
t r1J
u
u c
m lJl
ell ugt ell
c J
e 0
m +shyL
c
Ql L
J
Ul () J
values expressed by Chandler (1964) At the Knife River Station nitrates ranged from 084 to LIS ppm with a mean of 103 ppm Only traces of ammonia nitrogen organic nitrogen and nitrite were detected The mean chemical values reported by Putnam and Olson (1960) for the period July 15 to September 10 1959 may be summarized as follows
~
lJ2olimnion
Silica Carbon dioxide Nitrate (N03) Organic nitrogen Inorganic phosphorus Total phosphorus pH Alkalinity
204 128 159 014
lt0003 0012 79
385
(lt3 ppb) (102 ppb)
213 233 196 013
lt0003 0013 77
laquo3 ppb) (136 ppb)
These results are very similar to those reported earlier by Putnam and Olson (1959) Values for nitrates and total phosphorus in 1960 are slightly higher than those of 1959 Routine analyses performed during the sunnners of 1964 to 1971 by School of Public Health students showed that the results obtained by Putnam and Olson (1959 19(0) have remained essentially the same The supporttng chemical data collected by Fox (1969) Stokes (1969) and Parkos (1969) are also in close agreement with the original study
Winter (1971) has provIded additional cbemical data on Lake Superior In his work samples were collected from a total of twenty-two stations in the Duluth-Superior Harbor area the open water of Lake Superior the Apostle Islands and Chequamegon Bay Ashland Wisconsin Six of his sampling sites were located on a center transect running from the Dulllth-Superior Harbor to a point north of the Apostle Islands Distances of the sampling points from the harbor ranged from 16 km (10 miles) to 113 km (70 miles) Another sampling site was located among the Apostle Island group near Devils Island The average chemical values for tbe above mentioned stations along the transect and from the Apostle Island area representing a total of seven samples are presented below
~
Organic nitrogen 014 Ammonia nitrogen 0036 Nitrite-Nitrogen 0002 Nitrate-Nitrogen 023 (101 mglTotal inorganic N 027 Soluble phosphorus 0007 (7 ppb) Total phosphorus 002 (20 ppb)
27
The above averages compiled from Winters data show that nitrogen values are closely comparable to those reported by Putnam and Olson Total phosphorus ~lich ranged from 14 to 28 ppb in the seven collection areas was slightly higher than the averages of Putnam and Olson
28
CHAPTER III
MATERIALS AND METHODS
Project Site Selection
To provide an aquatic environment for periphyton growth which would be natural and which would lend itself to experimental modification a field station consisting of two rock-basin pools a piping system and a small building to house the pumps meters and other necessary equipment was established on a relatively isolated stretch of shoreline near Castle Danger Minnesota This particular section of shoreline comprises part of a 50-acre tract of lakeshore property owned by the University of Minnesota It is located about 40 miles from the Lake Superior Limnological Research Station at the Lester River which served as a base during these studies (See Figure 1)
The best site for pool construction was determined on the basis of a preliminary survey which encompassed approximately one-third mile of shoreline north of the Castle Haven resort The specific site eventually chosen was a flat rocky ledge approximately fifteen feet above the lake at the southernmost boundary of the University property This site met nearly all of the conditions set up in the original research plan and the following criteria were satisfied (1) The rock stratum was sufficiently level and large enough to assure exposure of both pools to equal amounts of insolation (2) The elevation above lake level was high enough to prevent ordinary or moderately-sized waves from splashing water into the pools (3) The bank above the pools was adequately sloped to minimize the possibility of seepage and surface runoff into the pools (4) The area was fairly well protected from the effects of periodic storms (5) The rock substrate itself was solid with only a few fine fissures and little evidence of crumbling (6) The pools were near a source of electricity which would provide power for the pumps and lastly (7) The area could only be reached by driving through the Castle Haven resort and thus satisfied the requirement of being isolated--a necessary condition for the prevention of vandalism
General layout and construction details The shoreline site as it appeared prior to construction of the pools is shown in Figure 2 The site was laid out to determine the approximate dimensions needed to provide space for two pools each containing about 3000 gallons of water With the aid of a heavy-duty air hammer the basalt rock bed was shaped into a large basin with a capacity of about 6000 gallons Rock fragments were chiseled out and removed from the middle however any rocks which could be utilized in the formation of a wall were left in place In those areas ~ere natural rock could not serve as a wall a low cement
29
site at 10 Oanger Minnesota asFi beforo oxperirnenlal pool construction
gu r~e Construction of forms in experimental pool bull I e Danger~ 1969
30
foundation was constructed as a basis for a cement-block wall Before the foundation was laid 9-inch deep holes were drilled into the solid rock at two-foot intervals l2-inch steel reinforcement rods were then anchoredlin the holes thus providing the needed strength and wall support
Because of the irregular contour of the rock bed the foundation had to be stepped to permit the construction of a all which would be level at the top Figure 3 shows the type of form used in the construction of the foundation and all of the cement used in the walls and foundation was mixed at the site with a small portable mixer Concrete blocks were subsequently laid upon the foundation to form the front and center walls whereas the back and side walls were almost entirely composed of natural rock The center cavities in each 8 x 12 block were filled with small rocks plus a 31 mixture of cement steel rods were then inserted to bind the blocks together and add further strength to the wall
Upon completion of the front and side walls a center wall of monolithic concrete was constructed which in effect divided the basin into two separate pools of approximately similar dimensions and volume To minimize leaching of calcium from the cement blocks and center wall the pools were scrubbed with a solution of technical grade hydrochloric acid After filling with water to test for leaks the pools were again drained and any small cracks or fissures judged to be a potential problem were patched with an inert hydraulic cement sealer known commercially as ThoroseaZ
Because natural rock had been used in their construction the general shape of the pools tended to be slightly irregular The control pool was roughly rectangular in shape whereas the test pool was more triangular in outline The exact layout and dimensions of the pools are shown in Figure 4
Water circulating system Initially a 13 hp continuous-duty centrifugal pump with one-inch delivery piping was installed on a platform at the edge of the control pool (15 feet above the lake level and approximately 20 feet inland) A 25-foot suction line--firmly anchored to the rocky ledge in four places--connected the pump to an underwater intake pipe which was equipped with a foot-valve and extended eight feet into the lake A tee-joint coupled to the discharge line directed the incoming water into both pools and each feeder pipe was provided with a valve to permit manual control of the flow into each pool
After several days of pumping the screen in the foot-valve became clogged and as a result the starving pump overheated burning out
lThe anchoring material was a specially-compounded substance known as Pour Rock
31
w-~ z
~
-0gt lt1J
0 r- g ~ ~ a
~ 0 ~ ~ Q) ) 0 11 t shy
2C1 ~~CEr 41 (1) 11 a OJ tJC i-OEiL
4) 0 0 0 ~ c ~oct(n-Il~~ ~ ~o OII~
~~~~sect~~~ JU)asClW~O
I laquo lt1l ltgt 0 W lL () x
a seal It was replaced by a more powerful 12 hp centrifugal pump however this pump required the use of 1 l2-inch suction and discharge pipes and consequently all of the previous piping had to be replaced The capacity of the new pump was approximately 61600 gallons per day [~ 428 gallonsminutel a volume far greater than the amount needed Therefore since it is not recommended that centrifugal pumps be throttled because of the production of dangerous back-pressures a simple by-pass was installed allowing the excess water to flow across the ledge and back into the lake In time the rock surface over which this excess water flowed also developed a periphytic growth which was later examined and the information obtained is included with the basic data presented in this study
c Q) Unfortunately installation of the new and more powerful pump did Ul
not eliminate all of the preliminary problems The foot-valvesc m D continued to clog with predictable regularity When these were replaced Q) by a gate-valve it was found that without the foot-valve small stones
some as big as marbles were sucked into the pump and jammed the ~ ~ impeller blades This problem was eventually resolved by capping the end of the intake pipe and randomly drilling a series of thirty 38-inchtshy
ro holes within the distal three-foot section At least three layers of U) l4-inch hardware cloth were loosely wrapped around this portion of
the intake pipe and this was apparently sufficient to reduce the8 - velocity of water entering the pipe to a point where small pebbles could
no longer be picked upltU t-c Q)
E Construction of pump house and instrument shelter As shown in L
Figure 5 a small building (6 x 8 x 8 feet) was constructed at the edge C) CL
of the pools to house the pumps chemical supplies and recording X instruments and to provide a place for laboratory work The floor of
C)
the sturcture was exactly 15 vertical feet above the lake surface and 0
~ was supported at each corner by a cement foundation tied with reinforcing
3 C)
rods to the underlying rock In addition to the shingled roof and
gt tiled double floor it was completely insulated and furnished with fluorescent light a fold-up work bench and a small space heater whichc
ro helped to maintain relatively constant temperatures during cold weather CL
Calibration of pool system The exact capacity of each pool when filled with water to a level about two inches below the rim was
C) calculated by measuring the flow rate of the incoming water and the 0 time required to fill the pools For this preliminary determinationE
flow meters were temporarily installed on each branch of the pump
~ discharge pipe The pool with the largest capacity designated as the control pool contained 394 cubic feet (2950 gallons) of water the test pool slightly smaller contained 337 cubic feet (2520 gallons) The water level in both pools was regulated and maintained by means of
LL two overflow pipes These pipes were 2 inches in diameter and drew water from the bottom of each pool discharging it on the outside of the pool wall at a point adjacent to the lake [Figure 4) The overflow ran
33
32
r-I
over the rock ledge before entering the lake and once again a periphytic growth was This growth was also examined and the information obtained has been included in the present study
As shown in Figure 5 the control pool was built at a slightly higher elevation than the test pool This was done to eliminate any possible diffusion of water from the test pool into the control pool
L Although there was no cause to believe that any appreciable water QJ exchange would occur through the eight-inch central wall since it haden c fl been treated with Thoroseal and every possible precaution had been il taken to construct an impervious wall by maintaining a higher level in (J) the control pool--eight inches in this case--the hydraulic head produced In would be sufficient to guarantee that if diffusion were to occur it () (0 would proceed from the control to the test pool This is an important
consideration because the test pool water was experimentally enrichedL o and any diffusion in the reverse direction would have altered the I quality of the natural 1akewater in the larger pool thus invalidatingQ)
- CL its use as a control U)
ill -
Field and Laboratory Procedures 1969
Phosphate as K2HP04 was delivered to the test pool concentration of 50 ppm (parts per million)
equivalent to 163 ppm phosphorus Although the amount of phosphorus added was recognized as being much greater than the optimum this dosage was chosen because it was high enough to be easily measured and yet presUlllably low enough to produce a rapid growth without exceeding the threshold of inhibition
As was true with other facets of the study the exact method to be used for delivering preselected chemical dosages had not been determined
o and it was first necessary to develop such a scheme on a trial-and-error 00cuD basis The methodology and apparatus finally adapted for use during the
0 fall experimental period is described below ltD t-CC ltD (J) tshy The method chosen can be described in general as a IC 0
In system The phosphate was delivered to the test pool through TygonL ltD Q c tubing and the dosage regulated by a 14-mil1imeter bore capillary CLC X -shy tube Since it is well known thac the amount of fluid which will pass
Ul ~ through a capillary can be altered by changing sHch factors as the length of the tube the hydraulic head applied to the system or the temperature delivery rates can therefore be altered in an otherwise stable system by simply changing the length of the tubing Figure 6 shows the relationships which exist between the length of tubing and milliliters per minute delivered under field conditions prevailing at Castle Danger since 1969
A satisfactory nutrient level could thus be maintained by knowing the (1) volume and overturn rate of the test pool (2) stock phosphate
34 35
laquo)
OJ laquo)
11 Q o L
0
E
CD o
o 0
(J
TJ
~ ~
tn o tn 0 ltXl CO r-middotmiddot f- shy
~~~l__---_----- 5
cl 9J n-lI2Jedw81o
o
L1) 01) C) If) 0 L1)o o -l rl (gtj N m
(W~) 4-l5U9l 5uqnl
36
(0
(1)
L1)
GJ +~ tJ c
E E
L1)
i
L1)
C)
concentration and (3) drops per minute from the capillary tube (I)
(Qifgt During this experiment the volume of water flowing through both +shyo
Q) o pools was kept constant at two overturns per day or roughly 5000 (n u ill gallons in the test pool and 6000 gallons in the control pool The c c
c stock phosphate solution was made by dissolving 1680 grams KHPO in ~ L 355 liters distilled water l This amount was sufficient to
e gt for seven days at the delivery rate produced by a 1 LIZ-inch capillary Q)
L tube This delivery rate (47 dropsminute or 5 lite~rsday) was maintained(J)
OJDshy c throughout the duration of the experiment Since the object of the studyE (Q
o was to maintain a constant level of phosphate in the pool the strength~ ill of the stock solution was kept at the level indicated above At this
~ +shy juncture it should be pointed out that the system is quite flexible in (Q
(1)
U1 terms of changing dosages inasmuch as it is only necessary to alter
U-o the concentration of the stock solution being delivered to the capillarya gt o
L The general arrangement of the chemical delivery system is shown in
~ gt Figure 7 Delivery through the capillary tube worked well however Q)
in order to maintain a regular rate it was essential that the temperature o remain fairly constant Higher temperatures tended to increase the
(j) dripping rate whereas the rate was decreased at lower temperaturesx (Figure 6)
The chemical feed technique is schematically illustrated in -)CT
Figure 7 From a 40-liter carboy the stock solution flows to a plasticOJ
basket containing a float mechanism which serves to maintain a constant head and thereby insure a constant drip rate from the capillary tube The measured stock solution then enters a modified toilet tank which
u functions as the holding and mixing reservoir The tank float controls +- incoming water from the main pump and keeps the water in the tank at a ltJl
constant level Sufficient pressure is thus maintained to cause the pound +shy
ill chemical solution to flow steadily and freely through thirty feet of
(Q
a L 38-inch Tygon tubing into the test pool The measured chemical is delivered at the point where incoming water from Lake Superior enters
o
gt ~
(I) the pool During the months of November and December the tubing was gt wrapped with an electric heating tape and fiberglas insulation to-(1) provide protection from the freezing temperatures0
0tr ill
Analyses for orthophosphate using the stannous chloride-molybdate gt r method were made on a routine basis during the first few days when
~ nutrients were initially being added to the test pool This was donecgt ltc Q)
to evaluate the efficiency of the dosing technique as well as to ascertain -1 whether the chemical was being evenly distributed throughout the test
Q) pool To check the circulation water samples were collected from four
0 representative areas of the test pool and results were then compared ~
gtD
ill L tJ lvalues are given in the Appendix A en
lo
37
L (j) I +- -~ c
c _- U IU 11J (Q
I +- t (j) ltgt pound oct gtshy
c n (l J
C fj (j)
0 U Jl
+- C J 1J
IT o gt C X (f) 0
_0 L +- -
C YI
u 1J t1J (0 - r-i shy
o U ()+- o L I +- co In U
lt en
+- L (Q (j)
O+shy1J
lt
r+ +shylt c
_L 0 c If)
] shyU
U) 0 c +shy- Ul X~
LLJ
Since the results indicated that phosphate levels were the same at all points and at different depths it was concluded that adequate mixing was taking place The same procedure was followed in the control pool
(j)
+- a to detect the possibility of diffusion from the test pool there was no 1l ill evidence of such diffusion and results were uniform throughout Finally
a number of samples were taken from the lake near the water intake and from an area some distance up shore This was done to determine whether
Q or not the phosphate-rich overflow from the test pool had affected the E
quality of the intake water No differences were observed in either theJ Ll Il- lake water samples collected at the intake or those obtained up shoreshy
All analyses indicated that no cross-contamination had occurred c 0 en gt- Values from the test pool were extremely close to the calculated cmiddot and desired value of 50 ppm phosphate Following the shakedown period
and for the remaining seven weeks phosphate determinations were done on IL
a weekly basis The data obtained during this period using the previously described method are presented in the Appendix [Section BJ
C gtD (1 By the middle
of tests were begun c This program of per lphyton-covered rocks from the lake
and the strategic placement of these rock in tle pools As shown inU ill If)
Figure 8 the collection area for 1969 was situated along the shoreline J a short distance from the experimental pools Hithin this area the natural Q) J
protection from rough water afforded by huge boulders extending outward IT into the lake allowed periphyton to grow profusely on the submerged rock c substrate Ideally rocks for use in thi tYJlE of a study should bec U approximately uniform in size and fairly smooth and rounded in shapeill + However since rough water during the preceding three weeks in those areas JQ)
where ideal rocks were availabl ( had vi r tuall y removed all periphytic (j) growths it became necessary to use the periphytnn-covered rocks in the
designated collection area although they were irregular in both size and ro shape and often quite jaggedu
E ill The rocks were collected by simply reaching into the water at variousc U depths and selecting those vlhi eh showerl eood ped phytic grOlrth The
procedure followed was essentially the same as that described by Fox r--shy et al (1969) and Stokes et (1970) After placing the hand and forearm
L Q) into a two-gallon size plastic bag the collector grasps the preselected J rock then rhile firmly gripping the four to six inch specimen the plasticOJ
LL bag is pulled down over the wrist dnd thEe rock and the specimen enveloped in its plastic bag is removed from the Welter and placed in a small plastic bucket In the present study the plas tic pail s with their contained rocks were transferred from point to point in a Sportynk dinghy
Af ter an appropriate number of rocks ha d heen co llectd they were brought back to the pools in the small elinehy The plastic bags were removed and the rocks were planted in the partially-filJed pools each rock being carefully repositioned in a manner sifli1ar to that which it had occupied on the lake bottom forty-eight rocks--rranged in a series
39
38
Sliver Cre~ - township -
Experimental POOLS
poundak middotw~ict
N
F 8 Detailod map of the shorel ire in the Castlo Danger study area
40
of eight north-south rows--were placed in each of the two pools with precautions being taken not to place them too close to any wall that would produce shade for an appreciable of time The entire transfer procedure including collection final placement of rocks required approximately two hours of time After a one week period of stabilization phosphorus was added to one pool and the other was reserved as a normal lakewater control
Experimental program At weekly intervals four rocks were removed from each pool and examined for growth (Figure 9) The method of retrieval was essentially the same as that previously described by Fox and Stokes (1969 1970) Each pool was roughly divided into four locations and from each of these a rock was removed at the time of a
run In addition at two-week intervals rock samples serving as a second control were taken directly from Lake Superior in the same location as the original test rocks
Laboratory procedures Biological and chemical analyses were done in the laboratory at the Lake Superior Limnological Research Station at Duluth Procedures for periphyton recovery and delineation of rock surface area were essentially the same as those described previously in related studies [Fox et aZ (1969) Stokes et at (1970raquo) Upon return to the laboratory rocks were removed from their plastic pags and placed in a small tub The area of periphyton growth on each rock was outlined by scoring the surface with a diamond-point marker so as to provide a basis for subsequent enumeration and comparative tabulation of organisms present
Following removal of the periphyton the correspondingly scored area on each rock was lubricated with a thin layer of white petrolatum and coated with a one-quarter inch thick layer of melted paraffin Before becoming completely set and while still pliable the paraffin coating was separated from its rock template by making a series of vertical incisions with a scalpel loosening the flaps thus fonned and carefully peeling off the coating as a single piece The intact replica was then flattened and its contour traced on a sheet of white paper The total surface area in terms of square centimeters was determined by retracing the outline with a previously-calibrated polar planimeter
After the boundaries of growth had been engraved on the rock surface the periphyton was scraped off with a stiff plastic brush and together with a small amount of distilled water used in rinsing the rock and the plastic-bag the suspension was measured in a graduated cylinder and then transferred to a small plastic container It was from this container that aliquots were taken for chlorophyll analysis species identification and enumeration and weight detennination
Because the analytical procedures involved required that aliquots be nearly identical as possible the periphytic suspension was thoroughly
41
I
r agitated prior to the removal of each sample The method of m~x~ng used was developed in this laboratory and is a relatively simple procedure involving only the container itself and a glass funnel approximately oneshyhalf the diameter of the sample container After the mixture is transferred to the specified container the glass funnel is inver-ted and slowly pumped up and down within the slurry until the suspension appears to be unifornlly distributed throughout the container At this point the aliquot is quickly removed
Chlorophyll analysis The procedure used was that recommended by Creitz and Richards (1955) in conjunction with certain modifications
1 which had been developed in this laboratory in 1965 The basic steps~ in this modified method are described as follows l The aliquot is
filtered through a Gelman type A glass filter and residue washed with 15 ml of a saturated magnesium carbonate solution The filter isJ then ground in a Teflon tissue-grinder along with 6 ml of 90 spectroshygrade acetone The ground material plus supernatant is transferred to a graduate centrifuge tube and 90 acetone is used to adjust the final volume to 10 mililiters After the stoppered tube has been centrifuged for ten minutes the clear supernatant is pipetted into a l-cm quart7 absorption cell and analyzed in a Beckman DK-2A ratio-recording spectrophotometer with 90 acetone as the reference standard Equipped with a cooling device for maintaining a constant sample temperature of 24deg C this instrument automatically scans the visible spectrum from 350 to 700 millimicrons while simultaneously tracing the results on a chart Hence by repeating this procedure in exactly the same manner a series of curves characteristic of each sample aliquot can be obtained
To be useful in a study of this type the values represented by the curves msut be translated into terms applicable to the problem at hand This is done as follows The first step involves the examination of each curve to determine the absorbance values at 665 645 630 510 and 480 millimicrons With the aid of specific formulae developed by Richards and Thompson (1952) these absorbance values can be used as a basis forr the calculation of chlorophylls a b and c as well as the concentrationI of astacin and non-astacin carotno1ds The formulae used in the present study are given as follows
[D = absorbance at a given wavelength D residual absorbance at a given wavelength minus res the absorbancies of the chlorophylls
MSPU Millispecific Pigment Unit It represents a specific but undetermined weight of the pigment
lAliquot size in this determination varied according to the concentration of the sample
2The carbonate acting as a buffer prevents the conversion of chlorophyll to phaeophytin
[
43
i (Ju roe f
and should be about 1 mg based on the weights and absorption coefficients of related compounds (Richards and Thompson 1952)
Chlorophyll ~ (mgl) 156 D665 - 20 D645 08 D630
Chlorophyll b 254 D - 44 D 103645 645
Chlorophyll ~ (MSPUl) 109 D630 - 125 D665 - 287 D645
D 510 D - 00026 C - 00035 C 00021 C res SIO a b c
D 480 - 00019 C - 00136 C 00054 C res a b c
Astacian carotenoids (MSPUl) ~ 2 (44 Dres5l0-Dres480)
Non-astacian carotenoids (MSPUl) ~ 76 (D 480 - 149 D 510)res res
Results obtained by the above calculations are next converted to milligrams (or MSPU) of pigment per 100 square centimeter of rock surface Values for chlorophyll a b and c may be added together to express total chlorophyll In the present study chlorophyll values of the four rocks from each pool were added and an average total chlorophyll production for a given week was recorded Along with the total chlorophyll production for a given week values were also compiled for the total production of the specific pigments
For the determination of dry weights a was removed from the periphyton slurry and
filtered through a previously weighed four centimeter Whatman (No 41) filter paper The filter was dried at 103 degrees centigrade for one hour cooled in a desiccator for one hour and then reweighed To obtain organic weight the above filter together with a previously weighed crucible was placed in a muffle furnace at 600 degrees centigrade for fifteen minutes cooled for one hour in a desiccator and then the crucible with its contained ash was reweighed After deductions are made for the weight of the crucible the results expressed as milligrams per square centimeter of rock represents the weight of the ash (inorganic materials) If this is subtracted from the original dry weight organic weight is obtained This is usually referred to as the ash-free dry weight However for practical purposes in this report the term organic weight will be used in place of the indirect expression ash-free dry weight
Identification and enumeration of organisms From the combined slurry suspension derived from the four rocks collected from each pool a 100 milliliter aliquot was removed for the purpose of the identification and enumeration of the organisms which made up the periphyton growth
44
This sample was preserved with five percent formalin Due to the concentrated nature of each sample it was necessary to make dilutions of the basic suspension to avoid overlapping of organisms in the counting cell and attendant inaccuracies After a suitable dilution had been found a dropper was used to transfer one milliliter of the sample into a Sedgwick-Rafter counting cell The sample was allowed to settle for ten minutes before the slide was examined A binocular microscope provided wlth a calibrated Whipple disk was used and then random fields were counted Organisms were examined at a magnification of 200 diameters and were identified to genus By knowing the total volume of the peri shyphyton-water suspension rock surface and dilution factors the counts obtained were converted to numbers or organisms per square centimeter of rock area The taxonomic decisions made at this time were re-evaluated a year later and after detailed studies of each organism under high powers
Field and Laboratory Procedures 1970
Modifications and improvements of the facility In the spring of 1970 a number of physical adjustments and general improvements were made of the project complex at Castle Danger The first major improvement was a re-location of the intake pipe In 1969 the submerged intake pipe was situated at the waters edge in such a way that waves from the northshyeast would hit it broadside along its entire length During heavy seas the resultant wave pressure on this pipe was so extreme that on two occasions the terminal eight feet of the intake was broken off For this reason the intake was re-located in such a way that its length formed a ninety degree angle with the crests of the incoming Iaves during a northeaster Furthermore rather than have the pipe extend straight into the lake it was bent downward into a deep depression near the edge Thus water could be drawn from a depth of eight feet The suction line leading from the edge of the lake to the pump was securely anchored to the rock ledge as it had been in 1969
To more accurately determine the amount of water going into each pool two flow-meters were permanently added to the plumbing system These meters made it possible to obtain an accurate flow-rate and provided a cumulative total for each pool The meters registered directly in gallons They were installed in such a way that removal for servicing could be accomplished by the simple expedient of opening one valve and closing another By this procedure the water was diverted into a by-pass
Flow-rate into each pool was increased from two overturns per day in 1969 to six overturns per day in 1970 This increased the twentyshyfour hour flow to 15000 gallons in the test pool and 18000 gallons in the control pool The change in overturn rate was instituted in order to maintain a temperature level in the experimental pools that was more closely aligned with the actual lake temperature Even at six overturns
45
per day which was the maximum pumping capacity a water temperature difference between the pools and the lake of as much as ten degrees could occur on extremely hot and sunny days However this phenomenon was observed on only one occasion during the season
Chemical procedures The capillary tube method as used in 1969 for the delivery of chemical to the test pool was replaced with a motorized proportioning dispenser This device an American Series Proportioning Pump (Figure 10) was installed in such a way that it injected the selected chemical directly into the test pool feeder line Chemical delivery rates were easily controlled by adjusting the length of the piston stroke The maximum amount of solution that could be delivered in one day was thirty-two liters whereas the minimum to which the device could be adjusted was somewhat less than one liter per day A forty liter carboy placed four feet above the proportioning pump was used as storage for the stock chemical solution A section of Tygon tubing delivered the solution by gravity to the proportioning pump which was adjusted to deliver exactly five liters per day or thirty-five liters over a one week period
In 1970 the nutrients added to the test pool consisted of a comhinshyation of nitrogen and phosphorus in the classical ratio mentioned by Cooper (1937) Redfield (1958) Menzel and Ryther (1961) and Carpenter and his colleagues (1965) This ratio represents fifteen atoms of nitrogen and one atom of phosphorus Nitrogen was supplied as nitrate in the form of NaN03 whereas phosphorus was provided as phosphate in the form of K2HP04 bull The phosphorus level chosen for this study was based on levels reported in the literature as generally conducive to the production of algal blooms Sawyer (1947) studied sixteen Wisconsin lakes and came to the conclusion that 001 ppm of inorganic phosphorus (p) would be enough to produce a bloom Even though this value is the most widely quoted figure other investigators such as Dryden and Stern (1968) and Taylor (1967) feel that a slightly higher value namely 005 ppm P is the critical level which must be reached before distinct blooms can occur Neos (1966) found that some algae responded to as little as 00025 ppm phosphorus Weiss (1969) indicates that a value of 0005 ppm P was capable of stimulating aeruginosa whereas AsterioneZZa formosa could be stimulated by concentrations as low as 0001 ppm P All of these values of course assume no limitation by nitrogen or other elements
In 1969 phosphate was added at a rate to produce a final P concentration in the pool of 16 ppm It was ultimately decided in order to avoid excess dosages which might be inhibitory that this value should be reduced ten fold that is to 016 ppm This reduced value was still considerably higher than the minimum figures suggested by the authors cited above
The nitrogen level used in this study was derived by simply multiplying the selected phosphorus dosage by a factor of fifteen In doing this the atoms were maintained at the desired 151 ratio A slight correction had
46
dosageigure Iv X I Q70
r i)
on-5 i te n i hate determinations ~t e Danger la ke lor 1970
47
Figure I I Portable analyzer
to be made for the amount of nitrogen already existing in the form of field station See Figure 8 In contrast to the patchiness observed nitrate in Lake Superior water However the amount of inorganic previously the periphyton at this location was uniform and the rocks phosphorus present in the lake was so small that no special correction were heavily coated with the wooly brown growth characteristic of was necessary The nitrogen dosage determined on this basis was 245 diatoms ppm or 871 ppm in terms of nitrate The calculations used to arrive at this rate as well as the calculations made to determine the strength Rocks from this site were collected by the same method used in of the stock solution and the dosage rate are presented in the Appendix 1969 However since the depth of the water at this new collecting(Appendix A) site was twelve feet SCUBA gear had to be used by the collector
As soon as the test chemicals had been added a sampling and testing program was initiated to determine the respective levels of nitrogen and phosphorus in each pool Nitrates were ulonitored on a daily basis throughshy f out the summer and fall period An Orion Ion Analyzer provided with a nitrate specific electrode (Figure 11) was used for the routine determinations of nitrogen This instrument had been previously calibrated at the base laboratory at tester River The analyzer provided immediate information on nitrogen concentrations which allowed the investigator to make prompt adjustments of the chemical proportioning pump to maintain the desired chemical levels Since Nand P were administered in the same solution and their concentrations had a ratio of exactly 151 the nitrogen values could be used to simultaneously determine the concentration of phosphorus In order to check the accuracy of the Orion Analyzer duplicate water samples were anlayzed by the Standard Method procedure in the base laboratory at Lester River The phenoldisulfonic-acid method was used and tests were usually made once every week Along with this procedure samples were also analyzed for phosphate using the stannous chloride method Nitrate and phosphate values for the incoming lake water were obtained also using the same procedures Once every month throughout the sampling period which extended from July 9 to November 25 pH and dissolved oxygen were determined All results obtained in these analyses are presented in the Appendix (Appendix C Tables I and II)
Collection of field materials for enrichment studies In 1969 as described earlier the periphyton-covered test rocks were collected from water two to three feet deep and from a relatively sheltered area along the shore However many of these rocks were extremely jagged and irregular a condition which made subsequent handling and measurements rather complex For this reason in 1970 a search was made to find an area in which the rocks would be more uniform in terms of shape size and the character of the periphyton growth This search was based on underwater exploration made possible by the use of SCUBA diving gear As a consequence the bottom could be thoroughly examined for considerable distances outward from the shore In this instance the region examined included depths from three to twenty feet
Rocks of adequate size were frequently noted at depths of five to eight feet but their surfaces often were uneven in terms of the usual periphyton growth being interrupted by patches of long filamentous green algae Such rocks were rejected in the interest of uniformity A suitable area was finally located in a small bay about one-quarter mile from the
48
Within a period of two hours a total of 120 rocks similar in shape and approximately four to six inches in diameter were selected and repositioned in the experimental pools These rocks equally divided between each pool were then spaced eight to twelve inches apart and aligned in six north-south rows In a similar manner an equal number of scrubbed and autoclaved rocks were positioned in the pools in alternating rows These denuded rocks were subsequently used to study regrowth potential of periphyton With the addition of these rocks each pool thus contained a total of 120 rocks in a series of twelve rows In order to distinguish throughout the season what category of rock sample (regrowth or natural) was contained in each row an identifying mark was inscribed on the top of the pool wall corresponding with and identifying each row
Experimental program At weekly intervals four rocks were removed from each pool Two of these were rocks which had been introduced into the pool with their original and natural growth the other two were denuded rocks which now were showing varying degrees of regrowth Collections were made by the technique described for the 1969 studies although in some cases the investigator waded into the pool to retrieve the rock sample Samples were as far as possible randomly collected from various areas of both pools Collections were usually made in the late morning and samples were promptly returned to the base laboratory where they were processed within four hours
Laboratory procedures In the laboratory samples were processed in the same way as they had been in 1969 Again parameters used in measuring growth were chlorophyll production number of organisms and dry and organic weights In 1970 the conventional procedure consisting of an examination of preserved material was supplemented by an examinshyation of live samples This was done to further improve the taxonomic work It was especially useful for the identification of green and blue-green algae and certain flagellate forms such as Chlamydomonaa In carrying out this procedure a live portion of each periphytonshyslurry was examined immediately Another modification which was also extended to the 1969 samples involved the ashing of a portion of each sample The follOWing technique was employed A few drops of each sample were placed on a glass slide and incinerated in a muffle furnace for fifteen minutes at 350 degrees centigrade After cooling the aehed samples were covered with a glass cover slip using balsam as the counting medium This procedure produced a slide which could be
49
examined under the high powers of a microscope including oil immersion Only diatoms survived this procedure however since they represented a very important part of the periphyton growth and are difficult to identify unless the details of sculpture can be clearly seen this technique turned out to be extremely valuable
Although at the outset balsam was used exclusively as a mounting medium other substances were later found to have certain advantages One of these was substituted for the balsam after it had been thoroughly checked This mounting medium was a substance formulated by Czarneki and Williams (1970) It consists of a combination of polystyrene toluene and methylene iodide This material has a higher refractive index than Hyrax a widely used commercial preparation Instructions for the preparation of this medium are given in the Appendix (Appendix D)
Permanent slides prepared with balsam or Czarnekis medium were examined under oil immersion Diatoms which could not be identified immediately were photographed with a Polaroid Land Photomicrographic Camera This photograph was later used as a reference and a basis for final identification The basic references consulted in arriving at the identity of an organism were Tiffany and Britton (1951) Hustedt (1930) Prescott (1962) Smith (1950) Patrick (1966) Tilden (1910) and Whitford and Schumacher (1969) In addition outside consultation was sought for special cases
Laboratory studies were carried out at the growth response which could be attained in the
using dosages which corresponded to those which had been selected for use in the test pool at Castle Danger To this end rocks covered with periphyton and collected from the same location in Lake Superior later used as a source for experimental rocks in the Castle Danger pool were brought to the laboratory In the laboratory these rocks were placed in special incubators (modified by Stokes 1969) which simulated lakeshore conditions All four were conventional BOD incubators with variable temperature controls which had been modified as follows a ten-liter plastic tub which served as the sample container replaced the shelves Banks of fluorescent laraps had been installed to serve as a light source Light intensities within each incubator could be altered by adding removing or masking the lamps As slow flow of water could be maintained through the sample container a circulating pump The circulating system consisted of a variable-speed peristaltic pump mounted on the top of the incubator which was connected to a reservoir and the sample c(mtainer by tvo lengths of three-eighths inch Tygon tubing The inlet tube which came directly from the reservoir reached slightly below the surface of the water of the sample container
of Dr Alan Brook and Mr Colingsworth is gratefully acknowledged
50
The outlet tube was anchored to the container bottom in the opposite corner A four-liter plastic aspirator bottle was suspended above the sample container inside the incubator and tied into the inlet line This bottle serving as a reservoir could be disconnected and removed at selected intervals with another bottle full of fresh water This exchange of bottles if carried out on a routine basis provided a means for maintaining a practically constant level of nutrients in the test container throughout an experiment
All four incubators were maintained at a light intensity of 100 foot candles and a temperature simulating that of the lake namely six degrees centigrade The peristaltic pumps were set to recirculate the water at a rate of 600 milliliters per minute Two of the incubators which served as controls had no nutrients added to the circulating water and the water itself came from Castle Danger The remaining incubators served as the dosage test chambers Nitrate and phosphate were added to the Castle Danger water circulating in each of these at the rate which would subsequently be used in the test pool During all experiments the nutrients were replenished every other day by replacing the old aspirator bottle with one filled with fresh nutrients
At weekly intervals during the next twenty-six days samples were removed and examined for total chlorophyll production Production rates of the test and control incubators were then compared
Each day upon arrival the form Included in this report were
visual observations surface waves wind direction and speed water turbidity water temperature air temperature and sunlight During the first part of the summer and throughout the fall period the effluent temperature of each pool was checked with a mercury thermometer In a similar manner the temperature of the incoming lake water was checked Surface temperature of the lake was also recorded for much of the summer During the latter part of the summer a YSI continuous monitoring scanning telethermometer was used During this period temperature probes were installed in the effluent discharge of each pool and in the influent line The latter represented incoming lake water Since temperatures were being continuously recorded on a three-inch strip chart it was possible by this method to follow temperature differences between the pools and lake throughout the day and night
As a supplement to the main study relating to periphyton on experimental rocks an examinatiun was made of the profuse periphytic growth occurring on the vertical walls of the experimental pools and distinct from the rocks Limited periphyton growth also developed on the outside of the pools at the point outside each pool where waste water from the pools overflowed onto the rock ledge The area between this outlet point and the lake was kept constantly wet by a thin layer
51
of water coming from this source This well-illuminated rock surface appeared to be ideal for a periphyton growth which was apparent within a period of two weeks To assess the importance of this growth and its characteristics it was sampled on a tri-weekly basis It also occurred to the investigator that the test pool effluent which had been enriched by the addition of Nand P might have some effect on the natural periphyton at the point where it entered the lake To evaluate this properly samples were again collected at intervals of three weeks and visual checks were made each week This examination was supplemented further by a careful underwater examination made by the SCUBA technique Two such examinations were taken All of the collections made in these miscellaneous areas were qualitative in nature
CHAPTER IV
RESULTS AND DISCUSSION
The experimental area at Castle Danger is located on the north shore of western Lake Superior some forty miles northeast of Duluth Minnesota and 110 miles southwest of the Canadian border at Pigeon River For practical purposes the specific area from which samples were collected may be considered to be uninhabited and thus generally free from domestic pollution The only conceivable source of such pollution is potential seepage from the septic tanks associated with the half dozen or so small summer resort cabins located several hundred yards southwest of the experimental pools (Figure 8) Unpublished chemical and bacteriological observations by Takumi (1971) tend to dispel any suspicion that seepage of this sort is reaching the area Even if some seepage reached the lake the counter-clockwise water circulation which exists at this point in Lake Superior (Ruschmeyer et aZ 1958) would carry such pollutants away
The Gooseberry River is located nearly a mile above the experimenlal pools at Castle Danger (Figure 8) After a very heavy rainfall and the voluminous surface runoff which followed the near-shore water at Castle Danger has turned brown as a result of the turbidity produced by suspended particles swept in by the flood-lVatfrs of the Gooseberry River This phenomenon was observed on two occasions only
In general the entire area lying outward from and to the northeast of the Castle Danger pool area is characterized by remarkably clear water For example in the near shore area where periphyton-covered rocks were collected for use in the experimental pools visibility was extremely good Ordinarily water quality at noon was such that observers at the surface could easily follow the movements and detailed work of the SCUBA divers 20 to 25 feet below
In 1969 the early summer was devoted to the cons testing of the experimental units and collection of actual data pertinent to this study was limited to a seven-week period between October 30 and December 14 This fall season was characterized by mild weather and considering the time of year calm lake conditions Originally the plan had been to extend the sampling program to the end of December However this schedule was decisively terminated by a Northeaster which carried away the intake pipe As a result of the interruption of flow and the sub-zero temperatures which accompanied
52
the storm a total freeze-up of the system occurred
Natural periphyton Castle Danger To provide a baseline and a frame of reference for the experimental studies routine examinations were made of the natural periphyton population characterisitic of the Castle Danger area As indicated in Figure 8 samples were collected near the shoreline in approximately three feet of water Observations were made on three occasions during October and November
A tabulation of the periphytic organisms identified during the course of this study is presented in Table IV It will be noted that a total of thirty-four species representing nineteen genera and three phyla were found in these in-shore waters Except for the green alga Ulothrix zonata and the blue-green Phormidiwn foveolarwn diatoms made up the entire population The average total count was four million cells per square centimeter of rock area Of this total diatoms comprised eighty-one percent or an average of 3450000 cells per square centimeter The relatively high count reported for PlOrmidiwn (601000 per square centimeter) is misleading unless one remembers that the cells of this species are very small and that the actual volume of this alga per 100 cells will be much less than the corresponding volume of 100 cells of Ulothrix or many of the diatoms The five most common diatoms in order of abundance were Synedra acus Achnanthes microcephaZa Cymbe lla spp Gomphonema spp and Tribe llaria floccu losa Synedra acus being the mos t common constituted the bulk of the growth and averaged two million cells per centimeter squared of rock area
In addition to cell counts the other parameters used to measure productivity were total chlorophyll and dry weight The results of the chlorophyll study are presented below
Mg (MSPU) Chlorophyll Per 100 Square Centimeters
Date
J0-22
11-12
11-25
Total Chlorophyll a Chlorophyll b Chlorophyll c Chlorophyll
0644 0040 0265 0949
1153 0410 0269 1832
1 262 0192 0511 1965
Mean 101 02l4 0348 1 582
54
0 x x x x x x x x x x xr--shy til 0 Q) 0m
(J) f-lt P -0 0
L [ 03ill H Dshy ~ 0
CJ 0Ol 0 Pc
U~ (l
E 0ITI~ r--shyif) 0 0 m0r--shy
PillQ r shy Q)+shy x x x x x x x x x x x x x-Dtil
Q) m010 c-D f-lt - 0 L shyJ~
0r-0 x x x x x x x x x x x x x x xr--shy0t 0)(J) C 0 - C Pis
cro shyCJ02 0CL
l Him-DL ltgt Q)(0 ill cr 0J+- 01
C C urshyltgtill ID
0 Ulr- tl Q)-0 tl2U N c
bullc N0 +shy +shy cltP 0cr ~)gtshy IDCgt c ctl 0 P c~ Xl UL ltC0~ Q) () 0CL tl
~
()~ N
IC ~
55
x x x x x x x x x x x x x x
x x x x x x x x x x x x
x x x x x x x x x x x x
EO
L ill illshy(l +shyx Ul
W ITI U
D C IID
L L 0 o shy
x x x x x x x x x x
x x x x x x x x x x x gt H
z -I-shy
0H r--shy0 mM
H 0)
P l
U)I~ l
W --l OJ ltC f-shy
L L Q) Q) (l
0J Jif)
if) Q)
Q)Y Y ID (0 --l
--l
c 0
-or--shyQ)Q gtshyL
illD Ul C 0 ITI 0
0 Ul-D EO Ul shy
C +shyID 0 01 L
~ oj oj oj
gt gt c c gt p Pc o 0 P til H 0 gt 0 H oj
c c gt ~
0
rl
[0 m +- c
ll (lJ (l Zl lIDm I rJ)(1
C u ltJ ll
Q) 0 U L C U
c
ID shyP ECgt ~
mu 0 tJ E (0 shy ~_ If)
L - 0 _) L Q) If) 1- U o Cl L0shy
-fUm (0 (1J shy
mLgt tD L J 0 CD o CD C ill L - mOe ClClL_ 0 - - 0 L +shy
m rD ru [0 l0 ID--JJ((luml +--1
-f- J 1) Ul (0 L0shy
- -1 cue - rn -- (j)0shy
CD U CD -- m 0 - 0 U X U +- -J In) ill 0 m0shy
CD Zj (1 C 0 +- U () j- shyCD-(1J00JVJ[OcrrL u n L L (u CD0- (1J
m JUOi--Cl tIl CD
- m Q) bullbull Q) bull (l- bullbullbull
cL)U+-U O-~)C)UU 0 0 +- Q)
cc~Q)m() (]0 Cl Cl () +- l U U E E EEE=U)Q)O gt-raquo
ltt ltr ltr laquo U () u ~ L)
Tab 13 t i iJed
al~e5trs
)2~ r-i nor
croto1ansis rrisonii
eala acrr na7U1 n-~
natUr1 7Jat
angustatum lJar obtusarum 1 Cfum
constri ctum val ca-i
Var d cotm-IQ
PERIPHYTON
Cymba I a p rost ra~a ventricosa
I a the r-rns I s ancaps
8 eongatum hi Ie
V1 CJ D v~1 ra x
x
leo
var
cragl aria capGcina x x x
F vridJ a
he red x x x
( shyv
x
G G gerrira~~T x x x G 9 r ac
x x
x
x
x
x x
x
x
x x
x x
x
x
x x
x
x x
x
X
x
x x
x
x
x
x X
x
X
x
x x
x x
x x x
x
X
x x x x
x x
x x
Table IV continued
rysophyta PERIPHYTON Chlorophyta
Cyanophyta
iCh 1 Gomphonema he I vel- cum tenu 15 --- shy
G irtri catuM G montarum G ollvaceum G 0 I I vaceum var ca I carea -- shyG parvulum
V1 G sphaerophorUM --------Melosira grarula7a
-1 variatls i d i on c i rcu I ar-e lJal I cta ---
Navi I arvensis N dicephala N dicephala elnersis N Mnirra ~ c~longa
N pupula N radiosa N reinhardtl i N tusc~ a N vereCc1ca N vi ridula ----------- shy
Nil angusto val N den~icula
N dissipota N filforrris
~ungar-ca
L Superior
1969 1970
x x
x
x x
x x
x
x x
NATURAL GROWTH
Control Pool
1969 1970
x x x x x
x x
x x x x
x
x x x
x x
x
x x x
x
Test Pool
1969 1970
x x x
x
x
x x
x x
x x x
x x x
x
x x
I
REGROWTH [1970]
Control I Test
Pool I Pool
x x
x
x x
x
x
x
x
x x
x
x
I
Ta I cont i
Vgt
X
X X
X X
P dupl PiThophora sp ~~I x
Table IV continued
PERIPHYTON
1970
x X C~ I arrydO1onas spp x x
8p
Fediastrum boryaum
x x
x x
x x
x x x
X X
X X
A X
x x
x x
x x x x x x x
x x x x
x x x
x x x x x x
s viridis
)Jr Schi Ie Ie r
Jadrisvashy
lenastJm sp
S-t- IcTnrix
G
On the basis of mean averages the ratio of chlorophyll abc was approximately 612 In two of the three samples reported above chlorophyll ~ had a greater concentration than chlorophyll b This is to be expected since nearly the entire population of periphyton consisted of diatoms and diatoms are characterized by their high chlorophyll values The higher chlorophyll ~ value occuring on November 12 ordinarily be attributed to the presence of great numbers of green algae However in microscopic examinations green algae were never prominant on this date and another explanation must be found A reasonable explanation is that the separate aliquot used for chlorophyll determination may have contained a small of UlothPix filaments
Non-astacian carotenoid values for the three samples collected ranged from 0241 on October 22 to 0568 MSPU per 100 square centimeters on the 25th of November The mean value for this pigment was 0443 MSPU per 100 square centimeters Since diatoms contain a significant amount of carotenoids these relatively high values are to be expected Astacian carotenoids having a mean of 003 MSPU per 100 square centimeters may be attributable to the presence of animal grazers in the samples
On the basis of the periphyton samples collected from Lake Superior it was found that dry weight values ranged from 1107 to 1112 mg per square centimeter of rock area The mean for this parameter was 1110 mg per square centimeter or 111 grams per square meter This figure compares favorably with standng crop levels that Stokes (1969) found in Stony Point Bay Lake Superior some twenty miles southwest of the Castle Danger area In 1966 he determined the standing crop of periphyton to be 104 grams per square meter whereas in 1967 it was 156 grams per square meter
Periphyton-covered rocks area in Lake Superior were placed
in the experimental pools on October 16 After a two-week period of stabilization during which untreated Lake Superior water was pumped into the pools at a rate which produced two overturns per day additions of phosphorus to the test pool were begun At the dosage used a concenshytration of 163 ppm P was reached in all parts of the pool The second pool served as a control At weekly intervals thereafter periphyton samples were removed from each pool for microscopic examination Growth parameters such as total counts chlorophyll content and dry weight were also monitored
In the course of the microscopic examination forty species were found in the control pool These species were distributed among twentyshyone genera In species composition and makeup the test pool was quite similar For example the number of genera was the same and the only difference was a slight increase in the number of species For details consult Table IV
In quantitating the samples removed from the pools growth parameters were simply related back to the surface area of the rock sample Total cell counts per square centimeter in the control pool ranged from one
61
0
0
0
million to four million with a mean count of 2384000 The five most common organisms in order of abundance together with the corresponding total count for all species are listed in Table V It will be seen that Synedra is the predominant alga on every occasion Usually Achnanthes is next in abundance It will also be observed that diatoms comprise ninety-one percent of the mean total counts for the seven-week period Green and blue-green algae when they appeared were represented exclusively by Ulothrix 2onata Mougeotia and Phormidium foveolarum In the test pool enriched with nutrient total counts ranged from 668000 to four million cells per square centimeter (Table VI) The mean count from these seven totals was 2570000 cells per square centimeter of rock area Again for practical purposes Synedra was the predominant organism Diatoms composed eighty-one percent of the total population The blueshygreen alga Phormidium appeared among the five most common organisms during the last four sampling weeks Its highest number was reached on November 25 when it ranked first in cell abundance Ulothrix 2onata although never appearing as one of the five most abundant organisms was seen on one occasion November 19 The weekly trends of total counts in each pool are indicated in Figure 13 As will be seen from this graph total counts in both pools demonstrated a gradual increase but there was no indication of any significant growth difference between the test and control pool This anomaly can be explained on the basis of overfertilization a factor which is discussed in detail later
The chlorophyll pigment concentrations on a unit area basis for each pool are shown in Table VII In the control pool total chlorophyll concentrations ranged from 1173 to 2548 mg (MSPU) per 100 square centimeters of rock area with a mean value of 1081 The chlorophyll pigment components found in the control pool during 1969 are shown in Figure 14 Chlorophyll~ which is the predominant pigment shows a rather gentle but steady increase after the second week Chlorophyll pound on the other hand although showing an increase after the first week remains rather consistent through the remainder of the season Chloroshyphyll c it will be observed falls off sharply during the second and third ~eek but then climbs rapidly during the remaining weeks The average ratio of chlorophyll abc was approximately 613 In the test pool chlorophyll concentrations ranged from 1147 at the onset to a final high of 2346 mg (MSPU) per 100 square centimeters The mean of 1762 was actually 004 mg (MSPU) less than the control pool average The pigment ratio was approximately 522 a ratio which was nearly the same as the control pool except for the fact that chlorophyll b was somewhat higher The higher chlorophyll pound values are attributed to the fact that there was a greater abundance of green algae in the fertilized pool The original microscopic examination did not reveal the presence of an unusual number of green algae however the possibility existed that very small organisms might be undetectable when the counts were made at 200 power To resolve this question the preserved samples were re-examined under 430 power and this revealed that small green algae were in fact being missed in the counting procedure Test pool pigment trends
62
r-l 0 0 P-lt
r-l 0p H Z~ OeyU-D
ey
~ ~
o UJ U gt lt1lc4-lt 0 I-lt
bull lI-lt I-lt Ul UJ UJ
P-lt bOgt gt
ubll lt1l 0 0Cl Cl I-ltr-l H UJN ~ H~ S H I - u
u Ul U lt1l I-lt o U UJ I 0 gt ~ Ul ~ S
lt1l I-lt Ul H Omiddotr- l I-lt lt1l lt1l UJ bO
Z 0 I-lt
l 0 4-ltCI)~
0 UJ
ugtgt H rn sectsectr-l 0 U
r-l ~ H 0 H
lt1l
~I~ 0
0 ~j 0 U
- Ul() 0
UJ gt ~N1 4-lt 0
gt
II ~I~
0 ~
c sc gt 0 bOb U o U lt1l c I-lt I-lt ~U~ZP-lt~~
gt ND S S lt1l - (1j o 0 ~~ ZZH00UU
55 ~~~]] 0~UUUP-ltP-lt
~~E5555 uu~~~~~
gtgtgtgtgtgt gt (j)(j)(f)(j)(f)(f)(j)
ooooccC)o ~ ~
~I
CI) Z0 H H ~ H gt ~ ~ 0 H
gtlt 0Cl ~
I
I
0 Ul-~ ~ lt1l
lt1l 0 - - Ul 0 o ~ H
H rn
bOUlO UJr-r- en O~UJ I-lt o~ rn 0D bO rn lt1l UJ H I-lt Ul
bO o 0 r-r-
r- jJ 0 - rn UJ (1jr- OJe gt UUJ U o I-lt l
4-lt D Ul D Ul
r- ltt If) jJ
Q) 0 OJ l ccoE-i (1jjJ u
UJ c -
ljlt
o
Sl Ul
UJ c jJ
0 UJ UJ
- Q) Q) U c ~ jJ
Ul 0
Ul - ~ lt1l 0 jJr- o - jJr-
0 U 0
tJr- (1jX - Q) Q) ~
rl r- gtgt CO c U)
UJ lt1l bO
~ (1jM
jJ 0
UJrngt
r- (1j S I-lt
tl 0 UJ H CO 0
-4-lt Q) c gt bO
r- M H ljlt H OJ
0 Q) OJ H
S oUJcc l
~~~ (1j (1j
- l 00 jJr-
gt 00r-
r- 0 c E-i r-
(1j
gt en I-lt Q) gt 0tJ
UJU
(1j 0
1 DCO
- - bO
ljlt jJ ~
0 lt1l 0
en 0 ~
~ UJ UJ (1j jJ tJ jJ U) en 0 UJ jJ rl 0
Ul
UJ UJ
Ul I-lt S Ul bO 0 I
- UJ UJ lt1l UJ l
M H rl 0 bOD
II II
Cl00
lt1l rn
rn - 0
000000()0H0 ~ ~
4-lt 0
~O
~
lt1l - 0 H
Ul
UJ UJ I-lt 0 I
UJ l ~
Ul ~
~
Ul S 0 - rnCl
oooacor---D 0000000000 ---1-1-1---1
0000000 0000000 0000000 t 00 t r--- If) Q N ttt 0000 00 0 -I C)t r--- 0 N 0 -1-1 rirlNtC)
000 000 000
OOOO-lr---C) ~~o N ~j
o 001oo 0 0000middot bull
~o ey o ~ ~ ~
0000000 0000000000000 ~~ tCOtr---OONO ttt co 0 C)N tMtr---C)r---t -I-IrlrlNMC)
O-D N ey ~ N 01UJ C) rl-lN -I - lt1l - gt UCl U 0 UJI
OZ P
63
0 0 0 j
00 ()
N
0 0 0
~ ~
0 0 0
00 ()
0 0 0 ey ~
N II
gt lt1l
UJ
II
Ul
UJ UJ I-lt 0 I UJ l ~
~I1
Ul S 0
P
- (1j
lt1l
I-lt Ei lt1l 0 l S
UJ lt1l lt1l 0
- ~rl r- 0
D ~ Ei - bJ)r-I H U
U 0 UJ
gt-cncrl r-l0P-ltP-lt
II II II II
u 0 u ~(flcrl
r-l0P-ltP-lt
Ul lt1l
Ul Ul l o rn S I-lt S I-lt 0 0 Ul UJ X Oc UJ S gt 00 o I-lt S 0 UJ Nc rnc jj -r- jJ
~ - UJ c 0 c u U~ up(j)(f)~
II II II
EC s -1 tJN+JjNNc) ~ CJ) U) -)
Ul lt1l lt1l UJ rn S c rn ~ H OJ -~ l lt1l gt gt~ U ~ 0 rn Q) r- r- c
(1jr- I-lt ~ c lt1l rn l tJ H rl tJ en 0 rl
gt D - bO pr- N OJ OJ c S gt rn S gt - gtDU gt UJ I-lt o COmiddotr- ~ (1j ~UP~0ZZCl)H
II II II II II II II II II
c S gt bO S gt N gt D tJ ~ Q) H 0 CO -4-J ~ CO ~uP~0ZZCI)H
TABLE VI
TOTAL COUNTS of Naturally-Occurring Periphyton in TEST POOL Lake Superior -- Castle Danger Minn (1969)
[Organisms per cm 2 rock surface]
Date Diatoms Greens Blue-Greens
shyTOTA of Total
D G BG Rank of Five ~ost Common Genera
1 2 3 4 5
Oct 30 1233000 0 0 1233000 100 0 deg Syn Tab Cym Ach floc
Gom
Nov 6 668000 0 0 668000 100 0 0 Syn Cym Ach Ntz Gom
Nav
crshy Nov 12 1458000 deg deg 1458000 100 0 0 Syn Cym Ach Nav Ntz
Gom
Nov 19 2435000 44000 779000 3258000 75 1 24 Syn Pho Ach Cym Gom
Nov 25 2260000 0 1169000 3429000 66 deg 34 Pho Syn Ach Cym Ntz
Dec 2 3262000 0 612000 3874000 84 0 16 Syn Ach Pho Cym Gom
Dec 10 3854000 deg 2l6000 4070000 95 0 5 Syn Ach Ntz Pho Gom
MEAN 2167000 6000 397000
See Table V for explanation
10 [ 1_ Control Pool I I-VV Il- shy
n-
l-
I shy
f shy
4If-
pshy~ r ~1Vf shy
6
crshyLn 1 6
0gt
~ ~5 o
o 12 19 25 2oyeni- fJnv IF Dote (1969)
Figure 2 latJra Iy-occurring Jerpry-or d v-eigrts (per uni- area) In expe r I pools Cas~ie
I ~ake Superr 1969
2570000
1 x I
1
5 x 10⁶
- 4 x I
i ~
x ~ g o
2 x
i~----~~----------
-+____+shy ____________
~--------________________
J6~------------____
1~6 I
~
61 I I I 10 x I J u __ u_ u 25 Oec 2 Dec -- 969
lt ore rn I i ormiddot I 668
gune 13 Total counts of naturallyshyoccurring peniphyton mental pools Castle Lake Superior 1969
Cym
TABL VII
of Igmer7 Concentra7ions
0 0
r~ov
lov i 2 O 0 235
iJov 19 I I 104 o
73
I
I
I
2
13 13
12
12
11 11
r-1~ 10 E 10 B u
o g 09o
08 OB - shy
(J) CONTROL POOL (J)
07 ~ 07 0
~ - 06 06 i 05 i 05
o (o
c B04u
01
02
01
I _ 19 25 2 10
NOV-( 1969)shy
o I I~ _I _ _~ I
--DECshy
TEST POOL
1 12
---- shy
gure 4 Natu phy 1 1
r i phy 7 0n
iers (per ~~i7 Cas+le Danger
Superior
loro- Fi I bull ratu a I I I ng per i phyton I I concentrations (per unl- aeal
r Test Pool J Castle Danger ~ake
i or 969
were essentially similar to those of the control pool This may be clearly seen in Figure 15 If the chlorophylls are lumped as total chlorophyll it will be found that total values in the control pool were significantly higher than in the test pool during the first two weeks (Figure 16)
In light of the fact that total counts of organisms for both pools ere quite similar the wide difference in chlorophyll concentration at the outset is an intriguing phenomenon Several explanations are possible but none can be substantiated and there is no reason to suspect the analytical procedure or the sampling technique Therefore it is assumed that the chlorophyll level shown is reliable The rapid decrease of chlorophyll in the control pool followed by a subsequent and very large increase is a point which needs to be considered One possible explanshyation would be that the lake periphyton which had been transferred to the control pool required a three week adjustment period During this perjod of adjustment chlorophyll concentrations declined possibly as a result of sub-lethal effects of increased sunlight This condition could have been created as a result of water depths in the experimental pools being slightly shallower than that found in the original collection area of the lake Weather data for the two weeks during which chlorophyll levels declined in the control pool shows that bright sunny conditions prevailed for the majority of the time In the test pool on the other hand there was no decline in chlorophyll probably as a result of the stimulating effect of the large amounts of fertilizer added Thus while certain organisms in the test pool were adversely affected others were responding favorably and the result was demonstra ted as shOlVD in Figure 16 by a net increase of chlorophyll After November 12 chlorophyll concentrations increased markedly in both pools and followed the same general pattern By November 25 the total chlorophyll concentration in the control pool was identical with that found in the lake at Castle Danger Although after November 25 total chlorophyll concentrations in the test pool dropped below those in the control the difference between the two values was not great On the basis of chlorophyll conce71tration therefore the phosphate-treated pool was no more productive than the control This is shown 1n Table VII where the mean values cited for the control pool and test pool were 180 and 176 mg (MSPU) per 100 square centimeters respectively
During this test period the pattern of non-astacian carotenoid production was quite similar to that observed for chlorophyll with the exception that values for the latter were much higher Non-astacian carotenoids in the control pool varied from 043 to 059 MSPU per 100 square centimeters whereas those in the test pool ranged from O 065 MSPU The mean value for the test pool was 0496 MSPU per clllL and
2that for the control was slightly lower 0489 MSPU per cm The astacian carotenoids Gid not follow the pattern of the chlorophylls and non-astacian carotenoid pigments Compared to other pigments they were very low The mean concentratton in the control pool was 0065 MSPUcm2 that in the test pool was 0059 MSPUcm2 (Figure 18)
68
Control Pool
Test Pool
M
N E o o shy3 shyltf)
i
I - - )0shy
r shyo a o - r u
- ~ o I shy
L I nLm I I 30 Nov 6 Nov 12 Noy 19 Nov 25 Dec 2 Dec 10
-1969 shy
Figure IJ pool
69
~ ~
~ bulli
0
~------- ~~~~J)
[) N
() In addition to microscopic counts and chlorophyll analysis dry C L 0 weight can be used to express productivity Results of dry weight o OJ 0 t-- 0 0 L analyses for both pools at Castle Danger are presented in Table VIII gt-shyr
0 and Figure 12 Dry weight values remained fairly constant in both pools 0 U) m L - C +- Q) with a mean of 736 mg per square centimeter in the control and 687 mg L 0 C 0
-1 CL+- E tn 0)- ill in the test pool However there was a slight increase in both pools
(1J - by the end of the period of observation and the control pool slightlyUlLLQ) C+-Q)Y exceeded the test pool in dry weight Expressed in terms of dry weight
C Q (1J
L Q) X-J the standing crop of periphyton in the control pool was 74 grams and L U OJ
c that in the test pool 69 grams per square meter These values are o C L Umiddot- III somewha t 10vler than the values obtained for comparable periphyton collec ted
OJ o ~ C in the lake In making these comparisons it must be remembered that
(1J (1J N oWCJ periphyton samples were collected from the lake on three occasions only
--- C L l] () ill G) Also one must consider the fact that in the manipulations involved in L f shy_-10+-+-0gt transferring periphyton-covered rocks from the lake to the Castle Danger~~ -t-- L lfl0
CrD ((J
0--
m G pools mechanical dislodgement of a portion of the growth occurred and Z U J ()
that this in itself would result in an initial dry weight reduction lake periphyton remained remarkahly constant (1107 shy
ltD and at levels which were never regained by the rocks
QJ placed in the experimental pools Since for practical purposes dryL -J weight values were the same in each pool it may be concluded that the OJ
high phosphorus dosage applied to the test pool was not effective in promoting an accelerated rate of periphyton production This conclusion is supported by the results obtained in studies of total counts and the chlorophyll concentrations If one considers the final observations only there is an indication although a very slight one that periphyton growth was a little better in the control pool In order to determine
o I +-0 whether or not the parameters above are comparable correlation coefficients
L ~ 0 Oro+- were calculated for total counts and total chlorophyll values from eache QJ CLO experimental pool In addition to facilitate future estimations ofuroG
numbers of periphyton organisms based on total chlorophyll concentrationC+shy0middotmiddotmiddot +- regression lines were constructed using the least squares method Total I C ro c)gt ~ r--- counts (y axis) were plotted against total chlorophyll values (x axis)
pound (J) 0 n L L_ The two regression lines are presented in Figures 19 and 20 along with
QJ 0 t a +- Q) the correlation coefficients (r) the probability values (p) and the ill - 1J C Q 1JJ equations for the slope of each lines In both pools the two parameters
cn -J J
Oeu were found to be positively correlated with the correlation coefficients (r)C 0 C(f) ranging from 086 (p = 001) in the control pool to 0885 (p = 001) in thegtshy L +- () l ((]laquo test poolo -) L rD 0
U +- +- fl U L C o ill Q) D iJith 6000 to 8000 I () E c gt- c to and approximately 20 o
0-
L U tV U1 returned as by-pass water a series of small scale were
(1J Cl ill L - x- formed which cascaded dmvn the rocky shore and in to the lake These J l)ufgt- c streamlets although extremely shallow provided an environment very roc C m
Z n- U favorable for the growth of algae The predominant species found in the bY-pass water was Ulothrvix zonata In the fringe area of the same flow where water did not move so swiftly diatoms by 8ynedra and grew profusely The growth of increased
Q)
as weather approached Even during the last few weeks when a crustl J l)j
U
71
001 I (1ldS~l) I I AydoJO I Yl
70
gtlt 0 0 0
+
00
0 -D -D 0 00 0
N 0 0 I
0 0 Q
- 0 a f-z 0 0
m CD m lNI
TABLE VIII ~-----------------------------------------------------l~
gtlt 0 0 0
N
+
N 0
0gt 0 Lf)
00 0 00 0
N I 0 0
gt- n
Q sect f shyrJJ UJ f-
gt0N L 0
(l CLDry Weights of Naturally-Occurring Periphyton o - o
L+shyIn Experimental Pools Castle Danger Lake Superior 1969 o m o co QlO
C -f- 0 U 0
~ ltJl CEMILLIGRAMS PER SQUARE CENTIMETER OF ROCK SURFACE u J 0
CD
N
DATE
October 30
November 6
November 12
November 19
November 25
December 2
December 10
MEAN
CONTROL POOL
670
642
661
664
679
905
934
736
72
Ul +- L Cgt L gt 0 Cgt OJ --c shy
gt rr L - QlTEST POOL
L0 L rrgt -f- CD J
Vgt C rru)
E o Ol(l) U C_L751 0shy 1) sect _ L --
ill L_ c ~480 U L
c - U OJ o OJ
~ C I C666 () gt- iJ Cogt cn
UJ rtl Q) Ql Lshy
672 -~1 t shy ei) +- (J)
I shy QJ rJ (T]700 (y r- (_)
707 C) CJ
Q)832 l 1
0) N
901 X ZW3 lad swsudJO LL
687
CD -
In - +shy1 L_ Ii
tIl L m 1_ ) C) 0 CD ( - W gt (j (l
0- shy(f) I () I- gt- (I r - rr t_ 0IN~ o (Jshy
Vgt ~ () L ) L Q)~ 1 I- c
ill m r )csectJ c L 0 l
() Q)
-x - L r rn o 0 _J ~ c
r+ U) rrgt-- In 0 c I
Cogt Q) l Ll Q) ()- 0 0) -- l~ C OJL Q) (J
PL U rr CI shy
0gt- n Q)
J 0)
901 X ZW3 lad SWSudJO
73
L
lL
of ice formed on the rocks this hardy alga grew nicely in the water which flowed under the ice This agrees with observations made by Castenholz (1960) He found growing under similar ice coatings along the shoreline of Falls Lake Michigan Ulothrix is also favored by water movement This is demonstrated by the fact that it is found in abundance along the North Shore at the waters edge where constant wave action provides the needed agitation In the experimental pools Ulothrix was scarce One reason for this may have been the reduced velocity of water flow
In 1969 water temperatures Jere taken twice a week Temperatures in the pools and the lake were for all practical purposes the same During the first five weeks of the experiment the average temperature was 42 degrees Fahrenheit (56 degrees C) During this period there was never a serious temperature variation between the pools and the lake For this reason it was concluded that at this time of year the comparatively slow overturn rate of 6000 to 8000 gallons per day was sufficient Cold water although favorable fa r the growth of certain diatoms and is inhibiting to the development of certain green or blue-green algae This is supported by Cairns (1956) who concluded that the optimum temperature [or most green algae in an unpolluted stream was 30-35 degrees C (86-95 degrees F) and for blue-green 35-40 degrees C (95-110 degrees f)
Accor1ing to Lake Superior data presented by Stokes (1969) periphytic algae in cleeper water (20-35 feet) tend to have an increased chlorophyll concentration in response to lower light intensities He found that total chlorophyll concentrations per unit area were greater at thirty-five feet than they were at 25 feet -Ihil( this can be explained on the hasis that in the deep water area with low light intensities a compensatory amount of chlorophyll is produced by algae another explanation is applicable in very shallow water At depths of three feet or less for instance differences in chlorophyll concentration can be explained on the basis that in shallow water the near ultra-violet rays may exert a lethal effett or on the basis that wave action during storms or unusual and temporary currents have swept the rocks clean and there are actually fewer organisms present At Clst1e Danger light penetration into the relatively shallow pools could have limited total chlorophyll production by its lethal effect but there was no possibility that wave action or strong currents would even pnrtially denude the rocks Other factors such as ice formation and the lower sun angle hrought on by the advancing season could presumably affect the production of chlorophyll and the numher of organisms for example the formation of a physical barrier which would reduce effective light penetration The first hard freeze occurred on November IS at which time a one-inch layer of ice was formed over approximately one-half of each pool Since there was no accumulation of snow on the ice it was assumed tbat sunlight was not drastically cut In the following weeks ice gradually increased in thickness and had to be removed whenever samples were taken By December 2 it was almost three-inches thick and covered with a fluffy half-inch layer
74
of snow However at no time were the pools covered completely with ice At least one-third of the surface in each pool was always open as a result of the constant flow of lake water An inspection of the data obtained gave no evidence that there had been any limitation of growth ascribable to light reduction by the ice cover Chlorophyll did increase at the end of the season however so did the count of organisms In this connection it should be recalled (Round 1965) that at low tempershyatures it is the light intenSity rather than a temperature change which affects the photosynthesis and the productivity In the Castle Danger pools organisms continued to increase as did chlorophyll until the end of the period of observation It is apparent therefore that enough light was available for continued growth even after a partial ice covering had formed
The data collected in 1969 indicated that phosphate additions at the level used did not increase periphyton production In terms of numbers per square centimeter the mean total counts were only 200000 cells per cm 2 higher in the test pool than in the control pool furthershymore mean total chlorophyll and dry weight values were actually higher in the control pool than in the tes t pool One explanation for this anomaly is that phosphorus which was being added at a rate which produced a final concentration 320 times greater than that nonnal for Lake Superior may be an inhibiting factor This possibility has been shown to he true by Rodhe (1948) He found that when inorganic phosphorus levels were greater than lOlg pil (001 ppm P) the grmth of certain algal species namely and was inhibited He discovered moreover that other species may tolerate higher levels
Also of interest is the work of Hamilton (1969) wbo used a complete nutrient media solution formulated by Rodhe in 19l18 Hamilton found in laboratory enrichment experiments on water from Cayuga Lake New York that when the medium was added to Cayuga water there was no algal growth enhancement Ultimately he discovered that when phosphorus as K2HP04 was removed frolll the medium grmvrh enhancement did occur In this instance the phosphorus level of the complete nutrient media was 29 pg-atomsl (0899 ppm P) This is a value at least thirty times higher than that found in Cayuga Lake Hamilton concluded that this was a case of phosphorus inhihition although he admitted that other components of the medium might also have been involved in terms of some unrecognized interaction Since at Castle Danger the only addition made to the water was P any inhihition which occurred must be attributed to the presence of this element in excess or limitation imposed by the lack of ni trogen In the latter instance even though phosphorus enrichment had oecurred growth would he ] ind ted by the absence of the nitrogen Further support for the contention tllat phosphate was the limiting factor in the Castle Danger experiments during the Fall of 1969 may be found in the f ollmbulling reports Fitzgerald (1969) found that growth of was delayed when P04-P values exceeded 5 ppm Similarly Swingle and his co-workers (1963)
75
found that algal response in a fish pond was delayed for 30-60 days when phosphate alone was added as a fertilizer Another explanation for the lack of response to heavy phosphate enrichment in the Castle Danger experiment is that there was a highly disproportionate ratio of N to P In this case the eatio was 310 rather than the more commonly accepted figure of 151 In suppoet of this view it should be pointed out that Whipple (1902) Patrick (1948) and Munawar (1970) have indicated that nitrates are extremely important to diatoms Furthermore Kott (1968) and Christie (1969) working with algae have established that phosphate must be combined with nitrate if growth enhancement is to take place
Visual inspections of the Castle Danger pools supported the quantitative studies and revealed no apparent differences between the t]O pools Periphyton-covered rocks retained the original br01vn color characteristic of diatoms in Lake Superior In no way subtle or othershywise could one tell that one pool was heing heavily enriched with nutrients while the other received lake water only
The principal diatom genera encountereu in 1969 were similar to those found by Fox (1969) In his studies of several North Shore stations on Lake Superior Fox found that the most predominant genera were lelmonllteD Nav1(u7a and Total mean counts from eleven stations studied him ranged from 1460000 oeganisms to four million organisms per These figures are almost identical with those found at Castlo Danger where counts in the control pool ranged from one million organisms to four million organisms per square centimeter of rock surface The test pool results were only a trifle lower namely 61i8OOO to four million organisms per cm 2 bull
As a result of the experience gained and the in 1969 the research program was modified and
greatly expanded in 1970 Because the sanplinr season was longer it was possible to follow seasonal trends in addition to instituting modifications of various physical and chemical procedures essential to the experimental design Weather and lake conditions dueing the sampling peeiod extending from July 9 to November 25 were unusual For example durin the months of July and August the ambient air temperature was cons iderably higher than the average Clima tolorieal data obtained from the Heather Bureau at Duluth Hinnesota showed that noon-time temperatures exceeded degrees 17 nearly fifty percent of the time Also during these months there Has little wind and the lake was extremely calm inds [rom the northeast or east were reported on only four occasions and velocities never exceeded 17 knots Northeast and east winds represented only six percent of the total In September and the ensuing falJ period however a number of severe storms developed dueing which
76
high waves were produced and the lake became exceedingly rough One such storm occurring on November 3 not only washed waves over the pool walls (Figure 21) but also damaged the pumphouse by pushing out its back wall On November 23 strong northwesterly winds and the attendant cold temperatures resulted in a temporary shut-down of all operations Strong winds reaching velocities of 20-25 knots broke down power lines and produced a power outage in the Castle Danger area which lasted some fifteen hours As a consequence of the exceedingly cold air temperatures and the interruption of water flow brought about by the power outage most of the pipes froze solid and cracked Efforts were directed immediately to the replacement of the frozen pipes and to the rtepair of the pump After several days all facilities were repaired and operations again resumed Unfortunately on the very next day Decembee 3 a violent storm churned the waters of Lake Superior into waves which were estimated to be at least twenty feet high These huge waves through constant pounding eventually demolished the small 6 by 8 pump house which served as the control center for the project (Figure 22) For practical purposes this brought the project to an end on December 4th Because of the advanced season and the propsect of additional storms no attempt Vas made to rebuild the structure and start anew
FOe greater clarity and convenience in reporting the remainder of this chapter has been divided into six parts each dealing with a slightly different aspect of the periphyton study The first section is concerned with laboratory or so called bench studies Lake Superior periphyton The second section deals with the istics of the natural lake periphyton occurring on rocks with those placed in the control and test pools The third part deals with the growth and characteristics of natural periphyton undee conditions found in the experimental pools and the fourth is concerned with the regrowth of periphyton on rocks introduced into the same pools The fifth and sixth sections deal with water temperature data and certain supplementary observations
Incubator studies To arrive at some idea relative to the effect various nutrient levels might have on Lake Superior periphyton and to determine the dosage to be used in 1970 preliminary laboratoey studies were undertaken using specially modified BOD incubators Phosphate and nitrate levels comparable to the dosages which had been theoeetically calculated as desirable for the experimental pool at Castle Dangee were maintained in two of the test incubators Two other incubators served as controls and these were supplied with normal unenriched Lake Superior water collected at Castle Danger
Several periphyton-covered rocks were collected from Castle Danger placed in enriched and control circulating water systems in the incubators and allowed to grow for a period of twenty-six days at a constant tempshyerature of five degrees centigrade and a light intensity of one hundred foot-candles At weekly intervals samples were removed and total chlorophyll analyses were made As indicated eaelier no enriching substances were
77
Figure I Novnmber Northedster at Ie [langer Lilke Super 970
house ng December 3n1Fiqure
78
added to the lake water used in the control However in the test incubator the Castle Danger water was sUP~lemented with 0163 ppm P (05 ppm P04) and 245 ppm N (871 ppm NO) The growth trends of
based on chlorophyll values during the 26 day period is shown in Figure 17 p 70 The mean chlorophyll value for the control was 0529 while that for the enriched water was 118 mg (MSPU) per 100 square centimeters Thus it will be seen that on the basis of this parameter the periphyton growth in the enriched water was more than twice as great as that in the control On the basis of this preliminary study it was apparent that the proposed nutrient level was satisfactory and this dosage was therefore adapted for the subsequent field tests which were carried out at Castle Danger during the 1970 season
The collection area for samples one-quarter mile from the
experimental pools (See Figure 8 p 40) Periphyton-covered rockswere collected in twelve feet of water using SCUBA technique and then brought back to the pools to be incubated for the summer and fall periods A general examination was n~de on a portion of the original samples collected Two such series of collections were made one on June 5 and the other on July 1 Microscopic examina tions revealed that periphyric organisms had changed very little from those f0und in 1969 (See Table IV) Synedra was the most common organism followed by Achnanthes CymbeUa and Nitzschia Total counts per square centimeter of rock area 600000) Ivere nearly identical with that found in 1969 Total and individual chlorophyll contents for qhe two samples collected are presented belDlV
Mg (MSPU) Chlorophyll Per 100 Square Centimeters
Total Date Chlorophyll ~ Chlorophyll b Chlorophyll ~ Chlorophyll
June 5 0379 0019 0150 0548
July 1 0423 0021 0193 0637
Mean 0401 0020 0171 0592
The chlorophyll values are lower than the averages found in 1969 This most likely is due to seasonal differences as well as differences in water depths from where the samples were collected The high chlorophyll c values are to be expected since the majority of the organisms (91) observed were diatoms Dry weight analyses on the samples collected (989 m~cm2) revealed a slight decrease from that observed in the fall
79
of 1969 Here again comparisons are at best only estimates since so few samples were collected In general it could be concluded that the 1970 samples obtained from the lake were nearly identical to 1969 in terms of species composition and total counts ParMleters such as chlorophyll and dry weight were lower than that of 1969
Natural periphyton experimental pools Periphyton-covered rocks collected from the lake were placed in the experimental pools on July 1 After a five day period of stabilization nutrients were introduced with the intake water into the test pool The other pool received untreated lake water only and served as a control Thereafter sample rocks were collected from each pool on a weekly basis and periphyton was removed in the laboratory for quantitation The data obtained covers the period from July 9 to November 25
Organisms were first identified and species were recorded in the form of a checklist (See Table IV) From this tabulation it will be seen that the organisms are grouped in three phyla forty-five genera and some seventy-three species Twenty-seven of the genera that is sixty percent are diatoms Diatoms also make up seventy-three percent of the species found Except for seltulana no species of chrysophytes other than diatoms were seen in the periphyton samples Chlorophytes green algae were represented by eleven genera There were only thirteen species which represents eighteen percent of the total number of algal species identified Six species of blue-green algae were found and these were distributed among six genera If one examines that tabulation in more detail it will be found that almost twice as many species were reported in 1970 as in 1969 The most obvious explanation is that the period of observation in 1969 was seven weeks only as compared to twenty weeks in 1970 and a greater number of samples were examined over a period which varied somewhat with the advancing season Further inspection of the data will reveal that a significant number of green and blue-green algae developed in the periphyton of the control pool whereas only five species were observed in the lake itself In this connection it should be realized that a certain element of unnaturalness exists in the control pool when comparisons are made directly with the lake These factors involve such things as shallowness of the water slightly elevated temperatures and difference in water movements In spite of minor differences the species make-up of the lake and the control pool is essentially the same and both can therefore serve as a baseline for the evaluation of the changes which have taken place in the test pool Organisms identified and encountered in the test pool are also presented in Table IV In this instance a total of thirty-eight genera and sixtyshyone species were recognized Fifty-eight percent of the genera and seventy percent of the species identified were diatoms Except for a slightly smaller number of genera and species the test pool resembled the control pool and the lake in diversity of diatom species It will be seen that the blue-green algae and the green algae follow this same diversity
80
When growth parameters such as nlmber individuals chlorophyll and weights are related to the surface area of the rock covered by periphyton the findings are as follows Total counts in the control pool ranged from 518000 to a high of ten million cells per square centimeter The mean for the twenty-week period was 4600000 cells This value is approximately two times higher than that found for the same pool in 1969 Tn Table IX a listing is made of the five most conunon organisms Also included in this Table are total counts including all the organisms and a count of organisms by groups (phyla) As can be seen from this Table diatoms formed the largest group This was true not only at the beginning but throughout the experiment On only six occasions was the most predominant form something other than a diatom and on five of these it was that appeared as the abundant organism In a sense this could be misleading inasmuch as the particular species involved was very small and individual cells were counted Thus in terms of actual volume this form made up only a small part of the total growth The importance of two other blue-greens Phormiriium and Plee I~onema should also be viewed cautiously because of their small cell size Surprisingly
appeared as the most abundant organism on July 29 This alga is usually associated with warm water and was therefore not an expected part of the periphyton growth As a matter of record after its appeArance on the 29th it dropped to fifth place on August 5 and never again appeared in the leading five species As far as can be determined from the literature Pithophola has not been reported as a component of Lake Superior periphyton Among the five most common organisms and 1ehnanthet were the predominant forms in fourteen out of the twenty sampling periods This is in agreement with the control pool results of 1969 and with the results obtained by Fox (1969) in his studies of Lake Superior periphyton in Stony Point Bay
In the test pool much higher results were obtained Total counts ranged from one to nineteen million cells per square centimeter The highest count was recorded during the eighth week (August 26) when a corresponding count in the control pool stood at slightly less than seven million The mean count for all test pool samples during the twenty week period was nine million cells per square centimeter or nearly twice the number (4600000) found in the control pool In the test pool the five leading organisms followed a definite succession in their development At the outset 8ynedpoundoa was dominant as it had been at the time of collection of the rocks from the lake However during the third week July 22 N1tzscmCl palea replaced as the most abundant form and it maintained this position for another week After that the green algae or moved into first position For the remainder of the season in terms of numbers these green algae ranked first as may be seen in Table X This table also presents certain details with regard to group and total counts Numbers of green algae it will be seen ranged fronl 67000 to almost 13000000 cellscm2 The mean value was 5540000 which is more than two times the mean value recorded for diatoms During the twenty-week period of
81
TABLE IX
TOTAL COlmTS of Naturally-Occurring Periphyton in CONTROL POOL Lake Superior Minn (1970)
[Organisms per surface]
--shy of Total Rank of Five Most Common Genera
Date Diatoms Greens Blue-Greens TOTAL D G BG 1 2 3 4 5
Jul 9 1696000 deg deg 1696000 100 0 deg Syn Ach Cym Gom rtzTal 15 1968000 189000 235000 2392000 82 8 10 Syn Ach Pho Ulx Frg 22 4435000 123000 914000 5480000 81 2 17 Syn Pho Ach Ntz Frg 29 3083000 1987000 64000 5155000 60 39 1 Pth Syn Ach Ntz Cym
Aug 5 4159000 515000 1396000 6069000 69 8 23 Syn Pho Ach Ntz Pth 12 5384000 367000 266000 6017000 89 6 5 Syn Ach Cym Pho Clm 19 3945000 114000 61000 4120000 95 3 2 Syn Ach Cym Frg Ntz
(J) ~
26 Sep 2
8 16 23 30
4669000 121000 3430000 237000 2862000 153000 3774000 229000 3574000 339000 4369000 414000
Oct 8 15 22 29
Nov 5 12 19 25
6537000 456000 4609000 291000 5988000 1339000
NS NS 432000 123000 356000 105000 555000 98000 528000 119000
I
I
1701000 1016000
184000 2076000 1283000 1180000
943000 3518000 2771000
S 33000 57000
deg358 000
6994000 4683000 3198000 6078000 5196000 5964000 7936000 8309000
10159000 NS
588000 518000 653000 995 000
67 73 89 62 69 73 82 55 59
73 69 85 53
9 5 5 4 6 7 6 3
13
21 20 15 11
24 22
6 34 25 20 12 42 28
6 11
deg36
Syn Ach Syn Lyn Lyn Syn Syn Lyn Lyn
Ach Ach Ach Lvn
Ach Syn Ach Syn Syn Lyn Frg Ach Den
Clm Clm Frg Ach
Lyn Pho Cym Ach Ach Ach Ach Den Syn
Cym Pho Clm Clm
Pho Cym Cym Frg Pho -Iav Pho Frg Cym enNt2 Cym Ntz Cym Lyn Syn Cym Ach PIc
Syn Ntz Cym Syn Syn ymNt2
CvmiSvn -Itz MEA 3318000 361000 903 000 4 610000
See Table V for explanation
TABLE X
TOTAL COUNTS of Naturally-Occurring Periphyton in TEST POOL Lake Superior -- Castle Danger Minn (1970)
[Organisms per cm2 rock surface]
of Total Rank of Five Most Common GenerTOTALDate Diatoms Blue-GreensGreens D G 2BG 1 43 5
Jul 9 1764000 Pho89000 91 4 Syn Ach Ntz Cym1608000 67000 5
(J) w
240000015 570600022 683800029 5959000Aug 5 806900012 425200019 516800026 2488000Sep 2 19480008 121800016 151300023 104300030
Oct 8 950000 166500015 156500022
29 NS Nov 5 323000
12 343000 19 770000 25 820000
177 000 2316000 3864000 4162000 7378000 3378000 9601000 5479000 5452000 5432000 7575000
10231000 12090000 12785000 11975000
KS 1166000 2314000 3329000 2050000
354000 811 000 438000
2331000 2588000 1641000 4082000 1052000
425000
328000 54000
1143000 148000 479000
NS 76000
313000 538000 733000
deg
2931000 8902000
11154000 12452000 17022000 9283000
18851000 9018000 7916000 6650000 9417000
11329000 14197000 1459fl000 14019000
NS 1565000 3000000 4637000 3603000
82 64 61 48 47 46 27 28 25 18 16
9 7
11 11
21 11 17 23
6 26 35 33 43 36 51 61 69 82 80 90 85 88 85
74 77 72 57 bull
12 10
4 19 10 18 22 11
6
deg4 1 8 I 4
5 12 11 20
Syn Ach Ntz Ach Ntz Syn CZm Ntz elm Szm elm Ach elm Szm Sed CZm Scd elm Scd n~
G m Scd elm Scd elm Sed elm Scd Szm Scd Szm
Sed elm Sed CZm Sed elm Sed Ose
Pho Ntz Cym Szm Syn elm elm Pth Ach Osc Syn Ach Ntz Ach Syn Osc SZTII Syn Lyn Ntz Osc Ntz SZTII Lyn Szm Ntz Ach Ntz 5zm Syn Szm Ntz Lyn Szm Cym Ach Szm Ose Ntz elm Ntz Cym elm Ntz Ose
Ntz Cym Ach Szm Lyn Osc Ntz Pho Osc elm Vlx Ach
MEAN 2732000 5541000 881000 9115000
See Table V for explanation
observation blue-green algae counts were highly variable For example while on August 26 a count of four million was recorded the count on September 2 had dropped to one million and on September 16 to less than ten thousand One explanation for these variations and the unstable population of blue-greens which resulted is that at certain growth levels mats of Ovcillatoria and are formed and that photosynthetic oxygen entrapped in these mats buoy them up to the point where they break loose from the substratum and float to the surface This leaves the periphyton with a low blue-green count until the mat is replenished by regrmlth For much of July and virtually all of August blue-green mats were observed floating as small fragments of scum on the water in the test pool Examination of these scum fragments revealed that they were made up almost exclusively of filaments of Osc-illatoria This phenomenon is similar to that reported by Blum (1957) In his studies of the polluted Saline River in Michigan he observed what he called flakes of Dsci floating on the water Although variable the blue-greens were generally present in sufficient numbers to be included in a listing of the five most abundant organisms and taken together they were included in twelve out of twenty lists or sixty percent of the time
In terms of succession (See Figure 23) diatoms which were the predominant forms at the outset reach their peak during the first two weeks of August and were characterized thereafter by a progressively decreasing abundance During the first weeks green algae increased sharply and by the eighth week they had finally passed the diatoms in terms of numbers They were the predominant forms for the remainder of the season The blue-green algae never achieved first place
As a first step in the evaluation of the data relating to productivity as it is expressed in terms of total numbers of organisms without reference to any given species a graph has been prepared pre8enting the data obtained from the test and the control pool on the same chart This then can serve as a basis for simple comparison This information is presented as Figure 24 It will be seen that after the third week productivity in the test pool which was receiving nitrogen and phosphorus enrichment greatly outstripped that in the control pool Actually after the first week counts in the test pool were higher than the control and they remained consistently higher throughout the period of experimentation In some instances the growth in the test pool was almost three times greater than that recorded for the control pool The downward dip taking place from September 8 to September 16 when there was a rise in the control pool may be explained on the basis that it was a period of northeast winds and high waves On several occasions it has been observed that northeast or east winds can produce waves which may spillover into the pools and on two occasions it was seen that the waves affected the test pool only As lake conditions worsened the control pool was also included This slight differential treatment of the pools resulted from the phY8ical contour of the shoreline No observation was actually made at Castle Danger on September 15 however weather bureau data reveals that
84
20
101 K
lt x
N E ~
~ c
i 0
a 6
4
08
06
04
02
005
0011-1--shy
-----~middotmiddot
bDiatoms --6shy
Greens --Q --shy Test Pool
Blue-~~__~~ --_
OCT
F i gure Tl
85
northeast winds up to 15 knots blew for that entire day and during the first half of September 16 It is believed that in this instance the waves were such that only the test pool was affected and that the force of these waves swept a portion of the periphyton from the test rocks The control pool was untouched and therefore reflected the normal increase expected for that period Another explanation and one which also takes into account the downward trend in the test pool two weeks prior to September 16 is that periphyton populations have reached a point of maximum development after which a sloughing-off effect took place thus making room for new young and rapidly growing periphytic forms This type of phenomenon has been observed quite commonly on filters of sewage treatment plants (Olson 1972) The extremely sharp drop-off in total numbers seen on November 5 is easily explained During the last week in October heavy rainfall along the North Shore was responsible for increased surface runoff which ultimately affected
2xl07
7 I~I the turbidity of Lake Superior water For nearly five days water in the
8xl06 ~ 7x 10⁶ experimental pools was so turbid that it was impossible to sample because one could not see the bottom On November 3 after the water finally~ 6xl06 cleared up a strong Northeaster developed during which massive waves~Jgt---~~
swept over the experimental pools and the ledge on which they had beenp- - --0 I15X106 I I I constructed A visual inspection of the pools showed that appreciable
4xl06 I Ii amounts of the periphyton had been swept away by the waves leaving rocks 0shy partly denuded As a result when samples were collected two days later
rf) 3xl06 I lt I it was found that the total counts in both pools had been decreased rf)
~ nearly fifteen times In the weeks which followed ltlith all operationsz I
I~ 2xl06 progressing normally total counts again moved upward in both pools0 This incident though possibly isollt1 ted points to the f ac t that periphyton
may be detached by wave forces and that at such times the periphyton certainly makes large contributions to the phytoplankton population of the body of water concerned
o
~6
8 xlo5 In addition to evaluating its effect on productivity one of the 7xl05 objectives in placing periphyton-covered rocks in experimental pools~ ~d 6xl05 was to follow the pattern of succession induced by the changes imposedbd 5xl05 in the new habitat It was hoped that the enrichment added to the test- - - - - Control Pool
pool would produce changes in the natural periphyton population of Lake Superior which could be seen and measured so that one might anticipate and possibly prevent the harmful effects of adding potential enriching substances to the lake in the future To this end eight genera were selected for special attention including an evaluation of the group response to controlled enrichment The eight genera involved were
-o---T05t Pool
t Nitzschia Synedra Aehnanthes Cyrrl)[lla 8cenedesmus Schizomeris and ()scillatoria In this study attention has been shifted from total counts of all organisms encountered to counts of organisms
II (N S)
within a genus A synopsis of the maximum and minimum and of the mean counts for each of the eight genera will be found in Table XI In dealing with relative growths in the test and in the control pools graphical comparisons of productivity in terms of numbers of individuals have been made for each of the eight genera The data are presented in the
Figure 24 Natura Ily-occurring periphyton tota I counts (per unit form of eight graphs (Figures 25 to 32) In the test pool as mentioned area) in experimental pools Castle Danger - Lake Superior 1970
87
86
----
Organism
CHRYSOPHYTA
Nitz8chia
en (Xl
CHLOROPHYTA
CYAIWPHYTA
Oscillatoia
Overall Mean
ABLE XI
Average Abundance and Population ~agnitude of Predominant Genera amoung Naturally-Occurring Periphyton in Experimental Pools
Lake Superior - Castle Danger ~inn (1970)
Counts expressed in terms of cm- rock surface
euro1 0 0 0 0 Orgonisms per
ltgt
ro N
Di ltD
lt0 u 0 c r(D rN laquod = N
N
J 0 to bull ~ ~ Q oro -1 UJ ~a tfl -t- N - - -+ 1gt _ () C 1l1l
00 0 Gi(i5 co gtD a pound
~ t~ (C ~ +m ~ ~ Q ~ CDshy ~
r s if) shy
0 ~ (J)
~ N CJ)
~
en ill c -+ 0 u c ~] CD o _ 00 lt n
I -I N t-X Nshy
~ () N c to 0
co
z u 0 ~ lt to
Control Pool
Range lean
22000 - 9ll000 302000 38000 - 2442000 1052000
144000 - 1954000 815000 41000 974000 369000
0 0 0
369000 246000 570000
150000 34000 35000
deg 277 000 15000
347000
Test Pool
Range
61000 3000000 45000 1896000 76000 2266000 40000 488000
0 4772000 0 9344000 0 4015000
0 1481000
2 6 cm X 10
0
-~
~ gtshy~ - shy_-r-
Hean
939000 531000 644000 196000
1598000 2715000 1373000
402000
1050000
4
SlNEDRA
2
~
) ()B 8
5
06
amp f 04
x )(
N
1~ ~
a Q 0 bull 2
E~
L
C a 0
0gt
0 2
0 111 bull 1
06
004
Control Pool -_ Test Pool
(1 002
JUL AUG OCT NOV
oi
in ndiur-ally-occuITinq i- Figure 27 Deve ~uper-iorl 1 per i
91
ill o x
I I I
-----i
bull o
J
2
i--Jbull G I
08
6
~ 01
X
~
bull
1 u
v- Ifv shy
~ c o
I I
I I
0 I ~J
004 Control Pool --~-shy
Test Pool -- shy003
------ shyUU2
002
Control Pool Test Pool--
00
JUL AUG SEP OCT NOV
Ii iopmont of Ua in naturaily-occurr-ing pei Figure 29 opmont natur-a ~tlo [Janger - La POI-jor- i97(L pnyton
92 93
q t IQ gt~ 0 Ie 12 21 t t shy
JUL
6
4
2shy
SCENEDESMlJS
08
06
O B
~ 06 ~ 04 x x
(J
E~ 04 Q Co~ Ugt 02
25 1 1 1 L 1 I I I_ __ _ _ __ ~ I J
OCT NOV
~ -E~ 0
~ f) 2 ~ 0 ~
0
-shyO l
1)081
OOG
004-shy
0011 j bull III J 1 I I 1 1 J 1 J 1 I I 1 I J 1011 l l L 9 22 ~ -shy~ 15
JUL
Figure 31 Development of Scfdzomens in gure 30 Development of Scenedesmuc i natural I urrlng periphyton Castle Danger - ke
periphyton Castle Danger - Lake peri
94 95
+
3
2
004
002
I I I I I
Control Pool -shy Test Pool
I I I I
II 1 I I I I I
Nfl
v c o 0 o
8
1
I I I
OSCILLAlORIA
Control Pool Test Pool
gure 32 Govel of OsailZatoY1a in natura periphyton Castle Gangor - ke Super
96
earlier Nitasahia was the diatom which generally predominated As Figure 25 shows Nitasahia increased tremendously during the first two weeks and reached its peak by July 29 The growth was essentially similar in both pools but was definitely higher in the test pool The mean in the latter count was more than three times greater than the control Thi s could be expected for the tolerance and adaptability of Ni~z8arlia to polluting conditions has been widely reported (Butcher 1947 Blum 1960 Philipose 1960 Allanson 1961 Palmer 1969 and Munawar 1970) After compiling a list of eighty of the most tolfrant algal forms Palmer (1969) shows that N was the second-most tolerant species and that Nitz[lciria was the sixth-most tolerant genus The success of Nitzsahia in polluted situations according to many investigators is closely tied in with the nutrient requirements of the alga as indicated by Chu (1943) He found the optimum N03-N level for Nitzschia to be one to three parts per million and established that the phosphorus limitation varied widely (0018 to 89 ppm) At Castle Danger nitrate-nitrogen was added to the test pool at the rate of 196 ppm whereas phosphorus was added to produce 0163 ppm This dosage is well within the optimum limits as indicated by Chu and therefore it seems logical that Nitzsah1a should have reached very high numbers in the tfst pool It will bf seen from Table XI that this organism actually reached a concfntration of 3000000 per cm2 bull The highest previous figure for pfriphyton in Lake Superior is that reported by Fox (1969) His maximum was 129000 organisms per square centimeter
In contrast to Nitzschia which was highly stimulated by conditions in the test pool SynedYa Achnanthes and Cymbe Za were inhibited Synedrgta for example was nearly two times as abundant in the control pool as in the enriched pooL This can be verified by consulting Table XI In this connection it is interesting to note tlwt the
maximum growth of in the control pool 2442000 organismscm is almost identical with the figure of 2523000 organisms found by Fox (1969) in Stony Point Bay Take Superior The means are also very close (1100000 to 1400000) Since the maximum value reported by Fox was from a depth of 25 feet it i[ directly camparable with the depths of the experimental pools Thus one can conclude that with counts so similar the conditions in the control pool were as it had been hoped extremely close to the conditions encountered in Lake Superior itself So far only the mean values have been dealt with however the week to week changes which took place would not alter the conclusion expressed above The details relating to the week by week counts are presented graphically in Figure 26 From this Figure it can be seen that for the first four weeks total counts were not very much different for the two pools However after this initial period one will note that populations in the test pool decreased rapidly The extreme drop which occurred in November and was shared by the control pool is attributable to the effects of a violent ~orthshyeaster
If we now turn to Aehnanthes we find that it too was inhibited in
97
the test pool This is demonstrated by the fact that the mean concenshytration in the test pool 644000 is twenty-six percent less than the growth in the control pool (8l5000cm2) This difference although small is believed to be a significant one This view is based on the fact that although to begin with counts in the two pools were very similar (See Figure 27) the difference became marked at the beginning of September If the period September 2 to October 22 alone is considered which represents the growth period preceding the November storm it will be found that growth in the control pool was more than three times as great as that in the test pool Again if comparisons are made with Foxs data it will be found that in the Castle Danger studies counts are higher In this case 815000 as compared to 300000 cellscm2 bull This difference may be explained on the basis that Foxs studies relate to a wave-swept bay in Lake Superior itself where the effects of even a small storm may be quite drastic At any rate ignoring possible seasonal variations the difference between the natural environment and the control pool is less than one log cycle
Although Za does not as frequently rank with the first five organisms as other diatoms mentioned it is still among the first eight Growth in the tes t pool for some unknown reason went through a series of up and down oscillations which can only be accounted for on the basis that these organisms having attained a certain level of growth are automatically and periodically sloughed off the rock surface to which they have been attached Once more the very low point reached in November can be associated with the effects of the very strong Northeaster on November 3 If reference is now made to the control pool curve shown in Figure 28 it will be seen that rather than reaching its maximum at the end of the first six weeks as was true with and Achnanthes progressively increased for fourshyteen weeks to an eventual maximum of 954OOOcm 2 in the control pool on October 8 It Seems apparent thRt Synedra and Achnanthes demonstrate a preference for the lower nutrient levels which characterize the control pool whereas being less sensitive to higher nutrient levels responded favorably except for certain oscillations which were attributed to sloughing-off The general reduction observed in the diatoms of the test pool which on the basis of the first impression might be ascribed to the harmful effects of high levels of enrichment could also be explained on the basis of competition on the part of green and blue-green algae
Ch10rophytes the experimental pools exhibited tremendous growth differences The involved Jere Seenedesmus and Sehizomeris were the first to appear As one will see in Figure 29 its numbers in the test pool increased tremendously after the first week and a high point of 4700000 organisms was reached on August 26 After that time numbers decreased to an eventual low of 373000cm2 which was reached after the severe storm of November 3 Development of in the control pool although signficantly lower showed a increase which reached a maximum of 369000
98
organisms on October 22 This is eight weeks later than the maximum observed in the test pool The mean count of in the test pool was over ten times greater than that in the control (See Table XI) The strong development of this alga in the enriched pool is not surprising since it is widely known that it grows well in sewage stabilization ponds and other highly enriched aquatic systems (Palmer 1969 Singh 1969 and Munawar 1970) Palmer (1969) for example has ranked the genus Chlamydomonas as the third most tolerant genus of all algae Fox (1969) does not report this genus probably because the organism was present in very small numbers only Because of this there is no basis for a comparison of his data with those at Castle Danger It should also be noted that the periphyton collected directly from the lake during the present study did not contain a sufficient number of to be listed among the first five organisms As a matter of fact it was never seen The possibility exists that ChZamydomonas is always present in small numbers in the periphyton and that when a more sheltered environment such as the experimental pools is provided it may be expected to appear in sufficient numbers to be counted
By the time Chlamydomonas had reached its peak Scenedesmus made its first appearance in the test pool As will be seen in Figure 30 this alga was characterized by an almost unbelievable growth increment which was observed in the test pool but not in the control pool At the time that the control pool finally reached a count of 110000 organismscm2 (October 8) the test pool count stood at nearly nine million Again the drop which occurred in November can be ascribed to the storm which was reported earlier Counts in the control pool were generally low and Scenedesmus did not appear until September 2 Its cyclic appearance after that date has not been explained Mean counts for the control pool and test pool are presented in Table XI They are 2715000 for the test pool and 34000 cells per controL As with Nitzschia and ChZamydomonas Seenedesmus is considered by many as a pollution tolerant organism Palmer (1969) ranks it fourth Godward (1937) observed that Scenedesmus quadricauda was definitely associated with the reed-swamp habitat and the presence of excessive amounts of organic matter Brook (1965) in summarizing some of Naumanns data stated that bullbullbull the green alga Seenedesmus is not a significant constituent of the pelagic plankton of oligotrophic waters although it is often common or even abundant in eutrophic waters Although it may be present in the littoral region of oligotrophic lakes the lack of adequate nutrients prevents it from establishing itself in deeper regions bull In a previous study by Fox (1969) the highest mean count recorded for Seenedesmus quadr-ieauda was 28000 cells per square centimeter of rock surface This was recorded in 1966 for periphyton collected at a depth of five feet in Stony Point Ray Lake Superior The fact that the enriched pool at Castle Danger reached a count of more than nine million organisms indicates tbat Scenedesmus is one of the organisms found in Lake Superior which responds very favorably to phosphorusand nitrogen enrichment
99
If one now combines the growth curves of all three genera an interesting succession of will be seen (Figure 33) Three separate peaks of increasing heights are visible in this graph of the results from the test pool It should be realized at this point however that succession is an extremely complicated phenomenon which brings into play many important biological chemical and physical factors In order to make valid conclusions several years of observation may be necessary For these reasons the succession noted in the periphyton at Castle Danger should be viewed with caution and the realization that a more in-depth and lengthy study would be needed However to add support to the seemingly apparent succession pattern observed in the test pool investigators such as Singh and Saxena (1969) have similarly noted the succession of by Scenede[JmUIl On a seasonal hasis they observed a consistent cycle in the grmgtth and disappearance of these algae in sewage stabilization ponds in India
Another alga seen in this study and one not previous Iv renorted for Lake Superior periphyton was the filamentous green alga LeibleinU Although this is the only spec ies reported in the United States and is widely distribu ted it is not a common alga It is interesting to ohserve therefore that in the enriched test pool this organism reached a concentration which in terms of numbers ordinarily exceeded that of
llatoria For example in the test pool counts of [J averaged 1370000 cells per cm 2 and on August 26th reached its maximum of fou r million This organism was observed in the control pool on only three occasions Based on this limited number of saJl1ples the control 35000 and never reached a count greater than 570000 cells per SchizomeIB was never observed in samples taken directly from the lake It is presumed that SeJd zomeris in very small numbers did occur in the lake but that the water movement and currents characteristic of the inshore areas kept ita t a very low level Upon entering the tes t pool violent water movements were eliminated and consequently the organism thrived Another explanation and the one favored by the author is that
was present in Lake Superior water in undetected quantities but that upon encountering the favorably enriched environment found in the test pool it responded rapidly to the high nitrogen and phosphorus levels which existed there The latter view is supported hy Prescott (1964) who stated There is some evidencE that the plant favors ater rich in nitrogenous matter ltmd is to he looked for in shallow water of lakes near the entrance of drains effluent of sewage treatment plants etc~n
It should he menttoned that especiaLly at one period in its growth closely resembles is sometimes confused with that genus However a ~JOrker who observes these two genera on a continuing basis has no difficulty in separating the two and in the event that as is stated by some [ichizomerlB merely is a growth form of the separa tion is s ti1 1 valid and useful because it ref]ec ts a maj or change in the environment In the Castle Danger studies the typical UZothl1X
100
61shy
4
Y-
2
08
~ - 06 x
N~ 04
c
~ g 02
o
005 I
I
A
01 f-I--t-----
--~
~~
r
NOV
Figure 33 n ( I
i-he
I
lCll
was observed in both pools In the test pool it occurred very sparingly however in the control pool while it was never abundant it could always be found The details of the Schizomeris response in the study of the pools are presented in Figure 31 It will be seen that after a two week lag Schizomeris LeibZeinii numbers increased very rapidly By the third week counts had reached one and one-half million and by the eighth week its maximum of four million was reached As one looks at the graph one detects two periods of major growth one on August 26 and the other near the end of October It is believed that the sharp decline seen on the 16th of September can be ascribed to a storm on the 15th during which time large waves breaking over the test pool wall produced a certain amount of scouring in the test pool This theory is supported by the fact that following another severe storm on November 3 another precipitous decline in numbers can be seen on the graph As pointed out earlier Schizomeris organisms were present in the control pool on three occasions only July 22 September 2 and October 22 Between these periods the organism was not seen No explanation is offered for this phenomenon inasmuch as the inspection of the experimental records reveals no incident which can be related to the sporatic growth of SehizomeYis in the control pool
Although OsciUatoria was observed on only one occasion in the intake water coming directly from Lake Superior (Adess et aZ 1971) observed rarely in periphyton from the control pool it grew the test pool As one will see from Figure 32 the growth of
and
seem to be cyclic This is probably due to a periodic sloughing-off which takes place when the OBeiZZatoria growth has produced a mat which will imprison bubbles of oxygen produced in photosynthesis When this happens the algae mat is buoyed up by the 3xygen bubbles and portions are torn loose and float to the surface This effectively reduces the count on the rock substrate Since llatoria is notorious for its favorable response to enrichment it is not surprising that it should reach high levels of concentration in the test pool In this instance the
2maximum was 1480000 and the mean was 402000 cells per cm Palmer (1969) places OsciZlatoria in the second position in his long list of pollution tolerant algae He considers the species O tenuis as the second most tolerant species of the group Although two or three species of Oscillatoria were observed at Castle Danger only the most common O tenuiB was identified to species It was felt that for the purpose of this study identification to genus was sufficient for species that were very rare The highest OscilZatoria counts coincided with the period in July and August when water temperatures were at their highest While other blue-greens such as Phormidiwn and contributed importantly to the total overall counts these algae were so small that for practical purposes their total cell counts although exceedingly high actually represented a much smaller contribution in terms of algal biomass This should be kept in mind ~vhen the tabula tions are examined
Another growth parameter monitored throughout the course of these experiments was the level of chlorophyll reached by each sampling date
102
A ummation of these findings will be found in Table XII On the basis ofSthiS tabulation it will be seen that in the control pool total chlorophyll values ranged from 002 to 2167 mg (MSPU) perlOO square centimeters with a mean value of 0846 In the test pool ~t ranged from 0561 to 4861 and the mean was 281 The details presented in Table XII are also presented in graphical form from Figure 34 to 35 inclusive Figure 34 shows a comparison of the results obtained in observations of the total chlorophyll values for the entire period of the experiment Chlorophyll concentrations on August 12 it will be noted were at a near maximum in both pools During the next week chlorophyll values dropped dramatically in each pool The best explanation is that temperature shock is involved Evidence for this can be found in the records for the week August 12 to August 19 which indicated that the lake water temperature which on August 12 was 70deg F had plummeted to 48deg F one day later A low of 44deg F was reached on August 17 By the second samplirg date August 19 the temperature had risen to 49deg F only Mindful of the very considerable drop of 21deg which occurred during this week and the fact that temperatures had not returned to their original levels even at the end of this time one can with some degree of assurance say that the drop in chlorophyll on this occasion was largely due to the reduced metabolism of the algae in the periphyton Another possible explanation which might have been responsible for a part of this drop is that the organisms sloughed off and lost to the plankton were not replaced by new individuals under the low temperature condition which prevailed
During the week which followed chlorophyll values in the test pool again reached their normal levels Values in the control pool however never reached their original level On September 16 another precipitous drop occurred in the chlorophyll values of the test pool This is attributed to the purging action of a Northeaster It is believed that high waves produced by this storm on September IS the day preceeding the taking of the sample swept up the face of the rocky ledge and spilled into the test pool where they produced a current of sufficient velocity to partly denude the test rocks The control pool as can be seen was not affected This is in keeping- with earlier observations that at the wind velocities involved on September 15 (21 knots) waves will not spill over into the second pool By October 8 the test pool had recovered from this purging and chlorophyll levels had reached 486 mg (MSPU) At this time ScenedeBrTlus was the predominant organism On November 3 another Northeaster even more severe than the first (wind velocity 30-35 knots) swept waves into both pools A corresponding reduction can be seen in chlorophyll levels in both the test and control pool By this time the weather was quite cold and in terms of chlorophyll levels neither pool recOvered from this episode
The data for the control pool presented in graphical form in Figure 35 represent a refinement of the information presented in the previous Figure In this instance the total chlorophyll value has been translated into corresponding values assignable to chlorophyll a chlorophyll Q and chlorophyll c Chlorophyll averaged 0552 mg per
103
COC8tiai ltSgtL) - S of Na~urall i1g agte SlJcer-or Cas-- e Danger ~inr 970)
125
678 bull Lt8+
O O
O 76 D Jlf
L
1 L
91
26J
2~38
2258 ~
bull [+7
3311
026
21(1
81 J=-S7
115
0]85 ill O 056i 0237 0161 O 121 O 263 3 i+6 2023
37 211 0747 J780 G 32 0324 2 =-67 706
043 3 1189 4329 052 J317 08 i l bull OS
022J J700 I 581 0184 0844 O 4594 J188 388 3607 13 0070 1064 2825
082 1 i22 2 D 082 2892
037 O 1 297 L861 127 O 0872 4570 112 0281 1 690 4717
I- 290
~~ug
13
8 13 23
TOTAL CHLOROPHYLL [m9(MSPU) per 100 cm2]1
0 N N 0J 0J (It
r 0) 0gt i i i
9 gt gt- CO ltgt c t1l
()lt-(] 0VI
-lt ~ ~ 2shy
g 1(j n z OJ cD - 9
U1 J -t -t n c U1
Ql 0 ru I- (1)
I
-t JgtN (D J Q
C ccJ OJ -lt J -t I shyco 0 ill (1I- (1o m
shyen c
rv - c () J F(Q m (7)
c U (f) (IiJ 1) C - - ~m
--0 -t - (7) -u I OJ r - lt o 0 -t 1 W 0
J
o -t
iD (l ~A
T (1) 0 shy
~i
CONTROL POOL
tbt==t===yen 11 19 5
--lUI 1
1970
36
32 TEST POOL (1
28
24 N I E
u
) 04 ~~0~~ o -~~~-f---=lt~--cL_____ J 1 1 1 1 ~ ~
Inl Z3 22OCTshy2~1_28 16 I 30ILI 8 I5 291~5NOVshySEP-
pigment irnental Is
106
100 cm2 and ranged from 0017 to 1255 mg Chlorophyll indicative of a diatom population ranged from an value on November 19 to a maximum of 083 MSPU per unit area on August 5 Chlorophyll ~ which remained low throughout the period averaged 0066 mg per 100 square centimeters The relation of chlorophylls ~~~ to one another are represented by the respective ratios of 914 On the basis of the algae present this ratio seems reasonable
In the test pool as may be seen from Figure 35 chlorophyll ~ was by far the most important pigment Its concentration varied from 0427 mg at the outset (July 9) to 3447 mg per unit area on October 8 The average value for the test pool during the season was 1858 mg This is a level three times higher than that in the control pool Since green algae made up the largest percentage of organisms in the test pool it is not surprising that chlorophyll b values are relatively high Chlorophyll l values ranged from 0009 on July 15 to 131 mg per unit area on September 2 The average 063 mg is almost ten times that recorded for the control pool in which diatoms were the dominant forms In general except for absolute values there is a good correspondence between the chlorophyll l levels and the numbers of green algae They tend to run a parallel course For the most part the test pool pigment with the lowest concentration was chlorophyll c During the twenty-week period chlorophyll ~ ranged from 001 to 097 MSPU per unit area The highest values occurred as might be expected between the fourth and ninth week which in the test pool was also the period of maximum diatom growth Diatoms as it will be remembered have a relatively high chlorophyll c value The chlorophyll ratio in the test pool was 621 as compared to 914 in the control This means that chlorophyll band c were completely switched around a finding which was completely supported by the microscopic examination of the samples
Control pool values in terms of mean total chlorophyll in 1970 was less than half that observed in 1969 A combination of factors ranging from the location and depth of original sample collection in the lakes to the seasonal weather differences may have been responsible for this difference Stokes (1969) value from all depths in Stony Point Bay Lake Superior was 136 mg (MSPU) per 100 square centimeters a value which falls exactly midway between those found at Castle Danger in 1969 and 1970 (180 and 085)
Test pool chlorophyll values were fairly high and the 1970 results were sixty percent higher than those reported in 1969 No valid comparisons can really be made between the 1969 and 1970 results because of the differences in procedure and dosages used Especially important is the fact that the dosage of phosphorus used in 1969 was so high that it appeared to be inhibiting and that no nitrogen supplementation was provided This imbalance in the nutrients was corrected in 1970 so that the final ratio including the phosphorus and nitrogen present in the lake water itself was fifteen parts of nitrogen to one part of phosphorus
107
The dosage was also reduced so that phosphorus was added at a rate one tenth of that used in 1969
In addition to the chlorophylls determinations were made of the carotenoid pigments For a better understanding these were separated further into non-astacian (plants) carotenoids and the astacian (animal) carotenoids Values for non-astacian carotenoids in the experimental pools are presented graphically in Figure 36 In general it is evident that values throughout the season except for their amplitude closely follow those given for chlorophyll In the test pool the average 2 concentration of non-astacian carotenoids was 072 MSPU per 100 cm as contrasted to 281 mg (MSPU) for the chlorophylls In the control the mean was 020 MSPU per 100 cm 2 as compared to 085 mg (MSPU) for the chlorophylls
As will be seen in Figure 36 the astacian carotenoids did not follow the same pattern of the chlorophylls and non-astacian carotenoid pigments For example in tbe test pool the mean concentration was 03 MSPU per 100 cm 2 while that in the control pool was more than twice as great or 007 tlSPU This would seem to indicate that animal grazers preferred the periphyton in the control pool to that found in the test pool The two sharp peaks of astacian carotenoids which occurred on August 12 and October 22 correspond nicely with observations recorded in the research journal for those days hich indicate that Chironomidae larvae in the periphyton samples were also most abundant at thltlt time
In summing up the data related to the 1970 chlorophyll pigments and total counts a comparison as made of these two parameters Correlation coefficients and regression lines were calculated by the least squares method for total counts and total chlorophyll values from each pool Counts (y axis) were plotted against total chlorophyll values (x axis) The regression lines arrived at by this procedure are presented in Figures 37 and 38 It can be seen that the correlation between these two parameters is excellent with the correlation coefficients (r) ranging from 082 (P = 0001) in the control pool to 0878 (P = 0001) in the test pool
The results of dry weight analysis obtained in this study during a twenty-week sampling period are presented in a graphical form in Figure 39 This information is backed-up by a tabulation (Table XIII) whid lists the specific individual results together ith the calculated means If these sources are consulted it will be seen that the overall average dry weight for the control pool was 989 mg w[lile the test pool
2average was 926 mg per cm This result is difficult to explain but it must be remembered that it is an average and a detailed examination of Figure 39 shows that there is a considerable fluctuation in the samples For this reason no close interpretation seems to be justified
If we now turn to the results obtained tn the study of ash-free dry
108
CAROTENOIDS -----~ - - ----shy1970
Astoclan I Non-Asfoclon - -=-===l===
- IContra 1 Poo 1
Test Pool
~ j
J
I
1 Y bull p
~
I[I I
I 2 i
0 II ~ j
I ___e-___ --- F-a bull I~ ~Q) (5 gt B u
c ~-~ I
~ ltn a o
-1 I
I
OJ J
J
11E u l 0
I -
0
~
o I
r-J Q) C shy I
1
=l D-if)
n
o
~
I I I
I I I
~~I ~~~~J1 ----------- 12 19 26 12 8 16 23 30 18 15 22 29 15 12 19 25
19
AUG SEP OCT NOV
Figure 36 Naturally-occurring periphyton carotenoid concentrations (per unit area) in experimental pools Castle Danger shyLake Superior (1970)
109
--
-------
18 Y 1000000 + 2948314 X r 0878
12 X E E
c
o
14
10
~ 6
4
2
04 08 12 16 20
Total Chlorophyll
Figure
81shyCgt
X 6
~ ~ 4 E
c ~ ~ 2
Cgt
Figure
37 Regression line counts versus total chlorophyll naturally-occurrinq periphyton test pool Castle Danger - Lake Superior (1970)
Y -120327 + 6382996 X r 082 P 0001
CONTROL POOL 1970
08 12 16 2
Total Chlorophyll [mg (MSPU) 100 cm~
38 Regress i on line counts versus tota I ch Iorophy I I naturally-occurring periphyton control pool Castle Danger - La ke Super i or (1970)
110
9 I
~
Ipound)
N
aob-CD
~I~
1pound)1
0 W
7 gt
----- ~
-
gl 0lt--------shy ~I~
CD 0 f shy
- -shy
-t) ~I~ shy
--shy0 0 cx 001a
00 t t
~I 0 0 lt~~gt 0a ~Io I shy
w (J)CD 0
c
~ 2 t ~w 0 0 f shyu
-
c c lt
0gt
u
I
j -J 0 c
0gt J
0
1
0
-------IX--=-_
_X)
~~------------- 0
N ~ o (lw~6w) 14 DI8M
III
Q)
+shyUJ ru
U
ltJ)
0 0 Q
ru +shyc Q)
E
L Q) Q x Q)
c
c 0 +shyCgtshyr Q
L Q) Q
OJ c
L L J U U 0 I
Cgtshy
ru L l +shyru co
r shy+- ( 0shy
UJ +- L L 0 OJmiddotshy
L Q) Q) Q
J UUJ
c Q)
rugt OJru L -- 0
D C L ru Q)
OJ cgt-c L ru 00
( r)
Q) L J 0)
LL
W I shyltl 0
a w (f)
00+I N bull wJ N
~f-(f) r gt ltJ gt
~laquo
Ipound)
~I
~Igt-J
jgt ~
1 J
----
Ul --lt o o
Polt
H til w ~ Q)
-rlt Q) p lt ~
~ -rlt
o ~
w
c ~ p
-rlt Q)~
Polt 0 Oilcy ~--lt -rlt~ l ~ U to U -rlt0gt I ~
--lt
--lt Q)
til bJ ~
H l til H Wp H til gtlt gtlt Q)
--lt ~ H W H 0 Ul
til-lt ~u E-lt Q)
U I til
H 0 l -rlt Ul
Q) - p U l OVl
Q)
N -
UHtil
DO
Ul w c DO
-rlt Q)
3
U -rlt ~ til DO o D ~ til
~ P
w c DO
-rlt Q)
~ MN~N~~~~OOM~~O~~~~~~OO o
U ~O~OMNN~~NOO~~~M~~O~OO~ cy -rlt ~
middotz ~~~NNNNNMM~~~NNN~OO~O H
til DO o
H o81---+----shyE-lt
~I~ DO
-rlt Q) OOOOOO~~~~~OO~~OOM~O~~~~MO 3 MO~N~~~M~~~~~~N~~~~~~ N
middotz ~ OO~OMN~O~NOO~~~O~O~oo~oo~ cy
p
w c DO
-rlt
~ ~~O~~~~~MOO~~NOO~~~~~M ~~NNN~~~OO~~NMN~NM~~ C)
U -z -rlt OONNNNN~OOOO H ~ til DO
Hie o o Polt
c31pO 1---1-------shyE-lt z oulw
c DO
-rlt Q) ~OO~~OMO~OON~M~O~~~N~N j
~ O~OOMM~~~~~MM~O~M~~~ 00 -z
~ ~~OOOMOO~~~NOONOO~~MNMM cy p H
~ ~~N~~N~~NOO~MOOO~N~~N~~
~ -lNN -lNN -lNM -lNN r--1r--1N ~ p
H l DO
~ p Q)
w U o
gt o Z
~
112
weight (organic weight) of the periphyton we find that the mean organic weight for the control pool was 137 mg compared to 190 mg per cm2 for the test pool In the test pool biomass production increased steadily to a maximum value of 3497 mg per cm 2 (September 2) This is clearly indicated in Figure 39 which is a graph summarizing organic weights In the interpretation of this graph the two storms previously mentioned (September 15 and November 3) should be remembered for they have influenced counts and chlorophyll values and could therefore be expected to affect the organic weights If the graph is examined carefully it will be noted that there is a very large drop in values in the test pool on both of these dates This strongly reinforces the theory advanced earlier and based on other parameters that reductions on these dates are related to the high wave activity which accompanied the storm If the effect of these two storms were to be ignored it will be seen that for practical purposes the test pool organic weights were at all times higher than those found in the control pool No ready explanation is at hand for the isolated value observed in the control pool on July 22
With certain up and down variations the results obtained from the control pool were rather consistent until November 3 At that time the storm which has been described earlier was so severe that waves splashed over into the control pool as well as the test pool which resulted in a serious reduction of the periphyton During the sixteen weeks before the November 3 storm organic weights in the control pool ranged from 0464 mg to 2248 mg per cm 2 The overall twenty-week average of 1371 mg per cm 2 was fifteen percent lower than the average occurring in the test pool (190 mgcm 2)
If the results of the organic weight studies are reported in another way namely in terms of grams per square meter we find that the growth in the control pool at Castle Danger reached an overall mean of thirteen percent of the total dry weight while in the test pool the organic weight average was nineteen grams representing 204 percent of the total dry weight For comparison reference to reports of Stokes (1969) and Fox (1969) on their studies of the periphyton in Stony Point Bay is interesting The average organic weight reported by them for the natural lake environment was twelve grams per square meter which was 97 percent of their total dry weight determination On the basis of organic weight therefore the growth in the control pool at Castle Danger (13 grams) is for all intents identical with the results reported by Fox and Stokes for periphyton growth (12 grams) occurring in Lake Superior ltself
Regrowth periphyton experimental pools At the same time that periphyton-covered rocks from the lake were placed in the pools an equal number of denuded autoclaved rocks were introduced for the purpose of observing the speed with which a new periphyton population is established The predominant rock types used in this regrowth study were indigenous to the area and consisted of Gabbro Granite Basalt and Rhyolite Beginning with day 15 in order to follow the progress of regrowth
113
rocks were removed weekly over a period of twenty-one weeks or 148 days After the initial stabilization period of fifteen days rocks from both pools were coated with a growth which was easily seen with the naked eye In the test pool the growth was considerably heavier and rocks in this pool had assumed a general brownish-green color
A tabulation of the species of organisms found in this regrowth periphyton is presented in Table IV In the control pool as may be seen some sixty-seven species are listed and these are distributed among thirty-nine genera representing three phyla Fifty-two of the species (78) and twenty-six of the genera (67) were diatoms seltulana was the only non-diatom chrysophyte observed Ten species of green and five species of blue-green algae were found The species found on regrowth rocks were practically identical with those found on rocks which had not been denuded It is true that six fewer species occurred in the regrowth periphyton however this is not considered significant since in any event these were fairly uncommon
In the test pool regrowth experiment fifty-nine species were found in contrast to the sixty-seven found on regrowth rocks in the control pool In the test pool thirty-seven genera and three phyla were recorded Diatoms made up seventy-one percent (42) of the species There were twelve species of green and five species of blue-green algae Here again as in the control pool the composition of the periphyton population was completely comparable with that found on non-denuded rocks Similarly in terms of species there is no essential difference between the periphyton growth on denuded rocks in the control pool or the test pool
The numbers of organisms in each of the three phyla represented as well as the overall total counts and listings of the five most common organisms for each pool are presented in Tables XIV and XV As may be seen from these tabulations the mean total count in the control pool was 2570000 cells per square centimeter of rock area whereas in the test pool the corresponding count was 9510000 This is nearly four times greater than the control Except for the sample taken after the September storm all results from the test pool were very much higher than those of the control This is clearly shown in the graph of total periphyton counts (Figure 40)
In the control pool diatoms comprised seventy-nine percent of the total In the test pool only twenty-two percent of the organisms were diatoms They had been replaced by chlorophytes which made up sixty-six percent of the total In the control pool Chrysophyta were always dominant and diatoms were constantly present Some species or other of the diatoms always ranked first among species The ranking species were
Since the ultimate objective of
114
the five most abundant algal and Achnanthes
this study is an evaluation of
-l 0 0 p
-l0 0 ~ ~j 0 u V
~ lt)
C C C1 H
C J a ~ J)
u I-lt gt(l) coo lt)
0- PC a H OM tU Igtlt HQ
(l) p (l)
-l -I ~
IQ cu J) I-lt
(l)bi ~ tU au P 001 J) (l) g ~ H Ul
a C a H tU
(l) 00 Ul P bi J 0 SUl
~
o (l) U
tU -l-l
~ 0 bi
NOOO gtONtJccc Nr-j +J CIjc +-IN 4J 1ls~~4Jl~tJ
zppp ~))ZZpzZZZ IJ)QC~ 1 U
(l) C (l)
CCcNCCl-IliN4J ampoJ gt--1 N ~N U - gt()1 Z z~~t) Ul-lZ-lC
a
~ 8cNcccCccccCCCcu lt) lt) lt) lt) gt lt) lt) lt) lt) gtgtgt lt) UZUlUl-lUl
J)
i1 ~
rf---+-shy
a ~ I rlmiddot
C Ul tU ~
o IQ
rl 31-+ ~~a bi
iNlt Q
oj(
~ E-lt o bi
J)
C ltU ltU H ()
I (l)
J -I IQ
Ol
ll ~
ltJ
J)
8 o C1
oM Q
(l) tU
C
B ~~~B ~~~~B ~~ ~ UlUlUlUlUlU-lUlUOO
ccc~~~~~~~~~~B~ u u u UUUUUUUlUUUU
OI1JION N100 T(lOOM-INl1-Ij l1 N j N
l1 uCCOOtoNOtr)jr-OOO-I l1j l1-1r-rlj NCO
oOOoCOO--ftr-tr)OO-ICOj OOOCCCOr-OCOr-ooOCOCO
000000000000000 000000000000000 000000000000000
~-Irlrl~~O~NroOO~~~rlOON~O~ tr)jNtr)COOoMNO~~~~r---~MMNO-tCOOONCONmtooromN Or-OM
l1~~tNNNNN(Tj-t(Tjt
00000 00 0000000000 00 00000 00000 00 00000
O~OO--~~O~~O-N
(TjCO~r-~ 0 ~~~
N +J z
S c~ ~ t) tt) U
g a C Cgt c gtgt U~U~
r---tr)-I M rl rl N
~ 0 0 -t r-shyjNjri
ttr)ttlO r- 0
0000 0000 0000
OOOOi 00000 0 0000 0
~M N ~N 00
O~O~ ~
000000000000000 OOOOf000000000000000 0000 000000000000000 0000
~-tONN~~Na)~on~OCJl1O--f~~~aQ lt)-ttCOOtIl)(TjCXjr-r-jr---or- r-~NN
--fNC)-tNC)NT)Nt~COti jjjN
000000000000000 OOOOi000000000000000 0000 000000000000000 0000
~ ~ () (V10ti--fOj~No()oNtZ~lt)--fCO O~OONttlm--fCONOCOT)ttl-t Or---OCO jr---ttlIl)-tOO~O--foNoOO o1or-
N~NNNNN--f~~MM
~N~~N~~Noo~~Oro~N~~N~~ ~NN MMN MNM MNN MMN
-I J
00 l
P (l)
Ul
lt)
o 5 z
115
00 a C0 a 0 -rl N
tU C tU
-I 0shy
0 ilt0 (l) 0
H on 000 0
gtrl
(l) rl D tU
H
z (l) (l)
fcOO
-l
TABLE XV
TOTAL COLNTS of Regrowth Periphyton in TEST POOL Lake Superior - Castle Danger Hinn (1970)
2[Organisms per cm rock surface)
Date Diatoms
342000 22
Ju1 15 2829000
29 7869000 Aug 5 6845000
12 6677 000 I- 19 3030000I-
26 3246000 Sep 2 1643000
8 926000 16 484000 23 482000 30 718000
Oct 8 830000 15 926000 22 1457000 29 NS
Nov 5 277 000 12 244000 19 389000 25 421000
MEAN 2086000
-- 0
to c - (j) 13i 4- -N 0 ON
N ltJl
~(j)lJ - x (j) 0 -0 co --J (j) - 0-0 ~ ~- lgt
3 C o CJ G1_ J ltJ) 0 ru (j) N
0gt f- 0 IN--J r
lt coU 0 J
~mill -+ iJl 0
VI
-0
(j) shy VI 0
co
I 0 -iN ([) 0 N
ltJ)T f(J c
J () - C ~t
-0 ([) - - ~I
ltshyltJl
N (Jgt
6101000 1225000 9510000I
C Qunts per cm2 X 106 0 o o o
~ N ofgt (raquo agt (5 iii o
f Total0 Rank of Five Most Common GeneraGreens I Blue-Greens n G BG
244000 346000I 1133 1340000 I 279000 4454000 630 4841000 1164000 I 13891000 57 835 7086000 1579000 15510000 46 1044 8229000 2738000 17645000 47 1538
39180005693000 14641000 45 3124 10681000 3257000 17184000 62 1919
7358000 997000 10007000 74 1016 7675000 487000 I 9089000 84 610 3058000 194000 3740000 81 613 6902000 489000 7873000 88 66 9407000 338000 10464000 90 37 8399000 1482000 10719000 78 148
14628000 992000 16546000 66 I 88 12218000 490000 14165000 410 86
NS KS I
NS 2416000 1246000 3940000 7 61 I32 2024000 1322000 3590000 7 56 37I 1699000 749000 2837000 14 (0 26 2025000 1213000 3659000 11 55 44I
21 3 4 5
Ntz SynPho elm Ulx Ntz PIc Synelm Szm Ntz CZm Pho8zm Fth
Frgelm ScmNtz Lyn Osc Lynelm Ntz S2m
Szm Ntz AchOsc elm Ntz Frgelm 82m Osc
~tz I FrgClrr Sed Osc Ntzelm SZrr Sed Ntz LynSea Szm elm Pho OscSea elm S2m Ntz AchSea elm S2m Osc NtzScd S2m elm
PhoScd elm I Szm Lyn Frgelm 3zm I Ntz
Osci SzmClm ScdLyn OscScdPho elm
~ Phooca 3zm elmOsc OscSed elm S2mPho
gt
the effect which additions of phosphorus and nitrogen may have on Lake Superior and it has been seen that periphyton in general responds positively to such enrichment the next logical step is a consideration of the nature of the response of certain individual species or at least genera within the complex which makes up the algal ecosystem As a first step in such an approach attention will now be focused on the three first genera found in the control pool namely Cymbella Synedra and If the counts of individuals representing each of these genera is plotted on a weekly basis we will have a record which can be the basis for an evaluation of the effect of enrichment on periphyton growth Figures 41 to 43 represent a series of such graphs A tabulation Table XVI includes additional information which will be helpful in making certain comparisons between the various algal genera which charshyacterize growth in the experimental pools during 1970
If the weekly totals for SynedIa in the experimental pools are examined it will be seen that counts in one pool are always higher than the other however unexpectedly it will be found that it is the control pool rather than the fertilized pool which has the highest count This is also true for the next two genera that is Cymbella and Achnanthes Apparently these diatoms seem to favor Lake Superior waters which have received no additional nitrogen and phosphorus enrichment The correlation of these three genera in terms of the species represented with increased fertility is definitely negative The species principally involved were S acus S ulna C ventricosa C lanceolata and A micTocephala
In the test pool the only diatom consistently present in listings of the first five organisms was Ntzschia As indicated in Table XVI the mean count for this genus in the test pool was approximately eight times higher than that in the control pool Nitzscha was most abundant during the first few weeks of the experiment After that numbers diminished (Figure 44) This finding is a complete reversal of the situation found with the other three diatoms which have just been discussed since it is the test pool growth which is highest TIle extent of this difference is demonstrated clearly by the graph of Nitzschia growth shown in Figure 44 It is apparent that Nitzschia unlike the Achnanthes and species which were present responded in an extremely favorable way to enrichment of phosphorus and nitrogen This is not surprising inasmuch as a number of investigators (Palmer 1969 Blum 1960 Allanson 1961 and Munawar 1970) have indicated that it is an organism which responds favorably to eutrophication The decline which occurred during August is probably a reflection of the competition exerted by green and blue-green algae
In the test pool green algae were present throughout the entire test period and their numbers usually ranked high In listings of the first five the principal genera were Scenedesmus domonas and Among these ch Zamudomonas and Scenedesmus
118
laquoI H ltlJ
~ ltJl 0 11 0 laquoI Po 11 -
middotjliO5 laquoII0 011 ltlJltlJ~
Po bull H P III P o 0lt) ltlJJl
0 gt p - ltlJ (lJ) 11 11 P
I-l (lJ) 0 laquoI laquo1 lt=1 ~ lZltlJ
zl Po l o -11 +J
H ltJl ~ ltlJ rn Eolt rnPou
gtc 0
o ~ Po 0 0 0 (lJ) H 11 ltlJ ltlJ lttI p 0
gt ltlJ ltJl Vl W lttIP ltlJ lttI (lJ)gt
0 P lttI 11 l gt H
0 lt11 gt w
ltlJ W (lJ)O rn H
ltlJ
aeao 000 C DaDe
0010gt0 co lIj a 0) Il r-I r-I
0 0
DaDe0 0000 0000-
ltIl III 0 0 () C)
COCOM-tH I 1itON
shy
0000 0000 ODOf
jOr-If--
oeoo 00 00 0000
0 r- r-I0 r- r- () r-I-tt-o
-l 0 0
p
0 P 0
U
0000 00 00 oeee l)()r-ICh rlChr-lC tOCCOM
ltlJ oc P rn p oeo
ceo a a a
e Lf) t 0 1 M C
ltJl 11 laquoI 00
0
i c
lt11 E-lt ~j
gtlt lt0 r ltQPo c c Vl gtlt
~
r u
000 000 000
NN 0 M-lcn N MM
NN
000 o oe 000
00 if)
0 OUj
r_ 0 (I)
a 0 0
u0 a M -l
000 a a a 00 a N shyof -l
000 coo 00 0
M 000 M
a 0 a 0 a a
ltfJ )1
0 j--) I-j
~ ~_l lt11 H
pound () laquo
i
~
~ 0 0p 0
ltQ ~- ~
Cf
H gtltr 0 C
~ Olc)
l r u
~ gtltu
119
ltlJ W rn
-lt H gt U)
gt u 0
4-lt 0
lfJ 5 ltlJ +J
P
0 ltlJ lfJ lfJ ltlI H 0 lt ltlJ
lfJ - 11 l 0
U
0
(
0
(
~08
II
I
I
06
I
04
x t (J IE Iu
0 2 ~~ I 0 i~ ~c
o en o
g
008
006
004
002
JUL
Conrol Pool ---+--shyTes Pool ----+-- SMiDPA
Ol~----~------------------~---f-4--~~--~~----~--t
AUG SEP OCT NOV
Figure 4 Development of occur-ring as regrolth experirnenta poo s Ci1~tle Danger - Lake Super (1970) bull
120
--
- r i Vmiddot I V
I I I I I
I I
~ II bull
15
fmiddot I
I ~ I V-
I
-~ 08 I
I I I06 I I ~ I
~
4
~
x (J
E lt)
~ o ~ ~c
g o
011-----+
008
o bull 0 6 ~-
004
002 Control Pool Test Pool
JUL AUG SEP OCT NOV
Figure 42 loprnent of CymbelZa occurring as regrowth imental pools I Danger - Lake Super
970)
121
I
I
I
j shy+ I I I I I I
0
004
002
00
I I I I I I I
NITZSCI
OCT
10Ft----------------------------------shy
8
G
4
8
05 Control Pool -----shy
Test Pool --shy2-shy
04-shy
o X
N E
06 u 02 g ~
0 e
--~ 0 4 ~ E I ~ o f~ ~ 1 o
u
I
I E I I
C o O2 08 o
006shy
004
v2
OOlmiddot-~5222~~Ti~~~~~~~~~~~~~L-U JUL AUG OCT NOV
5 12 19 25Figure lt13 Devel of Achnanthes occurrin9
NOV experimental pool Castle Danger shy(1970) as regrowth In
experimental pools I Figure 44 Development of Nitzschia
ke Superior (1970)122
123
k
I I I
I I
l0l=------------------~
8 reached the greatest concentrations The maximum for Seenedesmus was ten million 7200000 and Schi20meris 3500000 per 6 If the graphs representing weekly counts of the two leading genera (Figures 45 and 46) are examined it is seen that growth in the test pool in all instances far that found in the control pool 4
For example in the case of the mean cell count in the test pool was fifteen times the control Scenedesmus counts on the same basis were even higher and the test pool population was forty-five times as great as that encountered in the control pool
2
It will be noted again as it was in the case of naturally occurring periphyton that Scenedesmus followed in terms of its importance in the periphyton growth A type of succession was also noted in the test pool when the importance of each of the three phyla chrysophytes chlorophytes and cyanophytes was examined on a seasonal basis See Figure 47 If this graph is examined in detail it will be 08 seen that diatoms represented mainly by reached a maximum on July 29 (29 days regrowth) afterwhich they declined steadily On
CD 06 August 5 the green algae after thirty-six days of regrowth succeeded O
the diatoms in terms of abundance and slowly increased to an ultimate )(
maximum on October 15 Blue-green algae although never able to reach NO4 the population level of the other two phyla did reach their own maximum i about August 19 approximately two weeks after the green algae had superceeded the diatoms Since water temperatures during the first half of August were at their highest level for the year this factor is E probably an important consideration although enrichment is certainly ~ 02 the basic consideration for OseiIJatoria growth o
Results of chlorophyll analyses for regrowth periphyton are presented in Table XVII In the control pool total chlorophyll ranged from 077 at the outset to a maximum of 0840 mg (MSPU) per 100 square 011
centimeters on October 22 representing 114 days of regrowth The mean 008 value for all samples was 0419 Total chlorophyll in the test pool
2on the other hand ranged from 0264 to 4153 mg (MSPU) per 100 cmduring an identical time period The mean value 2564 was more than six times greater than that of the control pool A graph showing the
005
total chlorophyll values for the two pools is presented in Figure 48 Total chlorophyll in the test pool increased rapidly during the first few weeks dropped slightly in the first part of August and then on Augu~t 26 soared to a high of 408 mg (MSPU) per 100 square centimeters The precipitous drop must of course be ascribed to the September 15 storm From the Iowan September 16 chlorophyll concentrations quickly 002 recovered and shot up to its highest level 4153 mg (MSPU) on October 22 (114 days of
Chlorophyll concentrations in the control pool showed a rather OQIsteady and uniform increase up until August 12 The
which occurred on August 19 is attributed to a temperature
Figure 45 Development124 in imental 5 Castle Oanger - Lake Superior
( I
125
~-
CflINf] lOHOIW
Control Pool ---+--shyTest Poolshy
occurring as regrowth
------------------
10
41shy
~ 08
lti) 6 0
x 04 E ltgt
Q Q
E ~ O 0
0
n 1
08
006
004
002
00
IControl Pool -----Tes Pool
igt~ t ~ I
~ ~ I I
L
I I-l I I I
=- shy1 ~J
I
V
j1
~ 1 I
SCENEDJSMUS
SEP OCT
46 Development of Scenedesmus occurring as regrowth in 127 experimental pools Castle Danger Lake Superior (1970)
126
I
ltt
~
I L--shyO _ lti) I - shy2 o --~ IIIIIJ~I I
- 6 lti)---lshy0 LL
90 X ZWl ad 0 0 SWSuoBJO 0
ltlJ 01
I 0
f ~
ltlJ
I
+ U1 ill t-
e
L (lJ [)
r t shy
0 l O OJ L
U)
ru tD 0
(~
I tJ-~I L
IUtI OJr ~ C1 gtE - poundI~
a lt)- -- onliii
L G)
() Cl~I U)
NNI~ r-
t t N r--shy r--l O -=t co l- 0 rl tf) l) en 0)
+-1 w t (Y) 0 0 0 CD N rl (f) IT) 0~ 1- (D Lf) N(Y)t(y)Ol--OriUlCJo)Ol-tTIr-I
0 r-I (Y) (Y) (Y) 0J _T rl rl (Y) N (Y) t
o 1--+------shy
[-middot00) J QrltDO COOt~rlCD r-I (Y) (0 t V)
01 [--(Y)o DN(Y)
00000 00000 bull
J co ill=shyto (X)
()N o-----f en lshy t ~ GO UJ tn uJ to 00 --I en (f) If)wc--
1 rl 0 o (Dj CJ 0 (Y) rl 0
00 000000 00
r~~ r-I (Y) (f) rl f-shy co 1 N (Y) r-shya rlrimC)oo riOCJr-i bullbull
0 10) 1-tlf)NlOt l-IDCQf-
DO ooon 000
o (fl LD 0) N Lt) (oJ (Y)
0 (lt) Lf) CC 0) t lO 0) +-1 to rl CD (Yj lD T t If)
bullbull bull 0 C) 0 0 r~i rl 0 a --I ()
e
ta)N0l[-
NCJmo(r)
00 c)
CDtOOOlt
0 0~ 0~ --j c- ~ r-1 -i r~i r~ rl ~ ()
wn~rl ro~r-N NM~~
0000 Coon
tD N 0) (0 ( -I
(l~ Q)
(1
This phenomenon has been discussed earlier After August 19 chlorophyll concentrations increased rather uniformly until October 22 As a result of the November 3 storm chlorophyll values again declined sharply
The concentrations of chlorophyDs-a-b-c are individually reported in Figure 49 In general the results-obtained in these regrowth studies were similar to those obtained in studies based on non-denuded rocks (See Figure 35 p 106) However average values were somewhat lower The ratio of chlorophyll abc in the control pool was 712 whereas that in the test was 631 From these ratios it is apparent that diatoms should have prevailed in the control pool and chlorophytes in the test pool This observati0n was fully supported by the actual counts made of individual organisms See Tables XIV and XV
The maximum total chlorophyll concentration in both pools it will be remembered occurred on October 22 This represented a period of 114 days of regrowth If one divides the maximum chlorophyll values by this incubation time daily production rates are produced The daily rate for the build-up of chlorophyll in the test pool was 0036 grams and that for the control pool 00073 grams per square meter per day The difference in daily chlorophyll production was therefore nearly five fold
As a test of the adequacy of the chlorophyll concentration as a measure of biomass accumulation correlation coefficients were calculated for total chlorophyll and total numbers of organisms in each pool Again as had been true in the experiments with naturally grown periphyton on rocks that had not been denuded it was found that the two parameters correlated very well The correlation coefficients ranged from 076 (P = 0001) in the control pool to 083 (P = 0001) in the test pool When a regression analysis was made and regression lines were plotted as shown in Figures 50 and 51 it was obvious that on this basis as well one could say that total chlorophyll or total counts may on a practical basis be used interchangeably
In the control pool non-astacian carotenoid values for the regrowth samples which stood at 003 MSPU per 100 square centimeters at the outset reached a concentration of 026 MSPU on the 22nd of October 114 days later The average for the nineteen week period was 013 MSPU per 100 cm2bull
In the test pool the average value for non-astacian carotenoids was five times that of the control or 065 MSPU Concentrations ranged from a July value of 01 MSPU fift2en days after the beginninp of the experiment to 116 MSPU per 100 cm on October 22 114 days later See Figure 52
The pattern of non-astacian carotenoid production was for practical purposes a repetition of that observed for chlorophyll This is demonstrated graphically if Figure 52 is compared with Figure 48 The astacian carotenoids however did not follow such a pattern Compared to other pigments they were very low and if Figure 52 is consulted it
128
c 0 +shygtshyr 0shy
LO ()r-Q(]
r~
+shy3 o C L C CJ) shy()E
a L o (j)
CJ) nc
(j) eo UCl eo
lt- ltll L gt+shytil til
eopoundu
151 L
H L H E -0
5lt U L ltll
W 00shyJ 0gt CD U)
laquor- L ltll ltllpound O-eo
J
J ~ U)
E -til
0 0
Q til c-o eo
+shy+-c eo ltll L E +- shyC L (j) ltll U 0shyC x 8 w
c +- shyc (l) E CJ)
(L
gtshy U1 s= Q) a I-o L
r U
ro L +shyo Cr-Io+shy
u
~) 1]1 gtshyc a o L o
c L +shyU C o
U
Q I If) (j) Ishy
gtshyL a o L o
lt1U +shy
8 c
OCJOCJ
t +-10tl U) (I
~ ~ gtshyc 0shy
t o c U
129
I P hy Jon
12
8
14
10
Chlorophyll f~Lc
o I K )~ ~n
II
1970
concentrashypool CQstle
gur-e 49 Regrowth (per unlishy- La
131
OS
06
04
02
2
Control Pool -- --0- -_ o
o o
~
CL Ul ~
~O LJ
I 28o o l ltgt 26
gtshyL
8-24 L o ~c 22 u
-1 J 20 gtshyI shyo a o -1 16r o
-1
~ o f-shy
08A)--o
06
in experimental ior- (1970)
04
ri orophy I I concent 02
pool tie
CONrROLP~~
~ ~ ~ _0 ~ a
~ ~
130
CAROTENOI DS
18
16
4 ~
X 12
1200 IS
10 0
~ 1000IS 8
800c ~
600~ 6co
400 I~1+lt-_
1 -2 b
1 o o
~ =gt shy(f)
]~
x E
0
IS
CO ~
co
Y -1944844 + 4334617 X
r 083
P 0001
50 I [ogrowth por
Superior
~
i
j ~
~ -4
~
+ 5099704 X
CONTROL POOL
02 04 Db Total Chlorophyll [mg (MSPU) 1100 em1]
)1 [ino nts phy I I regrowth i phyton
10 Danger ke Superi
132
F un it r LJ
133
----
will be seen that with one exception values were always below 05 MSPU per 100 cm2 The mean in the control pool was 0024 and that for the test pool 0002 MSPU per 100 square centimeters
As will be remembered dry and organic weights were also used as a parameter in this study The results of the dry and organic weight determinations for both pools are summarized in Table XVIII and are presented in a graphical form in Figures 53 and 5~ It will be seen that the overall average dry weight was 387 mg per ern in the test pool and and that this is thirty-three percent higher than the average for the
2control The maximum for the test pool 648 mg per cm was reached on August 26 fifty-seven days after the beginning of the experiment The peak value in the control pool was not reached before October 15 the 107th day of regrowth The value at that time was 463 mg per cm 2bull If averages are used and these figures are converted into conventional standing crop values it will be found that the standing crop was thirty-nine grams per square meter in the test pool and twenty grams per square meter in the control
A parameter which is perhaps superior to simple dry weight is ashshyfree dry weight This will be referred to here as organic weight In most aspects this is a good yardstick except for the fact that it does not take into account the weight of diatom shells thus the siliceous frustule of these algae are included w1th the inert matter Organic weight values for the experimental pools are presented 1n Table XVIII 2 and Figure 54 It will be noted that a biomass maximum of 265 mg per em was reached in the test pool in fifty-seven days Tn the control pool the highest organic weight value was reached a bit later that is on September 2 which represented the 64th day of regrowth While the organic weight results from the test pool varied rather considerably at times as a result of temperature storms and other factors the results from the control pool where metabolism had not been so strongly stimulated were relatively uniform and oscillations that affected the test pool greatly tended to be strongly damped The average standing crop in the test pool 14 grams per square meter was nearly three times greater than that of the control which reached a level of only 57 grams
As pointed out earlier the maximum organic weight result was observed in the test pool after fifty-seven days and after sixty-four days in the control During these periods which for practical purposes represented items of most rapid growth the daily production rate in terms of organic weight was 046 grams per square meter in the test pool and 017 grams per m2 in the control pool
To properly evaluate these data one can refer to values obtained by other investigators in their studies of growth of periphyton in a variety of environments For example in a northwestern Ontario lake Stockner and Armstrong (1971) observed a daily increase in organic weight of 250 mg (025 grams) per square meter The samples on which these results were
134
XVIII
Pools )
surface]
DATE CONTFOL TEST POOL
Or-gan i c Dry We
o
3O
12761O 120OlJ52
24 30
301206
10
I
I
o
1564I1
4921o100
O 11
7000
1
112
_J
41]43
I n04O4
I45029
274147e
74402 I
31
O
I
No sample
135
Aug 5
i9
Sep
30
15
29~
Nov
12
bull (OL6 ) JO J8Gn S - J8bU8J
8[ 5jOOO r I2+U8W JedX8 U ( 128j +LC J8d) s+~6 gt JO+liO Jed L+MOJD8U 17lt ~6 ~
ION LJO d3S 9nl1 lnr ~Z 61 21 S 62 Z2 91 B Opound pound2 91 B lt0 92 61 21 g 62 (2 gl
0
Q p -
~~ 3deg Cl
~ Q t shy
0) -
~ 2
shy3-v----- IOOd IS 91 N
---(7-- IOOd 10JIYOJ
OL61-HJMOI1l93tJ
L-__________________________________________________________________________________~pound
N
ltraquo 0
~z
o
t ~ ~ InI
l ~ g15 I shy
U
Igoampj DO m~ ~ t IX)
o u
deg I)
I)
0_w ()
IX)
N
N
mt) l
ltI
5 L
1J ill ill CgtshyL J lt1J()
+- ill - lt C flJ Jl
L ill OJ c+shy
L lt1J 01
ill ill 3shy
gtshyL
C 0 ([)
+shygtshy COL 0 -
II
(j) L
8i
shy
based were taken at a depth of one meter and fifty-seven days were required to reach the maximum reported Interestingly this is exactly the time required to reach a maximum value in the Castle Danger test pool However although time was the same values were not Actually the value of 025 grams is closer to that of the control pool at Castle Danger which was 017 grams In the test pool at Castle Danger as might be expected the production rate was almost twice as high (046 grams)
The values for maximum periphyton growth in the control pool at Castle Danger are also similar to Falls Lake production rates as
by Castenholz (1960) Castenholz found considerably higher spring growth rates (0 S in more saline lakes In referring to the above studies it must be pointed out that Stockner and Armstrong and Castenholz used glass slides as a substrate and that growths on this material are not strictly to those growing on native rock Tn experiments conducted by Fox (1969) and Stokes (1969) and in which natural rock substrate was identical with that used at Castle da Uy per iphyton growth rates averaged 0067 grams organic weigh t per per day in Stony Point Bay Lake Superior This average is based on the standing crop reached at the end of a period consisting of forty-six days It was obtained by dividing the organic weight of periphyton on the last day of collection by the number of days during which regrowth had occurred The stamlinr crop represents the level of organic material reached in one short summer season in Lake and therefore represents the
end result of the growth under the special situations which characterized the period of study It is a reflection of the effect of strong wave action currents and other factors including storms which may affect the periphyton grovth in more-or-Iess open waters Tn no sense does it ref1ect the maximum growth for the season Because of this if the control pool at Castle Danger is actually a representation of growth which would occur when the effects of strong physical water movements have been removed the dai ly average production figure presented by Stokes and Fox should be vory much lower than the results reported for the control pool at Castle Danger If the maxima at Castle Danger are compared with the average for Stony Point Bay it ill be seen that this theory bolds in practice Castle Daner control pool results were twice as high as those reported for the Bay
weight results obtained in this study ofOn the basis of organic denuded n)cks it is clear that atthe regrowth of per iphyton on
5 ppm N03-N Lake Superior waterconcentrations of 163 ppm ohel compared to growths taking placeis highly stimulating to p
in Lale Superior water without artificial enrichment It was also observed that if allowances are mode for tlle effect of waves and currents the control pool is for purposes comparable to that of the lake
In general especially in the test pool regrowth as extremely rapid within a very short time the oriinal peripryton-covered rocks wereand
indistinguishahle from the Jenuded rocks on hieh regrowth had
138
occurred Identification of individual rocks was made on the basis of coded marks The growths differed very little even in terms of total number of algal species identified By the end of the season the regrowth rocks in the test pool had a growth characterized by fifty-nine species whereas rocks that had never been denuded had sixty-one species This difference is considered unimportant A difference of six species observed in the control pool is also considered insignificant In the test pool it was observed that N-itzschia palea was the first major colonizer on denuded rocks After fifteen days this species had reached a concentration of 220000 organisms per cm2 bull Npalea was accompanied by
which reached a number of 130000 organisms on the same day These two organisms along wi th SchizomeYis and Osci llatoYia and on the basis of a seasonal average eventually reached slightly higher numbers on the regrowth rocks than on the others
In the control pool the original colonizers were and which during the first fifteen days increased at approximately the same rate N was present in the control pool at the end of the first fifteen days but no appreciable population of individuals until the 2lnd day increased quite rapidly in comparison to the other diatoms and eventually reached a high of 1370000 organisms per cm2 bull This was the highest numher reached in the control pool by any organism observed during this regrowth experiment (See Tahle XVI) The seasonal average for Cymbe ta in the regrowth periphyton exceeded its
na tural grmrth by to times This alga along wi th domonas was more successful in terms of average total numbers
the regrowth periphyton than in the naturally occurring periphyton
If all organisms in the test pool rather than a representative few are considered the total average number of organisms found on regrowth rocks slightly exceeded that found on rocks which had not heen denuded See Tables X and XI The ratio of diatoms greens blue-greens in regrowth periphyton was 271 whereas a ratio of 361 was ohserved in periphyton on the other rocks in the test pool This slight difference is explained on the basis that original growth on the pcriphyton-covered rocks collected from the lake consisted nearly entirely of diatoms On this basis there seems to be evidence for a succession from diatoms to green and blue-green algae in the natural growth It will be seen in Figure 55 that total counts of regrowth periphyton slightly exceeded the natural growth in twenty-nine days however after that time the lines representing total counts are in rather close agreement
Average counts for regrowth periphyton in the control pool constituted about half of that characterizing the natural growth In regrowth periphyton the ratio of diatoms greens hlue-greens was 8 1 whereas for the natural growth it was 712 This indicated that diatoms were clearly predominant If the regrowth periphyton is compared with the natural growth in the control pool (See Figure 56) it will be seen that
139
TEST POOL
ReCjrowth Periphyton
200--shy
150
80
X
N
lt= U
IL (j) I Cl I
I I
I I
10 I I
8 9
6
4
CONTROL POOL
2 Natura Iy-Occurr-ing Per-jphyton ----4-shy
Regrowth Per- j phyton
JUl AUG
ur(=J) I i- Figure 56 Nat ) ly-occurr-inO per-iphyton siphyton per- i shyphyt tEt phyton total counts in conlTol I
Danger lake Superior (1970)l
141140
iii
although the growth on the denuded rocks is somewhat slower at the outset the two populations reached similar numbers after a total of fifty days regrowth (August 19) After this date regrowth values for the most part remained consistently below that of the natural growth
In terms of average chlorophyll concentrations regrowth periphyton c c
in the test pool closely approximated that found in growth Regrowth values starting at 0264 mg (MSPU) per 100 after fifteen
~ days reached a value of 343 by the 29th day at which point it exceeded -
J gt-the chlorophyll concentration which characterized natural growth After
that date chlorophyll concentrations remained rather constant for both Hol OJ U)regrowth and natural periphyton 4-1 +J bl
H ol gt i H M
f) Cgt 0In the control pool on the other hand average chlorophyll values pol
l) e Q) ~ Q) ~for the regrowth periphyton were less than half of those characterizing ol -the natural growth
It is apparent that regrowth of periphyton in the test pool was L (j)tremendously successful and proceeded at a rapid rate At times it Cl OJeven exceeded the natural growth A possible explanation for this is
(f) L J I I i __ L_i__L-l1 I -L
that in the natural periphyton there was more active competition on the I (J) Imiddotmiddotmiddot
ltpart of other algae and resident grazers The clean substrate of the denuded rocks provided an immediate attachment point for the more -
fIJ
prolific green and bluegreenalgae Whereas the rocks already covered with a natural growth of clean-water diatoms could not provide such an advantageous attachment area Possihly as diatoms such as
(j ()nchnanthes and Cymbella succumbed to the highly enriched waters of
Y -- i L ~t In co D r-- cO ro L I q ~t m In ~ L0 l 1(
the test pool they were eventually detached and in sloughing-off I (j)
- Jprovided spaces which allowed green and bluegreen algae to invade and U1
take over the area This accounts for the eventual equilibrium which was established for the two populations (natural and regrowth) I
Regrowth in the control pool based on a consideration of all 3 rei ~ II I I I bull I I I I I I parameters was significantly lO~Jer than the natural growth It appeared that the natural growth consistently maintained itself at a level which was about two times higher than that of the regrowth periphyton c) tf1 ID 0
lS 41 Lr- 0
One of the hasic objectives in the Cas tIe Danger was to create a system which was closely similar to natural lake environment One Cl
w N lf1 Lf q
Q) 0 0 til 0 0 N 0J l) I shy -q In L[ If ID ~o 0 tIlphysical condition which was important to the success or failure of this laquo
project was water temperature control For example it was desired that 3 water temperatures in both pools be nearly identical with that of the lake and more importantly it was ahsolutely necessary that similar (j) 000000 0000 temperatures be maintained in the two pools As a result it was deemed lt- 000000 0000
NNN~~~
necessary to accurate records of the temperature This information I-
is in a series tabulations and graphs as Figures 57 to 60 From these L (j)
Figures it will he seen that water temperatures in the control and test J gt CJ) -N~~ rna N v
-NNN N NN~LL
142
143
(J Ln In I) In 0
f41 0 0 In
Figure 58 14TER TE1middot1PERATURE DAB AUGUST 1970 Lake Superior - Castle Danger Minn
6 1400 52 1200 7
8 1200 9 1200 64
1400 7110 II 1630 71 12 1000 71 13 1830 51 14 1200 55
4917 0900 18 1000 47
5419 1730 IZOO 5020
5 ZI middotZOO
Figure 59
Sept TIMe
I 2
WATER TEMPERATURE DATA SEPTEMBER 1970
IntakePool Pool 120C
2 1200 7 J 1200 4 1200 5 1200 6 1200
i- 7 1200 lJ1 1200
12]0 I 1200 II 1200 I 1200 I 1200 14 200 15 1200
1200 7 1200 18 1200 I 1200 20 1200 21 1200 22 1200
ZOO Z]O
29 1200 ~Q i2CC
72
Ishy
(I Intake Temperature
6 a t-
Readings
I
4L 46 it 6 J I
I52 59
ltll64 L
I 64 62
72 + 068 (Q71 69 70 L
70 (l)7 70 i I I
shyE48 53 (l)51 1 i52 fshy55 I OJ)II I4 I I I~j 48 I I4547
I I
54 49 4750 J
4447 4751 - V
to uJL1 1 I I Iii I I I I I I I I I I I I I I I I I I
56 57 59 59 58 60 60 60 61 61 57 -I
55 55 55 54 55 50 50 51 51 45
56 58 59 59 58 60 60 60 61 61 57 57 55 55 55 54 55 r-v
50 51 51 45
52 56 57 57 57 59 60
60
-I
55
54 53
5 47 48 42
68
6 1+
60
LL
I 0 56
(l) L 0 + ro
52 L (l) Cl E Q 48f-shy
4~
40
4 6 B 10 12 14 16 18 20 22 24 26 2B
AUGUST
Lake Super I or Castle Danger Minn
Intake Temperature
Readings
__-shy --
j I
1 shy
I I
43 43 41 2 4 643 46 8 10 12 14 16 IB
L9 49 4L SEPTEHBER 45 45
I
ltlJ
ell
H
o Cshyr
y w m L 2c Wmiddotmiddot gt2 o 7 ~
bull (j)om lLJ L m ro on fshyUltJ)C) shy
+shyI iij
() lt
0
Ishy
ltlJ
ell
0
H
_ ~CJl
f - u0
ro Ishy
fshylt o L
o J0lt J ltJ)1-0 ltt ~1 O~ U) LU CL ltJ)
~-jo 6J npJ6dw6J
Lc U1 laquot(Q ~ Ilti li j ~ -q lLJ I1J f--
of laquot
LL
+shyC
Zt ~ gtltT ot t ltj
0 w
o
fshylt ltJ) +shy3 L
J +
lOOfshy(J) 0 laquot f- CL
f4 ~
Ifrlul-j~ oT laquoj ltY ot ltZt
I1J
~ CD - ~
eLi co
~ 9
m
If)
~~W~~~Nrn ~~~~V~~~
til r-- r-- in j- ilt N 0 gtltt-tZtot-tZtgttfll
~I~~~~middot~~~~~t------------~~~middot~~~~--------------t-t-----------------~
CL E 0
u r--middot r-- lCoJ rr N 0~ t 01 ~ ~ g ~ ~ ~ ~ ~ ~n ot 0 J ~- ltj ~ --t ff1-[ c 0
OlL (j) U L J OJ
00000000(1)10 00000000E 0 Or-tlC)CgtrltlC) C)() ~O~~OOOO
N ~) L ) rl r) tl 0 VC-V~N~~N
gtIN oNc-rornololv~~rnNrorn~
-NNNNN~Z N
146
pools are for practical purposes the same When temperature did vary it was never more than one degree Fahrenheit This data shows quite clearly that any growth difference occurring in these pools could not readily be attributed to differences in relative pool temperatures The temperature difference which existed between the pools and the lake itself may also be seen from these Figures The greatest temperature disparities between 1ake and pools occurred in the months of July and August On the average these amounted to a difference of only three to four degrees F From September through November temperature variations were very slight During the entire month of July as will be seen from the graphs water temperatures in the lake increased steadily In August two dramatic drops of temperature were recorded These occurred on August 2 and August 13 (See Figure 58) Both of these drops were brolght about by the same weather phenomenon namely strong off-shore winds from the northwest Apparently these off-shore winds blow the warm surface water outward and bring about an upwelling of deeper and co1der waters By the middle of September the beginning of a fall decrease in temperature was seen and by October and November lake temperatures hovered uniformly at or near forty-four degrees F
In the months of July and August as mentioned earlier temperature variations between the pools and lake averaged three to four degrees It should be realized however that this difference usually occurred at mid-afternoon when ambient air temperatures were at their highest In order to establish more accurately the complete temperature variation over a twenty-four hour period a continuous recording thermometer was installed for a period of some thirty days It was dis~over~d as expected that at this time of the year (August) lake water temperatures remained constant during a typical twenty-four hour period In general it was found that during days of high water temperature the disparity between the lake and tbe pools was at a maximum during the middle of the afternoon (330-430 PM) By 900 or 1000 PM temperatures in the pools and in the lake were at their closest correspondence By late morning (1100 AM) a small temperature dif ference was usually observed between the pools and the lake Evenshytually this difference reached its maximum in the late afternoon By pooling this information it is possible to calculate the average tempshyerature variation over a twenty-four hour period In summation it can be stated that for eight hours (33 of the time) of a given day temperatures were exactly the same in the lake and in the pools for four hours (16 of the time) the dlfference was 35 degrees F and for the remaining twelve hours of the time) temperature difference was about two degrees F Thus over a twenty-four hour span the average temperature in the experimental pools was 15 degrees higher than the lake This minor difference was all but eliminated during September October and November
For the purpose of relating the temperature information to the sample co11ecting program an average was made of daily temperatures
147
ltJ) ~y
re Preceding Each Sampl i
for the week preceding each sample collection date This information has been tabulated and is presented here in Table XIX As will be seen some of the highest weekly averages occurred in late July and early August Interestingly it was at this time that green and blue-green algae were
profusely It is also interesting to note that on August 19 the temperature was 168 degrees F lower than it had been the
preceding week (476 and 644 degrees F) growth parameters such as chlorophyll concentration and total counts were also reduced This phenomenon was referred to earlier as a shock Other than this no other specific examples can be found which definitely indicate temperature effects which can be considered as having been important to the experimental work
As mentioned earlier a number of areas in and around the perlmeter of the experimental pools complex supported heavy populations of periphyton These areas of periphyton growth occurred on the rock surface of the shelf on which the pools were built and represented areas kept moist by the by-pass water [rom the intake and by the overflow from each of the experimental pools At various times during the season periphyton specimens were collected from each area and identified microscopically On one occasion this sampling program was extended by a SCUBA diving survey of the inshore area immediately adjacent to the pools These samples were all qualitative in nature
Intake lake water not needed in the experimental pools was allowed to flow hack over the rocky ledge to the lake As it did so the thin film of water was constantly wetting the rock surface and thus provided a suitable place for periphyton growth This was one of the study areas In less than a week and for the remainder of the season a heavy growth of UlothYix zonata was established on the rock surface in this area In various pOCkets where water did not flow quite so rapidly a scattering of diatoms developed The representive genus was Synedra Directly beneath the overflow of each experimental pool a profuse growth of periphyton also appeared At the test pool outlet where enriched water flowed over the rock substrate and cascaded into the lake populations of zonata I ) were found in abundance In a few isolated instances glomeYata and Rhlzoelonium sp were also identified In the control pool outflow the predominant growth was again Ulothr-ix zonata Also represented were 8unedYa Cymbella and Aahnanthe13 NS
As indicated in the section on materials and methods scuba )
diving techniques were used to obtain materials directly from Lake Superior itself When the technique was used to obtain samples immediately above the point of influx of the pool effluent numerous circular patches of OsaillatoYia were observed at the point where the pool effluent entered the lake By far however the most abundant algal forms were diatoms which seemingly covered every square inch of the lake bottom in that area At the edge of the shoreline or the air-water interface populations of and
148
56
b
[i
56
GSS
51 2
S1 ij
~ bull
IU
iII
lll
L~r) 3
XIX
56
596
5gt2
064
G6S
S1 2
b1 L)
5
- ci
4 11
iii)3
1~) bull
yin Ithough
lee
b7 GI
ilmiddot7
i) fJ 1
i)
1
0
149
were again apparent The outfall area beneath the control pool supported only diatoms with the exception of Ulothrix zonata which occurred at the air-water interface No apparent growths of Oscillator~a were noted nor was any visible difference seen between this area and other areas some distance from the test pool outfall
The inside portions of the concrete walls in both pools offered another interesting collection area for periphyton On September 3D periphyton scrapings from walls in the control pool consisted mainly of diatoms with the exception of one specimen of In the test pool abundant populations of Schizomeris and Nitzschia
were found whereas Oscillator~a Chlamudomonas and Ulothrix were noted in lesser amounts
Visual inspections of the Castle Danger pools supported the quantitative studies and revealed a significant difference between the two pools For example after two weeks of enrichment (July 15) there was a very distinct growth difference noted In this case the test pool periphyton took on a greenish to yellow-brown color whereas the control pool periphyton maintained a rather subdued dark-brown to gray color By July 23 records in the inves tigator s daily field log described growth differences as tremendous and by July 25 the description advanced to phenomenal By July 20 the first floating scum was observed in the test pool and for the remainder of July and all of August this scum prevailed For practical purposes the test pool can be described as resembling a small polluted pond or an enriched horsewatering trough whereas the control pool resembled a normal rocky in-shore area of Lake Superior With the exception of some of the days following the November 3 Northeaster when much of the growth was removed this marked difference in the appearance of the pools prevailed for the entire sampling period As a matter of interest it should be reported that in 1969 no such color differences were noted
One of the objectives of the Castle Danger study was to design pools which would nearly duplicate the natural lake enVirOTInlent In the main this objective was fulfilled inasmuch as the natural substrate and water temperatures were very similar to that found in the lake Another point of interest is that the water movement provided by six overturns per day in the experimental pools compares favorably with the daily movement in the lake itself at that point The latter contention was established by a simple calculation which took into account the volume f10wrate and dimensions of each pool It was determined that the maximum water movement in the control pool was 294 feet per second or 48 miles per day In the test pool the movement was 195 feet per second or approximately 32 miles per day These values compare very favorably with surface water movements established in the Castle Danger vicinity by Ruschmeyer and Olson (1958) In their work it was
150
established that the flow was approximately three to four miles per day
In the experimental pools a counterclockwise current was characteristic with maximum movement occurring around the outer edges of each In contrast movement of water masses would decrease in areas progressively closer to the center and theoretically the exact center of each pool would have no movement at all In calculating maximum values no allowance was made for friction of water on the walls and bottom substrate therefore it should be realized that movement would be slightly less than that reported This information in addition to bei~g of general interest does point out quite simply that there is a constant flow of water past the periphyton-covered substrate whether this growth be in the lake or in the pools and that the rate at which it is passing any given point is approximately the same in the pools as it is in the lake itself This constant renewal of the water is a unique feature of the experimental facility which has been set up at Castle Danger
151
CHAPTER V
Su~Y AND CONCLUSIONS
The primary objective of this research as carried out in the summer and fall of 1969 and 1970 was to determine the possible changes which would take place in Lake Superior periphyton when polluting or enriching substances were added to the lake water To this end two natural rock basins were constructed at the lakeside for the purpose of exposing naturally grown and regrowth periphyton to higher-than-normal levels of phosphate and nitrate In 1969 P04-P in the test pool was maintained at 163 ppm which is 320 times the mean concentration of total phosphorus generally reported for the lake In the following year 1970 the P04-P level in the test pool was lowered to one-tenth of that used the previous year (32 times average concentration of P04-P in the lake) and nitrogen was also added to the test pool In the concentrations added this resulted in a NP ratio of 151
The basalt rock basins situated in a clean area along the north shore at Castle Danger Minnesota received a constant flow of fresh Lake Superior water and were exposed to the same insolation and general climatic conditions as the lake itself One pool served as a normal lake water control whereas the other served as a test pool to which the nutrient-enriched lake water was constantly added At weekly intervals samples were collected and productivity was measured by enumeration of organisms chlorophyll analysis and weight dry and organic
Detailed microscopic examinations were made of each sample to observe changes in the periphyton organisms By this means it was possible to determine the effects of phosphorus and nitrogen enrichment on species composition as well as numbers This information could then be translated into a prediction of changes which might be expected in the future if phosphorus and nitrogen were added in appreciable amounts to Lake Superior Some of the more important findings and conclusions derived from this study were
1 A near-simulation of the near-shore lake environment was achieved in the experimental pools
2 Two successful systems for the delivery of a constant and well-mixed source of nutrients were developed during the course of these studies
3 Natural periphyton collected directly from the lake near Castle Danger during 1969 and 1970 consisted almost exclusively of diatoms The most important representatives were S~nedra acus and Aahnanthes
152
miaroaephala Two other generaCymbeZla and (jompnonema occurred in somewhat smaller numbers Total counts for all organisms were nearly identical for both years and averaged 3800000 cells per cm 2 of rock surface
[ Data collected during 1969 indicated that P04-P additions of 163 ppm did not increase periphyton production On the contrary it seemed to inhibit growth Thus while mean counts were 200000 cells higher in the test pool than in the control other parameters such as total chlorophyll and dry weight values were actual1y higher in the control than in the test pool
5 Laboratory studies in 1970 undertaken prior to the period of field study indicated that the periphyton adhering to rocks collected from the lake at Castle Danger responded positively to enrichment ma intained at one tenth of the 1969 level As a result the phosphorus eosage utilized in the 1970 summer season was reduced to 163 ppm P04-P and nitrogen was added to produce a 151 nitrogen to phosphorus ratio
6 Using the new concentration the results obtained during the summer season of 1970 indicated a distinct difference he tween the test and control pools Organisms in the fertilized pool were two times as numerous as in the control Total chlorophyll was more than three times greater and organic weight was nearly half as great
7 When test rocks were denuded and regrowth was observed total counts were four times higher in the test than in the control pool and the total chlorophyll was more than six times higher Organic weights were three times higher in the test pool than in the control
8 A regression analysis of the data demonstrated that in all cases a high positive correlation existed between total chlorophyll and total cell numbers and that either of these two parameters can be employed as a measure of productivity
9 Based on the dry and organic weight measurements it was observed that periphyton growth in the control pool proceeded at a rate very comparable to that found in Lake Superior itself or in other oligotrophic waters
153
10 Organisms which responded most and phosphorus enrichment were
5cenedesmus and Gsci ltatori tenuis
11 Organisms norma lly abundant in Lake Superior periphyton which responded unfavorably to enrichment were acus Achnanthes m1ClOCeDhala and
Ua spp
12 During the 1970 tests it was observed that there was a definite succession of Ni and Sceneclesmus in the test pool
13 An active competition between algal groups appeared to take place in the test pool during the 1970 season Diatoms appeared first as dominant forms but were eventually replaced by green and blue-green algae which assumed the greatest importance at thE end of the summer
14 The overall seasonal ratio of diatornsgreensblue-greens for both regrowth and undennded rocks was 271 in the test pool In the control pool the ratio was 8 1 1
15 In terms of tIle chlorophyll parameter the prowth rate in the test pool was five times as high as that in the control The specific growth rates were 0036 grams total chlorophyllm2day in the test pool and 00073 grams total chlorophyllm2day in the control
16 On the basis of oreanic weight the test pool daily production rate was more than twice as high as that observed in the control pool or 046 grams as contrasted to 017 gramsm2day
17 Regrowth proceeded at a rapid rate in the test pool during 1970 and after 29 days total chlorophyll and total counts exceeded the natural groveth of periphyton in the same pool After that period the growth leveled off
18 In the control pool on the contrary the periphyton regrowth was less than that of the natural periphyton placed originally jn the pool In fact the natural periphyton parameters were nearly always twice the value of those characterizing the regrowth rocks
19 A supplementary study showed that U7othY1x zonata
154
would grow nicely in by-pass water which contained no enrichment This growth continued into the cold weather season and occurred even under ice during the months of November and December
20 On the basis of small differences in the astacian carotenoid values it would appear that animal grazers did better in the unenriched water of the control pool
21 A dramatic color difference was always observed between the two pools The test pool had a general dark green color and a floating greenish scum which reminded one of an old horsewatering trough or a small polluted pond In terms of color the control pool resembled the typical near-shore area around Castle Danger
On the basis of the foregoing conclusions it is apparent that Lake Superior periphyton responds dramatically to increased additions of phosphorus and nitrogen It could be expected therefore that if the near-shore area of Lake Superior ever received nutrients such as those added to the experimental test pool at Castle Danger a drastic change in the Lakes biota could occur For example as enrichment increased the predominant clean-water diatom forms could eventually be replaced by the more tolerant green or blue-green algae In addition the very composition of the macrobenthic forms found in Lake Superior could be altered as a result of their dependence on the periphyton which as primary producers form the first link in the food chain Likewise certain fish which depend on benthic organisms for their food may be adversely affected as an indirect result of a changing periphyton community
Having established that enrichment of Lake Superior water will dramatically change the normal periphyton growth another baseline has been establ ished for future reference in the event that phosphorus and nitrogen rich wastes should be added to the lake If certain types of algae appear as replacements of the normal flora nm characterizing the periphyton and the produc tivi ty increases one will have a means for assessing the possible changes taking place in the water quality of Lake Superior
155
POSSIBLE FUTURE STUDIES
1 How would periphyton respond to other concentrations and variations of nitrogen and phosphorus What would be the minimal levels of nutrients required in order to noticeably stimulate growth
2 What would be the effect of other macro and micronutrients used in combination with phosphorus and nitrogen
3 To what extent ~ould elevated temperatures affect periphyton
4 How important is periphyton as a source of food to aquatic organisms Would grazing play any significant role in the fluctuation of periphyton populations
5 How effective would the periphyton be as bioassay indicators of insecticide or radioactivity concentrations
6 How feasible would C-14 be as a method for measuring periphyton primary productivity
156
BIBLIOGRAPHY
Abbott W 1967 Microcosm studies on estuarine waters IT The effects of single doses of nitrate and phosphate
113-122
1969 High levels of nitrate and phosphate in a carboy microcosm 1748-1751
Abdin C 1949 Biological productivity of reservoirs (with special reference to the Aswan Reservoir) Hydrobio1 118-133
Adess M R Nelson L Schlottman and W Parkos 1971 A study of the potential of periphyton organisms as components of Lake Superior plankton 1-25
Aleem AA 1958 Succession of marine fouling organisms on test panels immersed in deep-water at La Jolla California 1140-58
Allanson BR 1961 Investigations into the ecology of polluted inland waters in the Transvaal I 1-94
Anderson CC 1958 Seasonal characteristics of two saline lakes in Washington 2 51- 68
Ansell AD IE Raymont KF Lander 1963a Studies on the mass culture of ThaeodactyZum III Small-scaJe experiments __------ ~207-213
Ansell An IE Raymont Kr Lander E and P Shackley 1963b Studies on tho mass culture of Zum II The
rnmO(aitu Iwn and other species tn outdoor tanks 8184-206
APHA 1965 Standard methods for the examination of water and wastewater (12th ed) APHA Tnc New York 769 p
Arnon D I 1958 The role of micronutrients in plant nutrition with special reference to photosynthesis and nitrogen assimilation In Trace Elements Academic Press Inc bullbull New York
Bakus CJ 1966 Some relationships of fishes to benthic organisms on coral reefs 280-284
Barnes H and JA Topinka 1969 Effect of the nature of substratum on the force required to detach a Common littoral algae Am Zool
753-755
Beers CD and I M Neuho1d 1968 Measurement of stream periphyton on paraffin-coated substrates Oceanogr13559-565
157
of the St Lawrence Great LakesBeeton AM 1965 Oceanogr
Bellis VJ 1968 Unialgal cultures of Cladophora glomerata (L) Katz I Response to temperature ~19-23
Bissonette TH 1930 A method of securing marine invertebrates 71464-465
Blum J L 1957 An ecological study of the algae of the Sal ine River Michigan Hydrobiol936l-408
1960 Algal populations in flowing waters In The Ecology of the pymatuning Symposia in Ecology Special Publ No2 Universi ty of Pittsburgh pp 11-21
Brauner T 1956 Die beeinflussung des stoffaustausches durch das licht In Handbuck der Pflanzen-Physiologie (W Ruhland ed) Vol II pp 381-397 Springer Berlin
Brezonik PL WH Morgan EE Shannon and HD Putanm 1969 Eutrophication factors in North Central Florida lakes Florida Engineering and Industrial Experiment Station University of Florida Gainesville Florida 101 pp
Brice RM and C F Powers 196() The Shagawa Lake Minnesota eutrophication research project Proc of the EutrophicationshyBiostimulation assessment workshop Calif Univ Berkeley Sanitary Fngr Res Lab and National Eutrophication Res Progr Corvallis Oregon Pacific Northwest Water Laboratory pp 258-269
Brock TD 1967 Microorganisms adapted to high temperatures Nature 214882-885
Taxonomic confusion concerning certain filamentous algae J 178-179
Brook AJ 1952 Some observations on the feeding of protozoa on freshwater algae HydrobioL 281-293
1954 The bottom-living algal flora of slow sand filter beds of waterworks lIydrobiol 333-351
1955 The attached algal flora of slow sand filter beds of waterworks Hydrobiol 7103-117
1965 Planktonic algae as indicators of lake types with references to the Desmidiaceae Oceanogr 10 403-411 bull
158
Brook AJ and R Colingsworth 1971 Personal Communication Univershysity of Minnesota Minneapolis Minnesota February 1971
Brook AJ and AV Holden 1957 Fertilization experiments in Scottish hill lochs I Loch Kinardochy Sci Freshwa ter Fish
17 30
Bush AF and SF Hulford 1954 Studies of waste water reclamation and utilization Calif State Water Poll Cont Bd Sacramento Publ No9 82 pp
Butcher RW 1932a Studies in the ecology of rivers II The microshyflora of rivers with special reference to algae on the riverbed Ann Bot L6813-86l
1932b Studies in the ecology of rivers IV Observations on grmJth and distribution of the sessile algaE in the River Hull Yorkshire Ecol 28210-223
1932c Notes on ne and little known a18ae from the beds of rivers New Phytol 31289-309
1947 Studies in the ecology of rivers VIII The algae or8anically enriched waters J Ecol bull 35 186-191
Caines JA 1965 The phosphate content of some aquatic macrophytes with special reference to seasonal fluctuations and applications of phosphate fertilizers Hydrobiol 25289-301
Cairns J 1956 Effects of increased temperatures on aquatic organisms Wastes 1150-152
Carpenter JH DW Pritchard and RC hlla1ey 1969 Observations of eutrophication and nutrient cycles in some coastal plain estuaries Eutrophication Causes Consequences Corrections National of Sciences Washington DC 661 PI
Casper VI 1965 A phytoplankton bloom in western Lake Erie Great Lake-2 Res Div Univ Micb 1329-35
Castenholz RW 1960 Seasonal changes in the attached algae of freshwa ter and saline lakes in the 10wer Grand Coulee l~ashington Limnol Oceanogr 1-28
The effect of grazing on marine littoral diatom 783-794
WJ and JE Tilden 1930 Algal food feeding and ease habits of the larva of the midge fly Tanylarsus
11 281-287
159
light induced oxidation ofChance B and R Sagar 1957 Oxygen and nucleotide in a Chlamydomonascytochrome flavoprotein and pyridine
mutant Plant 32548-560
Chandler DV 1964 The St Lawrence Great Lakes Intern Ver 1559-75 ----- shy
Christie AE 1969 In vitro responses of soft water algae to fertilization Ontario Water Resources Commission Toronto Division of Research Paper No 2024 16 pp
Chu SP 1942 The influence on the mineral composition of the
medium on the growth of planktonic algae 1 Methods and culture
media ~ 284-125
1943 The influence of the mineral composition of the medium on the growth of planktonic algae II The influence of the concentration of inorganic nitrogen and phosphate phosphorus J 31109-148
Claflin TO 1968 Reservoir aufwuchs on inundated trees Trans Amer Micr Soc 8797-104
On the rado of nitrogen to phosphorus in theCooper LRN 1937 sea Jour Marine Assn UK 177-182
Crei tz G I and FA Richards 1955 The estimation and characteri shyzation of plankton populations by pigment analysis Ill A note on the use of millipore membrane filters in the estimation of plankton pigments ~ Har Res 14211-216
Czarneki D and R Williams 1970 Personal Communication Bemidji State College Bemidji Hinnesota August 1970
Douglas B 1958 The ecology of the attached diatoms and other algae in a small stony stream J 295-322
Dryden FD and G Stern 1968 Renovated waste water creates recreational lake Sci and 2268
Duffer HR and TC Dorris 1966 Primary productivity in a southern Great Plains stream Limnoi Ocean0B 11143-151
Dut ton H L and WM Nanning 1941 Evidence for carotenoid-sensi tized photosynthesis in the diatom Nitzschia cZosterium ~ Bot 28516-526
Edmondson HT 1947 Measurement of production in fertilized salt water J Mar 6228-246
160
196L Changes in Lake Washington following an increase in the nutrient income Verh Intern 14167-175
Edmondson WT 1968 Lake eutrophication and water quali ty management The Lake Washington case In Hater Quality ControL Univ of Wash Press Seattle
Edmondson WT GC Anderson and DR Peterson 1956 Artifical eutrophication of Lake Washington Oceanogr 147-53
Emerson R 1958 The quantum yield of photosynthesis Ann Plant 91-24
Engelbrecht R and JJ Morgan 1959 Studies on the occurrence and degradation of condensed phosphate in surface waters Sew Ind Wast 31458-478
196L Land drainage as a source of phosphorus waters Algae and Metropolitan Wastes
US Public Health Service pp 74-79
Ewing MS and TC Dorris 1970 Algal community structure in artificial ponds subjected to continuous organic enrichment Amer Hidi Nat ~565-582
Eyster C 1964 Micronutrient requirements for green plants especially algae Algae and Han DF Jackson led] Plenum Press New York p 86
Federal Water Pollution Control Administration 1969 fin Apprais[d of Water Pollution in the Lake Superior Basin Covernment Printing Office Washington DC
Fitzgerald GP 1969 Field and laboratory evaluations of bioassays for nitrogen and phosphorus with algae and aquatic weeds Limnoi Ocean0B 14206-212
Flemer DA 1969 Chlorophyll acalysis as 11 method of evaluating the standing crop phytoplankton and primary productivity Sci 10301-306
Flint EA 1950 An investigation of the distribution in time and space of the algae of a British water reservoir Hydrobio1 2 217-240
Foerster JW and HE Sch1icting 1965 Phycoperiphyton in an oligotrophic lake Trans Amer 84485-502
Fox JL 1969 The Ecology of Epilithic Periphyton of Lake Superior PhD Thesis University of Minnesota Hinneapolis Hinnesota
161
Fox JL TO Odlaug and TA Olson 1969 The ecology of periphyton in western Lake Superior Part I Taxonomy and Distribution Water Resources Center University of Minnesota Minneapolis Minnesota
Fritsch FE 1931 Some aspects of the ecology of freshwater algae (with special reference to static waters) 19233-272
Fuller JI 1946 Season of attachment and growth of sedentary marine organisms at Lamoine Maine 27150-158
Gerloff GC GP Fitzgerald and F Skoog 1950 The mineral nutrition of CoccochiZopis peniocystis ft~er Bot ]L835-890
Godward M 1937 An ecological and taxonomic investigation of the littoral algal flora of Lake Windermere 1 Eco1 ~496-568
Goldman CR 1969 Micronutrient limiting factors and their detection in natural phytoplankton populations In Primary Productivity in Aquatic Environments CR Goldman [edT Mem 1st Ital Idrobiol 18 Supp] Univ of Calif Press Berkeley pr 123-135
Goldman C and R Armstrong 1969 Productivity primary productivity studies in Lake Tahoe California Verh Ver Limnol 1749-71 -- shy
Gross F FEG Raymont SR Nutman and DT Gauld 1946 Application of fertilizers to an open sea loch Nature ~483
Grzenda AR and ML Brehmer 1960 A quantitative method for the collection and measurement of stream periphyton Limnol Oceanogr 5190-194
Gumtow RB 1955 An investigation of the periphyton in a riffle of the West Gallatin River lontana Trans Amer Micr Soc 74278-292
Hamilton nR Jr 1969 Nutrient limitation of sunnner phytoplankton growth in Cayuga Lake Limn01 Oceanogr 579-590
Hamm A 1969 vater quality of the lakes in the Bavarian Alps Fish Flussbiol (Germany) 44
7153388 (1969)
Hasler AD 1947 Eutrophication of lakes by domestic drainage Ecol 383-395
1957 Natural and artificially (air-plowing) induced movement of radioactive phosphorus from the muds of lakes Inter Conf Radioisotopes Res 1-16
162
Hepher B 1962 Primary production in fishponds and its application to fertilization experiments Oceanogr 2 131-136
Herbst RP 1969 Ecological factors and the distribution of gZomepata in the Great Lakes Amer MidI Nat 8290-98
Hogetsu K and S Ichimure 1954 Studies on the biological production of Lake Suwa IV The ecological studies on the production of phytoplankton ~ 1 Bot 280-303
Hohn MH and J Hellerman 1963 The taxonomy and structure of diatool populations from three Eastern North American rivers using three sampling methods Amer Soc 82250-329
Holden AV 1959 Fertilization experiments in Scottish freshwater lochs II Sutherland 1954 Invest Freshwater Fish
42 ---- shy
Holm-Hansen 0 GC Gerloff and F Skoog 1954 Cobalt as an essential element for blue-green algae Physiol ~um 2 665-675
Huntsman AG 1948 Fertility and fertilization of streams J Fish Res Bd Can 248-253
Hustedt F 1930 Bacil1ariophyta (Diatomeae) Heft 10 Die Swsswassershyflora Mitte1europas Herausgegeben von Prof Dr A Pascher Gustave Fischer Jeno Deutschland 446 pp
Hutchinson GE 1957 A Treatise on Limnology John Wiley and SonsNew York 1015 pp
Ishac MM and nM Bishai 1968 The possible role of the algaeCZadophopa oZomepotn the biological control of BiomphaZa~abnissY1 of Schistosoma mansoni Hydrobiol 32168-180
Jackson DF 1967 A study of the periphyton organisms of the eastern end of Lake Ontario Proc 10th Conf on Great Lakes Res International Association for Great Lakes Research Ann ArborMichigan pp 31-36
Jolly VH and MA Chapman 1966 A preliminary biological study of the effects of pollution on Farmers Creek and the Coxs River New South Wales 160-187
Jones JRE 1949 An ecological study of the River Rheidol North Cardiganshire Wales J ~67-88
163
-- --
Juday C and EA Birge 1931 A second report on the phosphorus content of Wisconsin lake waters of Arts Lett 353-382
Devern NR and RC Ball 1965 Primary productivity and energy relationships in artificial streams Limnol 1074-87
Kilham P 1971 A hypothesis concerning silica and the freshwater planktonic diatoms 1610-18
King nL 1970 The role of carbon in eutrophication I 422035-2051
Knudson B 1957 the epiphytic diatom TabellaYia [Zoccnil-osa(Roth) Kutz in three English lakes 1 Eco1
93-112
Kobayasi H 1961 Productivity in sessile algal community of Japanese mountain river Bot 74 331-341
Komarvosky B 1953 A comparative study of the phytoplankton of several fish ponds in relation to some of the essential chemical constituents of the water Bull Res Coun 379-410
Kormondy EJ 1969 Concepts of Ecology Prentice-Hall Inc Englevood Cliffs New Jersey
Kott Y 1968 Effect of nitrogen and phosphorus on algal growth in citrus wastes experimental oxidation pond 161-167
Kuentzel LE 1969 Bacteria carbon dioxide and algal blooms 41 1737-1747
Lackey JB and CN Sawyer 1945 Plankton productivity of certain southeastern Wisconsin lakes as related to fertilization I Surveys Works 1 573-585
Lange W 1970 Cyanophyta-bacteria systems Effects of added carbon compounds or phosphate on algal growth at low nutrient concentrations J 230-234
Langford RR 1948 Fertilization of lakes in Algonquin Park Ontario Soc 78133-144
Larkum AWD EA Drew and RN Crossett 1967 The vertical distribution of attached marine algae in Malta J Ecol 22 361-371
Lebour MV 1922 The food of plankton organisms J Mar BioI Assn ~ Q644-677
164
Lee C 1970 Eutrophication Occasional paper No2 Eutrophication Information Program University of Wisconsin Madison
Lund JWG 1965 The ecology of freshwater phytoplankton BioI Rev 231-293
Mackenthun KM and lt1M Ingram 1967 Biological Associated Problems in Freshwater Environments Their Identification Investigation and Control US Dept of the Interior pp 1-287
Mackenthun KM LA Lueschow and cn McNabb 1960 A study of the effects of diverting the effluent from sevage treatment upon the tEceiving streams Trans Wise Sci Art Let~ 51-72
Margalef R 1948 A new lirrmological method for the investigation of thin-layered epilithic communities Trans Amer ~1icr Soc 67153-154 -- -- -shy
Marshall SM and AP Orr 1947 Further experiments on the fertil zation of a sea loch (Loch Craiglin) The effect of different plant nutrients on the phytopl ankton J Mar BioI Assn ~ 27 360
Marzolf CR 1965 Substrate relations of the burrowing amphipod in Lake Michigan Rcol 46579-592
McAllister CD TR Parsons K Stevens and JDH Strickland 1961 Measurements of primary production in coastal SEa water using a large-volume plastic sphere Limno1 6237-258
McConnell WJ and WF Sigler 1959 Chlorophyll and productivity in a mountain river Limn_ol Oceanog 4315-351
McIntire Cn lQ66a Some effects of current velocity on periphyton communities in laboratory streams Hydrohiol 559-570
Some factors affecting respiration of periphyton in lotic environments 918-930
HcIntire CD and ILK Phinney 1965 Laboratory studies of periphyton production and community metabolism in lotic environments Ecol Nono~ 35217-258
NcKee BS 1962 Nitrogen Hetabolism in Plants Clarendon Press Oxford England 78 pp
McKee IE and HW Wolf 1963 Water quality criteria California State Water Quality Control Board Publication 3-A Sacramento California
165
------
36Meeks R L 1968 The accumulation of C1 ring-labeled DDT in a freshwater marsh J Manag 376-379
Megard RO 1969 Algae and photosynthesis in Shagawa Lake Minnesota Limnol Res Center Dniv of Minn Interim Rept No5
Menzel DW and JH Ryther 1961 Nutrients limiting the production of phytoplankton in the Sargasso sea with special reference to iron Deep Res 276-281
Moss B 1969 Algae of two Somersetshire pools standing crops of phytoplankton and epipelic algae as measured by cell numbers and chlorophyll a l Phycol 2158-167
Moss B and AG Karim 1969 Phytoplankton associations in two pools and their relationships with associated benthic flora Hydrobiol
587-600
Munawar M 1970 Limnological studies on freshwater ponds of Hyderabad shyIndia II The biocenose distribution of unicellular and colonial phytoplankton in polluted and unpolluted environments
105-128
Neel JK 1953 Certain limnologica1 features of a polluted irrigation stream Soc 72119-135
Seasonal succession of benthic algae and their macroshyresidents in a headwater limestone stream JWPCA
RIO-R30 - - - - shy
Neil JH and GK Owen 1964 Distribution environmental requirements and significance of in the Great Lakes Great Lakes
Di Mich 113-121
Nelson R T Olson and T Odlaug 1971 Taxonomy of North Shore periphyton Lake Superior Castle Danger studies - 1970-1971
129-36
Neos C 1966 The removal of phosphate by algae in river water Water
Newcombe CL 1950 A quantitative study of attachment materials in Sodon Lake Hichigan 204-215
Oborn ET and EC Higginson 1954 Biological corrosion of concrete Joint Rept Field Crops Res Branch Agric Res Service US Dept Agric and Bur Reclamation US Dept Interior 8 pp
166
Odum HT 1957 Trophic structure and productivity of Silver Springs Florida Monogr
Olson TA 1972 Personal Communication University of Minnesota Minneapolis Minnesota April 1972
Oswald WJ 1960 Metropolitan wastes and algal nutrition Algae and Metropolitan Wates Trans 1960 Seminar Robt A Taft San Eng Center Cincinnati Ohio pp 88-95
Palmer CM 1962 Algae in Water Supplies US Dept of Health Education and Welfare Public Health Service Robert A Taft Sanitary Engineering Center Cincinnati Ohio Publication No 657
1969 A composite rating of algae tolerating organic pollution J 78-83
1971 A composite rating of algae tolerating organic pollution Selected Papers in Phycology JR Rosowski and BC Parker reds] of Botany Dniv of Nebraska Lincoln pp 33-37
Parkos WG 1969 An Analysis of the Primary Productivity of the Surface Waters of Lakes Superior Michigan Huron and Irie Using the C-14 Technique PhD Thesis University of Minnesota Minneapolis Minnesota
Patrick R 1948 Factors effecting the distribution of diatoms Bot Rev
Patrick R and Chi Reimer 1966 The Diatoms of the United States Livingston Publishing Company Philadelphia 688 pp
Patrick R MH Hohn and JH Wallace 1954 A new method for determining the pattern of the diatom flora Not Naturae No 259 12 pp
Perkins EJ 1958 The food relationships of the microbenthos with particular reference to that founct at Whitstable Kent Ann ~ Nat (ser 13) 164-77
Philipose MT 1960 Freshwater phytoplankton of inland fisheries Proc leAR New Delhi272-291
Phinney HK 1965 Effect of temperature on metabolism of periphyton communities developed in laboratory streams Toimnol Oceanogr 10341-344
Pinchot GB 1970 Narine farming Sci Amer 15-21
167
Prescott GW 1956 A guide to the literature on ecology and life histories of the algae Bot Rev 22167-240
Prescott GW 1962 Algae of the ~estern Great Lakes Area Rev ed Wm C Brown Co Inc Dubuque Iowa 977 pp
1964 How to Know the Freshwater Algae Im C Brown Co Iowa 272 pp
Putnam HD and TA Olson 1959 A Preliminary Investigation of Nutrients in Western Lake Superior 1958-1959 School of Public Health University of Minnesota Minneapolis Minnesota 20 pp
1960 An investigation of Nutrients in School of Public Health University of
Minnesota Minneapolis Minnesota 25 pp
Raschke RL 1970 Algal periodicity ami water reclamation in a stabilization pond ecosystem 2~ fE 42518-530
Ravera O and RA Vollenweider 1968 an indicator of Lago Maggiore eutrophication 30374-380
Raymont FEG 1949 Further observations on changes in the bottom fauna of a fertilized sea loch J Har BioI Assn lS 9-19
Redfield C 1958 The biological control of chemical factors in the environment Amer bull 46205-221
Rehbronn E 1937 X Beitrage zur Fischereibiologic merkischer seen II Das naturliche Nahrungsangebot insbesondere der Aufwuchs und die Ernahrung der Fischnahrtiere im Litoral eines eutrophen sees 1 and n-IV f Fischerei 35(2) 233-282 283-345 (Sladeckova - shy
Reynolds N 1950 Methods of culturing epiphytic algae New 155-162
Richards LA with T G Thompson 1952 The estimation and characteri shyzation of plankton populations by pigment analyses II A spectroshyphotometric method for the estimation of plankton pigments J Mar Res 156-172
Roa CB lQ53 On the distribution of algae in a group of six small ponds J 62-71
Rodhe W 1948 Environmental requirements of freshwater plankton algae Symb Bot 1-149
168
Rose FL and CD McIntire 1970 Accumulation of dieldrin by benthic algae in laboratory streams Hydrobiol 481-493
Rosine WN 1955 The distribution of invertebrates on submerged aquatic plant surfaces in Muskee Lake Colorado 308-314
Round FE 1953 An investigation of two benthic algal communities in Ma1ham Tarn Yorkshire J Ecol 41174-197
1960 Studies on bottom-living algae in some lakes of the lake district IV The seasonal cycles of the Bacillarioshy
phyceae J Ecol 48529-547
1961 Studies on bottom-living algae in some lakes of the English lake district VI The effect of depth on the epipelic algal community T Ecol 49245-554
1965 The Riology of the Algae St Martins Press New York 269 pp
Rudolfs II 1947 Phosphates in sewage and sludge treatment Sew 2 19 43
Ruschmeyer OR and LA Olson 1958 Water Movements and Temperatures of estern Lake Superior School of Public Health University of Minnesota Hinneapolis Hinnesota 21 pp
Ryther JH 1954 The ratio of photosynthesis to respiration in marine plankton algae and its effect upon the measurement of productivity
Deep Sea Res bull 2134-139
Sanderson WW 1953 Studies of the character and treatment of wastes from duck farms Proc 8th Ind ~aste Conf Purdue Univ Ext Ser 83170-176
Sawyer CN 1947 Fertilization of lakes by agricultural and urban drainage 2 New ~ Water Works Assn 61109-127
1965 Problem of phosphorus in water supplies J Amer Water Works 571431-1439
Sche1ske CL and Ebull Stoermer 1971 Eutrophication silica depletion and predicted changes in algal quality in Lake Michigan
423-424
Schindler DW 1971 Carbon nitrogen and phosphorus and the eutroshyphication of freshwater lakes 2 Phyco1 2321-329
Shapiro J lQ70 A statement on phosphorus 2~~I 42772-775
169
Shapiro J and R Ribeiro 1965 Algal growth and sewage effluent in the Potomic estuary I1~ 1034-1042
Singh VP and PN Saxena 1969 Preliminary studies on the algal succession in rm stabilized sewage Hydrobio1 34503-512
Skulberg OM 1968 Some experimental investigations of self-purification processes Gruntorbattring2l25-37 In BioI Abstr 1969 No 5681
Sladeckova A 1962 Limnologica1 investigation methods for the periphyton (Aufwucbs) community Bot Rev 286-350
Smith GM 1950 The Fresh-Water Algae of the United States McGraw-Hill Book Co Inc New York 719 pp
Smith HI 1945 Preliminary observations upon the fertilization of Crecy Lake New Brullfndck Tran Amer Fish Soc lfl5-l74
1959 Phosphorus enrichment of drainage waters from farm ~ Fish Res ~an 887-895
Smith R F bull 1968 mechanisms at Lake Tahoe IT Source of an endogenous bloom on the south shore July 1967 ~ater Res 2625-630
Smith RF and HF Ludwig 1968 Eutrophication mechanisms at Lake Tahoe (USA) 1 Source of an exogenous SiPUQl-llYl bloom on the south shore January 1967 Hater Res 2
STlyth JC 1955 A study of the benthic diatoms of Loch Sween J Ecol 43149-171
Slokes LW 19f19 The Productivity of Lake Superior Periphyton as Reflected oy Pi11lent Analysis and Respirometry PhD Thesis llniversi ty of r1innesota Hinneapolis Minnesota
Stokes LW TA Olson and TO Odlaug 1970 The Photosynthetic Pigments of Lake Superior Perlphyton and Their Relation to Primary Productivity Water Resources Center University of Minnesota Hinneapolis Ninnesota
Stockner JC 1968 Algal growth and primary productivity in a thermal stream J Res Can 2037-2058
Stockner JC and FAJ Armstrong 1971 Periphyton of the experimental lakes areel northwestern Ontario J Fish Res Can 28215-229
Strickland J DH O Holm-Hansen RH Eppley and RJ Linn 19f19 The US2 of a deep tank in plankton ecology T Studies of the growth and composition of phytoplankton crops at low nutrient levels
23-34
170
Stumm H and JJ Morgan 1962 Stream Pollution by Algal Nutrients Twelfth Annual Conference on Sanitary Engineering University of Kansas pp 16-26 (Harvard University Sanitary Engineering Reprint No 45)
swingle HS BC Gooch and HR Rabanal 1963 Phosphate fertilization of ponds Proc Ann Conf ~~ Assn Game~ Fish Comm 17213-218
Sylvester RO 1960 Nutrient content of drainage water from forested urban and agricultural areas Algae and Metropolitan Hastes Robt
A Taft San Eng Center Cincinnati Ohio pp 80-87
Sylvester RO and GC Anderson 1964 A lakes response to its environment 1 San ~ Div ASCE 1-22
Takumi J 1971 Personal Communication University of Ninnesota Duluth nuluth Minnesota August 1971
Tanada T 1951 The photosynthetic ef ficiency of carotenoid pigments in Naviouta rrrpoundrlima Am J le 27fl-283
Taylor AW 1967 Phosphorus and ater pollution J Soil ~ater Cons26 228-231 -- -- ~~~ shy
Tiffany LH and ME Britton 1951 The Algae of Illinois University of Chicago Press Chicdfo Illinois 407 pp
Tilden J 1910 The Nyxophyceae of North America and Acljacent Regions Vol I of ~finnesotCl AlgCle TIepuhlished by J Cramer Bibliotheca Phycologica Authorized nprint 19f18 Printecl in Germany Verlag von Cramer
Voigt GK 19f1O Alteration of the composition of L1inwater hy trees Amer M~ Nat 63J2]-176
Wallace NM 1955 The effect of temperature on the growth of some freshwater diatoms ]ot Nat Acad Sci Phi1 No 28011 pp
Waters Tr ]960 otes on the chlorophyll method of estimating the photosynthetic capacity 01 stream periphyton Limnol Oceanogr 5486-488
Weiss CM 1969 Relation of phosphate to eutrophication J Amer Water ~Iorks Assn bull 61 387-391
Westlake nF ]965 Some basic data for investigations of the productivity of aquatic macrophytRS pp 231-248 In Primary Productivity in Aquatic Environments CR Goldman [dj Mem 1st Ita1 Idrobio1 18 SuppJ University of California Press Berkeley
Iii
Whipple CG and HN Parker 1902 On the amount of oxygen and carbonic acid dissolved in natural waters and the effect of these gases upon the occurrence of microscopic organisms Trans Amer Microsc Soc pound103-144 --- ---
Whitford LA 1956 Communities of algae in sprIngs and spring streams of Florida Ecol 37433-442
1960 The current effect and growtll of fresh-water algae Trans Amer Microsc Soc 79302-309
Whitford LA and GJ Schumacher 1968 Notes on the ecology of some species of fresh-water algae Hydrobio1 225-236
1969 A Manual of the Fresh-Water Algae in Carolina Agricultural Experimental Station
313 pp
Winter DR 1971 Water Quality and Trophic Condition of Lake Superior (Hisconsin Haters) Research Report No 68 Dept of Natural Resources Madison Hisconsin 24 pp
Wood CE and TL Shedden 1968 Effects of fertilizer on food chain organisms and fish production in Norris Reservoir Tennessee
and Wildlife Branch Pub 19 pp
Young nw 1945 A llmnological investigation of periphyton in Douglas Lake Michigan Amer 641-20
Yount JL 1956 Factors that control species numbers in Silver Springs Florida Oceanogr 286-295
172
APPENDIX A
Calculations for Arriving at Chemical Dosage Rates at Castle Danger
(1) Desired nutrient level 50 mgL (163 mgL
(2) Amount of water flowing through test pool in one day 20000 Liters (2 overturns)
(3) Desired stock solution delivery rate from capillary tube 5 Litersday
(4) Size of stock reservoir 35 Liters
(5) Molecular weights of chemical used
(a) 3H 02
22823
(b) 95
(6) Amount of needed LO obtain 50 mg in one liter of water
grams of needed 005 g P04 012
38 0 in one liter of water will give the
Thus 0012 grams of value2 of 50 mgL P04
(7) Flow-thru in the test pool was 20000 liters thus in one day 240 grams (012 x 20000) of was released uniformly into the water Since the delivery rate was 5 liters per day 240 grams of stock chemical was dissolved in that volume The stock chemical Has mixed in a large 35-liter carboy vlbjch wouJd then provide sufficient solution for a 7-day period Thus in the 35-liter carboy of distilled wa ter 1680 grams of K HPO4 31LO was mixed
2
(1) Desired phosphorus rate 163 (5 mgL
(2) Amount of Hater flowing through test pool in one day 60000 liters (6 overturns)
73
(3) Desired stock solution delivery rate from proportioning pump 5 Litersday
(4) Size of stock solution reservoir 35 Liters
(5) Molecular weights of chemical used
(a) K~HPO bull 22823
(b) PO 4 = 95
(6) Amount of K2HP04 needed to obtain 5 mg P04 in one liter of is exactly 10 times less that of 1969 Thus 0012 grams
K2HPO in one liter of water will give the desired value of 5 mgL P04
(7) Flow-thru in the test pool was 60000 liters thus in one day 72 grams (0012 x 60000) of K2HP04 was released uniformly into the water Since the desired solution delivery rate was 5 liters per day 72 grams of this stock chemical was dissolved in that volume In the 35-liter carboy of distilled water 504 grams of KHPO was mixed
After the appropriate phosphorus dosage was determined the following steps were used to incorporate nitrogen (as NaN0 3) into the same solution at a 151 ratio
0) Assume the use of 163 mg P04-PL (05 mg
(2) P to N ratio of 115 thus 163 x 15 245
(3) Average va]ue of at Larsmont Station in Lake Superior is 049 mg N03-NL 245 049 - 196 mg N03-NL (871 mg N0 3L) This is thf amount to be added in combination with phosphorus
(4) Holecular weights of chemical used
(a) NaNO 8499
(ll) N0 = 623
(5) Iulotmtsof NaN03 needed to produce 871 mg in one liter of water
grams needed 00871 g [~] 0119
Thus 0119 grams of in one liter of water wi1] give the desired value 87] mg
174
IJ Flow-thru in the tes t pool was 60000 liters thus in one day(6) 714 grams (0119 x 60000) of NaN03 was released uniformly into the water Since the desired solution delivery rate was 5 liters per day 714 grams of this stock chemical was dissolved in that volume Thus in the 35-liter carboy of distilled water 4998 grams of NaN03 was mixed This was combined in the same 35-liter solution which contained the phosphorus
(7) Thus the 35-liter container of stock solution which would last for one week contained the following components
(a) 504 grams of K2HPO
(b) 4998 grams of
175
AII[ND
Summary of Phospha lysis
CasTI Danger 1969
LakG~-
APPEND I X
Ie
Summary lf Wa Chemistry lesl POll Danger
DaTe P04 (ppm) tm J (ppm) pH
7-22 17 6 N r
1-30 4 794
8-5 52 92 NS NS
8-1 49 90 NS N S
8shy 55 J I 0 Nbullbull Nbullbull
8-26 I 8 i
9-2 46 0
9-1 61 150 r~ s r )
9-30 48 9 I 13 0 I
0-8 N Nbullbull
0-15 101 NS
10-22 47 81 22
-) 42 e5 NS rL
-2 7 J 1 Nbullbull N
I I () 2 8
i~ ClndUCTed by the Stannous j()[ide-r~olybdate thod whereas was Iyzed by the Phenoldisulphonic-Acid Method
means no Ie collected
177
0-30 54
II 1
-6 4
-3 489
1-19
I 1-23 )
)
005 005
lt bull
lt005 NS
lt005
005 lt005
00 005
lt 00)
les room
I
f TWl (~d f Plo I
76
APPENDIX DAPPlNDIX C
Mounting Media InstructionsII
the floo I and Lake The mounting medium as formulated by David Czarnecki and 19
Harvey Williams in 1970 is prepared as follows If bullbullbull 1575 grams of polystyrene is added to 50 ml of toluene This solution is
pH allowed to stand until clear then thoroughly mixed with 200 g of methylene iodide In our preparation we used seven fragmented 6-7 f1 oz styrocup brand styrofoam cups ohtainable at most P ke C Lake grocery stores Other polystyrene sources should work equally
NS well 7-22 005 lt005 136 N
21 09 24 14 176 7 In evaluating their mounting medium Czarnecki and Williams7-30 concluded that refractive index of the solid medium determined by comparisons with reference refractive oils was 1 75 at 24deg C and 97 Nbullbull N~8-gt
~
tungsten light Resolution of detail in the finished mounts exceeded that in Hyrax mounts147 I Nbullbull N
NS(J- I I N
I 1 J 12 194 92B-2() S I 1489-L
Col- I) I N N
11) i 2 I gt II 8g 859-30
N 08 o N10-8
0-1 09 2 N N
7 bull I 70 o _13 N C N
Nbull J-2 o r
o o 1 6 I) gO 8
he tent both Coni Pool andyenIn every kc was tt1a n
means no es I
179
178
---APPENDIX E
Checklist of Periphyton Organisms Found In Lake Superior and Experimental Pools
At Castle Danger 1969-1970
PHYLU11 CHRYSOPHYTA
Achnanthes 1anceo1ata (Brebisson) Grunow A Microcepha1a (Kuetzing) Cleve
Amphiprora ornata Bailey Amphip1eura pellucida Kuetzing Amphora ovalis Kuetzing Asterione11a formosa Hassall Ceratoneis arcus (Ehrenberg) Kuetzing Cocconeis flexella (Kuetzing) Cleve
C pediculus Ehrenberg C placentula Ehrenberg
Cyclotella antiqua Wm Smith C bodanica Eulenstein
Cymatopleura solea (Brebisson) Wm Smith Cymbella cistult (Hemprich) Grunow
C gracilis (Rabh) Cleve C lanceolata (Ehrenberg) van Heurck C leptocerus (Ehrenberg) Grunow C parva (Wm Smith) Cleve C prostrata (Berkeley) Cleve C ventricosa Kuetzing
Denticula thermalis Kuetzing Diatoma anceps (Ehrenberg) Kirchner
D elongatum Agardh D hiemale (Lyngbye) Heiberg D vulgare Bory
Diploneis elliptica (Kuetzing) Cleve D puella (Schuman) Cleve
Epithemia argus alpestris (Wm Smith) Grunow E turgida (Ehrenberg) Kuetzing
Eunotia monodan (Ehrenberg) Wm Smith E pectinalis Val minor (Kuetzing) Rabenhorst L vJOleirolii Rabenhorst
Fragilaria capucina Desmazieres F crotonensis Kitton F harrisonii (Hm Smith) Grunow
Frustulia viridula (Brebisson) Detoni Gomphoneis herculeana (Ehrenberg) Cleve Gomphonema acuminatum vaT coronatum Rabenhorst
G acuminatum vaT turris (Ehrenberg) Cleve G angus tatum VaT obtusatum (Kuetzing) van Heurck C constrictum Ehrenberg
180
Gomphonema constrictum Val capitatum Grunow c geminatum (Lyngbye) CA Agardh G gracile Val dicotoma (Kuetzing) Grunow C helveticum Val tenuis Hustedt G intricatum Kuetzing C montanum Grunow C olivaceum (Lyngbye) Kuetzing G olivaceum Val calcarea Cleve G parvulum (Kuetzing) Grunmv G sphaerophorum Ehrenberg
Melosira granulata (Ehrenberg) Ralfs M varians CA Agardh
Neridion circulare VaT constricta (Ralfs) Hustedt Navicula arvensis Husted t
N dicepl1ala (Ehrenberg) Hm Smith N dicephala val elinensis (Gregory) Cleve N minima Grunow N oblohga Kuetzing N pupula Kuetzing N radiosa Kuetzing N reinhardtii (Grunow) van Heurck N tuscula Ehrenberg N verecunda Uustedt N viridula Kuetzing
Nitzschia angusta val acuta Hustedt N denticula Grunow N dissipata (Kuetzing) Crunow N filiformis Hustedt N hungarica Grunow N linearis (Agardh) I)m Smith N linearis val tenuis (Hm Smith) Grunow N palea (Kuetzing) Wm Smi th N sigmoidea (Nitzsch) Jm Smith N sublinearis Hustedt N vermicularis (Kuetzing) Hatzsch
Pinnularia cardinalis (Ehrenberg) Hm Smith P major (Kuetzing) Hm Smith P viridis (Nitzsch) Ehrenberg
Rhizosolenia eriensis HL Smitb Rhoicosphenia curvata (Kuetzing) Grunow Stauroneis anceps va anceps Ehrenberg
S obtusa Lagerst Stephanodiscus Ehrenberg Surirella angusta Kuetzing
S linearis In Smith S ovalis VaT pinnata Hm Smith
Synedra aeus Kuetzing S rumpens Kuetzing S tenera Kuetzing S ulna (Nitzsch) Ehrenberg S vaucheriae vaT truncata Kuetzing
181
Tabellaria fenestrata T flocculosa
Chlamydomonas Ehrenberg Chlorococcum Fries Cosmarillm Corda Hougeotia Agardh Oedogoniulll Link Pediastrum boryamUll (Turpin) Heneghini
P duplex Heyen Pithophora Wittock Protococcus viridis Agardh Rhizoclonium hierglyphiculll (Agardh) Klletzing Scenedesmus obliqUllS (Turpin) Kuetzing
S quadricauda (Turpin) Brebisson S qlladricauda var quadrispina (Chodat) CM Smith
Schizomcris leibleinii Kuetzing Selenastrum Reinsch Spirogyra Link Stigeoc]oniulll sllbsecuntum Kuetzing Ulothrix tenerrima Kuetzing
U Zonata (Weber amp fohr) Kuetzing
Aphanothece lllicrospora (Menegh) Rabenhorst ChroococcllS minor (Klletzing) Naegeli Lyngbya lllartensiana var calcarea Tilden Merislllopedia convoluta Brebisson Oscillatoria tenius CA Agardh Phormidiulll foveolarum (Montagne) Gomont Plectonellla wollei Farlow
182