Embed Size (px)
Citation preview
ERASMUS UNIVERSITY ROTTERDAM
The effects of female board members on CEO compensation
How women in the Board of Directors can influence CEO compensation components
Master thesis 2011 Stephan Kerkhoven
290250 Master Accounting & Finance Supervisor: van der Boom
This research investigates the effects on CEO compensation when females occupy board seats and finds that there is no significant relation between women representativeness in the Board of Directors and executive compensation components. The number of female board members does show a significant association with total board size and CEO chairmanship. Board size and CEO chairmanship in turn show significant association with the salary compensation component. Female directors are busier on average than male directors, meaning they hold more board seats at once than male directors. The number of board seats held by directors is associated with a significant impact on the salary, stock, option and total compensation components. The sample for this master thesis’ research consists of publicly listed U.S. S&P1500 companies for the years 2007‐2009 and contains 3.986 executive years which are matched with 37.418 director years. Keywords: Executive compensation, female board members, CEO bonus, CEO chairman, board of directors, board member occupancy, board diversity.
1 Preface
Preface
To complete the master course Accounting & Finance, students are required to write a thesis that
merges the adapted skills of the educational program. The basics of writing such a thesis were obtained
in the seminar Advanced Financial Accounting, lectured by Dr. Sc. Ind. A.H. Van der Boom. The idea for
writing this thesis arose from the actualities and media attention regarding executive bonuses and
compensation schemes in times of crisis and especially now during the aftermath of the credit crunch.
As differences in the human psyche between men and women are always an actuality of some sort and
variation on this subject seems infinite, and discussions on this topic were extant, the decision was
made to combine the two. I would like to thank Dr. Sc. Ind. A.H. Van der Boom for lecturing the seminar,
guiding me through the process of writing this thesis, and discussing and reviewing certain aspects of
life. Furthermore, I would like to thank Inge Schepens for her support with the SPSS statistics. Special
acknowledgements go out to Kelly van Cauter, not just for reviewing and criticizing this thesis, but for
the greater part of supporting me in all those years of college and being like a sister to me. Both
graduating means a lot to me and I thank her for all the laughs we shared, for all the times she reminded
me to subscribe for exams and for helping me out with study projects. Finally I thank all those who
supported me or contributed to this thesis some way or another1.
October 2011
Stephan Kerkhoven
1 These are, not exclusively; Barbara Filippo, Danielle Kerkhoven, Frank Keijzer, Jörgen de Landmeter, Joost Abma, Martin Kruller, Meike Lockhorst, Nick & Henny Tuinenburg, Rene Weteling, Robert Kerkhoven, Roland Jager, Sarah van de Linden, Sebastiaan Mook, Sherida Verbeek, Tina Kerkhoven, Will Hollander.
2 Preface
Contents
Preface .......................................................................................................................................................... 1
1 Introduction .......................................................................................................................................... 5
1.1 CEO compensation ............................................................................................................................ 5
1.2 Female representation ...................................................................................................................... 7
1.3 Research Questions .......................................................................................................................... 8
1.4 Relevancy ........................................................................................................................................ 10
1.5 Methodology ................................................................................................................................... 11
1.6 Structure of Thesis .......................................................................................................................... 12
2 Research approach.............................................................................................................................. 13
2.1 Positive Accounting ......................................................................................................................... 13
2.2 Agency Theory................................................................................................................................. 14
2.3 Chapter Summary ........................................................................................................................... 15
3 Prior Literature .................................................................................................................................... 16
3.1 Prior literature on Diversity ............................................................................................................ 16
3.1.1 Social Studies ...................................................................................................................... 16
3.1.2 Theoretical studies .............................................................................................................. 19
3.1.3 Economic studies ................................................................................................................ 21
3.2 Prior literature on CEO compensation ............................................................................................ 29
3.3 Chapter Summary ........................................................................................................................... 33
4 Research Design .................................................................................................................................. 37
4.1 Hypotheses ..................................................................................................................................... 37
4.2 Test Model ...................................................................................................................................... 41
4.3 Research statistics layout ................................................................................................................ 45
4.4 Data Sample .................................................................................................................................... 47
4.4.1 Selection procedure ............................................................................................................ 47
4.4.2 Sample Descriptives ............................................................................................................ 48
4.5 Chapter Summary ........................................................................................................................... 51
5 Test Results ......................................................................................................................................... 53
5.1 Outcomes statistic tests .................................................................................................................. 53
5.1.1 Single regression test .......................................................................................................... 54
3 Preface
5.1.2 Multiple Regression Model 1 .............................................................................................. 56
5.1.3 Multiple Regression Model 2 .............................................................................................. 58
5.1.4 ANOVA female directors and total board size .................................................................... 61
5.1.5 ANOVA CEO chairmanship and female directors ................................................................ 63
5.1.6 ANOVA female directors and occupancy ............................................................................ 64
5.1.7 Test on multicollinearity ..................................................................................................... 66
5.1.8 Multiple Regression Model 3 .............................................................................................. 67
5.2 Hypothesis Validation ..................................................................................................................... 69
5.3 Chapter Summary ........................................................................................................................... 74
6 Analysis and Conclusion ...................................................................................................................... 78
6.1 Outcomes ........................................................................................................................................ 78
6.2 Limitations ....................................................................................................................................... 83
6.3 Contribution and recommendations .............................................................................................. 85
6.4 Chapter Summary ........................................................................................................................... 87
7 Thesis summary .................................................................................................................................. 89
References .................................................................................................................................................. 91
Appendix ..................................................................................................................................................... 94
1 Newspaper cut‐outs ........................................................................................................................ 94
2 Graph from Frydman and Jenter paper .......................................................................................... 98
3 SPSS figures ..................................................................................................................................... 99
3.1 Age distribution CEO’s ............................................................................................................ 99
3.2 Female board members and occurrence .............................................................................. 101
3.3 Dependent variables outputs in Multiple Regression Model 1 ............................................ 102
3.4 Dependent variables outputs in Multiple Regression Model 2 ............................................ 108
3.5 Dependent variables outputs in Multiple Regression Model 3 ............................................ 114
4 Literature Summary ...................................................................................................................... 120
4 Preface
Table 1: Distribution of CEO years .............................................................................................................. 48
Table 2: Gender diversity of CEO years per index ...................................................................................... 48
Table 3: Age distribution of CEO years ....................................................................................................... 49
Table 4: Gender diversity in CEO chairmanship .......................................................................................... 49
Table 5: Descriptive of board characteristics .............................................................................................. 50
Table 6: Individual Correlation Coefficients ................................................................................................ 54
Table 7: Outcomes summary MRM 1 ......................................................................................................... 56
Table 8: Outcomes summary MRM 2 ......................................................................................................... 58
Table 9: Female directors and their board size .......................................................................................... 61
Table 10: ANOVA results of board size groups ........................................................................................... 61
Table 11: Chairmanship CEO and number of female board members ....................................................... 63
Table 12: ANOVA results CEO chairmanship and female board members ................................................. 63
Table 13: Female and male directors their occupancy ............................................................................... 64
Table 14: ANOVA results female board seats and male board seats ......................................................... 64
Table 15: Multicollinearity statistics ........................................................................................................... 66
Table 16: R and Rsq comparison MRM's ..................................................................................................... 68
Table 17: Descriptive CEO age .................................................................................................................... 99
Table 18: Descriptive CEO chairman age .................................................................................................. 100
Table 19: Female Board member distribution descriptive ....................................................................... 101
Figure 1: Distribution of female board members in relation to total board size ....................................... 62
Figure 3: Summarization of regression tests .............................................................................................. 74
Figure 4: Executive Age Distribution ........................................................................................................... 99
Figure 5: Age Distribution CEO Chair and Non‐chair ................................................................................ 100
Figure 6: Pie chart of boards having X number of female directors ......................................................... 101
5 Introduction
1 Introduction
1.1 CEOcompensation
Due to the public opinion, governments are currently employing and developing legislation to
control the bonuses of government supported companies their CEO’s. Companies that received a bailout
(emergency loan of the government) were obliged to make redundancy programs and expenditure cuts.
However, their CEO’s still received multimillion bonuses. For example, the Bank of America’s CEO
received a 9.05 million USD restricted stock bonus in 2010 and Goldman Sachs’ CEO received an even
bigger 12.6 million USD stock bonus in 2010. Both companies had received a bailout. At the same time,
salary levels were raised for these CEO’s because, with the upcoming legislation on bonuses, companies
fear they will lose top executives if their compensation drops2. Although these compensations were
within the boundaries of commitment and legislation, the bonuses led to negative publicity which
influenced company image and the call for new legislation. The US congress had voted positive on a new
legislation proposal in March 2009 that allowed for taxes on bonuses of bailout receiving companies
their CEO’s up to 90%3. However, this proposal wasn’t supported by the Senate.
The development of CEO compensation and the growth in payment gap between the CEO and lower
levels of management that occurred in the last couple of decades, seemed hard to relate to company
performance (Fahlenbrach, 2008; Frydman and Jenter, 2010; Perel, 2003). The composition of executive
compensation has changed over the decades and with matching the CEO income to firm value, the
equity related remuneration became the most substantial source of income for U.S. corporate
executives. For the years 2000‐2008, the CEO compensation graph of Frydman and Jenter (2010) shows
that the stocks and option components formed more than half of the CEO’s total payment4. And
although the total payments to CEO’s grew rapidly in the 1970‐2000 period, the post 2001 period
showed a decline in average pay for CEO’s in the U.S. (Frydman and Jenter, 2010). Perhaps this was due
to bookkeeping scandals such as Enron, which led to more strict legislation, and the bursting of the IT
bubble. The total compensation of CEO’s contains measurements on the components salary, bonus,
option grants, stock grants, long‐term incentive plans pay‐outs and other forms of compensation.
2 Washington Post Article, published 31‐01‐2011, by Hugh Son. 3 Telegraph Article, published 19‐03‐2009, by James Quinn 4 The graph on CEO compensation can be found in appendix 2
6 Introduction
When considering the impact of equity based compensation components on a CEO’s total pay, the
responsibilities of the Board of Directors towards company shareholders seem unambiguous.
Independency and sufficiency of the board members seem prerequisites to establish equilibrium in the
agency conflict that arises. In general, the Board of Directors can be classified in two kinds of board
systems. The U.S. for example use a one‐tier system and most Anglo‐Saxon countries use a two‐tier
system. In a one‐tier board, both executive as well as non‐executive directors form the board. In a two‐
tier system, the executive directors form the management board and the non‐executive directors form
the supervisory board. The agency theory and the role of the Board of Directors therein will further be
elaborated on in the next chapter.
Rose (2007), who investigated the Danish market (public listed companies have two‐tier system),
mentions that the Board of Directors “is by far the most important internal control device seeking to
control and monitor management in order to deter management from opportunistic behaviour”. Laux
and Laux (2009) use a theoretical model and focus on the two board functions, namely “designing the
CEO incentive pay scheme and overseeing the financial reporting process”. Both within the one‐tier and
two‐tier systems, the “ultimate decision authority for approving CEO compensation rests with the boards
of directors of public companies” (Perel, 2003).
The duties and responsibilities of the board combined with the possible conflicting interests of
shareholders and CEO has been the object of research in many researches. The independency of the
Board of Directors is investigated a lot (Cyert et al., 2002; Felo, 2001; Ghosh and Sirmans, 2005),
whereas another stream of research inquires about the assumed relation between performance related
compensation and company value objectives (Fahlenbrach, 2008; Frydman and Jenter, 2010; Perel,
2003). With regard to the latter, researchers have found little to no significant evidence that supports
the effective functioning of this incentive, that “should motivate managers to make sound business
decisions that increase shareholder value” (Frydman & Jenter, 2010).
So with the increased attention for CEO compensation schemes, the functioning of the Board of
Directors is consequently an interesting research topic. Did the directors grant the CEO excessive
compensation? Was the CEO monitored properly by the directors? Questions like these quickly arise
when news about abnormal CEO compensation is published, as the Board of Directors is responsible for
setting and evaluating the executive pay.
7 Introduction
1.2 Femalerepresentation
Another related issue that has gained more attention due to the excessive earnings of CEO’s during
these times of low economic activity, is the participation of woman in top management positions. To
address the ethical and political issues about a more equal distribution of men and women in executive
positions, Spain and Norway have implemented legislation that dictates a minimum number of female
board member representation for publicly traded companies. The Dutch, German and British
government also discussed such initiatives, however no such regulation is planned for in the United
States. Advocates of such regulation, like Euro‐commissionaire Reding, state that the crisis would have
been different if there were more Lehman Sisters than Lehman Brothers5. Reasoning that, due to
differences in risk assessment of women and men, the credit crunch would have been less severe. On
the other hand, critics of such regulation call the younger and generally less experienced6 female
successors ‘golden skirts’ to point out the discrimination effect of quota regulation. As implementing a
quota could interfere with market functioning, therefore bypassing the economic argument of best‐
selection criteria when choosing new candidates for executive functions. However, this being such a
recent phenomenon, little research is available to base a conclusive answer on the effects of such
regulation.
Besides the ethical argument of having female representation in the highest level of management,
the economic perspective is that diversity might affect performance and continuity (Erhardt et al, 2003).
As women perceive risks different than men (Harris and Jenkins, 2006), assess risks otherwise (Ertac and
Szentes, 2011) and evaluate success unlike men (Gill and Prowse, 2010), results are likely to differ when
women can influence decisions. Consequently, researchers investigated the relation of board diversity
and firm performance, finding positive results (Bell, 2005; Campbell and Minguez‐Vera, 2008; Erhardt et
al., 2003; Ghosh and Sirmans, 2005; Huse, 2009) as well as non‐significant results (Farrell and Hersch,
2003; Rose, 2007; Wang and Clift, 2009). The economic argument for diversity therefore is not
conclusive and additional research can further contribute to this issue.
5 De Pers.nl Article, published 21‐02‐2011, by Edward Deiters 6 Gayle et al. (2010) show that U.S. female executives “have two years less tenure in the firm and two and a half years less executive experience than males.”
8 Introduction
1.3 ResearchQuestions
Prior research has shown that females interpret information on risks, assess outcomes and evaluate
success differently than men. Meanwhile regulatory bodies are developing new legislation that
introduces a quota on the minimum number of female representativeness. Companies/industries
themselves are (due to social pressure?) developing programs that also should enhance female
representativeness. This makes it unclear whether legislation is needed or if the market function is
sufficient enough. And these opposing views fuel the discussion on the need for diversity.
This thesis will contribute by looking at the association of female board members and executive
compensation components, therefore focusing on the economical perspective of increased gender
diversity. Results may shed new light on the discussion of mandatory female board members and the
functioning of the board in its monitoring activities. The United States is the area of research in this
thesis7 because they haven’t introduced legislation dictating a quota, but rather have the market for
executives find optimal gender diversity for itself. Furthermore, the credit crunch period pointed out the
unclear relation between executive compensation and firm performance, leading to much discussion
about the payment setting process. To adapt to these recent developments, the time period for this
research is set on 2007‐2009.
Although many researchers such as Cyert et al. (2002), Fahlenbrach (2008), Ghosh and Sirmans
(2005) try to connect specific company and/or board characteristics to CEO compensation, none
combined the specific presence of female board members to CEO compensation, except for Bell (2005)
who found that U.S. female CEO’s and female board members positively influence female
compensation. However, Bell (2005) merely investigated the gender gap between male and female
executives and did not address the influence of female board members on executive compensation
components specifically. So to examine the association between the presence of female directors and
the amount of the U.S. listed companies’ CEO’s compensation during the past economic turbulent times,
the main research question of this thesis is as follows:
“Is the presence of female board members associated with the amount of CEO compensation
(components and in total) of the S&P1500 listed companies between 2007‐2009?”
7 By using the S&P1500 composite index to comprise the dataset, the market focus is set on the United States as Standard and Poor’s set criteria for index additions, such as the U.S. company criteria which is based on characteristics such as the location of company’s assets and revenues, corporate structure and SEC filings.
9 Introduction
Several sub questions have been formulated of which answering will gain sufficient insights to
address the main research question. At the end of each chapter, one or more sub questions are
answered in the summary paragraphs, giving this thesis a clear structure. The sub questions are as
follows:
1. What research approach is used in this thesis?
2. What differences between man and women could matter economically?
3. Does increased gender diversity lead to a change in performance?
4. What factors come into play when setting CEO compensation?
5. What hypotheses are tested to answer the main research question?
6. Which test model is used to test the hypotheses?
7. What data sample is used for the test model?
8. What are the results of the test?
9. Which hypotheses are validated?
10. How can these outcomes be interpreted?
11. What limitations restrict this research?
12. What recommendations can be made upon conclusion?
10 Introduction
1.4 Relevancy
Research on CEO compensation has become a hot item as the financial crisis has raised many
questions regarding the setting and monitoring of CEO pay. And the linkage between compensation and
firm performance seemed unclear and unexplainable towards stakeholders. As it is the task of the Board
of Directors to determine and evaluate executive compensation, the functioning of the board is
indissoluble to the discussion on CEO compensation. Combined with the current trend of an increased
demand for gender diversity, it becomes interesting to examine the effect females could have on board
functioning, thereby the CEO compensation setting process.
This thesis uses the U.S. market, which has the one‐tier system for board of directors, as the area of
research. The Dutch, along with many other Anglo‐Saxon countries, apply the two‐tier system. This
would imply that the outcomes of this thesis aren’t directly applicable in research for the Dutch market,
as decision processes in the Board of Directors are likely to differ between the one‐tier and two‐tier
systems. However, on May 31 of this year, the Dutch government accepted new legislation that allows
for Dutch listed companies to apply the one‐tier system per 1‐1‐20128. The outcomes of this thesis
might therefore be useful in future Dutch research.
Furthermore, by quantifying the relation between the number of female board members and the
height of CEO compensation components, the survey from Huse et al. (2009) could be empirically
supported as their results show that behavioural control tasks, such as setting the pay, ought to be
(positively) influenced by female board members. In addition, test results of this thesis could be
additional to those of Bell (2005), who investigated the gender pay gap and found that female directors
positively influence female CEO compensation. Results could furthermore add to the discussion on the
influence of individual board member characteristics as previous studies show varying results.
Results could be interesting for, among others, shareholders of companies that currently don’t have
female board representatives, company policy and ethical program makers, governmental policy
makers, employees that belong to a minority group and work for a company that has a non‐diversified
board, and stakeholders of a company that seeks to replace a board member to create or meet the
demands for diversity.
8 De Accountant, published 1‐06‐2011, by Eumedion
11 Introduction
Although this research can contribute in a positive way by adding to the growing literature on board
diversity and the possible consequences, the conclusiveness of the empirical results is limited as authors
like Frydman and Jenter (2010), Ghosh and Sirmans (2005), Huse (2009), Rose (2007) and Yermack
(2006) indicate that the pay‐setting process is influenced by many (social) factors that are seemingly
hard to quantify. These limitations will further be elaborated on in the final chapter.
1.5 Methodology
To address the main research question, prior literature on social studies, board member studies and
CEO compensation is taken into account. From this literature, variables are defined that are used for the
research design of this thesis. A multiple regression analysis is used to examine the effect dependent
variables and control variables have on the measured compensation components. By using a Multiple
Regression Model, the individual clarifying value of the variables can be measured, as well as the
combined value. With such a test the relation can be quantified, however the conclusiveness is limited
as only an association of the independent (and control) variables with the dependent variables can be
established, no causality can be presumed. The detailed description of the model is given in chapter 4.2
and the selection of the sample is given in the subsequent paragraph. As mentioned in the introduction,
the composition of a CEO’s compensation can be divided in several categories and investigated as such.
Rose (2005) states that “salary is a more discretionary component of executive compensation than
executive bonus which is often formulaic” and that it is therefore “reasonable to evaluate the gender pay
gap in specific components of pay”. With the data‐sources used for constructing the sample of this
thesis, a detailed distinction could be made between ‘Salary compensation’, ‘Bonus compensation’,
‘Current Compensation’, ‘Stock compensation’, ‘Options compensation’ and ‘Total compensation’. The
Current Compensation (Salary + Bonus) is taken into account as it quantifies the direct portion of
compensation, whereas the others elements are more indirect. The total set of detailed compensation
components gives the opportunity to examine the effect female board members have on specific
compensation components instead on just an aggregated level of compensation.
12 Introduction
1.6 StructureofThesis
In the oncoming chapter, a brief theoretical elaboration is given on what kind of research area this
thesis contributes. Thereafter, the main literature that has been used as a base for this thesis is
discussed in chapter 3. It consists of reviews regarding the social studies between men and women (in a
business environment) and the prior research on CEO compensation and board member effects. After
this, in chapter 4 the research design is explained and the hypotheses that will gain insight to answer the
main research are formulated. The Multiple Regression Model, as well as the collected data, is discussed
in that chapter as well. Chapter 5 contains the model outcomes of the tests used in SPSS and the
validation of the hypotheses. Finally, this leads to the conclusions based upon the outcomes and these
are, with the acknowledged limitations, given in the final chapter. From this point on, every subsequent
chapter will end with a brief summarization of what is discussed in that specific chapter and provide an
answer to the sub questions. Hopefully this systematic approach will contribute to the readability of this
thesis.
13 Research approach
2 Researchapproach
2.1 PositiveAccounting
The publication of Watts and Zimmerman’s paper in 1978 helped generating a new kind of
accounting research, the so‐called positive accounting theory (PAT). Watts and Zimmerman called for a
new approach to research the accounting principles as previous normative research merely generated
answers for what‐should‐be‐done questions. In contrast with this prescribing of theoretically optimal
accounting practices, the positive accounting approach seeks to describe, explain and predict certain
accounting phenomena. It uses empirical data research to analyse the choices managers make in
applying and acting on accounting principles. This is associated with the thought that a firm is
considered to be a ‘nexus of contracts’ and its existence is due to the intertwining of involved relations.
PAT focuses on the relations and how accounting is used in the functioning of these relationships
With the development of positive accounting theory, as proposed by Watts and Zimmerman as
being more scientific than normative research, criticism on this kind of research consequently arose.
Christenson (1983) for example discusses the PAT methodology and makes a three‐way distinction in
the positive/normative arrangement to point out the main argument of PAT methodology criticism. PAT
is considered to be too easy in recognizing phenomena, failing to distinct between meta‐problems and
meta‐theories. The difference being: do you want to investigate the problem(s) accounting entities face
or do you want to understand “why management made choices the way it did” (Christenson, 1983)?
Another argument is that PAT makes no positive statement of what is, but merely indicates a trend.
Watts and Zimmerman (1990) discuss the criticism of Christenson (1983) in their ‘Positive
Accounting Theory: A Ten Year Perspective’ paper. On the methodology part the authors state that “this
methodology has been successful in accounting and … a theory is not discarded merely because of some
inconsistent observations. The best theory is determined in a competition to meet the demand from
students and practitioners for theories that explain and predict accounting choice” (Watts and
Zimmerman, 1990). On the criticism of PAT being a sociology of accounting and thus not neutral in its
observation as preferences of studied objects and observers are influencing the research, Watts and
Zimmerman (1990) note that “an accounting theory that seeks to explain and predict accounting cannot
divorce accounting research from the study of people”. Watts and Zimmerman (1990) conclude by
14 Research approach
mentioning that the PAT approach therefore still remains legitimate. The research of this thesis
contributes to the field of PAT studies.
2.2 AgencyTheory
As Positive Accounting Theory focuses on the relations, and companies are considered to be a
network of relations in this context, an important part of understanding the relationships is defined in
the agency theory. Many relations involve the separation of ownership and management, where the
principal transfers decision authority to the agent. With such a transfer, efficiency can be lost,
consequently resulting in costs. These efficiency deficiencies arise from the assumption that every
person is driven by self‐interest (personal gain) which results in differences at risk perception and
opportunistic behaviour to increase personal wealth. The agency theory therefore addresses two
problems. “The first is the agency problem that arises when (a) the desires or goals of the principal and
agent conflict and (b) it is difficult or expensive for the principal to verify what the agent is actually
doing” (Eisenhardt, 1989). So initially there is the possibility of misaligned incentives and secondly there
is the hinder in verifying whether or not the agent has acted properly (in the best of interests of the
principal). This second problem is because of the information asymmetry that occurs when the agent
has (power over) information, which the principal has not.
To decrease the costs that arise from the two problems, agency theory predicts that mechanisms
will be put in place. For the first agency conflict that can arise, the principal can apply an accounting
based alignment mechanism. By tying the agent’s compensation to the company’s profit, this initial
misalignment can be solved. However, this generates a greater necessity for mechanisms to control the
second agency conflict that arises, which is about information control. Because if these accounting
based mechanisms are put in place, there will be a need for financial statements. Theory predicts that
managers will try to influence the preparing of these statements, with personal (material) gain as
motivating factor. Subsequently, a demand for monitoring and auditing of these statements is created
to ensure managers don’t overstate the profits. This creates the balancing act in which an equilibrium is
sought to align the interests of the principal with those of the agent, while auditing and monitoring costs
are ought to be acceptable compared to the risk they diminish.
15 Research approach
2.3 ChapterSummary
To answer the sub question 1: ‘What research approach is used in this thesis?’, this chapter
contains a brief theoretical elaboration on positive accounting research and the accompanying agency
theory. By examining the relation between female board members and the height of the various
compensation components, a conclusion is based upon measured events. The test gives empirical
support for the conclusion, which is a perceived one and thus not an absolute one. This thesis therefore
contributes to the field of positive accounting research.
The agency theory is important in this matter as the presumptions in this theory are used to explain
the behavioural patterns of the CEO’s and directors. It clarifies the importance of the Board of Directors
in the relation between the agent (CEO) and principal (shareholders). The usage of equity incentives in
the CEO’s compensation package is to align the interests of the agent and the principal and the
subsequent agency conflict that may arise, creates the need for good monitoring. Or as Cyert et al.
(2002) state:
“From the viewpoint of agency theory, various literatures emphasize the role of incentive
contracting… and the monitoring role of the Board of Directors”
The next chapter discusses the prior literature on diversity and CEO compensation. In some of the
paper reviews, terms from the agency theory are used to address the interaction between agent and
principal as described in this chapter.
16 Prior Literature
3 PriorLiterature
Previous chapter briefly elaborated on the positive accounting method and the agency theory that is
used for this thesis. Prior literature for this thesis’ research can be divided into two parts. Firstly, there is
literature on diversity. This consists of social studies, which examine the differences between men and
women (in a business environment) and studies that examine the effect diversity has on performance.
The literature discussed there will clarify why the gender differences could influence the decision
making processes, consequently the economic performance of a company. Secondly, there is the prior
literature on CEO compensation, which investigates the development and factors that contribute in that
matter.
3.1 PriorliteratureonDiversity
3.1.1 SocialStudies
To gain insight in what makes women differ from men, this paragraph contains literature that
investigates the different behaviour men and women show in a business environment. This kind of
research is relevant as it influences the way females and males make their business decisions.
Gill and Prowse (2010) take a closer look at the gender differences between men and women when
it comes to competitive environments and the choices man/woman make within. Specifically, the
behavioural differences men and women show when facing good or bad luck in a competitive
environment. The authors use an experimental design, running 6 sessions, using 120 participants and
match people randomly. People were asked to move sliders to match that of their randomly selected
partner who had the first turn (First Movers), winning price money (height randomly changed per round)
for succeeding as such. For analysis purposes the authors only considered the Second Movers (i.e. those
who had to match their partner’s set‐up) of the simulation as they face a pure optimization problem.
Because First Movers had knowledge of the previous success rate and start immediately, Second Movers
had time to process this before moving the slides. Furthermore, Second Movers ‘choose’ their
probability of winning as they see their matched partner’s move and assess his/her effort). This resulted
in a sample of 30 males and 28 females. The authors find that “women tend to reduce effort following a
loss compared to effort after winning a small prize, and the effect is independent of the monetary value
of the prize that the women failed to win. Men, on the other hand, reduce effort only after failing to win
17 Prior Literature
large prizes. We also find that women lower effort after winning a large prize compared to winning a
small prize, but we find no such effect for men”. The experience of a loss is therefore differently
processed by men and women. Men only dislike losing large prizes, women dislike any size loss. Women
also dislike winning large prices, and as a resulting conclusion: “women may have a stronger aversion to
competition than men do”.
This research shows that women behave differently than men when they’re faced with a certain
outcome of their actions. Women and men experience a win or loss and adjust differently when
assessing their next move. The conclusion of Gill and Prowse (2010) is that women don’t like to compete
the way men do. This distinction between the sexes may be of concern when considering the business
environment, as this is a competitive environment as well. So what considerations do people make then
before entering a competitive environment?
Ertac and Szentes (2011) conduct an experiment by “giving subjects information about the highest
performance in their group in a previous tournament, before they make their tournament entry choice”.
The authors mention prior research in which there was a big difference noticeable between the
percentage of males and females that choose the competitive scheme (in which reward is exponential
due to competitive score) over the piece‐rate incentive scheme (every action is rewarded on a fixed
base). And that this “tendency of women to shy away from competition has been offered as a potential
explanation for the observed differences in labour market outcomes, since top‐level positions usually
involve competitive career paths”. When no information is provided, the 74 male and 74 female
California UCLA students, show results resembling prior research. Men compete significantly more than
women do. However, when the simulation is run and information on other groups/peoples’
performance is given, the difference between competing men and women is non‐significant. Although
the performance in competition is higher than in the piece‐rate incentive setup, there is no significant
difference between the performance of men and women in these two setups. On conclusion, the
authors state that “findings suggest that more transparent performance feedback policies can be useful
in reducing the gender gap in self‐selection into tournaments and increase the efficiency of the
outcome”.
The research of Ertac and Szentes (2011) shows that women performed equally and when given
information about the competition, they participate in the same way as the men. This would imply that
women don’t avoid competitive environments more than men, but prefer more information when
assessing participation. However, these outcomes were from observatory researches and therefore
18 Prior Literature
don’t provide an answer as to why the persons acted the way they did, it only shows what they did. To
gain more insight in why women and men choose the way they do, the next paper is included.
Harris and Jenkins (2006) asked 657 participants (389 females. 268 males) to assess their likelihood
of conducting risky activities within 4 domains (gambling, health, recreation, and social). They were
furthermore asked to estimate the possible negative outcomes, the severity of those outcomes and the
enjoyment when despite the possible negative outcomes, success is achieved. As the authors discuss
prior literature, the theory would predict that “male participants are more likely to take risks than
female participants”. The results of the survey conclude that “relative to women, men reported a greater
overall likelihood of engaging in risky behaviours in the gambling, health, and recreational domains”.
This was mainly due to the greater female judgment on potential negative outcomes. The social domain
however showed a different image, as female were equally likely to take on risks like the men. Although
the females still ought the negative outcomes to more severe, there was no difference in the
male/female assessment of likeliness and satisfaction in the social area. A fifth domain was added in
which the participants were to assess activities with “high potential payoffs and fixed minor costs”. As it
turns out, the females were more likely to engage in this domain as they were more optimistic in their
judgments of good outcomes and the intensity of such a good outcome. And these results “clearly speak
against the suggestion that women engage in risky behaviours less often because they are pessimistic
and “feel unlucky” in some global sense”. Overall, subjects that assign higher probabilities to negative
outcomes, also think the outcomes are more severe. Although the risk taking difference is not
conclusive in all domains, it remains questionable why gender differences exist. The authors mention 2
evolution theories (generating offspring and protecting offspring) but mention that “these kinds of
evolutionary/functional accounts are notoriously difficult to test, and the point of the present discussion
is merely to suggest that any possible innate biological differences in risk perception are as likely to
reflect selection pressures related to child‐rearing as those related to mate‐seeking”. Another interesting
explanation is derived from prior literature which stated that familiarity with a certain risk was
associated with reduced risk perception.
Although the setup of Harris and Jenkins (2006) differs from the experimental setup of Gill and
Prowse (2010), both researches show that risk perception differs between the sexes. Albeit that with the
survey from Harris and Jenkins (2006) a more detailed distinction could be made in the kind of risks.
Interpretation of risks and the severity of the outcomes is the main difference in the risk approach of
men and women, though this doesn’t means that females/males consistently take on less/more risks.
19 Prior Literature
3.1.2 Theoreticalstudies
Previous paragraph showed that the difference between men and women in risk approach might
influence their business decisions. And the definition of diversity is having a range of different people or
things that differ from each other. Having both men and women in a group (like the Board of Directors),
thus creates diversity. This paragraph discusses two theoretical papers on the possibilities/risks of
diversity and how it can create/destroy value.
Adler (2002) wrote a theoretical article on companies’ expectations regarding the acquirement of
female managers in the context of global management. CEO’s are increasingly getting aware that in a
global economy, the rising of talent to the top should be without gender discrimination, because
opportunity costs are too high. Observation reveals that countries and companies increasingly appoint
females to leadership positions. Research however, is not conclusive on whether ‘females act te same as
males’ or ‘female managers differ from male managers’. Despite this contradictory, extending the pool
of possible candidates does create more competition, presumably therefore leading to better selection
of managers. How value can be added depends on the different approaches of companies. The
companies can do so by ‘identifying with men’s approaches to managing internationally’ or ‘denying
differences’ or ’identifying with women’s approaches to managing internationally’ or ‘creating synergy’.
With the identifying options, the belief is that one view is superior to the other and is therefore seen as
such by individuals and judged accordingly. With denying, there are assumed to be no differences
between man and women and this disables the possibilities that different needs can create. Only by
creating synergy, the differences are leveraged between the two sexes and “is most conducive to
sustained, long‐term global effectiveness”.
The theory of Adler (2002) indicates that the presence of females in management levels could
contribute to firm performance as diversity could deliver better candidates and variety could create
profitable possibilities. How differences are exploited, determines the value of having a diversified
group. However, considering the PAT definition of companies being a ‘nexus of contracts’, the value of
an executive is only as relevant as the relations would allow it to. To gain insight in this relations
effectiveness, a closer look to behavioural economics is taken.
Becker (1993) wrote an article that briefly recaps some of his previous works on behavioural
economics, one of which was the discrimination theory (published in 1957). He uses an economical
model, unlike Marxian analysts, that doesn’t assume the individuals to be solely motivated by
20 Prior Literature
selfishness or material gain. His “analysis assumes that individuals maximize welfare as they conceive it,
whether they be selfish, altruistic, loyal, spiteful, or masochistic. Their behaviour is forward‐looking, and
it is also assumed to be consistent over time”. When it comes to discrimination, the common
assumptions of employee productivity (the economic competition will let the employee who produces
the most efficient survive) and costumer product needs (customers will prefer the employee who gives
the best product result), don’t cover the issue. “Actual discrimination in the marketplace against a
minority group depends on the combined discrimination of employers, workers, consumers, schools, and
governments. The analysis shows that sometimes the environment greatly softens, while at other times
it magnifies, the impact of a given amount of prejudice”. Studies fail to quantify the actual size of
discrimination, as this can only be measured using indirect approaches, therefore having obvious
defects. In order to analyse social issues, the traditional theory of individual choice should be expanded
with more attitudes, preferences and calculations. Because behavioural issues are more than just an
individual choice and more people than the individual are concerned with it.
With the research of Becker (1993) on behavioural economics, it can be concluded that the
effectiveness of performance by diversity is diminished as discrimination occurs. The presence of
discrimination diminishes the value that could be realized under the synergy approach of Adler (2002) or
worse, it could destroy value. However, quantifying the effect of discrimination is hard to accomplish. In
turn, this would mean that adequate measures (such as legislation or company ethics programs) to
prevent/solve discrimination are hard to come up with. Based on the theoretical approach that diversity
creates possibilities, whilst having negative effects of discrimination that might occur in a diverse group
on the other hand, it can’t be said that diversity is a good or bad thing per se.
21 Prior Literature
3.1.3 Economicstudies
The first relevant question from a business perspective with regards to the men/women comparison
is whether the behavioural differences lead to a measurable difference in performance. Firstly, it is
interesting to assess whether women individually perform better/worse than men.
Du Rietz and Henrekson (1999) investigated the female entrepreneurial performance in comparison
to their male counterparts for a sample of 4200 Swedish entrepreneurs, 405 of which females. They find
prior literature on the gender differences in the performance of entrepreneurs which shows that
females perform less than the males. Using conventional economic measures of performance, this
underperformance was shown by research for the US and UK market. Du Rietz and Henrekson try to
empirically test the hypothesis of female underperformance with their Swedish sample. With their
sample of 4200 businesses and a high response rate, this size and reliability allows to make more
disaggregated comparisons in comparison to prior literature. The multivariate regression analysis shows
that, in line with previous studies, female underperformance is detected at the aggregated level, using
‘sales’, ‘profitability’, ‘employment’ and ‘orders’ as performance measures. However, “subsequent
analysis shows that this is largely due to the fact that female entrepreneurs tend to be active in small
firms, the service sector and in firms that disproportionately produce for private consumption purposes.
The gender effect tends to be of little importance in larger size classes and in trade and manufacturing”.
Only the sales variable shows female underperformance after correcting with the control variables. The
authors conclude with reasoning that when females underperform on sales, but not on profitability, the
hypothesis is not supported with their research. This would imply that the differences between female
and male performances are more related to firm and industry specific characteristics, rather than the
gender differences between the entrepreneurs in the sample.
Du Rietz and Henrekson (1999) showed that the distinction between men and women is not
sufficient to explain differences in performance and based on their results, it can’t be claimed that
women perform better/worse than men. This complies with the results of Ertac and Szentes (2011).
When analysing performance, specific characteristics such as firm size and industry should be taken into
account. Considering the theoretical papers of the previous paragraph, diversity could increase value or
it can destroy value if discrimination occurs. Accordingly, the following papers are incorporated as they
investigate the relation between diversity and firm performance.
22 Prior Literature
Weber and Zulehner (2009) test the discrimination theory of Becker, by analysing if the 29.935
Austrian new firms between 1978‐2006 show differences in their survival rates when correcting for their
prejudice on female workers. What they find is a “strong negative relationship between the share of
female workers and exit probabilities” with their regression analysis. This effect is mainly noticeable at
the lower end of the distribution, for the median and higher end of the sample distribution, there is no
significant difference in survival. Companies that initially have a low share of females, but manage to
survive, eventually increase their female workforce. Importance of finding equilibrium is evident as the
control functions of the model turn out insignificant, meaning that “unobserved heterogeneity doesn't
play a major role when it comes to the relationship between the share of female workers and survival
prospects of the firm. Even a gender‐neutral firm hiring a large number of male workers, because there is
a lack of supply from females, faces a higher exit probability.” The authors can’t conclude on whether
the competition element makes anti‐discrimination legislation obsolete, as the reaching of equilibrium
might still require policy effort.
So on an aggregate level of performance, the outcomes of Weber and Zulehner (2009) show that
the presence of women within a company increases the survival rate. Companies apparently are better
survivors when a good diversity mix is established. But do these companies also outperform other
companies which don’t have a well‐balanced mixture of the sexes? Considering the research of this
thesis, the diversity focus is on the diversity within the boardroom and not for the total company.
Erhardt et al. (2003) conduct a study that examines “the relationship between demographic diversity
on boards of directors with firm financial performance”. They use 127 U.S. companies in 1993 and 1998,
using that time interval to consider a change in ROI and ROA. The measure of demographic diversity is
calculated by considering the amount of females and ethnic minorities in comparison to the white male
board members. Based on the existent literature, “diversity tends to generate higher creativity,
innovation and quality decision‐making at individual and group levels”. This presumably might also be
the case at “the executive board of director level, where these characteristics are most critical”. In
theory, the diversity of the board can be associated with an improvement in the oversight function. By
creating more diversity in the group dynamics, more opinions are added to the decision process, which
in turn could have a positive impact on the controlling function of the board, thereby improving the
agency issues. Their test results show, in line with prior literature, that board diversity is positively
associated with firm performance, based on the used financial indicators. With the correlation and
23 Prior Literature
regression analysis they can’t determine causality, so whether diversity leads to better performance or
better performance leads to the possibility of (allowing for?) more diversity, remains questionable.
Although Erhardt et al. (2003) show that board diversity correlates with firm performance figures,
they use female as well as ethnic diversity measures. The following paper used a similar approach.
Wang and Clift (2009) take 243 Australian listed companies and check their performance figures for
the time period 2000‐2006, using a regression test to check whether racial or sexual board diversity
associates with financial performance figures. Theoretically, diversity may lead to better performances.
“First, diversity may promote a better understanding of the market”. As the markets are diverse, a better
diversified board could better interpret market needs and therefore contribute to a better performance.
“Second, diversity may increase creativity and innovation”. As more opinions and views are shared,
creativity may increase which in turn could result in better performance. “Third, diversity may produce
more effective problem solving” due to the heterogeneity in the perspectives. “Fourth, diversity could
enhance the effectiveness of corporate leadership” as diversity could increase the understanding of the
environment. “Finally, diversity may promote more effective global relationships” as cultural diversity in
an international business sense increases the sensitivity for other cultures. With minority and female
diversity as dependent variables, the performance figures of the companies is measured by Return on
Assets (ROA), Return on Equity (ROE) and shareholder return. Based on the results of the test, the
authors state that “there is no strong relationship between gender and racial diversity on the board and
financial performance. An apparent explanation for the findings is that there are simply very few female
and minority directors”. Unconventional board members might therefore not influence the board as
they are adapting conventional behaviour to gain the position. They authors also state that the relation
between diversity and performance is not negative, so diversity can be created without destroying
shareholder wealth.
Both Erhardt et al (2003) and Wang and Clift (2009) investigate the relation between diversity and
indicators of firm performance. Erhardt et al (2003) find a stronger indication of that relation than Wang
and Clift (2009) however, they both use ethnic and gender. The following papers addressed the diversity
by isolating gender as measure for diversity.
Campbell and Minguez‐Vera wrote two subsequent papers (2008 & 2010) on the relation between
board gender diversity and company performance figures. For both papers, they examined the Spanish
market between 1995‐2000 and used 68 companies and 408 observations in the 2008 paper. Using a
24 Prior Literature
panel data analysis, the regression shows a positive and significant relation between female
representation, as a percentage of the board and by the Blau and Shannon indices, and the
approximation of Tobin’s Q (as a measure for firm value). However, the presence of females itself
doesn’t affect firm value. In return, firm value doesn’t impact the percentage of women on board, nor
does firm size, but the size of the board does. “This implies that the most important focus for Spanish
companies should be the balance between women and men rather than simply the presence of women”.
A greater diversity could be accomplished without destroying value. In contrary, increased gender
diversity could well create shareholder value.
In their subsequent paper of 2010, the authors used the same timeframe and assessed the stock
fluctuations when a new director (female) was appointed. They found 47 female board appointments
and used an event study to analyse stock changes and a regression model to assess the long term
effects. What they found was a positive market reaction to female appointments, expressed in higher
stock values. This implies that investors do consider adding women to the board as a value adding
feature for the company. Furthermore, correlation tests show that the appointments on the long run
positively associate with improved firm performance. The panel data analysis to estimate the female
influence on the board shows an, expected, negative coefficient for the CEO/chairman duality. “As the
CEO is monitored by the board of directors it is in the CEO’s interest to present information to the board
that makes the firm’s results look good. This conflict of interest is likely to result in a dilution of the
monitoring role of the board of directors”. On conclusion, the results do suggest that gender diversity
can be achieved without destroying shareholder value and that it can increase firm value on short term,
but also by future increases.
The two papers of Campbell and Minguez‐Vera show that diversity relates to company performance
figures and that the markets reward female appointment with higher stock prices as a result. In the
interests of the shareholders, this implies that gender diversity is paying off. A similar research like that
of Campbell and Minguez‐Vera (2008) has been conducted for another market.
Rose (2007) used 443 observations of Danish firms in 1998‐2001 to find out if there was a relation
between the board diversity (presence of women) and the firm performance figure. This could help
clarify the issue whether increasing board diversity could actually contribute in creating value or
whether it is mainly an act to comply with social demands. Theoretically, a higher degree of diversity
could contribute in several ways. Firstly, it gives a positive signal to outsiders when it comes to job
25 Prior Literature
applications. This could increase the talent pool, so better candidates for jobs can be found. Secondly, it
could increase internal competition as minorities working for the company can see that they are not
excluded from the higher positions. Thirdly, it gives an overall better signal to stakeholders and external
parties. However, a downside could be that decision processes may take longer, which “may hamper
effective problem solving”. As prior literature finds that well diversified boards are matched to superior
performance, and more women on board lead to less stock price volatility, board diversity also “results
in a higher performance‐dependent remuneration for management”. The regression analysis of Rose
however, couldn’t find a significant outcome of board diversity on Tobin’s Q (as a measure for firm
performance), “hence the results suggest that gender has no impact on firm performance in Danish
firms”.
Papers discussed in this sub paragraph so far have shown that females perform equally as men (Du
Rietz and Henrekson, 1999) and that diversity can lead to better firm performance. This corresponds
with the assumptions of Adler (2002). Like Campbell and Minguez‐Vera (2008), Rose (2007) also finds a
(albeit non‐significant) positive relation between the presence of women on board and the firm value.
Erhardt et al (2003) mention the possible improvement of the boards oversight function if the Board of
Directors is more diverse, but Campbell and Minguez‐Vera (2008) also mention chairmanship of the CEO
as a counter effective variable of board effectiveness. The following research investigates further on
what specific tasks of the Board of Directors are affected by diversity.
Huse et al. (2009) used Norwegian survey data, containing answers of 840 respondents derived in
the year 2006, to examine the effect of different board members on the effectiveness of the board. They
take ‘Corporate Social Responsibility’, ‘Strategic Control’, ‘Budget Control’ and ‘Behavioural Control’ as
the four areas in which the board has responsibilities. The respondents could fill in a Likert scale, to
assign their perception with the relative importance for each area. Three items were used to scale the
behavioural control area namely, evaluation of CEO behaviour, evaluation of CEO compensation and
evaluation of compensation systems for top management. The test results showed that employee‐
elected board members positively influenced CSR and strategic control areas, but the variables on
female board members turned out insignificant in all areas! “There was, however, a positive relationship
between women ratio and board behaviour control tasks”. This suggests that the effect of female
representativeness is marginally measurable and doesn’t support the hypothesis conclusively that
diversity increases board control tasks.
26 Prior Literature
At this point it is questionable whether increased diversity leads to better performance as results
are contradictory in its conclusiveness. Furthermore, the gender diversity argument also is not sustained
consistently in the prior research. What are the motives then to incorporate diversity from a business
perspective?
Farrell and Hersch (2005) executed an event study that analysed the announcements of new female
directors for 266 Fortune & Service 500 listed companies between 1990‐1999. They find that board
selection is not gender neutral and that the “the greater number of women directors is not solely a result
of an increased supply of qualified female candidates”. The increased number of female directors over
the years could be attributed to the internal drive for diversity, but it is also a response to outside
pressure. When looking at the relation between firm performance and the presence of female board
representation, the authors state that “despite finding a positive relation between return on assets and
the likelihood of adding a woman to the board, event study results fail to detect any significant market
reaction to female additions”. So although female board members tend to work on boards of better
performing companies, the conclusion that gender diverse board lead to better performance, can’t be
drawn. The likelihood of adding a women to the board is better explained when looking at the number
of females already on board, as this significantly decreases the chance of a female being added.
The inconclusiveness on the gender diversity argument is captured by Farrell and Hersch (2005),
whose event study shows that there is no market reaction on adding a woman on the board, contrasting
with the findings of Campbell and Minguez‐Vera (2010). Farrell and Hersch (2005) furthermore conclude
that women seem to work in better performing companies (in line with the findings of Erhardt et al.,
2003) but the selecting and adding of females to the Board of Directors seems a non‐transparent
process. The following paper is therefore added as it reviews literature on individual board member
value.
Yermack (2006) wrote a literature review on the value of individual board members and used some
descriptive graphs from the discussed literature to highlight some of the findings. Prior research shows
that investors are aware of the fact that an individual board member can add/delete value of a
company. And when new information about the directors hit the market, the investors revalue the
shares. A connection between director qualification and share value seems plausible, as appointing
strong active expertise board members generally lead to a reward by the investors. Firm value can be
(significantly) influenced if a new board member is appointed with CEO influence, the number of boards
27 Prior Literature
an (exiting) executive is active in, his/her accounting financial qualifications, or that he/she is already a
CEO. Recent trends show that new directors are more independent, have better accounting financial
qualifications and more of them are female. The author questions whether regulation (proposals) are
therefore necessary as prior literature already shows that “stock market participants have for years been
quit savvy about the value of individual board members”. Suggesting that “a well‐functioning market for
directors might already exist”.
In contradiction with the findings of Farrell and Hersch (2005), Yermack (2006) reasons that the
market function in selecting best‐candidates for board positions, is possibly sufficient enough. This
would imply that the governmental legislation on adapting quota can be considered as too premature.
Perhaps equilibrium can be found by the market itself in selecting the proper persons for board
positions.
Questioning whether gender differences (diversity) of the Board of Directors matter economically,
and if mandatory diversity could therefore be a good thing, is addressed in the following paper. Trail of
thought used by the authors of the following paper is similar to that of this master thesis’ research. It
furthermore uses the same market to investigate, so the following paper had to be included in this
literature review.
Adams and Ferreira (2009) assess the effect gender diversity in the Board of Directors has on
governance and company performance. They examine 1.939 U.S. listed companies and their 86.714
directors for the time period 1996‐2003. They find that female board members have less attendance
problems then the men. Furthermore, the bigger the percentage of women on board, the better the
attendance of the men becomes. Female directors are also more likely to conduct monitoring activities.
The authors also state that the governance is influenced with gender diversity as “more diverse boards
are more likely to hold CEOs accountable for poor stock price performance”. When it comes to the
relation between gender diversity of the board and firm performance (measured by Tobin’s Q and ROA),
their “results suggest that, on average, firms perform worse the greater is the gender diversity of the
board”. Consequently, value would only increase when the gender diversity creates better monitoring
which enhances the firm value. As a measure for board‐level governance, the authors look at the CEO
turnover and find that “the fraction of women on boards appears to be an important determinant of the
turnover‐ performance sensitivity”. Members of diversified boards, also receive more equity‐related
compensation, “which is suggestive of a board that is more aligned with the interests of share‐ holders”.
28 Prior Literature
The paper of Adams and Ferreira (2009) shows that the gender differences can create an increase in
the board related performance inputs, such as board member attendance. They furthermore provide
empirical evidence on the suggestion delivered by the research of Huse et al. (2009), namely that
females improve the monitoring related tasks of the board, thereby creating value. Albeit that this
assumed effect has limitations, since increased diversity shows a negative relation with firm
performance indicators. This research furthermore shows that CEO’s receive more equity related
compensation, however the distinction in compensation is made on an aggregate level and shows no
further details on bonuses, stocks or options components. The authors interpret the increase in equity
related compensation for the CEO, as well as for the directors themselves, as an outcome of the
increased monitoring quality.
The papers discussed in this paragraph systematically work down from the gender differences to the
possible effects these can have on firm performance figures, board tasks and the subsequent selection
of board candidates. In the next paragraph, literature on CEO compensation will be discussed and
combined with the literature in this paragraph, it forms the theoretical frame of this thesis’ object of
study.
29 Prior Literature
3.2 PriorliteratureonCEOcompensation
This paragraph elaborates on some prior literature that discusses the CEO compensation, the factors
that influence the payment setting process and the relation with the Board of Directors characteristics.
As explained in chapter 2, the CEO compensation is a tool used in the agency theory to prevent conflicts
of interests, but it also creates the need for monitoring. The first paper elaborates on the functioning of
and having a compensation contract and how this can be perceived.
Perel (2003) wrote the theoretical paper “An Ethical Perspective on CEO compensation” in which he
discusses the two competing claims of CEOs being overpaid versus the CEO’s being worth the
compensation they get. In theory, the tying of executive compensation to company performance seems
reasonable, but it creates controversy in reality as “evidence suggests that good CEO’s can be overpaid”.
Prior research can’t find a positive relation between CEO compensation and company performance. The
Board of Directors has a determining role in the compensation setting, however “many corporate boards
function as entrenched and passive clubs, closely allied with the CEO, and not prone to exercising strong
challenges”. This underlines the agency conflict that arises as the CEO is able to influence his/her own
compensation. Stock options as a compensation component could add an element of risk, as the CEO’s
compensation could be hard hit and “on average, 60‐70% of a CEO’s compensation comprises stock
options”. The shareholders are in fact the employer of the CEO, but in reality they “rarely have much say
in, or exercise much control over, large salaries and stock option plans for CEO’s and other executives”.
The existent conflicts of interests show that it’s complicated to apply a good working pay‐for‐
performance principle. In defence of the claim on fair payment, general market theory supports the it‐is‐
worth‐whatever‐someone‐deems‐appropriate‐to‐pay‐for‐it principle, so this could also apply to CEO
compensation. As reforms are being made by regulatory bodies, the author stresses the importance of
the Board of Directors responsibility. As executive compensation should be examined “in relation to
some metric, value, or standard, rather than being an arbitrary decision made by often ill‐informed
board members”.
In his paper, Perel (2003) mentions the pay‐for‐performance principle as a cause and measure in the
agency conflict between the CEO and the shareholders. As the equity related compensation components
are substantial in the executive’s total pay, the need for proper monitoring becomes clear as the
shareholders face difficulties controlling the payment setting process. The following paper analyses the
role of CEO compensation in relation to the aligning of interests.
30 Prior Literature
Fahlenbrach (2008) investigates 11.029 CEO years of U.S. publicly traded companies in the time‐
period 1993‐2004 and the role of CEO compensation in corporate governance. He uses a regression
analysis on the pay‐for‐performance related compensation components as well as on the total
compensation in relation to the quality of the corporate governance mechanisms. In this case, the term
‘corporate governance mechanism’ is used to refer to a measure that helps aligning the shareholder
interests with that of the CEO. The author formulates three hypotheses on the association of
governance mechanisms and CEO compensation, which are as follows:
1. Complementarity hypothesis: strong governance is needed to provide the CEO with pay‐for‐
performance related compensation as prior literature shows that “increased monitoring.. is
associated with a higher fraction of a CEO’s salary that is paid in equity”.
2. Entrenchment hypothesis: the payment setting scheme is not a tool in the agency relation,
but a problem within this relation itself. Because, “if the governance mechanisms of a firm
are ineffective, a CEO may be able to influence the compensation contract to his or her
advantage”.
3. Substitution hypothesis: weak governance leads to a higher pay‐for‐performance sensitivity,
as this would help align interests of the shareholders with that of the CEO. The quality of the
board is measured using data on board size, non‐employee members, and chair duality. A
noticeable fact on chair duality is given as the author states that “CEOs who are also board
chairs receive approximately $325,000 higher total compensation”.
With these hypotheses, the author tries to clarify whether the strength of the governance associates
with pay‐for‐performance related compensation. With the first hypothesis, strong governance is
expected to associate with a high pay‐for‐performance sensitivity as the governance measures such as
monitoring are needed to provide performance related compensation incentives. With the second
hypothesis, weak governance is associated with low pay‐for‐performance sensitivity (yet with high
compensation levels on other compensation components) as managers would exploit the weak
governance to acquire high compensation which is unaffected by company performance. With the third
hypothesis, weak governance is expected to associate with high pay‐for‐performance sensitivity as
compensation schemes would be used to align the interests of the CEO with that of the shareholders
when governance is too weak to assure such alignment.
31 Prior Literature
The complementarity hypothesis doesn’t sustain as the author finds “that firms with governance
mechanisms that tend to give more power to management, such as CEO/chair duality, more employee
directors, and little monitoring by large shareholders, tend to have greater CEO pay‐for‐performance
sensitivity”. His empirical results partly support the entrenchment hypothesis, but when controlling for
governance strength and the shareholder‐rights, the results appear inconsistent with the entrenchment
hypothesis. The substitution hypothesis finds more support in his results as they are “consistent with
pay‐for‐performance sensitivity being jointly determined with most governance mechanisms to mitigate
the agency problems between shareholders and CEOs”. Ultimately, the pay‐for‐performance sensitivity is
merely a tool used to prevent agency problems, in the same way other governance mechanisms
contribute to this matter. As “entrenched managers do not seem to considerably influence their pay‐for‐
performance sensitivity and total pay”, the CEO pay‐for‐performance sensitivity is there “to maintain an
overall alignment of incentives between managers and shareholders”.
According to Fahlenbrach (2008) the payment setting and the equity related remuneration that is
part of the total pay, is empirically sustained to be a tool in aligning the interests. The effectiveness of a
governance tool is related to the quality of the board. Like Campbell and Minguez‐Vera (2010),
Fahlenbrach (2008) also mentions the CEO/Chair duality and furthermore the size of the board and its
independency as factors that determine the board quality. The following paper also investigates the
chairman duality and other variables/characteristics that influence the height of the executive
compensation.
Cyert et al. (2002) examine the top management compensation and the role of a self‐interested
Board of Directors. They use 1.648 US listed companies in the years 1992‐1993 as their sample for the
empirical tests. Their results show that external takeover threats play a role in executive compensation,
which could help explain the increase in compensation levels following the passage of antitakeover
legislation. Their test also shows that director ownership dominates board size when it comes to
compensation influence significance and consistently with previous studies: the firm size is the greatest
explanatory variable for all forms of executive compensation. And what was not previously documented
in the literature: “firm risk is strongly positively related to both the incentive and non‐incentive
compensation components”. Furthermore they notice that the variable ‘CEO ownership’ positively
correlates with base salary in small firms. The aforementioned presence of external takeover threats
also works as a substitute for managerial control, “especially in constraining management’s profligacy in
awarding equity‐based compensation to itself”. The three factors that negatively relate to contingent
32 Prior Literature
CEO compensation are largest shareholder ownership, size of compensation committee, and default
risk, although none significant for base salary and CEO shareholder ship outweighs board size. Factors
that positively relate to CEO (equity) compensation are firm size, chairmanship, and the firm’s growth
opportunities. Chairmanship impacts the equity component dramatically as “a CEO chairman receives
about 36% greater equity compensation than a non‐chairman CEO”.
In line with previous literature, Cyert et al. (2002) also find that the chairman duality has a
significant impact on the (equity related) compensation. Other factors such as board size, firm size and
director ownership also influence the height of the compensation components. The following paper
analyses the effect specific board characteristics have on CEO compensation.
Ghosh and Sirmans (2005) analyse the effect of board composition on CEO compensation of Real
Estate Investment Trusts (REIT) in the years 1998‐2000. They use 330 firms in their sample for the
correlation analysis. The board characteristics show to have a significant result on CEO compensation as
this is higher when the board is weak in monitoring (due to large size) and when directors are older. The
analysis furthermore shows that the structure of the board is not free of CEO influence, which would
cause severe agency problems when the CEO is allowed to “design boards that reward him at the cost of
shareholder wealth”. Pay‐for‐performance contracts could function optimally when board structures are
dedicated to their monitoring responsibilities, but when the board structure is compromised (therefore
allowing CEO entrenchment), the compensation contract allows for excess of the equilibrium rate.
“Consequently, models of CEO compensation that focus only on traditional economic determinants are
misspecified, and the results biased”.
Like the entrenchment hypothesis as used by Fahlenbrach (2008), Ghosh and Sirmans (2005) also
stress the possibilities of entrenchment when the control mechanisms are weak. If the CEO can
influence the design of the Board’s structure, the agency theory predicts the CEO will aim at obtaining a
higher level of compensation. The pay‐for‐performance principle could function properly and help in the
aligning of the interests if the boards are well structured and provide proper monitoring.
The following paragraph summarizes all the literature discussed in the paragraphs 3.1 on diversity
and the literature on CEO compensation in this paragraph by answering the corresponding sub
questions there.
33 Prior Literature
3.3 ChapterSummary
This chapter discussed various papers on the social/psychological differences between men and
women, the possibilities of diversity, the results from prior literature on diversity, board characteristics
and CEO compensation. To answer sub question 2: ‘What differences between man and women could
matter economically?’, the social studies provide the answer. Differences between women and men
that could matter in a business environment are as follows:
They experience loss/win differently (Gill and Prowse, 2010)
They join competition on a different informed base (Ertac and Szentes, 2011)
They assess risks and severity of outcomes differently (Harris and Jenkins, 2006)
Consequently, the follow‐up question is what the differences between the sexes could mean in an
economical context. Du Rietz and Henrekson (1999) show that there is no difference in individual
business performance between men and woman. So, although men and women show differences like
aforementioned, they achieve similar results in performance figures. Why would creating diversity then,
be something to be considered? To address the diversity issue, a theoretical approach on the matter is
taken. The theoretical possibilities differences can generate when group dynamics become
heterogeneous, are as follows:
Increased company value due to synergy of diversity (Adler, 2002)
Decreased company value due to discrimination (Becker, 1993)
Theoretically, the diversity argument is two‐sided as it could help companies create value, or it could
diminish value. This leads to sub question 3: ‘Does increased gender diversity leads to a change in
performance?’. The economic (empirical) studies on diversity could answer this question and actual test
results on diversity and company performance show the following:
Greater survival rate companies that employ women (Weber and Zulehner, 2009)
Better company performance indicators with high diversity rate (Erhardt et al., 2003)
Non measurable effect of diversity on performance (Wang and Clift, 2009)
34 Prior Literature
Short and long term value increase with gender diversity (Campbell and Minguez‐Vera, 2008
& 2010)
No significant relation between females and firm performance (Rose, 2007)
No significant increase in board tasks due to female presence (Huse et al., 2009)
Looking at the outcomes of the different researchers, the question of whether diversity leads to a
performance alteration in a firm’s performance can’t be answered on a conclusive base as results vary
from positively significant to non‐significant. Zooming in on the board specific tasks, the behavioural
control tasks are slightly positively influenced according to Huse et al. (2009), but no task is improved
significantly. This raises the question how diversity in the boardroom is accomplished and how board
member value is perceived. About achieving gender diversity in the Board of Directors the following
researches showed:
Board selection is not gender neutral (Farrell and Hersch, 2005)
Market functioning might be adequate in selecting best candidates (Yermack, 2006)
The functioning of the Board has a lot to do with the social environment that is current within the
executive levels of management. Selecting and acquiring new board candidates are likely to be under
the influence of social ties. However, it remains questionable whether selection procedures should be
something that legislation has to structure by providing quota for example. With the possible social
environmental influences on the decision making processes, it can be concluded that it is hard to
completely isolate the gender diversity effect. Most likely the influence of the social environment is not
quantifiable and thus forms a limitation on empirical research like this thesis.
A paper that has similarly followed the trail of thought as pointed out by the selection of papers in
the previous shown order is that of Adams and Ferreira (2009). They investigate the effects of increased
gender diversity within the board on several board and governance aspects, one of which the executive
compensation setting. This paper is therefore very relevant for this master thesis’ research as Adams
and Ferreira (2009) also use the U.S. market, albeit with a different time‐period and they analyse
executive compensation on a less detailed scale. Summarized, they report the following findings
regarding the influence of increased gender diversity in the Board of Directors:
35 Prior Literature
Attendance of the board members increases
Females are more likely to conduct monitoring activities
CEO compensation becomes more equity related (due to increased monitoring)
Directors themselves also earn more equity related compensation
On average, board gender diversity negatively associates with firm performance
It is therefore questionable whether mandatory diversity creates value
The second part of this chapter elaborated on prior literature about CEO compensation to address
sub question 4: ‘What factors come into play when setting CEO compensation?’. The first paper of
Perel (2003) underlines the importance of the Board of Directors and its role in the agency‐principal
relation. As market functioning could find a proper level of CEO compensation, Perel (2003) mentions
that this is unlikely to be the case as the Board of Directors usually has ties with the CEO. This means
that the shareholders are facing a disadvantage. An important factor that influences the CEO
compensation setting scheme is therefore:
Social ties of board members with the CEO (Perel, 2003)
Furthermore, the composition of the total compensation can be different for each CEO. Depending
on the strength of the governance mechanisms , the pay‐for‐performance sensitivity is likely to be
higher when less/weak mechanisms are in place according to Fahlenbrach’s (2008) entrenchment
hypothesis. The monitoring capabilities of the Board of Directors are a mechanism that should align the
interests of the shareholders with those of the CEO. Maintaining a high pay‐for‐performance sensitivity
(by compensating the CEO with equity related components) can therefore be considered as another
aligning mechanism under the entrenchment hypothesis. Consequently:
Weak governance mechanisms lead to higher pay‐out in equity related compensation
(Fahlenbrach, 2008). With regards to the quality of the board as a governance mechanism:
Board size and chairmanship of the CEO influence board quality (Fahlenbrach, 2008)
The results of Fahlenbrach (2008) are partly supporting his entrenchment hypothesis, which states
that weak monitoring leads to higher equity pay‐outs. This is somewhat contradicting with the results
36 Prior Literature
from Adams and Ferreira (2009), whose results better comply with Fahlenbrach’s (2008) complementary
hypothesis in which strong monitoring relates with higher equity pay‐outs.
Taking the literature on diversity and board members previously mentioned into account, it
becomes clear that most board characteristics can influence the quality of the board, consequently the
performance of the board. Setting and monitoring the payment process of the CEO is an important task
of the board and is thus likely to be influenced by changes in board quality. The following factors like
board characteristics and CEO characteristics, that influence the height and composition of CEO
compensation, are derived from the prior literature and they are as follows:
Gender diversity of the board (Adams and Ferreira, 2009; Bell, 2005)
Chairmanship CEO (Adams and Ferreira, 2009; Bell, 2005; Cyert et al, 2002; Fahlenbrach,
2008)
Firm size (Cyert et al, 2002)
Director ownership (Adams and Ferreira, 2009; Cyert et al, 2002)
Takeover risks (Cyert et al, 2002)
Directors age (Adams and Ferreira, 2009; Ghosh and Sirmans, 2005)
Board size (Adams and Ferreira, 2009; Fahlenbrach, 2008; Ghosh and Sirmans, 2005)
Occupancy directors (Adams and Ferreira, 2009; Ghosh and Sirmans, 2005)
Blockholders (Cyert et al. 2002; Ghosh and Sirmans, 2005)
CEO gender (Adams and Ferreira, 2009; Bell, 2005)
CEO age (Bell, 2005)
The factors influencing CEO compensation, along with the characteristics of the Board (thereby
influencing the board quality and effectiveness) are taken into account in the next chapter. The
hypotheses used to answer the main research question are formulated there accordingly using the prior
literature.
37 Research Design
4 ResearchDesign
In this chapter the hypotheses are formulated, using the discussed literature in the previous
chapter. The Multiple Regression Model is constructed in paragraph 4.2 and descriptive statistics on the
sample are given in 4.3. The tests that will be used in order to validate the hypotheses, are elaborated
on thereafter.
4.1 Hypotheses
The main research question is whether CEO compensation is influenced by the presence of female
board members. With the usage of a bonus or pay‐for‐performance components within CEO
compensation packages, good control mechanisms are required and board composition (size and
diversity) can influence the quality of aforementioned (Campbell and Minguez‐Vera, 2008; Erhardt et al.,
2003; Fahlenbrach, 2009). As the survey of Huse et al. (2009) indicates, females are likely to affect the
behavioural control tasks of the board in a positive way, which fits the assumption that females are
superior in tasks with a social and human aspect. And Adams and Ferreira (2009) confirm this by
showing that female directors are more likely to conduct monitoring activities. The social study of Gill
and Prowse (2010) furthermore showed that women are less affected by being awarded (high) rewards
so this might also be reflected in how they assign rewards. Ertac and Szentes (2011) show that women
take on the same risks as men, when they’re given more information. This could suggest that female
board members seek to find more information, or study the available information in more depth, before
entering a discussion within the board and/or voting on board related decisions. This in turn could
benefit the quality of the board. By improving the (monitoring) qualities of the board, the equity related
compensation of the CEO is expected to diminish (Fahlenbrach, 2008).
The first hypothesis therefore addresses the association between female directorship and the CEO
compensation. As mentioned in paragraph 3.1.2, effects of diversity are hard to quantify as performance
could benefit from the created synergy (Adler, 2002) or it could diminish if discrimination occurs
(Becker, 1993). The effect a minority in a group can have on the output of the group as a total is
therefore unlikely to show linear results and is expected to become more evident when acceptance of
the minority increases. So in order to address the respective association between female board member

38 Research Design
representativeness and a specific output of CEO compensation, the absolute as well as the relative
number of female board members is taken into account as this provides better insight in the
aforementioned effects of diversity. The monitoring quality of the Board of Directors is expected to
improve due to female representativeness in the Board of Directors and the equity related
compensation is expected to lower when the female representativeness increases. The first hypothesis
is therefore further divided to address the total as well as the equity related compensation of the CEO
and the association with the absolute as well as the relative female board member representativeness,
resulting in the following hypotheses:
H1a: The number of female board members is negatively associated with the total amount of CEO
compensation
H1b: The number of female board members is negatively associated with the equity related
amount of CEO compensation
H1c: The percentage of female board members is negatively associated with the total amount of
CEO compensation
H1d: The percentage of female board members is negatively associated with the equity related
amount of CEO compensation
Hypothesis 1 uses the absolute as well as the relative number of female directors, because with the
possible existence of discrimination in the board member selection process, there is also the chance that
female board members are acquired because of tokenism9 (Farrell and Hersch, 2005; Wang and Clift,
2009). This would imply that the presence of female directors is highly associated with the total number
of board members, because having more female directors would then only be allowed for in relatively
large boards. However, besides the variation in Directors, the board size in itself is a factor that could
influence the efficiency of the decision making process. Fahlenbrach (2008) mentions that opportunistic
9 Tokenism is the acquiring of a required feature, without accepting or enabling its possible added value. Farrell and Hersch (2005) mention the diminished chance of adding a female to the board, when there is already one on board. This could imply that females are acquired because of external pressure and not solely for the internal drive to increase diversity.
39 Research Design
behaviour of the CEO could result more easily in capturing the board when they are large. Reasoning
that within large boards, the directors feel less personally responsible and decisions are taken less
effectively as more views have to be considered. When a CEO ‘captures the board’ the independence
prerequisite is compromised, so the relation between board size and CEO compensation is likely to be
positive. This is also supported by Cyert et al. (2002) who state that “an ‘overcrowded’ board.. easier for
the CEO to control”. Other researchers like Adams and Ferreira (2009) and Ghosh and Sirmans (2005)
also take this variable into account. Consequently, the following hypothesis for this thesis is:
H2a: The number of female board members is positively associated with board size
H2b: Board size is positively associated with the amount of CEO compensation
As discussed in the literature research, the effects of individual board members could be diminished
by several factors. Cyert et al. (2002) and Fahlenbrach (2008) for example bring the chairmanship of the
CEO to attention in relation to the compensation package he/she receives. By leading the board, the
CEO can influence individual board members and this social interaction might diffuse tasks of the
compensation committee members as personal relations come into play. It could also mean that the
CEO can influence the process for selecting new board candidates like Perel (2003) mentions and Farrell
and Hersch (2005) show. Taking the assumptions for hypothesis 1 into consideration, a CEO that holds
chairman position would prefer to have few women on board. This because women monitor better than
men (Adams and Ferreira, 2009) and the diversity that is created by adding women to a traditionally
male dominated environment could lead to increased discussion inputs, making the chair position
harder to exploit for personal interests. The complexity of these social interactions is hard to measure
adequately, but the variable ‘CEO Chairmanship’ has shown to be an influencing factor in the payment
setting process by other researchers like Adams and Ferreira (2009) and Bell (2005). Therefore the
following hypotheses have been taken into account:
H3a: Boards where the CEO is chairman have fewer female directors than boards where the CEO
isn’t chairman
H3b: Chairmanship of the CEO is positively associated with the amount of compensation
40 Research Design
Another factor that could diminish the effectiveness of proper interest alignment is mentioned by
Yermack (2006), who states that the responsibility board members take in providing good management
control and monitoring, associates with their occupancy. The occupancy of directors, expressed as the
number of seats they occupy in total in other companies as well, is a factor that influences the quality of
the board (Fahlenbrach, 2008; Ghosh and Sirmans, 2005). Assuming that when directors hold several
seats on different companies, the dedication and focus within a seat can’t be optimal as time and energy
restraints require dividing of attention. Consequently, this would imply that boards with active directors
(measured in the number of board seats they occupy) show less monitoring effort, which would favour
the CEO. As Yermack (2006) notes that more new directors are women and they tend to be less
occupied (having less other board seats), the relation is therefore presumed to be positive and the
fourth hypothesis is:
H4a: Female directors hold a lower number of other board seats than male directors
H4b: The number of other board seats by directors is positively associated with the amount of CEO
compensation
These four hypotheses on CEO compensation are tested to provide an answer on the main research
question of this master thesis’ research. In the following paragraph, the Multiple Regression Model used
to test the aforementioned hypotheses is explained.
41 Research Design
4.2 TestModel
To validate the hypotheses as formulated in the previous paragraph, a statistical model is required
that can test the association between the dependent and independent variables. As the literature
review has revealed, many factors are likely to influence the payment setting, hence the outcomes of
the dependent variables (compensation components). An ANOVA test could be used to assess whether
two groups show a significant difference in the measured means. This could be useful in testing a single
relation between two variables, however for the purpose of this research a more comprehensive test is
required. The T‐test is quite similar to the ANOVA test, as it can test (one or two sided) whether
outcomes significantly differ between two groups. However, this would also imply that only one relation
can be tested at a time and as prior literature has mentioned the high complexity of the payment setting
process, a T‐test would also be insufficient. To test a combination of several variables and their
combined effect on a measured output, a Multiple Regression Model can be used. Adams & Ferreira
(2009), Bell (2005), Du Rietz and Henrekson (1999), Erhardt et al. (2003), Fahlenbrach (2008), Gayle et al.
(2010), Ghosh and Sirmans (2005), Huse et al. (2009), Rose (2007) and Wang & Clift (2009) all use a
regression model that incorporates multiple variables in order to measure outputs like CEO
compensation or board performance figures.
For this thesis’ research a Multiple Regression Model is used that incorporates all the variables that
were defined as plausibly explanatory and control variables are added. The independent variables are
the measures on female representativeness, chairmanship of the CEO, total board size and the number
of seats directors hold. Prior literature indicates that these variables are assumed and/or associated
with female board members. The hypotheses as formulated in the previous paragraph also correspond
with these independent variables. With the control variables taken into account, the model that will be
used is composed as follows:
, # , % , , ,
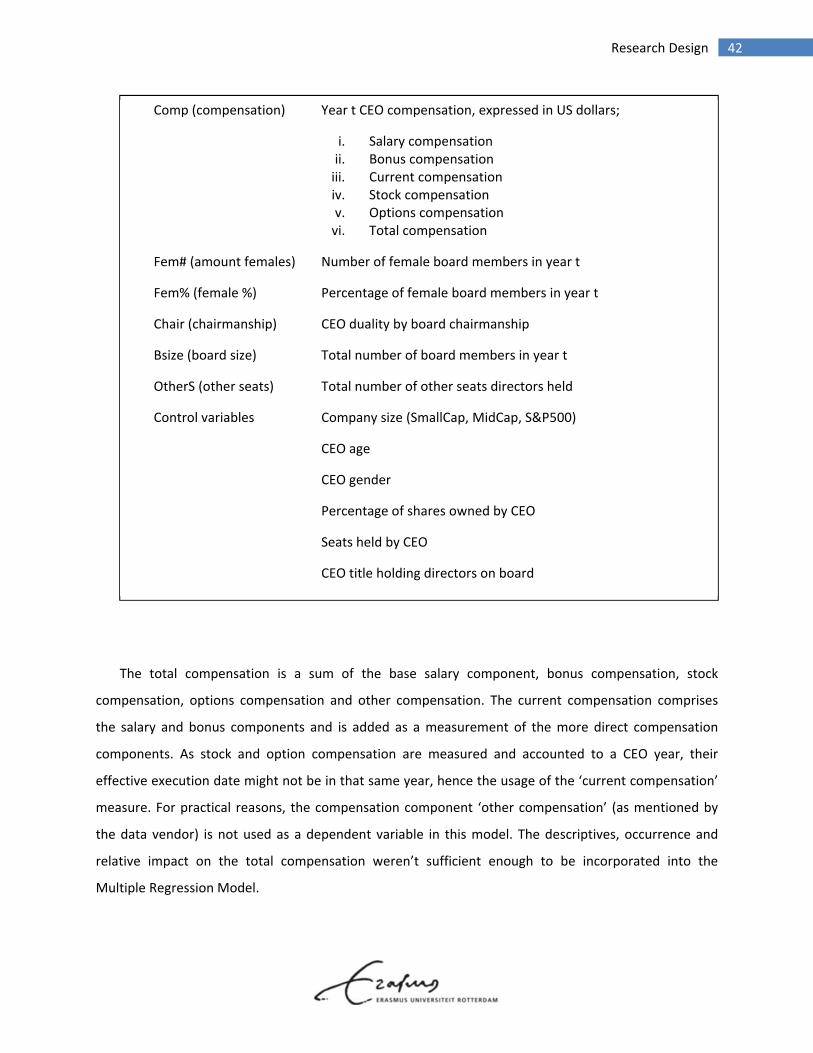
42 Research Design
The total compensation is a sum of the base salary component, bonus compensation, stock
compensation, options compensation and other compensation. The current compensation comprises
the salary and bonus components and is added as a measurement of the more direct compensation
components. As stock and option compensation are measured and accounted to a CEO year, their
effective execution date might not be in that same year, hence the usage of the ‘current compensation’
measure. For practical reasons, the compensation component ‘other compensation’ (as mentioned by
the data vendor) is not used as a dependent variable in this model. The descriptives, occurrence and
relative impact on the total compensation weren’t sufficient enough to be incorporated into the
Multiple Regression Model.
Comp (compensation) Year t CEO compensation, expressed in US dollars;
i. Salary compensation ii. Bonus compensation iii. Current compensation iv. Stock compensation v. Options compensation vi. Total compensation
Fem# (amount females) Number of female board members in year t
Fem% (female %) Percentage of female board members in year t
Chair (chairmanship) CEO duality by board chairmanship
Bsize (board size) Total number of board members in year t
OtherS (other seats) Total number of other seats directors held
Control variables Company size (SmallCap, MidCap, S&P500)
CEO age
CEO gender
Percentage of shares owned by CEO
Seats held by CEO
CEO title holding directors on board
43 Research Design
Based on prior literature, the five board characteristics that are most likely to influence the height
of these compensation components are the aforementioned two female representativeness measures,
CEO chairmanship, board size and board occupancy.
As there are other variables that might influence the process, several control variables are taken
into account and they are as follows:
1. Cyert et al. (2002) state that “firm size has the greatest explanatory power for
variations in all three types of CEO compensation”. Therefore the indexation of
companies based on their listing status within the S&P (SmallCap, MidCap or
S&P500) is taken into account as this serves as an indicator for company size.
2. In that same research of Cyert et al. (2002), the age of the CEO is mentioned as a
control variable that “might impact the effectiveness of corporate governance
mechanisms”. Furthermore, organizational behaviour theory suggests that the CEO
tenure would positively impact the payment and Perel (2003) underlines the effect
of CEO experience on the payment in their new positions. As tenure and experience
data were not fully available for the sample used in this thesis’ research, the
variable ‘CEO age’ serves as an indicator for CEO experience/tenure and is therefore
taken into account in the model. Bell (2005) also uses the CEO age as an
independent variable in her test to address this matter.
3. Bell (2005) investigated the differences in pay between women and men led firms
and found that the females earned 8 to 25% less than their male counterparts.
Using the ‘CEO age’ control variable, Bell (2005) also notices that female executives
“are younger and have less tenure on average than their male executive
counterparts”. As this effect is not likely to disappear within the time period that
exists between the sample of Bell and the one used for this research, the gender of
the CEO is added as a control variable.
4. A perhaps intuitive control variable is that of the CEO ownership, reasoning that
when the CEO has a major stake in the company, his/hers decision powers are
expected to coincide with the relative part owned. Although this variable turned out
44 Research Design
not to be significant in the research of Cyert et al. (2002), it did reveal a positive
relation within small companies. Control variable 4 therefore comprises the
percentage of shares in possession of the CEO.
5. As Perel (2003) mentions that social ties of executives are a factor highly likely to
influence their payment setting process, this had to be addressed in the model.
However, the social ties are hard to measure and their effect hard to quantify. To
add a control variable that indicates if there are interlocking relations influencing
the payment setting process, the number of board seats the CEO holds on other
major boards is taken into account. Because, if the CEO serves on other boards, the
social relations that he/she has in that board, might have their effect in the board of
the CEO’s company, therefore the independency of the board(s).
6. Another variable that is incorporated to address the possible influence of social ties
in the compensation setting process is the number of directors that hold the title
‘CEO’ within the board. In line with the argumentation for control variable 5, the
number of CEO’s on board of the company that is part of the sample, might give an
indication of the intertwining social relationships.
The control variables added to the model account for several factors that might influence the
payment setting process. As these are not exclusive, the limitations that remain present are discussed in
paragraph 6.2.
45 Research Design
4.3 Researchstatisticslayout
With the hypotheses and test model being discussed in the first two paragraphs, this paragraph
elaborates on the statistic tests that will be used to find the quantitative results needed to answer the
hypotheses and ultimately the research question. The results of these statistic tests will be provided in
the next chapter.
Paragraph 4.2 elaborated on the regression model which, in line with practices of prior literature,
was constructed to test the hypotheses as formulated in paragraph 4.1. The independent variables are
expected to show the most significant association with the dependent variables, based on the literature
provided in chapter 3. In order to analyse these associations, the individual correlation coefficients will
be measured first using a single regression test. With the Multiple Regression Model, it is possible to
measure the combined association the independent variables show with the dependent variables. With
the extended model, these associations are further tested as control variables might diminish/enhance
the strength of the Multiple Regression Model as a whole. That way, the effect of combining the
variables can show whether associations strengthen/weaken. The regression tests that will be used are
therefore as follows:
1. Single regression test
2. Multiple regression test using independent variables only (MRM 1)
3. Multiple regression test using both independent and control variables (MRM 2)
As some variables in the Multiple Regression Model might associate with each other, ANOVA tests
will be performed on the independent variables to analyse whether the female representation in the
Board of Directors relates to other independent variables in the test model. By using an ANOVA test, the
difference in mean of the groups can be quantified, whereby classification of groups is based on the
grouping variable. The ANOVA tests will be performed on the following variables:
4. ANOVA board size in relation to female directorship
5. ANOVA CEO chairmanship in relation to female directorship
6. ANOVA occupancy of directors in relation to female directorship
The outcomes of the ANOVA could clarify whether the grouping variable has significant impact on
the measured value of the dependent variable. If the outcome of an ANOVA turns out significant, it is
46 Research Design
assumed that the variation of the dependent variable can be clarified with the grouping variable.
Significant outcomes would imply that the ANOVA test’ dependent variable has less individual
explanatory power in the Multiple Regression Model as most of its own variance is determined by
another variable which is also part of the Multiple Regression Model. This however, would not
compromise the strength of the Multiple Regression Model as a whole although remarks have to be
made when looking at the individual strength of the variables.
The ANOVA tests are concentrated on 3 specific associations of the independent variables amongst
each other. However, it might be possible that within the complete set of variables used in the Multiple
Regression Model, multicollinearity occurs. This could mean that variables are overruled by a
(combination of) other variable(s). Perhaps the associations between the independent variables alone
aren’t significant according the ANOVA’s, but an independent variable might still be overruled by the
control variables. To test whether this is the case for any of the variables used, the multicollinearity is
measured. To fully analyse the strength of the variable female directorship, a final test is on the Multiple
Regression Model without using the variable ‘Number Of Female Board Members’. This could provide
more information on whether this variable is addressing, if any, of the variation in the dependent
variables. The last two statistic tests are therefore:
7. Test on multicollinearity within the Multiple Regression Model using both independent and
control variables
8. Multiple Regression Model without the variable ‘Number Of Female Board Members’10
The data sample that will be used is discussed in the following paragraph. All the test results will be
presented in chapter 5 according to the layout as presented in this paragraph. The individual results will
be analysed per statistic test and the hypotheses as formulated in paragraph 4.1 will be validated
accordingly. The conclusions based upon these outcomes will be presented in the final chapter, where
the main research question will be answered.
10 For practical purposes this model will be referred to as Multiple Regression Model 3
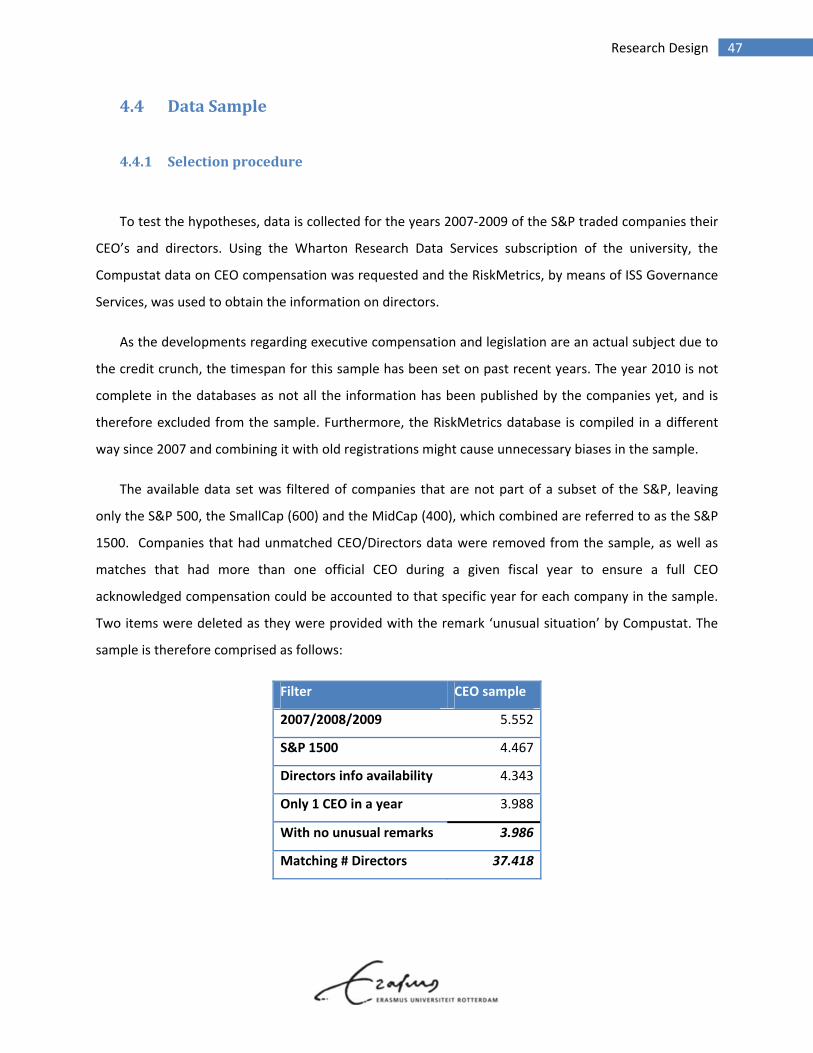
47 Research Design
4.4 DataSample
4.4.1 Selectionprocedure
To test the hypotheses, data is collected for the years 2007‐2009 of the S&P traded companies their
CEO’s and directors. Using the Wharton Research Data Services subscription of the university, the
Compustat data on CEO compensation was requested and the RiskMetrics, by means of ISS Governance
Services, was used to obtain the information on directors.
As the developments regarding executive compensation and legislation are an actual subject due to
the credit crunch, the timespan for this sample has been set on past recent years. The year 2010 is not
complete in the databases as not all the information has been published by the companies yet, and is
therefore excluded from the sample. Furthermore, the RiskMetrics database is compiled in a different
way since 2007 and combining it with old registrations might cause unnecessary biases in the sample.
The available data set was filtered of companies that are not part of a subset of the S&P, leaving
only the S&P 500, the SmallCap (600) and the MidCap (400), which combined are referred to as the S&P
1500. Companies that had unmatched CEO/Directors data were removed from the sample, as well as
matches that had more than one official CEO during a given fiscal year to ensure a full CEO
acknowledged compensation could be accounted to that specific year for each company in the sample.
Two items were deleted as they were provided with the remark ‘unusual situation’ by Compustat. The
sample is therefore comprised as follows:
Filter CEO sample
2007/2008/2009 5.552
S&P 1500 4.467
Directors info availability 4.343
Only 1 CEO in a year 3.988
With no unusual remarks 3.986
Matching # Directors 37.418
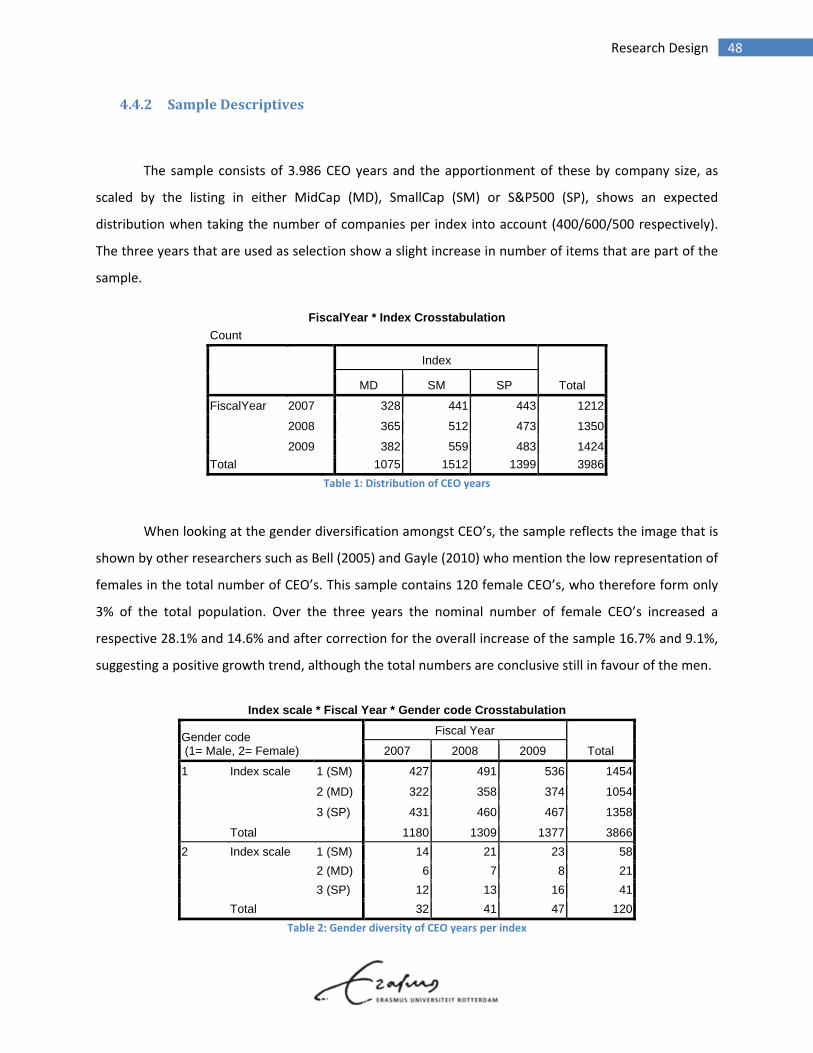
48 Research Design
4.4.2 SampleDescriptives
The sample consists of 3.986 CEO years and the apportionment of these by company size, as
scaled by the listing in either MidCap (MD), SmallCap (SM) or S&P500 (SP), shows an expected
distribution when taking the number of companies per index into account (400/600/500 respectively).
The three years that are used as selection show a slight increase in number of items that are part of the
sample.
FiscalYear * Index Crosstabulation
Count
Index
Total MD SM SP
FiscalYear 2007 328 441 443 1212
2008 365 512 473 1350
2009 382 559 483 1424
Total 1075 1512 1399 3986
Table 1: Distribution of CEO years
When looking at the gender diversification amongst CEO’s, the sample reflects the image that is
shown by other researchers such as Bell (2005) and Gayle (2010) who mention the low representation of
females in the total number of CEO’s. This sample contains 120 female CEO’s, who therefore form only
3% of the total population. Over the three years the nominal number of female CEO’s increased a
respective 28.1% and 14.6% and after correction for the overall increase of the sample 16.7% and 9.1%,
suggesting a positive growth trend, although the total numbers are conclusive still in favour of the men.
Index scale * Fiscal Year * Gender code Crosstabulation
Gender code (1= Male, 2= Female)
Fiscal Year
Total 2007 2008 2009
1 Index scale 1 (SM) 427 491 536 1454
2 (MD) 322 358 374 1054
3 (SP) 431 460 467 1358
Total 1180 1309 1377 3866
2 Index scale 1 (SM) 14 21 23 58
2 (MD) 6 7 8 21
3 (SP) 12 13 16 41
Total 32 41 47 120
Table 2: Gender diversity of CEO years per index
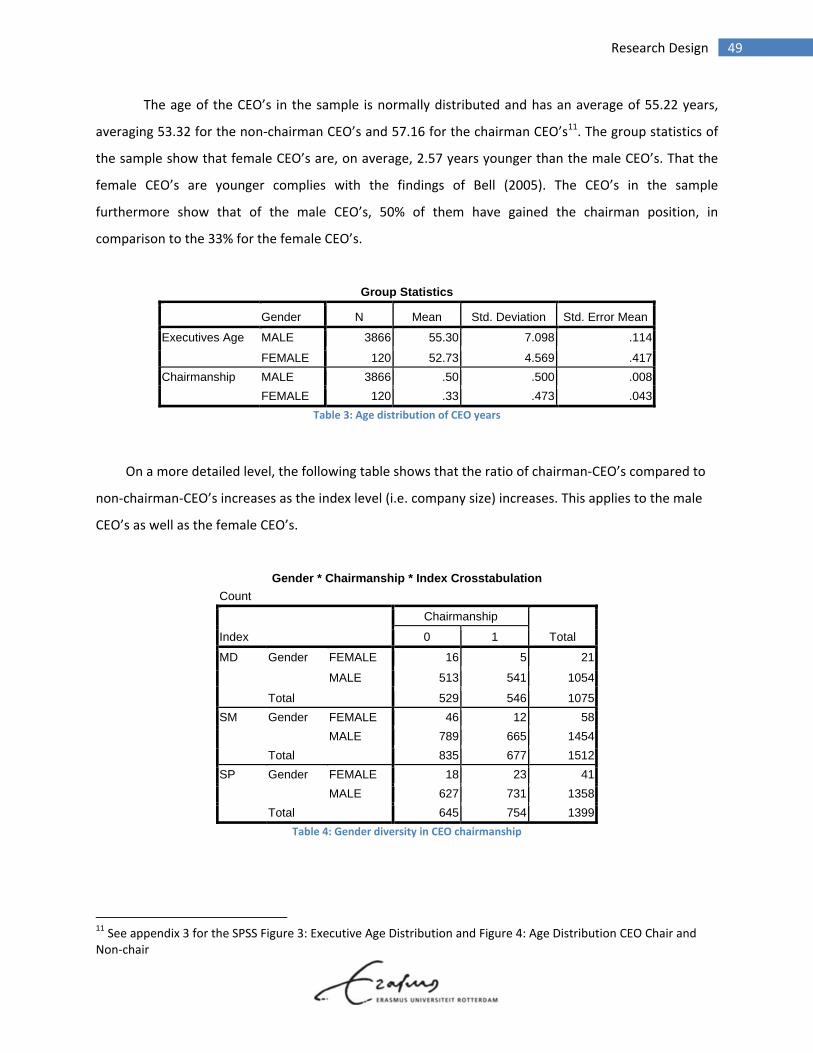
49 Research Design
The age of the CEO’s in the sample is normally distributed and has an average of 55.22 years,
averaging 53.32 for the non‐chairman CEO’s and 57.16 for the chairman CEO’s11. The group statistics of
the sample show that female CEO’s are, on average, 2.57 years younger than the male CEO’s. That the
female CEO’s are younger complies with the findings of Bell (2005). The CEO’s in the sample
furthermore show that of the male CEO’s, 50% of them have gained the chairman position, in
comparison to the 33% for the female CEO’s.
Group Statistics
Gender N Mean Std. Deviation Std. Error Mean
Executives Age MALE 3866 55.30 7.098 .114
FEMALE 120 52.73 4.569 .417
Chairmanship MALE 3866 .50 .500 .008
FEMALE 120 .33 .473 .043
Table 3: Age distribution of CEO years
On a more detailed level, the following table shows that the ratio of chairman‐CEO’s compared to
non‐chairman‐CEO’s increases as the index level (i.e. company size) increases. This applies to the male
CEO’s as well as the female CEO’s.
Gender * Chairmanship * Index Crosstabulation
Count
Index
Chairmanship
Total 0 1
MD Gender FEMALE 16 5 21
MALE 513 541 1054
Total 529 546 1075
SM Gender FEMALE 46 12 58
MALE 789 665 1454
Total 835 677 1512
SP Gender FEMALE 18 23 41
MALE 627 731 1358
Total 645 754 1399
Table 4: Gender diversity in CEO chairmanship
11 See appendix 3 for the SPSS Figure 3: Executive Age Distribution and Figure 4: Age Distribution CEO Chair and Non‐chair
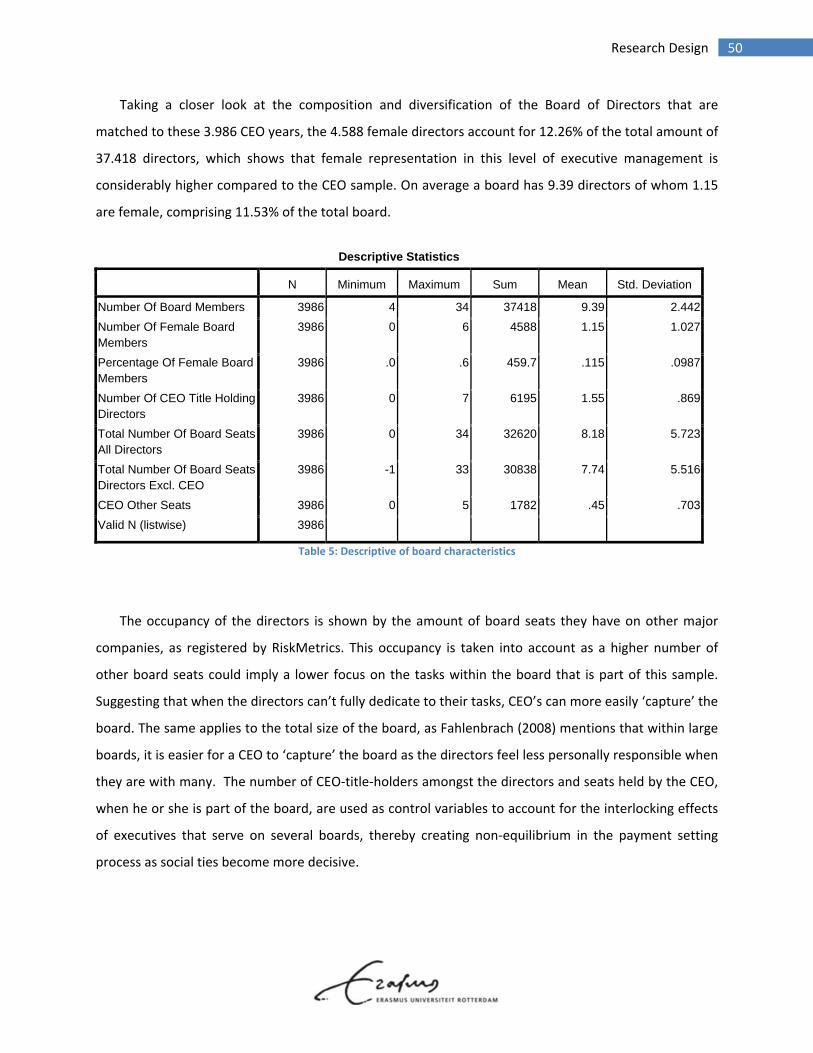
50 Research Design
Taking a closer look at the composition and diversification of the Board of Directors that are
matched to these 3.986 CEO years, the 4.588 female directors account for 12.26% of the total amount of
37.418 directors, which shows that female representation in this level of executive management is
considerably higher compared to the CEO sample. On average a board has 9.39 directors of whom 1.15
are female, comprising 11.53% of the total board.
Descriptive Statistics
N Minimum Maximum Sum Mean Std. Deviation
Number Of Board Members 3986 4 34 37418 9.39 2.442
Number Of Female Board Members
3986 0 6 4588 1.15 1.027
Percentage Of Female Board Members
3986 .0 .6 459.7 .115 .0987
Number Of CEO Title Holding Directors
3986 0 7 6195 1.55 .869
Total Number Of Board Seats All Directors
3986 0 34 32620 8.18 5.723
Total Number Of Board Seats Directors Excl. CEO
3986 -1 33 30838 7.74 5.516
CEO Other Seats 3986 0 5 1782 .45 .703
Valid N (listwise) 3986
Table 5: Descriptive of board characteristics
The occupancy of the directors is shown by the amount of board seats they have on other major
companies, as registered by RiskMetrics. This occupancy is taken into account as a higher number of
other board seats could imply a lower focus on the tasks within the board that is part of this sample.
Suggesting that when the directors can’t fully dedicate to their tasks, CEO’s can more easily ‘capture’ the
board. The same applies to the total size of the board, as Fahlenbrach (2008) mentions that within large
boards, it is easier for a CEO to ‘capture’ the board as the directors feel less personally responsible when
they are with many. The number of CEO‐title‐holders amongst the directors and seats held by the CEO,
when he or she is part of the board, are used as control variables to account for the interlocking effects
of executives that serve on several boards, thereby creating non‐equilibrium in the payment setting
process as social ties become more decisive.
51 Research Design
4.5 ChapterSummary
This chapter elaborated on the hypotheses that were formulated using prior literature, the test
model, the sample to test with and the statistic test that will be used. The first paragraph gives the
answer to sub question 5: ‘What hypotheses are tested to answer the main research question?’. The
hypotheses described in this chapter are formulated to address the following relations:
1. The absolute/relative presentation of female board members negatively associates with the
total and or equity related amount of CEO compensation
2. The number of female directors is dependent of total board size and board size positively
associates with the amount of CEO compensation
3. Chairmanship of the CEO influences the number of female directors and chairmanship positively
associates with the amount of compensation
4. Female directors hold less other board seats and the number of other board seats held by
directors positively associates with the amount of CEO compensation
The statistic test will provide empirical evidence on what variables significantly influence the CEO
compensation. Considering the main research question of this thesis, the first hypothesis is most directly
addressing the relation between female board representation and CEO compensation. Prior literature
predicts that the variables defined in hypotheses 2, 3 and 4 are likely to show significant association with
female directorship and on the CEO compensation, so these variables are independent variables in the
test model as well. This leads to the following sub question 6: ‘Which test model is used to test the
hypotheses?’. To incorporate all the variables needed to test the hypotheses, and to assess whether
they add up or diminish the significance of the outcomes when combined, a Multiple Regression Model
is used. The full version of this Multiple Regression Model is constructed as follows:
, # , % , , ,
This Multiple Regression Model will be used in different variations. At first a single regression test
will show all the individual correlation coefficients of the independent and control variables in relation
to the measurements of CEO compensation components (i.e. the dependent variables). Then the
Multiple Regression Model will be used to measure the independent variables combined and their
associations with the dependent variables. This would give insight in whether the independent variables
52 Research Design
are that strongly associated as theory has predicted. The full Multiple Regression Model is performed
next, with the control variables added, to test whether the predictive value of the independent variables
holds stand or increases/diminishes. Outcomes of the full model will show whether associations can be
addressed to the independent variables or whether they are more likely to be explained by the control
variables.
In an attempt to better interpret the associations that will be shown by Multiple Regression Model,
ANOVA tests are used to analyse the independent variables’ associations with each other. To test the
strength of the model, a test for multicollinearity will be performed thereafter. Finally, an alternative
version on the Multiple Regression Model will be performed, in which the direct measurements on
female board members are extracted.
This leaves the following sub question left to be answered, namely sub question 7: ‘What data
sample is used for the test model?’. The sample that is compiled for this master thesis research consists
of the years 2007, 2008 and 2009 and comprises S&P1500 listed companies (therefore U.S. companies
only). After a selection on completeness, this gives a total of 3.986 unique CEO years, which are
matched to 37.418 directors. Of the 3.986 CEO years, 120 of those are female CEO years. Of the 37.418
directors matched, 4.588 of those are female.

53 Test Results
5 TestResults
This chapter elaborates on the outcomes of the tests on variables and their subsequent results in
the Multiple Regression Model (MRM), using the described dataset of the previous chapter. The results
of the test are presented in the first paragraph of this chapter and the hypotheses as formulated in
paragraph 4.1 are validated in this chapter’s paragraph 5.2. The summary is provided thereafter and
interpretation of the results is provided in the sixth and final chapter.
5.1 Outcomesstatistictests
The statistic test results are presented in the order as mentioned in paragraph 4.3. The order
corresponds with the sub paragraph numbering to provide a clear lay‐out:
1. Single regression test
2. Multiple regression test using independent variables only (MRM 1)
3. Multiple regression test using both independent and control variables (MRM 2)
4. ANOVA board size in relation to female directorship
5. ANOVA CEO chairmanship in relation to female directorship
6. ANOVA occupancy of directors in relation to female directorship
7. Test on multicollinearity within the Multiple Regression Model
8. Multiple Regression Model without the variable ‘Number Of Female Board Members’
(MRM3)
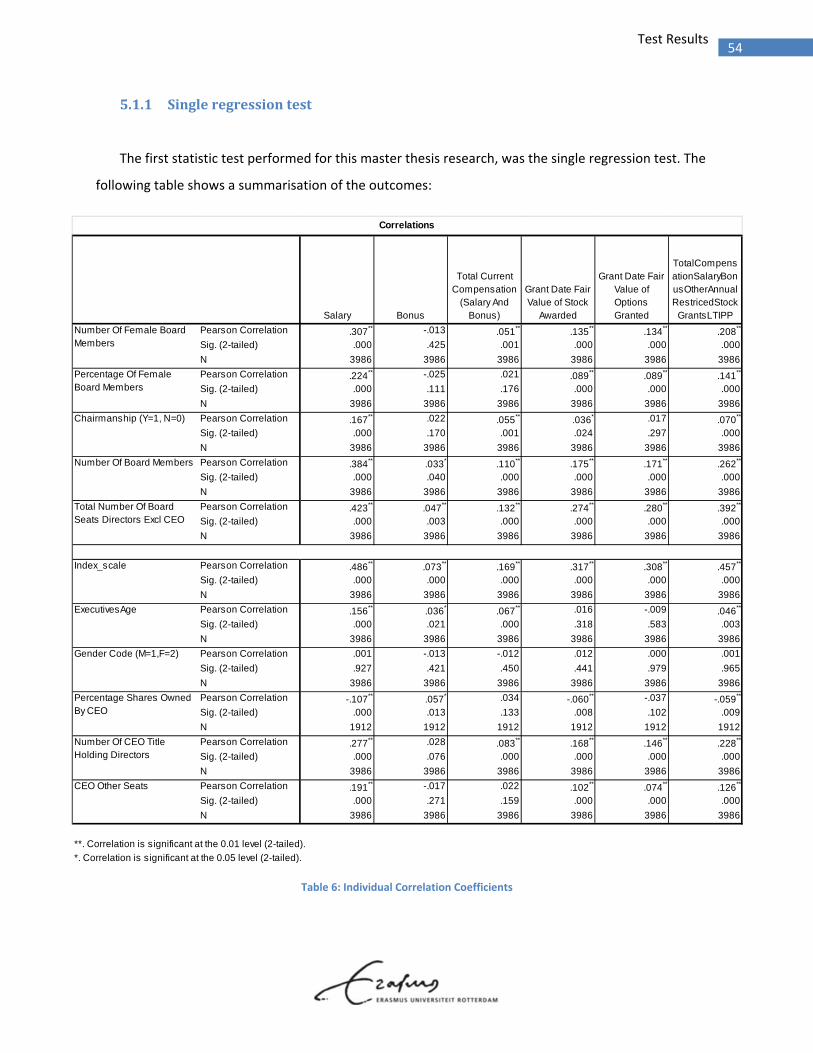
54 Test Results
5.1.1 Singleregressiontest
The first statistic test performed for this master thesis research, was the single regression test. The
following table shows a summarisation of the outcomes:
Table 6: Individual Correlation Coefficients
Salary Bonus
Total Current Compensation
(Salary And Bonus)
Grant Date Fair Value of Stock
Awarded
Grant Date Fair Value of Options Granted
TotalCompensationSalaryBonusOtherAnnualRestricedStock
GrantsLTIPP
Pearson Correlation .307** -.013 .051** .135** .134** .208**
Sig. (2-tailed) .000 .425 .001 .000 .000 .000
N 3986 3986 3986 3986 3986 3986
Pearson Correlation .224** -.025 .021 .089** .089** .141**
Sig. (2-tailed) .000 .111 .176 .000 .000 .000
N 3986 3986 3986 3986 3986 3986
Pearson Correlation .167** .022 .055** .036* .017 .070**
Sig. (2-tailed) .000 .170 .001 .024 .297 .000
N 3986 3986 3986 3986 3986 3986
Pearson Correlation .384** .033* .110** .175** .171** .262**
Sig. (2-tailed) .000 .040 .000 .000 .000 .000
N 3986 3986 3986 3986 3986 3986
Pearson Correlation .423** .047** .132** .274** .280** .392**
Sig. (2-tailed) .000 .003 .000 .000 .000 .000
N 3986 3986 3986 3986 3986 3986
Pearson Correlation .486** .073** .169** .317** .308** .457**
Sig. (2-tailed) .000 .000 .000 .000 .000 .000
N 3986 3986 3986 3986 3986 3986
Pearson Correlation .156** .036* .067** .016 -.009 .046**
Sig. (2-tailed) .000 .021 .000 .318 .583 .003
N 3986 3986 3986 3986 3986 3986
Pearson Correlation .001 -.013 -.012 .012 .000 .001
Sig. (2-tailed) .927 .421 .450 .441 .979 .965
N 3986 3986 3986 3986 3986 3986
Pearson Correlation -.107** .057* .034 -.060** -.037 -.059**
Sig. (2-tailed) .000 .013 .133 .008 .102 .009
N 1912 1912 1912 1912 1912 1912
Pearson Correlation .277** .028 .083** .168** .146** .228**
Sig. (2-tailed) .000 .076 .000 .000 .000 .000
N 3986 3986 3986 3986 3986 3986
Pearson Correlation .191** -.017 .022 .102** .074** .126**
Sig. (2-tailed) .000 .271 .159 .000 .000 .000
N 3986 3986 3986 3986 3986 3986
Number Of Female Board Members
Percentage Of Female Board Members
Number Of CEO Title Holding Directors
Correlations
ExecutivesAge
Percentage Shares Owned By CEO
**. Correlation is significant at the 0.01 level (2-tailed).
*. Correlation is significant at the 0.05 level (2-tailed).
Chairmanship (Y=1, N=0)
CEO Other Seats
Total Number Of Board Seats Directors Excl CEO
Index_scale
Gender Code (M=1,F=2)
Number Of Board Members
55 Test Results
The first five variables are the independent variables and the last six are the control variables, as
described in chapter 4. The individual correlation coefficients show that every variable, both
independent and control, have a significant regressive association with one or more compensation
component. All, except for the gender code of the CEO which shows no significant association with any
of the compensation components. This could imply that in the compensation setting process, no
distinction is made between male and female CEO’s, hence no discrimination occurs. In terms of
equality in payment setting, this could be interpreted as a positive signal. However, a single regression
test is too one‐sided to base such a conclusion on, but it is interesting to look at the variable CEO gender
in the following Multiple Regression Models to see whether the associations remain insignificant.
Looking at all the variables, the index scale seems to associate the most with all of the compensation
components, having significant levels of .000 in every measure. This complies with the findings of Cyert
et al. (2002). The number of board members and the number of seats they hold (CEO not included if he
or she is a board member) also show strong associations with the compensation components. This is
also in line with prior literature as Fahlenbrach (2008) as well as Cyert et al. (2002) mention that the
relation between compensation and board size is likely to be positive. The significance levels of the
number of board seats the directors hold (outside the company for which their part of the sample), is
not surprising as Ghosh and Sirmans (2005) mentioned this relation to be positive.
However, the individual correlations are far too broad to explain variations in the compensation
components as they might strengthen or nullify each other when combined. To assess the relation
between the independent variables and the dependent variables, this is better explained using the
combined regression coefficients to determine the relevance of each variable. The results of the
multiple regression tests are presented in the following subparagraphs. The ANOVA statistics will
furthermore test whether the variable of female directors associates with the total board size, the CEO
chairmanship variable and the occupancy of directors (measured by the number of other boards seats
they hold). What this single regression test has shown:
Every independent variable has significant association with at least 4 out of 6 dependent
variables (i.e. the compensation components).
Control variables also have at least a significant association with 4 dependent variables, all
except for the gender code of the CEO, which shows no significant association at all.
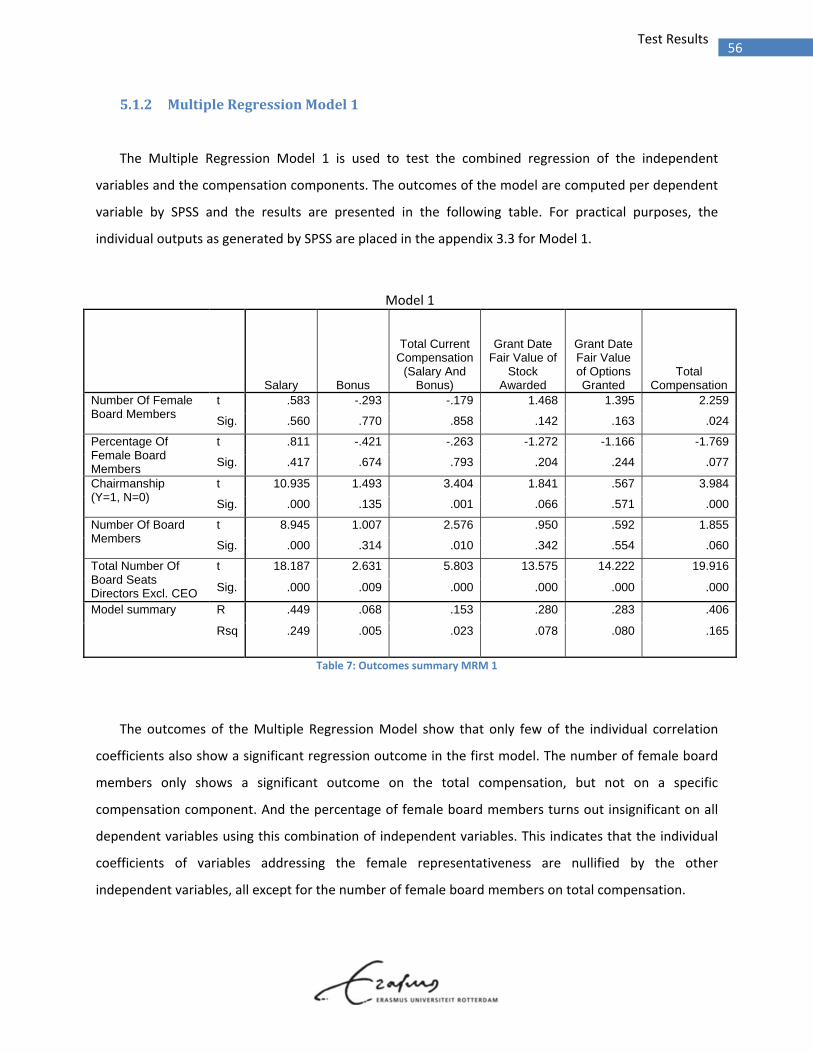
56 Test Results
5.1.2 MultipleRegressionModel1
The Multiple Regression Model 1 is used to test the combined regression of the independent
variables and the compensation components. The outcomes of the model are computed per dependent
variable by SPSS and the results are presented in the following table. For practical purposes, the
individual outputs as generated by SPSS are placed in the appendix 3.3 for Model 1.
Model 1
Salary Bonus
Total Current Compensation
(Salary And Bonus)
Grant Date Fair Value of
Stock Awarded
Grant Date Fair Value of Options Granted
Total Compensation
Number Of Female Board Members
t .583 -.293 -.179 1.468 1.395 2.259
Sig. .560 .770 .858 .142 .163 .024
Percentage Of Female Board Members
t .811 -.421 -.263 -1.272 -1.166 -1.769
Sig. .417 .674 .793 .204 .244 .077
Chairmanship (Y=1, N=0)
t 10.935 1.493 3.404 1.841 .567 3.984
Sig. .000 .135 .001 .066 .571 .000
Number Of Board Members
t 8.945 1.007 2.576 .950 .592 1.855
Sig. .000 .314 .010 .342 .554 .060
Total Number Of Board Seats Directors Excl. CEO
t 18.187 2.631 5.803 13.575 14.222 19.916
Sig. .000 .009 .000 .000 .000 .000
Model summary R .449 .068 .153 .280 .283 .406
Rsq .249 .005 .023 .078 .080 .165
Table 7: Outcomes summary MRM 1
The outcomes of the Multiple Regression Model show that only few of the individual correlation
coefficients also show a significant regression outcome in the first model. The number of female board
members only shows a significant outcome on the total compensation, but not on a specific
compensation component. And the percentage of female board members turns out insignificant on all
dependent variables using this combination of independent variables. This indicates that the individual
coefficients of variables addressing the female representativeness are nullified by the other
independent variables, all except for the number of female board members on total compensation.
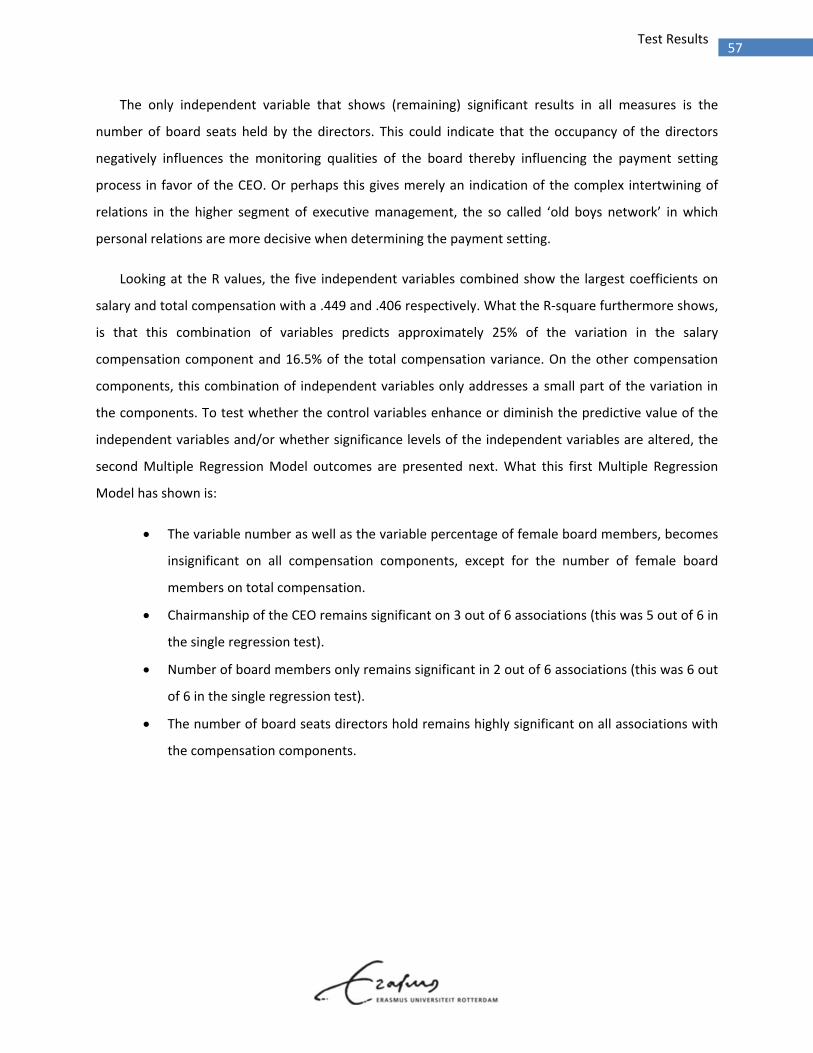
57 Test Results
The only independent variable that shows (remaining) significant results in all measures is the
number of board seats held by the directors. This could indicate that the occupancy of the directors
negatively influences the monitoring qualities of the board thereby influencing the payment setting
process in favor of the CEO. Or perhaps this gives merely an indication of the complex intertwining of
relations in the higher segment of executive management, the so called ‘old boys network’ in which
personal relations are more decisive when determining the payment setting.
Looking at the R values, the five independent variables combined show the largest coefficients on
salary and total compensation with a .449 and .406 respectively. What the R‐square furthermore shows,
is that this combination of variables predicts approximately 25% of the variation in the salary
compensation component and 16.5% of the total compensation variance. On the other compensation
components, this combination of independent variables only addresses a small part of the variation in
the components. To test whether the control variables enhance or diminish the predictive value of the
independent variables and/or whether significance levels of the independent variables are altered, the
second Multiple Regression Model outcomes are presented next. What this first Multiple Regression
Model has shown is:
The variable number as well as the variable percentage of female board members, becomes
insignificant on all compensation components, except for the number of female board
members on total compensation.
Chairmanship of the CEO remains significant on 3 out of 6 associations (this was 5 out of 6 in
the single regression test).
Number of board members only remains significant in 2 out of 6 associations (this was 6 out
of 6 in the single regression test).
The number of board seats directors hold remains highly significant on all associations with
the compensation components.
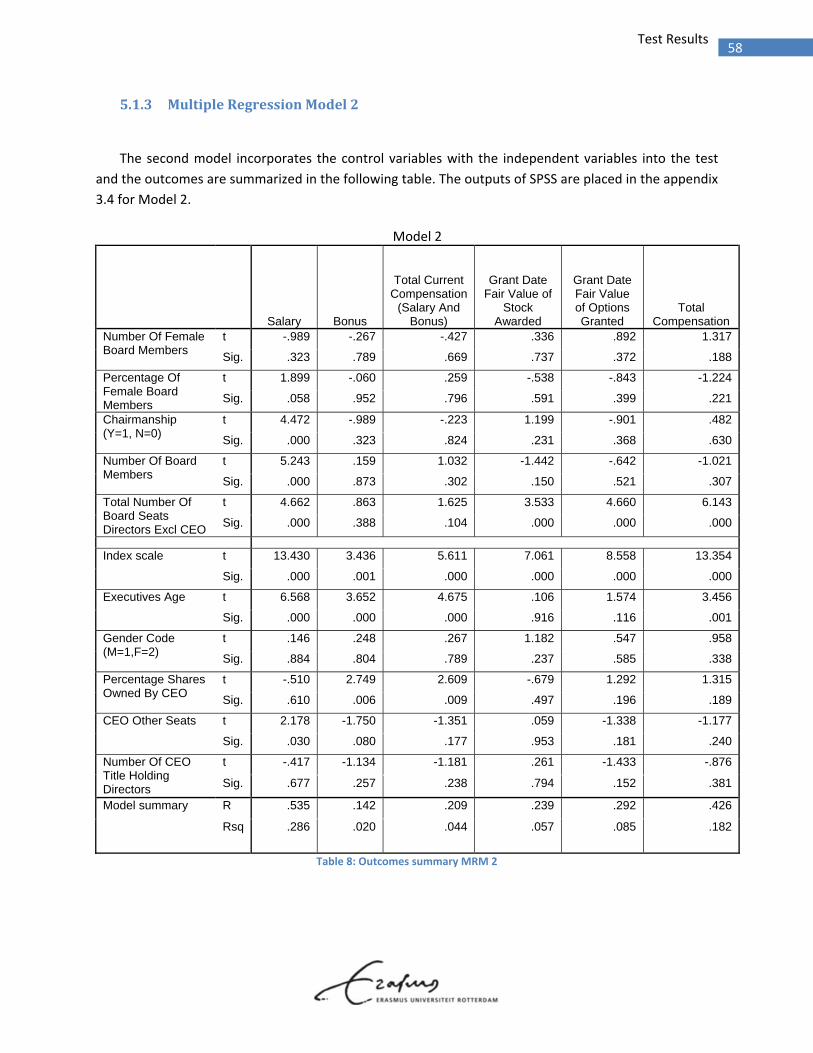
58 Test Results
5.1.3 MultipleRegressionModel2
The second model incorporates the control variables with the independent variables into the test
and the outcomes are summarized in the following table. The outputs of SPSS are placed in the appendix
3.4 for Model 2.
Model 2
Salary Bonus
Total Current Compensation
(Salary And Bonus)
Grant Date Fair Value of
Stock Awarded
Grant Date Fair Value of Options Granted
Total Compensation
Number Of Female Board Members
t -.989 -.267 -.427 .336 .892 1.317
Sig. .323 .789 .669 .737 .372 .188
Percentage Of Female Board Members
t 1.899 -.060 .259 -.538 -.843 -1.224
Sig. .058 .952 .796 .591 .399 .221
Chairmanship (Y=1, N=0)
t 4.472 -.989 -.223 1.199 -.901 .482
Sig. .000 .323 .824 .231 .368 .630
Number Of Board Members
t 5.243 .159 1.032 -1.442 -.642 -1.021
Sig. .000 .873 .302 .150 .521 .307
Total Number Of Board Seats Directors Excl CEO
t 4.662 .863 1.625 3.533 4.660 6.143
Sig. .000 .388 .104 .000 .000 .000
Index scale t 13.430 3.436 5.611 7.061 8.558 13.354
Sig. .000 .001 .000 .000 .000 .000
Executives Age t 6.568 3.652 4.675 .106 1.574 3.456
Sig. .000 .000 .000 .916 .116 .001
Gender Code (M=1,F=2)
t .146 .248 .267 1.182 .547 .958
Sig. .884 .804 .789 .237 .585 .338
Percentage Shares Owned By CEO
t -.510 2.749 2.609 -.679 1.292 1.315
Sig. .610 .006 .009 .497 .196 .189
CEO Other Seats t 2.178 -1.750 -1.351 .059 -1.338 -1.177
Sig. .030 .080 .177 .953 .181 .240
Number Of CEO Title Holding Directors
t -.417 -1.134 -1.181 .261 -1.433 -.876
Sig. .677 .257 .238 .794 .152 .381
Model summary R .535 .142 .209 .239 .292 .426
Rsq .286 .020 .044 .057 .085 .182
Table 8: Outcomes summary MRM 2
59 Test Results
Adding control variables to the model shows to have an impact on the significance levels of the
independent variables. Of the 11 variables (5 independent, 6 control) that were submitted in the
multiple regression model, the control variable ‘Company Size’ seems to have the most significant
coefficients. This complies with the findings of Cyert et al. (2002), who mentioned firm size having the
most explanatory power of all their used variables. The control variable CEO age is significant on the
current compensation components of salary and bonus as well as on the total compensation. This
complies with the prior literature of Bell (2005) and Perel (2003) in which the relation between CEO age
and compensation was mentioned. And as Perel (2003) also mentions that “a CEO’s track record and
established reputation… correlates strongly with the pay the CEO receives in a new position”, age and
tenure are likely to be associated variables so the positive association of CEO age and salary
compensation wasn’t completely unexpected.
The significant associations of the independent variables are further diminished by the control
variables. Chairmanship of the CEO only remains significant on the salary compensation and so does the
variable ‘Number Of Board Members’. The most significant independent variable ‘Number Of Board
Seats Directors excl. CEO’, is slightly diminished for the bonus and coherent current compensation.
However, it remains significant for the salary and the equity related compensation components, and
ultimately also for the total compensation. As mentioned by the outcomes of the first model, this might
be due to board quality and/or social ties. However, the control variables ‘CEO other seats’ and ‘number
of CEO title holding directors’ were added to address some measurement of the social dynamics, but
these variables show to have little significance.
The values of R and R‐square show that the compensation setting process is presumably influenced
by more factors than used in the Multiple Regression Model 2. As the values of R and R‐square increase
slightly (except for the option compensation) in comparison to the first Multiple Regression Model due
to the added control variables, the predictive value of the total set of variables remains low for the
individual compensation components. The variance of the salary component seems to be predictive for
28.6% and the total compensation’s variance for 18.2%. However in this second model, the
compensation components of bonus, current compensation, stock and options remain to show small
outcomes of R. The predictive value of the combination of variables used in the Multiple Regression
Model 2 on those components seems nil.
60 Test Results
The outcomes of the second Multiple Regression Model has shown the following:
The number as well as the percentage of female board members, remains insignificant on all
the dependent variables. With the direct measurements on female board participation and
their associations with compensation components of the CEO, the outcome would be
negative as no significant association could be found with the Multiple Regression Model.
Chairmanship of the CEO only remains significant on the salary component when the control
variables are added.
The number of board members also only remains significant on the salary component in the
second Multiple Regression Model.
Of all the independent variables, the ‘number of board seats directors hold’ variable showed
the most significant outcomes. However in the second Multiple Regression Model, the
control variables also diminish two of those associations, making them no longer significant.
Although it is not entirely within the specified focus of this master thesis research, it is
interesting to see that the variable CEO gender remains insignificant on all measurements as
a control variable in the second Multiple Regression Model. As it already showed to be
insignificant on every individual regression in the single regression test. This makes it
plausible that there is no gender discrimination in the payment setting of a CEO.
In the following subparagraphs, the outcomes of the ANOVA tests will be presented. The ANOVA
tests are on the independent variables CEO chairmanship, number of board members (board size),
number of board seats directors hold (occupancy) and the number of female board members. By testing
these relations, the outcomes of the Multiple Regression Model 2 can be better clarified. The direct
measurements of female board participation (number and percentage of female board members) show
to have none significant relation within the Multiple Regression Model 2. Perhaps this is due to the fact
that they are overruled by the other independent variables. Outcomes of ANOVA could clarify this.
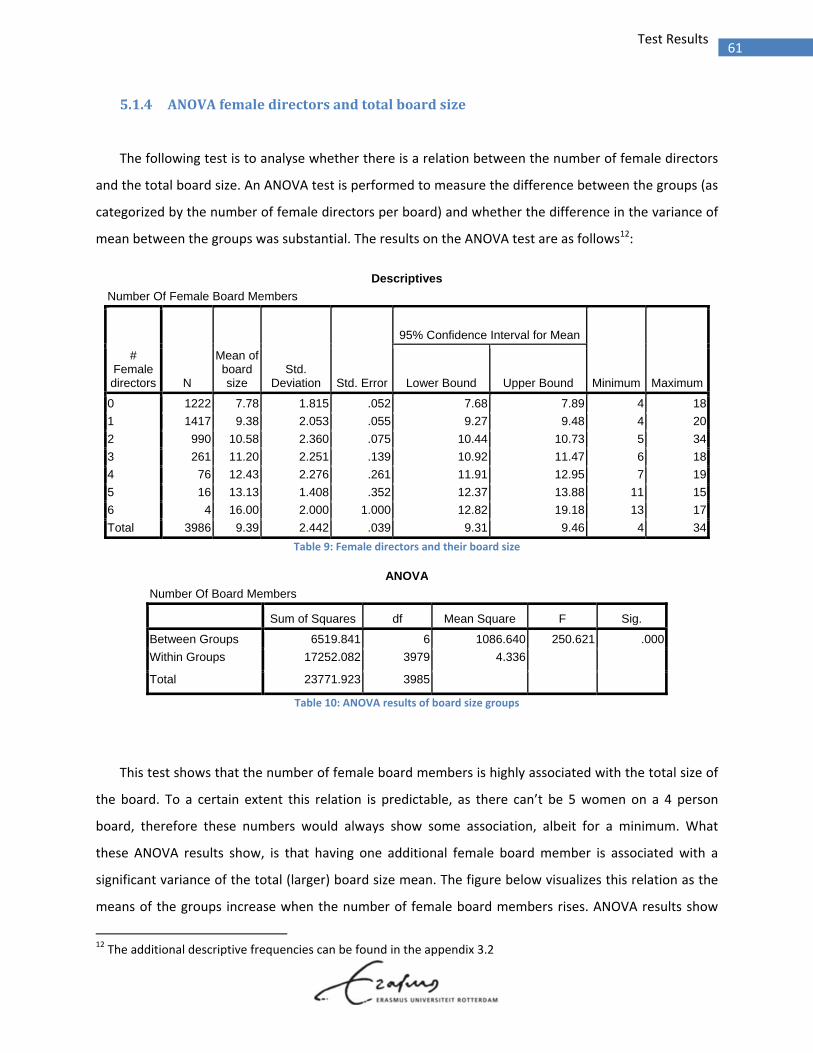
61 Test Results
5.1.4 ANOVAfemaledirectorsandtotalboardsize
The following test is to analyse whether there is a relation between the number of female directors
and the total board size. An ANOVA test is performed to measure the difference between the groups (as
categorized by the number of female directors per board) and whether the difference in the variance of
mean between the groups was substantial. The results on the ANOVA test are as follows12:
Descriptives
Number Of Female Board Members
N
Mean of board size
Std. Deviation Std. Error
95% Confidence Interval for Mean
Minimum Maximum
# Female directors Lower Bound Upper Bound
0 1222 7.78 1.815 .052 7.68 7.89 4 18
1 1417 9.38 2.053 .055 9.27 9.48 4 20
2 990 10.58 2.360 .075 10.44 10.73 5 34
3 261 11.20 2.251 .139 10.92 11.47 6 18
4 76 12.43 2.276 .261 11.91 12.95 7 19
5 16 13.13 1.408 .352 12.37 13.88 11 15
6 4 16.00 2.000 1.000 12.82 19.18 13 17
Total 3986 9.39 2.442 .039 9.31 9.46 4 34
Table 9: Female directors and their board size
ANOVA
Number Of Board Members
Sum of Squares df Mean Square F Sig.
Between Groups 6519.841 6 1086.640 250.621 .000
Within Groups 17252.082 3979 4.336 Total 23771.923 3985
Table 10: ANOVA results of board size groups
This test shows that the number of female board members is highly associated with the total size of
the board. To a certain extent this relation is predictable, as there can’t be 5 women on a 4 person
board, therefore these numbers would always show some association, albeit for a minimum. What
these ANOVA results show, is that having one additional female board member is associated with a
significant variance of the total (larger) board size mean. The figure below visualizes this relation as the
means of the groups increase when the number of female board members rises. ANOVA results show
12 The additional descriptive frequencies can be found in the appendix 3.2
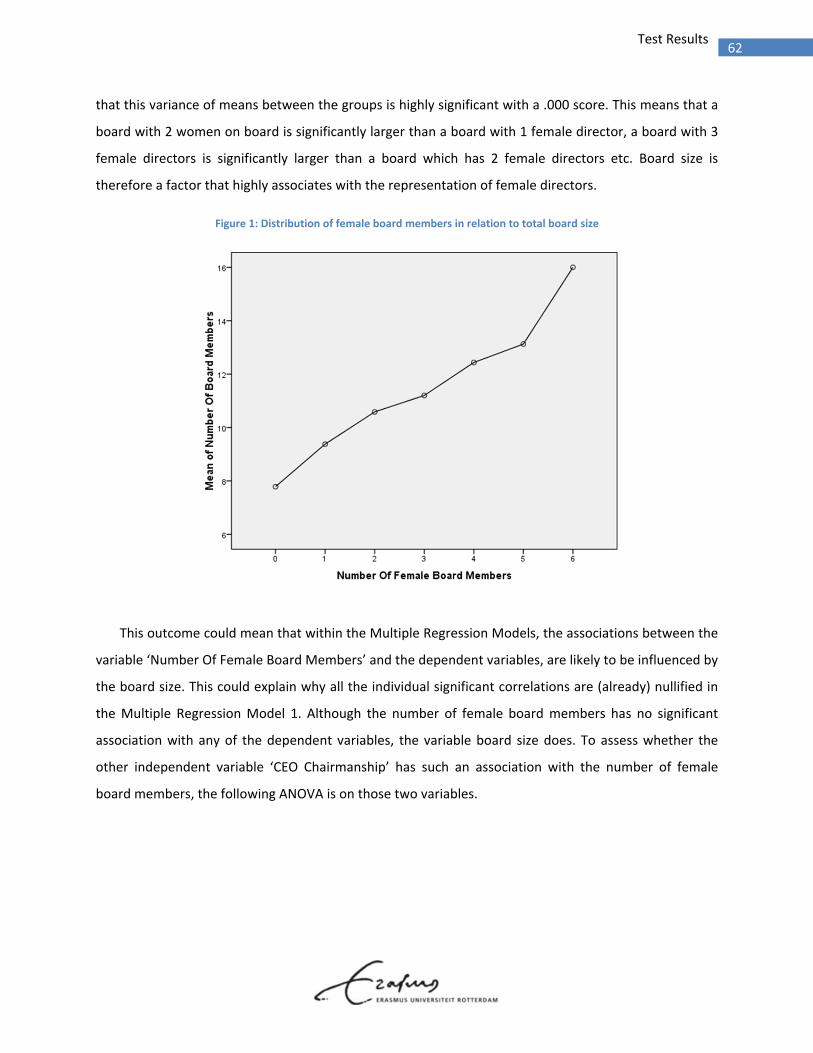
62 Test Results
that this variance of means between the groups is highly significant with a .000 score. This means that a
board with 2 women on board is significantly larger than a board with 1 female director, a board with 3
female directors is significantly larger than a board which has 2 female directors etc. Board size is
therefore a factor that highly associates with the representation of female directors.
Figure 1: Distribution of female board members in relation to total board size
This outcome could mean that within the Multiple Regression Models, the associations between the
variable ‘Number Of Female Board Members’ and the dependent variables, are likely to be influenced by
the board size. This could explain why all the individual significant correlations are (already) nullified in
the Multiple Regression Model 1. Although the number of female board members has no significant
association with any of the dependent variables, the variable board size does. To assess whether the
other independent variable ‘CEO Chairmanship’ has such an association with the number of female
board members, the following ANOVA is on those two variables.
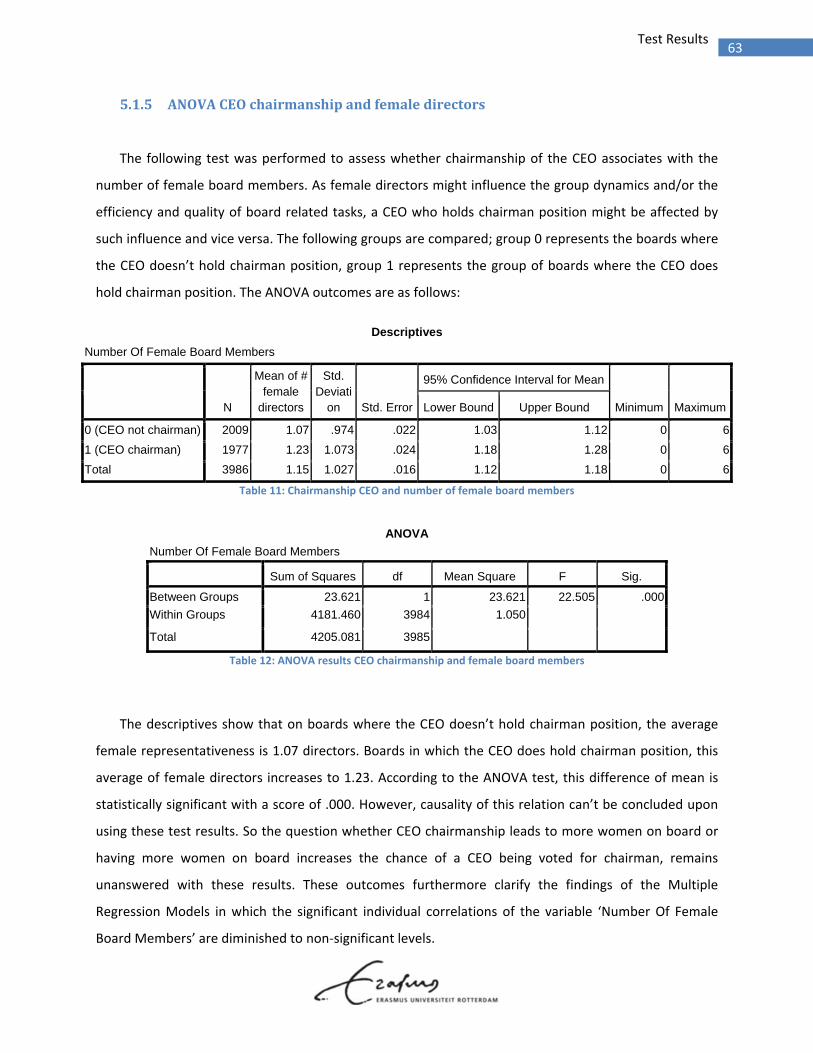
63 Test Results
5.1.5 ANOVACEOchairmanshipandfemaledirectors
The following test was performed to assess whether chairmanship of the CEO associates with the
number of female board members. As female directors might influence the group dynamics and/or the
efficiency and quality of board related tasks, a CEO who holds chairman position might be affected by
such influence and vice versa. The following groups are compared; group 0 represents the boards where
the CEO doesn’t hold chairman position, group 1 represents the group of boards where the CEO does
hold chairman position. The ANOVA outcomes are as follows:
Descriptives
Number Of Female Board Members
N
Mean of # female
directors
Std. Deviati
on Std. Error
95% Confidence Interval for Mean
Minimum Maximum Lower Bound Upper Bound
0 (CEO not chairman) 2009 1.07 .974 .022 1.03 1.12 0 6
1 (CEO chairman) 1977 1.23 1.073 .024 1.18 1.28 0 6
Total 3986 1.15 1.027 .016 1.12 1.18 0 6
Table 11: Chairmanship CEO and number of female board members
ANOVA
Number Of Female Board Members
Sum of Squares df Mean Square F Sig.
Between Groups 23.621 1 23.621 22.505 .000
Within Groups 4181.460 3984 1.050 Total 4205.081 3985
Table 12: ANOVA results CEO chairmanship and female board members
The descriptives show that on boards where the CEO doesn’t hold chairman position, the average
female representativeness is 1.07 directors. Boards in which the CEO does hold chairman position, this
average of female directors increases to 1.23. According to the ANOVA test, this difference of mean is
statistically significant with a score of .000. However, causality of this relation can’t be concluded upon
using these test results. So the question whether CEO chairmanship leads to more women on board or
having more women on board increases the chance of a CEO being voted for chairman, remains
unanswered with these results. These outcomes furthermore clarify the findings of the Multiple
Regression Models in which the significant individual correlations of the variable ‘Number Of Female
Board Members’ are diminished to non‐significant levels.
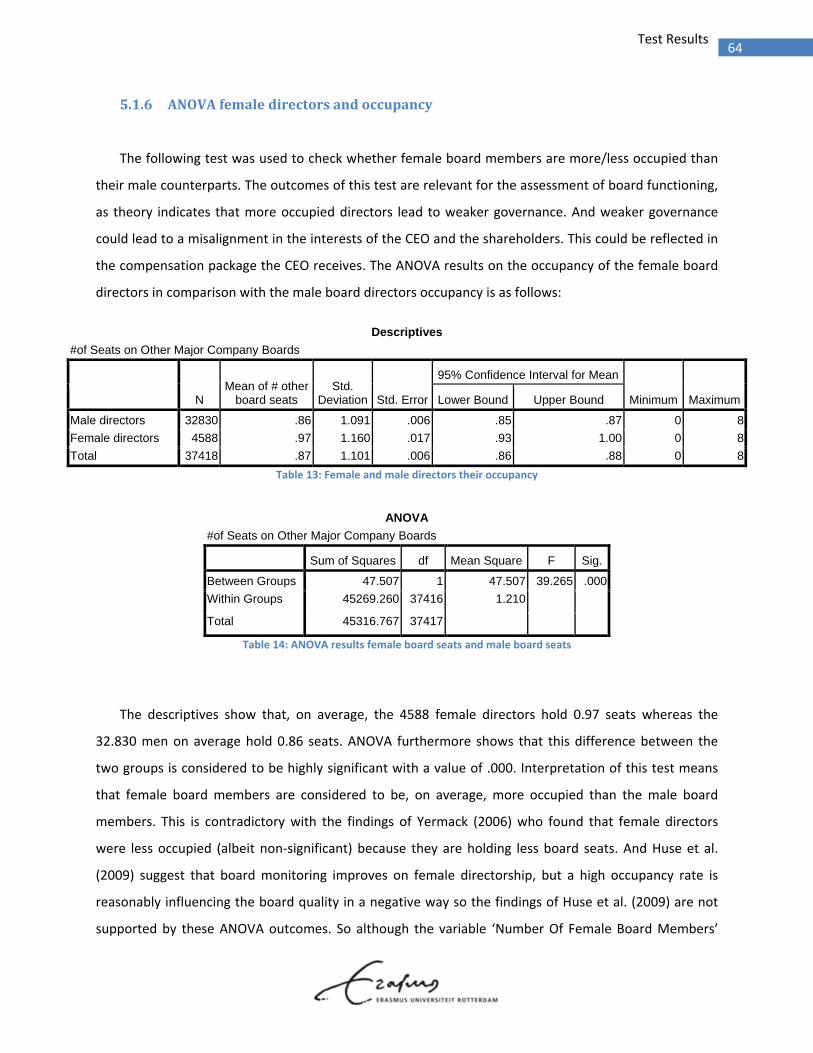
64 Test Results
5.1.6 ANOVAfemaledirectorsandoccupancy
The following test was used to check whether female board members are more/less occupied than
their male counterparts. The outcomes of this test are relevant for the assessment of board functioning,
as theory indicates that more occupied directors lead to weaker governance. And weaker governance
could lead to a misalignment in the interests of the CEO and the shareholders. This could be reflected in
the compensation package the CEO receives. The ANOVA results on the occupancy of the female board
directors in comparison with the male board directors occupancy is as follows:
Descriptives
#of Seats on Other Major Company Boards
N Mean of # other
board seats Std.
Deviation Std. Error
95% Confidence Interval for Mean
Minimum Maximum Lower Bound Upper Bound
Male directors 32830 .86 1.091 .006 .85 .87 0 8
Female directors 4588 .97 1.160 .017 .93 1.00 0 8
Total 37418 .87 1.101 .006 .86 .88 0 8
Table 13: Female and male directors their occupancy
ANOVA
#of Seats on Other Major Company Boards
Sum of Squares df Mean Square F Sig.
Between Groups 47.507 1 47.507 39.265 .000
Within Groups 45269.260 37416 1.210 Total 45316.767 37417
Table 14: ANOVA results female board seats and male board seats
The descriptives show that, on average, the 4588 female directors hold 0.97 seats whereas the
32.830 men on average hold 0.86 seats. ANOVA furthermore shows that this difference between the
two groups is considered to be highly significant with a value of .000. Interpretation of this test means
that female board members are considered to be, on average, more occupied than the male board
members. This is contradictory with the findings of Yermack (2006) who found that female directors
were less occupied (albeit non‐significant) because they are holding less board seats. And Huse et al.
(2009) suggest that board monitoring improves on female directorship, but a high occupancy rate is
reasonably influencing the board quality in a negative way so the findings of Huse et al. (2009) are not
supported by these ANOVA outcomes. So although the variable ‘Number Of Female Board Members’
65 Test Results
has no significant associations in the Multiple Regression Models, the variable ‘Number Of Board Seats
Directors Hold’ does. The number of board seats the directors of a board have, is significantly associated
with the salary, stocks, options and total compensation components (MRM2). This complies with the
thoughts of Adams and Ferreira (2009) and Ghosh and Sirmans (2005), who link the occupancy of
directors with decreased monitoring, consequently with higher CEO compensation. Although the female
directors in the sample used for this master thesis research are considered to be significantly busier than
their male counterparts, the outcomes on the variable ‘Total Number Of Board Seats Directors Excl CEO’
can’t be credited to female participation.
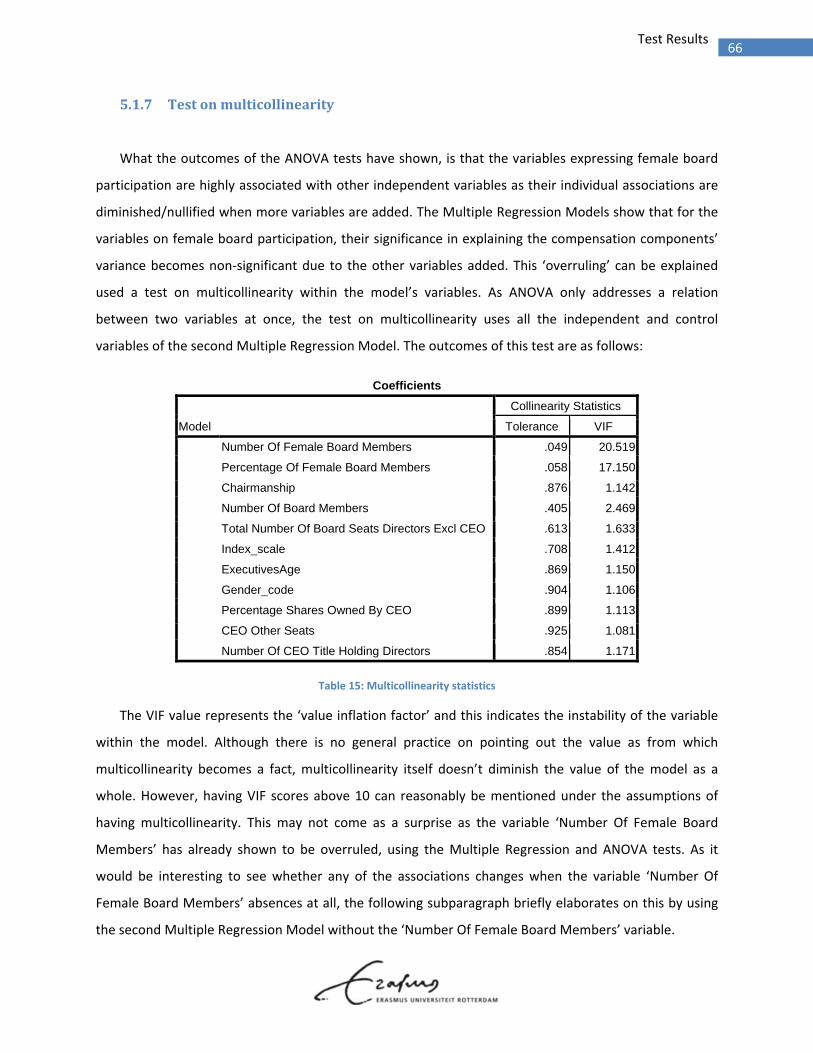
66 Test Results
5.1.7 Testonmulticollinearity
What the outcomes of the ANOVA tests have shown, is that the variables expressing female board
participation are highly associated with other independent variables as their individual associations are
diminished/nullified when more variables are added. The Multiple Regression Models show that for the
variables on female board participation, their significance in explaining the compensation components’
variance becomes non‐significant due to the other variables added. This ‘overruling’ can be explained
used a test on multicollinearity within the model’s variables. As ANOVA only addresses a relation
between two variables at once, the test on multicollinearity uses all the independent and control
variables of the second Multiple Regression Model. The outcomes of this test are as follows:
Coefficients
Model
Collinearity Statistics
Tolerance VIF
Number Of Female Board Members .049 20.519
Percentage Of Female Board Members .058 17.150
Chairmanship .876 1.142
Number Of Board Members .405 2.469
Total Number Of Board Seats Directors Excl CEO .613 1.633
Index_scale .708 1.412
ExecutivesAge .869 1.150
Gender_code .904 1.106
Percentage Shares Owned By CEO .899 1.113
CEO Other Seats .925 1.081
Number Of CEO Title Holding Directors .854 1.171
Table 15: Multicollinearity statistics
The VIF value represents the ‘value inflation factor’ and this indicates the instability of the variable
within the model. Although there is no general practice on pointing out the value as from which
multicollinearity becomes a fact, multicollinearity itself doesn’t diminish the value of the model as a
whole. However, having VIF scores above 10 can reasonably be mentioned under the assumptions of
having multicollinearity. This may not come as a surprise as the variable ‘Number Of Female Board
Members’ has already shown to be overruled, using the Multiple Regression and ANOVA tests. As it
would be interesting to see whether any of the associations changes when the variable ‘Number Of
Female Board Members’ absences at all, the following subparagraph briefly elaborates on this by using
the second Multiple Regression Model without the ‘Number Of Female Board Members’ variable.
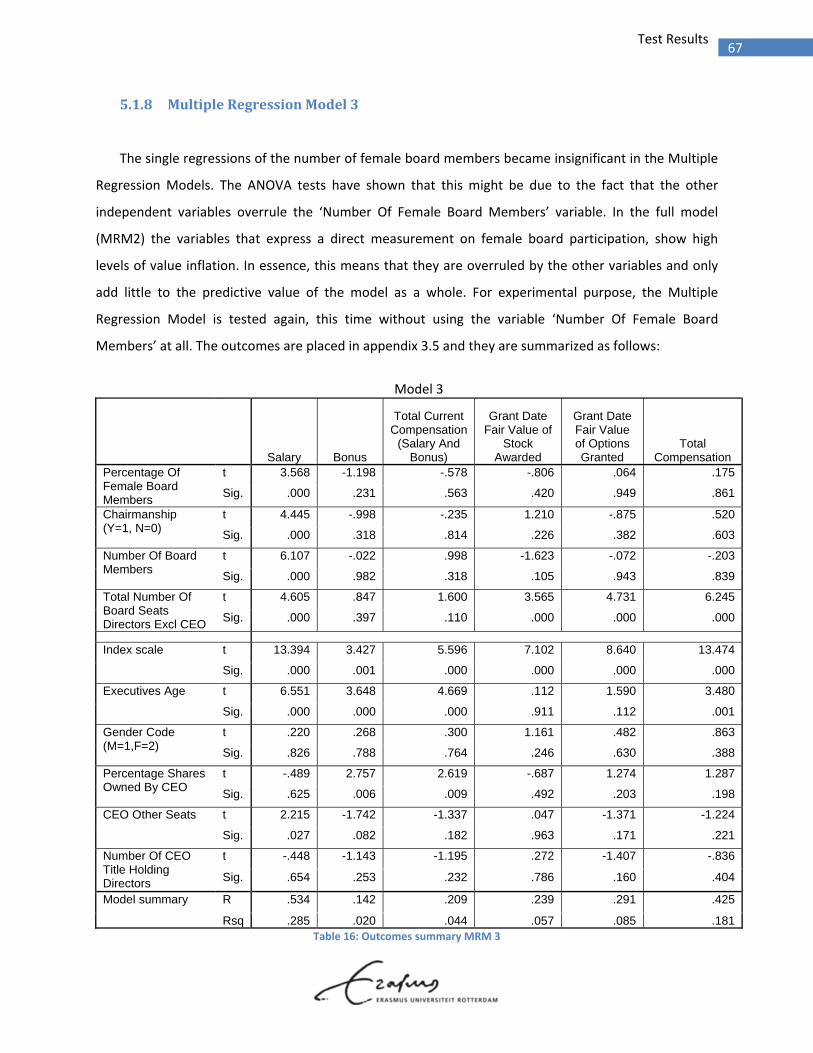
67 Test Results
5.1.8 MultipleRegressionModel3
The single regressions of the number of female board members became insignificant in the Multiple
Regression Models. The ANOVA tests have shown that this might be due to the fact that the other
independent variables overrule the ‘Number Of Female Board Members’ variable. In the full model
(MRM2) the variables that express a direct measurement on female board participation, show high
levels of value inflation. In essence, this means that they are overruled by the other variables and only
add little to the predictive value of the model as a whole. For experimental purpose, the Multiple
Regression Model is tested again, this time without using the variable ‘Number Of Female Board
Members’ at all. The outcomes are placed in appendix 3.5 and they are summarized as follows:
Model 3
Salary Bonus
Total Current Compensation
(Salary And Bonus)
Grant Date Fair Value of
Stock Awarded
Grant Date Fair Value of Options Granted
Total Compensation
Percentage Of Female Board Members
t 3.568 -1.198 -.578 -.806 .064 .175
Sig. .000 .231 .563 .420 .949 .861
Chairmanship (Y=1, N=0)
t 4.445 -.998 -.235 1.210 -.875 .520
Sig. .000 .318 .814 .226 .382 .603
Number Of Board Members
t 6.107 -.022 .998 -1.623 -.072 -.203
Sig. .000 .982 .318 .105 .943 .839
Total Number Of Board Seats Directors Excl CEO
t 4.605 .847 1.600 3.565 4.731 6.245
Sig. .000 .397 .110 .000 .000 .000
Index scale t 13.394 3.427 5.596 7.102 8.640 13.474
Sig. .000 .001 .000 .000 .000 .000
Executives Age t 6.551 3.648 4.669 .112 1.590 3.480
Sig. .000 .000 .000 .911 .112 .001
Gender Code (M=1,F=2)
t .220 .268 .300 1.161 .482 .863
Sig. .826 .788 .764 .246 .630 .388
Percentage Shares Owned By CEO
t -.489 2.757 2.619 -.687 1.274 1.287
Sig. .625 .006 .009 .492 .203 .198
CEO Other Seats t 2.215 -1.742 -1.337 .047 -1.371 -1.224
Sig. .027 .082 .182 .963 .171 .221
Number Of CEO Title Holding Directors
t -.448 -1.143 -1.195 .272 -1.407 -.836
Sig. .654 .253 .232 .786 .160 .404
Model summary R .534 .142 .209 .239 .291 .425
Rsq .285 .020 .044 .057 .085 .181Table 16: Outcomes summary MRM 3
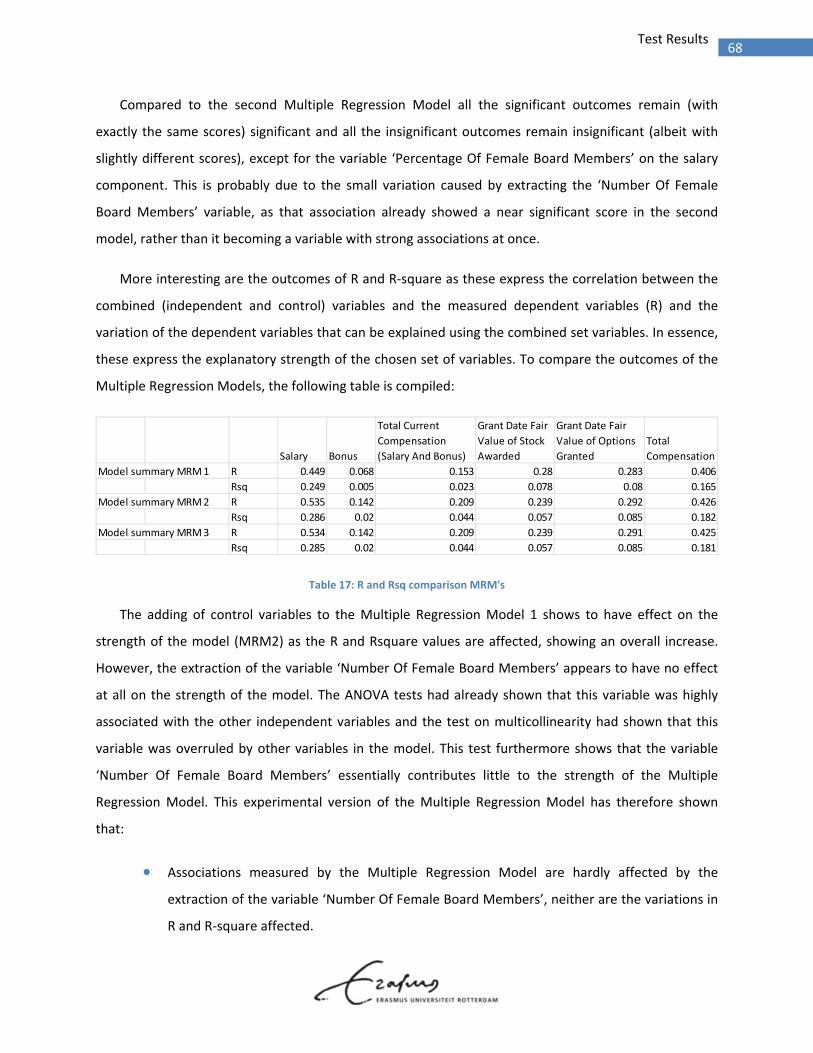
68 Test Results
Compared to the second Multiple Regression Model all the significant outcomes remain (with
exactly the same scores) significant and all the insignificant outcomes remain insignificant (albeit with
slightly different scores), except for the variable ‘Percentage Of Female Board Members’ on the salary
component. This is probably due to the small variation caused by extracting the ‘Number Of Female
Board Members’ variable, as that association already showed a near significant score in the second
model, rather than it becoming a variable with strong associations at once.
More interesting are the outcomes of R and R‐square as these express the correlation between the
combined (independent and control) variables and the measured dependent variables (R) and the
variation of the dependent variables that can be explained using the combined set variables. In essence,
these express the explanatory strength of the chosen set of variables. To compare the outcomes of the
Multiple Regression Models, the following table is compiled:
Table 17: R and Rsq comparison MRM's
The adding of control variables to the Multiple Regression Model 1 shows to have effect on the
strength of the model (MRM2) as the R and Rsquare values are affected, showing an overall increase.
However, the extraction of the variable ‘Number Of Female Board Members’ appears to have no effect
at all on the strength of the model. The ANOVA tests had already shown that this variable was highly
associated with the other independent variables and the test on multicollinearity had shown that this
variable was overruled by other variables in the model. This test furthermore shows that the variable
‘Number Of Female Board Members’ essentially contributes little to the strength of the Multiple
Regression Model. This experimental version of the Multiple Regression Model has therefore shown
that:
Associations measured by the Multiple Regression Model are hardly affected by the
extraction of the variable ‘Number Of Female Board Members’, neither are the variations in
R and R‐square affected.
Salary Bonus
Total Current
Compensation
(Salary And Bonus)
Grant Date Fair
Value of Stock
Awarded
Grant Date Fair
Value of Options
Granted
Total
Compensation
Model summary MRM 1 R 0.449 0.068 0.153 0.28 0.283 0.406
Rsq 0.249 0.005 0.023 0.078 0.08 0.165
Model summary MRM 2 R 0.535 0.142 0.209 0.239 0.292 0.426
Rsq 0.286 0.02 0.044 0.057 0.085 0.182
Model summary MRM 3 R 0.534 0.142 0.209 0.239 0.291 0.425
Rsq 0.285 0.02 0.044 0.057 0.085 0.181
69 Test Results
5.2 HypothesisValidation
To validate the hypotheses with the outcomes of the tests, the normal significance level of 5%
(α0.05) is being used. In this paragraph, the hypotheses are validated and the subsequent conclusions
are formulated in the next and final chapter. The first hypotheses addressed the direct measurements of
female representativeness in the board of directors and they are validated as follows:
H1a: The number of female board members is negatively associated with the total amount of CEO
compensation
The absolute number of female board members showed an individual correlation coefficient on
the total compensation with a score of .000, which is lower than the used α and is thus to be
considered significant. In the first Multiple Regression test, the significance slightly diminished
as the score became .024, however this is still significant. Ultimately in the second Multiple
Regression test with the control variables added, the significance level was nullified as the score
rose to .188. This leads to the conclusion that the hypothesis is not validated.
H1b: The number of female board members is negatively associated with the equity related
amount of CEO compensation
The individual correlation coefficients of the number of female boards members on stock and
option compensation are both significant with a score of .000. However in the Multiple
Regression Model 1, these scores are .142 and .163 and therefore non‐significant. In the
extended Multiple Regression Model 2, these scores rise to .737 and .372. This implies that with
expanding the regression model with more variables, the number of female board members
becomes even less significant. The overruling by other variables also became evident in the
multicollinearity test. As no significant association was found in the Multiple Regression Models,
the hypothesis is not validated.
70 Test Results
H1c: The percentage of female board members is negatively associated with the total amount of
CEO compensation
The relative representativeness of females in the board of directors is addressed with the
percentage of the board that is comprised of female directors. The individual correlation
coefficient is significant, scoring .000. In the first Multiple Regression Model the score rises to
.077 thereby showing that the other variables nullify the significance of this independent
variable. The second Multiple Regression Model furthermore shows that the score even rises
further to .221, so the explanatory value of this variable in the context of a model using several
other (control) variables, quickly diminishes. The score in the third Multiple Regression Model
even rises to .861. The test on multicollinearity shows that this variable is also overruled by
other variables in the model. With these scores, this hypothesis is considered not validated.
H1d: The percentage of female board members is negatively associated with the equity related
amount of CEO compensation
Like many variables, the percentage of female board members variable shows highly significant
levels on the stock and option compensation components in the singular regression model.
However, these individual correlation coefficients rarely hold their significant level when more
variables are added to the model. The same applies for this variable on the equity related
compensation components as individual coefficients rise from .000/.000 to .204/.244 in the first
Multiple Regression Model and to .591/.399 in the second Multiple Regression Model to
.420/.949 in the third Multiple Regression Model. This hypothesis therefore also is not
validated.
None of the direct measurements on the representation of females in the Board of Directors
showed significant outcomes on the equity related nor total compensation components. The absolute as
well as the relative representation show significant individual correlation coefficients on several
compensation components, but none of those hold stand when more independent variables are added.
And they remain insignificant when the control variables are added, for the total and equity related
compensation, but also for the total current compensation and salary and bonus individually.
71 Test Results
The measurements on female representation couldn’t validate an association with CEO
compensation components. As there are other board characteristics that underlie the assumptions on
female board representation influencing CEO compensation, the following hypotheses were taken into
account:
H2a: The number of female board members is positively associated with board size
Although this hypothesis seems to have great similarity with hypotheses H1c/H1d, the approach
is considered on a different base. As theory mentions the phenomena of tokenism, an ANOVA
test was performed to analyse whether having one or more female on board is associated with a
bigger board. The results of this ANOVA are presented in paragraph 5.1.4 and the outcome was
significant with a score of .000. This means that without knowledge of the total board size, one
can predict the interval of group mean with 95% confidence by knowing how many female
directors there are. This result would implicate that some sort of discrimination occurs when
selecting directors, as it is very unlikely to have a board in which males don’t dominate. And
having several female directors seems a large board characteristic exclusive. This hypothesis is
therefore validated.
H2b: Board size is positively associated with the amount of CEO compensation
With the H2a hypothesis validated, a relation between board size and female
representativeness is accepted. Subsequently the relation of board size and CEO compensation
is considered. The total number of board members shows significant individual coefficients on
all compensation components, however in the first Multiple Regression Model these only hold
for salary with a highly significant score of .000 and for the current compensation with a score of
.010. Within the second Multiple Regression Model the significance on the current
compensation is nullified, however the significance on salary remains .000. This association is
therefore validated for that specific compensation component. However, on total compensation
the variable ‘Board Size’ doesn’t show significance and the hypothesis is therefore not
validated.
72 Test Results
Another association that has been taken into account is a possible outcome of the social dynamics.
Prior literature indicates that female directors are likely to conduct more monitoring activities. And CEO
chairmanship has proven to be a variable significantly associated with CEO compensation. The
association between the presence of female directors and CEO chairmanship could be helpful in gaining
insight in the social dynamics influencing the payment setting and monitoring process.
H3a: Boards where the CEO is chairman have fewer female directors than boards where the CEO
isn’t chairman
To assess whether an association between the two variables exists, an ANOVA was performed to
analyse whether boards where CEO holds chairman position have considerably less female
directors. Outcomes of this test were presented in paragraph 5.1.2. With a 95% confidence
interval, the boards in which the CEO is not chairman have on average 1.03 to 1.12 female
directors. Boards where the CEO is chairman show to have between 1.18 and 1.28 female
directors on average. This difference in means is significant with a score of .000 in the ANOVA
test. Using the theoretical assumptions on increased monitoring activities due to female
directors and the agency theory on the self‐interest driven motives of the CEO, a negative
relation was expected. Instead the relation is positively significant, resulting in the conclusion of
the hypothesis being not validated.
H3b: Chairmanship of the CEO is positively associated with the amount of compensation
With hypothesis H3a not validated and the ANOVA showing a significant positive relation
between female representativeness in the board and CEO chairmanship, the subsequent check
is whether CEO chairmanship associates with compensation amounts. Again the individual
correlations show some significant scores, but previous hypothesis validation has shown that
these rarely hold stand in the multiple regression models. In the first Multiple Regression Model
the CEO chairmanship variable remains significant on salary, total current and total
compensation with scores of .000, .001 and .000. In the second Multiple Regression Model these
seemingly strong scores hold only for the salary component with .000 as scores rise to .824 for
total current and .630 for total compensation. This hypothesis is therefore not validated.
73 Test Results
Prior literature (Yermack, 2006) predicts that female directors are less busy, holding less board
seats. This fits the assumption that female directors are better monitors (Adams & Ferreira, 2009) as
they’re less likely to divide their concentration and efforts. Consequently this could lead to an alteration
of board quality and thereby CEO compensation. To assess this assumed female directors’ influence, the
following hypotheses were tested.
H4a: Female directors hold a lower number of other board seats than male directors
The first part of this analysis consists of an ANOVA test to test whether the difference in the
average board seats a director holds, is significant. The outcomes of this test were presented in
paragraph 5.1.3. The 4588 female directors in this thesis’ sample shown to have significantly
more board seats per person than their 32830 male counterparts. This outcome is contradictory
with current literature and this hypothesis is therefore not validated.
H4b: The number of other board seats by directors is positively associated with the amount of CEO
compensation
With the hypothesis H4a considered not validated and the ANOVA test showing that females
are, on average, busier than men, this hypothesis addresses the relation between occupancy
rates and CEO compensation. Again, looking at the individual correlation coefficients, the results
are highly significant on all compensation components. More interesting is that all these scores
remain significant in the first Multiple Regression Model, which is unique compared to the
previous tested independent variables. Moreover, when adding the control variables in the
second Multiple Regression Model, the components Salary, Stock, Option and Total
compensation still remain highly significant with all scores of .000! This indicates that this
variable is a strong influence in the payment setting process. This hypothesis is therefore
validated.
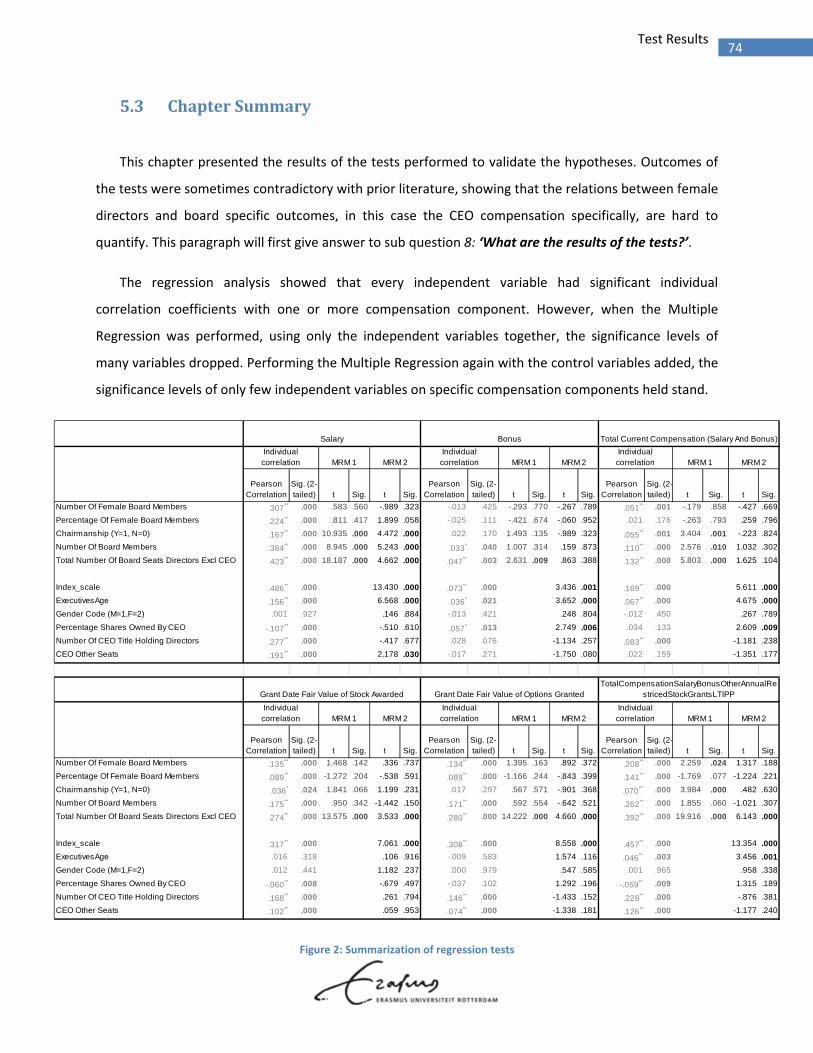
74 Test Results
5.3 ChapterSummary
This chapter presented the results of the tests performed to validate the hypotheses. Outcomes of
the tests were sometimes contradictory with prior literature, showing that the relations between female
directors and board specific outcomes, in this case the CEO compensation specifically, are hard to
quantify. This paragraph will first give answer to sub question 8: ‘What are the results of the tests?’.
The regression analysis showed that every independent variable had significant individual
correlation coefficients with one or more compensation component. However, when the Multiple
Regression was performed, using only the independent variables together, the significance levels of
many variables dropped. Performing the Multiple Regression again with the control variables added, the
significance levels of only few independent variables on specific compensation components held stand.
Figure 2: Summarization of regression tests
Pearson Correlation
Sig. (2-tailed) t Sig. t Sig.
Pearson Correlation
Sig. (2-tailed) t Sig. t Sig.
Pearson Correlation
Sig. (2-tailed) t Sig. t Sig.
Number Of Female Board Members .307** .000 .583 .560 -.989 .323 -.013 .425 -.293 .770 -.267 .789 .051** .001 -.179 .858 -.427 .669
Percentage Of Female Board Members .224** .000 .811 .417 1.899 .058 -.025 .111 -.421 .674 -.060 .952 .021 .176 -.263 .793 .259 .796
Chairmanship (Y=1, N=0) .167** .000 10.935 .000 4.472 .000 .022 .170 1.493 .135 -.989 .323 .055** .001 3.404 .001 -.223 .824
Number Of Board Members .384** .000 8.945 .000 5.243 .000 .033* .040 1.007 .314 .159 .873 .110** .000 2.576 .010 1.032 .302
Total Number Of Board Seats Directors Excl CEO .423** .000 18.187 .000 4.662 .000 .047** .003 2.631 .009 .863 .388 .132** .000 5.803 .000 1.625 .104
Index_scale .486** .000 13.430 .000 .073** .000 3.436 .001 .169** .000 5.611 .000
ExecutivesAge .156** .000 6.568 .000 .036* .021 3.652 .000 .067** .000 4.675 .000
Gender Code (M=1,F=2) .001 .927 .146 .884 -.013 .421 .248 .804 -.012 .450 .267 .789
Percentage Shares Owned By CEO -.107** .000 -.510 .610 .057* .013 2.749 .006 .034 .133 2.609 .009
Number Of CEO Title Holding Directors .277** .000 -.417 .677 .028 .076 -1.134 .257 .083** .000 -1.181 .238
CEO Other Seats .191** .000 2.178 .030 -.017 .271 -1.750 .080 .022 .159 -1.351 .177
Pearson Correlation
Sig. (2-tailed) t Sig. t Sig.
Pearson Correlation
Sig. (2-tailed) t Sig. t Sig.
Pearson Correlation
Sig. (2-tailed) t Sig. t Sig.
Number Of Female Board Members .135** .000 1.468 .142 .336 .737 .134** .000 1.395 .163 .892 .372 .208** .000 2.259 .024 1.317 .188
Percentage Of Female Board Members .089** .000 -1.272 .204 -.538 .591 .089** .000 -1.166 .244 -.843 .399 .141** .000 -1.769 .077 -1.224 .221
Chairmanship (Y=1, N=0) .036* .024 1.841 .066 1.199 .231 .017 .297 .567 .571 -.901 .368 .070** .000 3.984 .000 .482 .630
Number Of Board Members .175** .000 .950 .342 -1.442 .150 .171** .000 .592 .554 -.642 .521 .262** .000 1.855 .060 -1.021 .307
Total Number Of Board Seats Directors Excl CEO .274** .000 13.575 .000 3.533 .000 .280** .000 14.222 .000 4.660 .000 .392** .000 19.916 .000 6.143 .000
Index_scale .317** .000 7.061 .000 .308** .000 8.558 .000 .457** .000 13.354 .000
ExecutivesAge .016 .318 .106 .916 -.009 .583 1.574 .116 .046** .003 3.456 .001
Gender Code (M=1,F=2) .012 .441 1.182 .237 .000 .979 .547 .585 .001 .965 .958 .338
Percentage Shares Owned By CEO -.060** .008 -.679 .497 -.037 .102 1.292 .196 -.059** .009 1.315 .189
Number Of CEO Title Holding Directors .168** .000 .261 .794 .146** .000 -1.433 .152 .228** .000 -.876 .381
CEO Other Seats .102** .000 .059 .953 .074** .000 -1.338 .181 .126** .000 -1.177 .240
MRM 2
Salary
MRM 1
Bonus
Individual correlation MRM 2
Individual correlation
Individual correlation
MRM 1 MRM 2Individual correlation
MRM 1 MRM 2
Grant Date Fair Value of Stock Awarded
MRM 1
Grant Date Fair Value of Options Granted
MRM 1 MRM 2
TotalCompensationSalaryBonusOtherAnnualRestricedStockGrantsLTIPP
MRM 2
Total Current Compensation (Salary And Bonus)
Individual correlation
Individual correlation MRM 1
75 Test Results
With the 5 independent variables, the variance of the total compensation could be predicted for
16.5%. Adding the control variables strengthens the model by increasing the R‐square, meaning that the
set of independent and control variables together, then predict 18.2% of the variance in total
compensation. The predictive value of the model is greatest for the salary component, with 24.9% in the
first Multiple Regression Model and an increase to 28.6% in the second Multiple Regression Model. The
figure above shows that the salary component also has the most significant outcomes of the variables
and is for 53.5% associated with the set of variables in the second Multiple Regression Model. What the
figure furthermore quickly shows, is that the 5 independent variables which are (indirectly) associated
with female directorship, have less significant outcomes in the regression models than the control
variables.
The independent variables ‘Board Size’, ‘Chairmanship’ and ‘Other seats’ and their associations with
female directors were furthermore tested using ANOVA tests. The first ANOVA showed that the
presence of female directors is significantly associated with the size of the board. This implies that
having a second, third or fourth female director is an exclusive large board feature. This could imply that
the female directors are considered a token and that their capacities aren’t fully exploited, thereby
nullifying the possibilities diversity could bring. This would imply that the chances for a female director
of making it to the board associate with the size of the board and the number of female directors
already on board. Such discrimination might not be beneficial for the stakeholders, apart from it being
obviously unethical.
The second ANOVA furthermore showed boards are likely to have more female directors when the
CEO is chairman of the board. Considering the prior literature on increased monitoring activities when
females enter the board, this seems contradictory with the agency theory in which is assumed that the
CEO is driven by self‐interest and therefore would dislike increased monitoring. Causality can’t be
proven with the statistics, so whether a CEO chairman enhances the chances for females to enter the
board or whether female directors enhance CEO’s change of becoming chairman, remains questionable.
The third ANOVA focussed on a more detailed director characteristic. As female directors
presumably are better monitors according to prior literature, it sounds plausible that this is due to their
lower occupancy rate. This implies that they’re holding less board seats on other companies. However,
what the ANOVA on this thesis’ sample showed, was that females were, on average, busier than men.
This was also in contradiction with prior literature, as prior research found that females were less
occupied.
76 Test Results
What the ANOVA tests have shown, is that the independent variables are associated with each
other. This could clarify why the significant associations in the single regression test, become
insignificant in the Multiple Regression Models. The multicollinearity test on MRM2 showed that the
variables ‘Number Of Female Board Members’ as well as the variable ‘Percentage Of Female Board
Members’ had high VIF scores (20.519 and 17.150 resp.). This indicates that within the Multiple
Regression Model, the other variables are accountable for most of the associations and that the
variables ‘Number Of Female Board Members’ and ‘Percentage Of Female Board Members’ are
overruled by the other independent and control variables.
The experimental Multiple Regression Model in which the variable ‘Number Of Female Board
Members’ was taken out completely (MRM3), showed that the model still generated associations of
equal levels like it did within the full model (MRM2). This showed the relative non‐importance of the
variable ‘Number Of Female Board Members’ in the model, suggesting that the direct measurement on
female board participation is unlikely to have robust associations with any compensation components.
Using the results of the ANOVA tests, multicollinearity test and the outcomes of the three Multiple
Regression Models, sub question 9: ‘Which hypotheses are validated?’ can be answered. The
hypotheses are validated as follows:
H1a: The number of female board members is negatively associated with the total
amount of CEO compensation
Not
validated
H1b: The number of female board members is negatively associated with the equity
related amount of CEO compensation
Not
validated
H1c: The percentage of female board members is negatively associated with the total
amount of CEO compensation
Not
validated
H1d: The percentage of female board members is negatively associated with the equity
related amount of CEO compensation
Not
validated
H2a: The number of female board members is positively associated with board size Validated
H2b: Board size is positively associated with the amount of CEO compensation Not
validated
77 Test Results
H3a: Boards where the CEO is chairman have fewer female directors than boards
where the CEO
Not
validated
H3b: Chairmanship of the CEO is positively associated with the amount of
compensation
Not
validated
H4a: Female directors hold a lower number of other board seats than male directors Not
validated
H4b: The number of other board seats by directors is positively associated with the
amount of CEO
Validated
With none of the direct measurements of female influence in the Board of Directors showing
consistent significant outcomes on the compensation components, all 4 hypotheses of H1 are
considered not validated. And although the ANOVA test showed a significant result to justify H2a, the
board size itself only significantly relates to the compensation component of ‘Salary’ and not for the
total compensation, thus H2b wasn’t validated. The association of females with CEO chairmanship was
opposing the expectations and turned out significantly positive when testing for hypothesis H3a.
Furthermore, chairmanship of the CEO only showed a consistent significant outcome for the salary
component; therefore H3b was also not validated. Another result that differed from the expectations
based on prior literature was that female directors are busier than their male counterparts. This means
that H4a is not validated. However, the number of boards seats directors hold is positively related to the
salary, equity related components and total compensation. Hypothesis H4b is therefore validated.
78 Analysis and Conclusion
6 AnalysisandConclusion
With the outcomes of the tests and the validation of the hypotheses in the previous chapter, this
chapter presents the analysis of and conclusion based on those results. The limitations that restrict this
thesis’ research are mentioned in paragraph 6.2, followed by the contributions of this thesis in
paragraph 6.3 and the subsequent chapter summary in paragraph 6.4 in which the remaining sub
questions are answered. After the answering of the last sub questions, the thesis is finalized by
answering the main research question.
6.1 Outcomes
This thesis’ research has shown that there were no significant outcomes of the direct measurements
of female board member participation and the various compensation components. Both the absolute
number as well as the percentage of female board members, showed insignificant outcomes in the
Multiple Regression Model with all variables added. This is contradictory with previous research such as
Adams & Ferreira (2009), who mentioned that within gender diverse Board of Directors, the monitoring
capabilities are higher and the “CEO turnover is more sensitive to stock performance”. The findings of
Adams & Ferreira (2009) comply with the social theories that suggest that females are more risk adverse
(Gill and Prowse, 2010) and make better informed decisions (Ertac and Szentes, 2011). Although Adams
& Ferreira (2009) also use the US market with the S&P1500 listed companies and a regression model,
the outcomes of this master thesis aren’t similar. This might be due to recent developments in
legislation and/or events such as the credit crunch as Adams and Ferreira (2009) use 1996‐2003 as their
sample period, whereas in this master thesis research more recent years are used. Another explanation
could be the difference in the test models as the Multiple Regression Model for this research contains
more variables to account for firm specific and gender related characteristics. Based on the prior
literature and the outcomes of this master thesis research, it remains questionable whether female
representation in the Board of Directors increases the monitoring qualities of the board, thereby
influencing the equity related part of a CEO’s compensation. The Multiple Regression Model in this
thesis found insignificant outcomes at all the compensation components, equity related as well as non‐
equity related.
79 Analysis and Conclusion
The ANOVA tests on the association between female representativeness and the other independent
variables furthermore showed that there is a significant association between the number of female
directors and the total board size. Having no female director on board is associated with small boards
that are below‐sample‐average in their board size. One female director is an average board size feature.
However, having several women on board is a large board size characteristic. This possibly explains the
insignificant relation between female board participation and CEO compensation components as the
dominantly male boards are unlikely to allow for much female influences. This possible effect of
discrimination and the diminished effects of diversity was mentioned in the prior literature by Becker
(1993). It complies with the phenomena of tokenism, as mentioned by Farrell and Hersch (2005) and
Wang and Clift (2009). The female presence might not be a board quality influencing factor as they
would likely be overruled by the established dominant (male) culture. And the selection of board
candidates might be more driven by meeting social demands, rather than increasing and exploiting the
actual diversity. The independent variable of ‘board size’ itself (as expressed by the total number of
board members) shows only a significant result on the compensation component ‘salary’ and has
insignificant outcomes on the other compensation components as well as on the total compensation a
CEO receives. So although larger boards are likely to have more women on board, the board size itself
seems to have no effect on the total compensation a CEO receives.
One of the other independent variables that was taken into account is ‘CEO Chairmanship’, which
showed to be significantly associated with a larger number of female representativeness. With prior
literature like Adams and Ferreira (2009) and Huse et al. (2009), who found an increase in the
monitoring qualities of boards when females participate, this outcome was unexpected. As agency
theory predicts that a CEO will be driven by self‐interest, he or she would therefore dislike having female
members on board as they presumably increase the monitoring quality, thereby making it harder for the
CEO to capitalize on the governance mechanisms and enhance personal gain. The findings of Campbell &
Minguez‐Vera (2010) support this thought derived from the agency theory, as they found a significant
negative coefficient between CEO chairmanship and the estimated influence of female board members
on firm value. Explanation for the difference in outcome compared to this master thesis research might
be the time period used and the area of research as Campbell & Minguez‐Vera (2010) used the country
of Spain as their research area with 1995‐2000 as timespan. Besides social and/or economical historical
events, the cultural differences might therefore also play a role in clarifying the differences in outcomes
between this master thesis research and that of Cambell & Minguez‐Vera (2010).
80 Analysis and Conclusion
Furthermore, within the model used for this master thesis research, the independent variable ‘CEO
Chairmanship’ itself only showed a significant association with the ‘salary’ compensation component
and turns out insignificant on all other compensation measures. This is also contradictory with previous
literature as researchers like Cyert et al. (2002) found a significant result on the equity related
compensation components when the CEO holds chairman position. The findings of Cyert et al. (2002)
therefore seem to support the self‐driven interest assumption of the agency theory. Although Cyert et
al. (2002) use the same area of research (U.S. listed companies) and also test for correlations between
CEO compensation components and CEO/board characteristics, their timespan is 1992‐1993. As this
master thesis research has a more recent timespan, this might indicate that the governance mechanisms
have improved over time, possibly resulting in an impediment for a CEO to exploit his/hers chairman
position for personal gain.
Another independent variable used in the Multiple Regression Model was that of board seats held
by directors (excl. CEO). With prior literature (Yermack, 2006) mentioning that female directors are likely
to be less busy, thereby enhancing board quality, this turned out to be the opposite for the sample used
in the Multiple Regression Model. As the ANOVA test showed that the female directors were, on
average, busier than the male directors, meaning that a female director holds more board seats than a
male director. And holding more board seats at other companies would mean that the dedication and
attention can’t be optimal as it has to be divided, therefore board quality would diminish. This
difference in occupancy between male and female directors might indicate that female directors are
more scarce than male directors. Or perhaps the Board of Directors react to the societal pressure of
having more women in executive positions, giving the female directors an advantage in the selection
process for new board candidates. This could indicate that holding board seats at several companies is
the outcome of Board of Directors’ preferences and that positions are not gained solely on individual
qualifications, but rather on social expectations and relations. Whether the director is too busy when
holding multiple board seats to monitor properly or his/her independency is compromised due to the
social relations, the number of board seats held by directors is associated with higher CEO
compensation. And the Multiple Regression Model shows that the independent variable ‘Board Seats
Held By Directors excl. CEO’ had significant outcomes on the salary, stock, option and total
compensation components. Making it the most significantly associated independent variable with the
compensation components used in the model. Although prior literature suggests that female directors
are less occupied than their male counterparts, they appear more occupied in the sample used and
occupancy relates significantly to several CEO compensation components.
81 Analysis and Conclusion
Within the Multiple Regression Mode, the control variables showed more significant outcomes than
the independent variables, with ‘Company Size’ as the most significant of all. This variable showed
strong associations with all compensation components, which is compliant with the findings of Cyert et
al. (2002), who found the same with their Multiple Regression Model that addressed board, company
and CEO specific characteristics. The relation between company size and CEO compensation seems
explicable as the equity related compensation components are likely to be higher with S&P500 listed
companies than with SmallCap companies, due to company value, turnover and profit. Another control
variable that showed significant associations was that of CEO’s age. This turned out to be significant on
the current compensation components of salary and bonus, but also on the total compensation he/she
receives.
Although some of the independent and control variables in the model showed significant
associations with one or more compensation components, the complexity of the compensation setting
process is shown by the aggregated predictive value of the variables used in the Multiple Regression
Model. Using the 5 independent and 6 control variables combined, only 18.2% of the total
compensation’s variance can be explained. Consequently, there are likely to be other factors that
influence the compensation setting process more than the defined ones in this master thesis’ research.
What this research has shown, is that the direct relation between female representativeness and
CEO compensation is insignificant for the time period 2007‐2009 of U.S. listed S&P1500 companies.
Direct measurements of female participation showed none significant result in the Multiple Regression
Model. Other independent variables associated with female presentation did show some significant
results. Chairmanship, board size and board seats directors (excl. CEO) hold, are associated with female
directorship and these three variables showed significant results on the salary component. The
occupancy of the board members furthermore showed to be significant on the equity related
components and total compensation as well. Indirectly this could associate female directorship with
increased CEO compensation. However, this also shows that the effects of female board members on
CEO compensation components are hard to measure.
With insignificant results on the direct measures of female participation and contradictory (with
prior literature) associations with CEO chairmanship and director occupancy, the outcomes seem to
support the view that female directors aren’t affecting the CEO’s compensation setting process to the
extent of which prior literature suggests. Social theory suggests that diversity could increase
performance, however discrimination could obstruct this. It seems then, that discrimination could occur
82 Analysis and Conclusion
in the non‐transparent process of selecting board members. Perhaps female directors are chosen
because the (dominantly male) Board of Directors only want to comply with industry/society ethical
codes, rather than exploit advantages of increased gender diversity. This would support the beliefs of
tokenism, suggesting that female directors are part of the board only because the dominant culture
(men) allows them to. This in turn would mean that the females that are most likely to make it to the
board, are those who comply the most with the men (as the men are the established dominant culture).
Therefore, effects of a (new) female board member are not likely to result in significant outcomes of
board performance figures. Whether legislation could improve on the position of female board
members remains questionable. Perhaps introducing legislation in the U.S. that dictates a minimum
percentage of female board directors like Norway did in 2003, could make the effects of increased
gender diversity more visible. However, this in turn would also lead to discrimination in the board
candidate selection, making it a dubious approach as well.
83 Analysis and Conclusion
6.2 Limitations
As mentioned in chapter 3, numerous factors come in to play when setting the CEO pay. Some of
them are plausible but hard to quantify, whereas the effect of some are disputable yet can’t be
discarded as data is non‐conclusive. This would imply that within the conclusions based on the
outcomes of the tests using the selected data, a bias of some kind is inevitable. Literature shows that
there are several external factors and CEO characteristics that influence the height of CEO
compensation. Some of these were not incorporated in the research model of this thesis due to
attainability problems and are therefore mentioned as limitations:
…firm risk is strongly positively related to both the incentive and non‐incentive components
(Cyert et al., 2002)
…CEO cash compensation (in terms of salary and discretionary bonuses) is higher if the board is
represented by a greater portion of outside directors (Cyert et al., 2002)
…a CEO’s track record and established reputation associates strongly with the pay the CEO
receives in a new position (Perel, 2003)
… shows that externally hired CEO’s get paid more than the internal hires.. (Perel, 2003)
… director’s age positively relates to CEO compensation (Ghosh and Sirmans, 2005)
The factors mentioned above are specific for the measurement of CEO compensation, however this
type of study has some limitations in general. As Rose (2007) mentions that “quantitative studies may
experience severe difficulties in capturing board members interpersonal relations, as well as the complex
nature of the decision process on corporate boards”. The variables ‘CEO chairmanship’ and ‘Number of
board seats held by directors’ used in this thesis are merely indicators for measuring the social
complexity. The actual effect of interpersonal relations, the adapting of executives to the establishment
and discrimination effects are hard to measure, as only indicators are measurable. And not only do the
external perspectives influence the way directors are appointed, but the individual perspectives within
the social environment are decisive factors as well. Huse et al. (2009) show that “women perceived
themselves to have lower esteem than the male respondent perceived for the women directors”. This
could mean that the theoretical outcomes of increased gender diversity are restrained from the start as
female directors might hold back their full capacity in order not to disturb the group dynamics.
Individual perspectives therefore form another hard to quantify influencing factor.
84 Analysis and Conclusion
Furthermore, a limitation of quantitative research using regression models is that causality is hard to
determine. As associations are measured, it is sometimes unclear whether an increase in the
independent factor, results in an increase in the dependent factor. With the assumptions based on prior
literature, which sometimes show contradicting results, the causal relation can only be presumed.
However, results may still show associations simply due to coincidence, which remains an
unaccountable factor is this kind of research.
How individual perspectives, established culture, external pressure and company profile influence
the selection of board candidates and to what extent they allow for heterogeneity, is a question that
remains unsolved with this master thesis. Furthermore, as mentioned in the introduction, the call for
more diversity has increased over the last couple of years and gained more attention. This could mean
that acceptance of increased gender diversity is not fully realistic in this time period yet and that
relations between female directorship and measurable outputs on board performances are too soon to
be significantly measurable.
85 Analysis and Conclusion
6.3 Contributionandrecommendations
By investigating the relation between gender diversity in the Board of Directors and CEO
compensation, this master thesis contributes several findings to the discussion on CEO compensation
and board diversity. Firstly, the findings of the ANOVA on female directorship and board size showed
that female representativeness in the board is highly associated with the board size. It complies with the
beliefs of tokenism, suggesting that the women are part of the board due to an external pressure for
more gender diversity and that their inputs are discarded by the dominant and established board
members. The other ANOVA tests however, showed results that were contradictory with prior literature
and stress the need for more research on the topic of female board participation and the subsequent
effects on board outputs.
Research with regards to CEO chairmanship and directors could contribute to the discussion on
whether directors are enabled to make decision making processes adequately as their task description
would prescribe them to do. This type of research could further be narrowed to investigating the
position of female board members specifically as research on gender diversity within the Board of
Directors is a lesser investigated subject than ethnic diversity within a Board of Directors for example. It
might also be interesting to investigate the position and effects of female board directors, using other
countries as the research area as cultural differences are likely to affect the position and chances of
females making it to the Board of Directors. Furthermore, by investigating the relations between female
representativeness within the board and outcomes on board performance figures in an array of
different countries, the differences between an one‐tier and two‐tier system can then perhaps become
more visible. This would be interesting for the Netherlands, as upcoming new legislation would allow
companies to have an one‐tier system, opposed to the two‐tier that is the current standard.
As the call for increased gender diversity has gained recent attention and urgency, governments of
Norway (2003), Spain (2007) and Finland (2008) implemented legislation and other countries like
Germany and the Netherlands are making propositions for new legislation whilst industries are
developing their own codes to meet social expectations. Although the discrimination effects and the
possibilities of diversity are broadly discussed in prior literature, the effects of having more females in
top level management positions is not likewise extensively researched and the current existing literature
is not quite one‐sided on the effects female directors have on board outputs and CEO compensation.
This thesis therefore contributes to this relative recent object of study by presenting quantitative test
86 Analysis and Conclusion
results, objectifying the discussion on female board participation, which could lead to a better
understanding of the possible outcomes of having legislation in place that commands a gender quota.
Future research could contribute by investigating the relation between board participation and
board related outcomes. This might give more insights that can be useful in the discussion regarding
enforced diversity within the Board of Directors. Currently the results, this master thesis included, show
varying results from significant negative to relative to significant positive associations between female
directors and board outputs. By investigating this topic further, perhaps the results can show more
resemblance, thereby contributing to the discussion on whether diversity should be enforced. It is also
interesting to see whether the participation of females in the Board of Directors increases over the
oncoming years, as this thesis has shown that the growth has declined over the past couple of years.
Furthermore, the recent years were quite turbulent in terms of capital market movements and these
might have also affected the CEO’s compensation components. Future research could perhaps find
stronger results on the relation between female directorship and CEO compensation if the capital
markets stabilize.
87 Analysis and Conclusion
6.4 ChapterSummary
This chapter gave interpretation to the outcomes of the tests results that are presented in chapter
5. Answering the remaining sub questions will lead to the answer of this master thesis’ main research
question. The first sub question to address is number 10: ‘How can these outcomes be interpreted?’. As
test results have shown that the direct measurements of female board members have no significant
outcomes on CEO compensation components in the Multiple Regression Model, this relation is
considered to be non‐existent for the sample used. The presence of female board members does
however, significantly relates to board size, CEO chairmanship and the number of board seats the
members hold outside the company for which they are part of the sample. The CEO chairmanship
variable does have a significant outcome in the Multiple Regression Model on the salary component, so
does the board size. The only independent variable that showed significant results on several
compensation components as well as on the total compensation is that of the number of board seats
directors hold. Indirectly then, these relations can be linked to female representativeness. Moreover,
these indirect relations more likely express the possibilities of tokenism. And if board size determines
the chances of a female being accepted as board member, the potential of diversity is nullified from the
start. And under the assumptions of the agency theory, a CEO holding chairman position would likely
gather board members he/she can influence. The positive association of female presence within the
board and CEO chairmanship therefore doesn’t plea for female directors adding new perspectives and
increased monitoring capabilities. Perhaps biases in the board candidate selection procedures make it
difficult for women to gain board positions, resulting in a relatively small pool of female candidates who
fit the profile, who can therefore hold several board seats as they are rare. It remains questionable then,
whether females are gaining board positions due to the additional opinions they can provide and
additional value they can create. Or whether they’re allowed on board because of external pressure and
call for greater diversity and they’re merely selected on their adaptive capabilities to comply with a
homogeneous group.
As with any research, there are some limitations in this master thesis and they’re mentioned by
answering sub question 11: ‘What limitations restrict this research?’. The first limitations are that of the
Multiple Regression Models used. As the variables of the model were derived from prior literature, the
set of independent and control variables is not exclusive. Other variables mentioned in prior literature
couldn’t be taken into account due to attainability problems or simply because they’re not measurable
88 Analysis and Conclusion
in discreet terms. Another limitation of the Multiple Regression Model is that determining causality is
subjective of assumptions based on prior literature, as the model itself can’t produce outcomes to
determine a causal relation with. However, what seems to be the most important limitation is the
complexity of the social dynamics in which board candidatures are settled and the group dynamics
within a Board of Directors that influence decision making processes. Interpersonal relationships and
their effect on measurable outputs, such as CEO compensation, are limiting factors on quantitative
research investigating such outputs.
With the outcomes of this master thesis, the discussion on mandatory gender quota in the
boardroom could be further objectified. This research has furthermore shown that the outcomes
weren’t unanimous with prior literature, which leads to sub question 12: ‘What recommendations can
be made upon conclusion?’. Future research could be beneficial for providing a more extended time
range, as the upcoming of female directorship is a recent phenomenon. Or it could clarify whether this
trend actually leads to more diversity and subsequently whether that increase in gender diversity shows
significant outcomes on board outputs. As recent years were quite turbulent due to the international
credit crunch, follow‐up research on this thesis’ subject might bring stronger results as the economy
stabilizes and measured outputs perhaps show more consistency over time.
On the conclusion of this thesis, the answering of the main research question “Is the presence of female
board members associated with the amount of CEO compensation (components and in total) of the
S&P1500 listed companies between 2007‐2009?” is as follows:
The absolute as well as the relative representation of females in the Board of Directors
of S&P1500 listed companies between 2007‐2009 was not significantly associated with
any CEO compensation component. Other variables that associate with female directors
did show some significant associations with compensation components. However, these
relations more likely showed the effects of other factors influencing decision making
processes regarding CEO pay rather than supporting the argument that gender diversity
influences CEO compensation components, by ways of increasing the board
performance.
89 Thesis summary
7 Thesissummary
This thesis investigated the relation between female directorship and the compensation
components of the CEO. Prior literature suggests an increase in monitoring quality of the Board of
Directors due to gender diversity. Increased monitoring would imply that equity related compensation,
as a tool in aligning the interests of the CEO with those of the shareholders, could diminish. However,
the effects of diversity are seemingly hard to measure as several aspects of the social dynamics aren’t
quantifiable. In theory, diversity can bring all kinds of advantages for most of the stakeholders as the
pool of talent increases and more viewpoints are taken into consideration. And ethically and morally,
perseverance of equality is considered a good thing. Unfortunately, negative effects of discrimination
might also occur, thereby possibly nullifying the advantages diversity can bring. This illustrates the
difficulty of investigating relations that are influenced by social dynamics.
By investigating the compensation components of 3.986 executive years, matching them to 37.418
director years and analysing their specific characteristics, this master thesis research lead to some
outcomes that are contradictory with prior literature. In the Multiple Regression Model, the variables
that express female directorship showed non‐significant relations with the CEO compensation
components. This is in contrary with the expectations given by prior literature (in which female
directorship equals better monitoring, thereby leading to lower equity related compensation for the
CEO). The first ANOVA test furthermore showed that the number of female directors is highly associated
with board size, which was in line with prior literature. Unexpected was the outcome of the second
ANOVA, showing that boards where the CEO holds chairman position, on average have more female
directors participating. Assuming that higher levels of gender diversity in the Board of Directors would
lead to improved board outputs (of which CEO compensation setting is one), the relation between CEO
chairman and number of female directors was assumed to show a negative relation. Instead it showed a
significant positive association. The third ANOVA also showed an outcome contradictory with prior
literature, namely the higher (then male directors) occupancy rate of female directors. In turn, the
variables ‘ Chairmanship’, ‘Number of Female Board Members’ and ‘ Total Number of Board Seats
Directors excl CEO’ all show significant associations with the CEO’s salary compensation component. The
occupancy of the directors furthermore showed significant associations with the equity related
compensation components. Indirectly then linking the female board member characteristics to the
height of the compensation components of the CEO.
90 Thesis summary
This master thesis developed some outcomes that are interesting for the diversity debate and the
possible legal enforcement of a minimum level of gender diversity, which some governments have
already implemented and others are considering. The insignificant relations in the Multiple Regression
Model between measurements of female directorship and the CEO compensation components assumed
that gender diversity in the Board of Directors hardly affects the CEO’s compensation. Whether gender
diversity does have an effect on the payment setting can’t completely be excluded based on these
outcomes alone as the effects of discrimination are hard to measure. In combination with the outcomes
of the ANOVA tests, the existence of tokenism therefore seems plausible. As making it to the Board of
Directors for a female candidate is related to the total board size (and whether there is already a female
director on board) and CEO chairmanship, this could indicate some sort of discrimination. And the
higher occupancy rate of the female directors within the sample furthermore supports the argument of
tokenism, namely that the female directors are there (partly) due to representative motives of the
Board of Directors, rather than for the need of increasing diversity and exploiting the possibly
advantages. This could explain the higher occupancy rate of female directors as their presence is desired
by company boards (due to social pressure) whilst the pool of female directors is presumably smaller
than the pool of male directors.
On conclusion then; this master thesis research has found no significant associations between
female directorship and CEO compensation components for the period 2007‐2009 for the U.S.
companies listed on the S&P1500 index.
91 References
References
Adams, R.B., Ferreira, D. (2009). Women in the boardroom and their impact on governance and
performance. Journal of Financial Economics, Vol. 94, pp. 291‐309.
Adler, N.J. (2002). Global Managers: No Longer Men Alone. The International Journal of Human Resource
Management, Vol. 13, Nr. 5, pp. 743‐760.
Becker, G.S. (1993). Nobel Lecture: The Economic Way of Looking at Behavior. The Journal of Political
Economy, Vol. 101, Nr. 3, pp. 385‐409.
Bell, L. (2005). Women‐led firms and the gender gap in top executive jobs. IZA discussion paper no. 1689.
Campbell, K., Minguez‐Vera, A. (2008). Gender diversity in the boardroom and firm financial
performance. Journal of Business Ethics, Vol. 83, No. 4, 435‐451.
Campbell, K., Minguez‐Vera, A. (2010). Female board appointments and firm valuation: short and long‐
term effects. Journal of Management and Governance, Vol. 14, No. 1, 37‐59.
Christenson, C. (1983). The Methodology of Positive Accounting. The Accounting Review, Vol. 58, No. 1,
pp. 1‐22.
Cyert, R.M., Kang, S., Kumar, P. (2002). Corporate governance, takeovers, and top‐management
compensation: theory and evidence. Management Science, Vol. 48, No. 4, 453‐469.
Du Rietz, A., Henrekson, M. (1999). Testing the Female Underperformance Hypothesis. Small Business
Economics, Vol. 14, pp. 1‐10.
Eisenhardt, K.M. (1989). Agency Theory: An Assessment and Review. The Academy of Management
Review, Vol. 14, No. 1, pp. 57‐74.
Erhardt, N.L., Werbel, J.D., Shrader, C.B. (2003). Board of director diversity and firm financial
performance. Corporate Governance: An International Review, Vol. 11, No. 2, 102‐111.
Ertac, S., Szentes, B. (2011). The Effect of Information on Gender Differences in Competitiveness:
Experimental Evidence. Koç University‐Tűsiad Economic Research Forum Working Paper Series, Working
Paper 1104.
Fahlenbrach, R. (2008). Shareholder rights, boards and CEO compensation. Review of Finance, Vol. 13,
81‐113.
92 References
Farrell, K.A., Hersch, P.L. (2005). Additions to corporate boards: the effect of gender. Journal of
Corporate Finance, Vol. 11, 85‐106.
Felo A.J. (2001). Ethics Programs, Board Involvement, and Potential Conflicts of Interest in Corporate
Governance. Journal of Business Ethics, Vol. 32, No. 3, 205‐218.
Francis, J.R., Khurana, I.K., Pereira, R. (2005). Disclosure incentives and effects on cost of capital around
the world. The Accounting Review, Vol. 80, 1125‐1162.
Frydman, C., Jenter, D. (2010). CEO compensation. Annual Review of Financial Economics, Vol. 2, 75‐102.
Gayle, G., Golan, L., Miller, R. (2010). Gender differences in executive compensation and job mobility.
Carnegie Mellon University working paper.
Ghosh, C., Sirmans, C.F. (2005). On REIT CEO compensation: does board structure matter?. The Journal
of Real Estate Finance and Economics, Vol. 30, No. 4, 397‐428.
Gill, D., Prowse, V. (2010). Gender Differences and Dynamics in Competition: The Role of Luck. IZA
Discussion Paper, No. 5022.
Harris, C.R., Jenkins, M. (2006). Gender Differences in Risk Assessment: Why do Women Take Fewer
Risks than Men? Judgment and Decision Making, Vol. 1, No. 1, pp. 48–63
Huse, M., Nielsen, S.T., Hagen, I.M. (2009). Women and employee‐elected board members, and their
contributions to board control tasks. Journal of Business Ethics, Vol. 89, 581‐597.
Kahn, T.M., Clear, F., Al‐Kaabi, A., Pezeshki, V. (2010). An exploratory study of the effects of diversity
dimensions and intervening variables on attitudes to diversity. Team Performance Management, Vol. 16,
No. 5, 289‐308.
Laux, C., Laux, V. (2009). Board committees, CEO compensation and earnings management. The
Accounting Review, Vol. 84, 869‐891.
Perel, M. (2003). An ethical perspective on CEO compensation. Journal of Business Ethics, Vol. 48, No. 4,
381‐391.
Rose, C. (2007). Does female board representation influence firm performance? The Danish evidence.
Corporate Governance: An International Review, Vol. 15, 404‐413.
Sheikholeslami, M.(2001). EVA, MVA, and CEO compensation. American Business Review; Vol. 19, 13‐17.
Sheridan, A., Milgate, G. (2005). Accessing board positions: a comparison of female and male board
members’ views. Corporate Governance: An International Review, Vol. 13, 847‐855.
Yermack, D. (2006). Board members and company value. Financial Market Portfolio Management, Vol.
20, 33‐47.
93 References
Wang, Y., Clift, B. (2009). Is there a ‘business case’ for board diversity?. Pacific Accounting Review, Vol.
21, No. 2, 88‐103.
Watts, R.L., Zimmerman, J.L. (1990). Positive Accounting Theory: A Ten Year Perspective. The Accounting
Review, Vol. 65, No. 1, pp. 131‐156.
Weber, A., Zulehner, C.(2009). Competition and Gender Prejudice: Are Discriminatory Employers
Doomed to Fail? IZA Discussion Paper, No. 4526.
Washington Post Article, published 31‐01‐2011, by Hugh Son.
http://www.washingtonpost.com/wp‐dyn/content/article/2011/01/31/AR2011013105314.html
De Pers.nl Article, published 21‐02‐2011, by Edward Deiters.
http://www.depers.nl/economie/547042/Europa‐worstelt‐met‐vrouwenquota.html
Telegraph Article, published 19‐03‐2009, by James Quinn
http://www.telegraph.co.uk/finance/financialcrisis/5018560/US‐Congress‐backs‐law‐to‐claw‐
back‐bonuses‐with‐90pc‐tax.html
De Accountant, published 1‐06‐2011, by Eumedion
http://www.accountant.nl/Accountant/Nieuws/Eerste+Kamer+neemt+wetsvoorstel+bestuur+e
n+toezicht.aspx
Standard & Poors factsheet of the S&P1500 composite index.
http://www.standardandpoors.com/indices/sp‐composite‐1500

94 Appendix
Appendix
1 Newspapercut‐outs
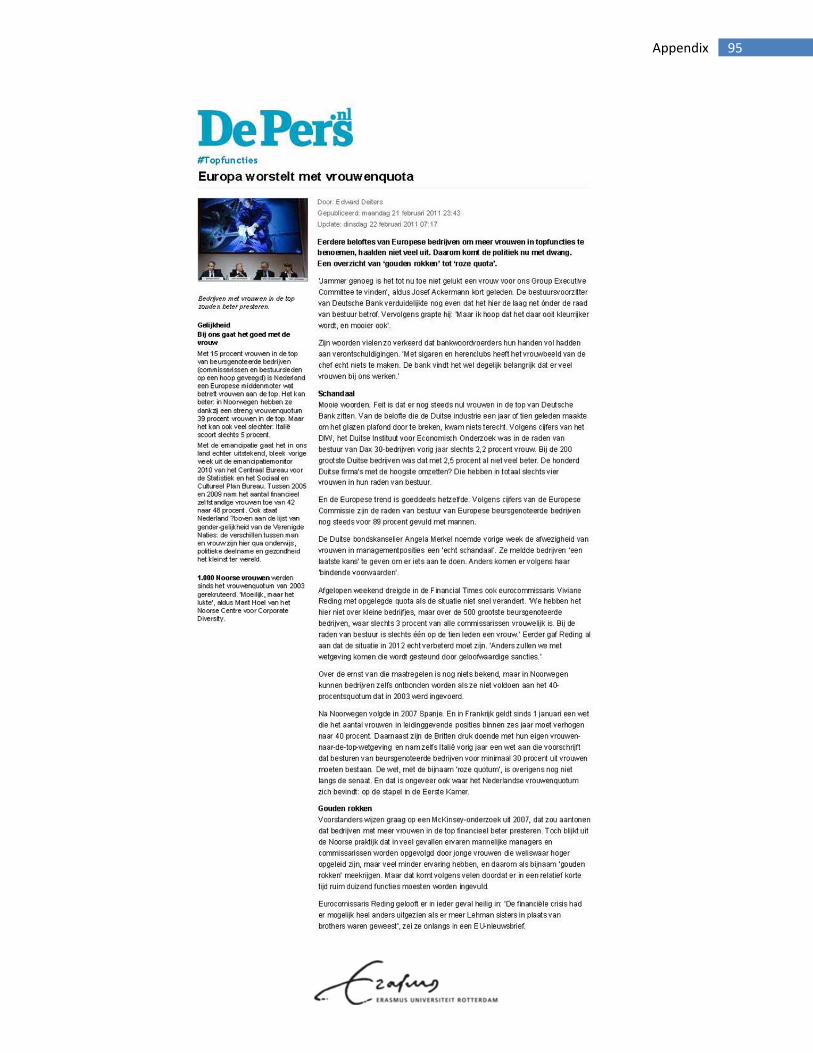
95 Appendix
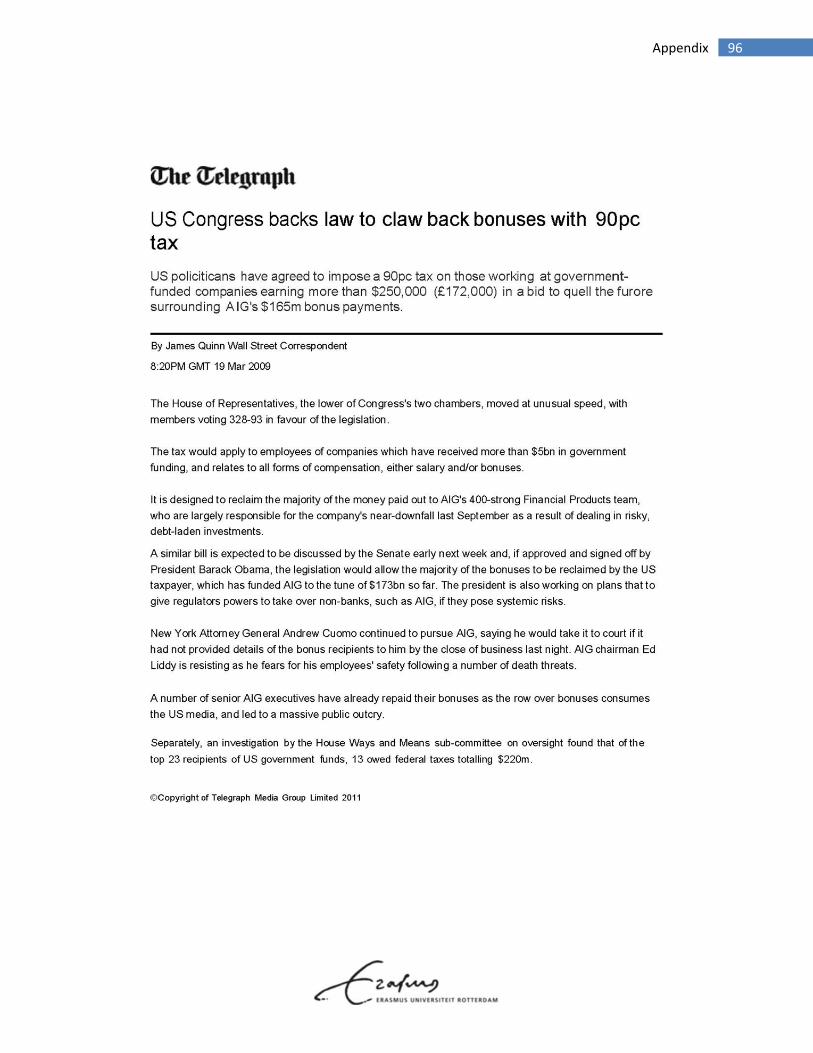
96 Appendix
97 Appendix
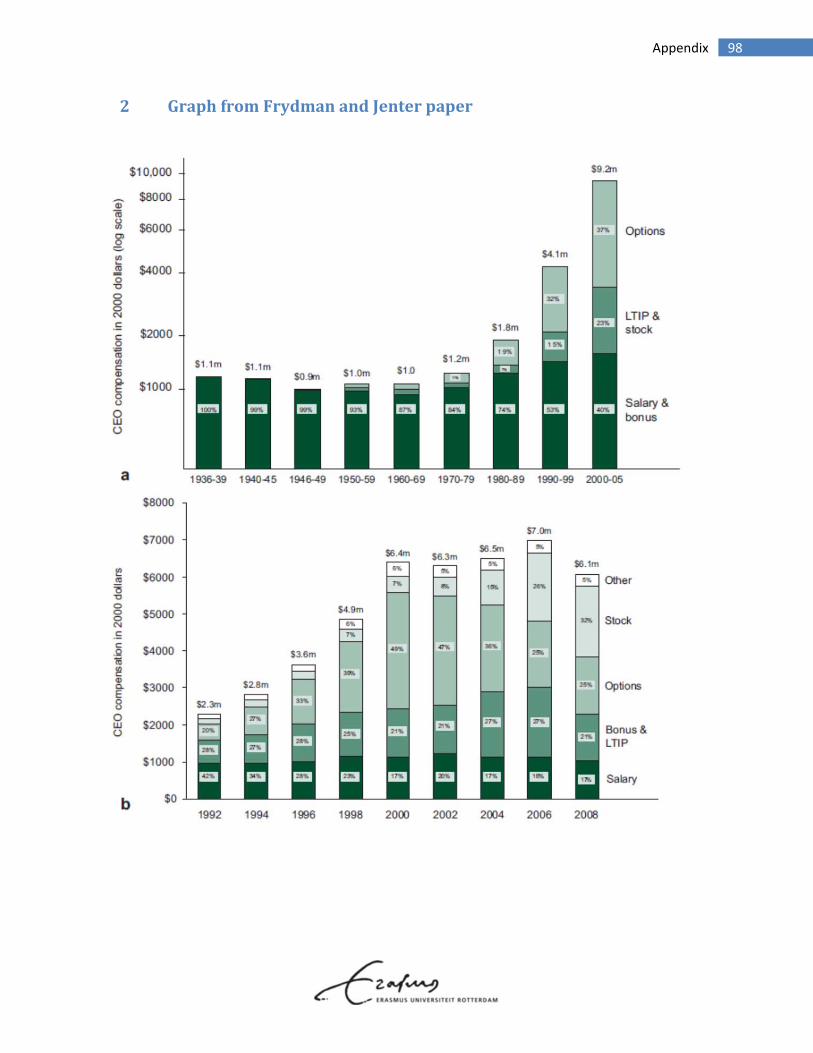
98 Appendix
2 GraphfromFrydmanandJenterpaper

99 Appendix
3 SPSSfigures
3.1 AgedistributionCEO’s
Figure 3: Executive Age Distribution
Descriptive Statistics
N Range Minimum Maximum Mean Std. Deviation
ExecutivesAge 3986 59 34 93 55.22 7.049
Valid N (listwise) 3986 Table 18: Descriptive CEO age
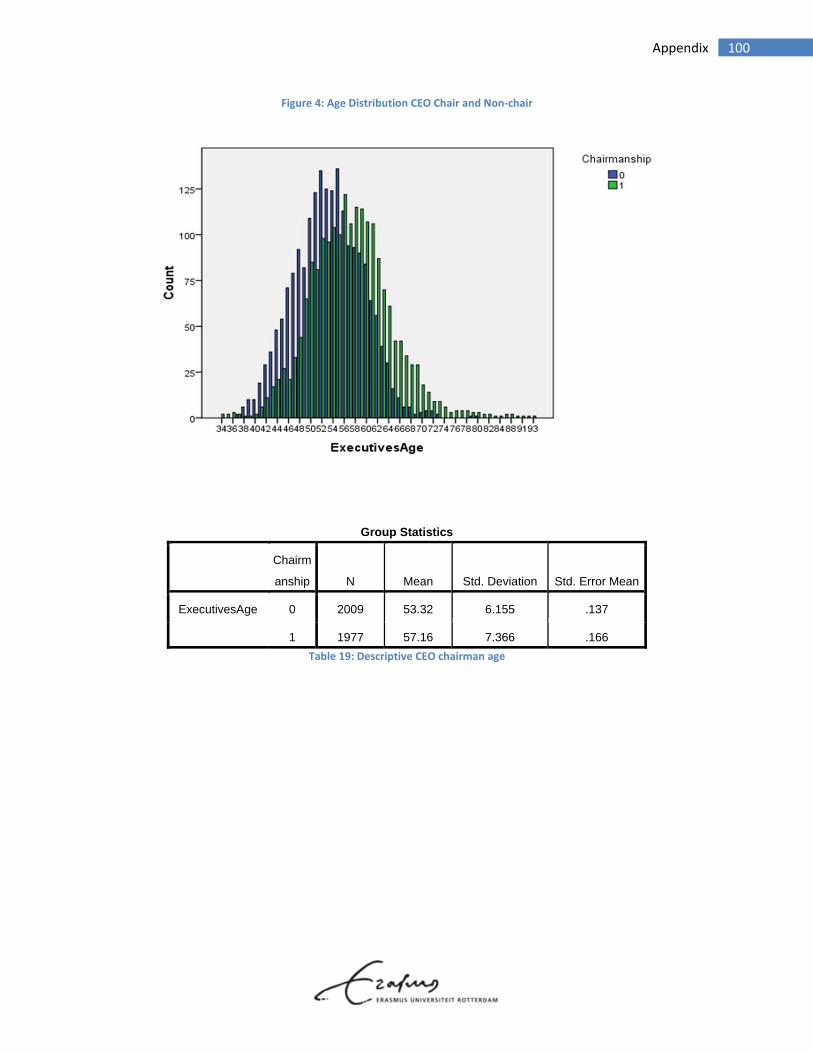
100 Appendix
Figure 4: Age Distribution CEO Chair and Non‐chair
Group Statistics
Chairm
anship N Mean Std. Deviation Std. Error Mean
ExecutivesAge 0 2009 53.32 6.155 .137
1 1977 57.16 7.366 .166
Table 19: Descriptive CEO chairman age
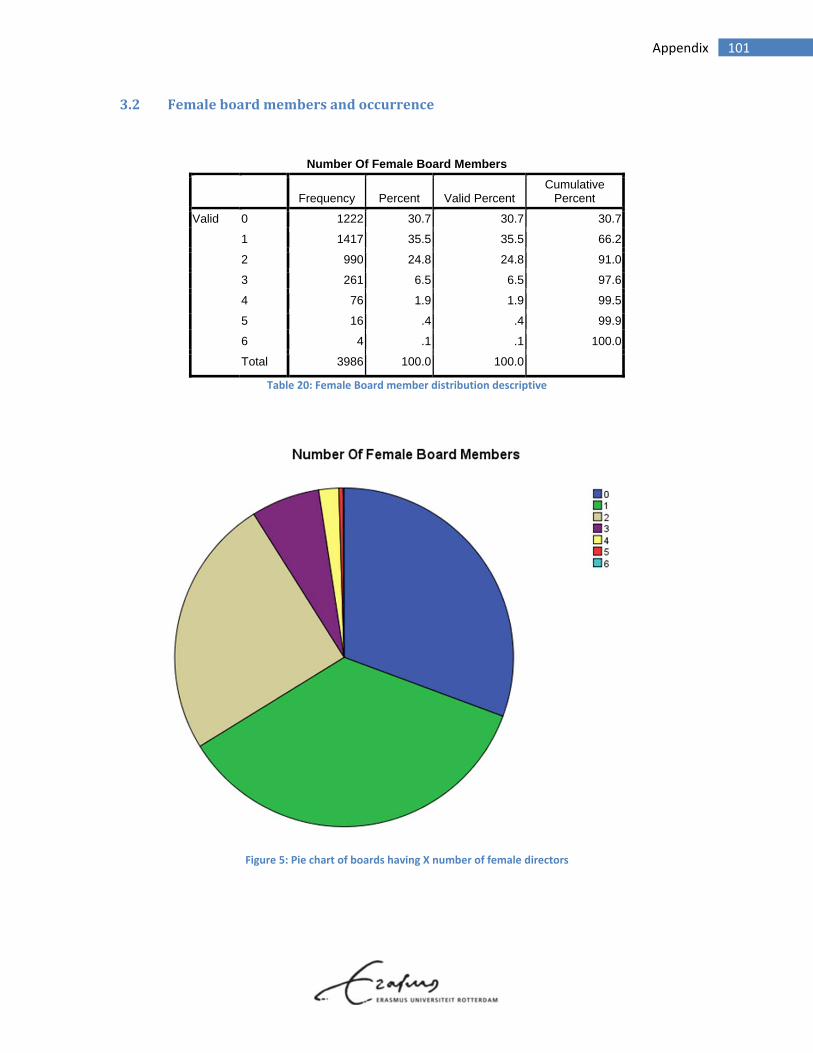
101 Appendix
3.2 Femaleboardmembersandoccurrence
Number Of Female Board Members
Frequency Percent Valid Percent
Cumulative Percent
Valid 0 1222 30.7 30.7 30.7
1 1417 35.5 35.5 66.2
2 990 24.8 24.8 91.0
3 261 6.5 6.5 97.6
4 76 1.9 1.9 99.5
5 16 .4 .4 99.9
6 4 .1 .1 100.0
Total 3986 100.0 100.0 Table 20: Female Board member distribution descriptive
Figure 5: Pie chart of boards having X number of female directors
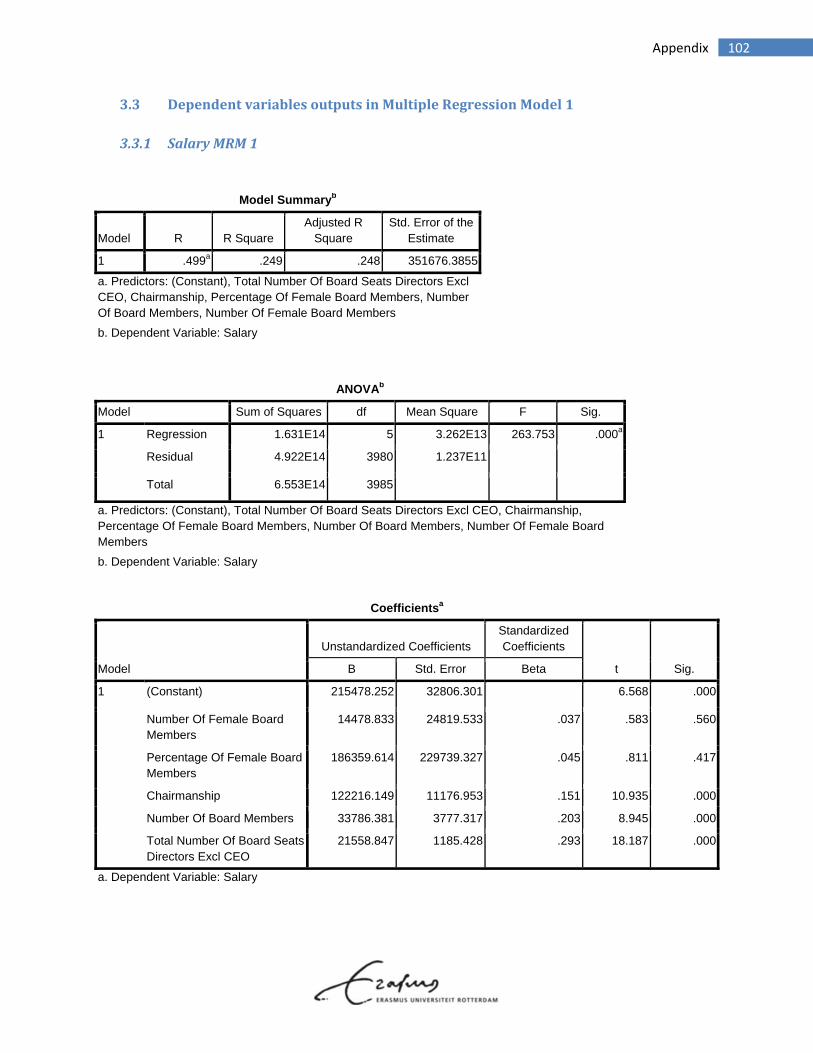
102 Appendix
3.3 DependentvariablesoutputsinMultipleRegressionModel1
3.3.1 SalaryMRM1
Model Summaryb
Model R R Square Adjusted R
Square Std. Error of the
Estimate
1 .499a .249 .248 351676.3855
a. Predictors: (Constant), Total Number Of Board Seats Directors Excl CEO, Chairmanship, Percentage Of Female Board Members, Number Of Board Members, Number Of Female Board Members
b. Dependent Variable: Salary
ANOVAb
Model Sum of Squares df Mean Square F Sig.
1 Regression 1.631E14 5 3.262E13 263.753 .000a
Residual 4.922E14 3980 1.237E11
Total 6.553E14 3985
a. Predictors: (Constant), Total Number Of Board Seats Directors Excl CEO, Chairmanship, Percentage Of Female Board Members, Number Of Board Members, Number Of Female Board Members
b. Dependent Variable: Salary
Coefficientsa
Model
Unstandardized Coefficients Standardized Coefficients
t Sig. B Std. Error Beta
1 (Constant) 215478.252 32806.301 6.568 .000
Number Of Female Board Members
14478.833 24819.533 .037 .583 .560
Percentage Of Female Board Members
186359.614 229739.327 .045 .811 .417
Chairmanship 122216.149 11176.953 .151 10.935 .000
Number Of Board Members 33786.381 3777.317 .203 8.945 .000
Total Number Of Board Seats Directors Excl CEO
21558.847 1185.428 .293 18.187 .000
a. Dependent Variable: Salary
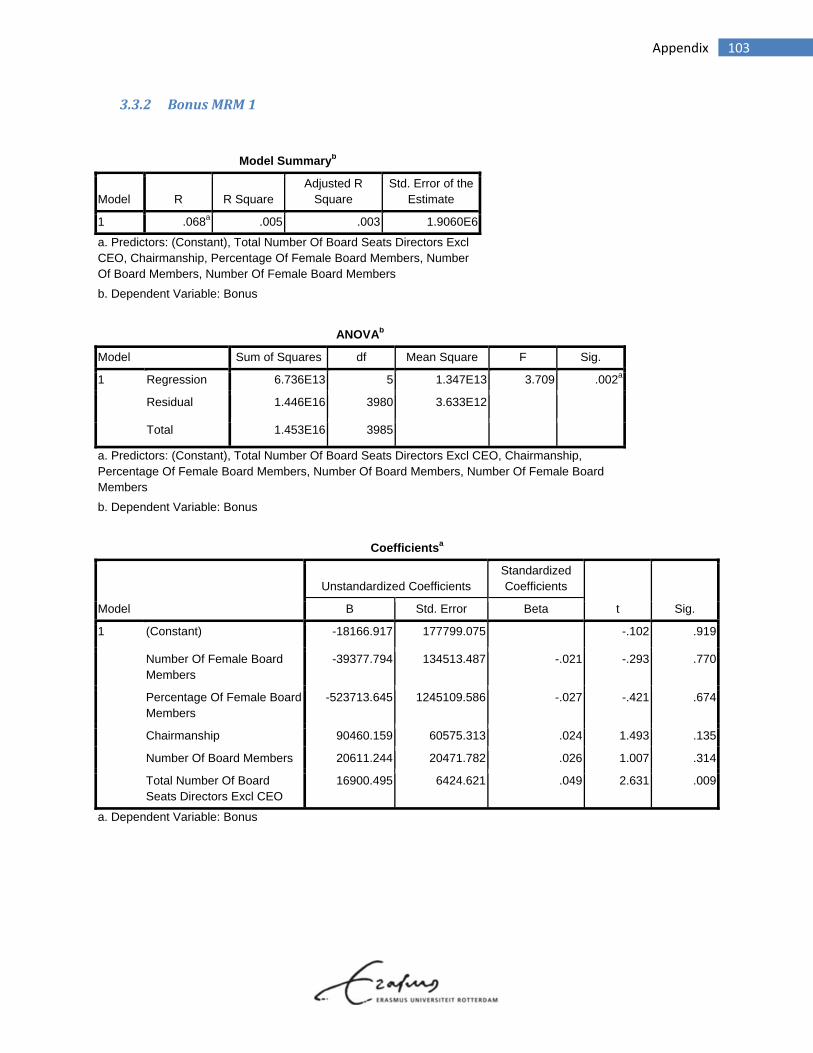
103 Appendix
3.3.2 BonusMRM1
Model Summaryb
Model R R Square Adjusted R
Square Std. Error of the
Estimate
1 .068a .005 .003 1.9060E6
a. Predictors: (Constant), Total Number Of Board Seats Directors Excl CEO, Chairmanship, Percentage Of Female Board Members, Number Of Board Members, Number Of Female Board Members
b. Dependent Variable: Bonus
ANOVAb
Model Sum of Squares df Mean Square F Sig.
1 Regression 6.736E13 5 1.347E13 3.709 .002a
Residual 1.446E16 3980 3.633E12
Total 1.453E16 3985
a. Predictors: (Constant), Total Number Of Board Seats Directors Excl CEO, Chairmanship, Percentage Of Female Board Members, Number Of Board Members, Number Of Female Board Members
b. Dependent Variable: Bonus
Coefficientsa
Model
Unstandardized Coefficients Standardized Coefficients
t Sig. B Std. Error Beta
1 (Constant) -18166.917 177799.075 -.102 .919
Number Of Female Board Members
-39377.794 134513.487 -.021 -.293 .770
Percentage Of Female Board Members
-523713.645 1245109.586 -.027 -.421 .674
Chairmanship 90460.159 60575.313 .024 1.493 .135
Number Of Board Members 20611.244 20471.782 .026 1.007 .314
Total Number Of Board Seats Directors Excl CEO
16900.495 6424.621 .049 2.631 .009
a. Dependent Variable: Bonus
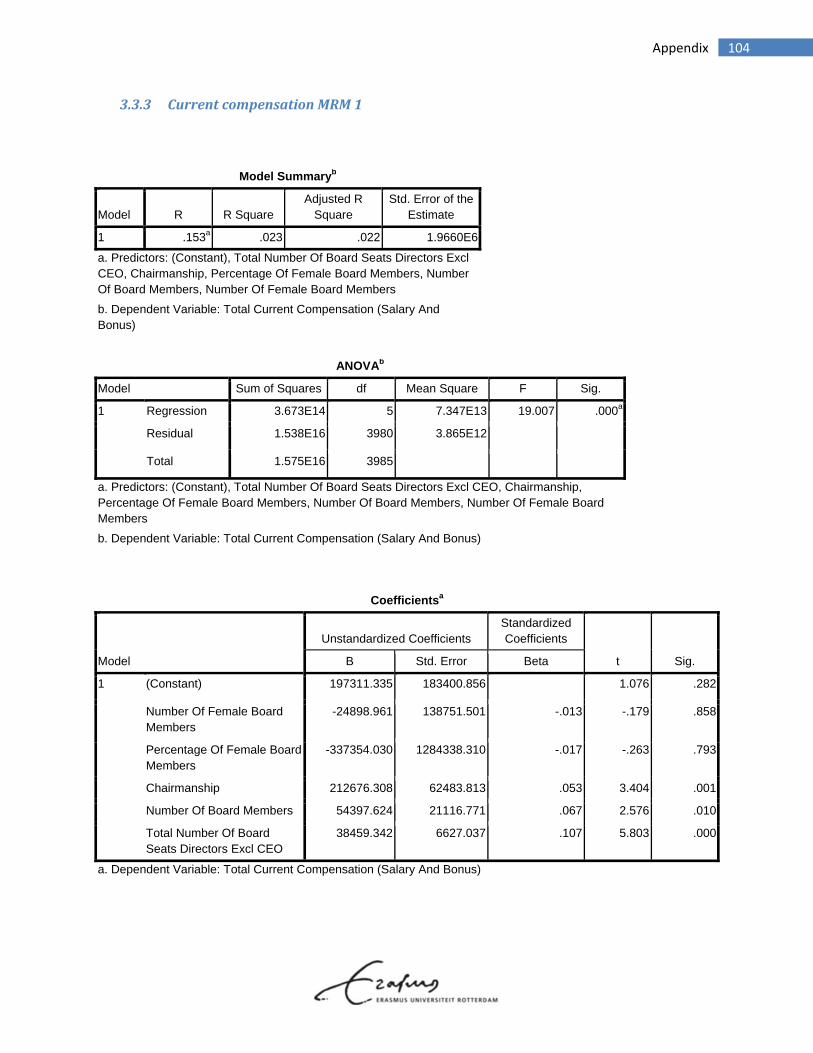
104 Appendix
3.3.3 CurrentcompensationMRM1
Model Summaryb
Model R R Square Adjusted R
Square Std. Error of the
Estimate
1 .153a .023 .022 1.9660E6
a. Predictors: (Constant), Total Number Of Board Seats Directors Excl CEO, Chairmanship, Percentage Of Female Board Members, Number Of Board Members, Number Of Female Board Members
b. Dependent Variable: Total Current Compensation (Salary And Bonus)
ANOVAb
Model Sum of Squares df Mean Square F Sig.
1 Regression 3.673E14 5 7.347E13 19.007 .000a
Residual 1.538E16 3980 3.865E12
Total 1.575E16 3985
a. Predictors: (Constant), Total Number Of Board Seats Directors Excl CEO, Chairmanship, Percentage Of Female Board Members, Number Of Board Members, Number Of Female Board Members
b. Dependent Variable: Total Current Compensation (Salary And Bonus)
Coefficientsa
Model
Unstandardized Coefficients Standardized Coefficients
t Sig. B Std. Error Beta
1 (Constant) 197311.335 183400.856 1.076 .282
Number Of Female Board Members
-24898.961 138751.501 -.013 -.179 .858
Percentage Of Female Board Members
-337354.030 1284338.310 -.017 -.263 .793
Chairmanship 212676.308 62483.813 .053 3.404 .001
Number Of Board Members 54397.624 21116.771 .067 2.576 .010
Total Number Of Board Seats Directors Excl CEO
38459.342 6627.037 .107 5.803 .000
a. Dependent Variable: Total Current Compensation (Salary And Bonus)
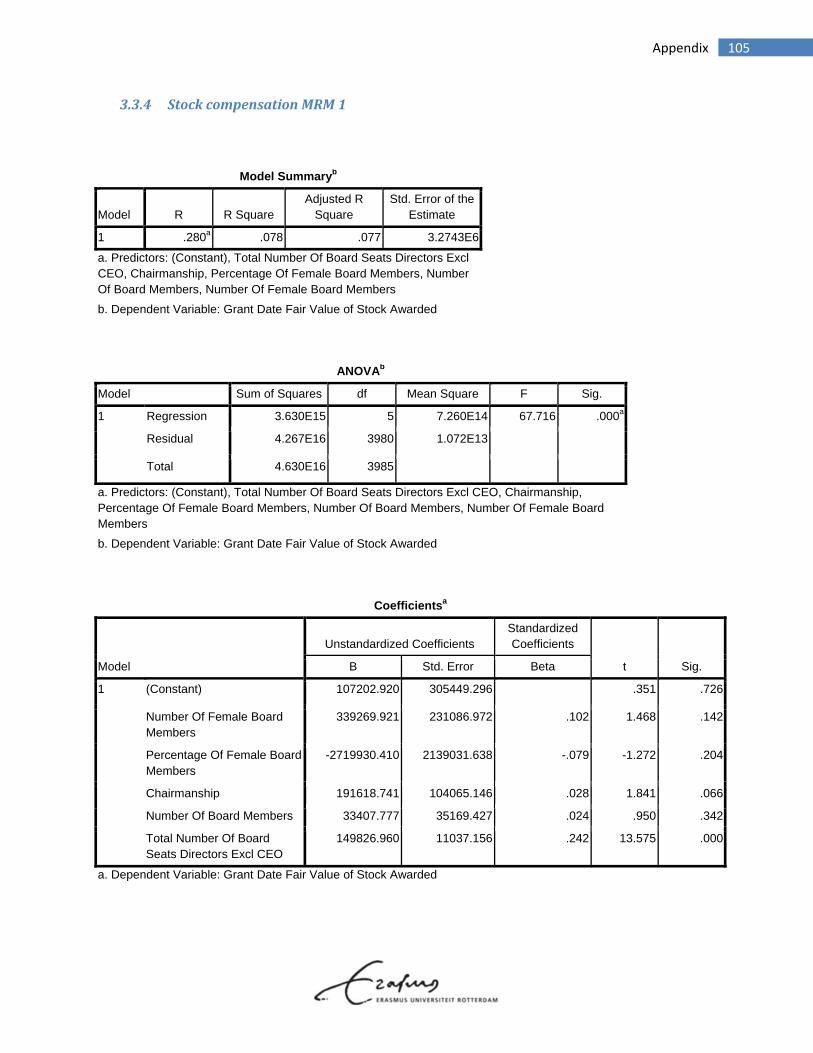
105 Appendix
3.3.4 StockcompensationMRM1
Model Summaryb
Model R R Square Adjusted R
Square Std. Error of the
Estimate
1 .280a .078 .077 3.2743E6
a. Predictors: (Constant), Total Number Of Board Seats Directors Excl CEO, Chairmanship, Percentage Of Female Board Members, Number Of Board Members, Number Of Female Board Members
b. Dependent Variable: Grant Date Fair Value of Stock Awarded
ANOVAb
Model Sum of Squares df Mean Square F Sig.
1 Regression 3.630E15 5 7.260E14 67.716 .000a
Residual 4.267E16 3980 1.072E13
Total 4.630E16 3985
a. Predictors: (Constant), Total Number Of Board Seats Directors Excl CEO, Chairmanship, Percentage Of Female Board Members, Number Of Board Members, Number Of Female Board Members
b. Dependent Variable: Grant Date Fair Value of Stock Awarded
Coefficientsa
Model
Unstandardized Coefficients Standardized Coefficients
t Sig. B Std. Error Beta
1 (Constant) 107202.920 305449.296 .351 .726
Number Of Female Board Members
339269.921 231086.972 .102 1.468 .142
Percentage Of Female Board Members
-2719930.410 2139031.638 -.079 -1.272 .204
Chairmanship 191618.741 104065.146 .028 1.841 .066
Number Of Board Members 33407.777 35169.427 .024 .950 .342
Total Number Of Board Seats Directors Excl CEO
149826.960 11037.156 .242 13.575 .000
a. Dependent Variable: Grant Date Fair Value of Stock Awarded
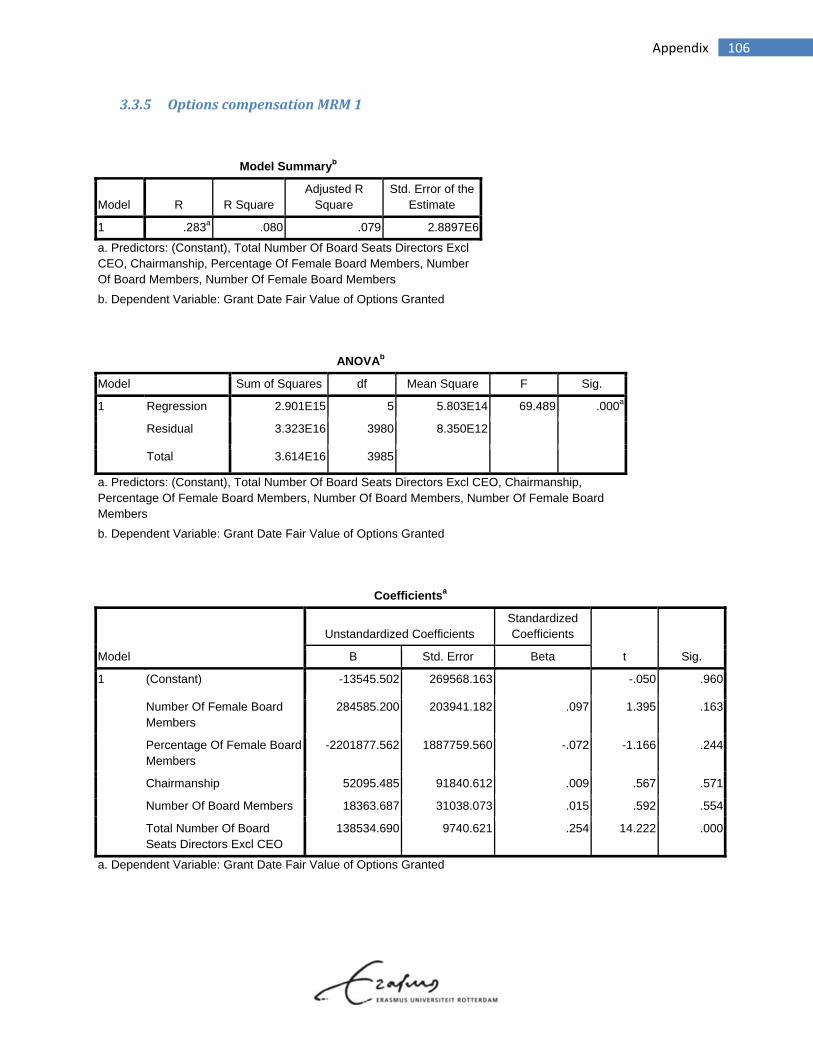
106 Appendix
3.3.5 OptionscompensationMRM1
Model Summaryb
Model R R Square Adjusted R
Square Std. Error of the
Estimate
1 .283a .080 .079 2.8897E6
a. Predictors: (Constant), Total Number Of Board Seats Directors Excl CEO, Chairmanship, Percentage Of Female Board Members, Number Of Board Members, Number Of Female Board Members
b. Dependent Variable: Grant Date Fair Value of Options Granted
ANOVAb
Model Sum of Squares df Mean Square F Sig.
1 Regression 2.901E15 5 5.803E14 69.489 .000a
Residual 3.323E16 3980 8.350E12
Total 3.614E16 3985
a. Predictors: (Constant), Total Number Of Board Seats Directors Excl CEO, Chairmanship, Percentage Of Female Board Members, Number Of Board Members, Number Of Female Board Members
b. Dependent Variable: Grant Date Fair Value of Options Granted
Coefficientsa
Model
Unstandardized Coefficients Standardized Coefficients
t Sig. B Std. Error Beta
1 (Constant) -13545.502 269568.163 -.050 .960
Number Of Female Board Members
284585.200 203941.182 .097 1.395 .163
Percentage Of Female Board Members
-2201877.562 1887759.560 -.072 -1.166 .244
Chairmanship 52095.485 91840.612 .009 .567 .571
Number Of Board Members 18363.687 31038.073 .015 .592 .554
Total Number Of Board Seats Directors Excl CEO
138534.690 9740.621 .254 14.222 .000
a. Dependent Variable: Grant Date Fair Value of Options Granted
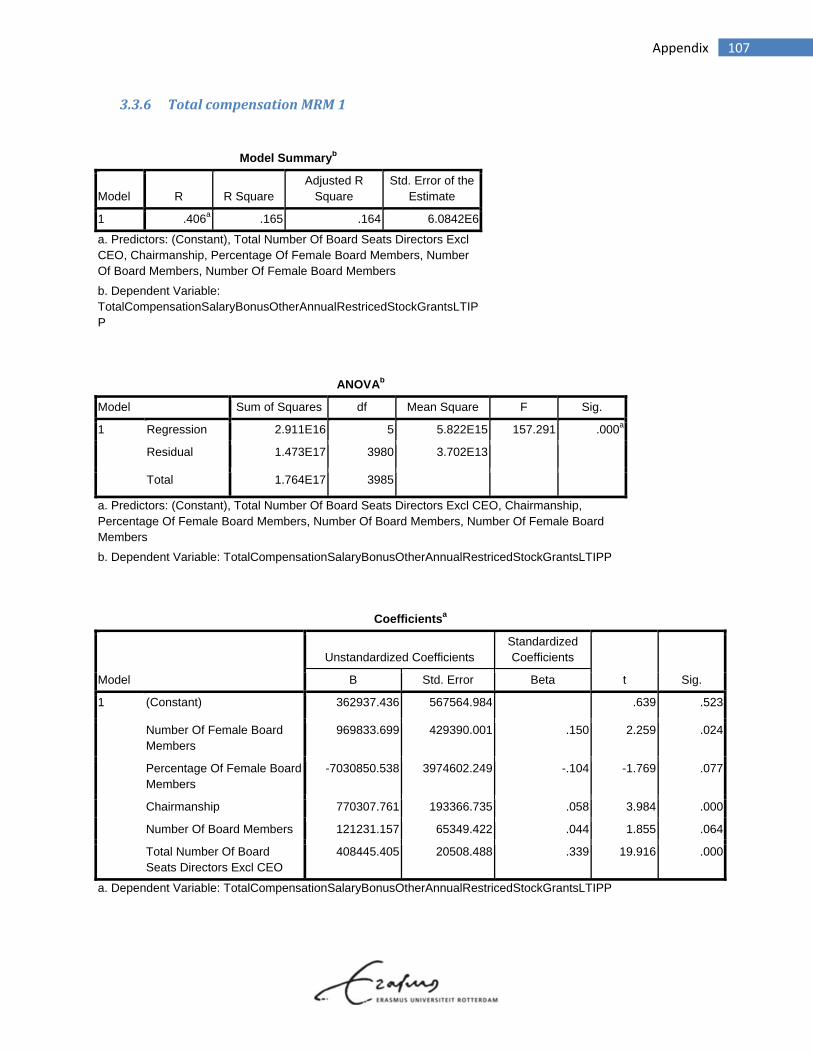
107 Appendix
3.3.6 TotalcompensationMRM1
Model Summaryb
Model R R Square Adjusted R
Square Std. Error of the
Estimate
1 .406a .165 .164 6.0842E6
a. Predictors: (Constant), Total Number Of Board Seats Directors Excl CEO, Chairmanship, Percentage Of Female Board Members, Number Of Board Members, Number Of Female Board Members
b. Dependent Variable: TotalCompensationSalaryBonusOtherAnnualRestricedStockGrantsLTIPP
ANOVAb
Model Sum of Squares df Mean Square F Sig.
1 Regression 2.911E16 5 5.822E15 157.291 .000a
Residual 1.473E17 3980 3.702E13
Total 1.764E17 3985 a. Predictors: (Constant), Total Number Of Board Seats Directors Excl CEO, Chairmanship, Percentage Of Female Board Members, Number Of Board Members, Number Of Female Board Members
b. Dependent Variable: TotalCompensationSalaryBonusOtherAnnualRestricedStockGrantsLTIPP
Coefficientsa
Model
Unstandardized Coefficients Standardized Coefficients
t Sig. B Std. Error Beta
1 (Constant) 362937.436 567564.984 .639 .523
Number Of Female Board Members
969833.699 429390.001 .150 2.259 .024
Percentage Of Female Board Members
-7030850.538 3974602.249 -.104 -1.769 .077
Chairmanship 770307.761 193366.735 .058 3.984 .000
Number Of Board Members 121231.157 65349.422 .044 1.855 .064
Total Number Of Board Seats Directors Excl CEO
408445.405 20508.488 .339 19.916 .000
a. Dependent Variable: TotalCompensationSalaryBonusOtherAnnualRestricedStockGrantsLTIPP
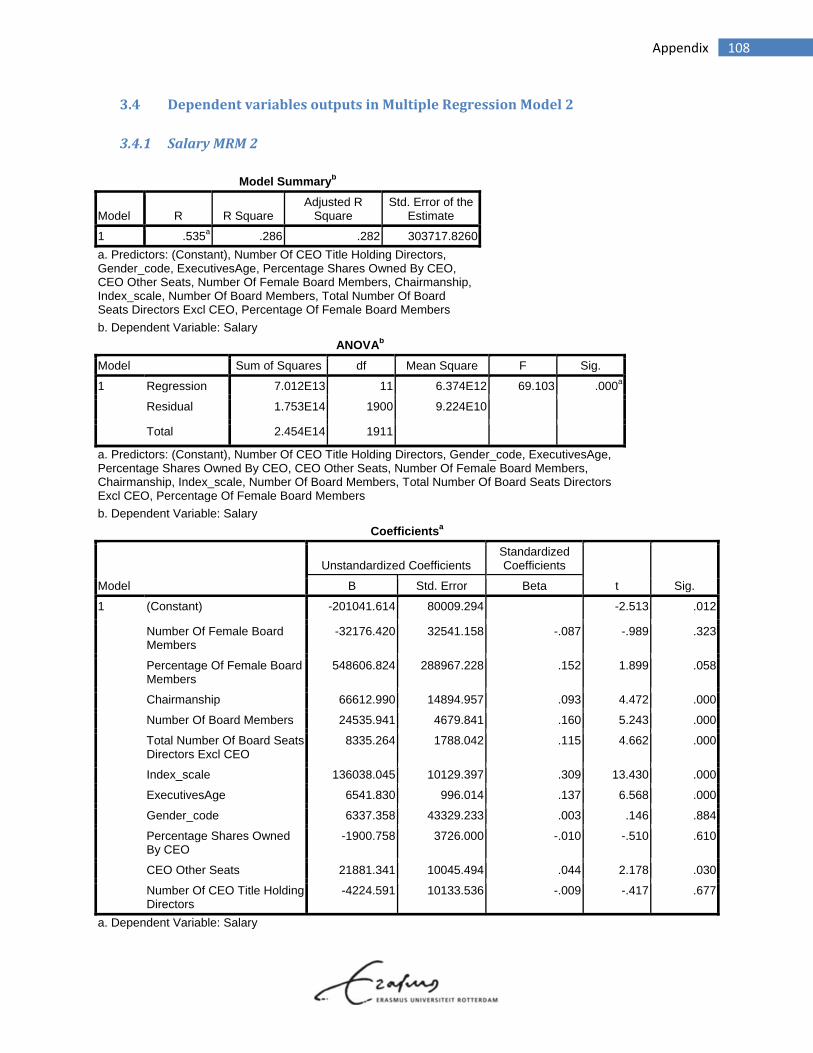
108 Appendix
3.4 DependentvariablesoutputsinMultipleRegressionModel2
3.4.1 SalaryMRM2
Model Summaryb
Model R R Square Adjusted R
Square Std. Error of the
Estimate
1 .535a .286 .282 303717.8260
a. Predictors: (Constant), Number Of CEO Title Holding Directors, Gender_code, ExecutivesAge, Percentage Shares Owned By CEO, CEO Other Seats, Number Of Female Board Members, Chairmanship, Index_scale, Number Of Board Members, Total Number Of Board Seats Directors Excl CEO, Percentage Of Female Board Members
b. Dependent Variable: Salary
ANOVAb
Model Sum of Squares df Mean Square F Sig.
1 Regression 7.012E13 11 6.374E12 69.103 .000a
Residual 1.753E14 1900 9.224E10 Total 2.454E14 1911
a. Predictors: (Constant), Number Of CEO Title Holding Directors, Gender_code, ExecutivesAge, Percentage Shares Owned By CEO, CEO Other Seats, Number Of Female Board Members, Chairmanship, Index_scale, Number Of Board Members, Total Number Of Board Seats Directors Excl CEO, Percentage Of Female Board Members
b. Dependent Variable: Salary
Coefficientsa
Model
Unstandardized Coefficients Standardized Coefficients
t Sig. B Std. Error Beta
1 (Constant) -201041.614 80009.294 -2.513 .012
Number Of Female Board Members
-32176.420 32541.158 -.087 -.989 .323
Percentage Of Female Board Members
548606.824 288967.228 .152 1.899 .058
Chairmanship 66612.990 14894.957 .093 4.472 .000
Number Of Board Members 24535.941 4679.841 .160 5.243 .000
Total Number Of Board Seats Directors Excl CEO
8335.264 1788.042 .115 4.662 .000
Index_scale 136038.045 10129.397 .309 13.430 .000
ExecutivesAge 6541.830 996.014 .137 6.568 .000
Gender_code 6337.358 43329.233 .003 .146 .884
Percentage Shares Owned By CEO
-1900.758 3726.000 -.010 -.510 .610
CEO Other Seats 21881.341 10045.494 .044 2.178 .030
Number Of CEO Title Holding Directors
-4224.591 10133.536 -.009 -.417 .677
a. Dependent Variable: Salary
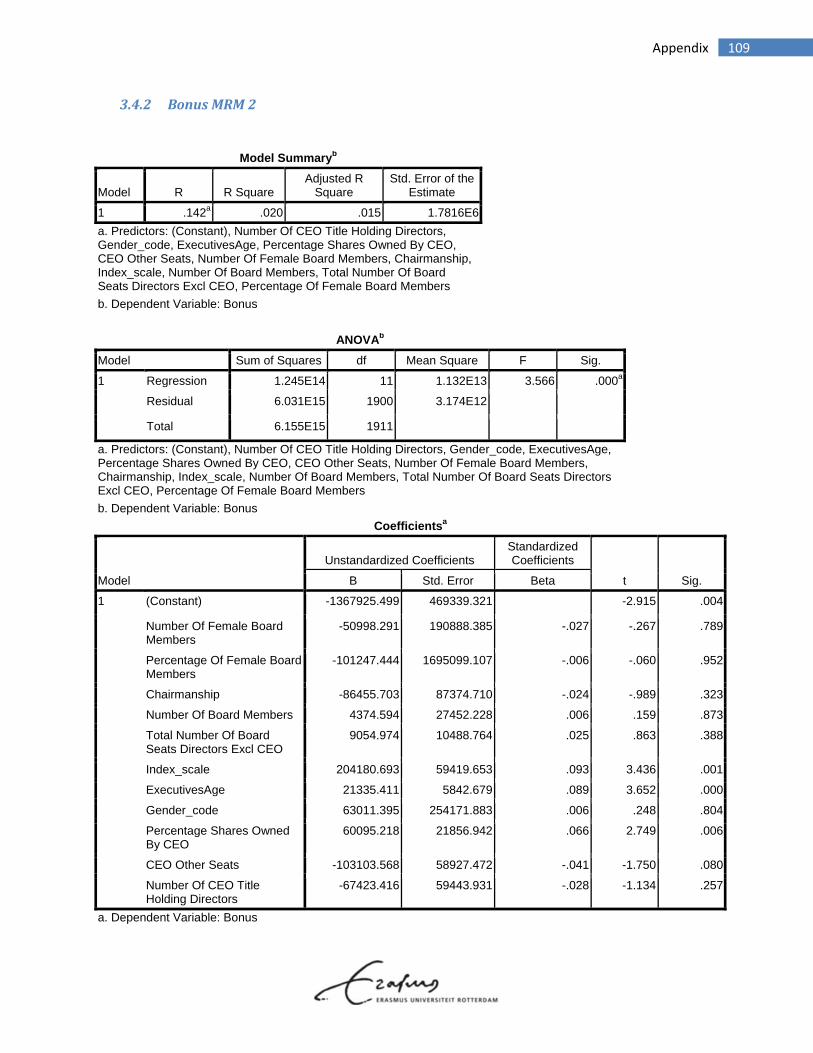
109 Appendix
3.4.2 BonusMRM2
Model Summaryb
Model R R Square Adjusted R
Square Std. Error of the
Estimate
1 .142a .020 .015 1.7816E6
a. Predictors: (Constant), Number Of CEO Title Holding Directors, Gender_code, ExecutivesAge, Percentage Shares Owned By CEO, CEO Other Seats, Number Of Female Board Members, Chairmanship, Index_scale, Number Of Board Members, Total Number Of Board Seats Directors Excl CEO, Percentage Of Female Board Members
b. Dependent Variable: Bonus
ANOVAb
Model Sum of Squares df Mean Square F Sig.
1 Regression 1.245E14 11 1.132E13 3.566 .000a
Residual 6.031E15 1900 3.174E12 Total 6.155E15 1911
a. Predictors: (Constant), Number Of CEO Title Holding Directors, Gender_code, ExecutivesAge, Percentage Shares Owned By CEO, CEO Other Seats, Number Of Female Board Members, Chairmanship, Index_scale, Number Of Board Members, Total Number Of Board Seats Directors Excl CEO, Percentage Of Female Board Members
b. Dependent Variable: Bonus
Coefficientsa
Model
Unstandardized Coefficients Standardized Coefficients
t Sig. B Std. Error Beta
1 (Constant) -1367925.499 469339.321 -2.915 .004
Number Of Female Board Members
-50998.291 190888.385 -.027 -.267 .789
Percentage Of Female Board Members
-101247.444 1695099.107 -.006 -.060 .952
Chairmanship -86455.703 87374.710 -.024 -.989 .323
Number Of Board Members 4374.594 27452.228 .006 .159 .873
Total Number Of Board Seats Directors Excl CEO
9054.974 10488.764 .025 .863 .388
Index_scale 204180.693 59419.653 .093 3.436 .001
ExecutivesAge 21335.411 5842.679 .089 3.652 .000
Gender_code 63011.395 254171.883 .006 .248 .804
Percentage Shares Owned By CEO
60095.218 21856.942 .066 2.749 .006
CEO Other Seats -103103.568 58927.472 -.041 -1.750 .080
Number Of CEO Title Holding Directors
-67423.416 59443.931 -.028 -1.134 .257
a. Dependent Variable: Bonus
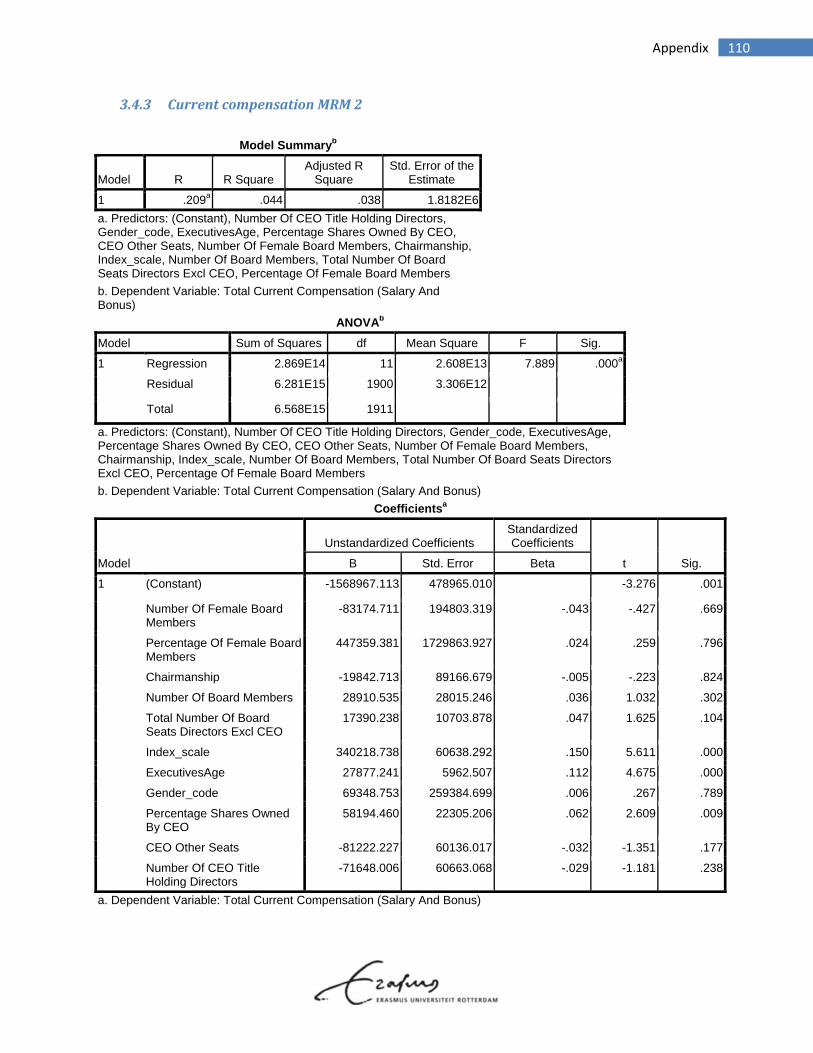
110 Appendix
3.4.3 CurrentcompensationMRM2
Model Summaryb
Model R R Square Adjusted R
Square Std. Error of the
Estimate
1 .209a .044 .038 1.8182E6
a. Predictors: (Constant), Number Of CEO Title Holding Directors, Gender_code, ExecutivesAge, Percentage Shares Owned By CEO, CEO Other Seats, Number Of Female Board Members, Chairmanship, Index_scale, Number Of Board Members, Total Number Of Board Seats Directors Excl CEO, Percentage Of Female Board Members
b. Dependent Variable: Total Current Compensation (Salary And Bonus)
ANOVAb
Model Sum of Squares df Mean Square F Sig.
1 Regression 2.869E14 11 2.608E13 7.889 .000a
Residual 6.281E15 1900 3.306E12 Total 6.568E15 1911
a. Predictors: (Constant), Number Of CEO Title Holding Directors, Gender_code, ExecutivesAge, Percentage Shares Owned By CEO, CEO Other Seats, Number Of Female Board Members, Chairmanship, Index_scale, Number Of Board Members, Total Number Of Board Seats Directors Excl CEO, Percentage Of Female Board Members
b. Dependent Variable: Total Current Compensation (Salary And Bonus)
Coefficientsa
Model
Unstandardized Coefficients Standardized Coefficients
t Sig. B Std. Error Beta
1 (Constant) -1568967.113 478965.010 -3.276 .001
Number Of Female Board Members
-83174.711 194803.319 -.043 -.427 .669
Percentage Of Female Board Members
447359.381 1729863.927 .024 .259 .796
Chairmanship -19842.713 89166.679 -.005 -.223 .824
Number Of Board Members 28910.535 28015.246 .036 1.032 .302
Total Number Of Board Seats Directors Excl CEO
17390.238 10703.878 .047 1.625 .104
Index_scale 340218.738 60638.292 .150 5.611 .000
ExecutivesAge 27877.241 5962.507 .112 4.675 .000
Gender_code 69348.753 259384.699 .006 .267 .789
Percentage Shares Owned By CEO
58194.460 22305.206 .062 2.609 .009
CEO Other Seats -81222.227 60136.017 -.032 -1.351 .177
Number Of CEO Title Holding Directors
-71648.006 60663.068 -.029 -1.181 .238
a. Dependent Variable: Total Current Compensation (Salary And Bonus)

111 Appendix
3.4.4 StockcompensationMRM2
Model Summaryb
Model R R Square Adjusted R
Square Std. Error of the
Estimate
1 .239a .057 .052 3.0413E6
a. Predictors: (Constant), Number Of CEO Title Holding Directors, Gender_code, ExecutivesAge, Percentage Shares Owned By CEO, CEO Other Seats, Number Of Female Board Members, Chairmanship, Index_scale, Number Of Board Members, Total Number Of Board Seats Directors Excl CEO, Percentage Of Female Board Members
b. Dependent Variable: Grant Date Fair Value of Stock Awarded
ANOVAb
Model Sum of Squares df Mean Square F Sig.
1 Regression 1.068E15 11 9.712E13 10.500 .000a
Residual 1.757E16 1900 9.249E12 Total 1.864E16 1911
a. Predictors: (Constant), Number Of CEO Title Holding Directors, Gender_code, ExecutivesAge, Percentage Shares Owned By CEO, CEO Other Seats, Number Of Female Board Members, Chairmanship, Index_scale, Number Of Board Members, Total Number Of Board Seats Directors Excl CEO, Percentage Of Female Board Members
b. Dependent Variable: Grant Date Fair Value of Stock Awarded
Coefficientsa
Model
Unstandardized Coefficients Standardized Coefficients
t Sig. B Std. Error Beta
1 (Constant) -409893.588 801172.634 -.512 .609
Number Of Female Board Members
109621.298 325850.709 .034 .336 .737
Percentage Of Female Board Members
-1556207.332 2893571.784 -.050 -.538 .591
Chairmanship 178882.718 149150.568 .029 1.199 .231
Number Of Board Members -67553.464 46861.562 -.050 -1.442 .150
Total Number Of Board Seats Directors Excl CEO
63264.070 17904.553 .101 3.533 .000
Index_scale 716183.090 101430.666 .187 7.061 .000
ExecutivesAge 1053.033 9973.583 .003 .106 .916
Gender_code 512993.873 433877.043 .028 1.182 .237
Percentage Shares Owned By CEO
-25350.026 37310.284 -.016 -.679 .497
CEO Other Seats 5891.236 100590.503 .001 .059 .953
Number Of CEO Title Holding Directors
26483.885 101472.109 .006 .261 .794
a. Dependent Variable: Grant Date Fair Value of Stock Awarded
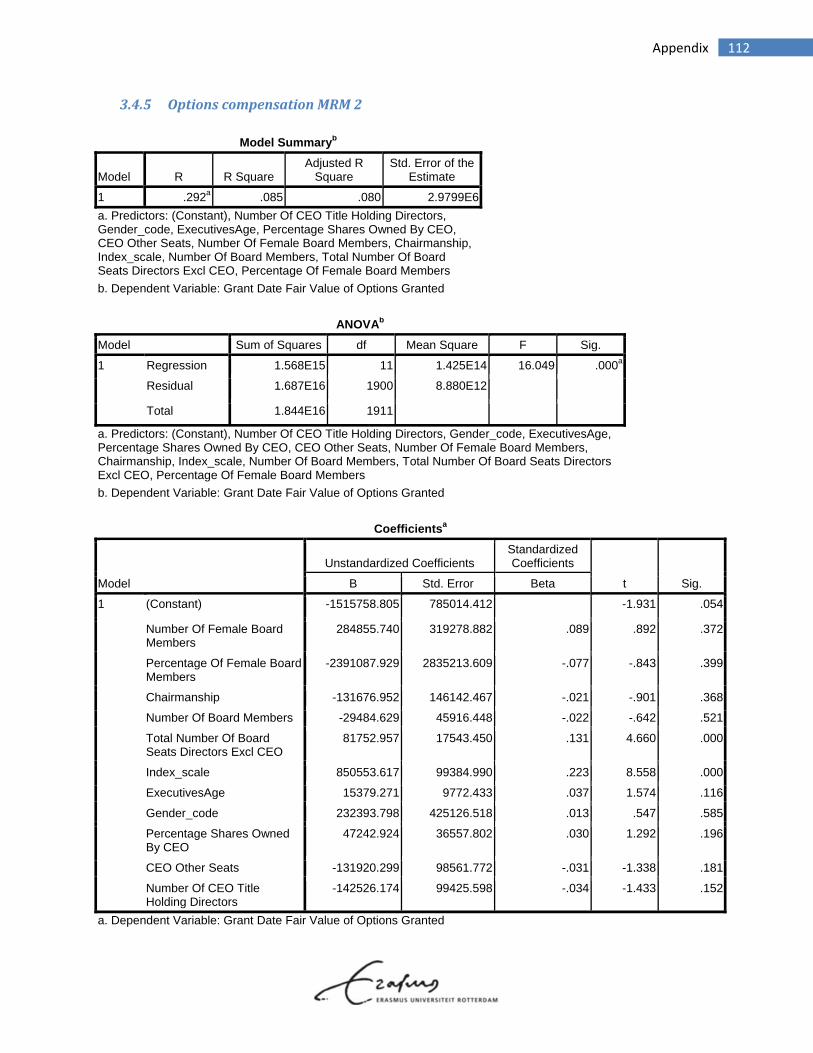
112 Appendix
3.4.5 OptionscompensationMRM2
Model Summaryb
Model R R Square Adjusted R
Square Std. Error of the
Estimate
1 .292a .085 .080 2.9799E6
a. Predictors: (Constant), Number Of CEO Title Holding Directors, Gender_code, ExecutivesAge, Percentage Shares Owned By CEO, CEO Other Seats, Number Of Female Board Members, Chairmanship, Index_scale, Number Of Board Members, Total Number Of Board Seats Directors Excl CEO, Percentage Of Female Board Members
b. Dependent Variable: Grant Date Fair Value of Options Granted
ANOVAb
Model Sum of Squares df Mean Square F Sig.
1 Regression 1.568E15 11 1.425E14 16.049 .000a
Residual 1.687E16 1900 8.880E12 Total 1.844E16 1911
a. Predictors: (Constant), Number Of CEO Title Holding Directors, Gender_code, ExecutivesAge, Percentage Shares Owned By CEO, CEO Other Seats, Number Of Female Board Members, Chairmanship, Index_scale, Number Of Board Members, Total Number Of Board Seats Directors Excl CEO, Percentage Of Female Board Members
b. Dependent Variable: Grant Date Fair Value of Options Granted
Coefficientsa
Model
Unstandardized Coefficients Standardized Coefficients
t Sig. B Std. Error Beta
1 (Constant) -1515758.805 785014.412 -1.931 .054
Number Of Female Board Members
284855.740 319278.882 .089 .892 .372
Percentage Of Female Board Members
-2391087.929 2835213.609 -.077 -.843 .399
Chairmanship -131676.952 146142.467 -.021 -.901 .368
Number Of Board Members -29484.629 45916.448 -.022 -.642 .521
Total Number Of Board Seats Directors Excl CEO
81752.957 17543.450 .131 4.660 .000
Index_scale 850553.617 99384.990 .223 8.558 .000
ExecutivesAge 15379.271 9772.433 .037 1.574 .116
Gender_code 232393.798 425126.518 .013 .547 .585
Percentage Shares Owned By CEO
47242.924 36557.802 .030 1.292 .196
CEO Other Seats -131920.299 98561.772 -.031 -1.338 .181
Number Of CEO Title Holding Directors
-142526.174 99425.598 -.034 -1.433 .152
a. Dependent Variable: Grant Date Fair Value of Options Granted
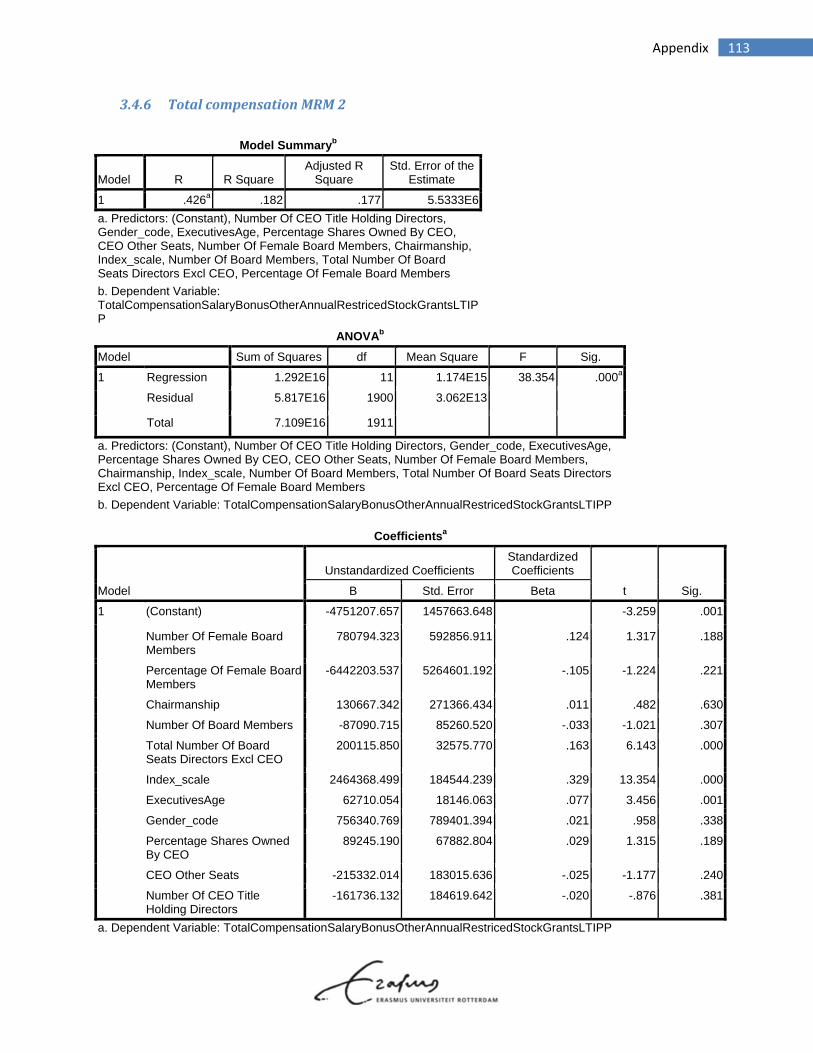
113 Appendix
3.4.6 TotalcompensationMRM2
Model Summaryb
Model R R Square Adjusted R
Square Std. Error of the
Estimate
1 .426a .182 .177 5.5333E6
a. Predictors: (Constant), Number Of CEO Title Holding Directors, Gender_code, ExecutivesAge, Percentage Shares Owned By CEO, CEO Other Seats, Number Of Female Board Members, Chairmanship, Index_scale, Number Of Board Members, Total Number Of Board Seats Directors Excl CEO, Percentage Of Female Board Members
b. Dependent Variable: TotalCompensationSalaryBonusOtherAnnualRestricedStockGrantsLTIPP
ANOVAb
Model Sum of Squares df Mean Square F Sig.
1 Regression 1.292E16 11 1.174E15 38.354 .000a
Residual 5.817E16 1900 3.062E13 Total 7.109E16 1911
a. Predictors: (Constant), Number Of CEO Title Holding Directors, Gender_code, ExecutivesAge, Percentage Shares Owned By CEO, CEO Other Seats, Number Of Female Board Members, Chairmanship, Index_scale, Number Of Board Members, Total Number Of Board Seats Directors Excl CEO, Percentage Of Female Board Members
b. Dependent Variable: TotalCompensationSalaryBonusOtherAnnualRestricedStockGrantsLTIPP
Coefficientsa
Model
Unstandardized Coefficients Standardized Coefficients
t Sig. B Std. Error Beta
1 (Constant) -4751207.657 1457663.648 -3.259 .001
Number Of Female Board Members
780794.323 592856.911 .124 1.317 .188
Percentage Of Female Board Members
-6442203.537 5264601.192 -.105 -1.224 .221
Chairmanship 130667.342 271366.434 .011 .482 .630
Number Of Board Members -87090.715 85260.520 -.033 -1.021 .307
Total Number Of Board Seats Directors Excl CEO
200115.850 32575.770 .163 6.143 .000
Index_scale 2464368.499 184544.239 .329 13.354 .000
ExecutivesAge 62710.054 18146.063 .077 3.456 .001
Gender_code 756340.769 789401.394 .021 .958 .338
Percentage Shares Owned By CEO
89245.190 67882.804 .029 1.315 .189
CEO Other Seats -215332.014 183015.636 -.025 -1.177 .240
Number Of CEO Title Holding Directors
-161736.132 184619.642 -.020 -.876 .381
a. Dependent Variable: TotalCompensationSalaryBonusOtherAnnualRestricedStockGrantsLTIPP
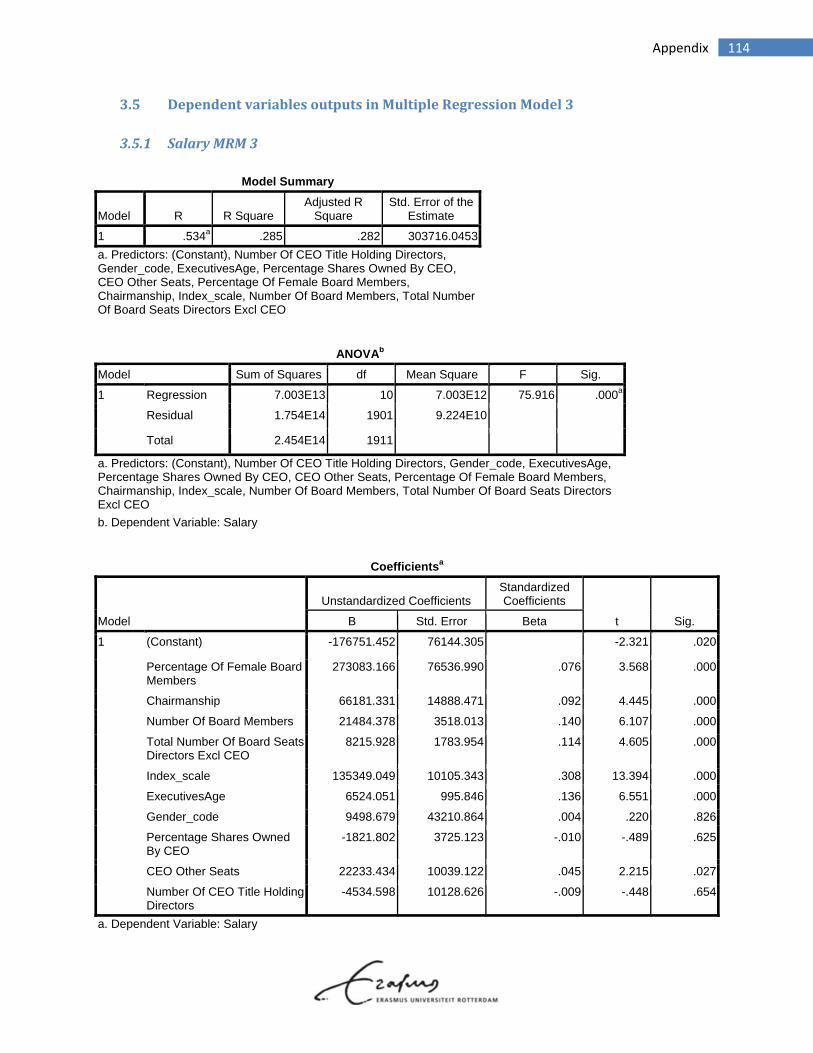
114 Appendix
3.5 DependentvariablesoutputsinMultipleRegressionModel3
3.5.1 SalaryMRM3
Model Summary
Model R R Square Adjusted R
Square Std. Error of the
Estimate
1 .534a .285 .282 303716.0453
a. Predictors: (Constant), Number Of CEO Title Holding Directors, Gender_code, ExecutivesAge, Percentage Shares Owned By CEO, CEO Other Seats, Percentage Of Female Board Members, Chairmanship, Index_scale, Number Of Board Members, Total Number Of Board Seats Directors Excl CEO
ANOVAb
Model Sum of Squares df Mean Square F Sig.
1 Regression 7.003E13 10 7.003E12 75.916 .000a
Residual 1.754E14 1901 9.224E10 Total 2.454E14 1911
a. Predictors: (Constant), Number Of CEO Title Holding Directors, Gender_code, ExecutivesAge, Percentage Shares Owned By CEO, CEO Other Seats, Percentage Of Female Board Members, Chairmanship, Index_scale, Number Of Board Members, Total Number Of Board Seats Directors Excl CEO
b. Dependent Variable: Salary
Coefficientsa
Model
Unstandardized Coefficients Standardized Coefficients
t Sig. B Std. Error Beta
1 (Constant) -176751.452 76144.305 -2.321 .020
Percentage Of Female Board Members
273083.166 76536.990 .076 3.568 .000
Chairmanship 66181.331 14888.471 .092 4.445 .000
Number Of Board Members 21484.378 3518.013 .140 6.107 .000
Total Number Of Board Seats Directors Excl CEO
8215.928 1783.954 .114 4.605 .000
Index_scale 135349.049 10105.343 .308 13.394 .000
ExecutivesAge 6524.051 995.846 .136 6.551 .000
Gender_code 9498.679 43210.864 .004 .220 .826
Percentage Shares Owned By CEO
-1821.802 3725.123 -.010 -.489 .625
CEO Other Seats 22233.434 10039.122 .045 2.215 .027
Number Of CEO Title Holding Directors
-4534.598 10128.626 -.009 -.448 .654
a. Dependent Variable: Salary
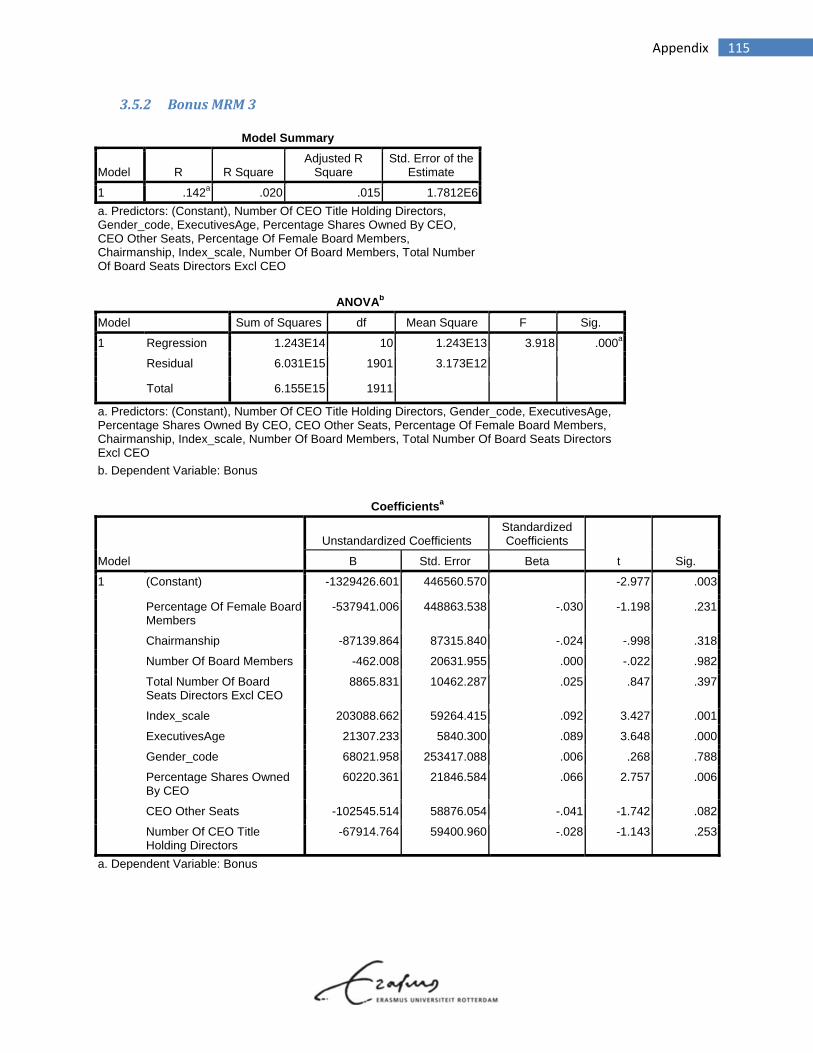
115 Appendix
3.5.2 BonusMRM3
Model Summary
Model R R Square Adjusted R
Square Std. Error of the
Estimate
1 .142a .020 .015 1.7812E6
a. Predictors: (Constant), Number Of CEO Title Holding Directors, Gender_code, ExecutivesAge, Percentage Shares Owned By CEO, CEO Other Seats, Percentage Of Female Board Members, Chairmanship, Index_scale, Number Of Board Members, Total Number Of Board Seats Directors Excl CEO
ANOVAb
Model Sum of Squares df Mean Square F Sig.
1 Regression 1.243E14 10 1.243E13 3.918 .000a
Residual 6.031E15 1901 3.173E12 Total 6.155E15 1911
a. Predictors: (Constant), Number Of CEO Title Holding Directors, Gender_code, ExecutivesAge, Percentage Shares Owned By CEO, CEO Other Seats, Percentage Of Female Board Members, Chairmanship, Index_scale, Number Of Board Members, Total Number Of Board Seats Directors Excl CEO
b. Dependent Variable: Bonus
Coefficientsa
Model
Unstandardized Coefficients Standardized Coefficients
t Sig. B Std. Error Beta
1 (Constant) -1329426.601 446560.570 -2.977 .003
Percentage Of Female Board Members
-537941.006 448863.538 -.030 -1.198 .231
Chairmanship -87139.864 87315.840 -.024 -.998 .318
Number Of Board Members -462.008 20631.955 .000 -.022 .982
Total Number Of Board Seats Directors Excl CEO
8865.831 10462.287 .025 .847 .397
Index_scale 203088.662 59264.415 .092 3.427 .001
ExecutivesAge 21307.233 5840.300 .089 3.648 .000
Gender_code 68021.958 253417.088 .006 .268 .788
Percentage Shares Owned By CEO
60220.361 21846.584 .066 2.757 .006
CEO Other Seats -102545.514 58876.054 -.041 -1.742 .082
Number Of CEO Title Holding Directors
-67914.764 59400.960 -.028 -1.143 .253
a. Dependent Variable: Bonus
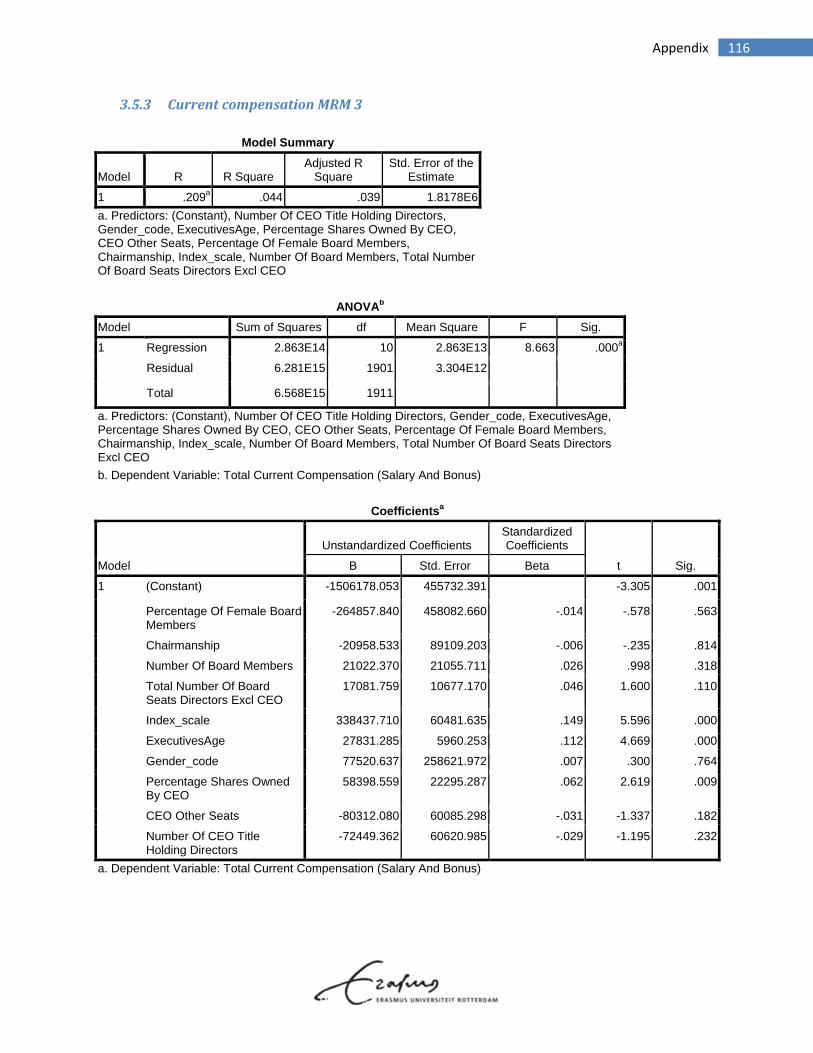
116 Appendix
3.5.3 CurrentcompensationMRM3
Model Summary
Model R R Square Adjusted R
Square Std. Error of the
Estimate
1 .209a .044 .039 1.8178E6
a. Predictors: (Constant), Number Of CEO Title Holding Directors, Gender_code, ExecutivesAge, Percentage Shares Owned By CEO, CEO Other Seats, Percentage Of Female Board Members, Chairmanship, Index_scale, Number Of Board Members, Total Number Of Board Seats Directors Excl CEO
ANOVAb
Model Sum of Squares df Mean Square F Sig.
1 Regression 2.863E14 10 2.863E13 8.663 .000a
Residual 6.281E15 1901 3.304E12 Total 6.568E15 1911
a. Predictors: (Constant), Number Of CEO Title Holding Directors, Gender_code, ExecutivesAge, Percentage Shares Owned By CEO, CEO Other Seats, Percentage Of Female Board Members, Chairmanship, Index_scale, Number Of Board Members, Total Number Of Board Seats Directors Excl CEO
b. Dependent Variable: Total Current Compensation (Salary And Bonus)
Coefficientsa
Model
Unstandardized Coefficients Standardized Coefficients
t Sig. B Std. Error Beta
1 (Constant) -1506178.053 455732.391 -3.305 .001
Percentage Of Female Board Members
-264857.840 458082.660 -.014 -.578 .563
Chairmanship -20958.533 89109.203 -.006 -.235 .814
Number Of Board Members 21022.370 21055.711 .026 .998 .318
Total Number Of Board Seats Directors Excl CEO
17081.759 10677.170 .046 1.600 .110
Index_scale 338437.710 60481.635 .149 5.596 .000
ExecutivesAge 27831.285 5960.253 .112 4.669 .000
Gender_code 77520.637 258621.972 .007 .300 .764
Percentage Shares Owned By CEO
58398.559 22295.287 .062 2.619 .009
CEO Other Seats -80312.080 60085.298 -.031 -1.337 .182
Number Of CEO Title Holding Directors
-72449.362 60620.985 -.029 -1.195 .232
a. Dependent Variable: Total Current Compensation (Salary And Bonus)
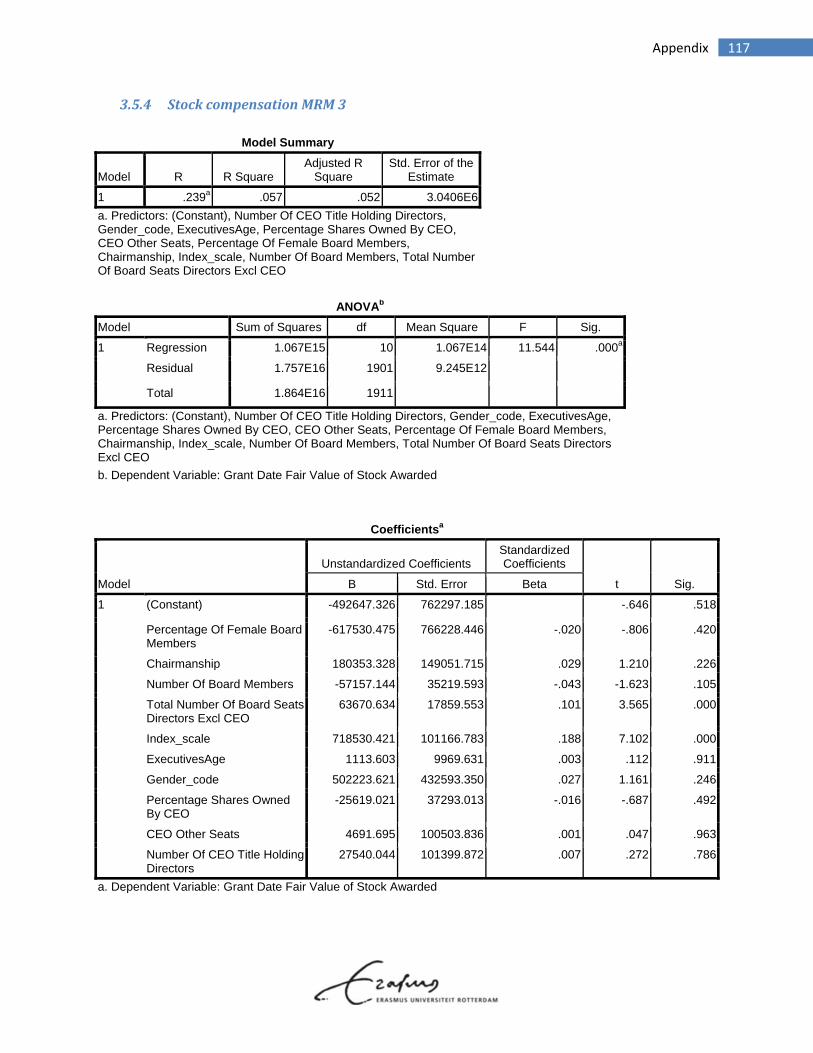
117 Appendix
3.5.4 StockcompensationMRM3
Model Summary
Model R R Square Adjusted R
Square Std. Error of the
Estimate
1 .239a .057 .052 3.0406E6
a. Predictors: (Constant), Number Of CEO Title Holding Directors, Gender_code, ExecutivesAge, Percentage Shares Owned By CEO, CEO Other Seats, Percentage Of Female Board Members, Chairmanship, Index_scale, Number Of Board Members, Total Number Of Board Seats Directors Excl CEO
ANOVAb
Model Sum of Squares df Mean Square F Sig.
1 Regression 1.067E15 10 1.067E14 11.544 .000a
Residual 1.757E16 1901 9.245E12 Total 1.864E16 1911
a. Predictors: (Constant), Number Of CEO Title Holding Directors, Gender_code, ExecutivesAge, Percentage Shares Owned By CEO, CEO Other Seats, Percentage Of Female Board Members, Chairmanship, Index_scale, Number Of Board Members, Total Number Of Board Seats Directors Excl CEO
b. Dependent Variable: Grant Date Fair Value of Stock Awarded
Coefficientsa
Model
Unstandardized Coefficients Standardized Coefficients
t Sig. B Std. Error Beta
1 (Constant) -492647.326 762297.185 -.646 .518
Percentage Of Female Board Members
-617530.475 766228.446 -.020 -.806 .420
Chairmanship 180353.328 149051.715 .029 1.210 .226
Number Of Board Members -57157.144 35219.593 -.043 -1.623 .105
Total Number Of Board Seats Directors Excl CEO
63670.634 17859.553 .101 3.565 .000
Index_scale 718530.421 101166.783 .188 7.102 .000
ExecutivesAge 1113.603 9969.631 .003 .112 .911
Gender_code 502223.621 432593.350 .027 1.161 .246
Percentage Shares Owned By CEO
-25619.021 37293.013 -.016 -.687 .492
CEO Other Seats 4691.695 100503.836 .001 .047 .963
Number Of CEO Title Holding Directors
27540.044 101399.872 .007 .272 .786
a. Dependent Variable: Grant Date Fair Value of Stock Awarded
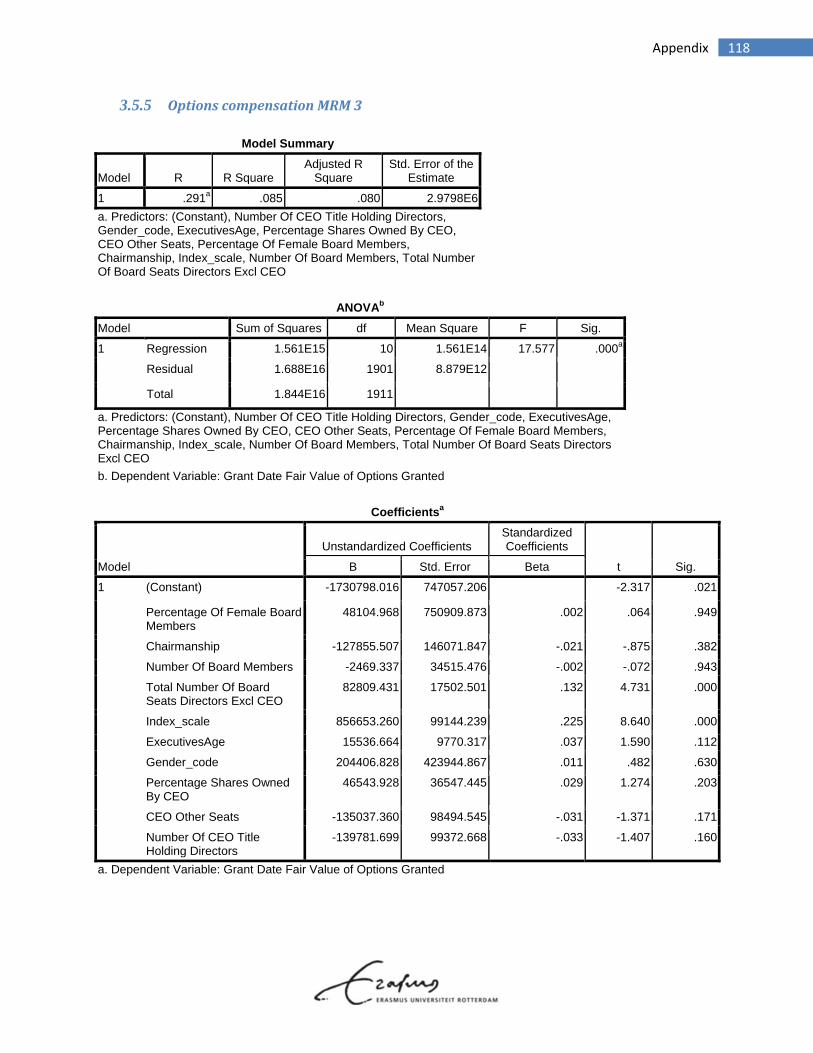
118 Appendix
3.5.5 OptionscompensationMRM3
Model Summary
Model R R Square Adjusted R
Square Std. Error of the
Estimate
1 .291a .085 .080 2.9798E6
a. Predictors: (Constant), Number Of CEO Title Holding Directors, Gender_code, ExecutivesAge, Percentage Shares Owned By CEO, CEO Other Seats, Percentage Of Female Board Members, Chairmanship, Index_scale, Number Of Board Members, Total Number Of Board Seats Directors Excl CEO
ANOVAb
Model Sum of Squares df Mean Square F Sig.
1 Regression 1.561E15 10 1.561E14 17.577 .000a
Residual 1.688E16 1901 8.879E12 Total 1.844E16 1911
a. Predictors: (Constant), Number Of CEO Title Holding Directors, Gender_code, ExecutivesAge, Percentage Shares Owned By CEO, CEO Other Seats, Percentage Of Female Board Members, Chairmanship, Index_scale, Number Of Board Members, Total Number Of Board Seats Directors Excl CEO
b. Dependent Variable: Grant Date Fair Value of Options Granted
Coefficientsa
Model
Unstandardized Coefficients Standardized Coefficients
t Sig. B Std. Error Beta
1 (Constant) -1730798.016 747057.206 -2.317 .021
Percentage Of Female Board Members
48104.968 750909.873 .002 .064 .949
Chairmanship -127855.507 146071.847 -.021 -.875 .382
Number Of Board Members -2469.337 34515.476 -.002 -.072 .943
Total Number Of Board Seats Directors Excl CEO
82809.431 17502.501 .132 4.731 .000
Index_scale 856653.260 99144.239 .225 8.640 .000
ExecutivesAge 15536.664 9770.317 .037 1.590 .112
Gender_code 204406.828 423944.867 .011 .482 .630
Percentage Shares Owned By CEO
46543.928 36547.445 .029 1.274 .203
CEO Other Seats -135037.360 98494.545 -.031 -1.371 .171
Number Of CEO Title Holding Directors
-139781.699 99372.668 -.033 -1.407 .160
a. Dependent Variable: Grant Date Fair Value of Options Granted

119 Appendix
3.5.6 TotalcompensationMRM3
Model Summary
Model R R Square Adjusted R
Square Std. Error of the
Estimate
1 .425a .181 .177 5.5344E6
a. Predictors: (Constant), Number Of CEO Title Holding Directors, Gender_code, ExecutivesAge, Percentage Shares Owned By CEO, CEO Other Seats, Percentage Of Female Board Members, Chairmanship, Index_scale, Number Of Board Members, Total Number Of Board Seats Directors Excl CEO
ANOVAb
Model Sum of Squares df Mean Square F Sig.
1 Regression 1.286E16 10 1.286E15 41.999 .000a
Residual 5.823E16 1901 3.063E13 Total 7.109E16 1911
a. Predictors: (Constant), Number Of CEO Title Holding Directors, Gender_code, ExecutivesAge, Percentage Shares Owned By CEO, CEO Other Seats, Percentage Of Female Board Members, Chairmanship, Index_scale, Number Of Board Members, Total Number Of Board Seats Directors Excl CEO
b. Dependent Variable: TotalCompensationSalaryBonusOtherAnnualRestricedStockGrantsLTIPP
Coefficientsa
Model
Unstandardized Coefficients Standardized Coefficients
t Sig. B Std. Error Beta
1 (Constant) -5340633.713 1387524.755 -3.849 .000
Percentage Of Female Board Members
243664.771 1394680.393 .004 .175 .861
Chairmanship 141141.985 271302.254 .012 .520 .603
Number Of Board Members -13041.351 64106.306 -.005 -.203 .839
Total Number Of Board Seats Directors Excl CEO
203011.665 32507.757 .165 6.245 .000
Index_scale 2481087.720 184142.641 .332 13.474 .000
ExecutivesAge 63141.469 18146.611 .077 3.480 .001
Gender_code 679628.019 787401.546 .019 .863 .388
Percentage Shares Owned By CEO
87329.230 67880.323 .028 1.287 .198
CEO Other Seats -223875.930 182935.950 -.026 -1.224 .221
Number Of CEO Title Holding Directors
-154213.481 184566.906 -.019 -.836 .404
a. Dependent Variable: TotalCompensationSalaryBonusOtherAnnualRestricedStockGrantsLTIPP
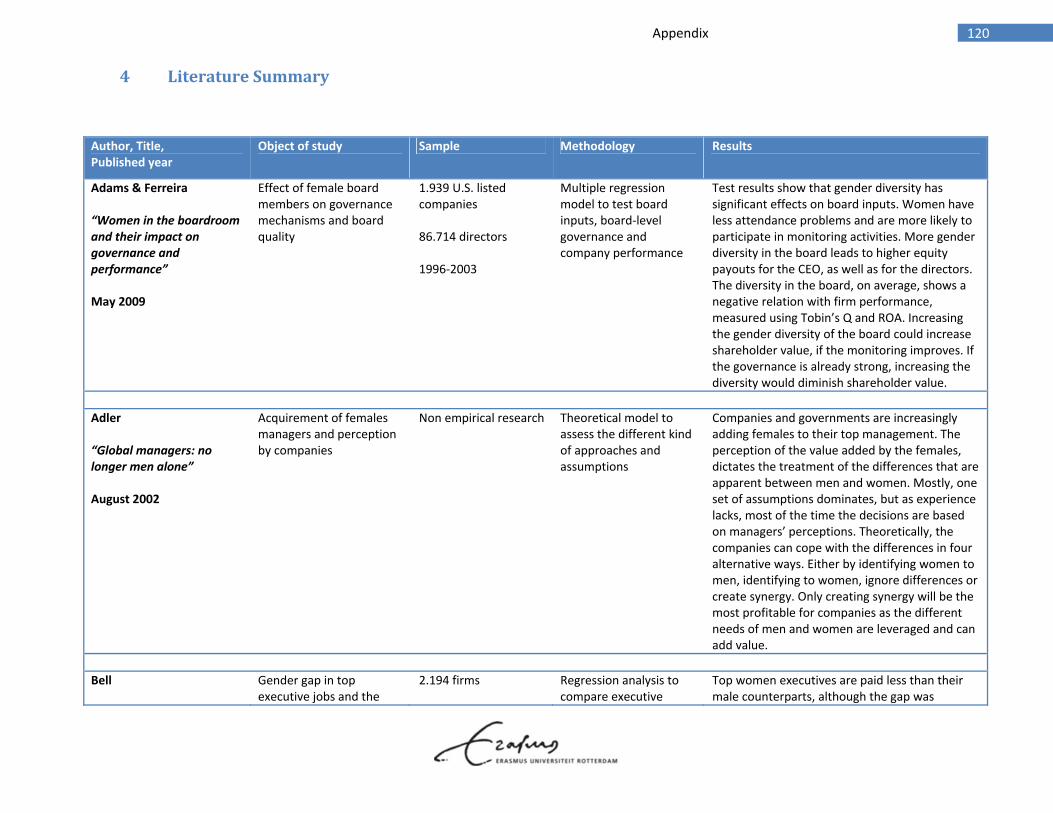
120 Appendix
4 LiteratureSummary
Author, Title, Published year
Object of study Sample Methodology Results
Adams & Ferreira “Women in the boardroom and their impact on governance and performance” May 2009
Effect of female board members on governance mechanisms and board quality
1.939 U.S. listed companies 86.714 directors 1996‐2003
Multiple regression model to test board inputs, board‐level governance and company performance
Test results show that gender diversity has significant effects on board inputs. Women have less attendance problems and are more likely to participate in monitoring activities. More gender diversity in the board leads to higher equity payouts for the CEO, as well as for the directors. The diversity in the board, on average, shows a negative relation with firm performance, measured using Tobin’s Q and ROA. Increasing the gender diversity of the board could increase shareholder value, if the monitoring improves. If the governance is already strong, increasing the diversity would diminish shareholder value.
Adler “Global managers: no longer men alone” August 2002
Acquirement of females managers and perception by companies
Non empirical research Theoretical model to assess the different kind of approaches and assumptions
Companies and governments are increasingly adding females to their top management. The perception of the value added by the females, dictates the treatment of the differences that are apparent between men and women. Mostly, one set of assumptions dominates, but as experience lacks, most of the time the decisions are based on managers’ perceptions. Theoretically, the companies can cope with the differences in four alternative ways. Either by identifying women to men, identifying to women, ignore differences or create synergy. Only creating synergy will be the most profitable for companies as the different needs of men and women are leveraged and can add value.
Bell
Gender gap in top executive jobs and the
2.194 firms
Regression analysis to compare executive
Top women executives are paid less than their male counterparts, although the gap was
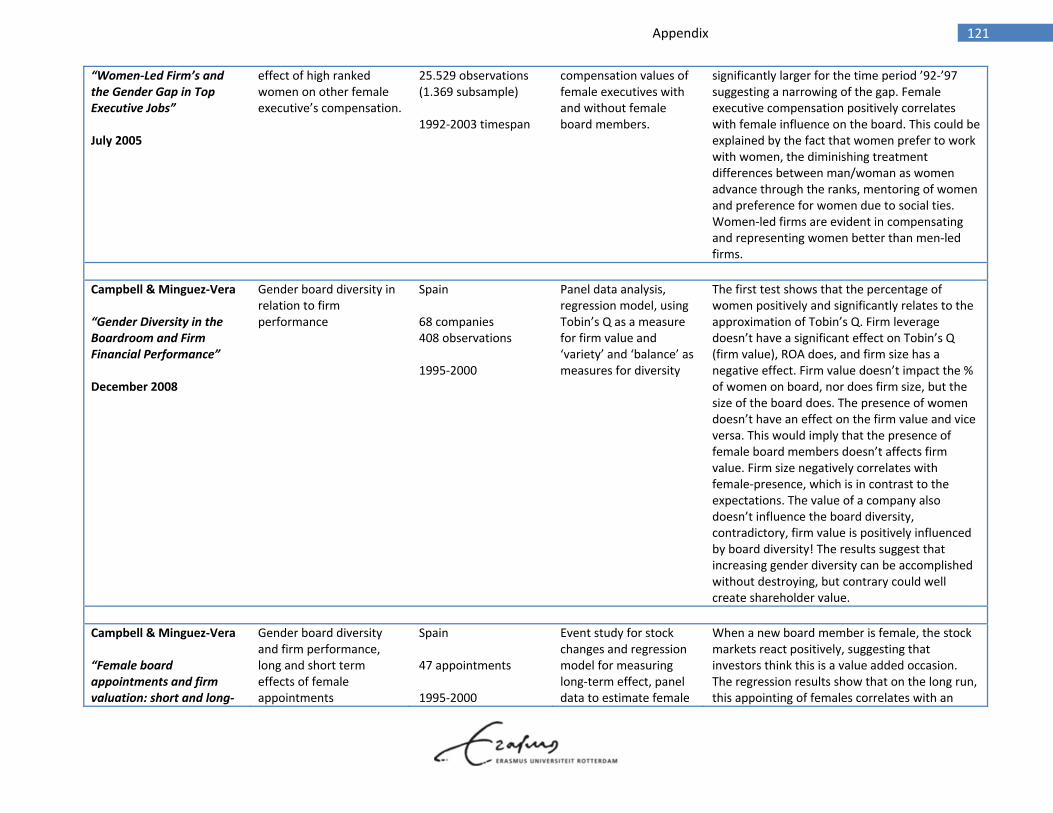
121 Appendix
“Women‐Led Firm’s and the Gender Gap in Top Executive Jobs” July 2005
effect of high ranked women on other female executive’s compensation.
25.529 observations(1.369 subsample) 1992‐2003 timespan
compensation values of female executives with and without female board members.
significantly larger for the time period ’92‐’97 suggesting a narrowing of the gap. Female executive compensation positively correlates with female influence on the board. This could be explained by the fact that women prefer to work with women, the diminishing treatment differences between man/woman as women advance through the ranks, mentoring of women and preference for women due to social ties. Women‐led firms are evident in compensating and representing women better than men‐led firms.
Campbell & Minguez‐Vera “Gender Diversity in the Boardroom and Firm Financial Performance” December 2008
Gender board diversity in relation to firm performance
Spain 68 companies 408 observations 1995‐2000
Panel data analysis, regression model, using Tobin’s Q as a measure for firm value and ‘variety’ and ‘balance’ as measures for diversity
The first test shows that the percentage of women positively and significantly relates to the approximation of Tobin’s Q. Firm leverage doesn’t have a significant effect on Tobin’s Q (firm value), ROA does, and firm size has a negative effect. Firm value doesn’t impact the % of women on board, nor does firm size, but the size of the board does. The presence of women doesn’t have an effect on the firm value and vice versa. This would imply that the presence of female board members doesn’t affects firm value. Firm size negatively correlates with female‐presence, which is in contrast to the expectations. The value of a company also doesn’t influence the board diversity, contradictory, firm value is positively influenced by board diversity! The results suggest that increasing gender diversity can be accomplished without destroying, but contrary could well create shareholder value.
Campbell & Minguez‐Vera “Female board appointments and firm valuation: short and long‐
Gender board diversity and firm performance, long and short term effects of female appointments
Spain 47 appointments 1995‐2000
Event study for stock changes and regression model for measuring long‐term effect, panel data to estimate female
When a new board member is female, the stock markets react positively, suggesting that investors think this is a value added occasion. The regression results show that on the long run, this appointing of females correlates with an
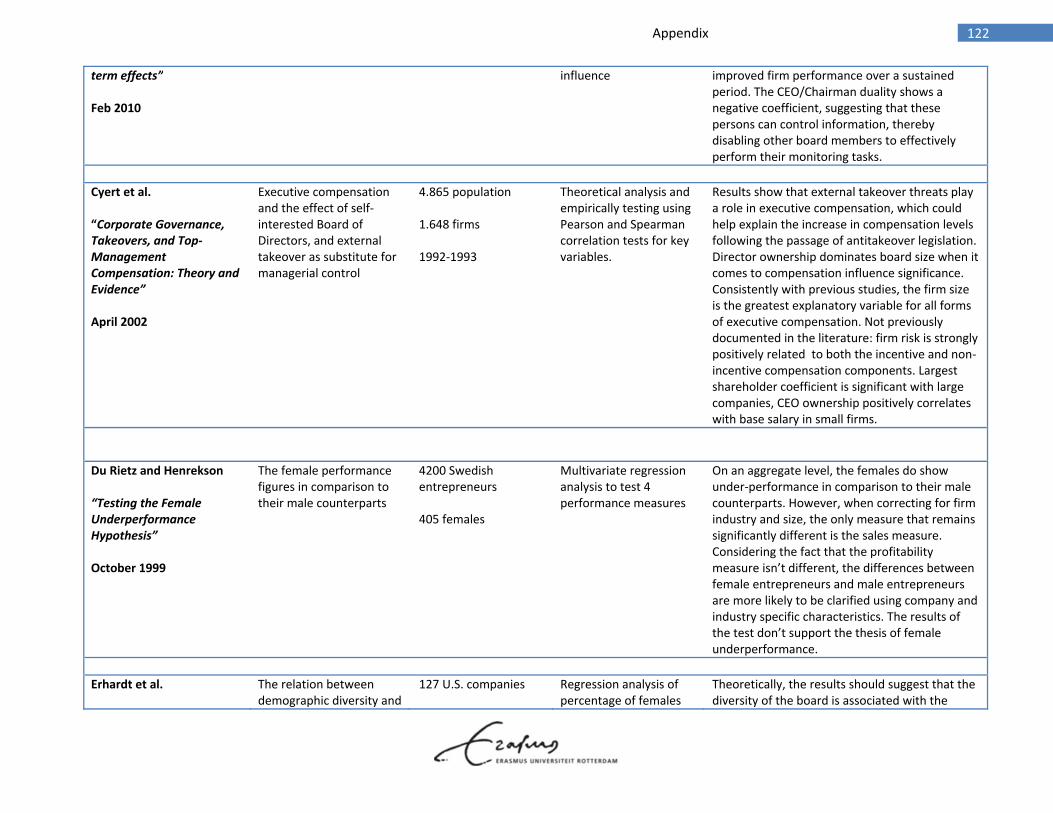
122 Appendix
term effects” Feb 2010
influence improved firm performance over a sustained
period. The CEO/Chairman duality shows a negative coefficient, suggesting that these persons can control information, thereby disabling other board members to effectively perform their monitoring tasks.
Cyert et al. “Corporate Governance, Takeovers, and Top‐Management Compensation: Theory and Evidence” April 2002
Executive compensation and the effect of self‐interested Board of Directors, and external takeover as substitute for managerial control
4.865 population 1.648 firms 1992‐1993
Theoretical analysis and empirically testing using Pearson and Spearman correlation tests for key variables.
Results show that external takeover threats play a role in executive compensation, which could help explain the increase in compensation levels following the passage of antitakeover legislation. Director ownership dominates board size when it comes to compensation influence significance. Consistently with previous studies, the firm size is the greatest explanatory variable for all forms of executive compensation. Not previously documented in the literature: firm risk is strongly positively related to both the incentive and non‐incentive compensation components. Largest shareholder coefficient is significant with large companies, CEO ownership positively correlates with base salary in small firms.
Du Rietz and Henrekson “Testing the Female Underperformance Hypothesis” October 1999
The female performance figures in comparison to their male counterparts
4200 Swedish entrepreneurs 405 females
Multivariate regression analysis to test 4 performance measures
On an aggregate level, the females do show under‐performance in comparison to their male counterparts. However, when correcting for firm industry and size, the only measure that remains significantly different is the sales measure. Considering the fact that the profitability measure isn’t different, the differences between female entrepreneurs and male entrepreneurs are more likely to be clarified using company and industry specific characteristics. The results of the test don’t support the thesis of female underperformance.
Erhardt et al.
The relation between demographic diversity and
127 U.S. companies
Regression analysis of percentage of females
Theoretically, the results should suggest that the diversity of the board is associated with the
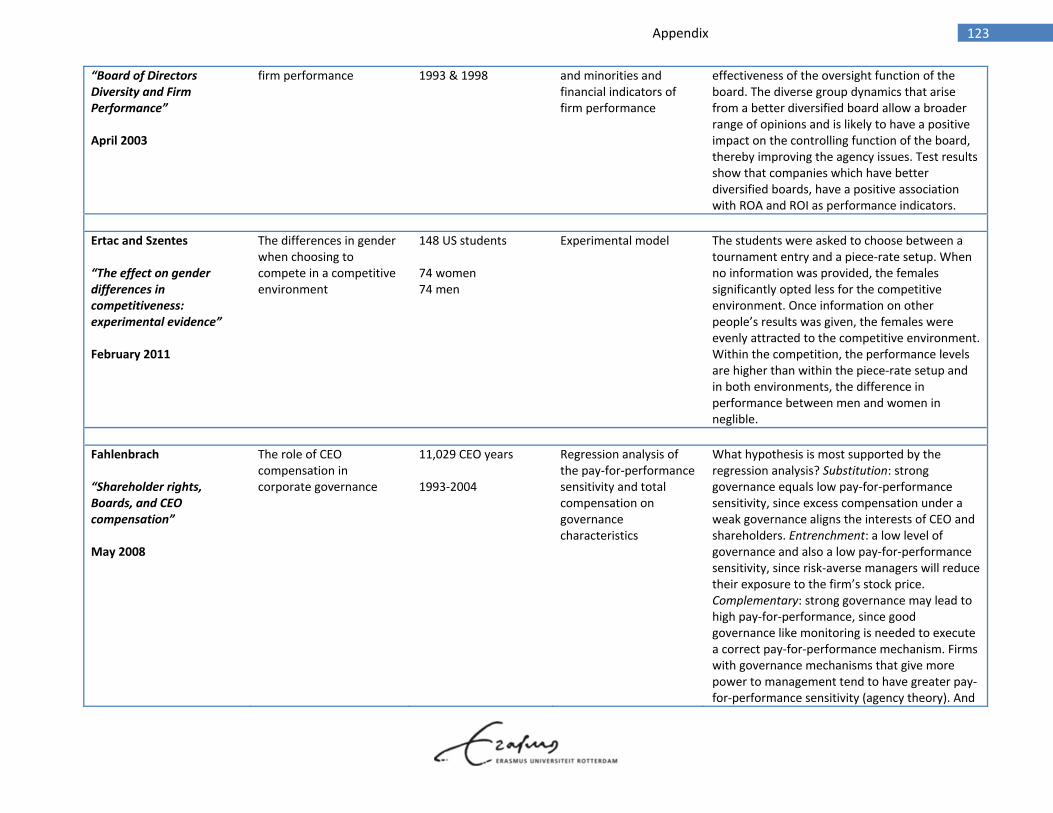
123 Appendix
“Board of Directors Diversity and Firm Performance” April 2003
firm performance 1993 & 1998
and minorities and financial indicators of firm performance
effectiveness of the oversight function of the board. The diverse group dynamics that arise from a better diversified board allow a broader range of opinions and is likely to have a positive impact on the controlling function of the board, thereby improving the agency issues. Test results show that companies which have better diversified boards, have a positive association with ROA and ROI as performance indicators.
Ertac and Szentes “The effect on gender differences in competitiveness: experimental evidence” February 2011
The differences in gender when choosing to compete in a competitive environment
148 US students 74 women 74 men
Experimental model The students were asked to choose between a tournament entry and a piece‐rate setup. When no information was provided, the females significantly opted less for the competitive environment. Once information on other people’s results was given, the females were evenly attracted to the competitive environment. Within the competition, the performance levels are higher than within the piece‐rate setup and in both environments, the difference in performance between men and women in neglible.
Fahlenbrach “Shareholder rights, Boards, and CEO compensation” May 2008
The role of CEO compensation in corporate governance
11,029 CEO years 1993‐2004
Regression analysis of the pay‐for‐performance sensitivity and total compensation on governance characteristics
What hypothesis is most supported by the regression analysis? Substitution: strong governance equals low pay‐for‐performance sensitivity, since excess compensation under a weak governance aligns the interests of CEO and shareholders. Entrenchment: a low level of governance and also a low pay‐for‐performance sensitivity, since risk‐averse managers will reduce their exposure to the firm’s stock price. Complementary: strong governance may lead to high pay‐for‐performance, since good governance like monitoring is needed to execute a correct pay‐for‐performance mechanism. Firms with governance mechanisms that give more power to management tend to have greater pay‐for‐performance sensitivity (agency theory). And
124 Appendix
although the index of shareholder rights doesn’t correlate with the pay‐for‐performance sensitivity and CEO compensation as expected under the entrenchment hypothesis, test results partly support this hypothesis. The evidence overall suggests that entrenched managers don’t influence their sensitivity and total pay.
Farrell and Hersch “Additions to corporate boards: the effect of gender” November 2005
The likelihood of female director entrance on corporate boards
Fortune & Service 500 companies (U.S.) 266 firms 1990‐1999
Event study for announcements of new female directors
The results show that the growing population of female board directors over the measured decade, wasn’t performance based, but more likely to be a response of companies on the internal/external call for diversity. Women seem to function on boards of better performing firms and the announcement of woman being added to a board, seems to trigger insignificant abnormal returns. The likelihood of a women being added to a board, decreases when there is already a women on the board.
Felo “Ethics Programs, Board Involvement, and Potential Conflict of Interest in Corporate Governance” August 2001
Ethics programs, the board involvement therein and the potential conflicts of interest
1995‐1996 136 firms
Analysis of covariance using ANCOVA model to test the effect of ethics program on compensation while correcting for firm size
Firms in which the boards are more actively involved in ethics programs, have a higher percentage of independent board members. Active firms are more likely to compensate outside directors with equity. Insider participation on compensation committees isn’t significant between ethics‐program active and non‐active. The existence of an ethics program alone isn’t related to potential conflicts of interest, but combined with active oversight, the supplemental analysis shows that it is related to a lower incidence of conflicts in the corporate governance structures. Shareholders could therefore benefit from such a combination of an ethics program an oversight.
Frydman and Jenter “CEO compensation”
The development of CEO pay and the relation between pay and firm
US market, publicly listed companies.
Literature review CEO pay grew rapidly in the mid 70’s till the 90’s, faster than other executives’ pay. Stock options were becoming a greater proportion of the total
125 Appendix
September 2010
performance. Papers used on:
Level and structure of CEO pay
Relation CEO pay and firm performance
Effects of CEO pay on firm behavior
compensation. Average pay declined in 2001‐2008. Although previous studies have shown the predicted relation between executive pay to stock price performance, this underestimates the short term goals in managerial incentives. This incentive increased over the last decades, most steep in the 90’s. Managerial power and competitive market are both important forces that determine CEO pay, but empirically, none is exclusive. There’s enough literature that discusses CEO compensation and portfolio incentives in relation to corporate behavior, but measuring causality is extremely difficult.
Gayle et al. “Gender Differences in Executive Compensation and Job Mobility” January 2010
The promotion and compensation rates of female vs. male executives, job mobility and attrition rates.
2.818 firms(1.800 subsample) 162.592 observations (71.803 subsample) (16.300 subsample) 1992‐2006 period
Multinomial logit model to address rank and employment transitions, regression models on compensation.
Women work longer for one firm, but attrit faster, therefore have a lower average age. They consequently have fewer executive experience and earn lower salaries and compensation, but are a little more likely to have a higher education. The promotion rates are identical, but at the higher ranks the external transition differs between males/females. The authors interpret aforementioned as the glass ceiling. On conclusion it shows that given background and rank, women earn more than men. Aggregate differences observed in the executive market between genders are driven by factors other than compensation packages and promotion opportunities.
Ghosh and Sirmans “On REIT CEO Compensation: Does Board Structure Matter?” April 2005
Structure of REIT board’s and CEO compensation
330 firms 1998‐2000
Correlation analysis between CEO compensation and economic / structure variables. Two‐Stage Least Squares to estimate association
The rise of pay‐for‐performance contracts created the potential to persevere self‐serving incentives. To protect shareholder value by appointing and monitoring the CEO, the board has a critical role. However, the structure of the board as well as the nomination of the CEO leaves a lot to be desired. Board independency is compromised due to interlock and CEO chairmanship. Busy and older directors have less
126 Appendix
time and/or incentives to be critical. This research shows that CEO compensation positively relates with the company’s ROA, larger companies pay more and large boards and/or with older board members tend to be more generous. Non‐affiliated members impact compensation positive, which is unexpected. Blockholders diminish pay, which is as expected. CEO power in controlling the board selection reflects in setting CEO pay, therefore independent board members will have little effect.
Gill and Prowse “Gender Differences and Dynamics in Competition: The Role of Luck” June 2010
Gender differences in competitive environment
120 participants 58 second movers 6 sessions
Experimental simulation Having people matched and work out a cooperative task, the assessment of loss or win is analyzed. The females tend to be more sensitive for losses as they lower their efforts after a loss, whereas men only lower their efforts after suffering a big loss. Women also don’t seem to like winning big prices, on which could be concluded that women are more competition (risk) averse than men.
Guthrie et al. “Are Women “Better” than Men? Personality Differences and expatriate selection” April 2003
Personal perception of female qualities in selection expatriate candidates
1080 participants US students
Simulation model The five personality dimensions are used to simulate a model in which the participants have to value the person specific qualities of males and females in order to select the appropriate person for the hypothetical expatriate job. These selection criteria seem to favor the women, as they are acknowledged as better candidates for the job. However, reality shows that females are underrepresented in these kind of jobs. Could this be due to the fact that women don’t personally prefer this kind of work? Or perhaps companies are reluctant to choose women as the function’s environment won’t accept women?
Harris and Jenkins
Gender impact on risk assessment
657 subjects389 females
Survey Male and female students were asked to assess their likeliness to participate in four different
127 Appendix
“Gender Differences in Risk Assessment: Why do Women Take Fewer Risks than Men?” July 2006
268 males US students
kind of risky activities (gambling, health, recreation, and social) and try to express an estimate on the possible negative outcome occurrence, the impact of a possible negative outcome and the satisfaction when fulfilling such an activity and success is achieved. The women perceived a greater chance of negative outcomes and they expected less of a satisfaction, causing them to show a lower propensity towards gambling, recreation and health. In social risks, the genders did not differ from each other. On the fifth (extra) domain, where high potential payoffs and low fixed costs were presented, the females engaged more than men.
Huse et al. “Women and Employee‐Elected Board Members, and Their Contributions to Board Control Tasks” November 2009
The effect of employee‐elected board members and female board members on the effectiveness of the board
Norwegian survey data 840 respondents 212 employee‐elected 186 woman 2006
Multiple linear regression model
The survey results show that the level of CSR relates to the employee‐elected and/or female board members. The findings indicate that these two kinds of board members can contribute to board effectiveness, albeit that the effect is sensitive for real diversity of the board, instead of just a demographic diversity. Besides CSR, strategic and budget control, a seven‐point Likert scale is validated for behavioral control. Three items that scaled behavioral control are; evaluation of CEO behavior, evaluation of CEO compensation, evaluation of compensation systems for the top management team. Employee‐elected board members positively influence CSR and strategic control, but not budget or behavioral. The two variables on female board members turned out insignificant in all equations! However a positive relation does exist between ratio of female board members and behavioral control.
Khan et al.
The intervening variables that determine personal
406 employees
Questionnaire
The researchers use three intervening variables namely; respect and fairness in the workplace,
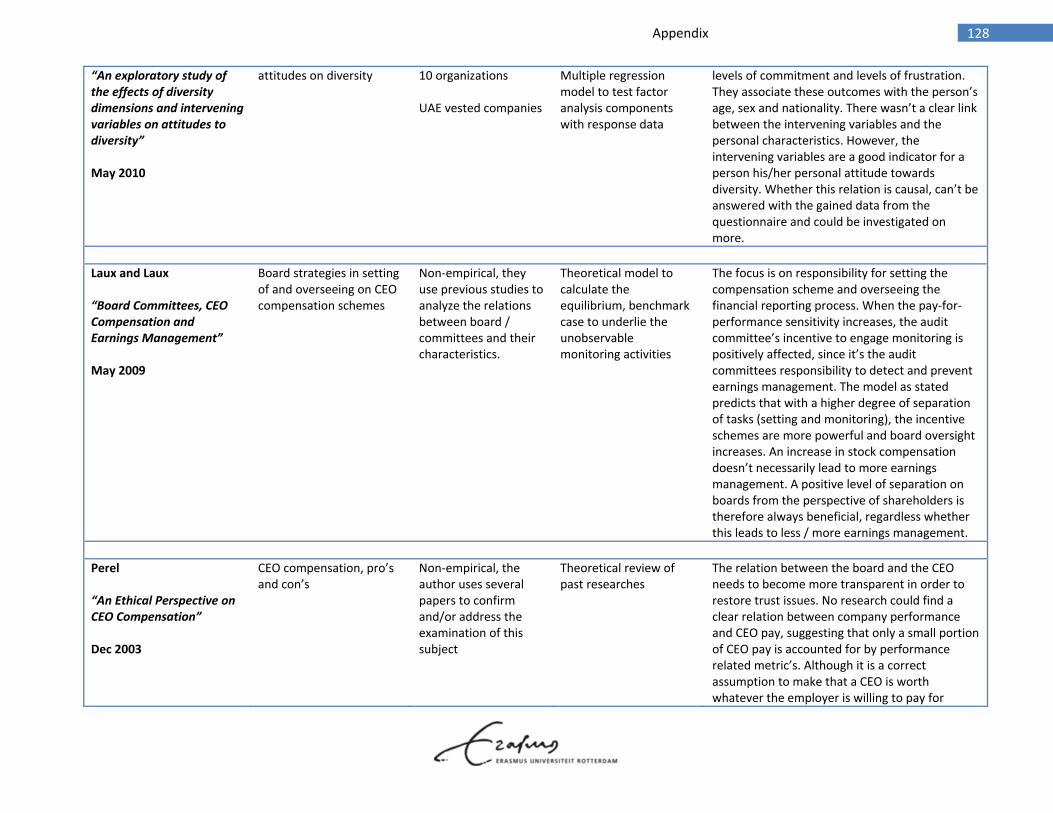
128 Appendix
“An exploratory study of the effects of diversity dimensions and intervening variables on attitudes to diversity” May 2010
attitudes on diversity 10 organizations UAE vested companies
Multiple regression model to test factor analysis components with response data
levels of commitment and levels of frustration. They associate these outcomes with the person’s age, sex and nationality. There wasn’t a clear link between the intervening variables and the personal characteristics. However, the intervening variables are a good indicator for a person his/her personal attitude towards diversity. Whether this relation is causal, can’t be answered with the gained data from the questionnaire and could be investigated on more.
Laux and Laux “Board Committees, CEO Compensation and Earnings Management” May 2009
Board strategies in setting of and overseeing on CEO compensation schemes
Non‐empirical, they use previous studies to analyze the relations between board / committees and their characteristics.
Theoretical model to calculate the equilibrium, benchmark case to underlie the unobservable monitoring activities
The focus is on responsibility for setting the compensation scheme and overseeing the financial reporting process. When the pay‐for‐performance sensitivity increases, the audit committee’s incentive to engage monitoring is positively affected, since it’s the audit committees responsibility to detect and prevent earnings management. The model as stated predicts that with a higher degree of separation of tasks (setting and monitoring), the incentive schemes are more powerful and board oversight increases. An increase in stock compensation doesn’t necessarily lead to more earnings management. A positive level of separation on boards from the perspective of shareholders is therefore always beneficial, regardless whether this leads to less / more earnings management.
Perel “An Ethical Perspective on CEO Compensation” Dec 2003
CEO compensation, pro’s and con’s
Non‐empirical, the author uses several papers to confirm and/or address the examination of this subject
Theoretical review of past researches
The relation between the board and the CEO needs to become more transparent in order to restore trust issues. No research could find a clear relation between company performance and CEO pay, suggesting that only a small portion of CEO pay is accounted for by performance related metric’s. Although it is a correct assumption to make that a CEO is worth whatever the employer is willing to pay for
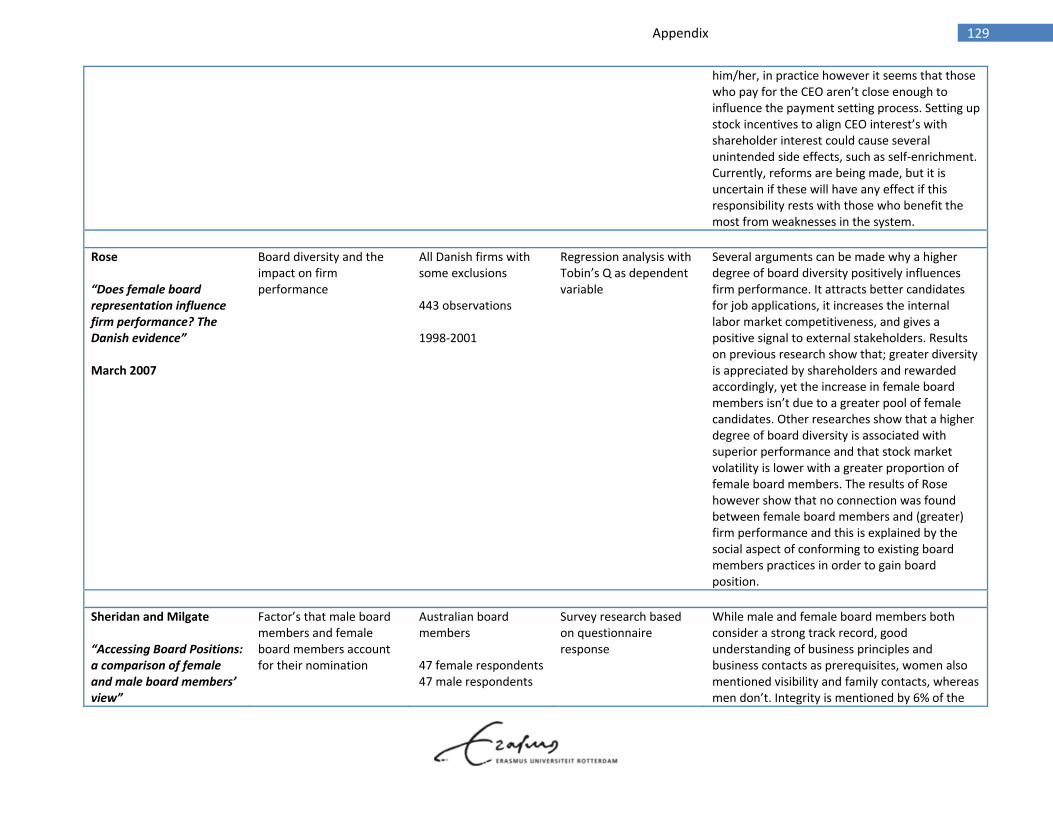
129 Appendix
him/her, in practice however it seems that those who pay for the CEO aren’t close enough to influence the payment setting process. Setting up stock incentives to align CEO interest’s with shareholder interest could cause several unintended side effects, such as self‐enrichment. Currently, reforms are being made, but it is uncertain if these will have any effect if this responsibility rests with those who benefit the most from weaknesses in the system.
Rose “Does female board representation influence firm performance? The Danish evidence” March 2007
Board diversity and the impact on firm performance
All Danish firms with some exclusions 443 observations 1998‐2001
Regression analysis with Tobin’s Q as dependent variable
Several arguments can be made why a higher degree of board diversity positively influences firm performance. It attracts better candidates for job applications, it increases the internal labor market competitiveness, and gives a positive signal to external stakeholders. Results on previous research show that; greater diversity is appreciated by shareholders and rewarded accordingly, yet the increase in female board members isn’t due to a greater pool of female candidates. Other researches show that a higher degree of board diversity is associated with superior performance and that stock market volatility is lower with a greater proportion of female board members. The results of Rose however show that no connection was found between female board members and (greater) firm performance and this is explained by the social aspect of conforming to existing board members practices in order to gain board position.
Sheridan and Milgate “Accessing Board Positions: a comparison of female and male board members’ view”
Factor’s that male board members and female board members account for their nomination
Australian board members 47 female respondents 47 male respondents
Survey research based on questionnaire response
While male and female board members both consider a strong track record, good understanding of business principles and business contacts as prerequisites, women also mentioned visibility and family contacts, whereas men don’t. Integrity is mentioned by 6% of the
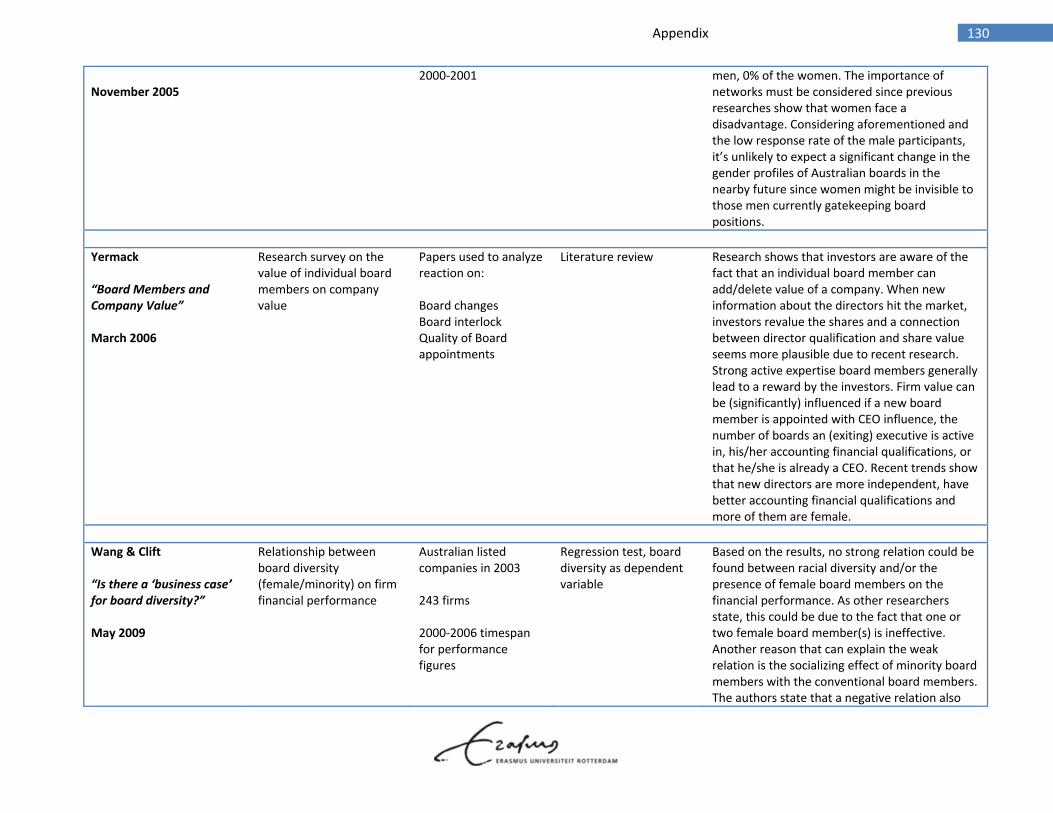
130 Appendix
November 2005
2000‐2001 men, 0% of the women. The importance of networks must be considered since previous researches show that women face a disadvantage. Considering aforementioned and the low response rate of the male participants, it’s unlikely to expect a significant change in the gender profiles of Australian boards in the nearby future since women might be invisible to those men currently gatekeeping board positions.
Yermack “Board Members and Company Value” March 2006
Research survey on the value of individual board members on company value
Papers used to analyze reaction on: Board changes Board interlock Quality of Board appointments
Literature review Research shows that investors are aware of the fact that an individual board member can add/delete value of a company. When new information about the directors hit the market, investors revalue the shares and a connection between director qualification and share value seems more plausible due to recent research. Strong active expertise board members generally lead to a reward by the investors. Firm value can be (significantly) influenced if a new board member is appointed with CEO influence, the number of boards an (exiting) executive is active in, his/her accounting financial qualifications, or that he/she is already a CEO. Recent trends show that new directors are more independent, have better accounting financial qualifications and more of them are female.
Wang & Clift “Is there a ‘business case’ for board diversity?” May 2009
Relationship between board diversity (female/minority) on firm financial performance
Australian listed companies in 2003 243 firms 2000‐2006 timespan for performance figures
Regression test, board diversity as dependent variable
Based on the results, no strong relation could be found between racial diversity and/or the presence of female board members on the financial performance. As other researchers state, this could be due to the fact that one or two female board member(s) is ineffective. Another reason that can explain the weak relation is the socializing effect of minority board members with the conventional board members. The authors state that a negative relation also
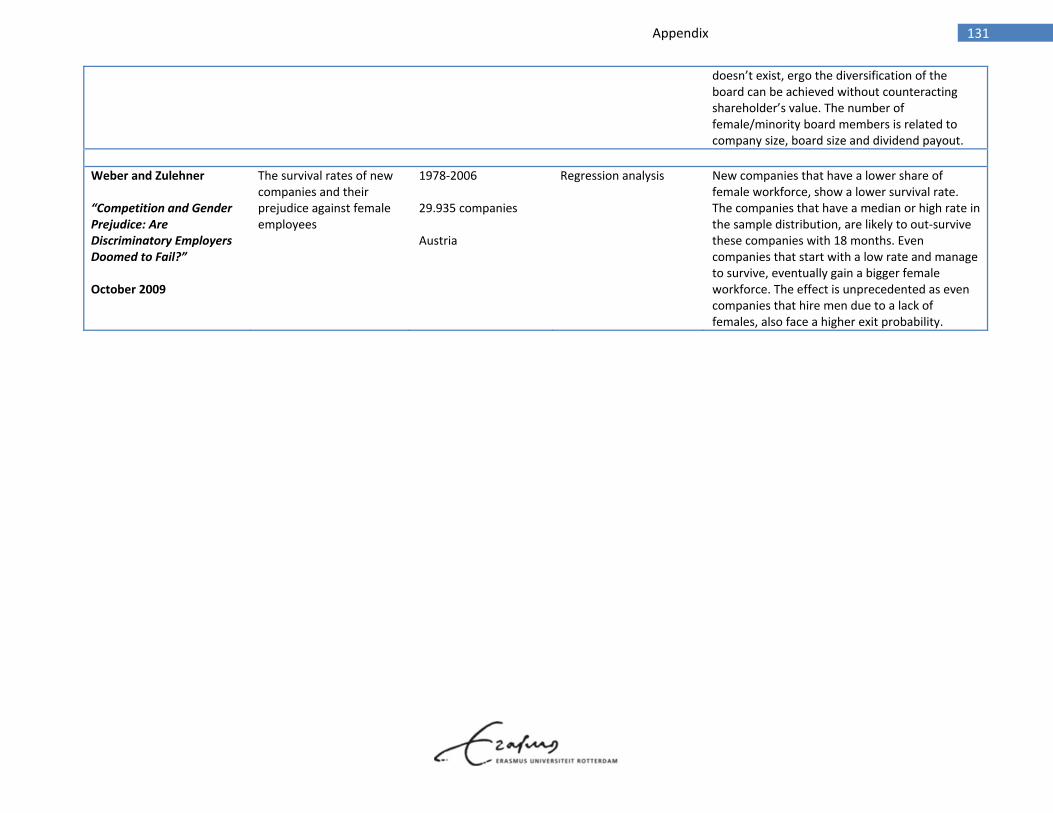
131 Appendix
doesn’t exist, ergo the diversification of the board can be achieved without counteracting shareholder’s value. The number of female/minority board members is related to company size, board size and dividend payout.
Weber and Zulehner “Competition and Gender Prejudice: Are Discriminatory Employers Doomed to Fail?” October 2009
The survival rates of new companies and their prejudice against female employees
1978‐2006 29.935 companies Austria
Regression analysis New companies that have a lower share of female workforce, show a lower survival rate. The companies that have a median or high rate in the sample distribution, are likely to out‐survive these companies with 18 months. Even companies that start with a low rate and manage to survive, eventually gain a bigger female workforce. The effect is unprecedented as even companies that hire men due to a lack of females, also face a higher exit probability.