Embed Size (px)
Citation preview

·:1 I"'· (:.
I I I I I I I I I I I I I I I I I I
-~~-~-~~-----------------
.""
THE EFFECTS OF ~~SELF-HELP" PRECAUTIONARY
MEASURES ON CRIMINAL VICTIMIZATION AND FEAR
~ N N ~ (:) ~
RESEARCH REPORT SERIES
NUMBER 12
KenTUCKY CRiminAL
JUSTICE
rRONG ERAL
STATIST~(AL AnALYSIS
"~I cenTER URBAN STUDIES CENTER
UNIVERSITY OF LOUISVILLE
If you have issues viewing or accessing this file, please contact us at NCJRS.gov.

KENTUCKY CRIMINAL JUSTICE srA~<mCAL AN.AT.YSIS CENTER.
THE MISSION
The Kent'ucky Criminal Justice Statistic~;l Analysis Center (SAC) gas established in 1984 as a .centralized clearinghouse for' criminal justice statistics. A major objective of SAC is to gather concrete data about the criminal: justice system in Kentucky and to disseminate that data stgtewide. With this information., policymakers will be better able to make criminal justice decisions.
THE STAFF
Co-Di rectors:
Manager:
University Faculty:
Researcher:
RECEwr RESEARCH PRODUCTS
• Capital Punishment
C. Bruce Traughber Office of the Attorney General Commonwealth of Kentucky
Knowlton W. Johnson, Ph.D. Urban Studies Center College of .Urban and Public Affairs University of Louisville
Jack B. Ellis
Gordon S. Bonham, Ph.D. Gennaro F. Vito, Ph.D.
Patricia L. Hardyman
• Child Abuse and Neglect
• Crime Estimation Program
• Criminal Justice Agencies Data Inventory
• Criminal Justice Needs-Use Assessment
• Criminal Victimization
• Offender-Based Tracking System
& Persistent Felony Offenders
THE CENTER
The Kentucky Criminal Justice Statistical Analysis Center is housed in the Office of the Attorney General, Commonwealth of Kentucky, and operated by the Urban Studies Center--the policy research component of the College of Urban and Public Affairs--in cooperation with the U.S. Bureau of Justice Statistics.
SAC is available to assist you in meeting your data and information needs. For more information, contact:
Mr. Jack B. Ellis Urban Studies Center College of Urban and Public Affairs University of Louisville Louisville, Kentucky 40292 (502) 588-6626
I I I I I I
I I I I I I I I I I I

I I I I I I I I I I I I I I I I I fl !'
1 0 8 2 2-3
THE EFFECTS OF "SELF-HELP" PRECAUTIONARY MEASURES
ON CRIMINAL VICTIMlZA~'ION AND FEAR
Research Report Series: Number 12
(Y) (',J
N (1)"'0>.-00 ...cQ):':O
---'-Q) <:) E~~2
Conducted by r-I e U) 0)'';:: -cow -g.~ ~:: .~'ao C'd ~ 0 c 5 w.... .-
Urban Studies Center .... oom "'~"Oz
'" '" ~.~ -g ~ U u
of Public Affairs ~~ __ co_
College Urban and TICUl
_
.;-, Cd (I) ..... 0 XC°(J) '0'0 Q)._..c: Q)
University of Loui svi lIe -Q) "O°3'u c- Ola."'o: Ol :::I 0""; 0
E:E :l 'c,~ a. e·s= 0 1::"' m.E 0._ a. mOe Ol m ~.s Q).2 cc cnm-.0 c·C' o 'US
CI);:: Q) o..c c-·m Ol - D.
Fran H. Nord s, Ph.D. ::lz .05<1>_ (1)'- '-.m camctJo
.r.=..t:! 'E ~ Knowlton Johnson, Ph.D. W. ~ ~~ ~ E .... ::J.c 0,,-::J ..... o_ g 0"0 ffi . "0 C en U) OJ (f)@:C~~ '- '- - c. VJ .= ~.E ~ ~
for
Kentucky Criminal Justice Statistical Analysis Center
David L. Armstrong
Attorney General
NCJR5
DEC 4 1987
c Ol Ol .0
"' '" .c !ii .~
rn E "0 Cf.l
i t-J PI '--J::
" • .-1 m £ Cd
~ Ol
" 0 :J '0 Q o C. ~ U 0 '.-1 ;;>,r-l ,Q .o..Q m"O ~ .~~~ ~ '" Ol ~ 0.01
July 1987 ACQUleHTIONS
([) u .-I .jJ U)
~ t-j
4-1 0
-lJ J:: ([)
f:l .jJ H Cd P.t ([) Q . Cf.l
0
en 'E
$ ID D. a: UJ -,
C.l ~ ~ '5 Ol
0-
" ~ '~ E Ol Ol en iii Ol >, "
m C en ~ a: Ol -, w C.l a: z Ol Ol .~ £. iii '0 :::I -, Ol !ii "0":
,- Ol c 2c: 'E :J~
(5 00
gJ !ii c: '" ,Q :J
"0 iii e CJ Z D.Ol Ol ~£ £ ID-.9 .cO
§ J~ LLm

AUTHORS I NOTES
Dr. Fran Norris; principal author: ;;-las responsible for overseeing this
secondary analysis of data collected in a Statistical Analysis Center (SAC)
1985-86 Victimization Survey. The survey itself was directed by Dr. Knowlton
Johnson, coauthor. Dr. Norris conducted the statistical analysis. Both
authors made essentially equal contributions to the study with regard to
developing its measures, interpreting the data, and writing the final report.
The authors would like to express their appreciation to the follo>oling
Urban Studies Center staff members who provided support serVIces and
consultation to the project: Patricia Hardyman, Lisa Johnson, Monica Bowles,
Elizabeth Jones, Rebecca McKelvy, Nancy Roseberry, Vernon Smith, and Ivan Weir.
We also thank a number of individuals for their comments on an earlier version
of the report: Bruce Traughber and Jack Ellis, of the Office of the Attorney
General; Dr. J. Price Foster, Dean of the College of Urban Affairs (CUPA) at
the University of Louisville; Dr. William Pelfrey, Director of the School of
Justice Administration; and Timothy Crowe, Director of the National Crime
Prevention Institute, and his staff, Ms. Barbara Bomar and Joe Mele.
This report IS a product of the Kentucky Criminal Justice Statistical Analysis Center.
Co-Directors
Knowlton W. Johnson Urban Studies Center
C. Bruce Traughber Office of the Kentucky Attorney General
The SAC IS funded by the Bureau of Justice Statistics, U.S. Department of Justice, Grant No. 84-BJ-CX-0013. Points of view or opinions stated in this document are those of the authors and do not necessarily represent the official POSItIon Or policies of the Bureau of Justice Statistics or the University of Louisville as a whole, its trustees, chief administrative officers, or any division of the University.
11
-----------~-----~-----------~-----~~~--~~-
I I I I I I I I I I I I I I I I I I I

I
I I I I I I I I I I I I I
DAVID L. ARMSTRONG ATTORNEY GENERAL
Dear Reader:
COMMONWEALTH OF KENTUCKY
OFFICE OF THE ATTORNEY GENERAL
CAPITOL BUILDING FRANKFORT 40601
Kentucky's Criminal Justice Statistical Analysis Center is now three years old. During these formative years, the SAC has had an impact beyond all reasonable expectations. From our first research on PFO's, Offender-Based Tracking Systems, prison populations, child abuse and crime victims have come new programs and legislation that have, and will continue to have, a beneficial impact on Kentucky I s system of cr iminal justice.
One area of special concern to me has been the plight of ar ime' s victims. We have devoted considerable energy to researching various victim-related issues and are receiving national attention for our work. Our CREST (Crime Estimation) project is now an annual survey of the impact of cr ime on Kentucky's citizens.
I want to commend the various state agencies that have been so cooperative in '-lorking closely with us on our various research projects-- the Cabinet for Human Resources, the Corrections Cabinet, the Depar tment for Publ ic Advocacy, the Legislative Research Commission, the State Police and the Administrative Office of the Courts. The Bureau of Justice Statistics and our grant moni tor, Mr. Don Manson f have always been helpful and supportive as well.
A special thanks is due the men and, women in the General Assembly of Kentucky who have recognized the importance of the SAC and appropriated General Fund dollars .Eor its continued operation. with their support, ~,he SAC will be able to continue providing what we believe is policy-relevant research of the highest caliber.
As I turn the reins of the SAC over to a new Attorney General in 1988, I want to thank you for your cooperation and support as we have worked so hard to create this research arm of Kentucky's criminal justice system. Facts and figures are valuable tools as we work to fulfill government's first obligation--to enhance the safety and security of citizens.

I I I I I I I I I I I I I I I I I I I
EXECUTIVE SUMMARY
In July 1984, the Kentucky Criminal Justice Stat i s tical Analysis Center
(SAC) was established in the Office of the Attorney General with its research
support provided through the Urban Studies Center in the College of Urban and
Public Affairs at the University of LOUIsville. From the outset, the Kentucky
SAC has made a concerted effort to produce and disseminate useful research
findings relating to criminal victimization and the fear of crime. During the
first three years in operation, SAC completed a major longitudinal study of
criminal victimization and fear of crlme, established a statewide crlme
estimation program based on self-reported victimization and fear data, and
organized a statewide crintinal victimization research conference for Augu~t
1987.
The l~sults being presented 1n Research Report #12 are based on a
secondary ~nalysis of data from the Kentucky SAC's 1985-86 longitudinal study
of criminal victimization and fear. This executive summary first presents
selected findings from the larger longitudinal study reported in SAC Research
Report #9 before turning to the scope of the present study and its procedures,
findings, and implications.
Findings from "Criminal Victimization in Kentucky: A Longitudinal Study"
•
•
•
Over 20 percent (20.5%) of the households experienced a crime dudng Report Year 1986; 19.4 percent experienced a property crime; and 2.5 percenl experienced a violent cl"ime. These rates were about the same as those reported in Kentucky during Report Year 1985.
The 1986 cnme ra te was more households that had experienced it was among those that had not previous year (15.5%).
than twice as high among a crime in 1985 (40.8%) as experienced a crime in the
Most Kentuckians Methods frequently parked away from another I shames. alarms installed.
take some precautions against crime. practiced include locking vehicles when home and keeping an eye out on one Very few respondents have had burglar
In the short term (within one year of the incident) respondents from households vi ct imized by crime were more fearful than respondents from nonvictim households.
1V

I I I I I I I I I I I I I I I I I I I
o
In the long term (more than one year after the incident) the level of fear in victim households continued to be higher than the level of fear in nonvictim households. The long-term effects of violence on fear were more pronounced than were the long-term effects of experiencing property crlmes.
Only about 9 percent of the respondents of victim households reported use of any of the vic tim services of which they were aware.
The investigators concluded that programs need to be designed for victims that focus on their continuing fear of crime and on their risk for recurrent victimization. One possibility noted for future study was that of incorporating instruction in crime prevention into victim programs.
Scope of Present Study
The present study addresses the efficacy of "self-help" prevention
measures (e.g., locking automobile, engraving property, etc.) as a "stand
alone" crime- and fear-reducing strategy. Two questions guided the research
reported herein: (1) To what extent are "self-help" precautionary measures
effective in preventing victimization and (2) To what extent do these measures
reduce the long-term impact of victimization on fear? This study doe,> not
address the question of whether the activities of crlme prevention specialists
significantly reduce criminal victimization or the fear of crime. This issue
will be addressed in a future SAC study.
Procedures and Measures
18 Selected by random-digit-dialing techniques, 557 persons were interviewed by telephone in the spring of 1985. Of
•
these persons, 445 were interviewed again one year later.
The data were weighted by the probability of selection in 1985 and by 1986 response rates so that the findings may be considered generally representative of the Kentucky population.
Victimization was scaled using a crime severity index developed by Wolfgang and others which weights and sums the following components into a single value: (1) harm and injury to victims, (2) forcible sexual intercourse, (3) intimidation, (4) forced entry of premises, (5) stolen motor vehicle, and (6) property damage.
v

I I I I I I I I I I I I I I I I I I I
•
•
•
Fear of crime was the sum of SIX items which reflected the extent to which the respondent was preoccupied with the threat of victimization.
Precaution reflected a general behavioral orientation toward being cautious about crime. It was scored as the number of "self-help" measures used by the respondent among these eight possible measures: lock vehicle at home, lock vehicle when away, have valuables engraved, use crime prevention stickers or decals, ask service personnel for identification, have burglar alarm, leave radio, television, or lights on when away, and lock doors and windows when away. Thesp. precautions mayor may not have been implemented with the help of a crime prevention specialist.
Nine vulnerabil;. ty measures were controlled for In study analyses. These were: age, sex, education, race, number of adults in household, number of children in household, residence (urban/rursl), employment, and social activity.
Regression analyses were conducted in which Victimization 86, Fear 85, and Fear 86 were the dependent measures. These equations allowed the effects of precaution and prior victimization to be estimated independently of the effects they share with one another and with the nine vulnerability factors.
In predicting victimization, JOInt effects were taken into consideration to test the possibility that precaution vIas more important for those at higher risk for crime. Risk was reflected by measures of prior victimization and selfreported risk (fear).
In predicting fear, JOInt effects were also examined to test the possibility that taking precautions after victimization may hasten recovery from the fear reaction.
Results of the Study
• When examined individually, none of the self-help precautionary measures were associated with reduced frequencies of victimization in the following year. This held both for "any crime" and for "property crime." In general, thi sal so held when the severi ty of crImes was taken into account in measuring victimization.
•
•
Precaution, the index behavioral orientation, the following year.
scaled to represent one's general had no effect on victimization in
Victimizati -. in the first year did predict victimization iq the following year. However, victims who practiced high
VI

I I I I I I I I I I I I I I I I I I I
•
precaution after the first incident were neither more nor less likely than other victims to be victimized again.
Fear of crime (perceived risk) did not victimization in the following year. Nor precaution and high perceived risk combine to subsequent victimization.
predict did low
pred ic t
Concurrent measures of precaution and fear were correlated. This correlation could indicate either that high fear leads to precaution or that precaution reinforces the fear. Precaution was not related to changes in fear occurring between 1985 and 1986.
Victimization was related to fear. Victims who practiced high precaution after the Ii rs t incident abandoned thei r fear no more rapidly than did other victims.
Public Policy Implications
• The policy of promoting self-help precautionary measures independently of other crime prevention tactics is insufficient as a solution to the problems of crime and fear.
,.
•
•
Contrary to the study's expectations, victims' selfinitiated efforts to be cautious seem to hold little promlse of reducing either their risk of future victimization or their levels of fear. The study does not rule out the possibility that professional interventions could be more effective.
Alternative strategies which focus less on the security of individual households and more on social and physical aspects of the community should be explored. Because these strategies may be more costly than programs focusing on self-help a 1.one, additional funds should be allocated to crime prevention activities.
Future research is needed to establish whether self-help measures (1) are more effective for particular subgroups of the population, such as inner-city dwellers; (2) are more effective in combination with other crime prevention strategies; and (3) are more effective when implemented with the guidance of crime prevention specialists.
Vll

I I I I I I I I I I I I I I I I I I I
TABLE OF CONTENTS
Authors' Notes •
Letter from the Attorney General
Executive Summary
List of Tables
Background and Purpose • Crime Prevention and Fear-Reduction Strategies in Perspective • Victims as an At-Risk Population
Method • Sample Selection and Weighting Procedures • Measures
Victimization Fear • Precaution • Vulnerability Measures.
Results: Summary
Results: Supporting Statistical Analyses Self-Help Measures and Subsequent Victimization •
Crime Frequency Crime Seved ty •
Precaution as a Victimization-Prevention Strategy • Precaution Main Effect Precaution Joint EffecLs
Precaution as a Fear-Reducing Strategy Short-Term Effects Long-Term Effects
Public Policy Implications • Self-Help is Insufficient Alternative Strategies Implications for Future Research Summary and Conclusions
References •
Appendices
VIiI
ii
iii
iV
l.X
1 2 4
7 7 9 9
10 10 11
12
17 17 17 17 18 19 19 20 20 21
23 23 24 2S 26
28

.----- ----- ------------------.----------------------------I I LIST OF TABLES
I l. Respondent Characteristics by Household Type .. - _ • • • II _ • 8
2.
I 3.
f
Relationship of Self-Help Measures to Subsequent Victimization 13
Effects of Precaution and Victimization on Subsequent Victimization: Results from Hierarchical Regression Analysis • • • • • • • • • • 15
I 4. Long-term and Short-term Effects of Precaution and Vivtimization on Fear: Results from Hierarchical Regression Analysis. • • • • 16
I I I I I I I I I I I I I
IX
I

I I I I I I I I I I I I I I I I I I I
THE STUDY

I I I I I I I I I I I I I I I I I I I
BACKGROUND AND PURPOSI~
Criminal vi ct imizat ion and the fear of being vi ct imized are well-known
threats to the quality of life In urban and rural communities (American
Psychological Association, 1984; Brown, 1984; U.S. Department of Justice,
1983). The prevalence of these threats IS most acute among city dwellers,
nonwhites, women, the less-educated, and the poor (Research & Forecasts, Inc.,
1980; Skogan & Maxfield, 1981). Public officials have responded to the threats
of crime in recent years by sponsoring initiatives that focus not only on the
person committing the crimes but a1 so on the victims or potential victims of
those crimes. The victim's movement has burgeoned into a major social force,
stimulating the development of programs and legislation affecting victims or
potential victims of crime.
This public policy shift from offender rehabilitation and defendants'
rights to concern over the victim's rehabilitation and rights has taken place
at all levels of government. In the 1970s and 1980s, the U.S. Department of
Justice supported a number of crime victim initiatives having implications for
the entire nation (U.S. President's Task Force, 1982; National Institute of
Justice, 1986; Bureau of Justice Statistics, 1986). State and local officials
have also initiated a variety of crime- and fear-reducing initiatives involving
the police, individual citizens, and entire communities (Duncan, 1980).
Additionally, some 40 states have enacted victim compensation programs, and 17
states, including Kentucky, have also enacted victim Bills of Rights (Bard &
Sangrey, 1986).
The study being presented addresses the efficacy of only one of the many
initiatives launched as solutions to the threats of criminal victimization and
fear: the promotion of "self-help" prevention measures among citizens. Many
crime prevention programs, as one facet of their total effort, encourage
citizens to take deliberate precautionary measures such as locking doors and
windows, installing alarm systems, marking property, checking for
identification (I.D.), or making sure their automobiles are locked at all times
when not occupied. The preventive value of precautionary behavior, as it
varies naturally wi thin the general population, has been examined only in a
very limited fashion, usually within the confines of specific neighborhood
level interventions (where personal security was promoted only as one of many
1

I I I I I I I I I I I I I I I I I I I
preventive efforts). It is the purpose of this research to examine the effects
of self-help measures independently of other crime prevention tactics.
Another purpose of the study 1S to examine the effects of self-help
preventive measures among crime victims in comparison with citizens whose lives
have not recently been touched by crime. To our knowledge, the moderating role
of citizen precaution and its effects among victims of crime have not been
heretofore examined.
In sum, two research questions have guided this study: (1) To what extent
are self-help measures effective in preventing victimization and re
victimization? and (2) To what extent do self-help measures reduce the long
term impact of victimization on fear? Our major emphasis is upon the potential
value of a self-help prevention strategy--without regard to other crime
prevention strategies--in protecting citizens, especially crime victims.
Crime Prevention and Fear-Reduction Strategies in Perspective
Concern over crime and the fear of crime have prompted the development of
diverse programs and strategies 1n our nation. The effects of innovative
police practices, environmental design, citizen participation, and citizen
initiated preventive measures appear to have been studied most often. Success
at reducing crime or fear by means of innovative police practices has been
mixed. In a Kansas City experiment, preventive patrols designed to increase
the visibility of the police had no effect on either the actual amount of crime
or on the fear of crlme (Kelling, Pate, Dieckman, & Brown, 1974), but foot
patrol s were found to reduce the fear of crlme in another study (Police
Foundation, 1981). The COPE (Citizen-Oriented Police Enforcement) project
found directed patrol to be of little value for reducing fear of crime, but
contacts between the police and citizens that were aimed at solving specific
neighborhood probl ems showed considerable promise (Cordner, 1986). Recent
experiments in Houston, Texas and Newark, New Jersey, found that an aggressive
program of expanded contacts between pol ice and citizens can reduce overall
fear of crime (Pate, Wycoff, Skogan, & Sherman, 1986).
There have also been mixed findings on the effects of Neighborhood Watch
programs, which are known most for promoting citizen involvement in protecting
their own communities. Although
Neighborhood Watch programs that
there have been numerous
have reported reductions
evaluations of
in crime, and
occasionally, reductions 1n fear of crime, nearly all of the program
2
I I I I I I I I I I I I I I I I I I I
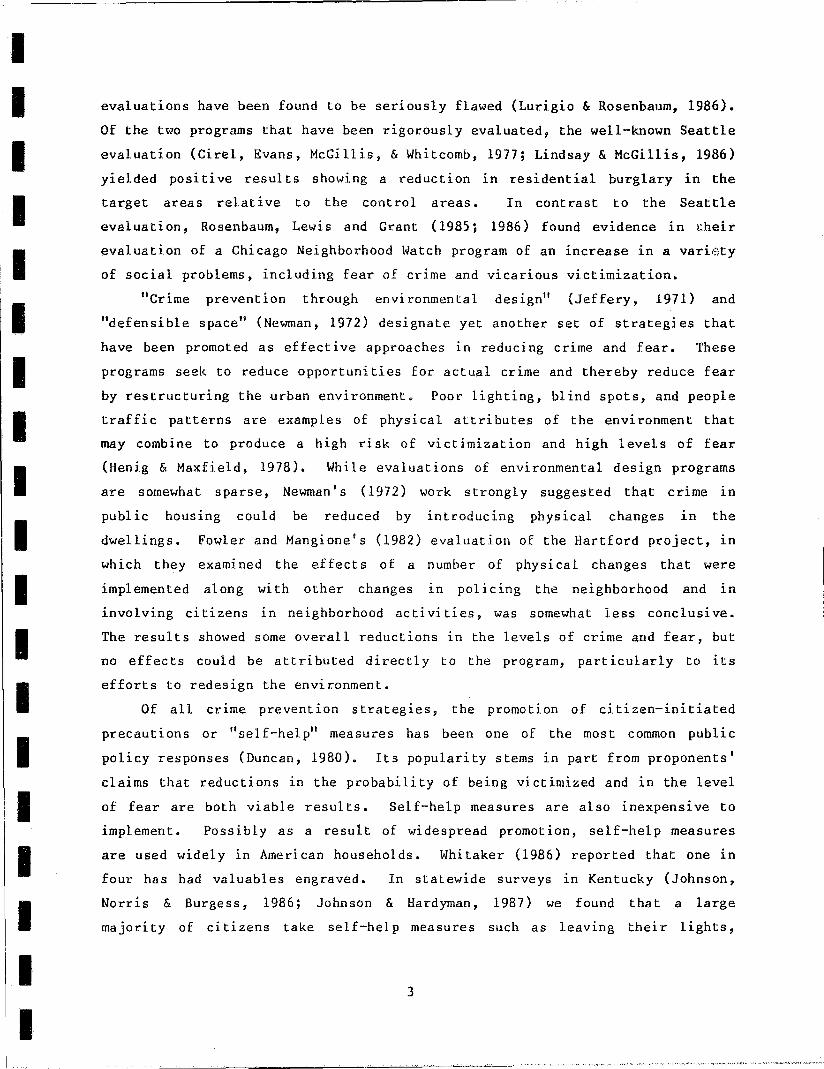
evaluations have been found to be seriously flawed (Lurigio & Rosenbaum, 1986).
Of the two programs that have been rigorously evaluated, the well-known Seattle
evaluation (Cirel, Evans, McGillis, & Whitcomb, 1977; Lindsay & McGillis, 1986)
yielded posi ti ve resul ts showing a reduction in residential burglary in the
target areas relative to the control areas. In contrast to the Seattle
evaluation, Rosenbaum, Lewis and Grant (1985; 1986) found evidence in t:heir
evaluation of a Chicago Neighborhood Watch program of an increase in a variety
of social problems, including fear of crime and V1car10US victimization.
"Crime prevention through environmental design" (Jeffery, 1971) and
"defensible space" (Neo;.nnan, 1972) designate yet another set of strategies that
have been promoted as effective approaches in reducing crime and fear. These
programs seek to reduce opportunities for actual crime and thereby reduce fear
by restructuring the urban environment. Poor lighting, blind spots, and people
traffic patterns are examples of physical attributes of the environment that
may combine to produce a high risk of victimization and high levels of fear
(Henig & Maxfield, 1978). While evaluat ions of environmental design programs
are somewhat sparse, Newman I s (1972) work strongly suggested that crime in
public housing could be reduced by introducing physical changes 1n the
dwellings. Fowler and Mangione's (1982) evaluation of the Hartford project, in
which they examined the effects of a number of physical changes that were
implemented along with other changes 1n policing the neighborhood and 1n
involving ci tizens in neighborhood acti vi ties, was somewhat less conclusive.
The results showed some overall reductions in the levels of crime and fear, but
no effects could be attributed directly to the program, particularly to its
efforts to redesign the environment.
Of all crime prevention strategies, the promotion of citizen-initiated
precautions or "self-help" measures has been one of the most common public
policy responses (Duncan, 1980). Its popularity stems in part from proponents'
claims that reductions in the probability of being victimized and in the level
of fear are both viable results. Self-help measures are also inexpensive to
implement. Possibly as a result of widespread promotion, self-help measures
are used widely in American households. Whitaker (1986) reported that one in
four has had valuables engraved.
Norris & Burgess, 1986; Johnson
In statewide surveys in Kentucky (Johnson,
& Hardyman, 1987) we found that a large
majori ty of ci tizens take self-hel p measures such as leaving their lights,
3

I I I I I I I I I I I I I I I I
I I
radios, or televisions on when away from home and asking for identification
(r.D.) from service and delivery personnel.
Like other crime prevention strategies, the effectiveness of campa1gns to
promote self-help measures 1S far from conclusive, primarily because these
measures have been implemented along with other preventive measures. In an
evaluation of a Monterey County, California, burglary prevention program that
heavily emphasized self-help preventive measures, an interrupted time series
analysis yielded results that showed the program failed to affect crime rates
(Johnson,1980). T:1 contrast, evaluations of programs 1n cities such as
Seattle~ Washington and Minneapolis, Minnesota, ln which self-help measures
were promoted along with other strategies, showed that such programs can
produce reductions in crlme and/or the fear of crime (Cirel, Evans, McGillis, &
Whitcomb, 1977; Kaplan, Palkovitz, & Pesce, 1978).
To date, older adults appear to have been the most frequent beneficiaries
of programs designed to promote precaution among specific at-risk groups. Older
persons have generally been considered important more for their fear of crime
than for their objective probability of experiencing cr1me (Hindelang,
Gottfredson & Garofalo, 1978; Lindquist & Duke, 1982), The Senior Safety and
Security Program (Harel & Broderick, 1980), for example, presented audiovisual
materials dealing with crime prevention, provided home security inspections,
and promoted the use of safer locks as vehicles for reducing fear of crime
among the urban aged. SAFE (Seniors Against a Fearful Environment) had similar
goals ln another city (Johnson, Norton & Triganopolos,1978; Norton &
Courlander, 1982). Neither program, however, provided much evidence that it
was successful in reducing the fear of its elderly participants.
Victims as an At-Risk Population
To our knowledge, victims of crlme do not appear to have been targeted for
interventions designed to promote self-hel p prevent i ve measures. For two
reasons, we find thi s somewhat surpd sing. First, on both theoretical and
empirical grounds, victims must be considered more likely than the general
population to be victimized at some future time. Fattah (1967), for example,
argued that certain victims were predisposed to victimization because of their
circumstances (e.g., occupation) or character traits (e.g., greed). According
to Fattah, many victims provoke, or at least create, situations that increase
thei r risk of exposure to crime. Similarly, Von Hentig (1948) proposed that
4
I I I I I I I I I I I I I I I I I I
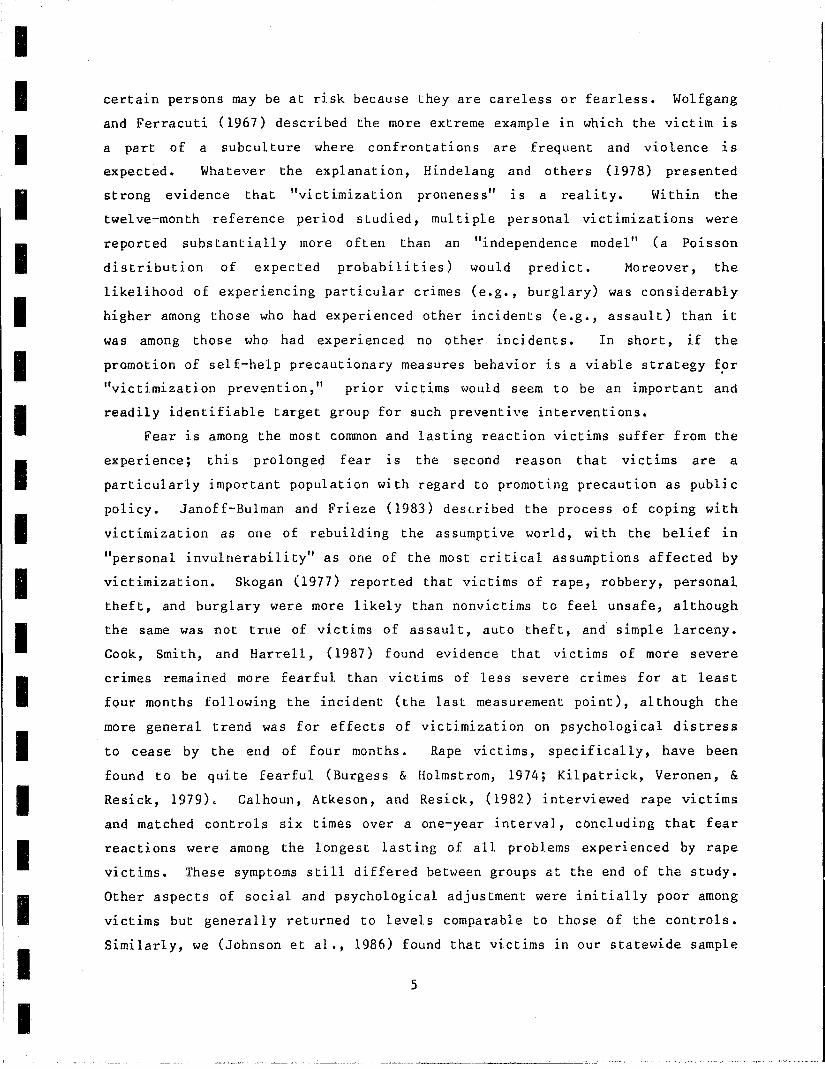
certain persons may be at risk because they are careless or fearless. Wolfgang
and Ferracuti (1967) described the more extreme example in which the victim is
a part of a subcul ture where confrontations are frequent and violence 1 S
expected. Whatever the explanation, Hindelang and others (1978) presented
strong evidence that "victimization proneness" 1S a reality. Within the
twel ve-month reference period studied, mul ti ple personal victimizations were
reported substantially more often than an "independence model" (a Poisson
distribution of expected probabilities) would predict. Moreover, the
likelihood of experiencing particular crimes (e.g., burglary) was considerably
higher among those who had experienced other incidents (e.g., assault) than it
was among those who had experienced no other incidents. In short, if the
promotion of self-help precautionary measures behavior is a viable strategy for
"victimization prevention," prior victims would seem to be an important and
readily identifiable target group for such preventive interventions.
Fear is among the most common and lasting reaction victims suffer from the
experience; this prolonged fear 1S the second reason that victims are a
particularly important population with regard to promoting precaution as public
policy. Janoff-Bulman and Frieze (1983) described the process of coping with
victimization as one of rebuilding the assumptive world, with the belief in
"personal invulnerability" as one of the most cd tical as sumptions affected by
victimization. Skogan (1977) reported that victims of rape, robbery, personal
theft, and burglary were more likely than nonvictims to feel unsafe, although
the same was not true of victims of assault, auto theft, an~ simple larceny.
Cook, Smith, and Harrell, (1987) found evidence that victims of more severe
crimes remained more fearful than victims of less severe crimes for at least
four months following the incident (the last measurement point), although the
more general trend was for effects of victimization on psychological distress
to cease by the end of four months. Rape victims, specifically, have been
found to be quite fearful (Burgess & Holmstrom, 1974; Kilpatrick, Veronen, &
Resick, 1979) < Calhoun, Atkeson, and Resick, (1982) interviewed rape victims
and matched controls SlX times over a one-year interval, concluding that fear
reactions were among the longest lasting of all problems experienced by rape
victims. These symptoms still differed between groups at the end of the study.
Other aspects of social and psychological adjustment were initially poor among
victims but generally returned to levels comparable to those of the controls.
Similarly, we (Johnson et al., 1986) found that victims in our statewide sample
5

I I I I I I I I I I I I I I I I I I I
had higher fear than nonvictims for considerably more than a year after the
incident, although the depressive symptoms present in the first few months had
dissipated by that time. The difference in fear levels was stronger between
victims of violence and victims of property crime than between property crime
victims and nonvictims. Although the severity of the crime experienced is an
important determinant of the intensity of the fear experienced, these studies,
taken together, indicate that fear may be among the most lasting consequences
of victimization. Thus, if promoting precaution through the use of self-help
measures is a viable fear-reduction strategy, victims again would seem to be a.n
important target group.
6

I I I I I I I I I I I I I I I I I I I
METHOD
Sample Selection and Weighting Procedures
The sample for this study consists of 445 respondents, generally
representative of adults in Kentucky, who participated in both interviews of a
two-wave panel study conducted in 1985 and 1986. The characteristics of the
respondents are presented in Table 1.
The sample was drawn using a two-stage cluster design which assured that
every household with a telephone had an equal probability of inclusion in the
sample (Waksberg, 1978). (Approximately 88 percent of Kentucky households have
telephones.) Initially, about 5,000 households were administered a short
screening instIument to identify whether any adult living in that household had
been a crime victim 1n the past year. From this information, hvuseholds were
categorized by their exposure to violent crime, property crime, or no crime.
Within each category, the probability that a household was selected for the
complete interview varied inversely with the probability that a household would
be assigned to that cat~gory. For example, a given household was most likely
to be assigned to the "no-crime" category. Therefore, a smaller proportion of
no-crime households was interviewed. Within each household selected for Lhe
complete interview, one person was selected randomly from all adult members cf
the household. He or she was then asked to report for all personD residing in
that household. In victim households, the selected respondent mayor may not
have been the victim of the crime.
In the first wave, 557 respondents were interviewed, which represented 82
percent of the households determined to be eligible for the complete interview.
The 1986 sample of 445 households represents 80 percent of the'1985 sample. Of
those who participated 1n the 1985 interview, about 6 percent refused to
participate in 1986; 1 percent began but did not complete the interview; about
1 percent had died or become too ill to participate; and 12 percent could not
be located or were unavailable for an interview. Response rates in 1986 varied
little across most demographic subgroups of the sample. Eighty-two percent of
male respondents, compared to 79 percent of female respondents, remained in the
study. Eighty percent of both blacks and whites continued to participate as
did 80 percent of both urban and rural respondents. Respondents with greater
than a high school education were somewhat more likely than others to continue
(86% versus 77%). Participation rates also varied with age, increasing with
7
J

I I Table 1
I Respondent Characteristics by Household Type (Unweighted)
I Victim Nonvictim
Households Households Total n % n % n %
I Sex Male 57 45 126 40 183 41 Female 69 55 192 60 261 59
I Age Under 25 25 20 36 11 61 14
I 25 - 34 30 24 75 24 105 24 35 - 44 37 29 62 19 99 22 45 - 54 16 13 1 .. 3 14 59 13 55 - 64 10 8 48 15 58 13
I 65 and older 8 6 54 17 62 14
Emplo)~ent status
I Full-time 68 54 157 49 225 51 Part-time 13 10 28 9 41 9 Unemployed 45 36 133 42 178 40
I Education First to eighth grade 10 8 44 14 54 13 Ninth to high school graduate 68 55 168 54 236 55
I College, business school 35 29 76 25 III 26 Graduate school 10 8 21 7 31 7
I Race
White 113 90 289 92 402 92 Black 11 9 23 7 34 a Other 2 1 1 3 3 1
I Number 1n household One 14 11 51 16 65 15
I Two 33 26 95 30 128 29 Three to four 61 48 132 42 193 44 Five or more 18 14 39 12 57 13
I Marital status Married for first time 56 45 193 61 249 56 Never married 25 20 44 14 69 16
I Remarried 10 8 19 6 29 7 Widowf;d 9 7 30 9 39 9 Separated 3 2 5 2 8 2
I Divorced 22 18 27 9 49 11
Total n 126 318 444
I 8
I

I I I I I I I I I I I I I I I I
II I I
age up to 40 and then decreasing. Response rates in 1986 were also lower among
those respondents who had reported ei ther a violent crime (68%) or both a
violent and property crime (63%) in their first interview than among those who
reported only a property crime (84%) or no crime (82%).
The data are weighted to adjust for both the probability of selection in
1985 and the differential response rates by cnme type in 1986. Separate
weights were derived for women who reported violence in the first year, men who
reported violence, other women, and other men. For each group the weight was
the product of the 1985 weight and the inverse of the 1986 response rate. The
1985 weight was the inverse of the household's probability of selection (1 for
violent-crime households, 3 for property-crime households, and 11 for no-crime
households). The product was then adjusted so that the total weighted sample
size was the same as the total unweighted sample size. This step adjusts the
weights so that statistical tests may be applied to the data.
More details on the sampling, interviewing, and follow-up procedures can
be found in SAC Research Reports #3 and #9.
Measures
VictimiLation
Victimization was measured in both 1985 and 1986 and was scaled using the
Crime Severity Index developed by Wolfgang, Fig1io, Tracy, and Singer, (1985).
These invest igators developed this scale and its severity weight s from data
collected from 60,000 persons nationwide who were asked to rate the seriousness
of a wide range of crlmes. Overall, they found a high level of agreement among
people nationwide as to what constitutes a serious crime. In this system,
varlOUS components of a criminal event are weighted and summed to a total
score. The six components are: (1) harm and injury to victims; (2) forcible
sexual intercourse; (3) intimidation; (4) forced entry of premises; (5) stolen
motor vehicles; and (6) property damage. For most of the components, the
weight is the product of the severity rating of that component (ranging from
1.47 to 35.67) and the number of victims to which it applies. In each
interview, the severity scale was administered for the most serious incident
experienced by that household in the past year. The higher the score, the
higher the severity of crime experienced. Scores ranged from 0 (nonvictims) to
48. About 20 percent of the sample had non-zerO scores. Among these victims,
mean severity was approximately 5.
9
-------~-----~----------------------- --

I I I I I I I I I I I I I I I I I I I
Fear
Fear of crime was assessed in both 1985 and 1986. The scale was developed
to tap the extent to which the respondent 1S preoccupied wi th the threat of
victimiz,ation. Fear implies a state beyond merely being aware or cautious
about crime. The scale's SlX items, each of which has a four-point response
format, are as follows: (1) "How safe do you feel walking alone 1n your
neighborhood during the day?"; (2) "How safe do you feel outside 1n your
neighborhood at night?"; (3) "How much does fear of crime prevent you from
doing things you would like to do?lI; (4) "When you leave your house. or
apartment, how often do you think about being robbed or physically assaulted?";
(5) "When you leave your house or apartment, how often do you think about it
being broken into or vandalized while you're away?"; and, (6) "When you're 1n
your home, how often do you feel afraid of being attacked or assaulted by
someone that you know such as a relative, neighbor, or acquaintance?" A factor
analysis supported the unidimensionality of the scale, with factor loadings
exceeding .50. The scale has high internal consistency (alpha = .79). Test
retest stability over a one-year interval was moderate (r = .68). The scale
was scored so that the higher the score, the higher the fear. Scores ranged
from 6 to 24 with a mean of 10.1.
Precaution
Precaution represents a general behavioral orientation rang1ng from
carelessness (a low score) to cautiousness (a high score), rather than the
respondent's use of any single self-help measure. The index is the sum of
responses to eight self-help prevention measures selected for their
correspondence to existing promotional programs. However, the measures mayor
may not have been implemented with the help of a crime prevention specialist.
Coded 0 (no) or 1 (yes), the items were: lock vehicle at home; lock vehicle
when away from home; have valuables engraved; use antiburglary stickers and
decals; ask service personnel for identification; have burglar alarm; leave
lights, radio, or television on w?en away; and lock doors and windows when
away. In the interview schedule, five of the eight items allowed the
respondent to answer "partially yes" rather than generally "yes" or "no." For
the three items concerned with locking, "partially" was treated as a "no." For
the two items concerned with using warning stickers and having valuables
engraved, "partially" was treated as a "yes." A single index was created
10

I I I I I I I I I I I I I I I I I I I
(range = 0 to 8) after a factor analysis and Guttman scalogram analysis
revealed that the items could be considered as independent of each other
(inter-correlation coefficients approaching zero). The index was distributed
normally with few subjects using none or only one self-help measure and with
few using as many as seven or eight. The most common number used (mode) was 3
and the sample average (mean) was 3.9.
Vulnerability Measures
Nine variables were included 1n the study because previous research has
suggested that they correlate with fear, victimization, or both. All are based
on data from the first interview in 1985. Four were personal characteristics:
age (in years), sex (male = 1; female = 2), education (in years), and race
(white = 1; nonwhite = 2). Two measures were included to describe the
household I s occupants: number of adul ts and number of children. The final
three measures were included as measures of "lifestyle": urban residence (non
SMSA = 1; SMSA = 2); employment activity (retired, homemaker, or disabled = 1;
worker or student = 2), included as a rough indicator of the extent to which
the respondent was "out and about II pursuing funct ional act ivities; and social
activity, the sum of scores (range 0-15) from three items concerning frequency
of getting together with friends, organizational participation, and frequency
of getting together with family members.
11

------------------_._--------,--------------
I I I I I I I I I I I I I I I I I I I
RESULTS: SUMMARY
A full discussion of the resul ts, one which includes more detail on the
supporting statistical analyses, may be found in the report section titled,
"Results: Supporting Statistical Analyses." In this section, we will present
the highlights for the reader who is less interested 1n the statistical
procedures. The two sections have been prepared so that either may stand
alone; thus the reader who prefers the more detailed results may safely skip
this section.
We began by examining the relationship between each of the eight self
help measures and victimization in 1986: Did the people who used them have a
lower frequency of victimization than others in the following year? Without
exception, the use of a particular self-help measure did not affect ihe
victimization rate to any significant degree. For example, of those who did
not "lock vehicles when away from home;' or who did this only partially, 18.6
percent reported some type of crime in 1986; comparably, 21.8 percent of those
who said they do "lock vehicles when away" reported some type of crime 1n 1986.
(Overall, 20.5 percent of the sample reported some type of crime in 1986.)
In subsequent analyses, we used a measure of victimization which took the
severity of crimes into account; the higher the score, the more severe the
crime experienced. No individual self-help measure was found to be stronglj'
associated with a reduced risk of severe crime. The "correlations li shown in
Table 2 are statislical measures of the strength of the association between
each of the self-help measures and victimization. A value of 0 indicates no
relationship. A value of +1 would indicate a perfect relationship when a high
score on one measure is associated with a high score on another measure. And a
value of -1 would indicate a perfect relationship when a high score on one
measure 1S associated with a low score on another measure. Negative
relationships would be expected between the self-help measures and
victimization. The strongest correlation obtained was between "asking for ID"
and victimization. At a value of -.10, it can be considered statistically
reliable but is nonetheless quite small in magnitude. The findings were about
the same when we used a statistical procedure that allowed us to control for
the effects of other variables 1n assessing the effects of each self-help
measure. The results of this procedure are labeled as "betas" in Table 2.
12

- -- - -- - - - -------- - -
....... w
T.ahle 2
Relationship of Self-Help Measures to Subsequent Vict:imizatioo
Crime Frequency
l'bnber :in Semple Percent of Sanple Percent of "Yes Respcn:ling Yes Resporrling Yes Groop" Reporting
"SE>J.f-Help" }ieasures :in 1985 :in 1985 Arrj Cr:ime :in 1986a
lock vehicle, hane 193 45.5 22.6
lock vehicle, away 350 81.4 21.8
Engrave valuables 169 38.0 18.3
The stickers 98 22.0 14.3
Ask for loD. 195 44.5 18.1
Burglar alann 27 6.0 24.8
Lights or sooni 00 304 68.3 20.0
lock winia.lS ani doors 385 86.5 19.7
SIM1ARY Total Semple Total Sanple I s M?.ASURES Size = 445 100.0 % = 20.5
Clrhe "Yes Groop" ani "No Groop" did not differ significantly (i of p < .05) in any canparisoo.
bSignificant , .E. < .05
CSane persons reporte:l both violent ani property cr:irres.
Percent of "Yes Groop" Reporting
PrqJerty Cr.ime :in 1986a
21.0
20.5
17.2
14.3
17.3
23.3
19.1
18.5
Total Sanple I s % = 19.4
c
Crime Severity 86
Correlatioo d Beta d
-.03 -.03
.03 .02
'-.08 -.09
-.03 .00
_.lOb -.09
.00 .02
.04 .03
.02 -.03
Miltiple R Variance Accamte:l = .15 For by Set = .02
dA value of 0 irrlicates no relationship, +1 a perfect relationship when ooe variable :increases as the other increases, ani -1 a perfect relationship when one variable :increases as the other ciecreases. Negative relationships were expected between self-help arrl victi'TIizatioo. See text for more canplete descriptioo.

I I I I I I I I I I I I I I I I I I
Like correlations, the betas potentially range from -1 to +1, but never exceed
+.03 or -.09 in Table 2.
The potential value of "precaution" as a general behavioral orientation
(not tied to a specific self-help measure) was then examined. The
contributions to victimization of several other variables 1n addition to
precaution (the vulnerabil ity factors) were assessed in the same procedure.
The correlations and betas resulting from these analyses are presented in
Table 3. Of the variables examined, age was the best predictor: younger
adults were more likely to be victims of crime than older adults. The amount
of precaution exercised was not related to victimization.
Precaution could be more (or only) important for populations at high risk
for crime. Therefore, we also examined the impact of precaution in combination
with two other variables. One of these variables was fear of crime, selected
because it reflected respondents I perceived risks of becoming crime victims.
The other was prior victimization, selected because we previously have found
victims to be at higher risk than nonvictims for future crime. Fear of crime
was not related to the actual subsequent occurrence of crime. The results
further indicated that those persons who were most afraid and who practiced
high precaution did not become crime victims less often than those who were
afraid but less cautious about cr1me. Prior victimization did predict
victimization. However, victims who practiced high precaution after the first
incident were no less likely to be revictimized than were other victims.
Finally, we evaluated the potential value of precaution as a fear-reducing
strategy, a strategy that might be particularly important for victims. Both the
1985 and 1986 measures of fear were examined as outcomes of victimization in
1985. Using the same general procedures as those used for predicting
victimization, the contributions to fear of several variables other than
precaution and victimization were assessed at the same time. These results,
presented in Table 4, indicate that fear was higher among women, victims, the
homebound, the less educated, and the more cautious. Fear increased among
nonwhi tes and younger persons over the one-year interval between interviews.
There was also some evidence that the fear reaction of victims was maintained
over that year, although victims' fear increased no further. We had expected
victims who practiced high precaution after the first incident to get over
their fearfulness sooner than other victims, but found no evidence to support
this expectation.
14

I I I I I I I I I I I I I I I I I I I
Table 3
Effects of Precaution and Victimization on Subsequent Victimization: Results from Hierarchical Regression Analysis
Variables Entered
Vulnerability measures Age Sex Race Education Number of adults Number of children Urban residence Employment activity Social activity
Precaution 85 (P8S)
Fear 85 (F8S)
Victimization 85 (V8s)
Joint Effects P8s- x V8S P85 x F85
R2 Adjusted (d£)
Correlationa
- .17*-:'-~
-.04 .01 .03 .02 .02 .07 .11* .08
-.05
.03
-.17-:'"* -.01
.00 -.06 -.01 -.06
.07
.05
.09
-.10
.05
.05 -.02
R2 Changeb
.046*
.005
.007
.028*-:'-k
.002
.056*"'.:* (14,399)
aA value of 0 indicates no relationship, +1 indicates a perfect relationship when one variable increases as the other increases and -1 indicates a perfect relationship when one variable increases as the other decreases.
bpercent of variance in victimization accounted for by variable or variables (e.g., .046 = 5%).
*p < .05 **p < .01
-:'-k*p < .001
15

-
...... cr-
- - - .. - - - - - - - - - ;- - - - -Table 4
Long-term and Short-term Effects of Precaution and Victimization on Fear: Results from Hierarchical Regression Analysis
Fear 85 Fear 86
Variable(s) Entered Correlation a Beta a 2 b R Change Correlationa Betaa 2 b R Change
Fear 85
Vulnerability measures Age Sex Race Education Number of adults Number of children Urban residence E~ployment activity Social activity
Precaution 85 (P85
)
Victimization measures Victimization 86 (V86 ) Victimization 85 (V
85)
Joint Effects P85 x V86 P85 x V85
R2 Adjusted (df)
NA NA
.08 -.02
.22*** .20***
.05 .04 -.14** -.10
.00 .04 -.05 -.01
.04 -.02 -.20*** -.11* -.05 -.06
.28*** .29***
NA NA .20*** .21***
NA .06
NA
.082***
.082***
.036***
.003
.180*** (12,401)
.68***
-.02 .21*** .14**
-.15** .00
-.03 .06
-.17*** .00
.23***
.08
.14**
.64***
-.14** .06 .10**
-.05 -.03 ~.07
.04 - .07
.02
.01
.06 -.03
-.03 -.04
.459***
.032**
.000
.002
.003
.477*** (15,398)
aA value of 0 indicates no relationship, +1 indicates a perfect relationship when one variable increases as the other increases, and -1 indicates a perfect relationship when one increases as the other decreases.
bpercent of variance in fear accounted for by variable or variables. (e.g., .032 = 3%)
*p < .05; **p < .01; ***p < .001

,I
I I I I I I I I I I I I I I I I I I
RESULTS: SUPPORTING STATISTICAL ANALYSES
Self-Help Measures and Subsequent Victimization
Table 2 di splays data concerning the reI at ionshi p of each of the eight
self-help measures to subsequent victimization. The different measures varied
in their prevalence of use by this sample, ranging from a low of 6 percent
(burglar alarms) to a high of 87 percent (locking doors and windows when away).
Overall, from neither the bivariate analyses nor multivariate analyses (i.e.,
those where effects of other variables were controlled) was there evidence that
these self-help measures were individually effective in preventing crime.
Crime Frequency
Individually, none of the self-help measures reduced the frequency of
victimization 1n the following year to a degree that can be considered
statistically reliable. As shown in Table 2, this result held both for "any
crime" and for "property crime." Because these self-help measures would not be
expected to prevent crimes of family violence, we repeated these analyses,
omitting from the victimization measures crimes committed by acquaintances.
Findings (not shown in Table 2) were the same as for "any crime" and "property
crime." It should be noted that the estimates of crime for those using
burglar alarms may not be reliable because of the small number of respondents
who made use of this precaution.
Crime Severity
Table 2 also shows the relationships between these precautionary measures
and that victimization measure which was scored to take into account the
severity of crimes. "Correlations" and "betas" were the statistics used to
assess the strength of the relationships. For both of these statistics, a
value of 0 corresponds to no relationship, and the potential range is from +1
(a perfect relationship where one variable increases as the other increases) to
-1 (a perfect relationship where one 1ncreases as the other decreases).
Negative relationships would be expected between precaution and victimization.
As can be seen, the correlations in Table 2 all are much closer to 0 than
to -1. Of all the specific measures, asking for 1.0. had the only correlation
with the cr1me severity scale high enough to be considered statistically
reliable. At -.10, it still must be considered weak in magnitude. When
17

I I I I I I I I I I I I I I I I I I I
considered in conjunction with the finding that asking for I.D. had no effect
on the frequency of crime, this finding suggests that asking for I.D. may be
moderately effective 1n preventing cr1mes of violence and/or of greater
severity. The mUltiple correlation between the set of self-help measures and
crime severity also was quite low. (Always expressed as a positive value, this
statistic potentially ranges from 0 to +1.)
Table 2 also shows the relationship between each or the specific measures
and victimization when the effects on victimization of the nine vulnerability
factors are first taken into account, using a hierarchical regression
procedure. The "betas" are similar to correlations. They also range from -1
to +1; the higher the absolute value, the stronger the relationship. The beta,
however, represents the effects on victimization of the particular self-help
measure which is independent of the effects of other self-help measures and the
vulnerabil ity measures. In this analysis,
including asking for I.D., had significant
none of
betas.
the self-help measures,
Al together, the set of
precautionary measures explained about 2 percent of the variance in the crime
severity scale, compared to the 5 percent accounted for by the vulnerability
factors.
Precaution as a Victimization-Prevention Strategy
The potential value of lIprecaution" as a general behavioral orientation
(not tied to a specific self-help measure) was examined using hierarchical
multiple regress10n as the statistical technique.
(subsequent victimization) was the dependent measure.
Victimization 1n 1986
Table 3 first presents
the correlations between each independent measure and Victimization 86, and
then gl ves the results from the hierarchical regressions. The betas are as
they were 1n the final step of the equation; none of the betas changed
substantially across steps when the variables were entered 1n the order
presented here. At each step in the equation, Table 3 also gives the "R2
change", a statistic potentially ranging from 0 to +1 that corresponds to the
percent of variance accounted for by the variable or variables entered at that
step. The higher the I{2 change, the more highly the predictor variables are
associated with victimization.
The results presented in Table 3 using the severity scale did not differ
substantially from those obtained from regressing a dichotomous victimization
measure on the same independent measures.
18

---------
I I I I I I I I I I I I I I I I I I I
Precaution Main Effect
By "main effect," we refer to the effect of precaution on victimization
for the sample as a whole, i.e., for Kentucky's general population. In the
regression analysis, the vulnerability measures were entered first to assess
whether the probability of victimization could be accounted for by such factors
as age, urban residence, or lifestyle. Altogether, the vulnerability measures
explained about 5 percent of the varIance In Victimization 86, primarily
because of a significant effect of age (higher levels of victimization were
associated with younger age). Although significant in the bivariate
correlations, employment activity was not a significant predictor In this
equation where age was controlled.
Precaution 85 was then entered into the equation to test whether it
explained vanance In subsequent victimization (Victimization 86) over and
above that accounted for by the vulnerability measures.
(i.e., explained less than 1 percent of the variance).
Precaution Joint Effects
It had no effect
By "joint effects," we refer to the effects of precaution in combination
with other variables. The presence of such effects would indicate that
precautionary behavior is more (or only) important among populations at high
ri sk for crime. The interview did not provide an objective (externally
defined) measure of risk that was more specific than the vulnerability factors.
Nonetheless, it was possible to identify two variables which should be
indicative of high-risk status: Victimization 85 (former victims have a crime
rate twice that of nonvictims) and FeaT 85 (which measures whether individuals
perceive themselves as being at high risk for crime).
To test for these possible interactive relationships, Fear 85,
Victimization 85, and two multiplicative interaction terms were also entered,
In that order, into the equation. The interaction terms were scored as
products of the mean deviations of the precaution and victimization/fear
measures and thus were approximately independent of the main effects of the
component measures (Pedhazur, 1982). Thus, in Table 3, the "victimization by
precaution" term (P85 x V85) represents the possibi li ty that precautionary
behaviors are more important among prior victims, and the "fear by precaution"
term (P85 x F85) represents the possibility that precaution is more important
among those at self-reported high risk.
19

I I I I I I I I I i I I I I I I I I I
As shown in Table 3, Fear 85 explained less than 1 percent of additional
varlance in Victimization 86. This suggests that a gap exists between
respondents' perceived and actual probabilities of victimization. However, a
statistically significant 3 percent of the variance in Victimization 86 was
predicted by Victimization 85, even after all the preceding variables were
controlled for in the analysis. Neither of the interaction terms had
significant effects. Thus, the findings indicate (1) that persons of perceived
high risk who practiced high precaution were neither less nor more likely than
others to be victimized and (2) that victims who practiced high precaution
after the first incident were neither more nor less likely than other victims
to be victimized again.
Precaution as a Fear-Reducing Strategy
The short- and long-term effects of victimization on fear, and whether
those effects could be lessened by post-victimization precaution, were also
examined in this study. The results are presented in Table 4. Table 4 first
glves the correlations between the fear measures and the independent measures.
Fear 85 and Fear 86 both were correlated with sex (higher among women),
education (highe~ among the less educated), employment activity (higher among
the homebound), precaution (higher among the cautious), and Victimization 85
(higher among victims). Fear 86 was, in addition, correlated with race (higher
among nonwhites).
Short-Term Effects
The regression of Fear 85 included the same variables as those described
for Victimization 86 except for the fear main effect and interaction terms.
The effect of victimization ln this regression represents its immediate or
short-term effects (those present one year or less after the incident). In
this equati6n, the vulnerability measures explained a significant amount of the
varlance, totaling about 8 percent across the nlne factors included. More
specifically, fear appeared to be higher among women, the homebound, and the
less educated. Precaution 85 and Victimization 85 also are related
significantly to level of fear in 1985, independent:ly of relationships they
have with the vulnerability measures. It should be noted that the nature of
the data does not allow us to conclude that victimization (or precaution)
"caused" the fear, but simply that victims (and the more cautious) had higher
20

I I I I I I I I I I I I I I I I I I I
fear than nonvictims. While this fear mayor may not have been caused by the
incident, we can say that it is not accounted for by any differences between
victims and nonvictims in a large number of personal characteristics (age, sex,
race, and education), household characteristics (presence of other adults and
children), or lifestyle characteristics (place of residence, employment
activity, and social activity).
There was no evidence for an interaction between Precaution 85 and
Victimization 85 in predicting Fear 85. This lack of an interactioll indicates
that more cautious victims w~re no less fearful than less cautious victims
within (on the average) the first few months after the incident.
Long-Term Effects
For assessing the long-term effects of victimization and precaution, Fear
86 was the dependent measure. The regression of Fear 86 was comparable to the
regression of Fear 85. In this case, however, Fear 85, Victimization 86, and a
Precaution 85 by Victimization 86 interaction term were also included as
independent measures (but considered here more as "control" variables). Fear
85 was entered first, before the set of vulnerability measures. Thus, for Fear
86, effects of the vulnerability measures, precaution, ana Victimization 85 are
independent of any effects they may have through prior fear. The effect of
victimization l.n this regreSSl.on, then, represents its lagged effect (that
occurring more than one year after the incident). A positive beta would point
to an additional increase in fear between the first and second years, while a
negative beta would point to a decrease or recovery from the fear of the first
year.
In
varl.ance.
the regression of Fear 86, Fear 85 explained nearly half of its
The set of vulnerability measures explained about 3 percent of the
"changes" 1.n fear occurring over this one-year intervaL More specifically,
fear in 1986 was significantly higher among younger adults and nonwhites than
could be accounted for by their fear in 1985.
Precaution 85 had no effect on Fear 86 with Fear 85 controlled. Taken
togeth~r, the victimization measures also explained no variance in Fear 86. In
interpreting this finding, it should be noted that Victimization 86 1.S not
related to Fear 86, even when Fear 85 is not controlled (a correlation of .08).
Few subjects (on an unweighted basis) experienced violent crimes in this year;
and, as discussed previously, the victimization-fear relationship may depend
21

I I I I I I I
I I I I I I I I I I
upon the levels of violence entailed 1n the incident. On the other hand,
Victimization 85 was modestly related to Fear 86 (a correlation of .14, £<.01)
when its effects through Fear 85 were not controlled. This pattern suggests
that the relationship of victimization to fear in the second year is explained
by its relationship to fear in the previous year, with no further increases or
decreases in fear attributable to it. The nature of the "long-term" effect is
that the level of fear associated with victimization 1n the first year of the
study was maintained over the following year.
Finally, Precaution 85 did not interact with either Victimization 85 or
Victimization 86 in explaining changes in fear occurring between the first and
second years of the study. Most notable for this study's purpose is the
finding that victims who had practiced high precaution after the incidents
abandoned their fear no more rapidly than victims who did not.
22
I

I I I I I I I I I I I I I I I I I
PUBLIC POLICY IMPLICATIONS
Self-Help is Insufficient
From these findings, the policy of promoting self-help preventive measures
independently of other crime-prevention tactics would have to be judged as an
insufficient solution to the problems of victimization and fear. There was
evidence that victims were more fearful than nonvictims and that victims were
more vulnerable to future crime than nonvictims. There was no evidence,
however, that precaution prevented victimization or that more cautious victims
fared better in the long run than did less cautious victims.
The self-help preventive measures ::ltudied here were all taken at the
individual or household level: locking car doors, leaving lights on, and so
forth. It is import.~nt to note that these 'self-help measures were assessed as
they varied naturall y wi thin general and vict im populations. Possibly, such
measures would have been more effective for the participating households had
they been implemented under the guidance of a crime prevention specialist. No
data were available in this, study to address this possibility. Generally,
however, when the use of precautionary measures has been associated with a
reduction in crime rates, their use represented only one aspect of a more
comprehensive intervention which incorporated additional strategies for
preventing victimization (Cirel et al., 1977). Furthermore, Heal (1983) notes
that much of the research now suggests that, at least as far as burglary 1S
concerned, the importance of physical security may be of less concern to
burglars than 1S tradi tiona11y supposed. Hare important considerations to
them, according to Heal, are whether or not the building 1 s occupied, the
chance of being observed, and the extent of potential rewards. Perhaps Waller
(1976) was correct to claim that preventive measures such as locking doors and
\>lindows are merely "security illusions."
On the other hand, Kidder and Cohn (1979) argued that strictly
individualized precautionary measures do little to promote a sense of security.
They may make the home secure, but leave the locality full of danger. Rather
than reduce the fear, they actually may remind the occupants of the danger that
lurks outside. Alarms, locks, and the like simply make the threat of crime
more salient. Johnson et a1. (1978) and Norton and Courlander (1982) made
similar observations, while noting that educational programs designed to
increase caution may inadvertently increase fear.
23

I I I I I I I I I I I I I I I I I I I
We had expected victims to become less fearful if they practiced high
precaution after the incidents. This expectation stemmed 1n part from Janoff
Bulman's (1979) distinction between "characterological self-blame" and
"behavioral self-blame" and her assertion that only the former was detrimental
to rape victims. We still view the act of assuming behavioral responsibility
for one's vulnerabi Ii ty to cr1me as a cons truc ti ve response for vic tims and
would not rule out the possibility that professional interventions designed to
promote precaution among victims could likewise help to reduce their fear.
These resul ts underscore the importance of Norton and Courlander' s (1982)
observation: If the reduction of fear 1S the goal of an intervention,
information about the need for security measures must be coupled with the
reassurance that the recommended behaviors do 1n fact reduce one's
vulnerability to crime.
provide such reassurance.
Alternative Strategies
Unfortunately, the present study does little to
These findings sugges t that publi c official s cannot rely on citizens'
abilities to protect themselves and must consider more comprehensive approaches
to crime prevention. Two strategies that appear to show promise are "community
building" and "physical rebuilding," concepts that have been discussed for
years in criminal justice (e.g., Henig & Maxfield, 1978; Jeffery, 1971). In
general, these strategies attack the problems of victimization and fear at the
neighborhood or community level rather than at the personal or household level.
The former strategy of "community building tl refers to efforts, primarily
police practices, that attempt to enhance social cohesion. Fear in particular
seems to be lower where persons are concerned about others, are confident that
others are concerned about them, or are simply acquainted with cne another
(Henig & Maxfield, 1978; Waller, 1976). Projects that promote a sense that the
police care (Pate, Wycoff, Skogan, & Sherman, 1986) or that involve the police
and residents in solving neighborhood problems (Cordner, 1986) appear to be
effective descendants of the earlier "team-policing" concept designed to
overcome police-resident isolation (Angell, 1960; National Advisory Commission
on Criminal Justice Standards and Goals, 1976). Neighborhood Watch programs
also could be considered an example of a community-initiated prevention
program, although evidence of their effectiveness is lacking (Rosenbaum et al.,
1985; 1986).
24

I I I I I I I I I I I I I I I I I I I
With regard to the latter strategy of "physical rebuilding": improving
lighting, removing blind spots, establishing communal areas, and promoting the
circulation of people all are strategies believed to reduce both actual crime
and fear of crime in urban areas (Jeffery, 1971; Newman, 1972). People also
respond with fear to signs of poverty and deterioration (e.g., abandoned
housing); thus eliminating such symbols may be effective 1n reducing the
perceived dangerousness of urban environments (Kidder & Cohn, 1979).
These strategies are not independent. Alterations of the physical
environment may enhance social cohesion. Fowler and Mangione (1982) evaluated
the impact on an urban neighborhood of physical changes such as cul-de-sacs and
new traffic patterns and found that residents used the neighborhood more often,
intervened on behalf of one another more often, and were more likely to
perceive their neighbors as a resource. Although change could not be
attributed to the intervention, fear of cr1me 1n this neighborhood was
significantly lower than would be expected from city-wide trends.
Implications for Future Research
The study that has been described here has several advantages over most
previous studies on this topic. Its longitudinal design (two interviews, one
year apart) allowed measures of precaution to be taken before they could have
been influenced by the crlme. The sample was heterogenous in terms of
socioeconomic status, age, and place of residence, and was generally
representative of the adul t population in Kentucky. Precautionary behavior
could thus be assessed as it occurs naturally in the population. Victimization
was examined both as a dichotomous variable (occurrence vs. non-occurrence) and
as a continuous variable (wherein more severe crimes received higher values
than less severe crimes), The fact that the effects of precaution through the
use of self-help measures did not differ across these dependent variables
should increase confidence in the validity ~f the findings. Most previous
studies of precautionary measures have evaluated the effects of specific
interventions where neighborhoods or groups such as older adults were targeted
for promotional activities. Although the findings here should be more
generalizable than those from confined interventions, they cannot be consider@~
complete in themselves. For example, they do not address the important
possibilities 0) that self-help measures are more effective for particular
subgroups of the population such as inner-city dwellers; (2) that self-help
25

I I I I I I I I I I I I I I I I I I I
measures are more effective when used In combination with other crIme
prevention techniques; and (3) that self-help measures are more effective when
implemented under the guidance of crime prevent ion special is ts. Furthermore,
the size of the sample and the frequency of crime were not sufficiently large
to allow us to examine particular crime types. The finding that respondents
who used these precautions experienced some type of property crime does not
necessarily imply that burglar alarms do not prevent burglary or that locking
cars does not prevent theft. Altogether, there is still much that needs to be
learned about for whom, for what crimes, and under what conditions individuals'
attempts to protect themselves are successful.
Summary and Conclusions
As presently practiced by Kentuckians, self-initiated precautionary
measures do little to alter the probabilities of being victimized in some way
over a one-year interval of time. One possible explanation is that Kentuckians
implement self-help measures poorly and need further guidance from crime
prevention specialists. On the other hand, policymakers may have overestimated
the importance of individual-level precaution in reducing victimization and
crlme.
All In all, programs whose aIm IS solely to promote the use of self-help
measures appear to show little promise of becoming a sufficient policy response
to the issues of victimization and fear. Kidder and Cohn's (1979) criticism of
this approach bears repeating: Campaigns to increase protective measures at
the individual or household level are surely the easiest "crime prevention"
programs to carry out. Compared to many other strategies, they take little
time, money, or coordinated effort. But they do nothing to reduce the number
of offenders or to change the acknowledged dangerousness of the environment.
We advise caution in interpreting these findings, particularly as they
relate to the specific self-help measures. We are not recommending that people
stop locking their doors! We are recommending that criminal justice officials
thoughtfully and critically reevaluate their current crime prevention policies
and priorities. These findings appear to justify, if not demand, the
allocation of additional funde to design and -implement comprehensive crime
prevention strategies. The effectiveness of self-help measures may well be
enhanced by professional instruction or supplementary tactics that are more
26

I I costly than present budget sallow. Clearly, further research evaluating the
impact of existing, as well as any new, crime prevention programs is needed.
I I I I
II
I I I I I I I I I I I
27
I
I I I I I I I I I I I I I I I I I I I
REFERENCES
American Psychological Association. (1984). Task force on the victims of crime and violence. (1984). Final report. Washington, DC: American Psychological Association.
Angell, J. E. (1975). The democratic model needs a fair trial: Angell's response. Criminology, ~(4) 379-384.
Bard, M., & Sangrey, D. (1986). The crime victims I book. Secaucus, NJ: Citadel Press.
Brownr. L. (1984). Strategies to reduce the fear of CTlm,e. The Police Chief, i,!, 45-45.
Bureau of Justice Stati st ics Annual Report Fiscal 1986. (1986). Washington, DC: U.S. Department of Justice, Bureau of Justice Statistics.
Burgess, A., & Holmstrom, L. (1974). Rape trauma syndrome. American Journal of Psychiatry, 131, 981-986.
Calhoun, K., Atkeson, B., & Resick, P. fear reactions in victims of rape. 655-661.
(1982). A longitudinal examination of Journal of Counseling Psychology, 29,
Cirel, P., Evans, P., McGillis, D., & Whitcomb, D. (1977). Community crime prevention: An exemplary project. Seattle, WA: National Institute of Law Enforcement and Criminal Just ice. Washington, DC: U.S. Government Printing Office.
Cook, R., Smith, B., & Harrell, A. (1987). Helping crime victims: Levels of trauma and effectiveness of services. Washington, DC: U.S. Department of Justice.
Cordner, G. (1986). Fear of crime and the police: An evaluation of a fear-reduction strategy. Journal of Pol ice Science and Adminis trat ion, 14, 223-233.
Duncan, J. T. (980). Citizen crime prevention tactics. Washington, DC: U.S. Department of Justicc 1 National Institute of Justice.
Fattah, E. (1967). Toward a criminological classification of victims. International Criminal Police Review, 22, 163-169.
Fowler, F., & Mangione, T. (1982). Neighborhood crime, fear, and social control: A second look at the Hartford program. Washington, DC: U.S. Department of Justice, National Institute of Justice.
Harel, Z., & Broderick, K. (1980). Victimization and fear of crime among the urban aged. The Police Chief, 47, 34-36.
Heal, K. (1983). The police, the public, and the prevention of cnme. The Howard Journal of Penology and Crime Prevention, 22, 91-100.
28

I I I I I I I I I I I I I I I I I I I
Henig, J., & Maxfield, M. intervention. Victimology:
(1978). Fear of crime: Strategies for An International Journal, ~, 297-313.
Hindelang, M., Gottfredson, M., & Garofalo, J. (1978). Victims of personal crime: An empirical foundation for a theory of personal victimization. Cambridge, MA: Ballinger Publishing Company.
Janoff-Bulman, R. (1979). Characterological versus behavioral self-blame: Inquires into depression and rape. Journal of Personality and Social Pathology, 37, 1798-1809.
Janoff-Bulman, R., & Fri(~ze, I. (1983). understanding reactions to victimization. 1-17 •
A theoretical perspective for Journal of Social Issues, 39,
Jeffery, C. R. (1971). Crime prevention through environmental design. Beverly Hills, CA: Sage Publications.
Johnson, K. (1980). A multifaceted evaluation of the Monterey County burglary prevention unit. Fairfax, VA: International Training, Research, and Evaluation on Council.
Johnson, K., Norris, F., & Burgess, L. (1986). Criminal victlmlzation in Kentucky: A longitudinal study. Louisville: Urban Studies Center, Kentucky Criminal Justice Statistical Analysis Center, University of Louisville.
Johnson, K., Norton, L., & Triganopolos. (1978). A second-year evaluation of the seniors against a fearful environment program. Upper Marlboro, MD: Prince Georges County Government Office of Budget and Planning.
Kaplan, H. M., Palkovitz, L. E., through environmental de~ign: Minneapolis, Minnesota. Corporation.
& Pesce, E. J. Final report on
Arlington, VA:
Kelling, G., Pate, T., preventive patrol
Dieckman, D., experiment:
& Brown, C. A technical
Police Foundation.
0·9,.78). .,~rime prevention t ..
residential demonstration, Westinghouse Electric
(1974) • report.
The Kansas City Washington, DC:
Kidder, L., & Cohn, E. (1979). Public views of crime and crime prevention. In I. H. Frieze, D. Bar-Tal, & J. Carroll (Eds.), New approaches to social problems. San Francisco: Jossey-Bass Inc.
Kilpatrick, D., Veronen, L., & Resick, P. (1979). Assessment of the aftermath of rape: Changing patterns of fear. Journal of Behavioral Assessment, !, 133-148.
Lindquist, J., & Duke, J. (1982). fear-victimization paradox. 20, 115-126.
The elderly victim at risk: Explaining the Criminology: An Interdisciplinary Journal,
29

I I I I I I I I I I I I I I I I I I
Lindsay, B, & McGillis, D. (1986). Citywide community crime prevention: An assessment of the Seattle program. In D. P. Rosenbaum (Ed.), community crime prevention: Does it work? Beverly Hills, CA: Sage Publications.
Lurigio, A. J., & Rosenbaum, D. P. (1986). Evaluation research in community crime prevention: A critical look at the field. In D.P. Rosenbaum (Ed.), Community crime prevention: Does it work? Beverly Hills, CA: Sage Publications.
National Advisory Commission on Criminal Justice Standards and Goals. (1976). Task force on police. Washington, DC: Department of Justice.
Newman, O. (1972). Defensible space: Crime prevention through urban design. New York: MacMillan Press.
Norton, L., & Courlander, M. (1982). role of crime prevention programs.
Fear of crime among the elderly--The Gerontologist, 22, 388-393.
Pate, A. M., Wycoff, M. A., Skogan, W. G., & Sherman, L. A. (986). Reducing fear of cr1me 1n Houston and Newark: A summary report. Washington, DC: U.S. Department of Justice, National Institute of Justice, Police Foundation.
Pedhazur, E. (982). Multiple regression 1n behavioral research. New York: Holt, Rinehart, and Winston.
Police Foundation. (1981). The Newark foot patrol experiment. Washington, DC: Police Foundation.
Research & Forecasts, Inc. America afraid; Part I:
(1980). The Figgie The general public.
report on fear Willoughby, OH:
of crime: The Figgie
Corporation.
Rosenbaum, D. P., Lewis, D. A., & Grant, J. A. (1985). The impact of community crime prevention programs in Chicago: Can neighborhood organizations make a difference? Final Report, Vol. 1, to the Ford Foundation. Evanston, IL: Northwestern University, Center for Urban Affairs and Policy Research.
& Grant, J. A. (986). Neighborhood-based the efficacy of community organ1z1ng in (Ed. ), Community cnme prevention: Does it Publications.
Rosenbaum, D. P., Lewis, D. A., crime prevention: Assessing Chicago. In D. P. Rosenbaum work? Beverly Hills, CA: Sage
Skogan, W. cities. Praeger.
(1977). Public policy and the fear of crime in large American In J. A. Gardner (Ed.), Public law and public policy. New York:
Skogan, W., & Maxfield, M. neighborhood reactions.
U.S. Department of Justice. report. Washington, DC: Justice Planning Office.
(1981). Coping with crime: Individual and Beverly Hills, CA: Sage Publications.
(1975). Burglary reduction program: Final U.S. Department of Justice, Seattle Law and
30

I I I I I I I I I I I I I I I I I I I
U.S. Department of Justice. (1983). Report to the nation on crime and
u.s.
justice, The data. Washington, DC: U.S. Department of Justice, Bureau of Justice Statistics.
Department of Justice. report, fiscal year 1986.
(1986). Bureau of Justice Statistics annual ----~--------~------~~~--~~---=-Washington, DC: U.S. Department of Justice.
U.s. Department of Justice. (1986). program plan, fiscal year 1987.
National Institute of Justice research Washington, DC: U.S. Department of
Justice.
United States President's Task Force on Victims of Crime, Final Report. (1982). Washington, DC: Government Printing Office.
Van Dijk, J., & Steinmetz, C. measurlng the volume of crime.
(1983). Victimization surveys: Victimology, ~, 291-309.
Von Hentig, H. (1948). The criminal and his victim. New Haven: University Press.
Beyond
Yale
Waksberg, J. (1978). Sampling methods for random-digit dialing. Journal of the American Statistical Association, 75, 40-46.
Waller, 1. (1976). Victim research, pUblic policy, and criminal justice. Victimology, 1, 240-252.
Whitaker, C. (1986). Crime prevention measures. Washington, DC: U.S. Department of Justice, Bureau of Justice Statistics.
Wolfgang, M., & Ferracuti, F. (1976). The subculture violence: Toward an integrated theory in criminology. London: Tavistock Publications.
\
Wolfgang, M., Figlio, R., Tracy, P., & Singer, S. (1985, June). The national survey of crime severity. U.S. Department of Justice, Bureau of Justice Statistics. NCJ-96017.
31

I
II I I
APPENDICES I I I I I I I I
. ' .... ", .
I I I I I I I I - ------- ----- -

I I I I I I I I
I I I I I I I I I I I I
ti"
APPENDIX A
CRIME INCIDENT BATTERY
URBAN STUDIES CENTER FEAR OF CRIME SCALE
URBAN STUDIES CENTER PRECAUTION INDEX

I I I I I I I I I I I I I I I I I I I
CRIME INCIDENT BATIERY
Each of the following questions had a one-year report period, and was followed by probes asking "In what month did this happen?" and "How many times?"
During the last 12 months •••
1. Did anyone break into your apartment/home, garage, or another building on your property?
2. Did you find a door jammed, a lock forced, or any other signs of an ATTEMPTED break-in?
3. Did anyone steal or TRY TO STEAL A VEHICLE OR PART OF (it/any of them), such as battery, hubcaps, tape-deck, etc. from you or anyone else in your household?
4. Have people In your household had their pockets picked or purses snatched?
5. Did anyone TRY to rob you or anyone else in your household by using force or threatening to harm you?
6. Did anyone beat up, sexually attack, or hit you or anyone else in your household with something?
7. Were you or anyone else In your household knifed, shot at, or attacked with some other weapon by anyone at all?
8. Did anyone THREATEN to beat you up or attack you or anyone else in your house~old with a knife, gun, or som~.other ~eapon not including telephone threats? •
9. Did anyone TRY to attack you or anyone else In your household In some other way?
10. Did anyone steal things that belonged to you or anyone else in your household from inside any car or truck, such as packages or clothing?
11. Was anything stolen from you somewhere other than at home, restaurant, or while traveling?
or anyone else in your household while for example, at work, In a theatre or
12. Was anything (else) stolen from you or anyone else in your household?
13. Did you find any evidence that someone ATTEMPTED to steal something that belonged to you or anyone else in your household?

I I I I I I I I I I I I I I I I I I
I I
14. Did anything else happen during the last 6 months that you thought was serious enough to report to the police--such as a car accident involving a drunken driver, or something else you haven't mentioned yet?
a. What happened?
b. During this/these incident(s), was a household member injured, attacked or threatened, or was something damaged or stolen or an attempt made to damage or steal something that belonged to him/her?
15. Did anything else happen during the last 6 months which you thought was a crime, but did NOT report to the police?
a. What happened?
b. During this/these incident(s), was threatened, or was something damaged damage or steal something that belonged
a household member attacked or or stolen or an at tempt made to to him/her?

I I I I I I I I I I I I I I I I I I I
URBAN STUDIES CENTER FEAR OF CRIME SCALE
1. How safe do you feel walking alone in your neighborhood during the day? Would you say you feel • • •
Very safe Somewhat safe Somewhat unsafe, or Very unsafe
2. How safe do you feel outside In your neighborhood at night?
3.
4.
5.
Very safe Somewhat safe Somewhat unsafe Very unsafe
How much does fear of crIme prevent you from doing things you would like to do?
Very much Somewhat Rarely, or Never (not at all)
When you leave your house or apartment, how often do you think about being robbed or physically assaulted?
Very often Sometimes Rarely, or Never
When you leave your house or apartment, how often do you think about it,,",, being broken into or vandalized while you';; away?
Very often Sometimes Rarely, or Never
6. When you're in your home, how often do you feel afraid of being attacked or assaulted by some0ne that you know such as a relative, neighbor, or acquaintance?
Very often Sometimes Rarely, or Never

I I I I I I I I I I I I I I I I I I I
URBAN STUDIES CENTER PRECAUTION INDEX
These questions are preceded by the following introduction: "1 want to remind you that this is a study by the University of Louisville and the State Attorney General, and we want to reassure you that your answers will be kept strictly confidential. • •• As 1 read from a list, tell me if, generally speaking, you take these precautions." Do you generally • • •
1.
2.
3.
4.
5.
6.
7.
8.
Keep the locks on your windows and doors in working order?
Yes Yes partiallya No
Lock vehicle doors when leaving them parked at home?
Yes Yes partiallya No
Lock vehicle when parked away from your home?
Yes Yes partiallya No
Have you engraved most of your valuable property with identification numbers?
Yes Yes partiallyb No
Do you have antiburglary stickers or warning decals on the windows or doors of your home?
Yes Yes partiallyb No
Do you usually leave the lights, radio, or TV on when you go out to make people think someone is home?
Yes No
Do you usually ask for identification from home servicemen?
Yes No
Do you have an operating burglar alarm system in your home or apartment?
Yes No
:"Partially yes" recoded to equal "no." "Partially yes" receded to equal "yes."

I I I I I I I I I I I I I I I I I I I
APPENDIX B
DESCRIPTION OF SAMPLING DESIGN AND SURVEY PROCEDURES FOR WAVE ONE
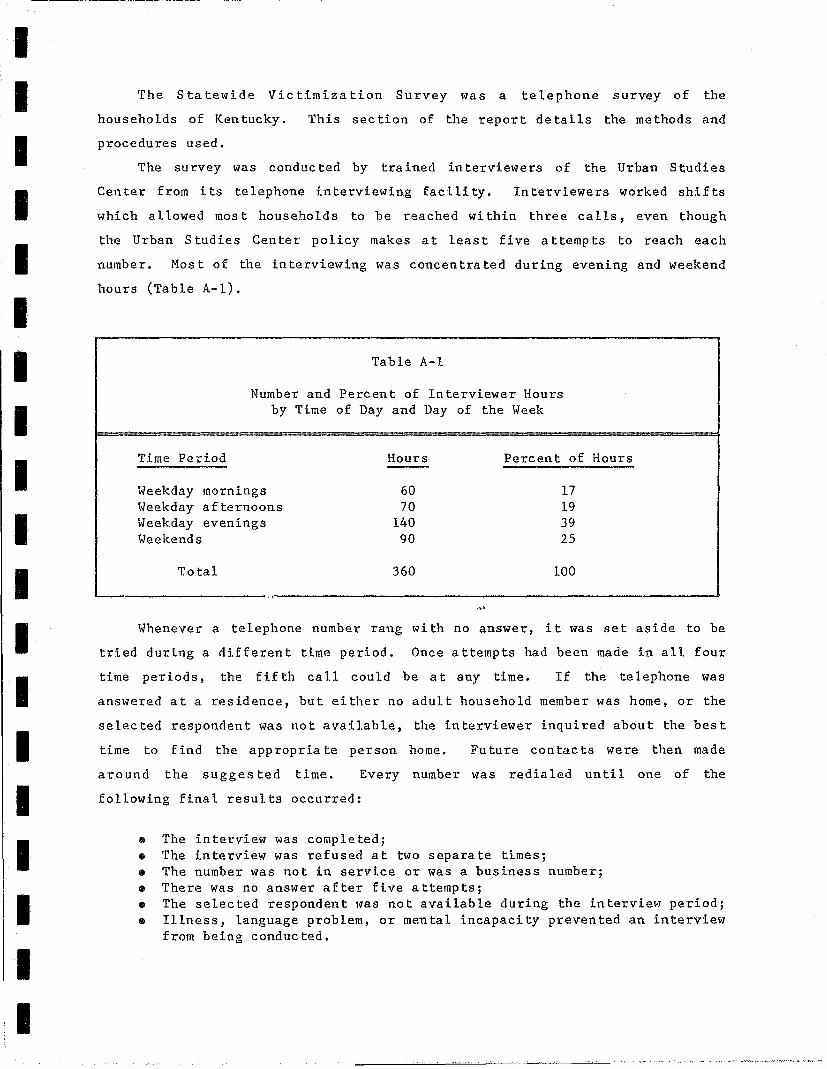
I I I I I I I I I I I I I I I I I I I
The Statewide Victimization Survey was a telephone survey of the
households of Kentucky.
procedures used.
This section of the report details the methods and
'l'he survey was conducted by trained interviewers of the Urban Studies
Center from its telephone interviewing faci li ty. Interviewers worked shifts
which allowed mos t households to be reached wi thin three calls, even though
the Urban Studies Center policy makes at least five attempts to reach each
number. Most of the interviewing Ivas concentrated during evening and weekend
hours (Table A-I).
Table A-I
Number and Percent of Interviewer Hours by 'l'ime of Day and Day of the Heek
Time Period Hours Percent of
\.]eekday mornings 60 17 Heekday afternoons 70 19 Heekday evenings 140 39 Heekends 90 25
'l'otal 360 100
."
Hours
Hhenever a telephone number rang wi th no answer, it was set aside to be
tried during a different time period. Once a ttempts had been made in all four
time periods, the fif th call could be a t any time. If the telephone was
answered at a residence, but either no adult household member was home, or the
selected respondent was not available, the interviewer inquired about the best
time to find the appropria te person home. Future contacts were then made
around the sugges ted time. Every number was redialed until one of the
following final results occurred:
• The interview was completed; • The interview was refused at two separate times; • The number was not in service or was a business number; • There was no answer after five attempts; • The selected respondent was not available during the interview period; • Illness, language problem, or mental incapacity prevented an interview
from being conducted.

1 I I I I 1
I 1 I I ·1 1 1 I I 1
Geography Coverage ..
The respondent was selected to be representative of each of five regions
wi thin the Commonweal th of Kentucky as well as the Commonweal th as a whole.
The five geographical regions with their associated Area Development Districts
selected characteristics of those regions from the 1980 Census; the number of
primary sample units (PSU's) within each region are shown in Table A-2.
Table A-2
Regional Characteristics According to the 1980 Census and the Sample
1980 Census Households Survey PSU's 1980 Census
Region Popula tion Total Phone % of Ph Number Percent
Central 605,756 203,039 171,560 15.4 30 15.8 (Lincoln Trai 1, Barren River, Lake Cumberland)
North Central 1,117,945 396,015 371,783 33.4 63 33.2 (KIPDA, Northern Kentucky)
Northeas t 808,990 282,549 248,931 22.3 42 22.1 (Bluegrass, Buffalo Trace, FIVCO, Gateway)
... Southeas t 543,753 176,454 134,169 12.0 23 12.1
(Big Sandy, Kentucky River, Cumberland Valley)
Wes tern 584,333 205,830 187,603 16.8 32 16.8 (Purchase, Pennyri1e, Green River)
TOTAL 3,660,777 1,263,887 1,114,046 100.0 190 100.0
The Sample
The sampling method was a t~10-stage cluster approach adapted for
telephone intervie\dng, a form of Random Digit Dialing (RDD) (\-laksberg, 1978).
RDD is simply telephone interviewing using a series of randomly genera ted
phonp. numbers. Such a method lowers field work costs yet maintains high
quality data. RDD has the advantage of including in the sample those
households with unlisted telephone numhers. This is especially important in
I I I I I I I I I I I I I I I I I I I
urban areas where one can expect a higher percentage of unlisted phone numbers
than in rural aredS.
The form of RDD employed involved a byo-stage clus tering method. The
first stage involved computer generation of random numbers comprised of eight
digits. The numbers were a composite of the three-digit area
three-digi t prefix, and a l-wo-digi t random number ranging from 00
Figuratively, the first stage would appear as:
(AAA) PPP - NN
code, a
to 99.
Where AAA was the area code, PPP was a random selection from among the
prefixes serving the coun ty or group of coun ties, and NN was a random number
from the range 00-99.
The second stage consisted of the interviewer selecting a number from a
lis t of a 11 two-digi t numbers ranging from 00-99. The list was randomly
ordered for each first stage number. The second stage two-digit number was
dialed after the first stage stem, thus creating the full digits necessary for
the phone number.
The clustering aspect of the process involved the identification of the
primary sampling unit (PSU). A member of the field staff dialed the
first-stage stem plus the first second-stage number from the random digit
lis ting. Whenever a residence was encountered, the first stage stem was
considered a PSU and included in the sample. As many of the remaining 99 • second stage numbers were dialed as needed to ldentify 33 eligible residences.
If the first telephone number dialed reached a business or was not in service,
the remaining numbers were excluded from the sample. In cases where the first
call was unanswered, the number was redia led four additional times at various
times of the day and various days of the week.
The third stage of the sample was based on national crime statistics,
with a violent crime rate about six percent and a property crime rate about 24
percent. For efficiency of the sample, it \V'as desired to complete
approximately the same number of interviews in each of the following strata:
• Households experiencing violent crime during the previous 12 months; • Households experiencing property crime but not a violent crime; • Households experiencing no crime during the previous 12 months.
The initial target sample size for each of these strata was 300 completed
interviews. Cost factors, however, indicated that 900 interviews would be
practicable only if the national rates held up for Kentucky and screening was
.,..,

I I I I I I I I I I I I I I I I I I I
100 perc(>'.1t efficient. The fall-back posi tion was to complete all of the
planned screening contacts regardless of the number of completed interviews in
each strata.
In order to obtain 300 violent crime interviews with only six percent of
the households having experienced this type of crime in a year, and assuming
80 percent of the eligible households would grant the interview, 6,250
households would need to be screened (300/ .06/ .80 = 6,250). Wi th this as the
ini tia 1 ta,rge t, it was decided to use 190 Primary SaMpling Uni ts wi th 33
residential contacts per PSU (190 x 33 = 6,270). Within the cluster of 33
residential contacts, all households reporting on the screener that a violent
crime had been experienced by a family member during the previous months were
eligible for a complete interview. Since about four times as many households
were expec ted to have experienced a property crime only than to have
experienced a violent crime (24 vs 6 percent), about a fourth of the
households reporting a property crime on the screener were eligible for the
complete interview. Finally, about one in 11 households were expected to have
experienced no crime as had experienced a violent crime (70 vs 6 percent), so
one out of 11 households reporting no crime on the screener were eligible for
interview. To ensure these ratios, each cluster of 33 residential contacts
(each PSU) had labels preprinted as follows:
• 'ALL' was preprin ted on three of the 33 labels to designa te tha t the household was eligible for an interview regardless of the screener responses;
• 'PROPERTY' was preprinted on eight labels of the 33 to designa te the household was eligible for the interview only if it had reported a property or a violent crime on the screener note--this should have been five labels to achieve the expected ratio, but the mistake worked in favor of the study;
• 'VIOLENT' was preprinted on 22 of the 33 labels to designate the households that were eligible for interview only if a violent crime had been reported in response to screener questions.
Following through the arithmetic of this sample plan, the study eKpected
to have interviews with 301 victims of violent crimes, 400 victims of property
crimes without violent crime, and 320 interviews \\fith households experiencing
no crime. The calculations for each preprinted label are:

I I I I I I I I I I I I I I I I I I I
•
•
Label says 'ALL' (3 of 33):
6,270 x 3/33 = 570 @ 8-0% = 456 potential households 456 @ 6% = 27 with a violent crime 456 @ 24% = 109 wi th a property crime 456 @ 70% = 320 with no crime.
Label says 'PROPERTY' (8 OF 33):
6,270 X 8/33 = 1520 @ 80% = 1216 potential households 1216 @ 6% = 73 with a violent crime 1216 @ 24% = 292 with a property crime.
Label says 'VIOLENT' (22 out of 33):
6,270 x 22/33 = 4180 @ 80% = 3344 @ 6%
3344 potential households = 201 with a violent crime.
Summa rizing from the ahove, and assuming crime reported on the screener
would be as accurate as in the questionnaire where more questions were
included, Table A-3 shows the expec ted number of completed questionnaires by
type of crime experiences, according to the label statement at the third level
of sampling.
Table A-3
Expected Number of Household Interviews by Crime Experience and Label
Crime Experience
Label Violent Property None Total
All 27 109 320 456 Property 73 292 0 365 Violent 200 0 0 200
TOTAL 300 401 320 1,021
The actual results of crime experience by label are shown i.n Table A-4.
As can be seen when Table A-3 and A-4 are compared, the actual deviated quite
a bit from the expected. This is due to three major differences between the
actual and the expected: crime rate, screening efficiency and response rate.

I I I I I I I I I I I I I I I I I I I
Table A-4
Actual Number of Household Interviews by Crime Experience and Label
Crime Experience
Label Violent Property None Total
All 20 58 277 355 Property 43 89 13* 145 Violent 51 6* 0 57
TOTAL 114 153 290 557
*=Questionnaire respondent gave different information than the screener respondent (15 cases) and interviewer completed questionnaire in error (4 cases).
When both the expected and actual numbers of completed interviews are
percentaged on the row or 'Label' totals, the differences between the expected
and actual crime rates can be seen in Table A-S. Since the screener did not
enter into the selection for households where an 'ALL' label was encountered,
this row of Table A-S demonstrates the differences most clearly. There was no
difference in the expected and ac tual percent of households experiencing a
violent crime (six percent each), but there was a substantial diff.erence
between the expected and actual property crime experience (24 vs. 16 percent),
and the expected and actual percentage of households experiencing no type of
crime during the previous 12 months. Among the group tha t were designa ted for
interview, if they had experienced either a property or violent crime, a
grea ter percentage than expected indica ted they had experienced a violent
crime. \ve expected a ratio of violent to property crime of 1:4 on the
'PROPERTY' label, but actually experienced a ratio of 1:2. Ken tucky had a
much lower rate of property crime than expected; the number of interviews
conducted with households experiencing a property crime would have been even
more underrepresented if we had not made a mistake and took every third
property crime household than every fourth as planned.

I I I I I I I I I I I I I I I I I I I
Table A-5
Percent of Households by Expected and Actual Crime Experience According to Sampling Label Expected Actual
F=================================-=-=========================9 Label
All Property Violent
Violent
6/6 20/30
100/89
Property
Percent
24/16 80/61
0/11
None
70/78 0/9 0/0
Total
100/100 100/100 100/100
Table A-6 shows the expected and actual numbers of intervie,ols percentaged
on the column totals. This makes it easier to compare the expected and the
actual efficiency of the screener in properly identifying households. It was
expected tha t 67 percent of the households which had experienced a violent
crime would be interviewed from the set of screened households with a
'VIOLENT' label. In actuality, only 45 percent of the households victimized
by a violent crime were picked up in this group. The two screener questions
on "iolent crime only identified 73 percent of the households tha t reported
experiencing a violent crime during the la ter interview. Households who had
experienced both violent crime and property crime were particularly
susceptible to having that violence missed by the screener. It may very well
be that the property crime was the salient crime, with only a minor form of
violence accompanying it which was not thought of until the detailed probes
during the comp le teo interview.
A greater percentage of property crime was picked upon the 'ALL' labels
than expected, indicating that the screener was not totally efficient for
picking up property crime either. Other comparisons showed that 85 percent of
households experiencing a property crime were correctly identified on the
screener. This is a better rate than violent crime, but less than the 100
percent accuracy used in the initial calculations. It should be noted that
there were a few cases where crime was reported on the screener but not
reported during the main interview. Part of this wad due to the interview
respondent not allvays being the same as the screener t"espondent.

I I I I I I I I I I I I I I I I I I I
Table A-6
Percent of Households by Expected and Actual Sampling Labels According to Interview Reporting of Crime
Label
All Property Violent
TOTAL
Violent
9/18 24/38 67/45
100/100
Property
Percent
27/38 73/58 0/4
100/100
NonVictim
100/96 0/4 0/0
100/100
The overall response rate to the survey was lower than expected. In
contrast to the 80 percent response used in planning this study, the actual
response ,vas 66 to 72 percent. The higher figure is the response ra te if
those telephone numbers which were not answered during five attempts are
assumed to be nonres idences . The lower figure is the response ra te if all
numbers called were never answerer} and are assumed to be residences with
occupants away or difficult to find.
The overall response rate has two major components: 1) the response to
the screener; and 2) the response to the interview. The product of these two
components produce the overall or total response rate. The screener response
is the proportion of identified residences from whom screening information was
obtained, ,,,hether or not the household had experienced a violent or property
crime. The interview response is the proportion of households eligible for
the complete interview and from whom a complete interview was obtained. The
responses to the study are shown in Table A-7.
The screener response can be computed only as a range. This is due to
the uncertainty of knO\dng whether the telephone numbers not answered in five
a t temp ts connec t to a res idence or no t. Since the numbers were randomly
generated, some of the numbers not answered during five attempts at different
times of the day and different days of the week could be numbers connected to
a telephone booth; numbers for which the phone seemed to be ringing but
actually were not in service; numbers connected to vacation homes which are
occupied infrequently. However, some were connected to residences at which no
one was home during any of the Elve scheduled attempts. If all the 523

I I I I I I I I I I I I I I I I
I I
numbers not answered connected to residences, the screener response was 81
percent (5,037/6,225). On the 0 ther hand, if those numbers not answered in
five attempts did not connect to residences, then the screener response was 80
percent (5,037/6,225-523). Therefore, the true screener response rate lies
within the range of 81-88 percent.
Table A-7
Number of Residentlal Numbers by Survey Results
Survey Resul ts
Total possible residential numbers
Screener completed
Eligible for interview
Completed interviews Terminated interviews Interview refused after screening Respondent not reached in ftve attempts
Household not eligible for interview
Screener not completed
Refused screener Number not answered in five attempts
The interview response ra te was 82 percent (557/682).
Number
6,225
5,037
682
557 32 54 39
4,355
1,188
665 523
Therefore, the
overall response rate lies within the range of 66-72 percent (0.82 x 0.81 to
0.82 x 0.88).
Weights
Different households had different probabilities of being interviewed,
depending upon whether or not the screener respondent indica ted tha t someone
in the household had been the vic tim of a crime during the previous twelve
months. Since the data were not to be analyzed separately within different
screening strata, weights were applied to each case to adjust for the
different probabilities of betng included in the sample for the complete
interview. The weights approxima te the number of interviews that would have

I I I I I I I I I I I I I I I I I I I
been conduc ted if all households where the screener indica ted no crime and
property crime had been interviewed.
Interviewed households for whom the screener response indicated they were
victims of a violent crime were always interviewed regardless of which label
applied to the telephone number (3 "ALL", 8 "PROPERTY" and 22 "VIOLENT" out of
33 labels), They had a probability of selection of 1.0, with the inverse of
this producing a weight of 1.0.
Interviewed households for whom the screener response indicated they were
a victim of a property crime, but not a violent crime, were eligible for
in terview 11 times in each clus ter of 33 (3 "ALL" and 8 "PROPERTY" out of 33
labels) . Therefore, they had a se1:ection probability of one in eleven with
the inverse of this producing a weight of 1.0.
The actual and weighted numbers of interviews are shown in Table A-8.
These weights are not dependent upon the answers made during the complete
in te rview, but the ones during the screener; therefore, they do not have
analytic meaning within themselves. However, weighted percentages or means do
have meaning and are used throughout this report. For purposes of calculation
standard errors of estimates (determining statistical significance), weighted
figures are no t always appropriate. For general purposes, the unweighted
number of interviews are used as the appropriate sample size for calculating
standard errors. The weighted number (3,843) is used for estimating the
overall ra tes of vic timiza tion. This is due to the fac t tha t over 5,000
households were screened, and the screener responses to vic t:l'.miza tion among
those interviewed largely predic ted vic timiza tion as reported on the main
interview. More refined estimates of standard errors would require a complex
approximation, such as balance half-sample replication procedures.
Table A-8
Unweighted and Weighted Number of Households Interviewed by Response to Victimization Questions on the Screener
Screener response
Victim reported on screener Property crime reported on screener No crime reported on screener
Total
Unweighted
94 168 295
557
Weighted
94 504
3,245
3,843

I I I I I I I I I I I I I I I I I I I
-----------------
KENTUCKY CRIMINAL JUSTICE STATISTICAL ANALYSIS CENTER STEERING COMMITrEE
Ernie Allen Chief Aide County Judge Executive's Office Jefferson County
E. Austin, Jr. Secretary Cabinet for Human Resources Commonwealth of Kentucky
David H. Bland DHB Consulting Versailles, Kentucky
Robin Crigler Director Kentucky Commission on Women Commonwealth of Kentucky
William "Bill" Dillard Sheriff Christian County Commonwealth of Kentucky
Horgan T. Elkins Commissioner Kentucky State Police Commonwealth of Kentucky
J. Price Foster Dean College of Urban & Public Affairs University of Louisville
Larry Hayes Secretary of the Cabinet Governor's Office Commonwealth of Kentucky
Vic Hellard Director Legislative Research Commission Commonwealth of Kentucky
-------------------~-~-------
Paul F. Isaacs Public Advocate Department for Public Advocacy Commonwealth of Kentucky
John Kearns Circuit Court Clerk Harrison County Commonwealth of Kentucky
Robert M. Kirtley County Attorney Daviess County Commonwealth of Kentucky
James Knauf Jailor Kenton County Commonwealth of Kentucky
Ronald W. McBride Chief Ashland Police Department Ashland, Kentucky
Gentry McCauley, Jr. Commonwealth's Attorney Fourteenth Judicial District Commonwealth of Kentucky
Ron Simmons Chairman Parole Board Commonwealth of Kentucky
Pat Sims Administrative Office of Courts Commonwealth of Kentucky
George W. Wilson Secretary Corrections Cabinet Commonwealth of Kentucky