Embed Size (px)
Citation preview

The Effects of Process Parameters during the Deposition of SiNx using
PECVD
Presented by John Nice and Joyce PalmerGeorgia Institute of TechnologyNNIN RETs Summer 2006

Objective
Evaluate the effect of process parameter changes for the deposition of Silicon Nitride (SiNx) using Plasma Enhanced Chemical Vapor Deposition (PECVD)
– Utilized the Plasma Therm, Unaxis and STS PECVD systems
– Changed the standard settings for gas flow rate, pressure, temperature and power
– Determined the effect of process changes on deposition rate, uniformity, and index of refraction.

Methodology
Ten minute cleaning process performed before process runs.
One minute seasoning run performed for each recipe prior to deposition.
Typical process run time of ten minutes unless otherwise noted.
Ten minute cleaning process run between consecutive depositions.
Two hour standard cleaning process run at conclusion of testing session.

Analysis of Films
Woollam Ellipsometer: Thin nitride 5-point scan recipe used. Film thickness, index of refraction (n) @ λ=633nm, and uniformity compared.
Plas-Mos Ellipsometer: Film thickness and index (n) @ λ=633nm compared
Nanospec Refractometer: Thin nitride recipe used. Film thickness compared.
Tencor P-15 Profilometer-FC: Thin nitride recipe used. Stress measurements compared.

Plasma Therm PECVD

Plasma Therm PECVD
Changed gas flow rates for SiH4 and NH3. Changed pressure up and down 100 mTorr. Changed temperature from 200-325°C in
25°C increments. Deposited films for 10 minutes except for
deposition rate analysis experiment.

Standard Recipe Used for the Plasma Therm PECVD (Stdnit.prc)
2% SiH4/N2 200 sccm
NH3 5 sccm
N2 900 sccm Temperature 250 °C Pressure 900 mTorr Power 30 Watt

SiH4 Changes for Plasma Therm
Varied Silane gas flow rate from 180 sccm to 220 sccm.
– NH3 5 sccm
– N2 900 sccm
– Temperature 250°C– Pressure 900 mTorr– Power 30 Watt

Woollam Ellipsometer Analysis for Deposition
Deposition of SiN film in 10 minutes vs. Silane Changes on Plasma Therm PECVD on Woollam
1195
1220
1245
1270
1295
1320
1345
1370
1395
175 180 185 190 195 200 205 210 215 220 225
SiH4 Gas Flow Rates (sccm)
De
po
sit
ion
in 1
0 m
inu
tes
(Ǻ
)
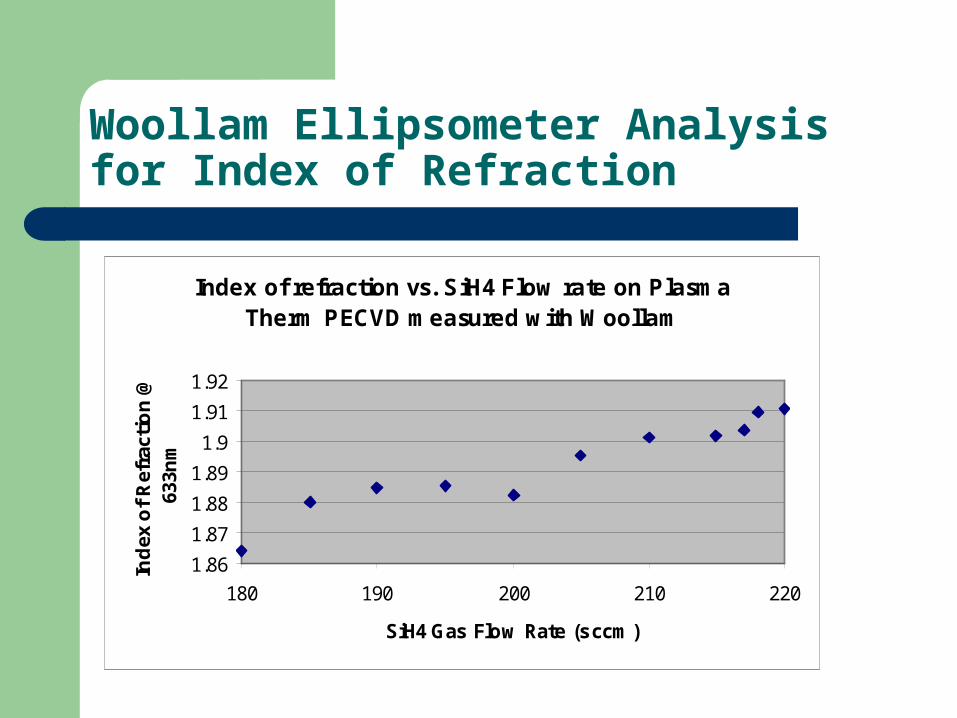
Woollam Ellipsometer Analysis for Index of Refraction
Index of refraction vs. SiH4 Flow rate on Plasma Therm PECVD measured with Woollam
1.86
1.87
1.88
1.89
1.9
1.91
1.92
180 190 200 210 220
SiH4 Gas Flow Rate (sccm)
Ind
ex o
f R
efra
ctio
n @
63
3nm

Woollam Ellipsometer for Uniformity for Silane Changes on Plasma Therm PECVD
Uniformity of SiN Film vs. Silane Gas Flow Rate on Plasma Therm PECVD
0
1
2
3
4
5
175 180 185 190 195 200 205 210 215 220 225
SiH4 Gas Flow Rates (sccm)
Un
ifo
rmit
y %

Film Deposition Comparison for NH3 as Measured on both Woollam and Plas-Mos Ellipsometers and Nanospec
Comparison of Deposition of SiN film in 10 minutes vs. Ammonia Gas Flow Rate on Plasma Therm PECVD
700
900
1100
1300
1500
1700
1900
3 3.5 4 4.5 5 5.5 6 6.5 7
NH3 Gas Flow Rates(sccm)
De
po
sit
ion
in 1
0 m
inu
tes
(Ǻ
)
Deposition on Plas-Mos
Deposition on Woollam
Nanospec

NH3 Changes for Plasma Therm
Changed gas flow rate from 3-7 sccm in 0.5 sccm increments
– 2% SiH4/N2 200 sccm
– N2 900 sccm
– Temperature 250°C– Pressure 900 mTorr– Power 30 Watt

Film Deposition Analysis Measured on Woollam Ellipsometer for NH3 Changes
Deposition of SiN film in 10 minutes vs. Ammonia Gas Flow Rate on Plasma Therm PECVD measured on Woollam
1200
1300
1400
1500
1600
1700
1800
2.5 3 3.5 4 4.5 5 5.5 6 6.5 7 7.5
NH3 Gas Flow Rates (sccm)
De
po
sit
ion
in
10
m
inu
tes
(Ǻ
)

Film Deposition Analysis Measured on Plas-Mos for NH3 Changes
Deposition of SiN film in 10 minutes vs. Ammonia Gas Flow Rate on Plasma Therm PECVD measured on Plas-Mos
1200
1250
1300
1350
1400
1450
1500
3 3.5 4 4.5 5 5.5 6 6.5 7
NH3 Gas Flow Rates (sccm)
Dep
osi
tio
n in
10
min
ute
s (Ǻ
)

Film Deposition Analysis Measured on Nanospec Refractometer for NH3 Changes
Nanospec Analysis for NH3 Film Deposition for Plasma-Therm PECVD
700
900
1100
1300
1500
1700
3 4 5 6 7
NH3 Gas Flow Rate (sccm)
Dep
ost
ion
in
10
min
ute
s (Ǻ
)

The Plas-Mos Ellipsometer and the Woollam Ellipsometer each can measure the film thickness and the index of refraction. The data from the Woollam is generally preferred, since the Woollam determines its values from a large range of wavelengths and measures at multiple points on the wafer. The Plas-Mos and the Nanospec only measure at one point. The Plas-Mos uses only one frequency of light.
Choices of Metrology Tools

Index of Refraction Analysis for NH3 Changes Measured on Woollam
Index of Refraction at 633nm of SiN Film vs Ammonia Gas Flow Rate measured on
Woollam
1.8
1.85
1.9
1.95
2
3 3.5 4 4.5 5 5.5 6 6.5 7
NH3 Gas Flow Rates (sccm)
Ind
ex o
f R
efra
ctio
n @
63
3nm

Uniformity for NH3 Changes on Woollam
Uniformity of SiN Film vs Ammonia Gas Flow Rate measured on Woollam
00.20.40.60.8
11.2
3 3.5 4 4.5 5 5.5 6 6.5 7
NH3 Gas Flow Rates (sccm)
Un
ifo
rmit
y %

Pressure Changes on Plasma Therm PECVD
The following pressures were tested: 900 mTorr, 1000 mTorr, and 800 mTorr
– 2% SiH4/N2 200 sccm
– NH3 5 sccm
– N2 900 sccm
– Temperature 250°C– Power 30 Watt

Woollam Analysis for Film Deposition for Pressure Change
Deposition of SiN Film in 10 minutes vs. Pressure on Woollam
0
200
400
600
800
1000
1200
1400
1600
0 200 400 600 800 1000 1200
Pressure (mTorr)
De
po
sit
ion
in
10
min
ute
s (
Ǻ)

Woollam Analysis for Index of Refraction for Pressure Changes
Index of refraction @ 633nm vs. Pressure on Woollam
1.8
1.85
1.9
1.95
2
0 200 400 600 800 1000 1200
Pressure (mTorr)
Ind
ex o
f R
efra
ctio
n @
633
nm

Uniformity for Pressure Changes on Woollam
Uniformity vs. Pressure on Woollam
0
0.2
0.4
0.6
0.8
1
0 200 400 600 800 1000 1200
Pressure (mTorr)
Un
ifo
rmit
y %

Temperature Changes on Plasma Therm PECVD
Temperature was changed between 200°C and around 325°C in 25°C increments.
– 2% SiH4/N2 200 sccm – NH3 5 sccm– N2 900 sccm– Pressure 900 mTorr– Power 30 Watt

Woollam Analysis for Film Deposition for Temperature Changes
Deposition after 10 minutes vs. Temperature on Plasma Therm PECVD
1250
1300
1350
1400
1450
1500
150 200 250 300 350
Temperature (°C)
Dep
osi
tio
n a
fter
10
min
ute
s (Ǻ
)

Woollam Analysis for Index of Refraction for Temperature Changes
Index of refraction @ 633nm vs. Temperature on Plasma Therm PECVD
1.87
1.875
1.88
1.885
1.89
1.895
1.9
1.905
150 200 250 300 350
Temperature (°C)
Ind
ex o
f re
frac
tio
n @
633
nm

Woollam Analysis of Uniformity for Temperature Changes
Uniformity vs. Temperature on Plasma Therm PECVD
0
0.2
0.4
0.6
0.8
1
1.2
150 200 250 300 350
Temperature (°C)
Un
ifo
rmit
y %

Unaxis PECVD

Standard Recipe For Unaxis PECVD (stdnit.prc)
5% SiH4/He 200 sccm
NH3 8 sccm He 560 sccm N2 150 sccm Temperature 250°C Pressure 1100 mTorr Power 50 watt

SiH4 Gas Flow Rate Changes
The following gas flow rates in sccm for Silane were tested: 220, 215, 210,205, 200, 195, 190, 185, 180
– NH3 8 sccm
– He 560 sccm– N2 150 sccm
– Temperature 250°C– Pressure 1100 mTorr– Power 50 watt

Woollam Analysis for Film Deposition for Silane Changes
Deposition after 10 minutes vs. Silane flow rate on the Unaxis PECVD
800
850
900
950
1000
175 180 185 190 195 200 205 210 215 220 225
Silane Gas Flow Rates (sccm)
Depo
sitio
n af
ter 1
0 m
inut
es (Ǻ
)

Woollam Analysis for Index of Refraction for Silane Changes
Index of refraction at 633nm vs. Silane flow rate on the Unaxis PECVD
1.9
1.92
1.94
1.96
1.98
2
175 180 185 190 195 200 205 210 215 220 225
Silane Gas Flow Rates (sccm)
Inde
x of
Ref
ract
ion

Woollam Uniformity Analysis for Silane Changes
Uniformity vs. Silane flow rate on the Unaxis PECVD
0
1
2
3
4
5
175 180 185 190 195 200 205 210 215 220 225
Silane Gas Flow Rates (sccm)
Unifo
rmity
(%)

Tencor P-15 Profilometer Stress Analysis for Silane Changes
Average Tensile Stress vs Silane Flow Rate on the Unaxis
0
10
20
30
40
50
60
70
80
170 180 190 200 210 220 230
Silane Flow Rate (sccm)
Avg
. T
ensi
le S
tres
s (M
Pa)

NH3 Changes for Unaxis PECVD
The following NH3 gas flow rates in sccm were tested: 10, 9.5, 9, 8, 7, 6
– 5% SiH4/He 200 sccm
– He 560 sccm– N2 150 sccm
– Temperature 250°C– Pressure 1100 mTorr– Power 50 watt

Woollam Analysis for Film Deposition for NH3 Change
Deposition after 10 minutes by changing Ammonia flow rate on the Unaxis PECVD
800825850875900925950975
1000
5 6 7 8 9 10 11
Ammonia Gas Flow Rates (sccm)
Dep
osi
tio
n a
fter
10
min
ute
s (Ǻ
)

Woollam Analysis for Index n @633nm for Ammonia Change
Index of refraction at 633nm vs. Ammonia flow rate on the Unaxis PECVD
1.9
1.95
2
2.05
2.1
5 6 7 8 9 10 11
Ammonia Gas Flow Rates (sccm)
Ind
ex
of
Re
fra
cti
on
@
63
3n
m

Woollam Uniformity Analysis for Ammonia Change
Uniformity vs. Ammonia flow rate on the Unaxis PECVD
0
1
2
3
4
5
5 6 7 8 9 10 11
Ammonia Gas Flow Rates (sccm)
Un
ifo
rmit
y (%
)

Tencor P-15 Profilometer Analysis for Ammonia Change
Average Stress vs. Ammonia Flow Rate on the Unaxis
0
50
100
150
200
250
300
350
400
0 5 10 15
NH3 Flow Rate (sccm)
Avg
. S
tres
s (M
Pa)
Tensile Stress
Compressive Stress

Pressure Changes on Unaxis PECVD
The following pressures were tested in mTorr: 1200, 1100, 900, 800
– 5% SiH4/He 200 sccm– NH3 8 sccm– He 560 sccm– N2 150 sccm– Temperature 250°C– Power 50 watt

Woollam Analysis for Film Deposition for Pressure Change
Deposition after 10 minutes by changing Pressure on the Unaxis PECVD
700725750775800825850875900
700 800 900 1000 1100 1200 1300
Pressure (mTorr)
Dep
osi
tio
n a
fter
10
min
ute
s (Ǻ
)

Woollam Analysis for Index n@633nm for Pressure Change
Index of refraction at 633nm vs. Pressure on the Unaxis PECVD
1.9
1.92
1.94
1.96
1.98
2
700 800 900 1000 1100 1200 1300
Pressure (mTorr)
Ind
ex o
f R
efra
ctio
n

Uniformity Analysis for Pressure Change
Uniformity vs. Pressure on the Unaxis PECVD
0
1
2
3
4
5
700 800 900 1000 1100 1200 1300
Pressure (mTorr)
Un
ifo
rmit
y (%
)

STS PECVD

Low Frequency Standard Thin Nitride Recipe Used(lfsin.set)
2% SiH4/N2 2000 sccm
NH3 20 sccm Temperature 300°C Pressure 550 mTorr Power 60 watts

SiH4 Gas Flow Changes for STS PECVD
The following SiH4 gas flow changes in sccm were tested: 2200, 2150, 2100, 2050, 1950, 1900, 1850, 1800,
– NH3 20 sccm
– Temperature 300°C– Pressure 550 mTorr– Power 60 watts

Woollam Analysis for Film Deposition for Silane Changes
Deposition after 10 minutes by changing Silane flow rate on the STS PECVD
300032503500375040004250450047505000
1700 1800 1900 2000 2100 2200 2300
Silane Gas Flow Rates (sccm)
Depo
sitio
n af
ter 1
0 m
inut
es (Ǻ
)

Woollam Analysis for Index n@633nm for Silane Changes
Index of refraction at 633nm vs. Silane flow rate on the STS PECVD
1.8
1.84
1.88
1.92
1.96
2
1700 1800 1900 2000 2100 2200 2300
Silane Gas Flow Rates (sccm)
Ind
ex o
f R
efra
ctio
n
@ 6
33 n
m

Uniformity Analysis for Silane Changes
Uniformity vs. Silane flow rate on the STS PECVD
0
1
2
3
4
5
6
1700 1800 1900 2000 2100 2200 2300
Silane Gas Flow Rates (sccm)
Un
ifo
rmit
y (%
)

Tencor P-15 Profilometer Stress Analysis for Silane Changes
Compressive Stress vs. Silane Flow Rate on the STS
0
100
200
300
400
500
600
700
800
900
1700 1800 1900 2000 2100 2200 2300
Silane Flow Rate (sccm)
Co
mp
ress
ive
Str
ess
(MP
a)

Conclusions
As the silane flow rate increased, we saw an increase in the deposition rate and the index of refraction. Uniformity was generally constant.
As the ammonia flow rate increased, the deposition rate decreased on the Plasma-Therm, but was unchanged on the Unaxis. The index of refraction decreased as ammonia flow rate increased on both PECVDs. Uniformity was generally constant

Conclusions
As the pressure of the chamber increases, the deposition rate increases. The film becomes more porous. The index of refraction decreased as pressure increased on the Plasma-Therm. The uniformity was better as the pressure decreased on the Plasma-Therm. The results for the Unaxis were inconclusive for all cases.

Conclusions
As temperature increased, the deposition rate decreased, the index of refraction increased, and the uniformity improved.
The cleaning process is very important for getting consistent results. If process parameters are changed by a large amount, rather than in small steps, the results can be skewed. Longer cleaning is indicated for more consistent results.

Mentors
Dr. Nancy Healy Dr. Kevin Martin Janet Cobb-Sullivan Steven Parente