Embed Size (px)
Citation preview
River morphology above a subduction zone, Oregon, USA 1
Copyright © 2006 John Wiley & Sons, Ltd. Earth Surf. Process. Landforms (in press)DOI: 10.1002/esp
Earth Surface Processes and LandformsEarth Surf. Process. Landforms (in press)Published online in Wiley InterScience(www.interscience.wiley.com) DOI: 10.1002/esp.1326
The effects of rock uplift and rock resistance onriver morphology in a subduction zone forearc,Oregon, USASam VanLaningham,1* Andrew Meigs2 and Chris Goldfinger1
1 College of Oceanic and Atmospheric Sciences, Oregon State University, Corvallis, Oregon 97331, USA2 Department of Geosciences, Oregon State University, Corvallis, Oregon 97331, USA
AbstractRelationships between riverbed morphology, concavity, rock type and rock uplift rate areexamined to independently unravel the contribution of along-strike variations in lithologyand rates of vertical deformation to the topographic relief of the Oregon coastal mountains.Lithologic control on river profile form is reflected by convexities and knickpoints in anumber of longitudinal profiles and by general trends of concavity as a function of lithology.Volcanic and sedimentary rocks are the principal rock types underlying the northernOregon Coast Ranges (between 46°30′′′′′ and 45°N) where mixed bedrock–alluvial channelsdominate. Average concavity, θθθθθ, is 0·57 in this region. In the alluviated central Oregon CoastRanges (between 45° and 44°N) values of concavity are, on average, the highest (θθθθθ ===== 0·82).South of 44°N, however, bedrock channels are common and θθθθθ ===== 0·73. Mixed bedrock–alluvial channels characterize rivers in the Klamath Mountains (from 43°N south; θθθθθ ===== 0·64).Rock uplift rates of ≥≥≥≥≥0·5 mm a−−−−−1, mixed bedrock–alluvial channels, and concavities of 0·53–0·70 occur within the northernmost Coast Ranges and Klamath Mountains. For riversflowing over volcanic rocks θθθθθ ===== 0·53, and θθθθθ ===== 0·72 for reaches crossing sedimentary rocks.Whereas channel type and concavity generally co-vary with lithology along much of therange, rivers between 44·5° and 43°N do not follow these trends. Concavities are generallygreater than 0·70, alluvial channels are common, and river profiles lack knickpoints between44·5° and 44°N, despite the fact that lithology is arguably invariant. Moreover, rock upliftrates in this region vary from low, ≤≤≤≤≤0·5 mm a−−−−−1, to subsidence (<<<<<0 mm a−−−−−1). These observationsare consistent with models of transient river response to a decrease in uplift rate. Con-versely, the rivers between 44° and 43°N have similar concavities and flow on the samemapped bedrock unit as the central region, but have bedrock channels and irregularlongitudinal profiles, suggesting the river profiles reflect a transient response to an increasein uplift rate. If changes in rock uplift rate explain the differences in river profile form andmorphology, it is unlikely that rock uplift and erosion are in steady state in the Oregoncoastal mountains. Copyright © 2006 John Wiley & Sons, Ltd.
Keywords: Oregon Coast Ranges; Klamath Mountains; slope–area; lithologic control;rivers; erosion; topography; stream power; steady state; concavity
*Correspondence to:S. VanLaningham,College of Oceanic andAtmospheric Sciences,104 COAS Admin. Bldg.,Oregon State University,Corvallis Oregon 97331,United States.E-mail:[email protected]
Received 4 March 2005;Revised 20 September 2005;Accepted 16 November 2005
Introduction
Fundamental controls on the relief structure of mountain belts are tectonically controlled rock uplift and horizontaltranslation, climate and climate change, the bedrock resistance to erosion and processes of river incision (Merrittset al., 1994; Pazzaglia et al., 1988; Roe et al., 2002; Sklar and Dietrich, 1998; Whipple, 2001; Whipple et al., 1999;Willett, 1999). Rivers provide the mountain belt with a network that modulates material input and output. Rivers andriver profiles therefore reflect the integration of multiple processes and forcings. River profile geometry, for example,is a proxy for identifying spatial patterns of rock uplift in some instances (Seeber and Gornitz, 1983; Merritts and

2 S. VanLaningham, A. Meigs and C. Goldfinger
Copyright © 2006 John Wiley & Sons, Ltd. Earth Surf. Process. Landforms (in press)DOI: 10.1002/esp
Vincent, 1989; Hurtrez et al., 1999; Snyder et al., 2000; Kirby and Whipple, 2001). Erosional processes have alsobeen inferred from longitudinal profiles and channel types (Howard, 1994; Howard and Kerby, 1983; Howard et al.,1994; Sklar and Dietrich, 1998; Whipple and Tucker, 1999), while sediment supply effects on fluvial erosion can exertcontrols on longitudinal profiles as well (Sklar and Dietrich, 2001). Moreover, longitudinal profiles not only respondto climate by modulating the hydrologic and erosional conditions, but also show effects driven by orographic precipi-tation (Roe et al., 2002). Longitudinal profile development is also complicated by variable rock strength. Gilbert(1877) first suggested that lithology was of fundamental importance in river erosion and longitudinal profile form.Stock and Montgomery (1999) argued that lithologic controls produce large variability in river long-profile develop-ment. Duvall et al. (2004) showed that lithology is important in determining the concavity of river profiles. Althoughlong-profiles are the consequence of complex interactions between a range of variables, they are markers for under-standing crustal processes in the topographic landscape.
The aim of this study is to distinguish between rock resistance and rock uplift influences on river profile andtopographic form in the terrestrial forearc of an active subduction zone. A simple approach is taken here to assess therelationship between river morphology, rock resistance and tectonic rock uplift in the coastal mountains of Oregonbetween 42° and 46°N. Forty-one rivers flowing generally from the drainage divide westward to the Pacific Ocean onthe windward, western flank of the range were selected to minimize orographic effects. To a first order, therefore, thevariables controlling river profile form, and hence the topographic relief of the range, are rock uplift rate and lithologicvariation, all of which vary systematically along-strike. Two uplift rate datasets exist for the west flank of the CoastRange. We invoke established slope–area analyses (Hurtrez et al., 1999; Snyder et al., 2000; Kirby and Whipple,2001) to quantify river profile variability and examine river profile form as it relates to bedrock, mixed bedrock–alluvial and alluvial channel morphologies.
The motivation for this research came largely from the need to understand active tectonic processes in the forearcregion of Cascadia Subduction Zone. The coast range topography represents a physical marker containing in-formation about long-term strain accumulation (Brandon et al., 1998; Kelsey et al., 1994). Quantifying ratesof vertical deformation in this highly vegetated region is notoriously difficult; therefore we adopted a tectonic–geomorphic approach with the goal of learning more about the communication between topography and mountainbuilding processes occurring during active subduction. Previous work argues that rock uplift and lithologic variationinfluence rivers, hillslopes and relief in the Oregon Coast Ranges (Rhea, 1993; Kobor and Roering, 2004; Roeringet al., 2005). This study complements and builds from these studies via contemporaneous exploration of river profileform, reach-scale lithologic variation, and structural processes associated with subduction zone strain accumulationand release. A key result from this analysis, however, is that the rock resistance signal seen in hillslopes (Roeringet al., 2005) is a key control, and more important than rates of rock uplift in some cases, on the river profile andtopographic relief.
Study Area
Geographic domainsThe coastal mountains of Oregon, which include the northern portion of the Klamath Mountains, are examined(Figure 1). Four geographic domains based on lithologic, tectonic (uplift patterns) and topographic variations along-strike are recognized. The four domains are the northern Oregon Coast Ranges (NCR; latitudes 46°–44°45′N), thecentral Oregon Coast Ranges (CCR; 44°45′– 44°N), the southern Oregon Coast Ranges (SCR; 44°– 43°N), and theKlamath Mountains (KM; 43°– 42°N).
Rock uplift ratesVertical tectonic motions in the coastal region of Oregon are related to the interaction of the subducting Juan de Fuca-Gorda plates and overriding North American Plate. Rates of vertical deformation in coastal Oregon have been con-strained by uplifted marine terraces (Kelsey et al., 1994; Kennedy et al., 1982; McInelly and Kelsey, 1990; Ticknorand Kelsey, 1992) and from the reoccupation of benchmarks over a 45-year period and tide gauge records (Figure 2)(Mitchell et al., 1994). Marine terraces document uplift along the coast, specifically, and are interpreted to be ameasure of permanent deformation averaged over hundreds of seismic cycles (Kelsey et al., 1994). Geodetic rates,measured over the last c. 45 years, constrain vertical deformation from the coast eastward across the range during theinterseismic period. Some component of the geodetic uplift signal measures elastic strain accumulating from a ‘locked’subduction interface (Hyndman and Wang, 1995; McCaffrey and Goldfinger, 1995; McCaffrey et al., 2000). These
River morphology above a subduction zone, Oregon, USA 3
Copyright © 2006 John Wiley & Sons, Ltd. Earth Surf. Process. Landforms (in press)DOI: 10.1002/esp
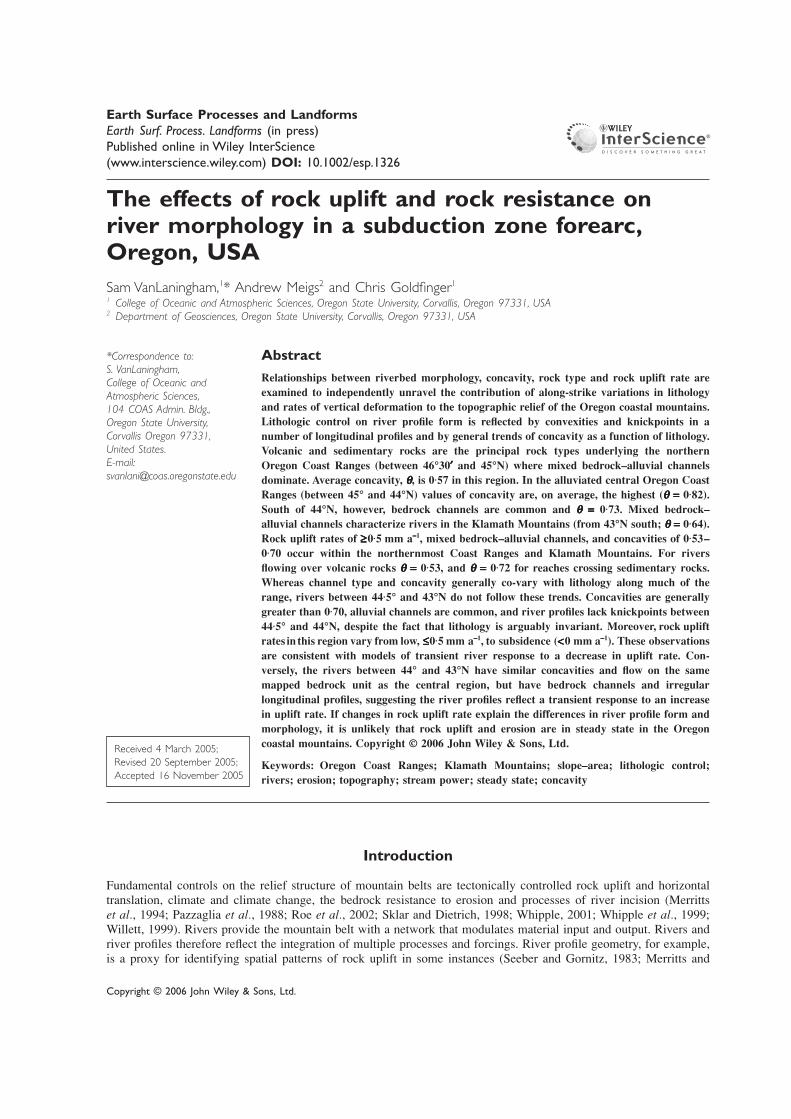
Figure 1. The regional topography and bathymetry of the Juan de Fuca–North American plate boundary between latitudes 42°and 46°N. The Juan de Fuca Plate subducts beneath North America at about 34 mm a−1 (Miller et al., 2001). The Oregon CoastRanges (NCR, CCR, SCR) and Klamath Mountains (KM) are the inner forearc high and lie between a marine forearc basin buriedby sediment on the shelf to the west and a terrestrial forearc basin (the Willamette valley, WV) to the east. The dashed white linedelineates the outer forearc high (McNeill et al., 2000). The Newport Basin (NB) is a region that has experienced offshoresubsidence, initiating in the Pliocene and possibly subsiding more vigorously during the Pleistocene (McNeill et al., 2000). Black linealong approximate drainage divide shows line of cross-section (Figure 2 & 11b). Image compiled from digital data by Haugerud(1999; http://geopubs.wr.usgs.gov/openfile/of99-369/).
4 S. VanLaningham, A. Meigs and C. Goldfinger
Copyright © 2006 John Wiley & Sons, Ltd. Earth Surf. Process. Landforms (in press)DOI: 10.1002/esp
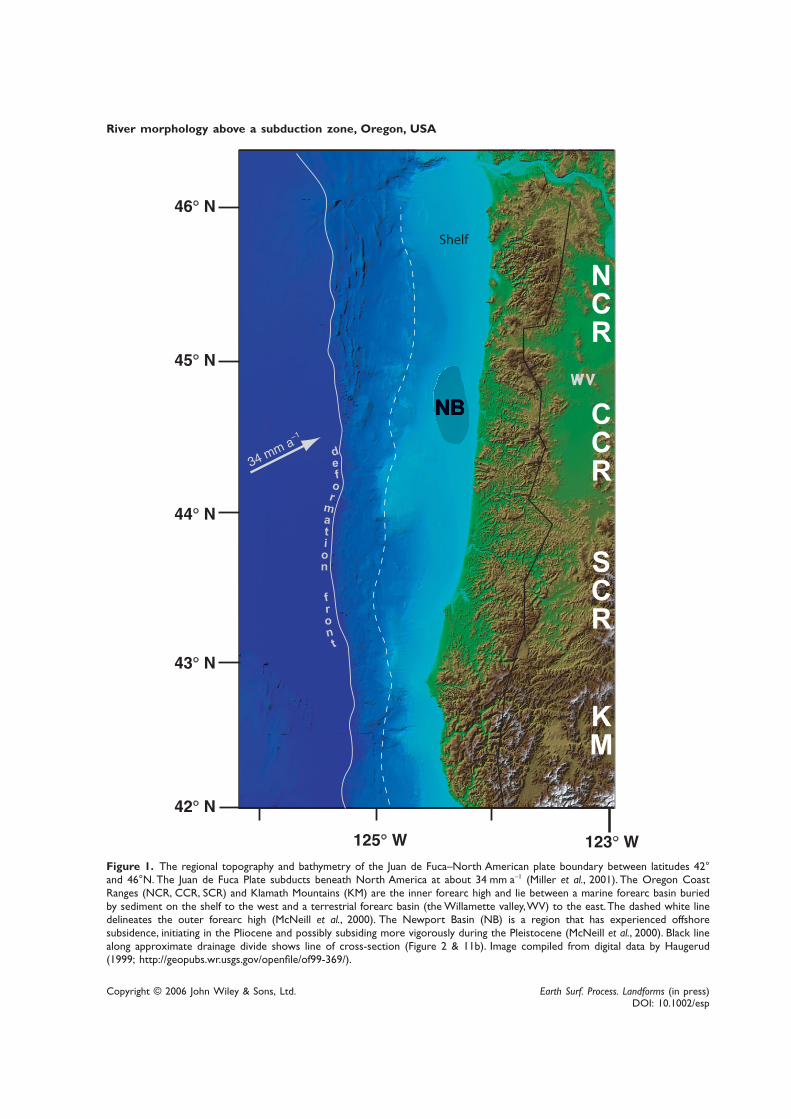
Figure 2. Relief, mean elevation and uplift rate profiles from 42° to 46°N. (A) Topographic relief and mean elevationprofiles along a north–south transect through the crest of the Coast Ranges. Relief and mean elevation are moderate in the NCR.In the CCR relief is moderate and mean elevation is low. Both relief and mean elevation are low in the SCR and high in the KM.(B) Long-term uplift data derived from marine terraces (black dots with error bars and dashed line; Kelsey, 1990; Kelseyand Bockheim, 1994; Kelsey et al., 1996) and stream incision rate data (open boxes with range-of-measurement bars and solidline; Personius, 1995). Black dashed line is best-fit curve from Kelsey et al. (1996). The grey shaded region at Cape Blanco showsnearly an order-of-magnitude difference in uplift rate within 10 km of coast. Grey solid line is a fit based on the incision ratevalues from Personius (1995). Errors on incision data are around 0·4 mm a−1 on average. (C) Coastal geodetic uplift rates (Mitchellet al., 1994). (D) Inland geodetic uplift rates, which illustrate that no uplift is occurring along the coast or inland are betweenc. 44°30′N and 45°30′N. Shaded grey areas in the uplift plots are illuminating zone of low to negative uplift rates.
geodetic rates are important in understanding the strain accumulation and release patterns of the earthquake cycle.However, it is unclear to what extent the vertical deformation associated with interseismic strain accumulationcontributes to the long-term net, rock uplift in the coastal mountains. Permanent strain probably does accumulate(Thatcher, 1984), and therefore contributes to long-term landscape evolution.
No long-term uplift data are available for much of the NCR (Figure 2). Rates in the CCR are moderate (0·4–0·9 mma−1) and fall to low values in the SCR (0·01– 0·2 mm a−1) (Figure 2B). South of 43°N in the KM, the long-termuplift rates are the highest (c. 0·5 –1·0 mm a−1 on average). Present-day deformation rates from levelling along thecoast show the same general trend of moderate, low and high rates from north to south, respectively, but are an order-of-magnitude higher (Figure 2C) (Kelsey et al., 1994; Mitchell et al., 1994). It is notable, however, that the twodatasets are out-of-phase between c. 45°30′ and 43°30′N. Whereas long-term rates are >0 mm a−1 between 45°30′ and44°30′N, geodetic rates are c. 0 mm a−1. In contrast, long-term rates are c. 0 mm a−1 from 44°30′ to 43°30′, butgeodetic rates are >0 mm a−1 (compare Figure 2B and C). The east–west trends in geodetic data show easterly tiltalong much of the length of the Oregon coastal ranges (Mitchell et al., 1994). However, at c. 44.5°N there is no east–west tilt observed.
River morphology above a subduction zone, Oregon, USA 5
Copyright © 2006 John Wiley & Sons, Ltd. Earth Surf. Process. Landforms (in press)DOI: 10.1002/esp
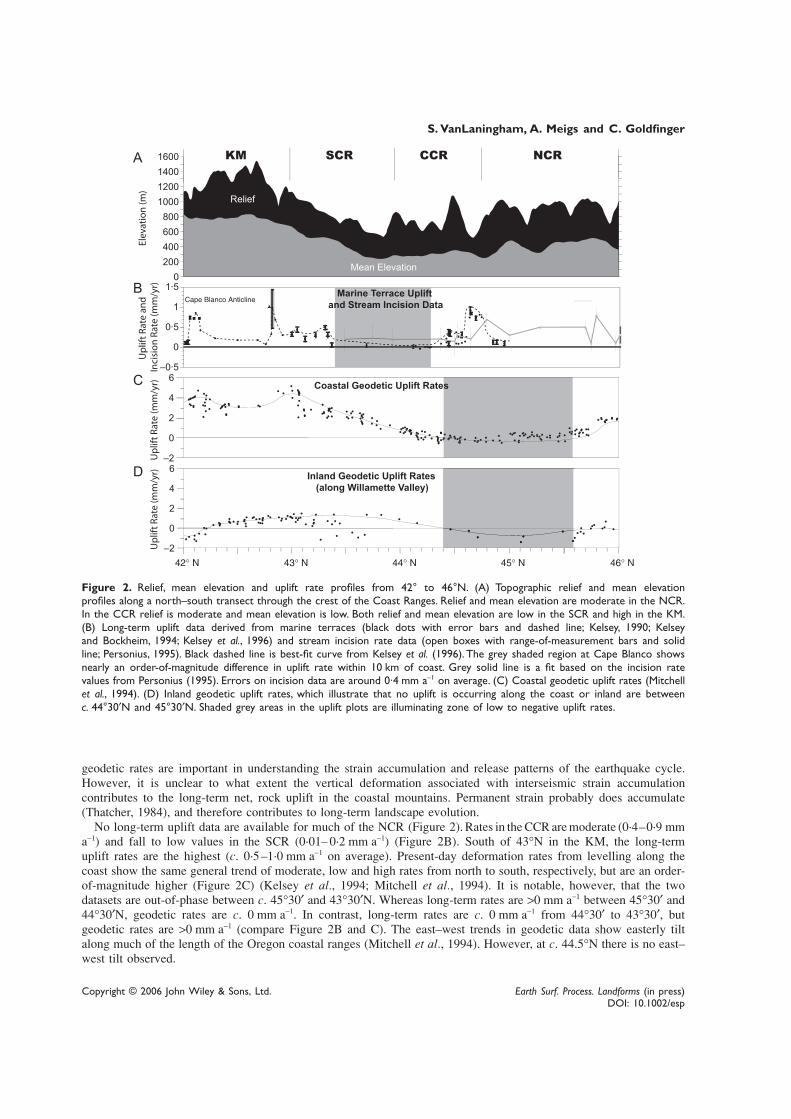
Bedrock geologyThe bedrock geology is quite diverse along the length of the Coast Ranges (Figure 3). Generally, the dominant units inthe northern region are the Tillamook Volcanics (Ttv) and the Siletz River Volcanics (Tsr), which range in age from 50to 58 Ma (Duncan, 1982). The Siletz River Volcanics form the basement to the Coast Range (Trehu et al., 1994), butthey are primarily exposed north of 44°45′N. Siletz River Volcanics consist of basalt flows and sills interbedded withminor sandstone, siltstone and conglomerate and are thought to be due to hot-spot volcanism on or near a spreadingridge (Duncan, 1982). Sedimentary units overlying the Siletz River basement include the Yamhill Formation (Ty) andvolcaniclastic deposits (Ttvm) within the Tillamook Volcanics. Younger Tertiary sedimentary rocks flank exposures ofthe Siletz River Volcanics in the north.
Figure 3. A simplified version of the 1:500 000 geologic map of Oregon showing the major bedrock units of the coastalmountains in Oregon. The heavy dark grey line delineates the line of cross-section in Figure 2 & 11b. Dotted line shows westernedge of the basement rocks (Tsr), which underlie most of the Oregon Coast Ranges (Trehu et al., 1994). Note that rock unitshading is not the same in this figure as in the figures showing geology superimposed on longitudinal profiles (Figures 6 – 9).Geologic map is modified from Walker and MacLeod (1991).
6 S. VanLaningham, A. Meigs and C. Goldfinger
Copyright © 2006 John Wiley & Sons, Ltd. Earth Surf. Process. Landforms (in press)DOI: 10.1002/esp
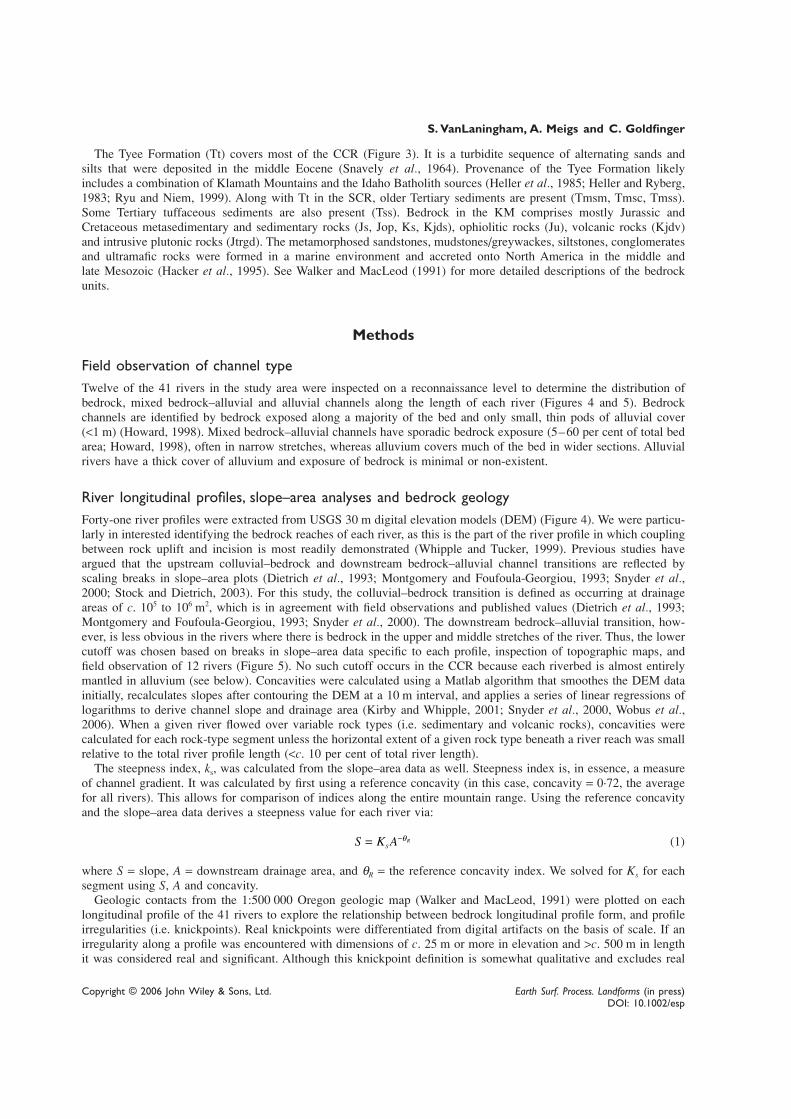
The Tyee Formation (Tt) covers most of the CCR (Figure 3). It is a turbidite sequence of alternating sands andsilts that were deposited in the middle Eocene (Snavely et al., 1964). Provenance of the Tyee Formation likelyincludes a combination of Klamath Mountains and the Idaho Batholith sources (Heller et al., 1985; Heller and Ryberg,1983; Ryu and Niem, 1999). Along with Tt in the SCR, older Tertiary sediments are present (Tmsm, Tmsc, Tmss).Some Tertiary tuffaceous sediments are also present (Tss). Bedrock in the KM comprises mostly Jurassic andCretaceous metasedimentary and sedimentary rocks (Js, Jop, Ks, Kjds), ophiolitic rocks (Ju), volcanic rocks (Kjdv)and intrusive plutonic rocks (Jtrgd). The metamorphosed sandstones, mudstones/greywackes, siltstones, conglomeratesand ultramafic rocks were formed in a marine environment and accreted onto North America in the middle andlate Mesozoic (Hacker et al., 1995). See Walker and MacLeod (1991) for more detailed descriptions of the bedrockunits.
Methods
Field observation of channel typeTwelve of the 41 rivers in the study area were inspected on a reconnaissance level to determine the distribution ofbedrock, mixed bedrock–alluvial and alluvial channels along the length of each river (Figures 4 and 5). Bedrockchannels are identified by bedrock exposed along a majority of the bed and only small, thin pods of alluvial cover(<1 m) (Howard, 1998). Mixed bedrock–alluvial channels have sporadic bedrock exposure (5–60 per cent of total bedarea; Howard, 1998), often in narrow stretches, whereas alluvium covers much of the bed in wider sections. Alluvialrivers have a thick cover of alluvium and exposure of bedrock is minimal or non-existent.
River longitudinal profiles, slope–area analyses and bedrock geologyForty-one river profiles were extracted from USGS 30 m digital elevation models (DEM) (Figure 4). We were particu-larly in interested identifying the bedrock reaches of each river, as this is the part of the river profile in which couplingbetween rock uplift and incision is most readily demonstrated (Whipple and Tucker, 1999). Previous studies haveargued that the upstream colluvial–bedrock and downstream bedrock–alluvial channel transitions are reflected byscaling breaks in slope–area plots (Dietrich et al., 1993; Montgomery and Foufoula-Georgiou, 1993; Snyder et al.,2000; Stock and Dietrich, 2003). For this study, the colluvial–bedrock transition is defined as occurring at drainageareas of c. 105 to 106 m2, which is in agreement with field observations and published values (Dietrich et al., 1993;Montgomery and Foufoula-Georgiou, 1993; Snyder et al., 2000). The downstream bedrock–alluvial transition, how-ever, is less obvious in the rivers where there is bedrock in the upper and middle stretches of the river. Thus, the lowercutoff was chosen based on breaks in slope–area data specific to each profile, inspection of topographic maps, andfield observation of 12 rivers (Figure 5). No such cutoff occurs in the CCR because each riverbed is almost entirelymantled in alluvium (see below). Concavities were calculated using a Matlab algorithm that smoothes the DEM datainitially, recalculates slopes after contouring the DEM at a 10 m interval, and applies a series of linear regressions oflogarithms to derive channel slope and drainage area (Kirby and Whipple, 2001; Snyder et al., 2000, Wobus et al.,2006). When a given river flowed over variable rock types (i.e. sedimentary and volcanic rocks), concavities werecalculated for each rock-type segment unless the horizontal extent of a given rock type beneath a river reach was smallrelative to the total river profile length (<c. 10 per cent of total river length).
The steepness index, ks, was calculated from the slope–area data as well. Steepness index is, in essence, a measureof channel gradient. It was calculated by first using a reference concavity (in this case, concavity = 0·72, the averagefor all rivers). This allows for comparison of indices along the entire mountain range. Using the reference concavityand the slope–area data derives a steepness value for each river via:
S K AsR = −θ (1)
where S = slope, A = downstream drainage area, and θR = the reference concavity index. We solved for Ks for eachsegment using S, A and concavity.
Geologic contacts from the 1:500 000 Oregon geologic map (Walker and MacLeod, 1991) were plotted on eachlongitudinal profile of the 41 rivers to explore the relationship between bedrock longitudinal profile form, and profileirregularities (i.e. knickpoints). Real knickpoints were differentiated from digital artifacts on the basis of scale. If anirregularity along a profile was encountered with dimensions of c. 25 m or more in elevation and >c. 500 m in lengthit was considered real and significant. Although this knickpoint definition is somewhat qualitative and excludes real
River morphology above a subduction zone, Oregon, USA 7
Copyright © 2006 John Wiley & Sons, Ltd. Earth Surf. Process. Landforms (in press)DOI: 10.1002/esp
irregularities below a certain scale, the scale is sufficiently large to avoid most artifacts and to identify significantirregularities along individual longitudinal profiles. Integration of bedrock unit distribution with river form allowed fordifferentiation of knickpoints associated with lithology change and those occurring in rivers flowing over a singlebedrock unit.
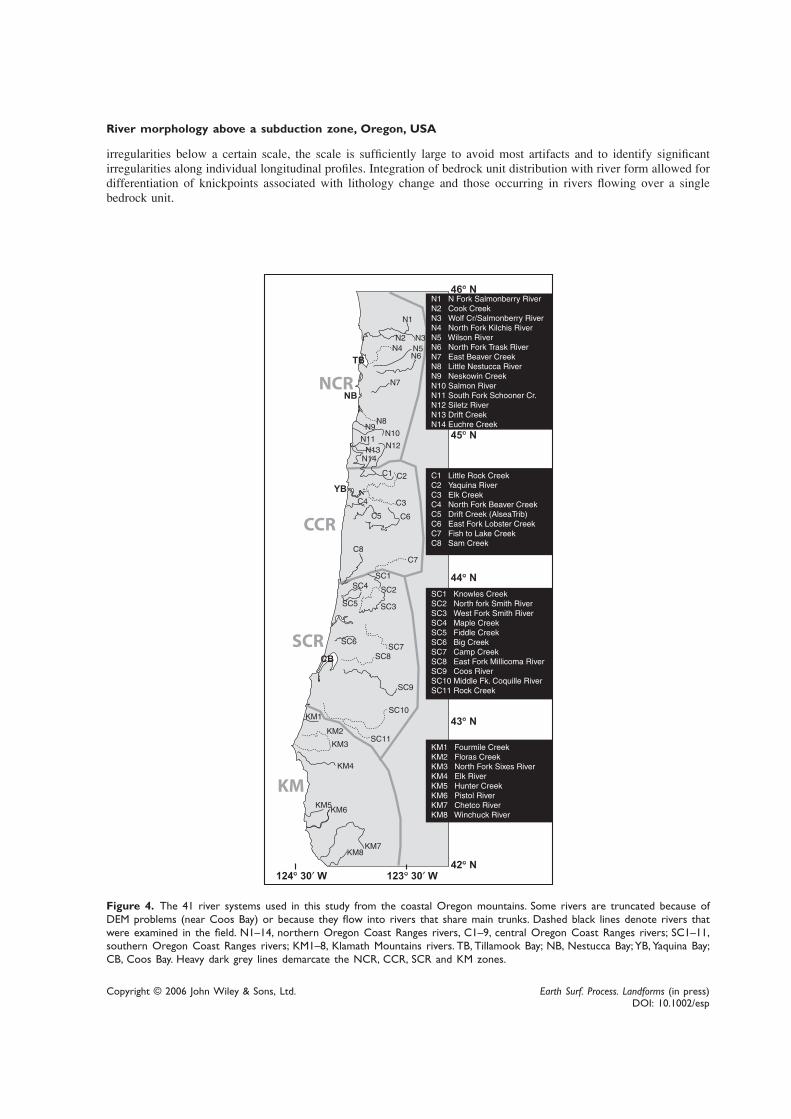
Figure 4. The 41 river systems used in this study from the coastal Oregon mountains. Some rivers are truncated because ofDEM problems (near Coos Bay) or because they flow into rivers that share main trunks. Dashed black lines denote rivers thatwere examined in the field. N1–14, northern Oregon Coast Ranges rivers, C1–9, central Oregon Coast Ranges rivers; SC1–11,southern Oregon Coast Ranges rivers; KM1–8, Klamath Mountains rivers. TB, Tillamook Bay; NB, Nestucca Bay; YB, Yaquina Bay;CB, Coos Bay. Heavy dark grey lines demarcate the NCR, CCR, SCR and KM zones.
8 S. VanLaningham, A. Meigs and C. Goldfinger
Copyright © 2006 John Wiley & Sons, Ltd. Earth Surf. Process. Landforms (in press)DOI: 10.1002/esp
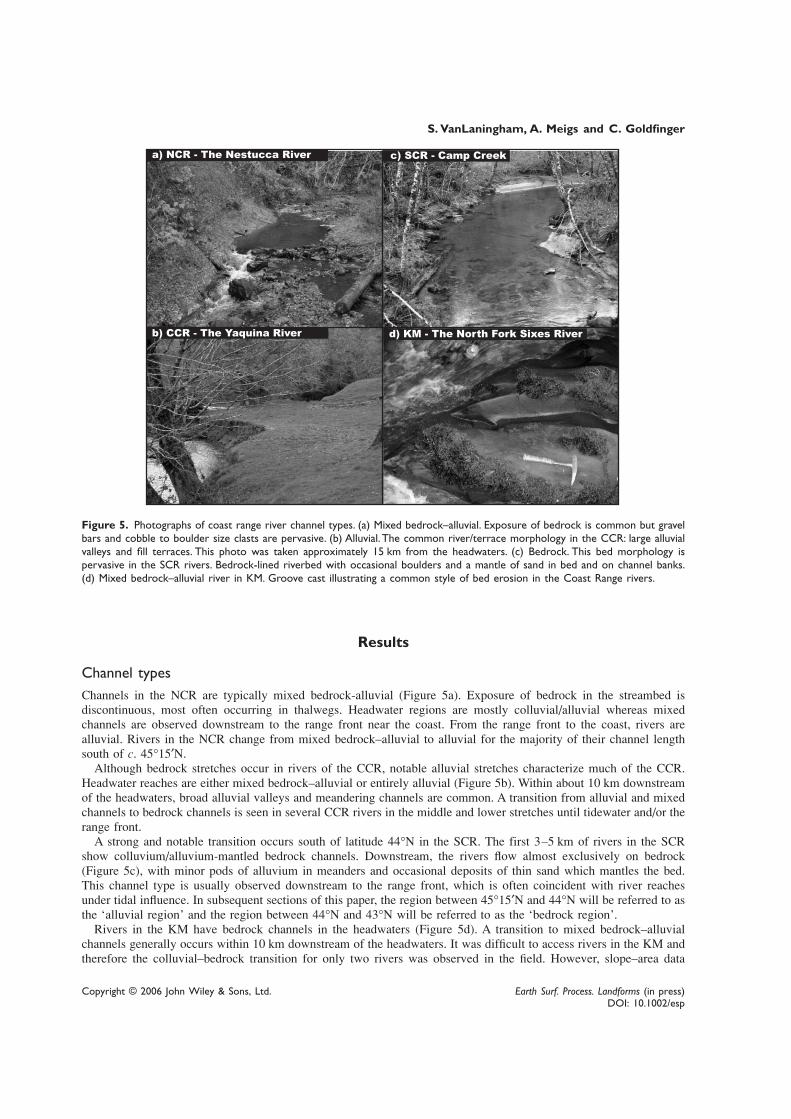
Figure 5. Photographs of coast range river channel types. (a) Mixed bedrock–alluvial. Exposure of bedrock is common but gravelbars and cobble to boulder size clasts are pervasive. (b) Alluvial. The common river/terrace morphology in the CCR: large alluvialvalleys and fill terraces. This photo was taken approximately 15 km from the headwaters. (c) Bedrock. This bed morphology ispervasive in the SCR rivers. Bedrock-lined riverbed with occasional boulders and a mantle of sand in bed and on channel banks.(d) Mixed bedrock–alluvial river in KM. Groove cast illustrating a common style of bed erosion in the Coast Range rivers.
Results
Channel typesChannels in the NCR are typically mixed bedrock-alluvial (Figure 5a). Exposure of bedrock in the streambed isdiscontinuous, most often occurring in thalwegs. Headwater regions are mostly colluvial/alluvial whereas mixedchannels are observed downstream to the range front near the coast. From the range front to the coast, rivers arealluvial. Rivers in the NCR change from mixed bedrock–alluvial to alluvial for the majority of their channel lengthsouth of c. 45°15′N.
Although bedrock stretches occur in rivers of the CCR, notable alluvial stretches characterize much of the CCR.Headwater reaches are either mixed bedrock–alluvial or entirely alluvial (Figure 5b). Within about 10 km downstreamof the headwaters, broad alluvial valleys and meandering channels are common. A transition from alluvial and mixedchannels to bedrock channels is seen in several CCR rivers in the middle and lower stretches until tidewater and/or therange front.
A strong and notable transition occurs south of latitude 44°N in the SCR. The first 3–5 km of rivers in the SCRshow colluvium/alluvium-mantled bedrock channels. Downstream, the rivers flow almost exclusively on bedrock(Figure 5c), with minor pods of alluvium in meanders and occasional deposits of thin sand which mantles the bed.This channel type is usually observed downstream to the range front, which is often coincident with river reachesunder tidal influence. In subsequent sections of this paper, the region between 45°15′N and 44°N will be referred to asthe ‘alluvial region’ and the region between 44°N and 43°N will be referred to as the ‘bedrock region’.
Rivers in the KM have bedrock channels in the headwaters (Figure 5d). A transition to mixed bedrock–alluvialchannels generally occurs within 10 km downstream of the headwaters. It was difficult to access rivers in the KM andtherefore the colluvial–bedrock transition for only two rivers was observed in the field. However, slope–area data

River morphology above a subduction zone, Oregon, USA 9
Copyright © 2006 John Wiley & Sons, Ltd. Earth Surf. Process. Landforms (in press)DOI: 10.1002/esp
consistently show a break at 105–107 m2, which was used as a proxy for the transition to bedrock channels in theheadwater region. This is within range of the commonly observed scaling breaks for mountain rivers (Dietrich et al.,1993; Montgomery and Foufoula-Georgiou, 1993; Snyder et al., 2000).
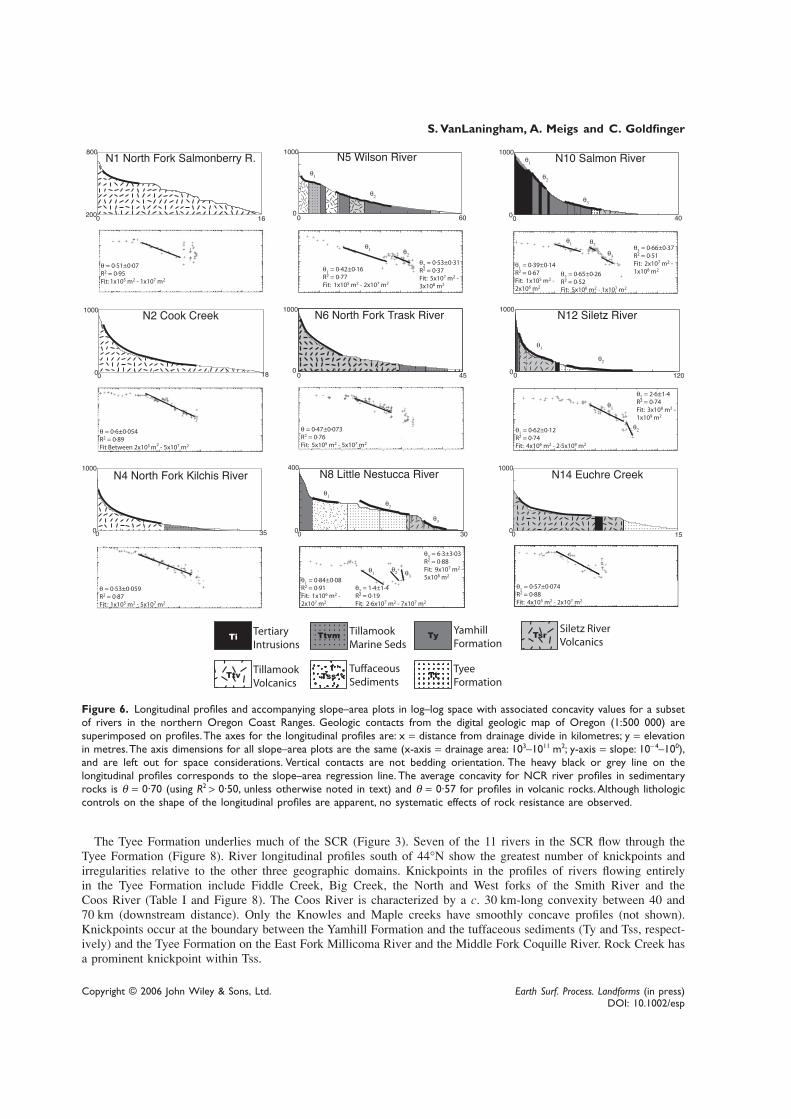
River longitudinal profile–bedrock geology connectionsLithologic influence on river profiles in the NCR is variable. Rivers flow over six different lithologies, which seem toshow no consistent signature in the profiles (Table I and Figure 6). For example, both the North Fork Kilchis Riverand the North Fork Salmonberry River flow for 15 to 20 km over the Tillamook Volcanics. The North Fork KilchisRiver has a concave form without significant knickpoints. In contrast, the North Fork Salmonberry River has threeconvexities over 50 m in height and longer than 1 km. Four lithologies underlie the Little Nestucca River, but twoprominent knickpoints occur within a given rock unit rather than at the contacts with adjacent units. Euchre Creekhas a knickpoint that coincides with the contact between the Siletz River Volcanic rocks and the Tyee Formation(Figure 6).
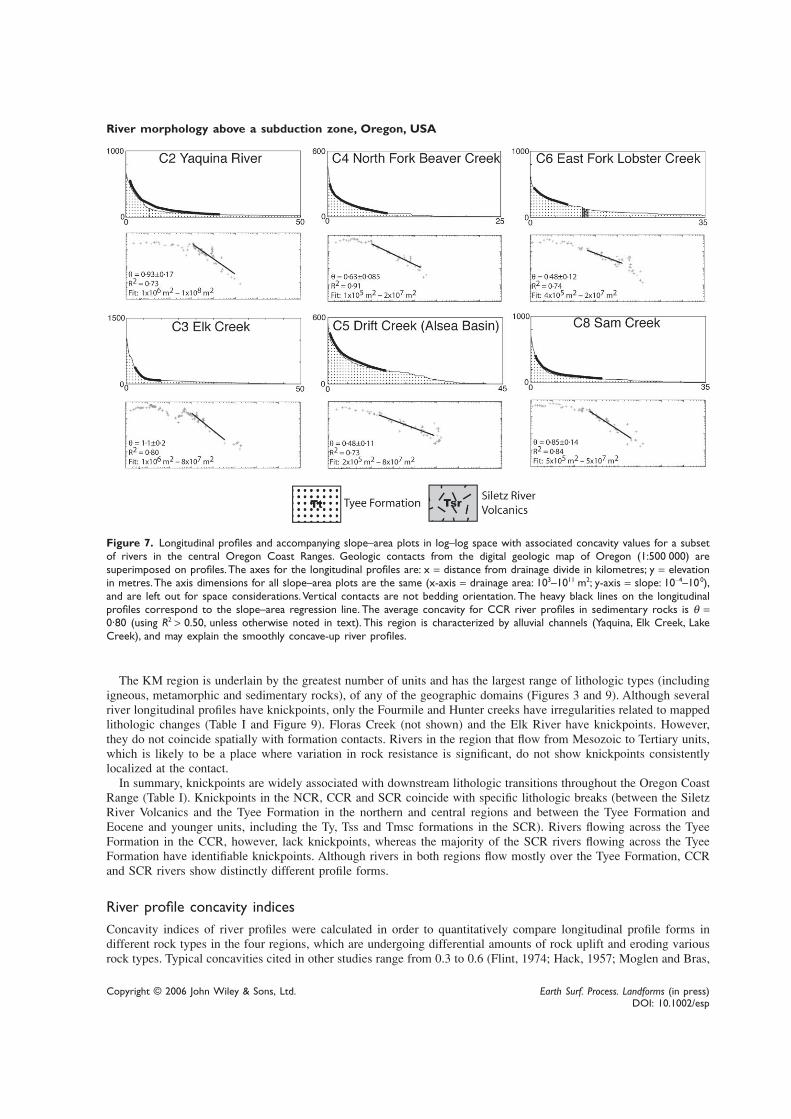
Rivers in the CCR flow over the Tyee Formation and are dominated by alluvial channels over most of their length(Figure 3). Smoothly concave longitudinal profiles are common (Table I and Figure 7). Thus, the well-developedconcave forms are consistent with the ‘graded’ channel form of alluvial rivers. Knickpoints in the North Fork AlseaRiver (not shown) and East Fork Lobster Creek correspond with lithologic changes from volcanic (Siletz RiverVolcanics) to sedimentary rocks (Tyee Formation).
Table I. Table summarizing the nature of knickpoints in the four regions of the Coast Ranges.Rivers in the NCR show no systematic pattern for or against rock type control on profile forms.The CCR rivers show knickpoints due only to Siletz River Volcanic–Tyee Formation contacts.However, most of the rivers do not show knickpoints at all. The SCR rivers are characterized bya large number of knickpoints, despite the fact that they travel exclusively through sedimentarylithologies similar to those in the CCR. The KM rivers have knickpoints but they are usually notassociated with mapped changes in lithology
10 S. VanLaningham, A. Meigs and C. Goldfinger
Copyright © 2006 John Wiley & Sons, Ltd. Earth Surf. Process. Landforms (in press)DOI: 10.1002/esp
Figure 6. Longitudinal profiles and accompanying slope–area plots in log–log space with associated concavity values for a subsetof rivers in the northern Oregon Coast Ranges. Geologic contacts from the digital geologic map of Oregon (1:500 000) aresuperimposed on profiles. The axes for the longitudinal profiles are: x = distance from drainage divide in kilometres; y = elevationin metres. The axis dimensions for all slope–area plots are the same (x-axis = drainage area: 103–1011 m2; y-axis = slope: 10− 4–100),and are left out for space considerations. Vertical contacts are not bedding orientation. The heavy black or grey line on thelongitudinal profiles corresponds to the slope–area regression line. The average concavity for NCR river profiles in sedimentaryrocks is θ = 0·70 (using R2 > 0·50, unless otherwise noted in text) and θ = 0·57 for profiles in volcanic rocks. Although lithologiccontrols on the shape of the longitudinal profiles are apparent, no systematic effects of rock resistance are observed.
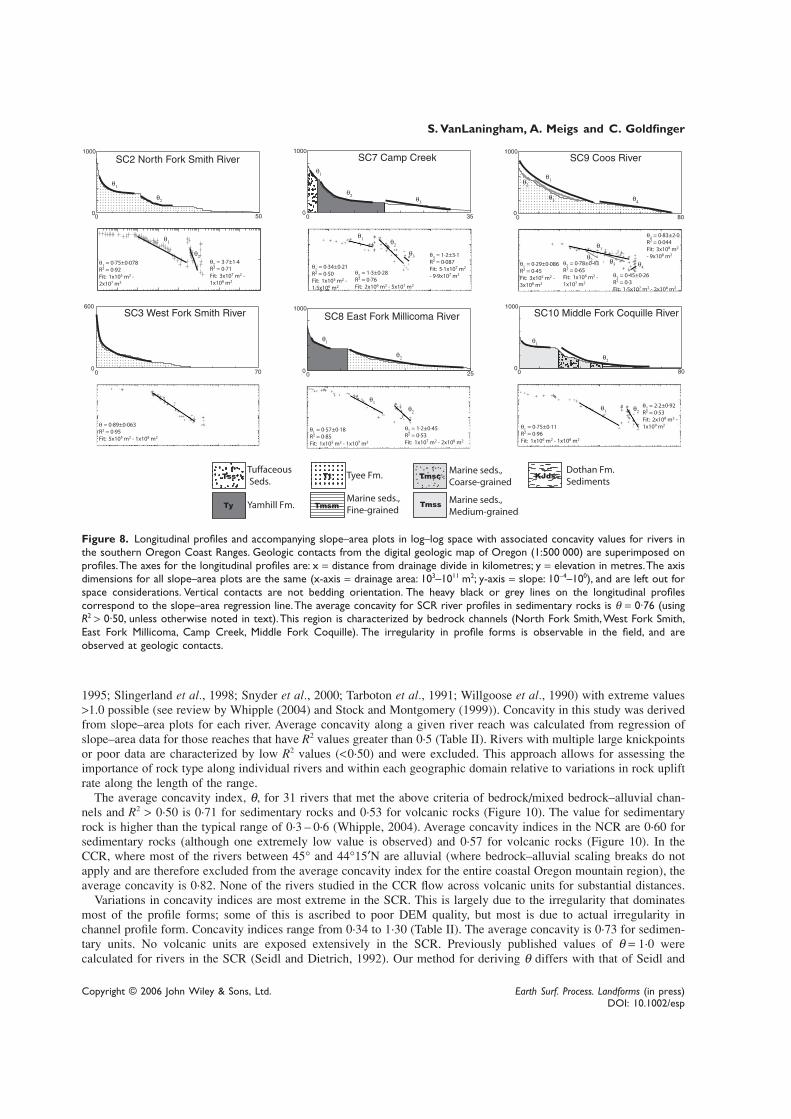
The Tyee Formation underlies much of the SCR (Figure 3). Seven of the 11 rivers in the SCR flow through theTyee Formation (Figure 8). River longitudinal profiles south of 44°N show the greatest number of knickpoints andirregularities relative to the other three geographic domains. Knickpoints in the profiles of rivers flowing entirelyin the Tyee Formation include Fiddle Creek, Big Creek, the North and West forks of the Smith River and theCoos River (Table I and Figure 8). The Coos River is characterized by a c. 30 km-long convexity between 40 and70 km (downstream distance). Only the Knowles and Maple creeks have smoothly concave profiles (not shown).Knickpoints occur at the boundary between the Yamhill Formation and the tuffaceous sediments (Ty and Tss, respect-ively) and the Tyee Formation on the East Fork Millicoma River and the Middle Fork Coquille River. Rock Creek hasa prominent knickpoint within Tss.
River morphology above a subduction zone, Oregon, USA 11
Copyright © 2006 John Wiley & Sons, Ltd. Earth Surf. Process. Landforms (in press)DOI: 10.1002/esp
Figure 7. Longitudinal profiles and accompanying slope–area plots in log–log space with associated concavity values for a subsetof rivers in the central Oregon Coast Ranges. Geologic contacts from the digital geologic map of Oregon (1:500 000) aresuperimposed on profiles. The axes for the longitudinal profiles are: x = distance from drainage divide in kilometres; y = elevationin metres. The axis dimensions for all slope–area plots are the same (x-axis = drainage area: 103–1011 m2; y-axis = slope: 10−4–100),and are left out for space considerations. Vertical contacts are not bedding orientation. The heavy black lines on the longitudinalprofiles correspond to the slope–area regression line. The average concavity for CCR river profiles in sedimentary rocks is θ =0·80 (using R2 > 0.50, unless otherwise noted in text). This region is characterized by alluvial channels (Yaquina, Elk Creek, LakeCreek), and may explain the smoothly concave-up river profiles.
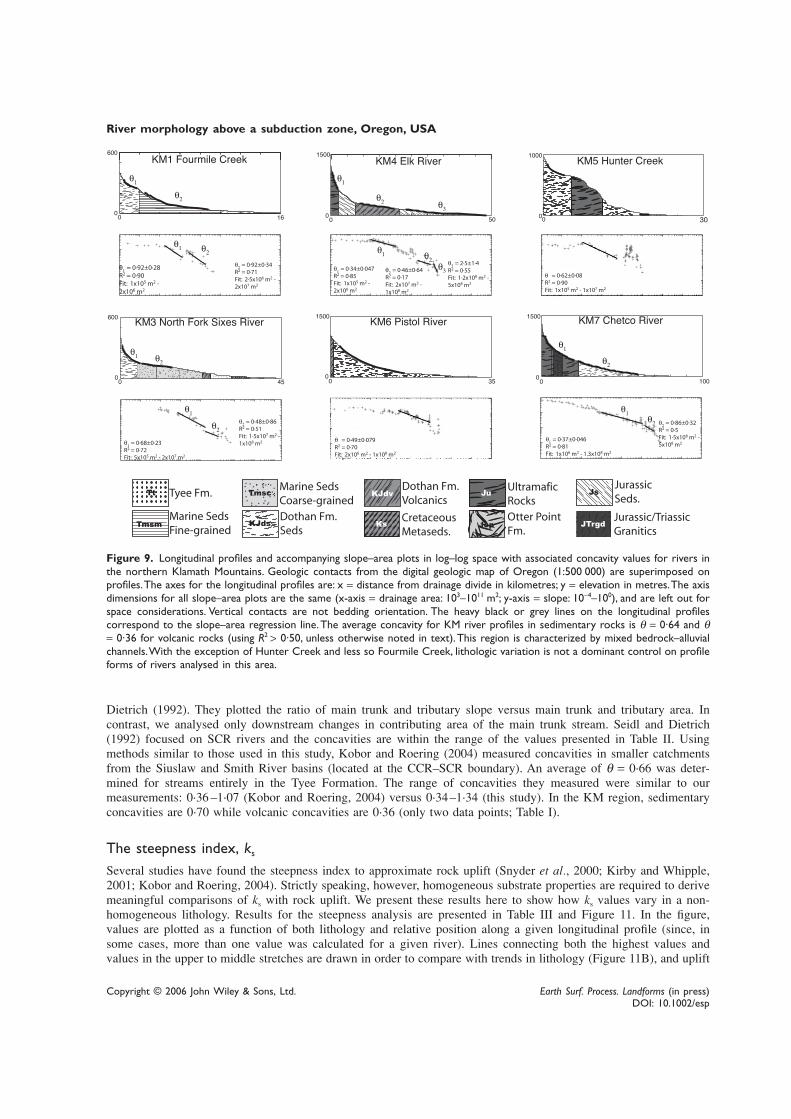
The KM region is underlain by the greatest number of units and has the largest range of lithologic types (includingigneous, metamorphic and sedimentary rocks), of any of the geographic domains (Figures 3 and 9). Although severalriver longitudinal profiles have knickpoints, only the Fourmile and Hunter creeks have irregularities related to mappedlithologic changes (Table I and Figure 9). Floras Creek (not shown) and the Elk River have knickpoints. However,they do not coincide spatially with formation contacts. Rivers in the region that flow from Mesozoic to Tertiary units,which is likely to be a place where variation in rock resistance is significant, do not show knickpoints consistentlylocalized at the contact.
In summary, knickpoints are widely associated with downstream lithologic transitions throughout the Oregon CoastRange (Table I). Knickpoints in the NCR, CCR and SCR coincide with specific lithologic breaks (between the SiletzRiver Volcanics and the Tyee Formation in the northern and central regions and between the Tyee Formation andEocene and younger units, including the Ty, Tss and Tmsc formations in the SCR). Rivers flowing across the TyeeFormation in the CCR, however, lack knickpoints, whereas the majority of the SCR rivers flowing across the TyeeFormation have identifiable knickpoints. Although rivers in both regions flow mostly over the Tyee Formation, CCRand SCR rivers show distinctly different profile forms.
River profile concavity indicesConcavity indices of river profiles were calculated in order to quantitatively compare longitudinal profile forms indifferent rock types in the four regions, which are undergoing differential amounts of rock uplift and eroding variousrock types. Typical concavities cited in other studies range from 0.3 to 0.6 (Flint, 1974; Hack, 1957; Moglen and Bras,
12 S. VanLaningham, A. Meigs and C. Goldfinger
Copyright © 2006 John Wiley & Sons, Ltd. Earth Surf. Process. Landforms (in press)DOI: 10.1002/esp
Figure 8. Longitudinal profiles and accompanying slope–area plots in log–log space with associated concavity values for rivers inthe southern Oregon Coast Ranges. Geologic contacts from the digital geologic map of Oregon (1:500 000) are superimposed onprofiles. The axes for the longitudinal profiles are: x = distance from drainage divide in kilometres; y = elevation in metres. The axisdimensions for all slope–area plots are the same (x-axis = drainage area: 103–1011 m2; y-axis = slope: 10−4–100), and are left out forspace considerations. Vertical contacts are not bedding orientation. The heavy black or grey lines on the longitudinal profilescorrespond to the slope–area regression line. The average concavity for SCR river profiles in sedimentary rocks is θ = 0·76 (usingR2 > 0·50, unless otherwise noted in text). This region is characterized by bedrock channels (North Fork Smith, West Fork Smith,East Fork Millicoma, Camp Creek, Middle Fork Coquille). The irregularity in profile forms is observable in the field, and areobserved at geologic contacts.
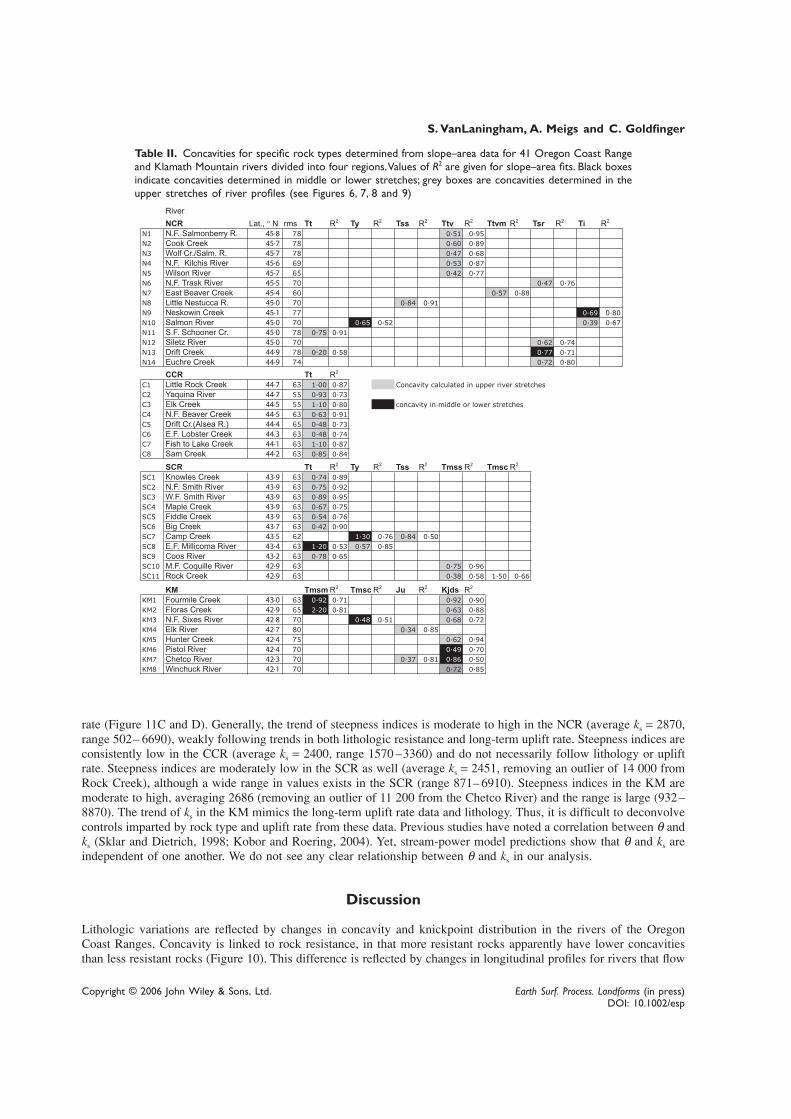
1995; Slingerland et al., 1998; Snyder et al., 2000; Tarboton et al., 1991; Willgoose et al., 1990) with extreme values>1.0 possible (see review by Whipple (2004) and Stock and Montgomery (1999)). Concavity in this study was derivedfrom slope–area plots for each river. Average concavity along a given river reach was calculated from regression ofslope–area data for those reaches that have R2 values greater than 0·5 (Table II). Rivers with multiple large knickpointsor poor data are characterized by low R2 values (<0·50) and were excluded. This approach allows for assessing theimportance of rock type along individual rivers and within each geographic domain relative to variations in rock upliftrate along the length of the range.
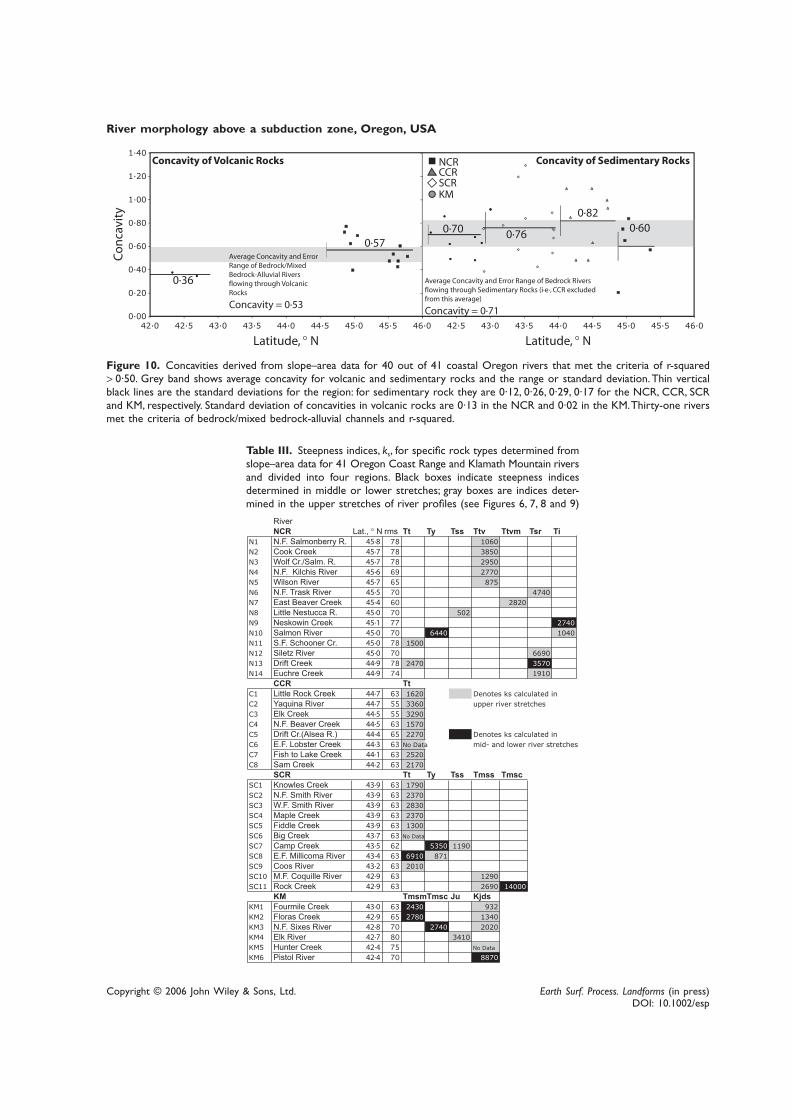
The average concavity index, θ, for 31 rivers that met the above criteria of bedrock/mixed bedrock–alluvial chan-nels and R2 > 0·50 is 0·71 for sedimentary rocks and 0·53 for volcanic rocks (Figure 10). The value for sedimentaryrock is higher than the typical range of 0·3 – 0·6 (Whipple, 2004). Average concavity indices in the NCR are 0·60 forsedimentary rocks (although one extremely low value is observed) and 0·57 for volcanic rocks (Figure 10). In theCCR, where most of the rivers between 45° and 44°15′N are alluvial (where bedrock–alluvial scaling breaks do notapply and are therefore excluded from the average concavity index for the entire coastal Oregon mountain region), theaverage concavity is 0·82. None of the rivers studied in the CCR flow across volcanic units for substantial distances.
Variations in concavity indices are most extreme in the SCR. This is largely due to the irregularity that dominatesmost of the profile forms; some of this is ascribed to poor DEM quality, but most is due to actual irregularity inchannel profile form. Concavity indices range from 0·34 to 1·30 (Table II). The average concavity is 0·73 for sedimen-tary units. No volcanic units are exposed extensively in the SCR. Previously published values of θ = 1·0 werecalculated for rivers in the SCR (Seidl and Dietrich, 1992). Our method for deriving θ differs with that of Seidl and
River morphology above a subduction zone, Oregon, USA 13
Copyright © 2006 John Wiley & Sons, Ltd. Earth Surf. Process. Landforms (in press)DOI: 10.1002/esp
0 160 160 16
40
50
106
108
1010
500
500
100
106
108
1010
drai
nage
are
a (m
2 )
1000
500
1000
1500
elev
atio
n (m
)
Figure 9. Longitudinal profiles and accompanying slope–area plots in log–log space with associated concavity values for rivers inthe northern Klamath Mountains. Geologic contacts from the digital geologic map of Oregon (1:500 000) are superimposed onprofiles. The axes for the longitudinal profiles are: x = distance from drainage divide in kilometres; y = elevation in metres. The axisdimensions for all slope–area plots are the same (x-axis = drainage area: 103–1011 m2; y-axis = slope: 10−4–100), and are left out forspace considerations. Vertical contacts are not bedding orientation. The heavy black or grey lines on the longitudinal profilescorrespond to the slope–area regression line. The average concavity for KM river profiles in sedimentary rocks is θ = 0·64 and θ= 0·36 for volcanic rocks (using R2 > 0·50, unless otherwise noted in text). This region is characterized by mixed bedrock–alluvialchannels. With the exception of Hunter Creek and less so Fourmile Creek, lithologic variation is not a dominant control on profileforms of rivers analysed in this area.
Dietrich (1992). They plotted the ratio of main trunk and tributary slope versus main trunk and tributary area. Incontrast, we analysed only downstream changes in contributing area of the main trunk stream. Seidl and Dietrich(1992) focused on SCR rivers and the concavities are within the range of the values presented in Table II. Usingmethods similar to those used in this study, Kobor and Roering (2004) measured concavities in smaller catchmentsfrom the Siuslaw and Smith River basins (located at the CCR–SCR boundary). An average of θ = 0·66 was deter-mined for streams entirely in the Tyee Formation. The range of concavities they measured were similar to ourmeasurements: 0·36 –1·07 (Kobor and Roering, 2004) versus 0·34–1·34 (this study). In the KM region, sedimentaryconcavities are 0·70 while volcanic concavities are 0·36 (only two data points; Table I).
The steepness index, ks
Several studies have found the steepness index to approximate rock uplift (Snyder et al., 2000; Kirby and Whipple,2001; Kobor and Roering, 2004). Strictly speaking, however, homogeneous substrate properties are required to derivemeaningful comparisons of ks with rock uplift. We present these results here to show how ks values vary in a non-homogeneous lithology. Results for the steepness analysis are presented in Table III and Figure 11. In the figure,values are plotted as a function of both lithology and relative position along a given longitudinal profile (since, insome cases, more than one value was calculated for a given river). Lines connecting both the highest values andvalues in the upper to middle stretches are drawn in order to compare with trends in lithology (Figure 11B), and uplift
14 S. VanLaningham, A. Meigs and C. Goldfinger
Copyright © 2006 John Wiley & Sons, Ltd. Earth Surf. Process. Landforms (in press)DOI: 10.1002/esp
Table II. Concavities for specific rock types determined from slope–area data for 41 Oregon Coast Rangeand Klamath Mountain rivers divided into four regions. Values of R2 are given for slope–area fits. Black boxesindicate concavities determined in middle or lower stretches; grey boxes are concavities determined in theupper stretches of river profiles (see Figures 6, 7, 8 and 9)
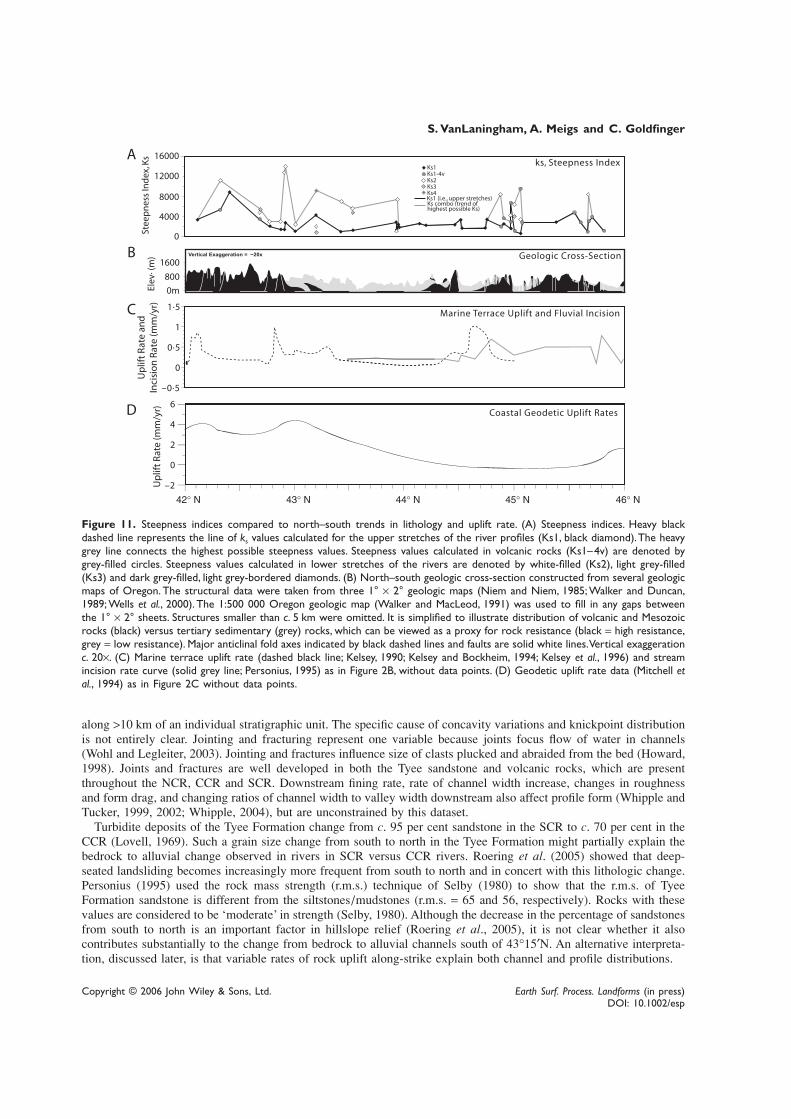
rate (Figure 11C and D). Generally, the trend of steepness indices is moderate to high in the NCR (average ks = 2870,range 502– 6690), weakly following trends in both lithologic resistance and long-term uplift rate. Steepness indices areconsistently low in the CCR (average ks = 2400, range 1570 –3360) and do not necessarily follow lithology or upliftrate. Steepness indices are moderately low in the SCR as well (average ks = 2451, removing an outlier of 14 000 fromRock Creek), although a wide range in values exists in the SCR (range 871– 6910). Steepness indices in the KM aremoderate to high, averaging 2686 (removing an outlier of 11 200 from the Chetco River) and the range is large (932–8870). The trend of ks in the KM mimics the long-term uplift rate data and lithology. Thus, it is difficult to deconvolvecontrols imparted by rock type and uplift rate from these data. Previous studies have noted a correlation between θ andks (Sklar and Dietrich, 1998; Kobor and Roering, 2004). Yet, stream-power model predictions show that θ and ks areindependent of one another. We do not see any clear relationship between θ and ks in our analysis.
Discussion
Lithologic variations are reflected by changes in concavity and knickpoint distribution in the rivers of the OregonCoast Ranges. Concavity is linked to rock resistance, in that more resistant rocks apparently have lower concavitiesthan less resistant rocks (Figure 10). This difference is reflected by changes in longitudinal profiles for rivers that flow
River morphology above a subduction zone, Oregon, USA 15
Copyright © 2006 John Wiley & Sons, Ltd. Earth Surf. Process. Landforms (in press)DOI: 10.1002/esp
Figure 10. Concavities derived from slope–area data for 40 out of 41 coastal Oregon rivers that met the criteria of r-squared> 0·50. Grey band shows average concavity for volcanic and sedimentary rocks and the range or standard deviation. Thin verticalblack lines are the standard deviations for the region: for sedimentary rock they are 0·12, 0·26, 0·29, 0·17 for the NCR, CCR, SCRand KM, respectively. Standard deviation of concavities in volcanic rocks are 0·13 in the NCR and 0·02 in the KM. Thirty-one riversmet the criteria of bedrock/mixed bedrock-alluvial channels and r-squared.
Table III. Steepness indices, ks, for specific rock types determined fromslope–area data for 41 Oregon Coast Range and Klamath Mountain riversand divided into four regions. Black boxes indicate steepness indicesdetermined in middle or lower stretches; gray boxes are indices deter-mined in the upper stretches of river profiles (see Figures 6, 7, 8 and 9)
16 S. VanLaningham, A. Meigs and C. Goldfinger
Copyright © 2006 John Wiley & Sons, Ltd. Earth Surf. Process. Landforms (in press)DOI: 10.1002/esp
Figure 11. Steepness indices compared to north–south trends in lithology and uplift rate. (A) Steepness indices. Heavy blackdashed line represents the line of ks values calculated for the upper stretches of the river profiles (Ks1, black diamond). The heavygrey line connects the highest possible steepness values. Steepness values calculated in volcanic rocks (Ks1–4v) are denoted bygrey-filled circles. Steepness values calculated in lower stretches of the rivers are denoted by white-filled (Ks2), light grey-filled(Ks3) and dark grey-filled, light grey-bordered diamonds. (B) North–south geologic cross-section constructed from several geologicmaps of Oregon. The structural data were taken from three 1° × 2° geologic maps (Niem and Niem, 1985; Walker and Duncan,1989; Wells et al., 2000). The 1:500 000 Oregon geologic map (Walker and MacLeod, 1991) was used to fill in any gaps betweenthe 1° × 2° sheets. Structures smaller than c. 5 km were omitted. It is simplified to illustrate distribution of volcanic and Mesozoicrocks (black) versus tertiary sedimentary (grey) rocks, which can be viewed as a proxy for rock resistance (black = high resistance,grey = low resistance). Major anticlinal fold axes indicated by black dashed lines and faults are solid white lines. Vertical exaggerationc. 20×. (C) Marine terrace uplift rate (dashed black line; Kelsey, 1990; Kelsey and Bockheim, 1994; Kelsey et al., 1996) and streamincision rate curve (solid grey line; Personius, 1995) as in Figure 2B, without data points. (D) Geodetic uplift rate data (Mitchell etal., 1994) as in Figure 2C without data points.
along >10 km of an individual stratigraphic unit. The specific cause of concavity variations and knickpoint distributionis not entirely clear. Jointing and fracturing represent one variable because joints focus flow of water in channels(Wohl and Legleiter, 2003). Jointing and fractures influence size of clasts plucked and abraided from the bed (Howard,1998). Joints and fractures are well developed in both the Tyee sandstone and volcanic rocks, which are presentthroughout the NCR, CCR and SCR. Downstream fining rate, rate of channel width increase, changes in roughnessand form drag, and changing ratios of channel width to valley width downstream also affect profile form (Whipple andTucker, 1999, 2002; Whipple, 2004), but are unconstrained by this dataset.
Turbidite deposits of the Tyee Formation change from c. 95 per cent sandstone in the SCR to c. 70 per cent in theCCR (Lovell, 1969). Such a grain size change from south to north in the Tyee Formation might partially explain thebedrock to alluvial change observed in rivers in SCR versus CCR rivers. Roering et al. (2005) showed that deep-seated landsliding becomes increasingly more frequent from south to north and in concert with this lithologic change.Personius (1995) used the rock mass strength (r.m.s.) technique of Selby (1980) to show that the r.m.s. of TyeeFormation sandstone is different from the siltstones/mudstones (r.m.s. = 65 and 56, respectively). Rocks with thesevalues are considered to be ‘moderate’ in strength (Selby, 1980). Although the decrease in the percentage of sandstonesfrom south to north is an important factor in hillslope relief (Roering et al., 2005), it is not clear whether it alsocontributes substantially to the change from bedrock to alluvial channels south of 43°15′N. An alternative interpreta-tion, discussed later, is that variable rates of rock uplift along-strike explain both channel and profile distributions.

River morphology above a subduction zone, Oregon, USA 17
Copyright © 2006 John Wiley & Sons, Ltd. Earth Surf. Process. Landforms (in press)DOI: 10.1002/esp
Although steepness indices, ks, vary in concert with uplift rate in some cases (Snyder et al., 2000; Kirby andWhipple, 2001; Kobor and Roering, 2004), whether our results show a similar variation is equivocal (Figure 11).Values of ks do not show any clear relationship to either long- or short-term uplift rates. In all regions, ks varies by afactor of two or more with Ks values ranging from 800–6000 (Table III). Similarly, ks and rock type do not co-vary.For example, high values of ks are associated with both sedimentary and volcanic rocks in the NCR (Table III andFigure 11). Single units such as the Tyee Formation (Tt) show a range of ks from less than 1000 to more than 6000 inthe SCR. Steepness is not seen to vary with concavity (compare Tables II and III) and ks and concavity show lessvariability in the CCR whereas large range and variability characterize the SCR.
Kobor and Roering’s (2004) work in the Oregon Coast Ranges argues for a weak relationship between θ and ks. Thediscrepancy between our two analyses is probably due to the fact that Kobor and Roering analysed smaller basins ina restricted geographic region relative to the region of this study. Moreover, many of these smaller basins are orientedboth parallel and perpendicular to the Oregon Coast Range axis (capturing a wider range of rock uplift rates), whereasthis study focused on trunk streams that are perpendicular to the axis of the range.
Climate and climate change on any timescale are not directly addressed in this study. Orographic precipitation canaffect the concavity of river profiles (Roe et al., 2002). Longer cycles of climatic change can also produce shifts inriver profile shape as well as channel bed morphology (Personius et al., 1993). An abrupt change from a drier to awetter climate (transition from glacial to interglacial) produces large changes in hillslope sediment flux, filling chan-nels and inhibiting incision into bedrock (Hancock and Anderson, 2002). Stochastic slope failures also affect sedimentsupply and channel bed elevation. Slope–area data capture deposition of debris flows and landslides in the channels ifthey are of the appropriate scale. These are common processes in the OCR (Reneau and Dietrich, 1991). Reneau et al.(1989) and Personius (1993) argued that the OCR experienced a period of channel aggradation around the Pleistocene–Holocene transition (c. 10 000 years BP). Thick alluvial deposits commonly overlie strath terraces in the NCR andCCR. River terraces and present-day riverbeds in the CCR are covered with alluvium, whereas in the northern part ofthe NCR and the SCR, deposits of alluvium are mostly found on the banks while the riverbed itself is bedrockor bedrock–alluvial. Thus, the Pleistocene–Holocene boundary is associated with a change in sediment flux to thechannels throughout the OCR (Reneau and Dietrich, 1991). This aggradational event, however, does not entirelyexplain the alluvial signature of the CCR since a climatic event would affect the geomorphology of the entire coastalmountain region similarly and not be focused in a c. 1° latitudinal band.
Storms with 100–1000-year recurrence intervals and land-use effects also provide noise to the long-term signal andcannot be differentiated easily from the available data. Logging has enhanced landsliding and debris flows in theOregon Coast Ranges (Benda, 1990), while some agricultural practices in river valleys have probably altered portionsof the landscape. Although land-use and other short-term forcings are undoubtedly important locally, we believe thescale of our analyses filters that signal and captures a large-scale geomorphic signature in the landscape related toprocesses operating on much longer timescales.
Eustatic sea-level changes affect the base-level and can be transmitted to the river profile (Merritts et al., 1994).Model predictions and some field evidence suggest that base-level change effects are propagated through the fluvialsystem by knickpoint migration (Seidl and Dietrich, 1992; Seidl et al., 1994; Merritts et al., 1994; Whipple andTucker, 1999). Knickpoints in a fluvial system formed by eustatic base-level change are thought to be a function ofoffshore topography as well as the ratio of nearshore wave-base erosion rate to onshore uplift rate (Snyder et al.,2002). The shelf offshore Oregon narrows significantly south of 44°N, at the boundary between the CCR and SCR(Figure 1). The model of Snyder et al. (2002) predicts that when nearshore erosion rates are greater than nearshorerock uplift rates (typical of steeper, shorter shelves), knickpoints develop in rivers following base-level fall. Independ-ent nearshore erosion rates are not available for the OCR. Thus, it is difficult to determine whether sea level changeaffects longitudinal profiles in coastal Oregon. We note, however, that a large knickpoint is shared by several riverssouth of 44°N (see Figures 8 and 9), possibly indicative of a sea level signal reflected in the river profiles andcomplicating the lithologic and tectonic controls observed to be affecting the fluvial system in the OCR.
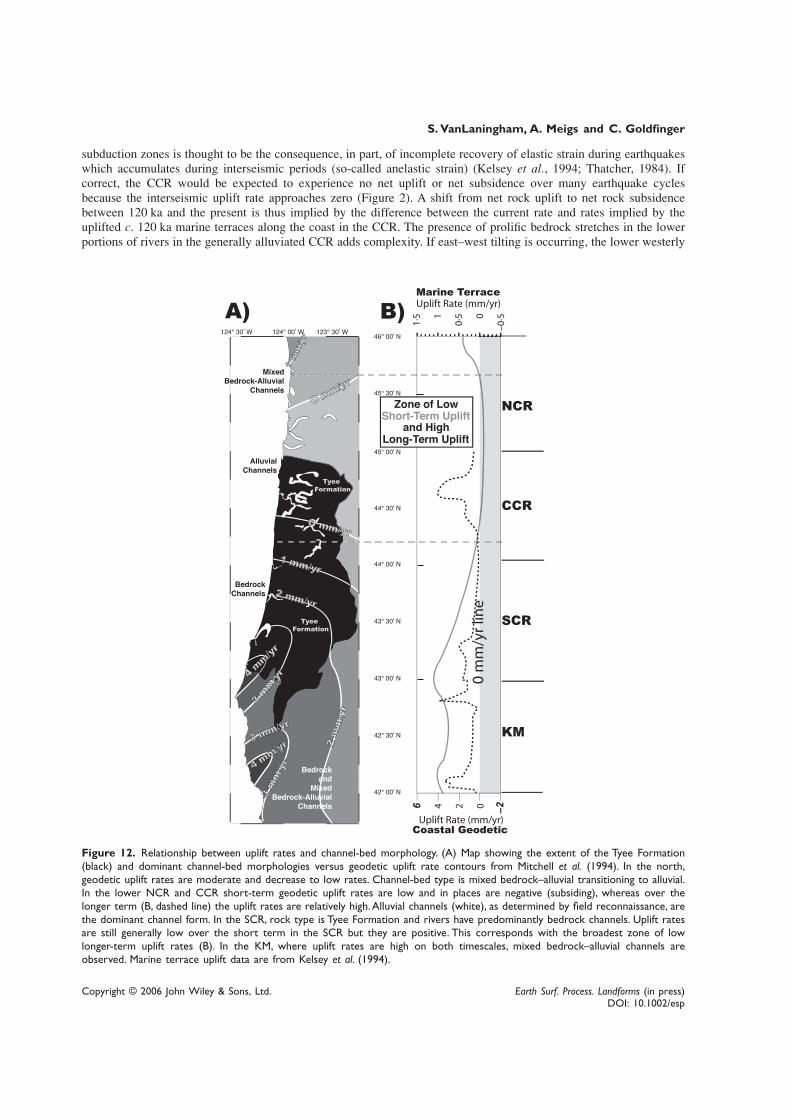
Although rock resistance explains some aspects of river longitudinal profile variation and distributions of channelmorphologies in the OCR, rock resistance alone does not account for differences between rivers in the CCR and SCR.The Tyee Formation underlying both the CCR and SCR is gradational in terms of its decrease in sandstones fromsouth to north whereas the contrasts in fluvial geomorphology are more abrupt. Mean concavities are similar (Figures3 and 10). In the CCR, however, alluvial channels predominate, bedrock is very discontinuously exposed until thelower stretches, and few significant knickpoints are developed (Figures 6 and 12). In contrast, bedrock exposure alongmuch of the length of rivers in the SCR is commonplace, and a number of rivers have prominent knickpoints(Figures 7 and 12). Long-term (>105 years) uplift rates are higher in the CCR, on the order of 0·5 mm a−1, than SCRrates (c. 0·1 mm a−1). Short-term rates (101 years) are lower in the CCR (−0·1– 0·1 mm a−1) than in the SCR (1–2 mma−1), the opposite of the CCR and SCR long-term rates (Figures 2 and 12). Net rock uplift in the forearc region of
18 S. VanLaningham, A. Meigs and C. Goldfinger
Copyright © 2006 John Wiley & Sons, Ltd. Earth Surf. Process. Landforms (in press)DOI: 10.1002/esp
subduction zones is thought to be the consequence, in part, of incomplete recovery of elastic strain during earthquakeswhich accumulates during interseismic periods (so-called anelastic strain) (Kelsey et al., 1994; Thatcher, 1984). Ifcorrect, the CCR would be expected to experience no net uplift or net subsidence over many earthquake cyclesbecause the interseismic uplift rate approaches zero (Figure 2). A shift from net rock uplift to net rock subsidencebetween 120 ka and the present is thus implied by the difference between the current rate and rates implied by theuplifted c. 120 ka marine terraces along the coast in the CCR. The presence of prolific bedrock stretches in the lowerportions of rivers in the generally alluviated CCR adds complexity. If east–west tilting is occurring, the lower westerly
Figure 12. Relationship between uplift rates and channel-bed morphology. (A) Map showing the extent of the Tyee Formation(black) and dominant channel-bed morphologies versus geodetic uplift rate contours from Mitchell et al. (1994). In the north,geodetic uplift rates are moderate and decrease to low rates. Channel-bed type is mixed bedrock–alluvial transitioning to alluvial.In the lower NCR and CCR short-term geodetic uplift rates are low and in places are negative (subsiding), whereas over thelonger term (B, dashed line) the uplift rates are relatively high. Alluvial channels (white), as determined by field reconnaissance, arethe dominant channel form. In the SCR, rock type is Tyee Formation and rivers have predominantly bedrock channels. Uplift ratesare still generally low over the short term in the SCR but they are positive. This corresponds with the broadest zone of lowlonger-term uplift rates (B). In the KM, where uplift rates are high on both timescales, mixed bedrock–alluvial channels areobserved. Marine terrace uplift data are from Kelsey et al. (1994).
River morphology above a subduction zone, Oregon, USA 19
Copyright © 2006 John Wiley & Sons, Ltd. Earth Surf. Process. Landforms (in press)DOI: 10.1002/esp
stretches could be actively uplifting, leading to bedrock incision, whereas low or negative uplift rates in the middleand headwater portions of CCR rivers may be experiencing deposition. These interpretations are, however, highlyspeculative.
Comparison of long- and short-term rock uplift rates in the SCR suggests a rock uplift rate change in the oppositesense to that in the CCR. Marine terrace elevations in the SCR yield low to negligible rock uplift rates after c. 120 ka,whereas geodetic rates are higher in this region. Thus, one interpretation of these contrasting rates is that the SCR hasexperienced an increase in rock uplift rate since 120 ka. An alternative interpretation is that the extent of interseismicstrain recovery in the SCR simply varies along-strike from complete to incomplete recovery from north to south,respectively. We cannot speculate as to which is more likely.
Permanent deformation in the forearcs of obliquely convergent subduction zones like Cascadia also results fromgrowth of structures in the upper plate, which have trends both parallel and at high angles to the plate boundary(McCaffrey et al., 1998; Wells et al., 1998). An alternative interpretation for the observed contrasts in the CCR andSCR is that regions of rock subsidence and uplift reflect the growth of synclines and anticlines, respectively, resultingfrom north–south shortening in the OCR. Structural trends offshore from the deformation front across the continentalslope demonstrate that this region of the forearc is dominated by east–west shortening (Figure 1) (Goldfinger et al.,1992). Forearc structures in the continental shelf and along the coast, in contrast, suggest that a component of the plateconvergence is accommodated by north–south shortening (Mazzotti et al., 2002; McCaffery et al., 2000; McNeillet al., 2000; Wells et al., 1998). The Newport basin, which lies offshore the region of alluvial channels in the CCR(Figures 1 and 11), is marked by an increase in subsidence rate during the Pleistocene, which has been interpreted tobe the consequence of active warping of a syncline bounded by east–west trending anticlines to the north and south,respectively (Figure 1) (McNeill et al., 2000). Thus, the distribution of alluvial channels within the OCR onshore andthe Newport Basin offshore are consistent with the inference that the region between c. 45°15′ and 44°00′N has beensubsiding at a greater rate than adjacent regions to the north and south in the Pleistocene. Whether the postulated rocksubsidence onshore is due to anelastic strain accumulation over repeated seismic cycles or whether it is due to thegrowth of mesoscale upper plate structures is not clear, although the CCR and SCR define a broad bedrock structurallow between the NCR and KM (Figure 1).
The fact that knickpoint development is ubiquitous in the SCR rivers (Figure 8 and Table I) may suggest that OCRrivers are sensitive to rock uplift rate variation and that the response time to an increase in uplift rate is less than120 ka. In support of this, Kobor and Roering (2004) argue that steepness indices in the central Oregon Coast Rangesvary systematically with the east–west trends seen in geodetically derived, short-term uplift rate data. If there issignificant variability in rock uplift and subsidence along-strike from north to south in the OCR as we infer, thisvariability is likely to impact the topographic form and evolution of the range, augmenting previous work suggestingthat the age of the subducting slab and the attendant buoyancy variations are important in controlling the long-wavelength topography (Kelsey et al., 1994).
Models of river profile evolution lend support to the interpretation that the CCR and SCR are in transient states dueto a change in rock uplift rate. Whipple and Tucker (2002) argue that alluvial and bedrock rivers are not characterizedby different concavities, which is contrary to the suggestion that alluvial rivers have lower concavities (Howard, 1994,1997). The inference from models that concavities of both bedrock and alluvial rivers can be similar allowed Whippleand Tucker (2002) to use a simplified sediment flux erosion model to explore channel response to increases anddecreases in rock uplift rate. In these models a two-dimensional fluvial system that undergoes a change from higher tolower rock uplift rates (such as is inferred for the CCR) develop alluvial, transport-limited conditions with relativelysmooth concave-up profiles with enhanced concavity, much like what is observed in the CCR. Conversely, the fluvialresponse to an increase in uplift rate is reflected by a shift to a detachment-limited bedrock channel, consistent withwhat is seen in the SCR. These stream-power-based models predict that upstream knickpoint propagation is thetransient response to the change in rock uplift rate, which is reflected by an irregular longitudinal profile. Since boththe field data and profile analyses are consistent with these model predictions, we postulate that rivers in the CCR andSCR are in a transient state as the consequence of a decrease in net rock uplift rate in the CCR and an increase in theSCR. If broadly correct, it is unlikely that the Oregon Coast Ranges are in steady state with respect to rock uplift,erosion and topography.
A steady state between tectonic influx and exhumation is inferred for the Olympic Mountains (Brandon et al., 1998;Pazzaglia and Brandon, 2001; Willett, 1999; Willett and Brandon, 2002). In the Oregon Coast Ranges, Reneau andDietrich (1991) showed that hillslope sediment production balanced with the sediment output in colluvial hollows.Heimsath et al. (2001) showed stochastic variability in soil production rates. Personius (1995) observed that riverincision rates in the OCR followed the trend of marine terrace uplift data in scale and magnitude and argued that riverincision rates matched rock uplift rates. Montgomery (2001) argued, on the basis of DEM-based hillslope analyses,that the OCR are in a topographic steady state (where tectonic and erosional processes balance). In contrast, we argue
20 S. VanLaningham, A. Meigs and C. Goldfinger
Copyright © 2006 John Wiley & Sons, Ltd. Earth Surf. Process. Landforms (in press)DOI: 10.1002/esp
that the CCR and SCR in particular are unlikely to be in steady state on the basis of differences in river long-profileform and bed morphology. In-channel sediment storage is apparently a major component in the CCR but not in theSCR. Although SCR rivers are apparently detachment-limited, in that they transport the sediment flux to the channel,they do not erode large knickpoints or display more typical smooth, concave-up longitudinal profile forms that arecommonly seen in rivers thought to be in steady state. The observations presented in this paper suggest that betweenlatitudes 45°N and 43°N, neither erosional nor tectonic steady-state conditions characterize the main tributaries andtherefore, a topographic steady state is unlikely. This postulation of non-steady-state conditions in portions of the OCRcould be the result of the polarized trends in long-term rock uplift. The marine terrace uplift rate data show netsubsidence at 44·2°N while other areas along the coast have experienced net uplift (see Figure 2). This appears to beunique relative to many other tectonically active mountain belts and is very likely to be important in the topographicevolution of the OCR and subsequent geomorphic expression of the fluvial system. The NCR and the KM, however,may approach a topographic steady state in that the majority of the longitudinal profiles, regardless of lithologicvariation, have an equilibrium form and are consistently bedrock–alluvial channels.
Conclusion
An analysis of river concavity and river morphology has been carried out to better understand the influences of rockresistance and rock uplift on the fluvial and topographic system in the Oregon Coast Ranges and Klamath Mountains.The study is cast in terms of four domains that describe the trends in topographic relief, lithology, fluvial morphologyand uplift rates. We make the following main conclusions.
(1) Concavity is dependent on rock type, with higher values associated with sedimentary rocks and lower valuesassociated with more resistant volcanic rocks. Inverting tectonic information from distributions of channel typesand river profile concavity in tectonically active mountain belts depends on isolating lithologic and other variablesindependently.
(2) Concavities derived from river profiles that flow in one mapped lithology are similar regardless of whether theriverbed is alluvial or bedrock and independent of uplift rate, although a tremendous amount of variability is seen.This finding is consistent with recent theoretical work by Whipple and Tucker (2002).
(3) Riverbed morphology depends on rock type, rock uplift rate, and variations in rock uplift rate in space and time.(4) The alluvial nature of rivers in the CCR may reflect a response to a decrease in uplift rate since 120 ka, whereas
the knickpoints in the SCR are consistent with a fluvial response to an increase in uplift rate since 120 ka(Whipple and Tucker, 2002). Both intra-formation lithologic variation and a latitudinal correspondence of channelknickpoints to a major change in shelf width at 44°N complicate the tectonic explanation but illuminate pathwaysfor future work.
(5) Although hillslope sediment production and channel carrying capacity may suggest steady-state in small catch-ments, neither tectonic, erosional or topographic steady-state is likely to be occurring in the central and southernOregon Coast Ranges on a main tributary scale. A transient state since 120 ka is more likely.
AcknowledgementsThe first author thanks Gordon Grant for numerous and rich contributions to this research including conceptualizing the geologylong profiles, Kelin Whipple for his experience, expertise and helpful direction throughout the preparation of this manuscript, NoahSnyder and Eric Kirby for many insights into river profile development and the gift of their slope–area analysis code, Chris Krughfor moral and intellectual support from the beginning, editor Michael Kirkby for a helpful review, Bob Yeats for his exhaustiveknowledge of earthquakes and the seismic cycle and Bob Duncan and Nick Pisias for support in the latter stages of this endeavour.This work was funded by a NASA SRTM Grant NAG5-11404.
References
Benda LE. 1990. The influence of debris flows on channels and valley floors in the Oregon Coast Range, USA. Earth Surface Processes andLandforms 15: 457–466.
Brandon MT, Roden-Tice MK, Garver JI. 1998. Late Cenozoic exhumation of the Cascadia accretionary wedge in the Olympic Mountains,northwest Washington State. Geological Society of America Bulletin 110: 985–1009.

River morphology above a subduction zone, Oregon, USA 21
Copyright © 2006 John Wiley & Sons, Ltd. Earth Surf. Process. Landforms (in press)DOI: 10.1002/esp
Dietrich WE, Wilson CJ, Montgomery DR, McKean J. 1993. Analysis of erosion thresholds, channel networks, and landscape morphologyusing a digital terrane model. Journal of Geology 101: 259–278.
Duncan RA. 1982. A captured island chain in the Coast Range of Oregon and Washington. Journal of Geophysical Research 87: 10,827–10,837.
Duvall A, Kirby E, Burbank D. 2004. Tectonic and lithologic controls on bedrock channel profiles and processes in coastal California.Journal of Geophsical Research 109: F03002.
Flint JJ. 1974. Stream gradient as a function of order, magnitude, and discharge. Water Resources Research 10: 969–973.Gilbert GK. 1877. Report on the Geology of the Henry Mountains. In United States Geographical and Geological Survey of the Rocky
Mountains Region, Powell JW (ed). US Government Printing Office: Washington; 160.Goldfinger C, Kulm LD, Yeats RS, Appelgate B, MacKay M, Moore GF. 1992. Transverse structural trends along the Oregon convergent
margin: implications for Cascadia earthquake potential. Geology 20: 141–144.Hack JT. 1957. Studies of longitudinal stream profiles in Virginia and Maryland. US Geological Survey Professional Paper: 45–97.Hacker BR, Donato MM, Barnes CG, McWilliams MO, Ernst WG. 1995. Timescales of orogeny; Jurassic construction of the Klamath
Mountains. Tectonics 14: 677–703.Hancock GS, Anderson RS. 2002. Numerical modeling of fluvial strath-terrace formation in response to oscillating climate. Geological
Society of America Bulletin 114: 1131–1142.Haugerud RA. 1999. Digital elevation model (DEM) of Cascadia, latitude 39N–53N, longitude 116W–133W. 99–369. U.S. Geological
Survey Open-file Report.Heimsath AM, Dietrich WE, Nishiizumi K, Finkel RC. 2001. Stochastic processes of soil production and transport: Erosion rates, topo-
graphic variation and cosmogenic nuclides in the Oregon Coast Range. Earth Surface Processes and Landforms 26: 531–552.Heller PL, Peterman ZE, O’Neil JR, Shafiqullah M. 1985. Isotopic provenance of sandstones from the Eocene Tyee Formation, Oregon
Coast Range. GSA Bulletin 96: 770–780.Heller PL, Ryberg PT. 1983. Sedimentary record of subduction to forearc transition in the rotated Eocene basin of western Oregon. Geology
11: 380–383.Howard AD. 1994. A detachment-limited model of drainage basin evolution. Water Resources Research 30: 2261–2285.Howard AD. 1997. Badland morphology and evolution: interpretation using a simulation model. Earth Surface Processes and Landforms 22:
211–227.Howard AD. 1998. Long profile development of bedrock channels: Interaction of weathering, mass wasting, bed erosion and sediment
transport. In Rivers Over Rock: Fluvial Processes in Bedrock Channels, Tinkler KJ, Wohl EE (eds). American Geophysical Union:Washington; 323.
Howard AD, Kerby G. 1983. Channel changes in the Badlands. GSA Bulletin 94: 739–752.Howard AD, Siedl MA, Dietrich WE. 1994. Modeling fluvial erosion on regional to continental scales. Journal of Geophysical Research 99:
13,971–13,986.Hurtrez J-E, Lucazeau F, Lavé J, Avouac JP. 1999. Investigation of the relationships between basin morphology, tectonic uplift,
and denudation from the study of an active fold belt in the Siwalik Hills, central Nepal. Journal of Geophysical Research 104: 12,779–12,796.
Hyndman RD, Wang K. 1995. The rupture zone of Cascadia great earthquakes from current deformation and the thermal regime. Journal ofGeophysical Research 100: 22,133–22,154.
Kelsey HM. 1990. Late Quaternary deformation of marine terraces on the Cascadia subduction zone near Cape Blanco, Oregon. Tectonics 9:983–1014.
Kelsey HM, Bockheim JG. 1994. Coastal landscape evolution as a function of eustasy and surface uplift rate, Cascadia margin, southernOregon. Geological Society of America Bulletin 106: 840–854.
Kelsey HM, Engebretson DC, Mitchell CE, Ticknor RL. 1994. Topographic form of the Coast Ranges of the Cascadia margin in relation tocoastal uplift rates and plate subduction. Journal of Geophysical Research 99: 12,245–12,255.
Kelsey HM, Ticknor RL, Bockheim JG, Mitchell CE. 1996. Quaternary upper plate deformation in coastal Oregon. Geol. Soc. Am. Bull.108: 843–860.
Kennedy GL, Lajoie KR, Wehmiller JF. 1982. Aminostratigraphy and faunal correlations of late Quaternary marine terraces, Pacific Coast,USA. Nature 299: 545–547.
Kirby E, Whipple KX. 2001. Quantifying differential rock-uplift rates via stream profile analysis. Geology 29: 415–418.Kobor JS, Roering JJ. 2004. Systematic variation of bedrock channel gradients in the central Oregon Coast Range: implications for rock
uplift and shallow landsliding. Geomorphology 62: 239–256.Lovell JPB. 1969. Tyee Formation; undeformed turbidites and their lateral equivalents, mineralogy and paleogeography. Geological Society
of America Bulletin 80: 9–21.Mazzotti S, Dragert H, Hyndman RD, Miller MM, Henton JA. 2002. GPS deformation in a region of high crustal seismicity; N. Cascadia
forearc. Earth and Planetary Science Letters 198: 41–48.McCaffery R, Long MD, Goldfinger C, Nabelek JL, Johnson CK, Smith C. 2000. Rotation and plate locking at the southern Cascadia
subduction zone. Geophysical Research Letters 27: 3117–3120.McCaffrey R, Goldfinger C. 1995. Forearc deformation and great subduction earthquakes: Implication for Cascadia earthquake potential.
Science 267: 856–859.McCaffrey R, Goldfinger C, Murray M, Zwick P, Nabelek J, Smith C, Johnson C. 1998. GPS constraints on rorearc sliver motion, plate
coupling, and strain partitioning in northwestern Oregon. EOS, Transactions of the American Geophysical Union, Fall Supplement.

22 S. VanLaningham, A. Meigs and C. Goldfinger
Copyright © 2006 John Wiley & Sons, Ltd. Earth Surf. Process. Landforms (in press)DOI: 10.1002/esp
McInelly GW, Kelsey HM. 1990. Late Quaternary tectonic deformation in the Cape Arago-Bandon region of coastal Oregon as deducedfrom wave cut platforms. Journal of Geophysical Research 95: 6699–6713.
McNeill LC, Goldfinger C, Kulm LD, Yeats RS. 2000. Tectonics of the Neogene Cascadia forearc basin: Investigations of a deformed LateMiocene unconformity. GSA Bulletin 112: 1209–1224.
Merritts D, Vincent KR. 1989. Geomorphic response of coastal streams to low, intermediate, and high rates of uplift, Mendocino triplejunction region, California. Geological Society of America Bulletin 101: 1373–1388.
Merritts DJ, Vincent KR, Wohl EJ. 1994. Long river profiles, tectonism, and eustacy: A guide to interpreting fluvial terraces. Journal ofGeophysical Research 99: 14,031–14,050.
Miller MM, Johnson DL, Rubin CM, Dragert H, Wang CY, Qamar A, Goldfinger C. 2001. GPS-determination of along-strike variation inCascadia margin kinematics: Implications for relative plate motion, subduction zone coupling, and permament deformation. Tectonics 20:61–176.
Mitchell CE, Vincent P, Weldon II RJ, Richards MA. 1994. Present-day vertical deformation of the Cascadia margin, Pacific northwest,U.S.A. Journal of Geophysical Research 99: 12,257–12,277.
Moglen GE, Bras RL. 1995. The importance of spatially heterogenous erosivity and the cumulative area distribution within a basin evolutionmodel. Geomorphology 12: 173 –185.
Montgomery DR. 2001. Slope distributions, threshold hillslopes and steady-state topography. American Journal of Science 301: 432 – 454.Montgomery DR, Foufoula-Georgiou E. 1993. Channel network source representation using digital elevation models. Water Resources
Research 29: 3925–3934.Pazzaglia FJ, Brandon MT. 2001. A fluvial record of long-term steady-state uplift and erosion across the Cascadia fore-arc high, western
Washington State. American Journal of Science 301: 385 – 431.Pazzaglia FJ, Gardner TW, Merritts DJ. 1988. Bedrock fluvial incision and longitudinal profile development over geologic timescales
determined by fluvial terraces. In Rivers Over Rock: Fluvial Processes in Bedrock Channels, Tinkler KJ, Wohl EE (eds). AmericanGeophysical Union: Washington; 207–236.
Personius S, Kelsey HM, Grabau PC. 1993. Evidence for regional stream aggradation in the central Oregon Coast Range during thePleistocene-Holocene transition. Quaternary Research 40: 297–308.
Personius SF. 1995. Late Quaternary stream incision and uplift in the forearc of the Cascadia Subduction Zone, western Oregon. Journal ofGeophysical Research 100: 20,193 – 20,210.
Reneau SL, Dietrich WE. 1991. Erosion rates in the southern Oregon Coast Ranges: evidence for an equilibrium between hillslope erosionand sediment yield. Earth Surface Processes and Landforms 16: 307–322.
Reneau SL, Dietrich WE, Rubin M, Donahue DJ, Jull AJT. 1989. Analysis of hillslope erosion rates using dated colluvial deposits. Journalof Geology 97: 45– 63.
Rhea S. 1993. Geomorphic observations of rivers in the Oregon Coast Range from a regional reconnaissance perspective. Geomorphology 6:135–150.
Roe GH, Montgomery DR, Hallet B. 2002. Effects of orographic precipitation variations on the concavity of steady-state river profiles.Geology 30: 143–146.
Roering JJ, Kirchner JW, Dietrich WE. 2005. Characterizing structural and lithologic controls on deep-seated landsliding: Implications fortopographic relief and landscape evolution in the Oregon Coast Range, USA. GSA Bulletin 117: 654 – 668.
Ryu I, Niem AR. 1999. Sandstone diagenesis, reservoir potential and sequence stratigraphy of the Eocene Tyee Basin, Oregon. Journal ofSedimentary Research 69: 384 – 393.
Seeber L, Gornitz V. 1983. River profiles along the Himalayan arc as indicators of active tectonics. Tectonophysics 92: 335 – 367.Seidl MA, Dietrich WE. 1992. The problem of channel erosion into bedrock. Catena Supplement 23: 101–124.Seidl MA, Dietrich WE, Kirchner JW. 1994. Longitudinal profile development into bedrock: An analysis of Hawaiian channels. Journal of
Geology 102: 457–474.Selby MJ. 1980. A rock mass strength classification for geomorphic purposes: with tests from Antarctica and New Zealand. Zeitschrift für
Geomorphologic N. F. 24: 31–51.Sklar LS, Dietrich WE. 1998. River longitudinal profiles and bedrock incision models: Stream power and the influence of sediment supply.
In Rivers Over Rock: Fluvial Processes in Bedrock Channels, Tinkler KJ, Wohl EE (eds). American Geophysical Union: Washington;237–259.
Sklar LS, Dietrich WE. 2001. Sediment and rock strength controls on river incision into bedrock. Geology 29: 1087–1090.Slingerland R, Willett SD, Hovius N. 1998. Slope-area scaling as a test of fluvial bedrock erosion laws. EOS Transactions (Abs) 79: F358.Snavely PDJ, Wagner HC, MacLeod NS. 1964. Rhythmic bedded eugeosynclinal deposits of the Tyee Formation, Oregon Coast Range.
Geological Society of Kansas Bulletin 169: 461–480.Snyder NP, Whipple KX, Tucker GE, Merritts DJ. 2000. Landscape response to tectonic forcing: digital elevation model analysis of stream
profiles in the Mendocino triple junction region, northern California. GSA Bulletin 112: 1250–1263.Snyder NP, Whipple KX, Tucker GE, Merritts DJ. 2002. Interactions between onshore bedrock-channel incision and nearshore wave-base
erosion forced by eustacy and tectonics. Basin Research 14: 105–127.Stock JD, Dietrich WE. 2003. Valley incision by debris flows: evidence of a topographic signature. Water Resources Research 39. DOI:10·1029/
2001WR001057.Stock JD, Montgomery DR. 1999. Geologic constraints on bedrock river incision using the stream power law. Journal of Geophysical
Research 104: 4983 – 4993.Tarboton DG, Bras RL, Rodriguez-Iturbe I. 1991. On the extraction of channel networks from digital elevation data. Hydrological Processes
5: 81–100.
River morphology above a subduction zone, Oregon, USA 23
Copyright © 2006 John Wiley & Sons, Ltd. Earth Surf. Process. Landforms (in press)DOI: 10.1002/esp
Thatcher W. 1984. The earthquake deformation cycle at the Nankai trough. Journal of Geophysical Research 89: 3087–3101.Ticknor RL, Kelsey HM. 1992. Quaternary upper plate deformation in coastal Oregon. GSA Bulletin 108: 843–860.Trehu AM, Asudeh I, Brocher TM, Luetgert JH, Mooney WD, Nabelek JL, Nakamura Y. 1994. Crustal architecture of the Cascadia forearc.
Science 265: 237–243.Walker GW, Duncan RA. 1989. Geologic map of the Salem 1° × 2° Quadrangle, western Oregon. I-1893 U.S. Geological Survey Map.Walker GW, MacLeod NS. 1991. Geologic map of Oregon, 1:500 000. US Geological Survey.Wells RE, Weaver CS, Blakely RJ. 1998. Fore-arc migration in Cascadia and its neotectonic significance. Geology 26: 759 –762.Whipple KX. 2001. Fluvial landscape response time: How plausible is steady-state denudation? American Journal of Science 301: 313–325.Whipple KX. 2004. Bedrock rivers and the geomorphology of active orogens. Annual Reviews Earth and Planetary Science 32: 151–185.Whipple KX, Tucker GE. 1999. Dynamics of the stream-power river incision model: Implications for height limits of mountain ranges,
landscape response timescales, and research needs. Journal of Geophysical Research 104: 17661–17674.Whipple KX, Tucker GE. 2002. Implications of sediment-flux-dependent river incision models for landscape evolution. Journal of
Geophysical Research 107: ETG 3-1-20.Whipple KX, Kirby E, Brocklehurst SH. 1999. Geomorphic limits to climatically induced increases in topographic relief. Nature 401: 39 –
43.Willett S. 1999. Orogeny and orography: The effects of erosion on the structure of mountain belts. Journal of Geophysical Research 104:
28,957–28,981.Willett SD, Brandon MT. 2002. On steady states in mountain belts. Geology 30: 175 –178.Willgoose G, Bras RL, Rodriguez-Iturbe I. 1990. A model of river basin evolution. EOS Transactions 71: 1806 –1807.Wobus CW, Whipple KX, Kirby E, Snyder NP, Johnson J, Spyropolou K, Crosby BT, Sheehan D. 2006. Tectonics from topography:
Procedures, promise and pitfalls. In Tectonics, Climate and Landscape Evolution: Geological Society of America Special Paper 398,Willett SD, Hovius N, Brandon MT, Fisher D, (eds). Geological Society of America: Boulder, CO; 55–74.
Wohl E, Legleiter CJ. 2003. Controls on pool characteristics along a resistant-boundary channel. Journal of Geology 111: 103 –114.