Embed Size (px)
Citation preview
Abstract This paper shows the results of tests undertaken on pallet rack connections in order to obtain the moment-rotation curve of the connection including the reduced capacity after repeated cyclic loads. The moment-curvature relations were then used in Ansys computer models to determine the behaviour of sample down-aisle pallet racks under seismic loads. The results of the analyses show that the reduced ultimate moment-rotation capacity of the connection does not significantly affect the overall structural behaviour of pallet rack frames as the rotations required for effect to occur does not normally occur under earthquake simulations. Keywords: seismic, pallet racks, semi-rigid joints, steel structures, numerical modelling. 1 Introduction Storage racks are used in a variety of industries to store and organise goods and also to help manage storage spaces efficiently. The wide ranging typologies in shapes, thicknesses and sizes for use in warehouses, supermarkets etc. as storage racks and for shelving pose inconsistencies in their design and often need to be tested to ensure their behaviour is well understood. This is a measure often recommended in design guides. The beam – connector joints are designed to allow for easy assembly into and dismantle from the uprights, a design which often brings along further complications in the semi – rigid and nonlinear joint behaviours in their global frame analysis [1-3.
This work is part of a research development at Oxford Brookes University on the behaviour of semi – rigid joints in cold formed steel structures and similar slender frames which has been going on since the mid 1980s. The initial research [4,5] investigated the effects of static loading on slender cold formed steel structures with semi – rigid joints and conducted simple monotonic tests on their connectors. Abdel
Paper 21 The Effects of Seismic Loading on Pallet Rack Semi-Rigid Joints K.O. Kwarteng1, R.G. Beale2, M.H.R. Godley2 and S.D. Thomson1 1 CS&A Capability, Risley, United Kingdom 2 Slender Structures Group Oxford Brookes University, United Kingdom
©Civil-Comp Press, 2012 Proceedings of the Eleventh International Conference on Computational Structures Technology, B.H.V. Topping, (Editor), Civil-Comp Press, Stirlingshire, Scotland

– Jaber et al [6] extended the work to include the effects of loading and unloading cycles on the semi – rigid joints of racking frames and conducted elementary cyclic tests on full scale frames with these joints. The load cycles were applied in one direction and without going through zero. The work was then extended by Prabhakaran et al. [7] into cyclic tests through zero but the work was carried out on frames with scaffolding tubes and the effects of looseness in these connections. The behaviour of scaffolding frames is similar to that of storage racks. The current research extends the work on semi – rigid connections even further, taking the connection to positive loading and unloaded through zero to negative loading in a quasi – static increasing loading process and looking at the semi – rigid behaviour of the connection stiffness. It also looks at the effects of pinching in these connections on the structural response under seismic loading. A literature review showed that there is limited reported research in this area on storage racks.
There is currently no Euronorm for the seismic design of storage racks in the European Union. The only standard currently available for seismic design of storage racks is the standard of the European Federation of Rack Manufacturers pr-FEM10.2.08 [8]. This standard has been in a draft form for some years now and not even an approved standard of the European Committee for Standardization. In the USA the American Rack Manufacturers’ Institute (RMI) has produced a standard - ANSI Standard MH16.1-2004 [9]. This standard is based on push – over analysis and therefore easy to follow. The American FEMA – 460 guide [10] contains recommendations developed following the 1994 Northridge Earthquake event to prevent the excessive loss of goods and to limit the impact of these losses on the United States economy in the event of another earthquake.
Ductility in steel connections is a design requirement in most seismic design codes because the recommended failure mechanism is one that is associated with the formation of plastic hinges in the beam – column joints. Such a plastic failure mechanism is a pre – requisite for global ductility required to prevent a sudden failure at the onset of the seismic loading Anastasiadis et al [11] looked at plastic failures and ductility in these joints under static loads meanwhile other researchers such as Chan and Chui [12] show that if ductility demand is extended from member to global frame level the structure will be more efficient and resistant to seismic loading. Despite the earlier ductility requirements emphasised in other seismic design codes the Northridge Earthquake event in January 1994 and the Kobe event in the following year showed significant damage in steel connections. Bertero [13] and Chia – Ming and Yu [14] reported that most of the failures in steel structures resulting from the Northridge and Kobe earthquakes were not in the beams but in the stiff moment connections.
Beam – column connections in storage racks behave as semi – rigid by default [2, 4-6] due to the need to make the connectors removable. However, connections are often treated either as pinned or rigid out of convenience of the designer and this assumption works well under static loads partly because the connections are not expected to rotate so far. Under seismic load conditions the repeated effects of the applied loading on the connections cause material yielding, permanent deformation with increasing looseness and therefore persistent degradation of the stiffness. All the factors help to re – distribute loads through the structure and by doing so make
the design economic for seismic loading. This paper describes the results of tests on the connections and the influence of
the resulting moment-rotation curves on the seismic behaviour of pallet-racks. 2 Experimental determination of moment-curvature
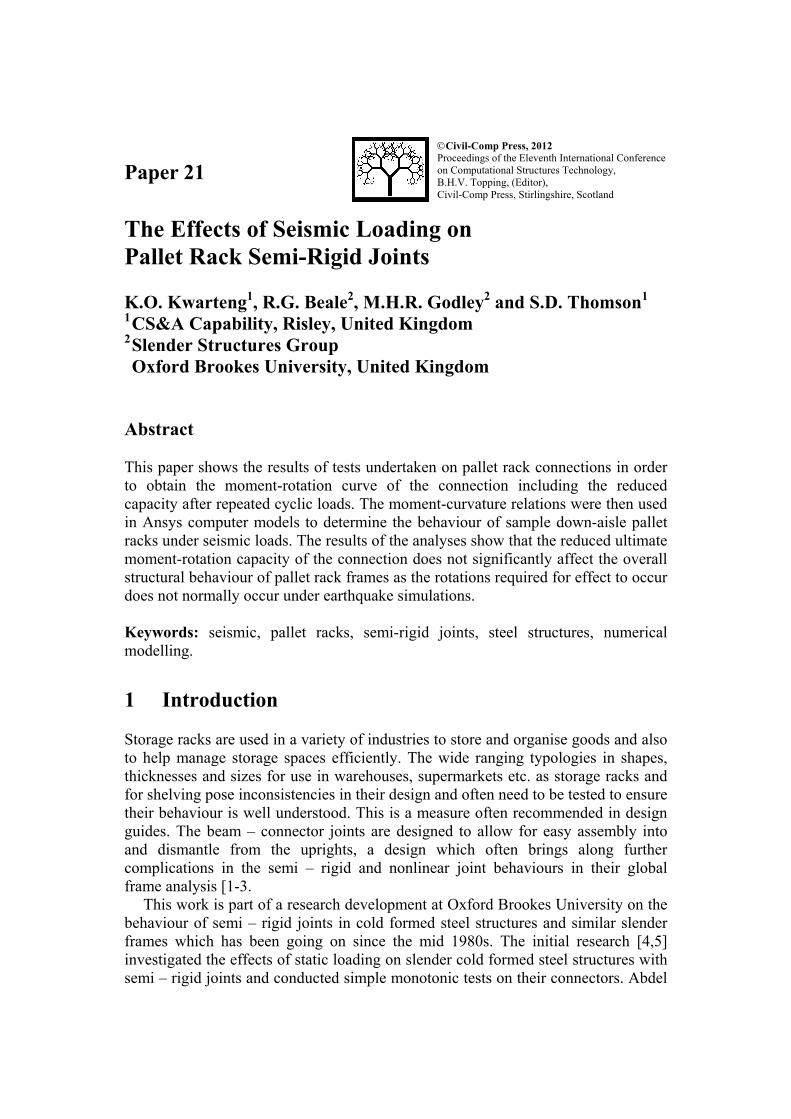
relationships of pallet rack connections 2.1 Introduction The only published data on moment-curvature relationships available to the authors were the experiments conducted by Bernuzzi and co-workers [15, 16]. However, the results were non-dimensionalised so that the maximum moment in all tests was unity which meant that they could not be used in modelling rack structures. The authors therefore conducted their own tests. A schematic of the test arrangement is shown in Figure 1.
Figure 1 Schematic of the test arrangement
Ten uprights and twelve beams were tested. Ten of the experiments were carried out under cyclic loading and two under monotonic loading. Prior to the experiments each beam had been welded to an end connector. Half of the tests were carried out with the beams mounted in the rig as shown in Figure 1 (called a sagging position as the initial rotation in this position would be such as would occur under a sagging moment applied to the beam) and the other half were carried out with the beams mounted upside-down (called a hogging position). This was because the nature of the slotted connection which had asymmetric properties in the two directions.
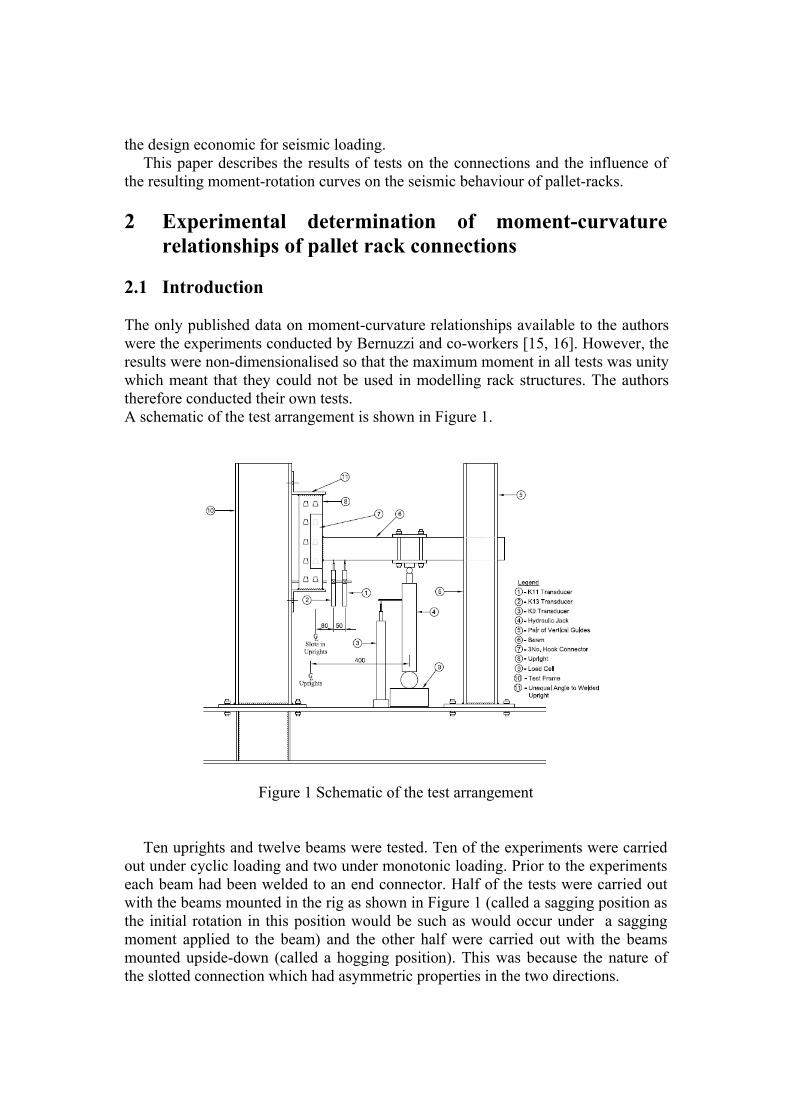
The first pair of tests was carried out monotonically, one in each direction. The aim of conducting the monotonic tests prior to the cyclic tests was to determine the ultimate moment capacity of the connections in both directions and from this information the amplitudes of the cyclic loads were determined. In both monotonic tests failure was observed in the welding between the beams and the connectors. The integrity of the uprights throughout the tests was intact except for minor erosion of the connector hooks into the slots in the uprights. The two uprights used in the monotonic tests were therefore re – used with the two remaining beams in the cyclic tests program but the slots in those uprights were not re – used. This resulted in a total of one monotonic test and five cyclic tests in hogging and the same number of tests in sagging. 2.2 Test Procedure and results The moment–rotation curves obtained for the monotonic loadings in the sagging and hogging beam positions are as shown in Figures 2 and 3. The maximum moment achieved in hogging was approximately 30% higher than that achieved in sagging. In determining the rotations given by the differential positions of the two vertical transducers corrections were made for both bending and shear in the beam due to load being applied at the end of the beam using the formulae derived by Abdel-Jaber [6] and Markazi [4].
Full details of the formulae and corrections can be found in reference [17]. When conducting the dynamic tests the speed of the hydraulic jack was varied as
the amplitude of the oscillation increased. This was so that the tests could be completed in a single day. The maximum oscillation of the loaded end of the beam was between 63 mm in one direction and 73.5 mm in the other. Larger oscillations could not be undertaken by the loading jack.
Figure 2: Moment-rotation curve for monotonic loading in sagging (Specimen KEN0S)
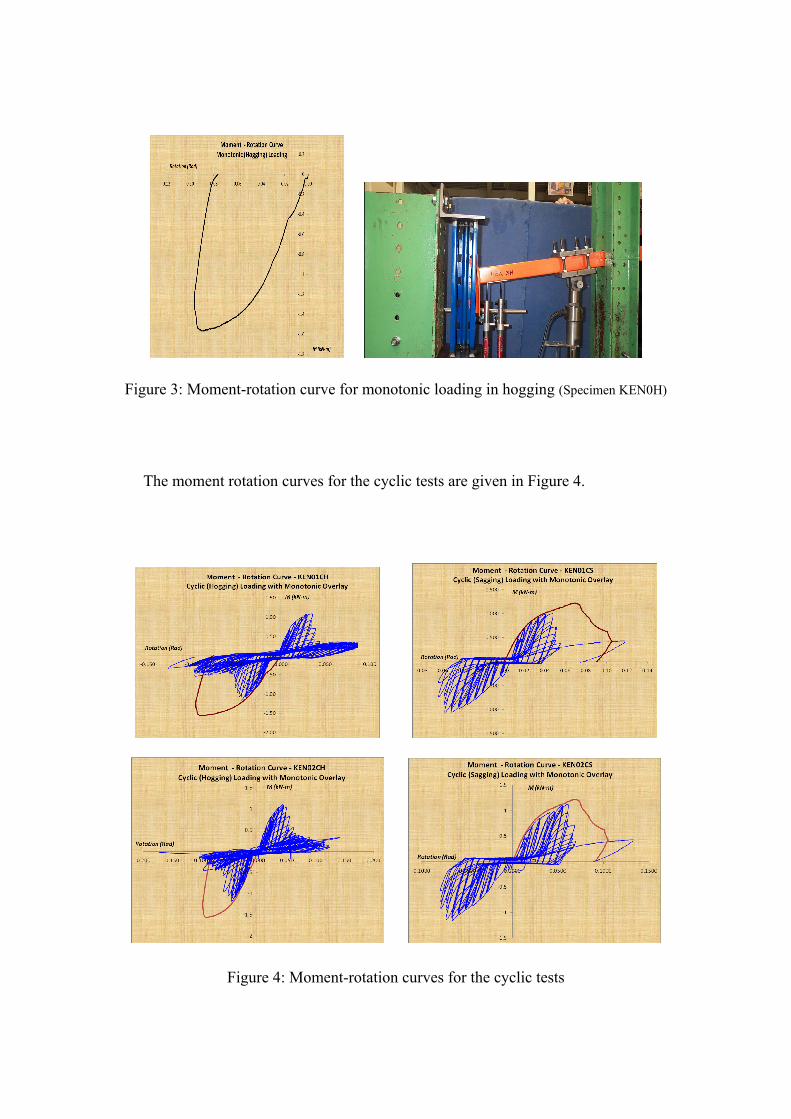
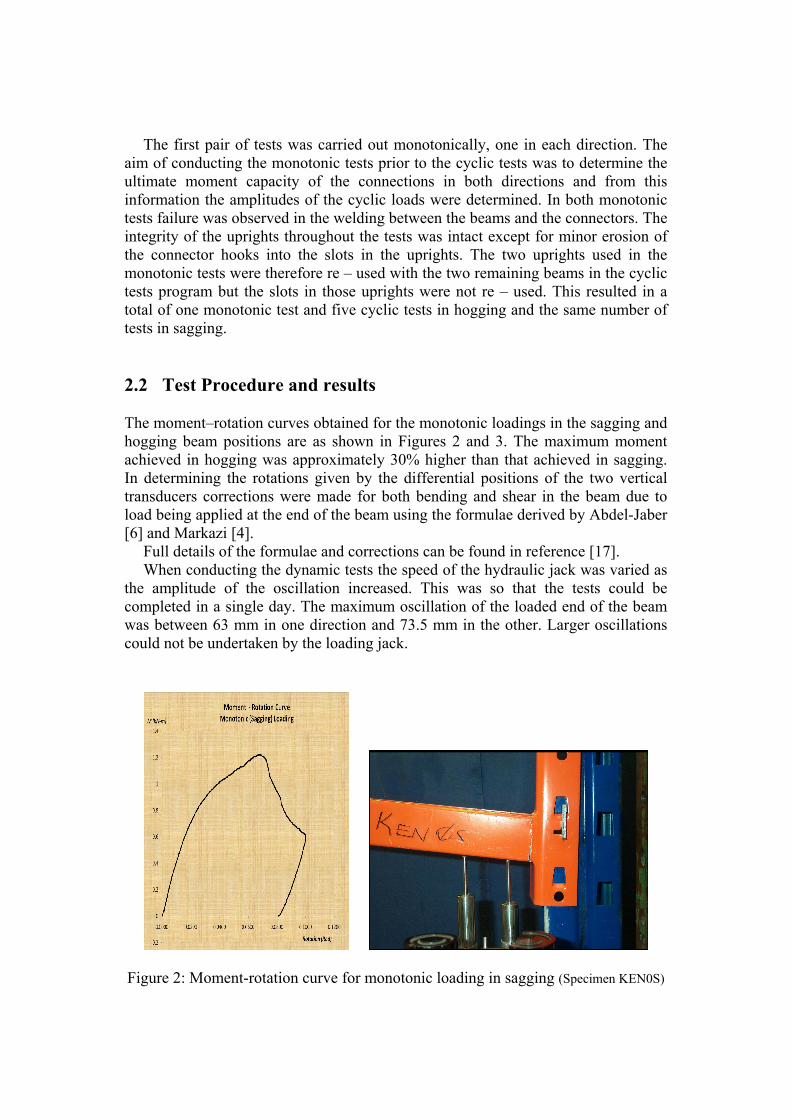
Figure 3: Moment-rotation curve for monotonic loading in hogging (Specimen KEN0H)
The moment rotation curves for the cyclic tests are given in Figure 4.
Figure 4: Moment-rotation curves for the cyclic tests
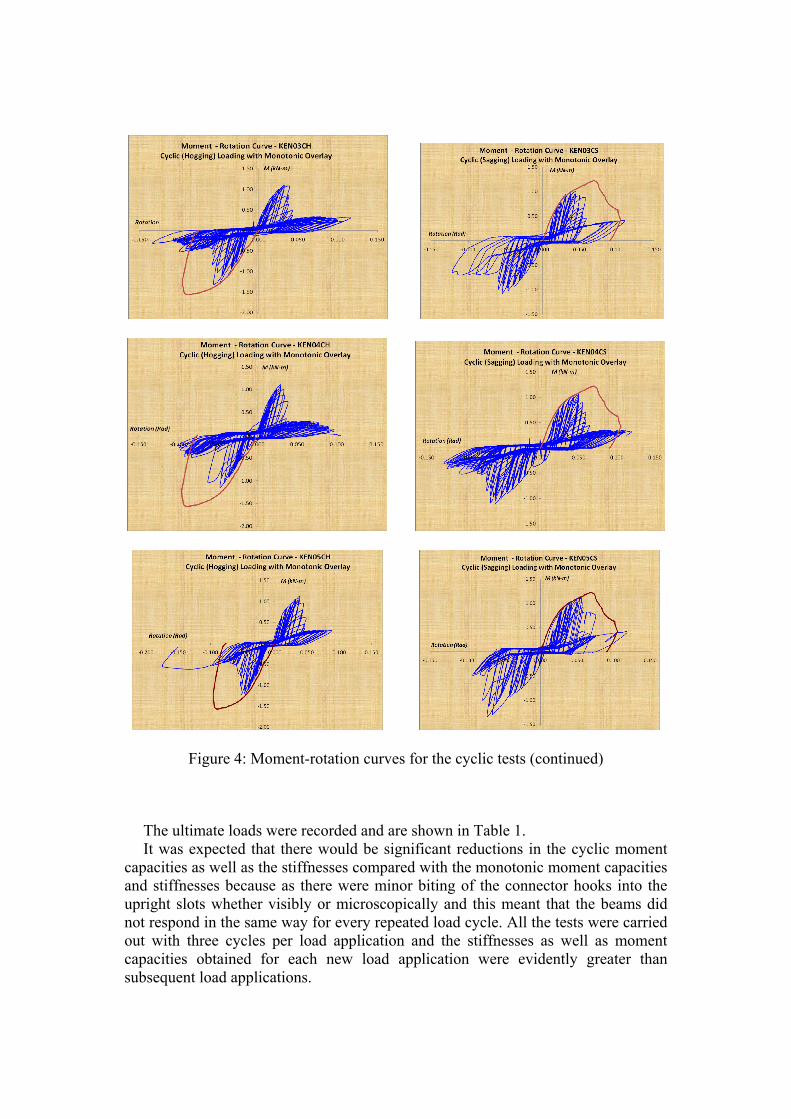
Figure 4: Moment-rotation curves for the cyclic tests (continued)
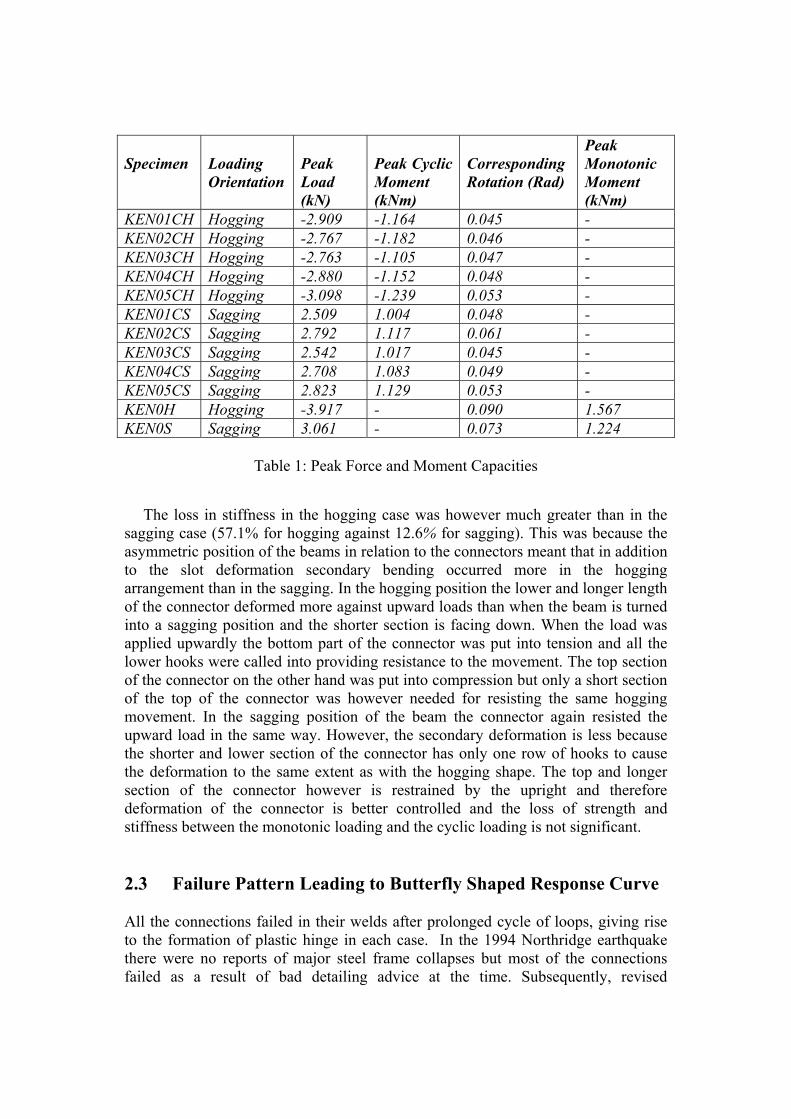
The ultimate loads were recorded and are shown in Table 1. It was expected that there would be significant reductions in the cyclic moment
capacities as well as the stiffnesses compared with the monotonic moment capacities and stiffnesses because as there were minor biting of the connector hooks into the upright slots whether visibly or microscopically and this meant that the beams did not respond in the same way for every repeated load cycle. All the tests were carried out with three cycles per load application and the stiffnesses as well as moment capacities obtained for each new load application were evidently greater than subsequent load applications.
Specimen
Loading Orientation
Peak Load (kN)
Peak Cyclic Moment (kNm)
Corresponding Rotation (Rad)
Peak Monotonic Moment (kNm)
KEN01CH Hogging -2.909 -1.164 0.045 - KEN02CH Hogging -2.767 -1.182 0.046 - KEN03CH Hogging -2.763 -1.105 0.047 - KEN04CH Hogging -2.880 -1.152 0.048 - KEN05CH Hogging -3.098 -1.239 0.053 - KEN01CS Sagging 2.509 1.004 0.048 - KEN02CS Sagging 2.792 1.117 0.061 - KEN03CS Sagging 2.542 1.017 0.045 - KEN04CS Sagging 2.708 1.083 0.049 - KEN05CS Sagging 2.823 1.129 0.053 - KEN0H Hogging -3.917 - 0.090 1.567 KEN0S Sagging 3.061 - 0.073 1.224
Table 1: Peak Force and Moment Capacities
The loss in stiffness in the hogging case was however much greater than in the
sagging case (57.1% for hogging against 12.6% for sagging). This was because the asymmetric position of the beams in relation to the connectors meant that in addition to the slot deformation secondary bending occurred more in the hogging arrangement than in the sagging. In the hogging position the lower and longer length of the connector deformed more against upward loads than when the beam is turned into a sagging position and the shorter section is facing down. When the load was applied upwardly the bottom part of the connector was put into tension and all the lower hooks were called into providing resistance to the movement. The top section of the connector on the other hand was put into compression but only a short section of the top of the connector was however needed for resisting the same hogging movement. In the sagging position of the beam the connector again resisted the upward load in the same way. However, the secondary deformation is less because the shorter and lower section of the connector has only one row of hooks to cause the deformation to the same extent as with the hogging shape. The top and longer section of the connector however is restrained by the upright and therefore deformation of the connector is better controlled and the loss of strength and stiffness between the monotonic loading and the cyclic loading is not significant. 2.3 Failure Pattern Leading to Butterfly Shaped Response Curve All the connections failed in their welds after prolonged cycle of loops, giving rise to the formation of plastic hinge in each case. In the 1994 Northridge earthquake there were no reports of major steel frame collapses but most of the connections failed as a result of bad detailing advice at the time. Subsequently, revised
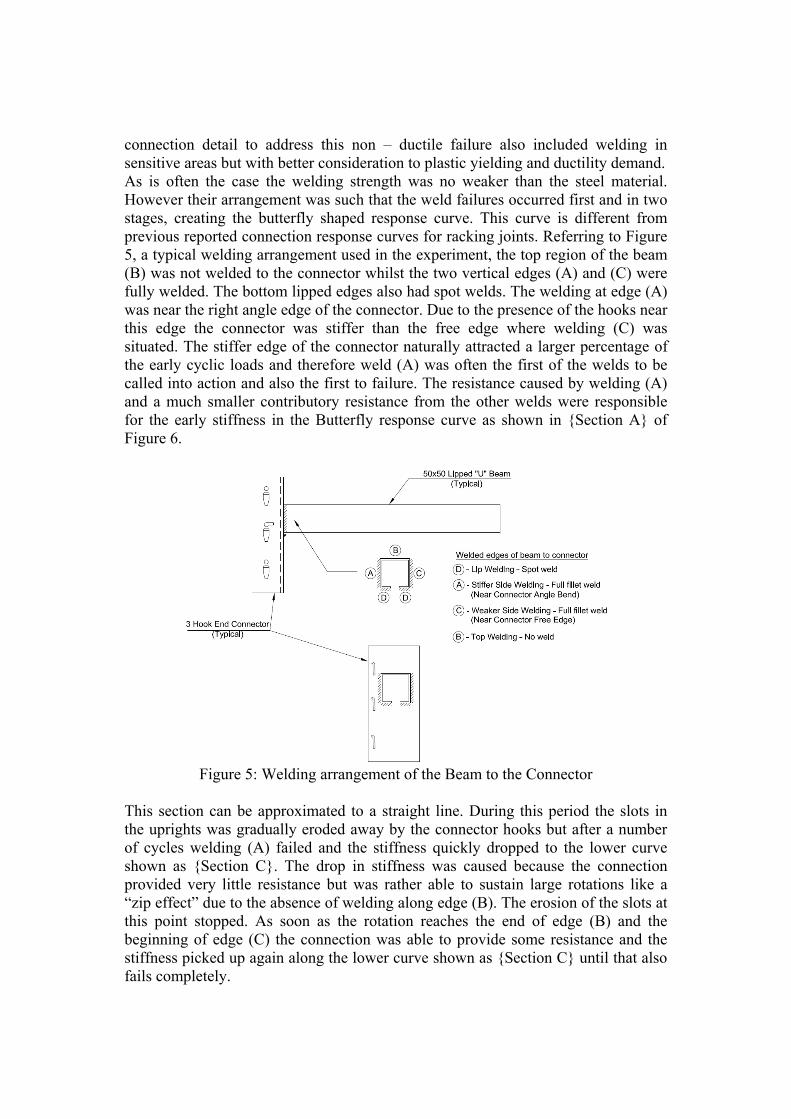
connection detail to address this non – ductile failure also included welding in sensitive areas but with better consideration to plastic yielding and ductility demand. As is often the case the welding strength was no weaker than the steel material. However their arrangement was such that the weld failures occurred first and in two stages, creating the butterfly shaped response curve. This curve is different from previous reported connection response curves for racking joints. Referring to Figure 5, a typical welding arrangement used in the experiment, the top region of the beam (B) was not welded to the connector whilst the two vertical edges (A) and (C) were fully welded. The bottom lipped edges also had spot welds. The welding at edge (A) was near the right angle edge of the connector. Due to the presence of the hooks near this edge the connector was stiffer than the free edge where welding (C) was situated. The stiffer edge of the connector naturally attracted a larger percentage of the early cyclic loads and therefore weld (A) was often the first of the welds to be called into action and also the first to failure. The resistance caused by welding (A) and a much smaller contributory resistance from the other welds were responsible for the early stiffness in the Butterfly response curve as shown in {Section A} of Figure 6.
Figure 5: Welding arrangement of the Beam to the Connector
This section can be approximated to a straight line. During this period the slots in the uprights was gradually eroded away by the connector hooks but after a number of cycles welding (A) failed and the stiffness quickly dropped to the lower curve shown as {Section C}. The drop in stiffness was caused because the connection provided very little resistance but was rather able to sustain large rotations like a “zip effect” due to the absence of welding along edge (B). The erosion of the slots at this point stopped. As soon as the rotation reaches the end of edge (B) and the beginning of edge (C) the connection was able to provide some resistance and the stiffness picked up again along the lower curve shown as {Section C} until that also fails completely.
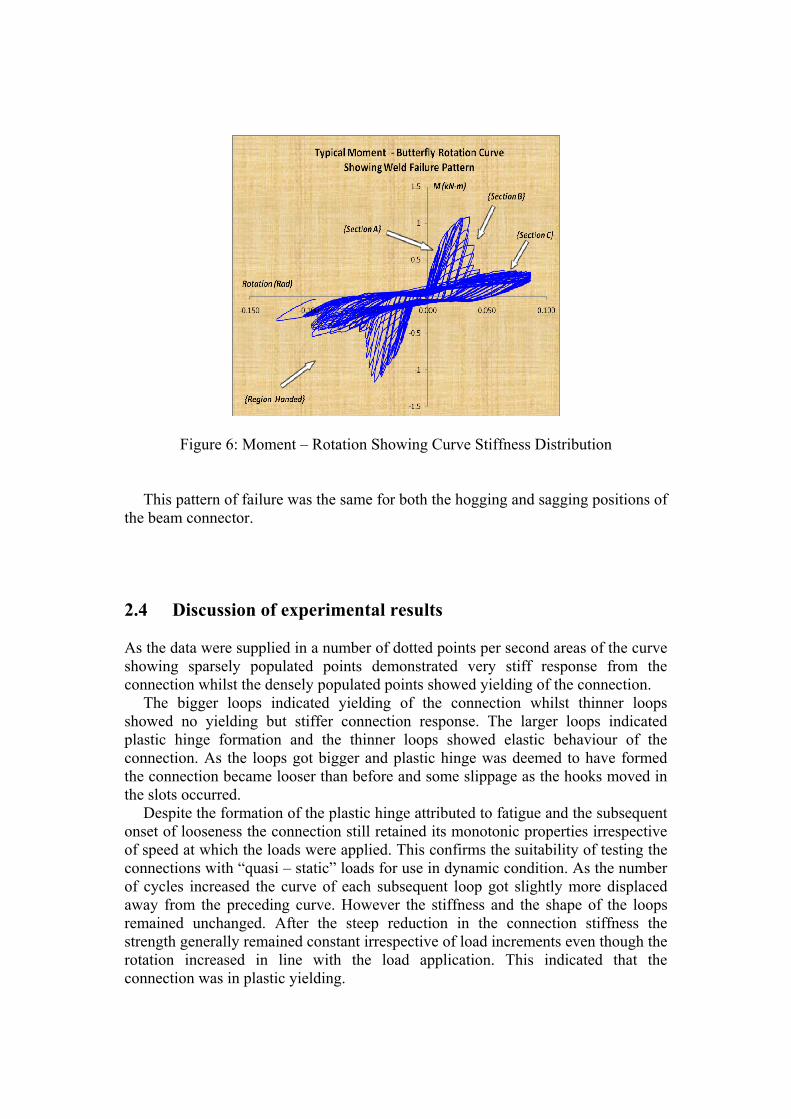
Figure 6: Moment – Rotation Showing Curve Stiffness Distribution
This pattern of failure was the same for both the hogging and sagging positions of the beam connector. 2.4 Discussion of experimental results As the data were supplied in a number of dotted points per second areas of the curve showing sparsely populated points demonstrated very stiff response from the connection whilst the densely populated points showed yielding of the connection.
The bigger loops indicated yielding of the connection whilst thinner loops showed no yielding but stiffer connection response. The larger loops indicated plastic hinge formation and the thinner loops showed elastic behaviour of the connection. As the loops got bigger and plastic hinge was deemed to have formed the connection became looser than before and some slippage as the hooks moved in the slots occurred.
Despite the formation of the plastic hinge attributed to fatigue and the subsequent onset of looseness the connection still retained its monotonic properties irrespective of speed at which the loads were applied. This confirms the suitability of testing the connections with “quasi – static” loads for use in dynamic condition. As the number of cycles increased the curve of each subsequent loop got slightly more displaced away from the preceding curve. However the stiffness and the shape of the loops remained unchanged. After the steep reduction in the connection stiffness the strength generally remained constant irrespective of load increments even though the rotation increased in line with the load application. This indicated that the connection was in plastic yielding.
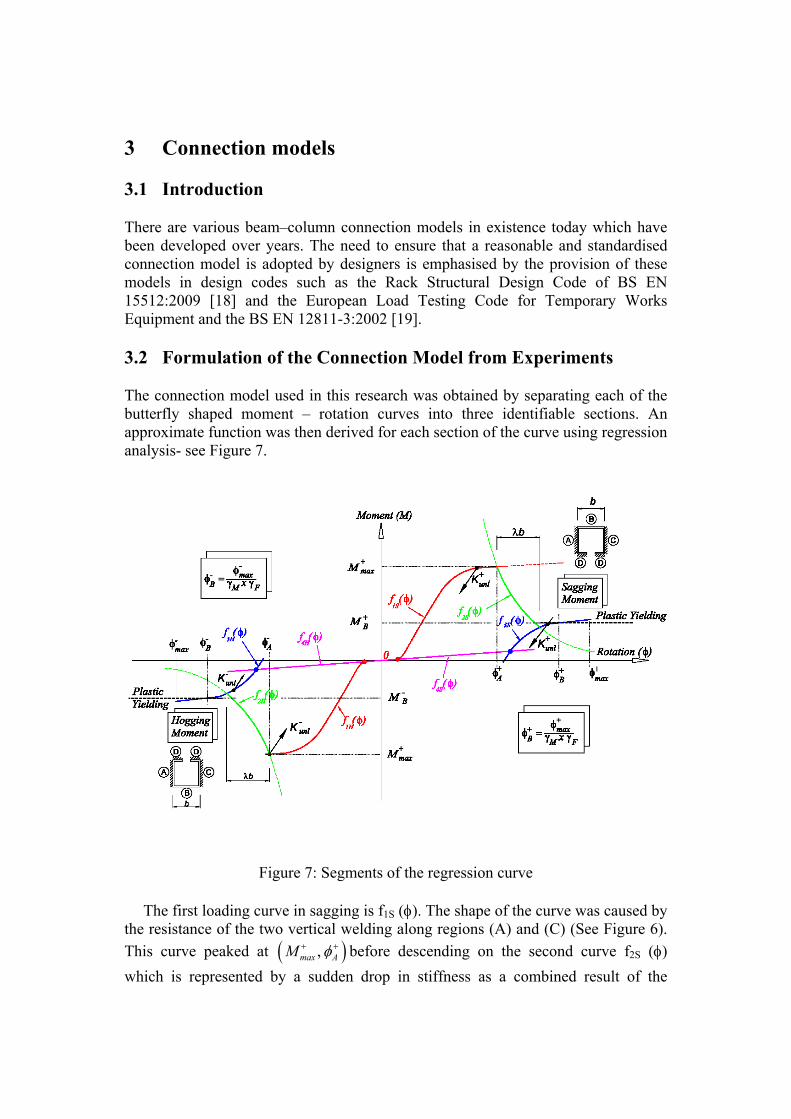
3 Connection models 3.1 Introduction There are various beam–column connection models in existence today which have been developed over years. The need to ensure that a reasonable and standardised connection model is adopted by designers is emphasised by the provision of these models in design codes such as the Rack Structural Design Code of BS EN 15512:2009 [18] and the European Load Testing Code for Temporary Works Equipment and the BS EN 12811-3:2002 [19]. 3.2 Formulation of the Connection Model from Experiments The connection model used in this research was obtained by separating each of the butterfly shaped moment – rotation curves into three identifiable sections. An approximate function was then derived for each section of the curve using regression analysis- see Figure 7.
Figure 7: Segments of the regression curve
The first loading curve in sagging is f1S (φ). The shape of the curve was caused by
the resistance of the two vertical welding along regions (A) and (C) (See Figure 6). This curve peaked at ( ),max AM φ+ + before descending on the second curve f2S (φ) which is represented by a sudden drop in stiffness as a combined result of the
complete failure in the welding along region (A) and the lack of welding along region (B). The steep drop in stiffness continued until the stiffness in the welding along region (C) was fully engaged to describe the lower curve. This lower stiffness curve was caused by the fact that welding (C) was so far away from the connecting hooks creating a weakened strength associated with large rotations in the connection. This lower stiffness curve is represented by curve f3S (φ). The maximum rotation in each connection, Maxφ+ , was obtained from each test along the lower curve f3S (φ). This maximum rotation was then factored down with a material factor γM of 1.1 and a strength factor of γF of 1.5 to obtain the maximum design rotation of Bφ
+
and the corresponding moment as ( ),B BM φ+ + . Beyond the maximum rotation the connection showed a constant moment of MB, demonstrating that the connection was in plastic yielding. The connections generally retained their stiffnesses irrespective of looseness created by the number of cycles they were subjected to. The three stiffness curves in sagging, f1S (φ), f2S (φ) and f3S (φ)were derived for the loading range of KEN04CS as: ( )1 0.611 ln( ) 2.918Sf φ φ= × + (1)
( ) 3 1.7032 3.291 10Sf φ φ− −= × × (2)
( )3 0.12 ln( ) 0.61Sf φ φ= × + (3)
From which the stiffnesses were obtained as:
( ) 11 0.611S
d fd
φ φφ
−= × (4)
( ) 2.7032 0.0056S
d fd
φ φφ
−= × (5)
( ) 13 0.12S
d fd
φ φφ
−= × (6)
The unloading curves were described by a straight curve with a constant stiffness of 41 kNm/radunlK + = . Hence
( ) ( )4 4.588S unl rf Kφ φ φ+= − − (7)
where rφ is the rotation of the connection before unloading. The unloading stiffness remained constant until a minimum rotation of approximately
0.1127 radCφ+ = where a fictitious stiffness of 0.307 kNm/rad was used to avoid
causing numerical instability. Similarly the three hogging stiffnesses were derived for the loading range of
KEN01CH as:
( ) 11 0.571H
d fd
φ φφ
−= × (8)
( ) 2.8272 0.0074H
d fd
φ φφ
−= × (9)
( ) 13 0.292H
d fd
φ φφ
−= × (10)
The unloading stiffness was 33 kNm/radunlK − = and the curve was a straight line. The instability avoidance stiffness was again 0.307 kNm / rad and ( ) ( )4 2.978H unl rf Kφ φ φ−= − − (11)
The unloading stiffness of ( )4Hf φ again remained constant until a minimum
rotation of approximately 0.1127 radCφ− = was reached before a fictitious stiffness
of 0.307kNm/rad. It should be noted that the resistance of the connector to the back and forth cyclic
loading show a significant degradation of stiffness and moment capacity beyond a point of rotation that is correspondent with the moment capacity of the connector. From the end of the unloading section of the movement cycle there is continuity of the cycle as the hysteretic loop closes off with the beginning of the reloading cycle. It is the correlation of these two processes which define the pinching in the connection. Pinching is therefore defined as the degradation of stiffness in the connection as a result of persistent application of loading and unloading cycles to the connection causing wear and tear, material yielding, geometric change and fatigue. The reduced stiffness in the pinched connection is responsible for significant stress re – distribution. The pinching effect is also associated with energy differential with a non – pinched connection that helps to dampen the structural system. The three sources of pinching are: i) connector teeth deforming and yielding as a result of the cyclic load application, ii) connector teeth cutting into the upright and introducing looseness into the connection and iii) failure in the beam – connector joint welding, leading to significant drop in stiffness. These pinching sources were not analysed separately because the numerical models used in the research only allow for a single moment – rotation curve, hence only the composite (pinching) curve was needed in the analyses.
A graphical representation of the connection modelling is illustrated in Figure 6 and bounded by the experimental model of Figure 7. A separate record was kept in a
function to track the behaviour of the resulting joint data to detect whether the connection was in loading or unloading.
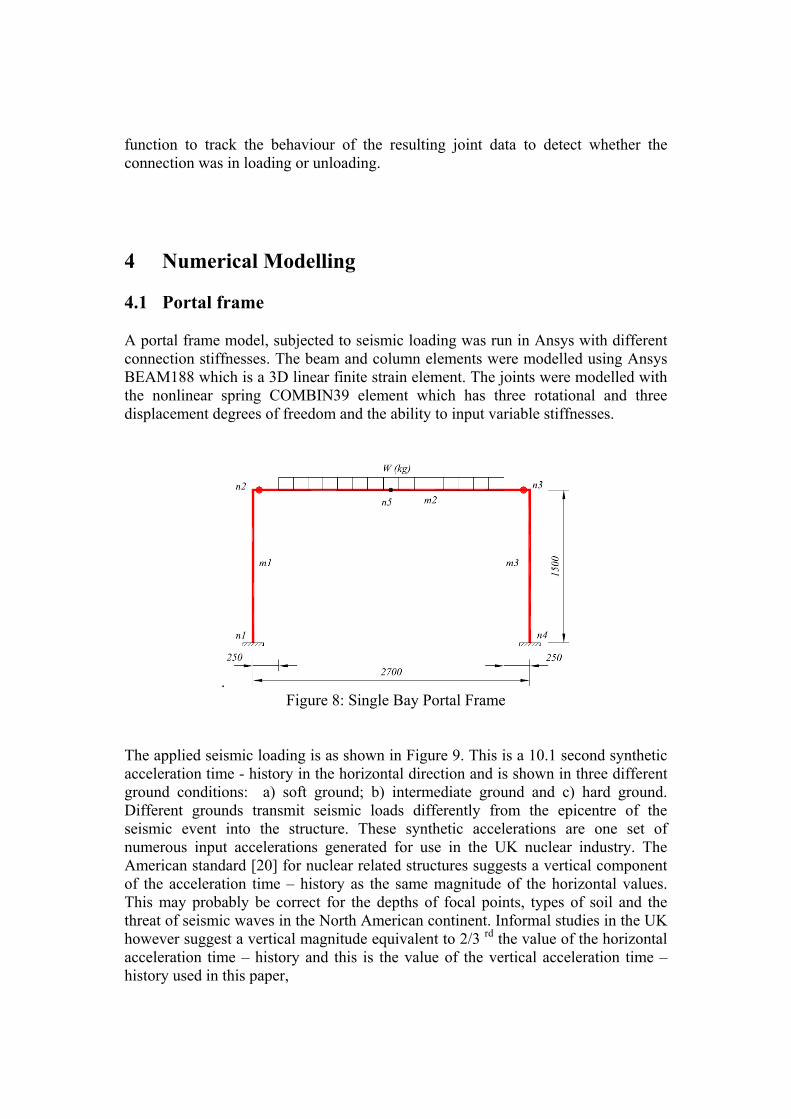
4 Numerical Modelling 4.1 Portal frame A portal frame model, subjected to seismic loading was run in Ansys with different connection stiffnesses. The beam and column elements were modelled using Ansys BEAM188 which is a 3D linear finite strain element. The joints were modelled with the nonlinear spring COMBIN39 element which has three rotational and three displacement degrees of freedom and the ability to input variable stiffnesses.
. Figure 8: Single Bay Portal Frame
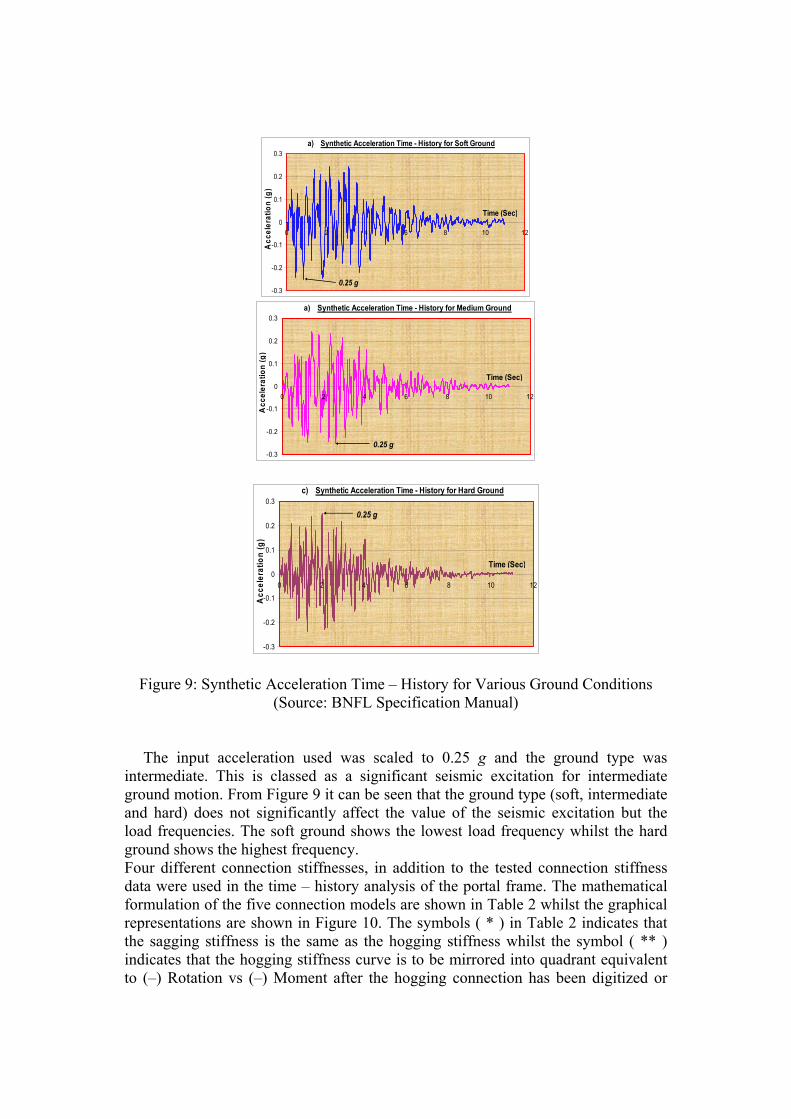
The applied seismic loading is as shown in Figure 9. This is a 10.1 second synthetic acceleration time - history in the horizontal direction and is shown in three different ground conditions: a) soft ground; b) intermediate ground and c) hard ground. Different grounds transmit seismic loads differently from the epicentre of the seismic event into the structure. These synthetic accelerations are one set of numerous input accelerations generated for use in the UK nuclear industry. The American standard [20] for nuclear related structures suggests a vertical component of the acceleration time – history as the same magnitude of the horizontal values. This may probably be correct for the depths of focal points, types of soil and the threat of seismic waves in the North American continent. Informal studies in the UK however suggest a vertical magnitude equivalent to 2/3 rd the value of the horizontal acceleration time – history and this is the value of the vertical acceleration time – history used in this paper,
-0.3
-0.2
-0.1
0
0.1
0.2
0.3
0 2 4 6 8 10 12
a) Synthetic Acceleration Time - History for Soft Ground
Time (Sec)
Acc
eler
atio
n (g
)
0.25 g
-0.3
-0.2
-0.1
0
0.1
0.2
0.3
0 2 4 6 8 10 12
a) Synthetic Acceleration Time - History for Medium Ground
Time (Sec)
Acc
eler
atio
n (g
)
0.25 g
-0.3
-0.2
-0.1
0
0.1
0.2
0.3
0 2 4 6 8 10 12
c) Synthetic Acceleration Time - History for Hard Ground
Time (Sec)
Acc
eler
atio
n (g
)
0.25 g
Figure 9: Synthetic Acceleration Time – History for Various Ground Conditions (Source: BNFL Specification Manual)
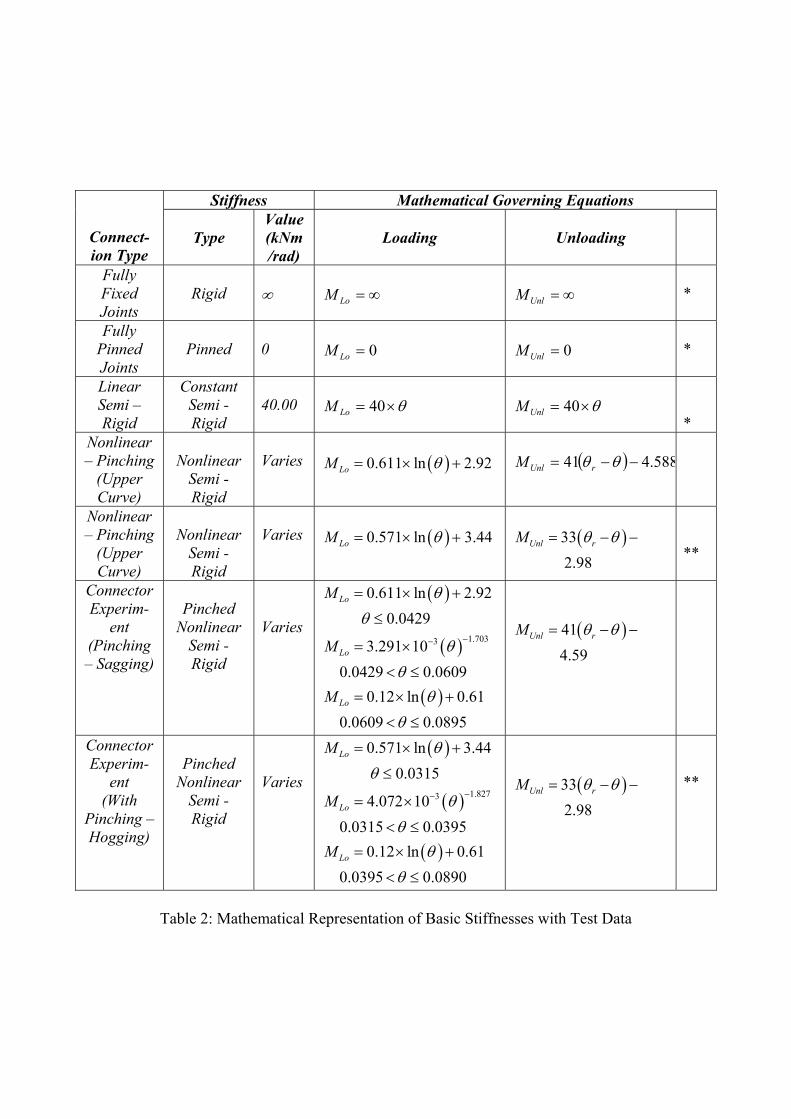
The input acceleration used was scaled to 0.25 g and the ground type was intermediate. This is classed as a significant seismic excitation for intermediate ground motion. From Figure 9 it can be seen that the ground type (soft, intermediate and hard) does not significantly affect the value of the seismic excitation but the load frequencies. The soft ground shows the lowest load frequency whilst the hard ground shows the highest frequency. Four different connection stiffnesses, in addition to the tested connection stiffness data were used in the time – history analysis of the portal frame. The mathematical formulation of the five connection models are shown in Table 2 whilst the graphical representations are shown in Figure 10. The symbols ( * ) in Table 2 indicates that the sagging stiffness is the same as the hogging stiffness whilst the symbol ( ** ) indicates that the hogging stiffness curve is to be mirrored into quadrant equivalent to (–) Rotation vs (–) Moment after the hogging connection has been digitized or
discretised. The unloading stiffness for sagging bending was maintained constant throughout the same goes for the hogging unloading stiffness.
The stiffness used in the linear semi rigid case was 40 kNm / rad and this was equivalent to the initial stiffness in sagging, obtained from the experimental program. This stiffness is also the same as the unloading bending stiffness in sagging. The semi – rigid stiffnesses are therefore set in bounds of fully stiff and fully pinned connection stiffnesses.
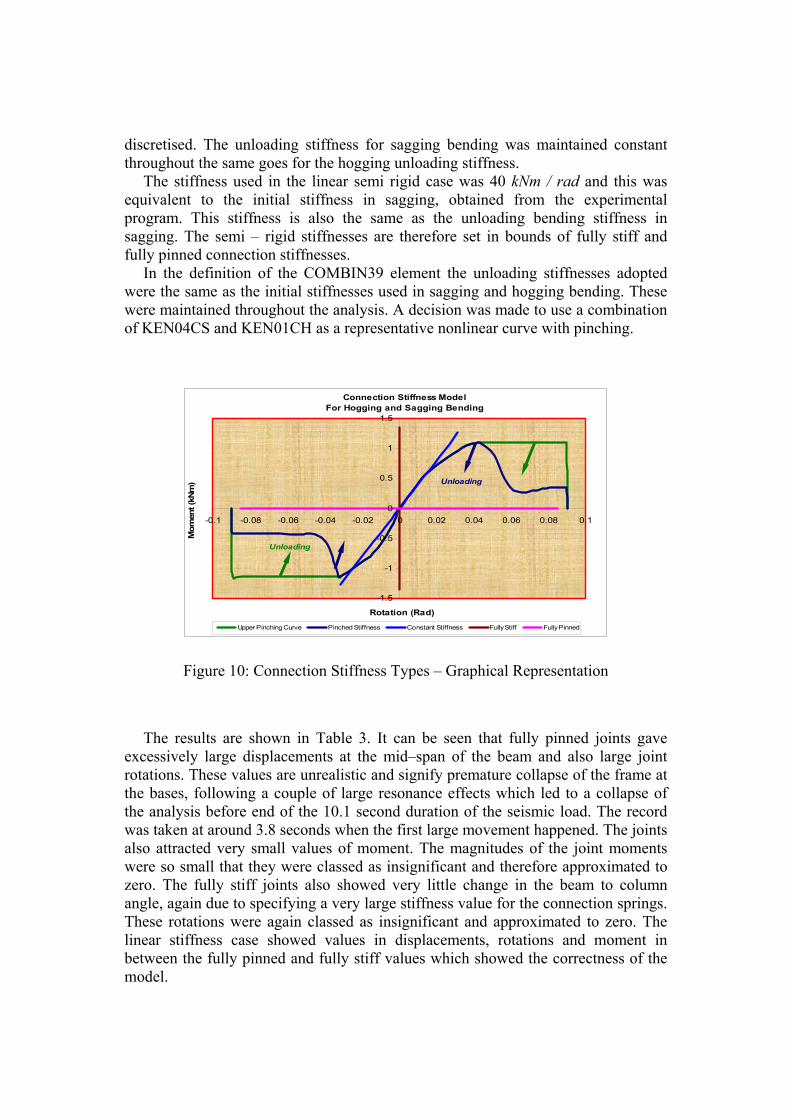
In the definition of the COMBIN39 element the unloading stiffnesses adopted were the same as the initial stiffnesses used in sagging and hogging bending. These were maintained throughout the analysis. A decision was made to use a combination of KEN04CS and KEN01CH as a representative nonlinear curve with pinching.
Connection Stiffness Model
For Hogging and Sagging Bending
-1.5
-1
-0.5
0
0.5
1
1.5
-0.1 -0.08 -0.06 -0.04 -0.02 0 0.02 0.04 0.06 0.08 0.1
Rotation (Rad)
Mom
ent (
kNm
)
Upper Pinching Curve Pinched Stiffness Constant Stiffness Fully Stiff Fully Pinned
Unloading
Unloading
Figure 10: Connection Stiffness Types – Graphical Representation
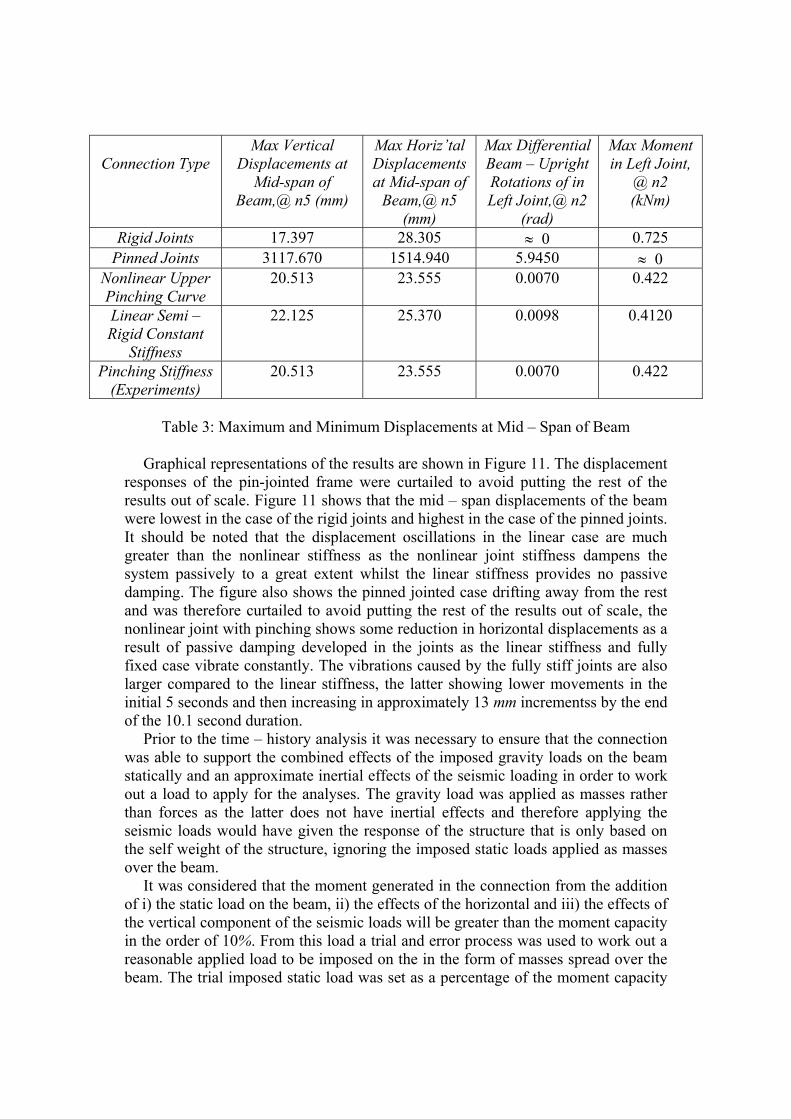
The results are shown in Table 3. It can be seen that fully pinned joints gave excessively large displacements at the mid–span of the beam and also large joint rotations. These values are unrealistic and signify premature collapse of the frame at the bases, following a couple of large resonance effects which led to a collapse of the analysis before end of the 10.1 second duration of the seismic load. The record was taken at around 3.8 seconds when the first large movement happened. The joints also attracted very small values of moment. The magnitudes of the joint moments were so small that they were classed as insignificant and therefore approximated to zero. The fully stiff joints also showed very little change in the beam to column angle, again due to specifying a very large stiffness value for the connection springs. These rotations were again classed as insignificant and approximated to zero. The linear stiffness case showed values in displacements, rotations and moment in between the fully pinned and fully stiff values which showed the correctness of the model.
Connect-ion Type
Stiffness Mathematical Governing Equations
Type Value (kNm /rad)
Loading
Unloading
Fully Fixed Joints
Rigid
∞
∞=LoM
∞=UnlM
*
Fully Pinned Joints
Pinned
0
0=LoM
0=UnlM
*
Linear Semi – Rigid
Constant Semi - Rigid
40.00
θ×= 40LoM
θ×= 40UnlM
*
Nonlinear – Pinching
(Upper Curve)
Nonlinear
Semi - Rigid
Varies
( )0.611 ln 2.92LoM θ= × +
( ) 588.441 −−= θθ rUnlM
Nonlinear – Pinching
(Upper Curve)
Nonlinear
Semi - Rigid
Varies
( )0.571 ln 3.44LoM θ= × +
( )33
2.98Unl rM θ θ= − −
**
Connector Experim-
ent (Pinching – Sagging)
Pinched
Nonlinear Semi - Rigid
Varies
( )0.611 ln 2.920.0429
LoM θθ= × +
≤
( ) 1.70333.291 100.0429 0.0609LoM θ
θ
−−= ×
< ≤
( )0.12 ln 0.610.0609 0.0895LoM θ
θ= × +
< ≤
( )414.59
Unl rM θ θ= − −
Connector Experim-
ent (With
Pinching – Hogging)
Pinched
Nonlinear Semi - Rigid
Varies
( )0.571 ln 3.440.0315
LoM θθ
= × +
≤
( ) 1.82734.072 100.0315 0.0395LoM θ
θ
−−= ×
< ≤
( )0.12 ln 0.610.0395 0.0890LoM θ
θ= × +
< ≤
( )332.98
Unl rM θ θ= − −
**
Table 2: Mathematical Representation of Basic Stiffnesses with Test Data
Connection Type
Max Vertical Displacements at
Mid-span of Beam,@ n5 (mm)
Max Horiz’tal Displacements at Mid-span of
Beam,@ n5 (mm)
Max Differential Beam – Upright Rotations of in Left Joint,@ n2
(rad)
Max Moment in Left Joint,
@ n2 (kNm)
Rigid Joints 17.397 28.305 ≈ 0 0.725 Pinned Joints 3117.670 1514.940 5.9450 ≈ 0
Nonlinear Upper Pinching Curve
20.513 23.555 0.0070 0.422
Linear Semi – Rigid Constant
Stiffness
22.125
25.370 0.0098
0.4120
Pinching Stiffness (Experiments)
20.513 23.555 0.0070 0.422
Table 3: Maximum and Minimum Displacements at Mid – Span of Beam
Graphical representations of the results are shown in Figure 11. The displacement
responses of the pin-jointed frame were curtailed to avoid putting the rest of the results out of scale. Figure 11 shows that the mid – span displacements of the beam were lowest in the case of the rigid joints and highest in the case of the pinned joints. It should be noted that the displacement oscillations in the linear case are much greater than the nonlinear stiffness as the nonlinear joint stiffness dampens the system passively to a great extent whilst the linear stiffness provides no passive damping. The figure also shows the pinned jointed case drifting away from the rest and was therefore curtailed to avoid putting the rest of the results out of scale, the nonlinear joint with pinching shows some reduction in horizontal displacements as a result of passive damping developed in the joints as the linear stiffness and fully fixed case vibrate constantly. The vibrations caused by the fully stiff joints are also larger compared to the linear stiffness, the latter showing lower movements in the initial 5 seconds and then increasing in approximately 13 mm incrementss by the end of the 10.1 second duration.
Prior to the time – history analysis it was necessary to ensure that the connection was able to support the combined effects of the imposed gravity loads on the beam statically and an approximate inertial effects of the seismic loading in order to work out a load to apply for the analyses. The gravity load was applied as masses rather than forces as the latter does not have inertial effects and therefore applying the seismic loads would have given the response of the structure that is only based on the self weight of the structure, ignoring the imposed static loads applied as masses over the beam.
It was considered that the moment generated in the connection from the addition of i) the static load on the beam, ii) the effects of the horizontal and iii) the effects of the vertical component of the seismic loads will be greater than the moment capacity in the order of 10%. From this load a trial and error process was used to work out a reasonable applied load to be imposed on the in the form of masses spread over the beam. The trial imposed static load was set as a percentage of the moment capacity
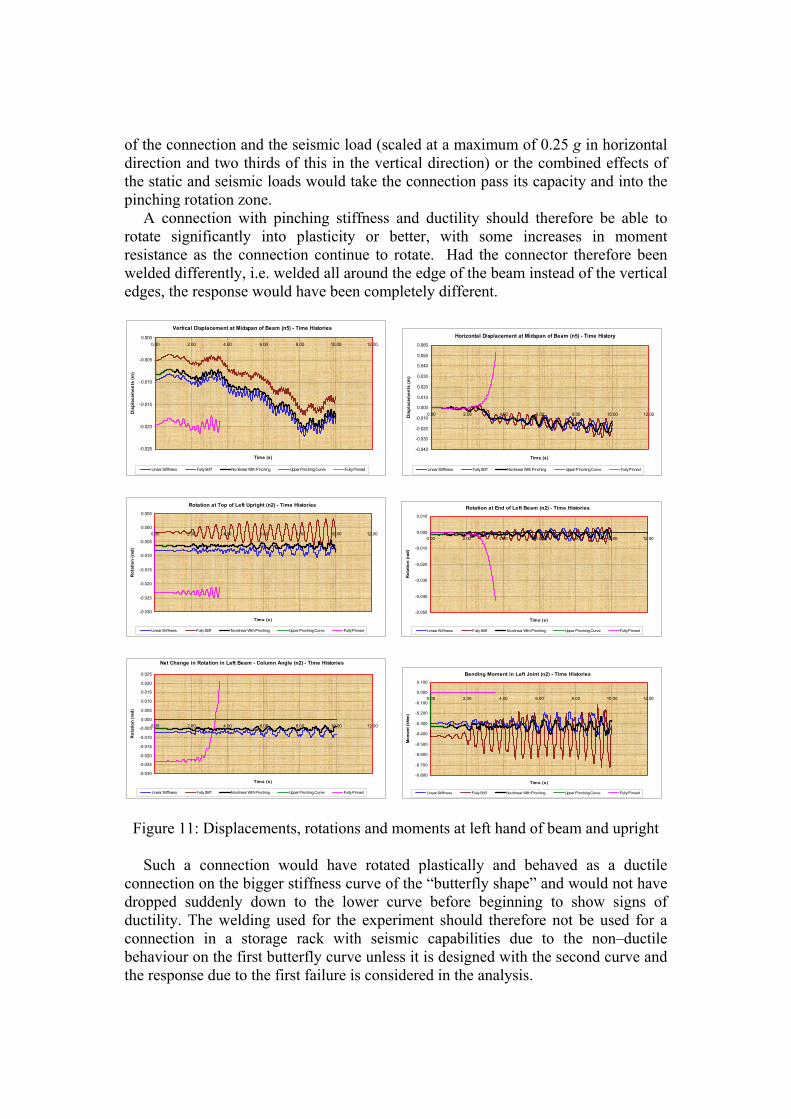
of the connection and the seismic load (scaled at a maximum of 0.25 g in horizontal direction and two thirds of this in the vertical direction) or the combined effects of the static and seismic loads would take the connection pass its capacity and into the pinching rotation zone.
A connection with pinching stiffness and ductility should therefore be able to rotate significantly into plasticity or better, with some increases in moment resistance as the connection continue to rotate. Had the connector therefore been welded differently, i.e. welded all around the edge of the beam instead of the vertical edges, the response would have been completely different.
Vertical Displacement at Midspan of Beam (n5) - Time Histories
-0.025
-0.020
-0.015
-0.010
-0.005
0.0000.00 2.00 4.00 6.00 8.00 10.00 12.00
Time (s)
Dis
plac
emen
ts (m
)
Linear Stiffness Fully Stiff Nonlinear With Pinching Upper Pinching Curve Fully Pinned
Horizontal Displacement at Midspan of Beam (n5) - Time History
-0.040
-0.030
-0.020
-0.010
0.000
0.010
0.020
0.030
0.040
0.050
0.060
0.00 2.00 4.00 6.00 8.00 10.00 12.00
Time (s)
Dis
plac
emen
ts (m
)
Linear Stiffness Fully Stiff Nonlinear With Pinching Upper Pinching Curve Fully Pinned
Rotation at Top of Left Upright (n2) - Time Histories
-0.030
-0.025
-0.020
-0.015
-0.010
-0.005
0.000
0.005
0.00 2.00 4.00 6.00 8.00 10.00 12.00
Time (s)
Rot
atio
n (r
ad)
Linear Stiffness Fully Stiff Nonlinear With Pinching Upper Pinching Curve Fully Pinned
Rotation at End of Left Beam (n2) - Time Histories
-0.050
-0.040
-0.030
-0.020
-0.010
0.000
0.010
0.00 2.00 4.00 6.00 8.00 10.00 12.00
Time (s)
Rot
atio
n (r
ad)
Linear Stiffness Fully Stiff Nonlinear With Pinching Upper Pinching Curve Fully Pinned
Net Change in Rotation in Left Beam - Column Angle (n2) - Time Histories
-0.030
-0.025
-0.020
-0.015
-0.010
-0.005
0.000
0.005
0.010
0.015
0.020
0.025
0.00 2.00 4.00 6.00 8.00 10.00 12.00
Time (s)
Rot
atio
n (r
ad)
Linear Stiffness Fully Stiff Nonlinear With Pinching Upper Pinching Curve Fully Pinned
Bending Moment in Left Joint (n2) - Time Histories
-0.800
-0.700
-0.600
-0.500
-0.400
-0.300
-0.200
-0.100
0.000
0.100
0.00 2.00 4.00 6.00 8.00 10.00 12.00
Time (s)
Mom
ent (
kNm
)
Linear Stiffness Fully Stiff Nonlinear With Pinching Upper Pinching Curve Fully Pinned
Figure 11: Displacements, rotations and moments at left hand of beam and upright
Such a connection would have rotated plastically and behaved as a ductile connection on the bigger stiffness curve of the “butterfly shape” and would not have dropped suddenly down to the lower curve before beginning to show signs of ductility. The welding used for the experiment should therefore not be used for a connection in a storage rack with seismic capabilities due to the non–ductile behaviour on the first butterfly curve unless it is designed with the second curve and the response due to the first failure is considered in the analysis.
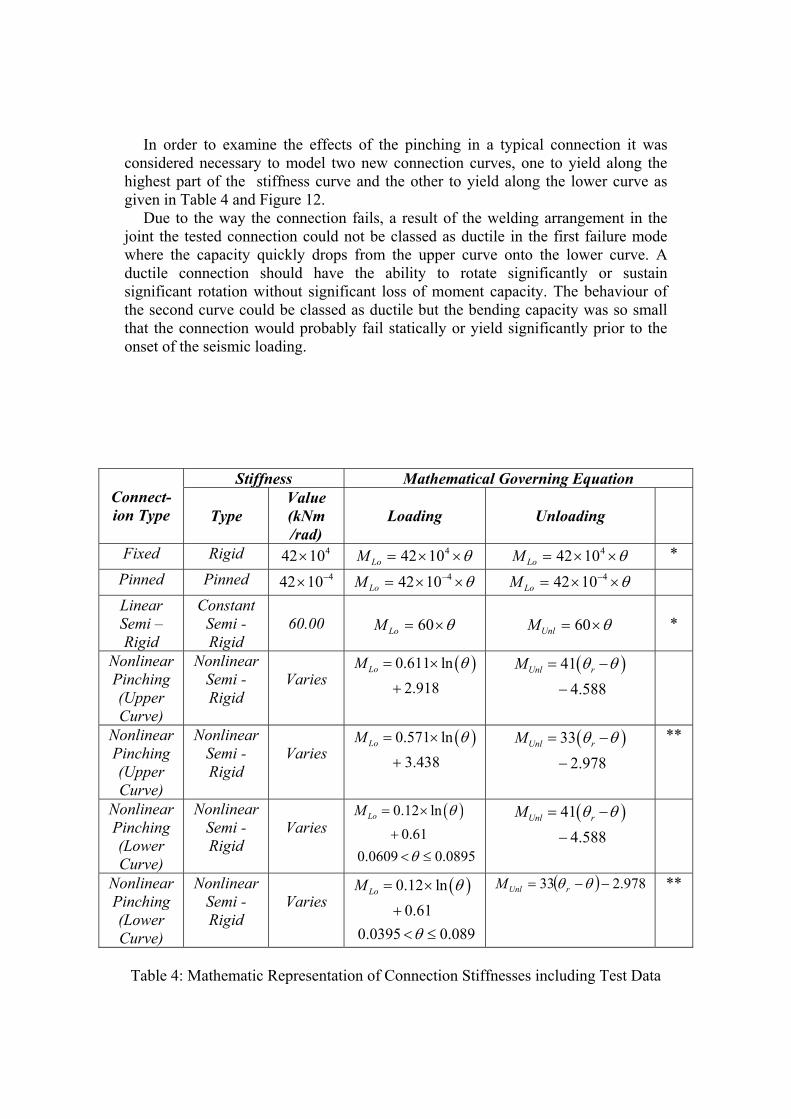
In order to examine the effects of the pinching in a typical connection it was considered necessary to model two new connection curves, one to yield along the highest part of the stiffness curve and the other to yield along the lower curve as given in Table 4 and Figure 12.
Due to the way the connection fails, a result of the welding arrangement in the joint the tested connection could not be classed as ductile in the first failure mode where the capacity quickly drops from the upper curve onto the lower curve. A ductile connection should have the ability to rotate significantly or sustain significant rotation without significant loss of moment capacity. The behaviour of the second curve could be classed as ductile but the bending capacity was so small that the connection would probably fail statically or yield significantly prior to the onset of the seismic loading.
Connect-ion Type
Stiffness Mathematical Governing Equation
Type Value (kNm /rad)
Loading
Unloading
Fixed Rigid 41042× θ××= 41042LoM θ××= 41042LoM * Pinned Pinned 41042 −× θ××= −41042LoM θ××= −41042LoM Linear Semi – Rigid
Constant Semi - Rigid
60.00
θ×= 60LoM
θ×= 60UnlM
*
Nonlinear Pinching (Upper Curve)
Nonlinear Semi - Rigid
Varies
( )0.611 ln2.918
LoM θ= ×
+( )41
4.588Unl rM θ θ= −
−
Nonlinear Pinching (Upper Curve)
Nonlinear Semi - Rigid
Varies
( )0.571 ln3.438
LoM θ= ×
+( )33
2.978Unl rM θ θ= −
−
**
Nonlinear Pinching (Lower Curve)
Nonlinear Semi - Rigid
Varies
( )0.12 ln0.61
0.0609 0.0895
LoM θ
θ
= ×
+< ≤
( )414.588
Unl rM θ θ= −
−
Nonlinear Pinching (Lower Curve)
Nonlinear Semi - Rigid
Varies
( )0.12 ln0.61
0.0395 0.089
LoM θ
θ
= ×
+< ≤
( ) 978.233 −−= θθ rUnlM **
Table 4: Mathematic Representation of Connection Stiffnesses including Test Data
Connection Stiffness ModelFor Hogging and Sagging Bending
-1.5
-1
-0.5
0
0.5
1
1.5
-0.1 -0.08 -0.06 -0.04 -0.02 0 0.02 0.04 0.06 0.08 0.1
Rotation (Rad)
Mom
ent (
kNm
)
Fully Stiff Fully Pinned Upper Pinching Connection Tests Low er Pinching
Unloading
Unloading
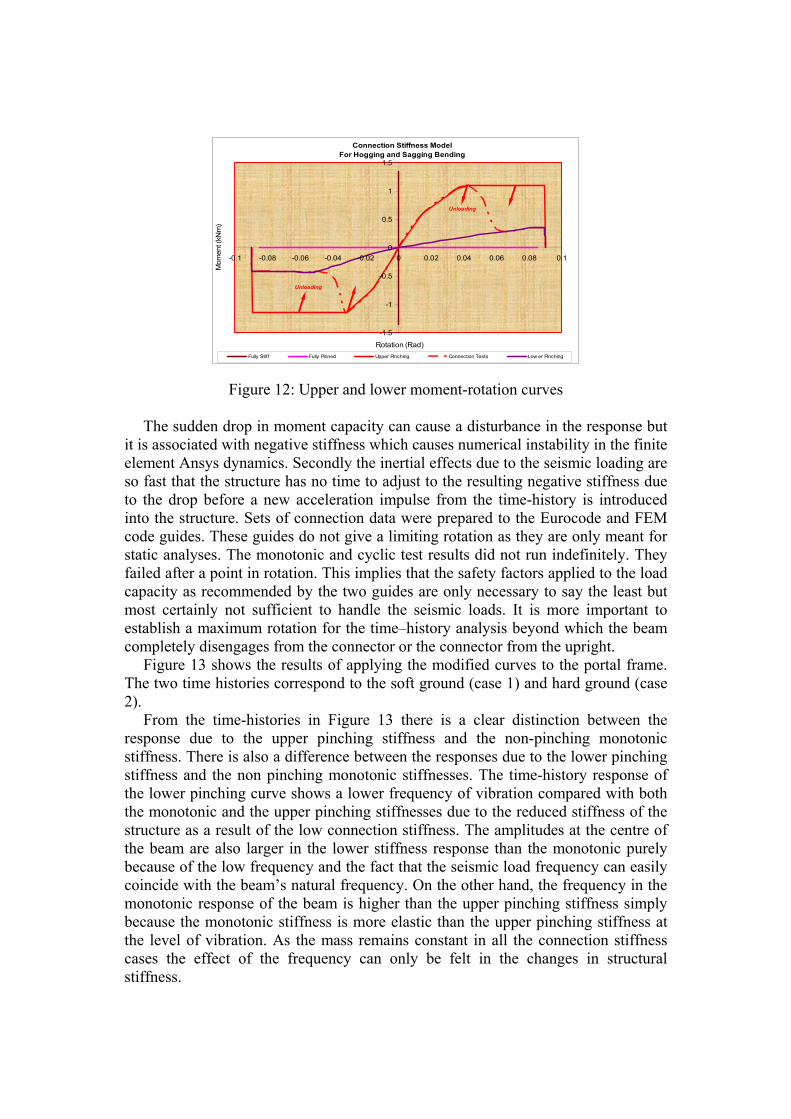
Figure 12: Upper and lower moment-rotation curves The sudden drop in moment capacity can cause a disturbance in the response but
it is associated with negative stiffness which causes numerical instability in the finite element Ansys dynamics. Secondly the inertial effects due to the seismic loading are so fast that the structure has no time to adjust to the resulting negative stiffness due to the drop before a new acceleration impulse from the time-history is introduced into the structure. Sets of connection data were prepared to the Eurocode and FEM code guides. These guides do not give a limiting rotation as they are only meant for static analyses. The monotonic and cyclic test results did not run indefinitely. They failed after a point in rotation. This implies that the safety factors applied to the load capacity as recommended by the two guides are only necessary to say the least but most certainly not sufficient to handle the seismic loads. It is more important to establish a maximum rotation for the time–history analysis beyond which the beam completely disengages from the connector or the connector from the upright.
Figure 13 shows the results of applying the modified curves to the portal frame. The two time histories correspond to the soft ground (case 1) and hard ground (case 2).
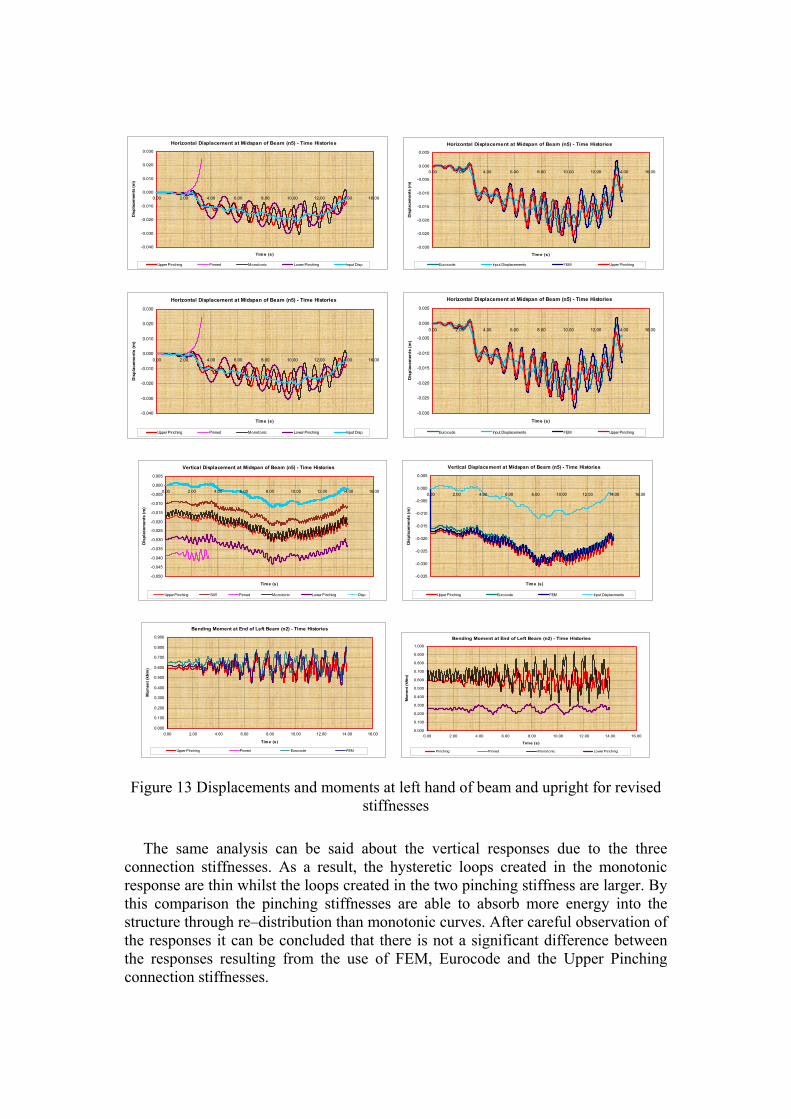
From the time-histories in Figure 13 there is a clear distinction between the response due to the upper pinching stiffness and the non-pinching monotonic stiffness. There is also a difference between the responses due to the lower pinching stiffness and the non pinching monotonic stiffnesses. The time-history response of the lower pinching curve shows a lower frequency of vibration compared with both the monotonic and the upper pinching stiffnesses due to the reduced stiffness of the structure as a result of the low connection stiffness. The amplitudes at the centre of the beam are also larger in the lower stiffness response than the monotonic purely because of the low frequency and the fact that the seismic load frequency can easily coincide with the beam’s natural frequency. On the other hand, the frequency in the monotonic response of the beam is higher than the upper pinching stiffness simply because the monotonic stiffness is more elastic than the upper pinching stiffness at the level of vibration. As the mass remains constant in all the connection stiffness cases the effect of the frequency can only be felt in the changes in structural stiffness.
Horizontal Displacement at Midspan of Beam (n5) - Time Histories
-0.040
-0.030
-0.020
-0.010
0.000
0.010
0.020
0.030
0.00 2.00 4.00 6.00 8.00 10.00 12.00 14.00 16.00
Time (s)
Dis
plac
emen
ts (m
)
Upper Pinching Pinned Monotonic Lower Pinching Input Disp
Horizontal Displacement at Midspan of Beam (n5) - Time Histories
-0.030
-0.025
-0.020
-0.015
-0.010
-0.005
0.000
0.005
0.00 2.00 4.00 6.00 8.00 10.00 12.00 14.00 16.00
Time (s)
Dis
plac
emen
ts (m
)
Eurocode Input Displacements FEM Upper Pinching
Horizontal Displacement at Midspan of Beam (n5) - Time Histories
-0.040
-0.030
-0.020
-0.010
0.000
0.010
0.020
0.030
0.00 2.00 4.00 6.00 8.00 10.00 12.00 14.00 16.00
Time (s)
Dis
plac
emen
ts (m
)
Upper Pinching Pinned Monotonic Lower Pinching Input Disp
Horizontal Displacement at Midspan of Beam (n5) - Time Histories
-0.030
-0.025
-0.020
-0.015
-0.010
-0.005
0.000
0.005
0.00 2.00 4.00 6.00 8.00 10.00 12.00 14.00 16.00
Time (s)
Dis
plac
emen
ts (m
)
Eurocode Input Displacements FEM Upper Pinching
Vertical Displacement at Midspan of Beam (n5) - Time Histories
-0.050
-0.045
-0.040
-0.035
-0.030
-0.025
-0.020
-0.015
-0.010
-0.005
0.000
0.005
0.00 2.00 4.00 6.00 8.00 10.00 12.00 14.00 16.00
Time (s)
Dis
plac
emen
ts (m
)
Upper Pinching Stiff Pinned Monotonic Lower Pinching Disp
Vertical Displacement at Midspan of Beam (n5) - Time Histories
-0.035
-0.030
-0.025
-0.020
-0.015
-0.010
-0.005
0.000
0.005
0.00 2.00 4.00 6.00 8.00 10.00 12.00 14.00 16.00
Time (s)
Dis
plac
emen
ts (m
)
Upper Pinching Eurocode FEM Input Displacments
Bending Moment at End of Left Beam (n2) - Time Histories
0.000
0.100
0.200
0.300
0.400
0.500
0.600
0.700
0.800
0.900
0.00 2.00 4.00 6.00 8.00 10.00 12.00 14.00 16.00
Time (s)
Mom
ent (
kNm
)
Upper Pinching Pinned Eurocode FEM
Bending Moment at End of Left Beam (n2) - Time Histories
0.000
0.100
0.200
0.300
0.400
0.500
0.600
0.700
0.800
0.900
1.000
0.00 2.00 4.00 6.00 8.00 10.00 12.00 14.00 16.00
Time (s)
Mom
ent (
kNm
)
Pinching Pinned Monotonic Lower Pinching
Figure 13 Displacements and moments at left hand of beam and upright for revised stiffnesses
The same analysis can be said about the vertical responses due to the three connection stiffnesses. As a result, the hysteretic loops created in the monotonic response are thin whilst the loops created in the two pinching stiffness are larger. By this comparison the pinching stiffnesses are able to absorb more energy into the structure through re–distribution than monotonic curves. After careful observation of the responses it can be concluded that there is not a significant difference between the responses resulting from the use of FEM, Eurocode and the Upper Pinching connection stiffnesses.
Similar results were obtained when the analysis procedures were applied to a 2-bay portal and to a single bay, five lift rack. Full details can be found in Kwarteng [17].
5 Conclusions and design recommendations The experimental data was fitted to logarithmic curves, both under sagging and hogging moments. For both cases they can be generalised as: ln( )LoM a bθ= × + (12)
( )Unl i rM k cθ θ= − − (13)
where LoM and UnlM are the loading and unloading moments, a, b are constants describing the stiffness curve obtained through regression analysis, c is the value of the last sagging moment or hogging moment in loading before the connection began to unload, ik is the initial stiffness in sagging or hogging from the zero point of the connection and rθ is the last loading rotation recorded before the beginning of unloading. A logarithmic type function is used to represent the stiffnesses (in loading) of both hogging and sagging bending because it fits well to the ductile connection stiffness profile obtained from the experiments.
Implicit damping generated from pinching behaviour of the connection is evident. It is difficult to quantify this without further tests. It is therefore not recommended to consider this in the absence of further testing for the sake of conservatism. This ability of the connection to absorb energy and re – distribute it through the structure should only be considered in a design as a way of increasing the overall factor of safety in ultimate limit state.
In the absence of a currently practical code of practice in the European Union and due to similarities in the structural responses obtained between the experimental stiffness model and the stiffness model of Eurocode BS EN 12811 – 3: 2002 [19] the design process may be simplified by Eurocode model for Equation 12. Equation 13 will still be needed for the unloading stiffness.
Note that in order to limit the excessive movements expected from the seismic action and possible premature collapse due to excessive loss of stiffness in the beam – column connections it is also recommended that the upright bases be designed with significant fixity to ensure that these bases can taken a share of the re – distributed loads after a beam - column connection is deemed to have lost significant stiffness or completely failed.
In conclusion this paper has reported on experimental tests on the cyclic performance of pallet-rack connections and using the derived moment-curvature relations has successfully applied these to the analysis of a portal structure under different seismic accelerations. Recommendations are made as to the form of the curves to be used and in simplified models for seismic analysis of rack-structures.
References [1] R.G. Beale, “The Influence of Semi-Rigid Connections on the Non-Linear
behaviour of Pallet Rack and Scaffold Structures”, PhD Thesis, Oxford Brookes University, Oxford, UK, 2004.
[2] M.H.R. Godley, “Plastic design of pallet rack beams”, Thin-Walled Structures, 29(1-4), 175-188, 1997.
[3] N. Abdel – Rahman, A. Fadel, M. El – Sadaawy, M. S. Mourad, “Tests of Storage Rack Steel Channel Columns with Rear Flanges with Rear Flanges”. Journal of Engineering and Applied Science,52(2), 231-250, 2005.
[4] F.D. Markazi, R.G Beale, M.H.R. Godley, “Experimental Analysis of Semi-Rigid Boltless Connectors’, Thin-Walled Structures, 28(1), 57-87, 1997.
[5] F.D. Markazi, R.G Beale, M.H.R. Godley, “Numerical modelling of semi-rigid boltless connectors”, Computers and Structures, 79(26-28), 2391-2402, 2001.
[6] M. Abdel-Jaber, R.G. Beale, M.H.R. Godley, “A theoretical and experimental investigation of pallet rack structures under sway”, Journal of Constructional Steel Research, 62 (1/2), 68 – 80, 2006.
[7] U. Prabhakaran, R.G. Beale, M.H.R. Godley, “Analysis of scaffolds with connections containing looseness”, Computers and Structures, 89(21-22), 1944-1955, 2011.
[8] Federation Européenne de la Manutention, “ Recommendations for the design of static steel pallet racks under seismic conditions pr-FEM10.2.08”, Manchester, United Kingdom, 2008.
[9] Rack Manufacturers Institute Manufacturers Institute, “MH16.01-2008- Specification for Industrial Steel Storage Racks”, 2008.
[10] FEMA, “Seismic Considerations for Steel Storage Racks Located in Areas Accessible to the Public”, FEMA-460, FEMA, 2005.
[11] A. Anastasiadis, V. Gioncu, F.M. Mazzolani, “Towards a consistent methodology for ductility checking”, In, “Behaviour of Steel Structures in Seismic areas, STESSA 2000”, F.M. Mazzolini, R. Tremblay (Editors), A.A. Balkema, Rotterdam, 443-454, 2000.
[12] S.L. Chan, P.P.T. Chui, “Non-linear static and cyclic analysis of steel frames with semi-rigid connections”, Elsevier, UK, 2000.
[13] W. Bertero, “Major Issues and future directions in earthquake resistant design”, In “Proceedings of the tenth world conference on Earthquake Engineering”, Madrid, Spain, 6407-6444,1994.
[14] U. Chia-Ming, Q-S. Yu, “Cyclic Testing of Steel moment connections rehabilitated with RBS or welded Haunch”, Proc ASCE, Journal of Structural Engineering, 126(1), 57-68, 2000.
[15] N. Baldassino, C. Bernuzzi, R. Zandonini, “Performance of joints in steel storage pallet racks”, Thin-Walled Structures, 16(6), 382–391, 2002.
[16] C. Bernuzzi, C.A.Castiglioni, “ Experimental analysis on the cyclic behaviour of beam–to–column joints in steel storage pallet racks”, Thin–Walled Structures, 39(10), 841 – 859, 2001.

[17] K.O. Kwarteng, “Effects of seismic loading on slender steel structures with semi-rigid joints”, PhD Thesis, Oxford Brookes University, Oxford, UK, 2004.
[18] British Standards Institute, “BS EN 15512: Static Steel Storage System Adjustable pallet racking system – Principles for structural design”, BSI, London, UK, 2009.
[19] British Standards Institute, “BS EN 12811 – 3: Temporary Works Equipment - Part 3: Load Testing”, BSI, London, UK, 2009.
[20] American Society of Civil Engineers, “Seismic Analysis of Safety – Related Nuclear Structures and Commentary” ASCE 4 – 98, 1987.