Embed Size (px)
Citation preview

1 | T h e e f f e c t o f P r o t e c h m a s t a I n f r a r e d l e g w r a p s o n t h e s k i n t e m p e r a t u r e o f t h e p e r f o r m a n c e h o r s e – S a n d i e C h a m b e r s
The effects of the Protechmasta Infrared leg wraps on
the distal limb of the performance horse.
Sandie Chambers.
Abstract:
Despite the high incidence of flexor tendon and ligament injury in the modern sport horse, there is little
application of science in the everyday training and competition management of these structures. The role of
cooling therapy in the initial treatment of acute flexor tendonitis is widely accepted and has been scientifically
proven in some cases to reduce cellular and matrix damage of the tendons and ligaments [Smith and
Goodship, 2008]. However, there is little scientific information on the benefits of warming up these structures
pre-exercise and post exercise for the benefit of prevention of the potential for injury during warming up. This
study investigates the benefits of gently warming up the Distal limb (Muscle, tendons and ligaments) prior to
exercise with the use of FAR Infrared therapy, a therapy that has been scientifically proven to gently increase
blood supply to an anatomical region therefore increasing oxygen, improving metabolism and reducing lactic
acid build up and removal of toxins
Horses are mostly used for athletic function and are under a lot of pressure to perform. The distal limb of the
equine consists of bone, tendons and ligaments. The tendons and ligaments are connective tissues that form
part of the equines skeletal system. Collectively, tendons, ligaments, muscle and bone are attached together
to stabilise, support and create movement. Due to the lack of muscle and soft tissue cover of the distal limbs
of the equine their tendons and ligaments in this region are vulnerable to injury. Horses being genetically
adapted for flight can accelerate at speed, turn sharply and quickly over short distances. For that reason, they
are built to maximise efficiency; the muscles are mainly located near the axle skeleton, their limbs are long
with minimum soft tissue cover especially the distal limb which, being furthest from the muscles, improves the
ability of the horse to take longer strides with minimum weight on the end of the limbs, nevertheless this does
procure the risk of injury balanced with the necessity for efficiency. With this improved efficiency, there are
greater forces at the end of the limbs and add to this the rider element, then there are greater loads added to
the forces, potentially increasing further the risk of damage to tendons and ligaments of the distal limb.
Performance horses are open to diverse types and degrees of injury depending on the job that it does, at what
level and for how long. The competency of the rider is also a consideration. For example, the digital flexor
tendons operate at high efficiency, allowing the horse to store energy to take each long stride but because of
this, and the added pressure and weight from the rider, they are operating near their failure limits and
repetitive overstretching and loading is likely to lead to tendon and ligament damage or failure.
Tendon and ligament matrix can be injured in one of two ways, either by overstrain or laceration. Overstrain
injuries have been studied and proven to occur by one of two mechanisms, they are: sudden overloading of
the structures or degeneration. [Goodship AE, Birch HL 1994] Degeneration is normally the first phase to
tendinopathy and unlike clinical injury does not provoke a repair process. Once clinical injury with disruption
to the tendon matrix occurs, a repair process is initiated; there is an initial intratendinous haemorrhage,
immediately followed by an acute inflammatory response resulting in an increase of blood flow followed by
oedema and further repair responses.
It is therefore important that management of the distal limb is carefully considered for prevention of injuries
and to maximise performance longevity. Because tendons and ligaments can undergo unseen accumulative
damage over time, due to repetitive forces, management of these structures needs to be a priority to optimise
the equines health and performance longevity. A crucial part of the management process is the warming up of
these structures pre-exercise and the reduction of lactic build up post exercise. When these structures are not
warmed up then they are exposed to damage especially as the tendons are made up of predominantly
collagen and elastin, when cold and tight they become less elastic and vulnerable to micro damage and even

2 | T h e e f f e c t o f P r o t e c h m a s t a I n f r a r e d l e g w r a p s o n t h e s k i n t e m p e r a t u r e o f t h e p e r f o r m a n c e h o r s e – S a n d i e C h a m b e r s
rupture. A warming up period is therefore advised to ensure maximum injury prevention. This warming up
period can be encouraged using Far Infrared Therapy which has been scientifically proven to provide radiant
heat which encourages blood flow, [Michael R. Hamblin. PubMed.] which in turn favourably warms up
tendons, ligaments and other structure and post-performance encourages the removal of toxin build up.
Far Infrared (FIR)
Far infrared (FIR) radiation (λ = 3–100 μm) is a subdivision of the electromagnetic spectrum that has been
investigated for biological effects. [2. Vatansever F, PubMed]
FIR transfers energy purely in the form of heat which can be perceived by the thermoreceptors in Equines skin
as radiant heat.
Not only is Far Infra-red (FIR) absorbed by the Equines body but it is also emitted by the body in the form of
black body radiation. FIR also can be described as “biogenetic radiation” Its therapeutic effect is the result of
local hyperaemia (excessive blood flow) and the positive heating impact which will favourably and not
excessively warm up the tendons and ligaments to reduce pain perception (due to increase of endorphin
secretion), immunological reactions, acceleration of metabolism, and regulation of activity of autonomic
nervous system in the aspect of controlling muscle tension. At the cellular level the mechanism of infrared
radiation is based mainly on the interactions with water molecules
An especially interesting part of IR is far infrared (FIR) which is alternatively called biogenetic radiation or
biogenetic rays. This is the part of the IR which has the pure heating effect on the mammals cells due to
marked sensitivity of their thermoreceptors. It penetrates up to 5 cm beneath the skin surface. [3. Michael R.
Hamblin. PubMed.]
Protechmasta Infrared Leg Wraps
This study investigates the beneficial effects of the Protechmasta Infrared (IR) leg wraps when applied to the
equine distal limbs at rest. The Protechmasta IR leg wraps contains a special ceramic powder (filaments) that is
blended with the yarns of the lining fabric, these filaments are impregnated with Far InfraRed (FIR) emitting
nanoparticles designed to deliver thermal radiation effects and keep those effects at a regulated temperature.
Materials and Methods.
Preparation of horses and environment.
This study was performed in a professionally designed scanning room for use with Thermography, selected for
its enclosed and controlled environment and to minimise external artefacts such as wind, sunlight and
distraction from other elements. The horses were scanned on a hard, dry, and level surface.
Four adult dressage horses with no known current abnormalities on physical examination of the distal limb
were used. Horses in this study were all close in competition level, height, age and weight. All horses are
ridden by the same rider and have the same daily routine. All Horses for this study were housed in 12' x 12'
stone stables on the same yard and cared for by the same grooms. All horses had a normal spring coat
including limbs. Pre-scanning the horses were not exercised for 24 hours before hand, this was to ensure no
artefacts from rider, boots, bandages, wind, sunlight, mud, water, sweat, and to prevent evaporative cooling, conduction, convection and solar radiation from exercise and environment.
NOTE: One horse was withdrawn from this study after contracting thrush infection in its foot.
The horses were fasted for 2hrs prior to and during the imaging procedure to avoid postprandial thermal
variation.
The ambient temperature during this study were recorded and stayed constant at 20 degrees Celsius. Horses
were not rugged or bandaged overnight prior to the research. As the horses had their spring coats the ambient
3 | T h e e f f e c t o f P r o t e c h m a s t a I n f r a r e d l e g w r a p s o n t h e s k i n t e m p e r a t u r e o f t h e p e r f o r m a n c e h o r s e – S a n d i e C h a m b e r s
temperature at 20 degrees Celsius, an hour was all that was required to bring their superficial skin temperature to normal and to prevent excessive conduction and hyperthermal reactions from the stone floor.
Leg Wraps:
Full size Protechmasta leg wraps were used in this study.
Handling during research:
A designated handler restrained the horses with a halter and rope during each stage of image capture. In
between the 30 minute stages the horse were tied up in the scanning area.
Equipment used.
Research was conducted using a thermal imaging camera to discern the boots ability to induce physiological
changes in horse’s limbs at rest and to ascertain the thermal effects of the ProTechmasta Infrared leg wraps.
The wavelength of the FIR is too long for human eyes therefore an Infrared camera’s special filters will allow us
to visualise the Infrared radiation and to measure it.
Equipment that was used included one Flir T1030 Thermal Imaging camera with a resolution of 480 x 360.
The infrared image analysis required the Flir Tools software to download the final scans to and interpret the
scans for their quantitative data.
The final temperature data was transferred to an excel sheet created to calculate the maximum. Minimum and
average temperatures within each single scan at the different stages of analysis.
Image capture:
A designated highly qualified thermographer was used to capture all scans for all horses and at all stage of this
study.
Anatomical Regions of the distal limbs scanned:
• Dorsal view of forelimb
• Palmer view of forelimb
• Nearside/offside later view of forelimb
• Nearside/offside medial view of forelimb
• Dorsal view of hindlimb
• Plantar view of hindlimb
• Nearside/offside view of hindlimb
• Nearside/offside view of hindlimb
See Table 1.0

4 | T h e e f f e c t o f P r o t e c h m a s t a I n f r a r e d l e g w r a p s o n t h e s k i n t e m p e r a t u r e o f t h e p e r f o r m a n c e h o r s e – S a n d i e C h a m b e r s
Table 1.0
Dorsal Forelimbs + boots Dorsal Forelimbs - boots Dorsal Hindlimbs + boots Dorsal Hindlimbs - boots
Palmer forelimbs +
boots Palmer forelimbs - boots Plantar hindlimbs +
boots Plantar hindlimbs - boots
Nearside lateral &
offside medial forelimb + boots
Nearside lateral & offside medial forelimb -
boot
Offside lateral & medial nearside forelimb + boot
Offside lateral & medial nearside forelimb - boot
Nearside lateral &
offside medial hindlimb + boot
Nearside lateral & offside medial hindlimb -
boot
Offside lateral & medial nearside hindlimb + boot
Offside lateral & medial nearside hindlimb - boot
Extrinsic factors:
Emissivity = 0.98 Ambient temperature = 20ºC Relative humidity = 50% Distance from target = 2 meters Reflective temperature = 20 ºC

5 | T h e e f f e c t o f P r o t e c h m a s t a I n f r a r e d l e g w r a p s o n t h e s k i n t e m p e r a t u r e o f t h e p e r f o r m a n c e h o r s e – S a n d i e C h a m b e r s
Protechmasta rug In Situ.
When the Protechmasta IR leg wraps are in-situ, the wraps are positioned in a 360-degree diameter over the
following regions:
• top to the bottom of the cannon bone
• over the fetlock joint
• pastern region
• coronet band
• top of hoof
The wraps are fixed with Velcro to Velcro. No pressure was applied to keep the wraps in place and they sat
evenly and without movement during the full scanning period. The absolute temperatures of both boot and
distal limb were recorded prior to application and post application.
The study
Phase one:
To establish baseline temperatures all four horse’s distal limbs, thermal images (thermograms) of the skin
surface temperature of the selected anatomical regions were taken from each horse at rest and in an ambient
temperature of 20 ºC. Two minutes was given to capture all anatomical regions of each phase of this study.
(See table 1.0)
Anatomical Regions scanned see Fig 1.
Phase two:
(a) Before application, the Protechmasta IR leg wraps were scanned inside and outside at 20 Celsius to
ascertain a baseline temperature of the leg wraps. Three regional measurements were selected on
each view of the leg wraps. (see table 2.0 ) These were taken prior to the leg wraps being place in situ
on the limbs.
(b) Once in situ a scan of the inside and outside of the leg wraps was taken at each temporal increment (
30,60,90,120,150, 180) in an ambient temperature of 20 Celsius. This was to ascertain the thermal
reaction of the leg wrap material and its properties.
Table 2.0

6 | T h e e f f e c t o f P r o t e c h m a s t a I n f r a r e d l e g w r a p s o n t h e s k i n t e m p e r a t u r e o f t h e p e r f o r m a n c e h o r s e – S a n d i e C h a m b e r s
Phase three:
The Protechmasta IR leg wraps were placed in situ on each horse initially for 30 minutes and removed for 2
minutes while scan capture of the selected (see Fig 1) anatomical regions were taken. The leg wraps were
immediately re-applied post scan capture for a further 30 minutes and the sequence continued until 180
minutes of leg wrap application was recorded.
Sequence:
Thermal images were taken at the following temporal increments: 30, 60, 90, 12, 150 and 180 minutes.
Storage:
The thermograms were stored on high-resolution SD card and transferred to a HP laptop for post imaging
processing and evaluation. Flir tools analytical software was used to analyse each scan. Each thermograms
level and span was change to 14 and 40 to ensure standardisation of each thermogram. Effective mean surface
temperature (MAST) for the targeted anatomical regions was calculated from an approximately 2000-pixel
(each pixel contains an individual temperature) area selected over the regions of the lateral, medial dorsal,
palmer and plantar cannon bone regions.
Table 3.0 Flir tools analysis software used to measure high, low and average temperatures of each scan.
Results
Each horse tolerated the leg wrap applications and infrared imaging without complication or resistance.
Unfortunately, one horse had to be withdrawn from the study, due to the development of thrush in its foot.
(not related to the effects of the leg wraps). No environmental complications were encountered and ambient
temperatures were held steady at 20°C. Infrared images were obtained successfully for each horse at all time
intervals.

7 | T h e e f f e c t o f P r o t e c h m a s t a I n f r a r e d l e g w r a p s o n t h e s k i n t e m p e r a t u r e o f t h e p e r f o r m a n c e h o r s e – S a n d i e C h a m b e r s
Table 4.0 Level and span values of 14 – 40 (circled) and the target area measured in this case the dorsal
forelimbs
The analytical software utilizes the mean of the pixels composing the targeted area within each image to
determine the surface temperature of the limb. Effective mean temperature for the areas was calculated to
allow comparison of changes in MAST, as affected by the time increments post the leg wrap applications and
protocol.
Regional surface temperature changes in each limb in relation to the baseline images were noted and
recorded. The mean temperatures of the baseline were then compared to the mean values of the scans post
application of each horse from each temporal increment. Infrared thermographic imaging, imaging storage,
and analysis were similarly repeated.
Statistical Analysis
Stage 1 & 3 results are the mean average surface temperature (MAST) of the replicated 8 thermal images of
each horses selected anatomical regions after the Protechmasta IR leg wrap applications. Each timed
Protechmasta IR leg wrap application was initially considered a separate application for analysis. The mean
values of 8 scans taken of each horse at each temporal increment were calculated and recorded. The final
mean values from each temporal increment were then compared together to acquire the final mean values
and results of the research. We have then compared the baseline MAST of all the horses with the maximum
180-minute application.
Stage 2. All Temperature data from the inside and outside of the Protechmasta IR leg wrap baseline and
temporal increments post application were calculated in the same way and MAST from each increment were
compared to acquire their mean values.
Data analysis was completed by using a the Flir Tools analysis software that captured the high, low and
average temperature of the anatomical regions measured in this research. Excel electronic software was used
to store and calculate this data from the Thermograms and tables were used to plot and evaluate the data
and achieve significance of the results.

8 | T h e e f f e c t o f P r o t e c h m a s t a I n f r a r e d l e g w r a p s o n t h e s k i n t e m p e r a t u r e o f t h e p e r f o r m a n c e h o r s e – S a n d i e C h a m b e r s
Table 5.0 Example of the average high/low/average temperatures for the temporal timings of the distal limbs
of a horse post leg wrap application.
Diablo Baseline Dorsal
Palmer Fore
Lft lat Fore
Lft med Fore
Rgt lat Hind
Rgt Med Hind
Dorsal Hind
Plantar Hind Mean
Max 17 19 22 18 21 19 18.5 18 153 19
Min 14 14 16 18 15 19 14 13 123 15
Average 15 16 18 18 18 19 16 16 136 17
Diablo 30 mins Dorsal
Palmer F
Lft lat F
Lft med F
Rgt lat H
Rgt Med H
Dorsal H
Plantar H Mean
Max 24 26 26 22 26 23 24 24 195 24
Min 18 20 22 22 23 23 19 19 166 21
Average 21 23 24 22 24.5 23 21.5 21.5 181 23
Diablo 60 min Dorsal Palmer F
Lft lat F
Lft med F
Rgt lat H
Rgt Med H
Dorsal H
Plantar H Mean
Max 26 28 28 24 27 24 25 25 207 26
Min 20 22 24 23 25 25 22 22 183 23
Average 23 25 26 23.5 26 24.5 23.5 23.5 195 24
Diablo 90 mins Dorsal
Palmer F
Lft lat F
Lft med F
Rgt lat H
Rgt Med H
Dorsal H
Plantar H Mean
Max 26 28 28 25 28 25 25 25 210 26
Min 21 23 24 24 25 25 22 22 186 23
Average 23.5 25.5 26 24.5 26.5 25 23.5 23.5 198 25
Diablo 120 mins Dorsal
Palmer F
Lft lat F
Lft med F
Rgt lat H
Rgt Med H
Dorsal H
Plantar H Mean
Max 26 28 27 25 27 25 24 25 207 26
Min 21 22 23 23 24 24 21 22 180 23
Average 23.5 25 25 24 25.5 24.5 22.5 23.5 194 24
Diablo 150 mins Dorsal
Palmer F
Lft lat F
Lft med F
Rgt lat H
Rgt Med H
Dorsal H
Plantar H Mean
Max 26 28 27 25 27 25 24 25 207 26
Min 21 23 23 23 24 24 22 22 182 23
Average 23.5 25.5 25 24 25.5 24.5 23 23.5 195 24
Diablo 180 Dorsal Palmer F
Lft lat F
Lft med F
Rgt lat H
Rgt Med H
Dorsal H
Plantar H Mean
Max 28.5 24.5 29.2 28 28.2 28 29.5 25.5 221 28
Min 23 17.5 23.1 28 20 28 24 19.5 183 23
Average 26.5 25 26.3 28 25 28 28 22.5 209 26
9 | T h e e f f e c t o f P r o t e c h m a s t a I n f r a r e d l e g w r a p s o n t h e s k i n t e m p e r a t u r e o f t h e p e r f o r m a n c e h o r s e – S a n d i e C h a m b e r s
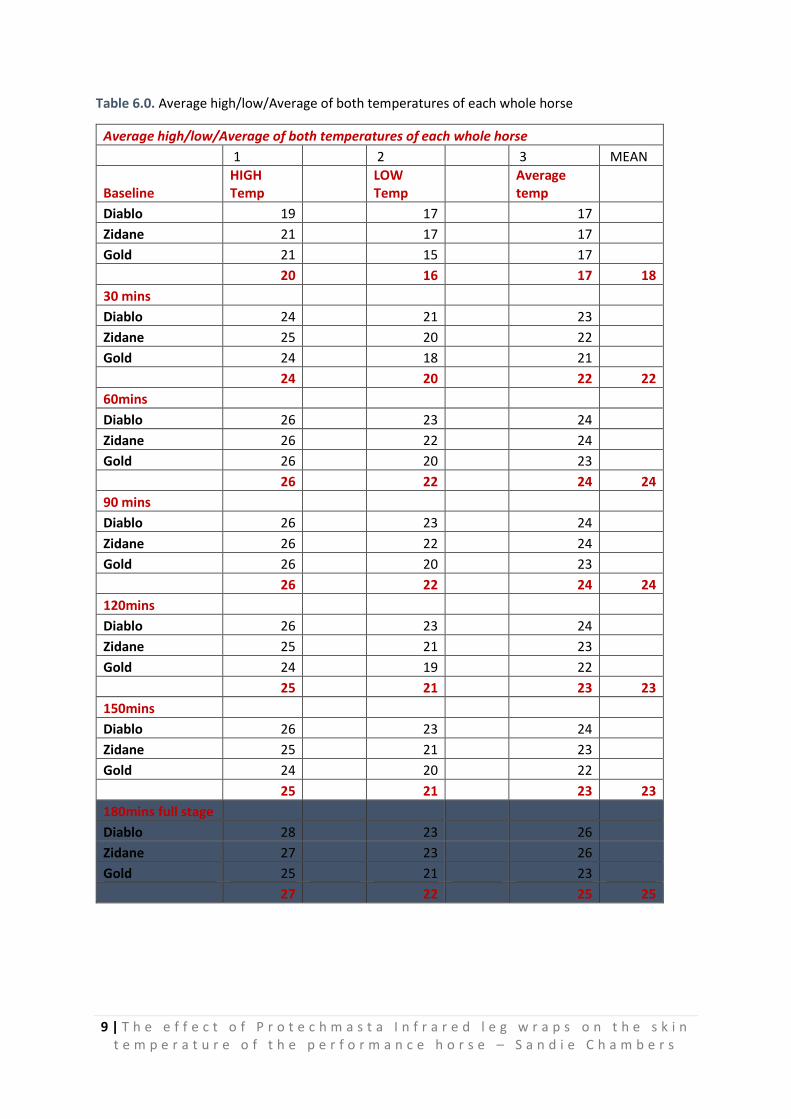
Table 6.0. Average high/low/Average of both temperatures of each whole horse
Average high/low/Average of both temperatures of each whole horse
1 2 3 MEAN
Baseline HIGH Temp
LOW Temp
Average temp
Diablo 19 17 17
Zidane 21 17 17
Gold 21 15 17
20 16 17 18
30 mins
Diablo 24 21 23
Zidane 25 20 22
Gold 24 18 21
24 20 22 22
60mins
Diablo 26 23 24
Zidane 26 22 24
Gold 26 20 23
26 22 24 24
90 mins
Diablo 26 23 24
Zidane 26 22 24
Gold 26 20 23
26 22 24 24
120mins
Diablo 26 23 24
Zidane 25 21 23
Gold 24 19 22
25 21 23 23
150mins
Diablo 26 23 24
Zidane 25 21 23
Gold 24 20 22
25 21 23 23
180mins full stage
Diablo 28 23 26
Zidane 27 23 26
Gold 25 21 23
27 22 25 25

10 | T h e e f f e c t o f P r o t e c h m a s t a I n f r a r e d l e g w r a p s o n t h e s k i n t e m p e r a t u r e o f t h e p e r f o r m a n c e h o r s e – S a n d i e C h a m b e r s
Results of Stage 1 and 3.
Column 3 Average Temperature
(Translated the average temperature represents the average of 3,000 pixel temperatures of each 8 anatomical
regions measured within the selected region within the Thermogram for each horse. This figure equates to
189,000 temperatures measured to achieve the overall average result).
• When comparing the MAST (mean average surface temperature) of the Baseline Average
Temperatures of the selected points for all horse’s distal limbs with the 30-minute temporal stage,
there was an initial increase of 4 degree Celsius - from 18ºC to 22ºC. Whilst it would be expected on
insulating the distal limb that the largest increase in limb temperature would occur in the initial
stages of the Protechmasta leg wraps application, an increase of 4ºC is a significant increase. It is the
largest increase in temperature recorded in any single 30-minute period in the study, but would be
expected as perfectly normal given that the air temperature around the limb has been retarded and
an insulating property has been applied restricting airflow to the skin.
• Between 30 minutes and up to 60 minutes the MAST for the average temperature of these temporal
stages increased by 2ºC, to reach 24ºC at the 60 - minute mark. This increase of 2ºC is not as
significant for this second 30-minute period as that recorded for the first 30-minute period, but in
combination means that the MAST of the study area has increased by an overall 6ºC between
baseline and 60 minutes.
• The MAST readings for the average temperature of all 3 of the horses in the study plateaued and
remained the same at the 60 and 90-minute temporal stage.
• The significant readings at 60 minutes and 90 minutes were that all 3 horse’s highest temperature
readings all reached the same temperature of 26ºC at 60 minutes and remained there until 90
minutes.
• Diablo's highest, lowest and mean temperature readings at 120 and 150 minutes remained at the
same temperatures of 26ºC, 23ºC and 24ºC. This means that once the 60-minute mark had been
reached Diablo's distal limb temperature points in his highest, lowest and mean temperatures stayed
the same throughout the study. The other 2 horses, Zidane and Gold, remained consistent but did
exhibit a 1 degree drop in Limb temperature at the 120 and 150 minute marks.
• The MAST readings for the average temperature of all 3 horse’s readings at the 120 and 150-minute
mark show a drop-in temperature of 1ºC. The MAST readings for the average temperature for all 3
horses at 60 and 90 minutes were 24ºC, but for the 120 and 150 minute readings they dropped by
1ºC to 23ºC.
Column 1. Highest Temperature.
• Of the three horses in the study all three saw an increase in their mean average highest temperature
point of between 4 and 5 degrees from baseline to 30 minutes and a total of 5 and 7 degrees from
baseline to 60 minutes.
• The only decreases in average highest temperature were recorded in two horses at 120 and 150
minutes and these decreases were of 1 and 2 degrees.

11 | T h e e f f e c t o f P r o t e c h m a s t a I n f r a r e d l e g w r a p s o n t h e s k i n t e m p e r a t u r e o f t h e p e r f o r m a n c e h o r s e – S a n d i e C h a m b e r s
Column 2. Lowest Temperature.
• Of the three horses in the study all three saw an increase in their mean average lowest temperature
point of between 3 and 5 degrees from baseline to 30 minutes and a total of 5 and 7 degrees from
baseline to 60 minutes.
• Of the three horses the lowest mean average temperature plateaued at its highest MAST
temperature point between 60 and 90 minutes.
• Two of the horses saw a decrease of 1 degree in their lowest mean temperature point from 120 to
150 minute, while one stayed the same from 60 minutes to 150.
The 180 Full application
For the sake of this study we did a separate full 180-minute application to all the horses without removal of
the leg wraps at 30-minute temporal stages.
• Of the three horse the highest MAST reached at the 180-minute stage was 27 ºC this is 7 ºC higher
than the baseline highest MAST
• Of the three horse the lowest MAST reached at the 180-minute stage was 22 ºC this 6 ºC higher than
the baselines MAST.
Between the 150-minute stage and the 180-minute stage there was an overall 2 ºC increase in the overall
MAST of the three subjects, however there was an overall 7 ºC increase from Baseline to 180 minutes.
Points to note:
It is not possible to get all the horses at the exact starting point temperature for several factors these are due
to the following:
• Level of activity while tied up.
• Level of musculature
• Adipose fat levels
• Bone size
Results of stage 2.
• When comparing the MAST (mean average surface temperature) of the leg wraps Baselines Exterior
temperatures with the exterior temperature at the 30-150-minute temporal stage, there was no increase in
MAST across all leg wraps therefore maintaining an Exterior temperature of 15 ºC.
• When comparing the MAST of the Baselines Interior temperatures with the interior temperatures of
the 30-minute temporal stage, there was an initial increase of 2.25 ºC across all leg wraps.
• When comparing the MAST temporal stages of the internal portion of the leg wraps between 30 & 60,
there was an overall rise of 1 degree for all three horses and stabilising up to 120, then we see a drop of 1
degree for all three horses up to the 150 temporal stage.
The independent 180 minutes’ stage saw a 1 degree increase in the internal portion of the Leg wraps MAST
across all three horses. (see table 6.0).

12 | T h e e f f e c t o f P r o t e c h m a s t a I n f r a r e d l e g w r a p s o n t h e s k i n t e m p e r a t u r e o f t h e p e r f o r m a n c e h o r s e – S a n d i e C h a m b e r s
Table 6.0
Protechmasta IR Leg wrap Results
Dorsal Palmer Lateral Medial 4 MAST Mast whole Wrap
Baseline
Exterior 15 15 15 15 60 15
15 Interior 15 15 15 15 60 15
30 mins
Exterior 15 15 15 15 60 15
16 Interior 17 17 17 18 69 17.25
60 mins
Exterior 15 15 15 15 60 15
16 Interior 18 18 18 19 73 18.25
90 mins
Exterior 15 15 15 15 60 15
16 Interior 18 18 18 19 73 18.25
120mins
Exterior 15 15 15 15 60 15
16 Interior 17 17 17 18 69 17.25
150 mins
Exterior 15 15 15 15 60 15
16 Interior 17 17 17 18 69 17.25
180 mins
Exterior 15 15 15 15 60 15
16 Interior 18 18 18 19 73 18.25
Total Collective MAST
Total MAST of all 4 Leg Wraps 16 Exterior 15
Interior 17
Total MAST 16


14 | T h e e f f e c t o f P r o t e c h m a s t a I n f r a r e d l e g w r a p s o n t h e s k i n t e m p e r a t u r e o f t h e p e r f o r m a n c e h o r s e – S a n d i e C h a m b e r s
Horses distal limbs did not just increase in temperature but also decreased in temperature which indicates the
leg wraps ability to absorb heat and emit heat allowing a more stable and regulated temperature effect,
therefore preventing the horse’s legs from heating up beyond that of a safe level.


![Flexor Tendon Injuries[1]](https://img.pdfslide.net/doc/110x75/546eeaf2b4af9f8c068b465a/flexor-tendon-injuries1-558457890f347.jpg)