Embed Size (px)
Citation preview

THE EFFECTS OF THEMATIC VERSUS TAXONOMIC CATEGORIZATION ON CHOICE
OVERLOAD WHEN CHOOSING UNIVERSITY CLASSES
BY
JOSEPH TEK YUN
THESIS
Submitted in partial fulfillment of the requirements for the degree of Master of Science in Advertising
in the Graduate College of the University of Illinois at Urbana-Champaign, 2014
Urbana, Illinois
Adviser: Assistant Professor Brittany Duff

ii
Abstract
The problem of “having too much choice” within our everyday lives is magnified in
online environments. This study looked at the effects of thematic categorization on the problem
of choice overload by categorizing an undergraduate course catalog either by taxonomic
categorization, thematic categorization, or no categorization. Surprisingly the three different
types of categorization did not affect choice overload measures. Theoretical and practical
implications are discussed.

iii
Table of Contents List of Tables .................................................................................................................................. iv1. Introduction ................................................................................................................................. 1
1.1. Literature Review ................................................................................................................. 2 1.1.1. The Choice Overload Effect .......................................................................................... 2 1.1.2. Factors of Choice Overload ........................................................................................... 6
1.1.2.1. Familiarity .............................................................................................................. 7 1.1.2.2. Decision for Self versus Others ............................................................................. 9 1.1.2.3. Time Given to Make a Decision ............................................................................ 9 1.1.2.4. Categorization ...................................................................................................... 10
1.1.3. Definition of Thematic and Taxonomic Categorization ............................................. 14 1.1.4. Utilizing a Course Catalog to Analyze Choice Overload Effects .............................. 15
2. Method ....................................................................................................................................... 22 2.1. Pre-Test ............................................................................................................................... 22 2.2. Participants ......................................................................................................................... 24 2.3. Design ................................................................................................................................. 25 2.4. Stimuli ................................................................................................................................ 25 2.5. Measures ............................................................................................................................. 26 2.6. Procedure ............................................................................................................................ 27 2.7. Analysis .............................................................................................................................. 28
3. Results ....................................................................................................................................... 29 3.1. Power Analysis ................................................................................................................... 29 3.2. Mere Categorization Testing .............................................................................................. 29 3.3. Thematic versus Taxonomic Testing ................................................................................. 32 3.4. Thematic versus Taxonomic versus No Category Testing ................................................ 35
4. Discussion .................................................................................................................................. 39 4.1. General Discussion ............................................................................................................. 39
4.1.1. Lack of Expected Mere Categorization Effects ....................................................... 39 4.1.2. Lack of Expected Categorization Effects on Perceived Similarity ........................ 39 4.1.3. Lack of Expected Categorization Effects on Choice Overload .............................. 40 4.1.4. Lack of Expected All Categorization Effects on Choice Overload ........................ 41 4.1.5. Familiarity Effect on Satisfaction with Choice and Familiarity with the Course Catalog Format ................................................................................................................. 42 4.1.6. Contributions to Testing Choice Overload ............................................................. 43
4.2. Future Research .................................................................................................................. 45 4.3. Limitations .......................................................................................................................... 46 4.4. Final Remarks ..................................................................................................................... 48
References ..................................................................................................................................... 50Tables ............................................................................................................................................. 54Appendix A: Three Course Catalog Sites ...................................................................................... 58 Appendix B: Choice Overload Questionnaire .............................................................................. 61 Appendix C: Mogilner, Rudnick, and Iyenger’s (2008) Coffee Study Stimuli ............................ 63

iv
List of Tables Table 1: Categorization Effects of Choice Overload .................................................................... 54 Table 2: Familiarity as Covariate and Choice Overload .............................................................. 55 Table 3: Planned Contrasts for Mere Categorization Testing of Choice Overload ...................... 56 Table 4: Planned Contrasts for Type of Categorization (Taxonomic versus Thematic) Testing of Choice Overload ........................................................................................................................... 57

1
1. Introduction
A phrase that might be heard on a college campus during class registration period is,
“Hey! What class are you going to take?” For individuals that have gone through selecting
elective courses during undergraduate studies, many have most likely experienced the dilemma
of how to figure out what elective courses to take. Although most course catalog systems at
higher education institutions are readily available online to facilitate class selection, the sheer
number of classes available at most colleges makes it a formidable task to filter through these
listings. As an example of how large this choice set can get, for a spring 2014 course catalog
listing at the University of Illinois at Urbana/Champaign, there were over 4,900 classes listed to
choose from.
A substantial body of literature looks at the effects of having large sets to choose from
and how this affects the choice process for individuals. This body of literature includes the
effects of categorization (Mogilner, Rudnick, & Iyengar, 2008) as well as types of categorization
(Poynor & Diehl, 2007) on choice overload. Many studies have looked at the effects of reducing
the amount of choice available, but this study is one of the few that looked at the situation in
which one cannot reduce the amount of choice in a set. This study utilized the environment of a
university course catalog in which students choose elective courses from. This is an environment
in which classes cannot be removed, thus this study investigated means of reducing choice
overload without reducing the amount of choice. This study aimed to build on top of Poynor and
Diehl’s (2007) study that found that categorizing assortments thematically rather than
taxonomically created a greater perception of similarity between choices within the assortment.
Poynor Lamberton and Diehl (2013) suggested that future research should be conducted to test
whether these categorization effects on perceived similarity could reduce choice overload. This

2
study thus built on prior studies and tested Poynor Lamberton and Diehl’s (2013) suggestion of
future research. Additionally, Mogilner, Rudnick, and Iyengar (2008) found that merely
categorizing a large choice set without reducing the amount of choice reduced choice overload.
This study built on their research as well as I tested to see if mere categorization effects hold true
over multi-layered online environments of choice such as a course catalog system.
1.1. Literature Review
1.1.1. The Choice Overload Effect
The potential problems of the growing amount of information and options to parse
through is identified in literature and studies utilizing various terms such as information overload
(Beaudoin, 2008; Hiltz & Turoff, 1985), information load (Malhotra, 1982), the problem of too
much choice (Scheibehenne, Greifeneder, & Todd, 2009), or the tyranny of choice (Chok &
Brozyna, 2011; Fasolo, McClelland, & Todd, 2007). This study utilizes the phrase “choice
overload” as mentioned in much consumer research literature, which states, “although the
provision of extensive choices may sometimes still be seen as initially desirable, it may also
prove unexpectedly demotivating in the end” (Iyengar & Lepper, 2000, p. 996). Iyengar and
Lepper (2000) found that when consumers shopping in a grocery store were presented with the
ability to sample jams from a booth containing six varieties versus another booth containing
twenty-four varieties, although 60% of the consumers who sampled jam stopped at the high
variety booth versus 40% stopping at the low variety booth, only 3% who sampled the high
variety booth jams purchased jam versus 30% of those who sampled from the low variety booth.
Interestingly, we can see from the results of their study that consumers seemed to prefer the
allure of a large assortment size, but were less motivated to purchase when choosing from a large

3
assortment. This effect was tested again by Iyengar and Lepper (2000) in further lab studies
where participants were randomly assigned to a large choice set of thirty Godiva chocolates, a
small choice set of six chocolates, or a condition upon which a choice was made for them, and
the participants with the larger choice set rated their satisfaction with their final choice as lower.
The participants that were given no choice (a choice was made for them) rated their satisfaction
with their choice lower than both the large and small choice set. Ratings of frustration with the
choice process and difficulty of the choice process were also higher in the larger choice set
compared to the smaller, but interestingly a rating of enjoyment of the choice process was higher
in the larger choice set compared to the smaller choice set. This measure of enjoyment with the
choice process was clearly a result that seems to conflict with the other measures. The
researchers explain though that participants may be allured by the opportunity of more choice
and may be excited for the opportunity of having more choice, but they may also feel much more
responsible for their choices in the larger choice set, and this may result in frustration with the
process, difficulty with the process, and lower satisfaction with their final choice. Although this
explanation does have merit, it should be noted though that there is the potential for conflicting
results with regards to measuring various affect measures for the process of choosing. Overall
though, these studies show that there is a threshold upon which giving consumers more choice
actually lessens their ability to easily choose, lowers their satisfaction with a choice, and
produces more frustration with the choice process.
Subsequent research tested whether prior preferences affected choice situations (Chernev,
2003). Participants were given either a condition where they were presented with four chocolates
or sixteen chocolates. Participants were randomly put into either a treatment group in which they
were asked to articulate ideal chocolate preferences (referred to as an articulated ideal point) or

4
were not asked to articulate any preferences. For their manipulation, the attributes of chocolates
that made up an ideal point were the chocolate type, cocoa content, flavor, and nut content. Their
hypothesis was that for participants that were asked to articulate an ideal point, the impact of
choice overload effects would be moderated. At the end of the experiments, participants were
allowed to either choose a small box containing two chocolates identical to the ones they chose
during the experiment, or to choose a box of two of the most popular chocolates from a popular
chocolate brand, Godiva. Choice overload was assessed via whether participants switched from
their choice of chocolate from the experiment to the popular choice of chocolates presented at
the end of the experiment, thus indicating their overall displeasure towards their chocolate choice
made during the experiment. When participants were not forced to articulate an ideal point, 9%
of participants in the four chocolate condition switched at the end of the experiment to the
popular brand of chocolates versus 38% of participants in the sixteen chocolate condition. Thus,
presenting more options in this case seemed to cause less satisfaction towards chocolates that
were chosen in the larger assortment size condition for participants without an articulated ideal
point. For participants that did articulate an ideal point, no choice overload effects were found.
The study explains that having to form an ideal point while simultaneously searching for a
preferred choice makes choosing much more difficult, and having an ideal point simplifies
choice. It should be noted that the utilization of “switching behavior” at the end of the
experiment as a measure of choice overload may introduce additional variables that may actually
not be measuring choice overload, such as whether or not the “popular choice” of chocolates at
the end of the experiment was indeed popular or even well known by the participants, as well as
the potential for other motivators for why participants decided to switch to a different type of
chocolate. Overall though for participants without articulated ideal points, a smaller choice set

5
was connected to a greater desire to retain their chosen chocolate, and thus contributes to the
potential of a certain threshold upon which choice becomes negatively affected by a growing
assortment size. Thus, choice overload effects were confirmed.
A more recent study also found choice overload effects in a study where they asked
participants to choose a camcorder for a co-worker who had pre-defined preferences, and those
preferences were scaled across four attributes (weight, resolution, memory, and zoom) (Diehl &
Poynor, 2010). Participants were randomly assigned to treatment conditions, and participants in
the limited choice condition were given a catalog of eight camcorder options while the
participants in the extensive choice condition were given a catalog of thirty-two camcorder
options. Once again, results sided towards the existence of choice overload as subjective ratings
of choice overload were significantly higher for the participants with catalogs that had thirty-two
camcorder options versus the participants that had eight. Additionally, participants were less
satisfied with their choice when choosing from thirty-two camcorder options versus participants
choosing from eight. The researchers argue that choice overload occurs due to larger choice sets
causing individuals to have higher expectations with regards to finding a good choice; whether or
not individuals find an acceptable choice in the larger choice set, their higher expectations cause
them to be less satisfied than those with a smaller choice set. As a whole, these studies along
with numerous additional studies have confirmed the existence of choice overload when larger
assortment sizes degraded peoples’ ability to choose, and produced negative effects with regards
to the process of choosing (Chok & Brozyna, 2011; Iyengar, Wells, & Schwartz, 2006; Johns,
Edwards, & Hartwell, 2013; Sellier, & Dahl, 2011; Wise, & Pepple, 2008).
Although various researchers have identified choice overload effects in their studies,
Scheibehenne, Greifeneder, and Todd (2010) conducted a meta-analysis of sixty-three conditions

6
from fifty published and unpublished experiments (N=5,036) and found a mean effect size across
all studies of almost zero, but this was with substantial variance between the studies within the
meta-analysis. This has brought much focus on whether or not choice overload effects indeed
exist. Chernev, Bockenholt, and Goodman (2010) responded to this meta-analysis identifying
flaws in Scheibehenne, Greifeneder, and Todd’s (2010) argumentation and methods, such as
their oversight as to many of the studies purposely creating conditions upon which they were
attempting to reverse the choice overload effect compared to a condition exhibiting choice
overload effects, and thus simply averaging data points would cause, not surprisingly, an effect
of zero within those studies. Additionally, Chernev, Bockenholt, and Goodman (2010) state,
“Analysis will benefit more from a focus on identifying conditions in which choice overload is
likely to occur rather than simply on whether it occurs across all conditions” (p. 428).
1.1.2. Factors of Choice Overload
Various factors have been identified and tested in this problem of too much choice. As
mentioned, previous research has shown that varying assortment size was a moderator of choice
overload (Chernev, 2003; Diehl & Poynor, 2010; Iyengar & Lepper, 2000). In addition to the
moderator of assortment size, additional moderators include familiarity (Haynes, 2009; Iyengar
& Lepper, 2000), making a decision for self versus others (Polman, 2012), time pressure
(Haynes, 2009), and categorization (Mogilner, Rudnick, & Iyengar, 2008).
7
1.1.2.1. Familiarity
Although not always necessarily explicitly pointed out and mentioned in past research
studies, the factor of familiarity was addressed in various ways throughout many studies. Iyengar
and Lepper (2000) controlled for familiarity by choosing a category in which most consumers
would be familiar with, but not highly familiar with the product of choice. They state, “careful
attention was given to selecting a product with which most consumers would be familiar, yet not
so familiar that preferences would already be firmly established” (p. 997). Thus it seems that the
study used a product that was in the range of somewhere between low to moderate familiarity,
and choice overload effects were found to exist in this state.
Haynes (2009) tested undergraduate students with an assortment that contained drawings
for prizes of which they would most likely be unfamiliar with, such as a massage treatment at a
spa or a hot air balloon ride, thus making sure familiarity was at a low level throughout the study.
Although their main study was measuring how decision time interacts with assortment size with
regards to choice overload, they believed that utilizing unfamiliar options would make
processing information more complex. They found that decision time did affect certain measures
of choice overload, but once again the assumption of this study was that unfamiliar choices were
necessary to measure choice overload. Thus it seems to be assumed that having a low level of
familiarity may be necessary for choice overload to occur.
Inbar, Botti, and Hanko (2011) factored in prior preferences in a choice overload study in
which they utilized stimuli (DVDs) that was only recently released on Amazon.com. Although
the study’s main manipulation was the effects of feeling rushed while making a choice between
and large choice set of forty-five DVDs versus a small choice set of fifteen DVDs, and
subsequent choice overload effects (participants feeling rushed exhibited choice overload, but

8
not feeling rushed did not exhibit choice overload), the study controlled for prior preferences by
choosing only DVDs recently released on Amazon.com. Although they did not specifically
mention familiarity, controlling for prior preferences by utilizing newly released DVDs seems to
be highly related to the concept of attempting to create a set of unfamiliar choices. It should be
noted though that just because a DVD is newly released on Amazon.com, there is the potential
that individuals would still recognize the movie title due to the normal process of movies first
being released in public theaters and then being released to DVD. In a previous study, choice
overload effects were found utilizing stimuli that potentially were highly familiar to the
participants, namely “a group of popular DVDs arranged on a table in front of them (examples
include “Crash,” “Brokeback Mountain,” “The Matrix,” and “The Breakfast Club”)” (p. 2). They
found that measures of regret were higher for those put in a large set condition of thirty DVDs
versus those that were put into a small set condition of five DVDs, as well as participants felt
more rushed in the large set condition versus the small set condition. Although familiarity was
not specifically measured, these results are notable due to the potential for the stimuli to be
highly familiar, and this study still exhibiting potential choice overload effects.
Scheibehenne, Greifeneder, and Todd (2010) write in their meta-analysis of choice
overload studies, “experiments on choice overload have typically used options that decision
makers are not very familiar with to prevent strong prior preferences for a specific option and
consequently a highly selective search process that would allow participants to ignore most of
the assortment.” (p. 410) Aggregating this past research, low familiarity seems to be assumed as
a necessary pre-condition for the exhibition of choice overload effects, but there were mixed
results, with some choice overload effects even in conditions of potential high familiarity (Inbar,
Botti, & Hanko, 2011).

9
1.1.2.2. Decision for Self versus Others
More recent research proposed that individuals that are making a decision for their own
selves are in a prevention focus, while individuals making decisions for others are in a promotion
focus (Polman, 2012). This research showed that choice overload occurs for those making
decisions for themselves, but the effect was reversed for those making decisions for others.
Customers at two wine stores were surveyed with two questions that were counterbalanced. The
first question was whether they were buying wine for themselves or for someone else, and the
second was a question on how satisfied they were with their purchase. Results showed that
customers who purchased wine for themselves experienced more satisfaction when shopping at
the smaller store versus the larger store, however when customers were purchasing wine for
others, customers experienced more satisfaction when shopping at the larger store versus the
smaller store. The study explains that this difference is due to participants who choose for others
as being in a promotion focus condition, thus desiring to reduce errors of omission. For
participants that chose for themselves, they were explained to most likely be in a prevention
focus, thus desiring to reduce errors of commission. These findings seem to contradict Diehl and
Poynor’s (2010) study of which participants were asked to choose a camcorder for their co-
workers. The study found choice overload effects for larger choice sets compared to smaller
choice sets when choosing for another individual. Interestingly neither study controlled for
familiarity, which may have factored into the contradicting results.
1.1.2.3. Time Given to Make a Decision
Recent research has shown that time given to make a decision interacts with assortment
size with regards to measures of choice overload (Haynes, 2009). This study looked at

10
assortment size (ten vs. three prize options) and decision time (five vs. two minutes).
Undergraduates were randomly assigned to conditions, and were asked to make a choice to be
entered into a drawing for one of many prizes worth $100; it was assumed that each prize was
something that an undergraduate student would not normally be familiar with having to decide
on (a hot air balloon ride, a limousine ride with VIP passes to a night club, a party in a luxury
suite hotel, etc.). Participants were found to have more frustration with choosing and less
satisfaction with their final choice when choosing from the large assortment size versus the
smaller assortment size, thus exhibiting the same choice overload effects from assortment size
changes as I have previously mentioned. With regards to the main effect of time given to make a
decision, participant satisfaction with choice was significantly lower when they were given less
time to make a decision. Interestingly though, there was no interaction effect for satisfaction with
choice between assortment size and time given to make a decision. The study attributes the
occurrence of choice overload to the increased complexity of the decision that comes from
having a larger assortment set, as well not having enough time required to utilize choice
elimination heuristics to simplify the decision. Thus we note that giving participants enough time
to make a decision seems to be necessary for the reduction of choice overload.
1.1.2.4. Categorization
Mogilner, Rudnick, and Iyengar (2008) found that “mere categorization” (the mere
presence of any sort of categorization) acted as a moderator of choice overload. Participants were
approached within a food court of a local university, and were given menus with a listing of fifty
gourmet coffees. Four versions of the menus were made available of which the first had no
categories and all fifty coffees were listed in no specific order, the second split the fifty coffees

11
into ten categories that were informative (complex, spicy, dark roast, mild, etc.), the third split
the fifty coffees into ten categories that were somewhat informative (the hut, the coffee house,
Lola’s, etc.), and the fourth split the fifty coffees into ten categories that were completely
uninformative (category a, category b, category c, etc.). Their results showed that chooser
satisfaction for preference-constructing participants (participants that did not identify themselves
as frequent coffee drinkers or having expertise in selecting coffees) that were given the menu
with no categories was significantly lower than the preference-constructing participants that
received the menus with informative, somewhat informative, and uninformative categories.
Notably, the three categories did not significantly differ from one another. Thus for preference
constructors, the mere presence of any categorization helped reduce choice overload. They
explained that this could be due to categories helping choosers discern differences in large choice
sets while still allowing them to perceive variety. For preference matching participants
(participants that did identify themselves as frequent coffee drinkers or having expertise in
selecting coffees), the mere presence of categories did not affect satisfaction with choice.
Although they did not specifically speak of familiarity, if preference constructing and matching
were measured by whether or not participants were frequent coffee drinkers and/or whether or
not they had expertise in the realm of selecting coffees, it seems logical to believe that preference
constructors are generally unfamiliar with choosing coffee, and preference matchers are
generally familiar with choosing coffee. Thus, it seems that for participants that had a low level
of familiarity with choosing coffee, mere categorization (of any type) heightened satisfaction,
whereas for those highly familiar with choosing coffee, no change in satisfaction with choice
was found between categorizing and not categorizing. It should be noted that the various menus
looked quite different visually, and thus this could have contributed as a factor within the study.

12
Overall, in a condition of low familiarity, categorization of any sort should help reduce the
impact of choice overload.
Past research has shown that organizing assortments differently has affected perceived
variety of the assortment (Hoch, Bradlow, & Wansink, 1999). Poynor and Diehl (2007) looked at
the differences between structuring categories based on thematic versus taxonomic
categorization. They stated that thematic categories are “formed in terms of higher-level,
generally abstract connections among items” (p. 53). They posited that due to thematic
categorization’s higher relational processing when compared to taxonomic categorization,
individuals would perceive heightened similarity between items presented within a thematic
category versus a taxonomic category. They defined thematic categorization as, “thematic
groupings are formed in terms of higher-level, generally abstract connections among items” (p.
53), and taxonomic categorization as, “taxonomic categories, by contrast, present items in highly
intuitive groups” (p. 53). They conducted a study in which New Age drinks were selected as the
stimuli and sixteen drinks were categorized either taxonomically by four brands (Sobe, Tazo,
Arizona, and Vitamin Water) or thematically by four thematic categories (Tension Tamers, Brain
Boosters, All-Day Stamina, and Wake-Me Ups). Participants (undergraduate business students)
were randomly assigned to the thematic category condition or the taxonomic category condition,
and for the first week all participants filled out a survey to establish baseline brand strength
amongst other measures. Starting from the subsequent week, participants (undergraduate
business students) visited the lab once a week for four weeks to choose a drink from their
assigned category condition. Amongst various measures taken, participants were asked to
allocate points to each of the brands “by assigning a total of 100 points across the four brands, in
a manner similar to that described in Kahn, Moore, and Glazer (1987)” (p. 62). They stated that

13
if participants perceived brands to be more similar, they would distribute points more evenly
across the four brands, resulting in low variance. When analyzing point allocation variance, their
results showed that the categorization of thematic versus taxonomic had significant effects
towards perceived similarity in which thematic categorization produced more perceived
similarity (less point allocation variance) versus taxonomic categorization (greater point
allocation variance). Additionally, this did not significantly change over the course of the four
weeks, and there was no interaction between category structure and time. They mentioned a
potential connection with choice overload in stating, “some consumers may fear that choosing
from high-variety assortments will be overwhelming (Chernev, 2006). For these consumers, a
decrease in perceived variety caused by the thematic structures could actually make a
thematically-structured assortment more attractive than a taxonomically organized set” (p. 66).
An important note about these results is that the researchers believed these New Age drinks were
an unfamiliar arena of choice for the participants, stating, “Though, of the general population,
this age group does consume energy drinks in general more often than others, use of these
particular products in the general market is still not extremely widespread. Therefore, the
stimulus set allows us to analyze changes in brand strength for a relatively unfamiliar but highly
competitive, emerging product category” (Poynor & Diehl, 2007, p. 61). In testing for familiarity
with this product category, they did indeed confirm that the product category was unfamiliar to
participants. Thus, their results were achieved testing participants that were generally unfamiliar
with the choice domain from which they were choosing.
More recent research identified a similar effect with regards to perceived similarity, but
this time according to benefit-based assortment organization versus attribute-based assortment
organization (Poynor Lamberton & Diehl, 2013). The study identified that perceived similarity

14
between assortments categorized according to product benefits would be higher when compared
to the same assortments categorized according to product attributes. Implications to choice
overload can be made from this study as the study states, “For these consumers, an increase in
perceived similarity could actually increase the attractiveness of benefit-based over attribute-
based organizations” (Poynor Lamberton & Diehl, 2013, p. 405).
1.1.3. Definition of Thematic and Taxonomic Categorization
While utilizing taxonomies or themes could prove to be potentially important ways of
categorizing, one challenge with utilizing thematic or taxonomic categorization is getting
clarification for the definitions in the previously mentioned research study (Poynor & Diehl,
2007). Poynor and Diehl (2007) somewhat defined thematic categorization as, “thematic
groupings are formed in terms of higher-level, generally abstract connections among items” (p.
53), and taxonomic categorization as, “taxonomic categories, by contrast, present items in highly
intuitive groups” (p. 53). Utilizing the taxonomic definition as an example, this would require all
participants to consider brand names of energy drinks as highly intuitive groups. These
definitions seem to have a high potential to cause confusion, thus more extensively defining
taxonomic and thematic as terms is important before using these constructs in testing.
Lin and Murphy (2001) defined a taxonomic category as “a hierarchical system in which
concepts are differentiated into levels of varying specificity (e.g., animal, dog, collie) related by
class inclusion” (p. 3), as well as a thematic category as “the external or complementary relations
among objects, events, people, and other entities that co-occur or interact together in space and
time” (p. 3). Estes, Golonka, and Jones (2011) write in line with this class concept of taxonomic
categorization as they state that taxonomic relations allow people to treat non-identical items as

15
similar, thus enabling people to interact with certain objects like bananas and apples as similar
within taxonomic relations to one another, through taxonomic categories such as food or fruits.
Taxonomic categorization thus has to do with internal characteristics within a single entity
providing a common category based on those internal shared characteristics, such as a cat having
whiskers, a tail, and two pointed ears. On the other hand, Estes, Golonka, and Jones (2011) also
write in line with Lin and Murphy’s (2001) complementary relations concept of thematic
relations by explaining that things are related thematically if they play a complementary role in
the same event or same scenario, such as cows and milk playing a role within a production
theme. Thus, thematic categorization has to do with external relations that occur across various
objects, events, concepts, or even people, such as a restaurant theme of a waiter, plate, and bill.
Therefore, thematic relations must occur between two or more things, as well as well as they
must fulfill differing roles within their theme. Estes, Golonka, and Jones (2011) write, “Among
the most typical thematic relations are spatial (e.g., JUNGLE and BIRD), temporal (e.g.,
SUMMER and HOLIDAY), causal (e.g., WIND and EROSION), functional (e.g., FORK and
KNIFE), possessive (e.g., POLICE and BADGE), and productive relations (e.g., COW and
MILK)” (p. 252). A course catalog contains a choice set of numerous classes, and classes are
meant to teach students skills and knowledge to help them accomplish their educational goals.
Utilizing functionally thematic categories to organize courses fits nicely with the purpose of
educational courses as students can utilize the knowledge learned in courses to functionally
achieve their goals.
1.1.4. Utilizing a Course Catalog to Analyze Choice Overload Effects
As mentioned in the introduction, utilizing a university course catalog system filled with
real class data to test choice overload seems to be an ideal place to test for choice overload

16
effects, especially due to the fact that it is a highly naturalistic environment, it is an environment
with a high probability that an individual is choosing classes for themselves (Polman, 2012), and
is a natural environment where time given to make a decision is as long as a participant may
desire to have (Haynes, 2009). A course catalog is also an interesting arena in which to test
choice overload since what constitutes a large choice set for a course catalog is far greater than
any of the aforementioned studies. In the case of this study’s course catalog, the amount of
classes available to choose from was greater than three hundred and fifty classes. As mentioned
previously, most choice overload studies have looked at situations in which removing choice
helped reduce choice overload, but this is a case where choice (university courses) cannot be
removed, thus other manipulations are needed to attempt to reduce choice overload.
Mogilner, Rudnick, and Iyengar (2008) found that merely categorizing a large choice set
without reducing the amount of choice reduced choice overload. Their manipulation though was
on single sheet menus of coffee, while this study tested whether or not mere categorization still
holds true on a multi-tier course catalog site, thus furthering research in this area. This is
potentially important since most online environments of choice have multiple layers of
navigation with regards to choice rather than a single page of options. Additionally, Poynor
Lamberton and Diehl (2013) suggested that future research should be conducted to test whether
categorization effects on perceived similarity could reduce choice overload. This study also
followed their suggestion to test whether or not thematically categorizing a course catalog could
reduce choice overload, thus furthering choice overload research in this way as well.
Research has shown that low familiarity of choice sets is potentially a necessary pre-
condition for choice overload effects to be experienced (Chernev, 2003; Iyengar && Lepper,
2000; Mogilner, Rudnick, & Lepper, 2008). Considering categorization in line with Mogilner,

17
Rudnick, and Iyenger’s (2008) study, it is expected that if familiarity is controlled for,
categorizing course catalog classes will cause less choice overload than when classes are not
categorized at all.
Hypothesis 1a: There should be a relationship between mere categorization and
frustration, controlling for familiarity. People should indicate more frustration when
choosing from uncategorized courses than from categorized courses.
Hypothesis 1b: There is a relationship between mere categorization and ease of choosing,
controlling for familiarity. People should indicate less ease when choosing from
uncategorized courses than from categorized courses.
Hypothesis 1c: There is a relationship between mere categorization and satisfaction,
controlling for familiarity. People should indicate less satisfaction when choosing from
uncategorized courses than from categorized courses.
Hypothesis 1d: There is a relationship between mere categorization and likelihood to
register, controlling for familiarity. People should indicate a lower likelihood to register
for their chosen courses when choosing from uncategorized courses than from
categorized courses.
Research has found that a specialized categorization type of thematically-based
categorization increased ratings of perceived similarity compared to taxonomic categorization for

18
those that were unfamiliar with the choice set presented to them (Poynor & Diehl, 2007). Thus it
is expected that when controlling for familiarity, participants will perceive classes to be more
similar to each other when browsing a course catalog that is categorized thematically compared
to participants that browse a course catalog that is categorized taxonomically.
Hypothesis 2: There should be a relationship between type of categorization (thematic vs.
taxonomic) and perceived similarity between courses, controlling for familiarity. People
should indicate less perceived similarity between courses when choosing from
taxonomically categorized courses than from thematically categorized courses.
Mogilner, Rudnick, and Iyengar (2008) found that between different categorization
schemes (informative, somewhat informative, and completely uninformative categorization
structures), there was no effects of choice overload, thus potentially pointing to types of
categorization as not being a moderator of choice overload effects. Other research though has
identified a specialized categorization type of thematically-based categorization increased ratings
of perceived similarity compared to taxonomic categorization for those that were unfamiliar with
the choice domain (Poynor & Diehl, 2007). Poynor Lamberton and Diehl (2013) stated that
perceived similarity might potentially moderate the effects of choice overload. Thus, it is
hypothesized that if familiarity is controlled for, participants will experience less choice overload
when browsing classes that are categorized thematically compared to participants that browse
classes that are categorized taxonomically.

19
Hypothesis 3a: There should be a relationship between type of categorization (thematic
vs. taxonomic) and frustration, controlling for familiarity. People should indicate more
frustration when choosing from taxonomically categorized courses than from
thematically categorized courses.
Hypothesis 3b: There should be a relationship between type of categorization (thematic
vs. taxonomic) and ease of choosing, controlling for familiarity. People should indicate
less ease when choosing from taxonomically categorized courses than from thematically
categorized courses.
Hypothesis 3c: There should be a relationship between type of categorization (thematic
vs. taxonomic) and satisfaction, controlling for familiarity. People should indicate less
satisfaction when choosing from taxonomically categorized courses than from
thematically categorized courses.
Hypothesis 3d: There should be a relationship between type of categorization (thematic
vs. taxonomic) and likelihood to register, controlling for familiarity. People should
indicate a lower likelihood to register for their chosen courses when choosing from
taxonomically categorized courses than from thematically categorized courses.
Synthesizing the aforementioned research and comparing the presence of categorization
with the types of categorization, it is hypothesized that if familiarity is controlled for, participants
in the thematic course catalog will experience less choice overload than participants in the
20
taxonomic course catalog, and both will experience less choice overload than participants in the
no category course catalog.
Hypothesis 4a: There should be a relationship between all categorization (thematic vs.
taxonomic vs. no category) and frustration, controlling for familiarity. People should
indicate more frustration when choosing from taxonomically categorized courses than
from thematically categorized courses, and the most frustration when choosing from
uncategorized courses.
Hypothesis 4b: There should be a relationship between all categorization (thematic vs.
taxonomic vs. no category) and ease of choice, controlling for familiarity. People should
indicate less ease when choosing from taxonomically categorized courses than from
thematically categorized courses, and the least ease when choosing from uncategorized
courses.
Hypothesis 4c: There should be a relationship between all categorization (thematic vs.
taxonomic vs. no category) and satisfaction, controlling for familiarity. People should
indicate less satisfaction when choosing from taxonomically categorized courses than
from thematically categorized courses, and the least satisfaction when choosing from
uncategorized courses.
Hypothesis 4d: There should be a relationship between all categorization (thematic vs.
taxonomic vs. no category) and likelihood of registering, controlling for familiarity.
People should indicate less likelihood to register for their chosen courses when choosing

21
from taxonomically categorized courses than from thematically categorized courses, and
the least likelihood to register for their chosen courses when choosing from uncategorized
courses.
Hypothesis 4e: There should be a relationship between all categorization (thematic vs.
taxonomic vs. no category) and perceived similarity between courses, controlling for
familiarity. People should indicate less perceived similarity between courses when
choosing from taxonomically categorized courses than from thematically categorized
courses, and the least perceived similarity between courses when choosing from
uncategorized courses.

22
2. Method
2.1. Pre-Test
Because familiarity and interest were potential moderators (Chernev, 2003; Inbar, Botti,
& Hanko, 2011; Iyengar & Lepper, 2000; Mogilner, Rudnick, & Iyengar, 2008), a pre-test was
conducted to select only moderately familiar and moderately interesting category titles amongst
both the taxonomic and thematic categorization. All the courses that were selected for this study
were elective courses pulled out of the University of Illinois Urbana Champaign Spring 2014
course database. The algorithm of the university registrar determined the definition of a “true
undergraduate elective course”, but it involved making sure that all courses were available to all
undergraduate years and majors, there were no pre-requisites, and there were no restrictions.
Once those classes were filtered and selected by subject, taxonomic categorization (e.g.
Advertising, Informatics, History) was already in place for those classes. The number of
taxonomic categories that were associated with the true elective courses was 220 taxonomic
categories, thus, 220 thematic categories (e.g. Enjoying Drama, Running a Business,
Understanding Labor Rights) for the same courses were created to match the number of
taxonomic categories.
Participants for the pre-testing of categories were 92 undergraduate students chosen by
snowball sampling from five different undergraduate groups. Five surveys were created with a
mix of 44 taxonomic and thematic categories, of which made up all 220 categories. Each survey
asked for participants to rate each category title using 10-point Likert scales for “interesting-
ness” and familiarity (1=Boring, 10=Interesting; and 1=Unfamiliar, 10=Familiar). Five groups of
undergraduates were chosen to each fill out one of the five survey groups (this was an execution
mistake, it is a known limitation, and it is explained in more detail within the limitations section).

23
Results from the surveys were aggregated together and means were calculated for the
ratings of “interesting-ness” and familiarity. Results from both Likert scales followed a normal
distribution, and due to the study’s desire to eliminate highly (un)interesting and highly
(un)familiar category titles, all outliers that were more than two standard deviations away from
the group were removed. If a thematic category was removed due to familiarity or interest,
courses that were originally assigned to that thematic category were then moved to other
thematic categories that pre-tests showed were only moderately familiar and moderately
interesting. For example, the thematic category, “Learning to Program Computers” was rated
highest with regards to interest and was more than two standard deviations away from the rest of
the group of both taxonomic and thematic categories. Thus, this thematic category was removed
from the main study, and all the courses that originally were under this thematic category were
assigned to various other thematic categories that were only moderately familiar and moderately
interesting. If a taxonomic category was removed due to familiarity or interest, the underlying
classes were completely removed from the study due to not wanting to actually change actual
course data since taxonomic categorization is built into the numeric identifier of courses. An
example of this was the taxonomic category of “Computer Science”. This category was rated as
one of the most familiar categories as well as more than two standard deviations from the group
of thematic and taxonomic categories with regards to familiarity. Thus the taxonomic category of
“Computer Science” was removed from the main study as well as all courses that had the
identifier of CS in the course number. Changing the course identifiers (changing CS100 to
XX100) could have been potentially detrimental to a student who may have looked to this course
catalog for real class data. After all removals, 390 true elective courses remained, and 96
thematic and taxonomic categories remained.
24
2.2. Participants
Participants were 191 undergraduate students at the University of Illinois Urbana
Champaign. Participants were randomly assigned to a course catalog, and were allowed to
browse the course catalog from any device, from any location, and for any length of time. This
was to allow for a more naturalistic choice environment that was very close to how students
would normally browse classes, as well as giving them enough time to prevent time pressure
from affecting choice overload (Haynes, 2009). A total of forty-two participants were dropped
due to an analysis of IP addresses that showed that there were many instances where multiple
entries were received from the same IP. Although this could have been caused by multiple
people utilizing the same laptop, lab computer, or device to browse the catalog and complete the
experiment, these multiple entries from the same IP addresses were all dropped to control for the
case that any participant mistakenly (or intentionally) completed the study multiple times.
Additionally, three participants were not able to select a course, thus were removed from analysis
as well as one more participant indicating in their comments that they felt they should not be
included in the analysis. This left a total of 145 students (taxonomic n=48; thematic n=51; no
category n=46). All participants were undergraduate students ranging from freshmen to fifth year
seniors, and all students received extra-credit for participation in the study.
Undergraduates were chosen from this study as opposed to graduate students due to the
potential that undergraduates may be a different enough participant population than graduate
students with regards to how they may go about selecting courses. Additionally, there are far
more undergraduate true elective courses available compared to graduate elective courses, and
due to the nature of this study with regards to choice overload, undergraduates were considered
the best choice. Additionally, although there has been debate as to whether utilizing college

25
populations in experiments was appropriate with regards to ecological validity, this study’s
design required the use of college students to test choice overload in a highly naturalistic
environment.
2.3. Design
This study utilized a one-way between subjects experimental design with three levels.
The no-category catalog was not categorized at all and listed all the courses on the main page
with links to course details (see Appendix A for example). The taxonomic catalog was
categorized by course subject (e.g. Asian American Studies, Latin), with links to the listing of
courses within each category, and each course link led to the appropriate course details (see
Appendix A for example). The thematic catalog was categorized by functionally thematic themes
(e.g. Becoming a Politician, Enjoying Nature), with links to the listing of courses within each
category, and each course link led to the appropriate course details (see Appendix A for
example). All comparisons were conducted on the same large set size of 389 classes, which is
different than most previous studies as there is no smaller set of choices upon which the larger
set is being compared to. Rather, the change in choice overload was tested utilizing the
moderator of categorization, controlling for familiarity. Participants reported how many
semesters they have utilized a course catalog, which was then used as this study’s measure of
familiarity.
2.4. Stimuli
Three separate course catalog websites were created for this study, of which were
categorized either taxonomically by subject (the vast majority of university courses catalogs are
categorized by), thematically by functional theme (e.g. Enjoying Music, Learning about Insects,

26
Understanding Human Behavior), or not categorized at all. Each course catalog was made to
look visually similar and simple, with a fully white background and standard hyperlink colors, so
as not to distract participants from the task of the study. The course catalog was structurally
made to look similar to the official campus course catalog, but the campus catalog does differ by
additional functionality (e.g. a search box) and font/color variations throughout. Thus the course
catalogs for the study should have been moderately familiar when compared to participants’
experiences with the official campus course catalog. The specific courses and course details were
the same across all three course catalog conditions. At the top and bottom of each course catalog
page, instructions were given as follows: “Registration for Spring 2014 UIUC classes begins in
early November. Please look through this course catalog below and find an elective course that
you would be interested in taking next semester. Once you have made your selection (or if you
decide not to make a selection after spending some time searching), please click on the following
survey link to finish this experiment.” As mentioned in the pre-test, the taxonomic and thematic
course catalogs had a total of 96 categories listed on the main index page, and the no
categorization course catalog had 390 links presented on the index page (see Appendix A for
images of each course catalog). Google Analytics was enabled behind each site for every page to
gain additional data as to how participants were utilizing the sites.
2.5. Measures
After browsing the course catalog, participants entered demographic information and
rated choice overload through a survey. With regards to demographics, participants were asked
for their year in school. To measure familiarity, participants were asked how many semesters
they have used a course catalog to choose courses. To rate choice overload, participants were
asked six questions on 10-point Likert scales. Satisfaction (Dar-Nimrod, Rawn, Lehman, &

27
Schwartz, 2009; Diehl & Poynor, 2010; Haynes, 2009; Iyengar & Lepper, 2000; Iyengar,
Mogilner, Rudnick, & Iyengar, 2008; Wells, & Schwartz, 2006; Polman, 2012) was measured by
how satisfied they were with the class that they ultimately chose (1=Not at all satisfied,
10=Extremely satisfied). Only three participants were not able to select a course across all three
sites, so these three were removed from analysis. Ease of choice (Scheibehenne, Greifeneder, &
Todd, 2009) was measured (1=Not at all easy, 10=Extremely easy) as well as likelihood that they
would actually register for the course (or courses) that was selected from the course catalog was
measured (1=Not at all likely, 10=Extremely likely). How frustrated (Haynes, 2009; Iyengar &
Lepper, 2000) they felt when attempting to make a choice was also measured (1=Not at all
frustrated, 10=Extremely frustrated). Lastly, they were asked to rate how similar (Mogilner,
Rudnick, Iyengar, 2008; Poynor & Diehl, 2007; Poynor Lamberton & Diehl, 2013;
Scheibehenne, Greifeneder, & Todd, 2009) they felt the classes were to each other (1=Not
similar at all, 10=Very similar). Familiarity with the course catalog format was also asked
(1=Not at all familiar, 10=Extremely familiar), but this measure was not used due to reasons that
are explained in the limitations section. See Appendix B for sample questionnaire.
2.6. Procedure
The study was conducted in the 2013 fall semester during the month of October to mirror
the time period that the actual university course catalog was made available to students in
preparation of spring semester course registration. Courses that were included in this study were
actual spring 2014 classes, but only true undergraduate elective courses were selected for this
study. The university registrar created the algorithm that defined what courses were true
electives, but it included courses that were available to all undergraduates, that had no pre-
requisites, and had no restrictions.

28
Participants were randomly assigned to one of the three course catalogs and were
provided a link to the course catalog that they were assigned to. Participants were specifically
asked to choose a course for themselves due to previous findings that indicate that choosing for
another person (rather than oneself) reversed the effects of choice overload (Polman, 2012).
Participants were able to browse the catalog for as long as they wanted in order to control for
potential interference with time pressure effects on choice overload (Haynes, 2009) and they
could return to the site to browse as many times as they wanted; this was to maintain a
naturalistic feeling to the course catalog environment. When their search for elective classes was
completed, participants filled out the survey by following the link available. This link was on
every page of the course catalog to ensure they could exit at any point. After completing the
survey, participants were given extra credit for their participation.
2.7. Analysis
An ANCOVA across the three levels was conducted with familiarity as the covariate.
Once again, familiarity was measured by asking participants how many semesters they had used
a course catalog to choose courses. The relationship between categorization types was analyzed
with familiarity controlled for as a covariate. Planned contrasts were conducted to assess the
effects of mere categorization as well as thematic versus taxonomic categorization.

29
3. Results
3.1. Power Analysis
Scheibehenne, Greifeneder, and Todd (2010) estimated effect sizes for various choice
overload studies in their meta-analysis, and found that the choice overload studies that they
analyzed had estimated effect sizes ranged from -1.89 < d < 1.21. Of the 63 effect sizes that they
estimated, 28 were in the range of -.20 < d < .09, and of those 28 that showed choice overload
effects, seven were in the range of .02 < d < .09. For studies that were accessible (many studies
that their meta-analysis analyzed were unpublished works), after post-hoc power analysis, the
majority of them showed to have power greater than or equal to .9. There were studies though
that found effects even amidst very low power, such as Fasolo, Carmeci, and Misuraca’s (2009)
referenced study showing power equal to .06. Thus the range of estimated effect sizes for choice
overload in their study varied greatly, and this affected study power levels.
Due to the wide range of effect sizes estimated for choice overload and lack of reporting
actual effect sizes, there was difficulty in estimating appropriate sample size to achieve power
greater than or equal to .9. Specifically, the mere categorization and thematic versus taxonomic
literature did not report actual effect sizes (Poynor & Diehl, 2007; Mogilner, Rudnick, &
Iyengar, 2008), making it hard to estimate appropriate sample size for a properly powered study.
A power analysis revealed lack of power across the study, thus indicating the possibility for type
II error. All power measurements are reported.
3.2. Mere Categorization Testing
All of hypotheses 1a through 1d were testing the effects of categorization (categorized
versus not categorized) on choice overload measures with familiarity controlled for as a
covariate. Refer to Table 1 for all categorization effects of choice overload with familiarity

30
controlled for as a covariate. Refer to Table 2 for familiarity as a covariate and its relationship
with choice overload measures. Refer to Table 3 for planned contrast testing of mere
categorization on choice overload.
Hypothesis 1a: There should be a relationship between mere categorization and frustration,
controlling for familiarity. People should indicate more frustration when choosing from
uncategorized courses than from categorized courses.
The covariate, familiarity, was not related to frustration, F(1, 141) = 3.40, p = .07, r =
.15, 1-β = .45. There was also no effect of all categorization (no category, taxonomic, and
thematic) on frustration after controlling for familiarity, F(2, 141) = .94, p = .39, partial η2 = .01,
1-β = .21. Planned contrasts revealed that merely categorizing courses did not affect frustration
compared to having no categorization at all, t(141) = .98, p = .33, r = .08. Thus, hypothesis 1a
was not supported.
Hypothesis 1b: There is a relationship between mere categorization and ease of choosing,
controlling for familiarity. People should indicate less ease when choosing from uncategorized
courses than from categorized courses.
The covariate, familiarity, was not related to ease of choice, F(1, 141) = 1.02, p = .31, r =
.08, 1-β = .17. There was also no effect of all categorization (no category, taxonomic, and
thematic) on ease of choice after controlling for familiarity, F(2, 141) = 1.16, p = .32, partial η2 =
.02, 1-β = .25. Planned contrasts revealed that merely categorizing courses did not affect ease of

31
choice compared to having no categorization at all, t(141) = -1.18, p = .24, r = .10. Thus,
hypothesis 1b was not supported.
Hypothesis 1c: There is a relationship between mere categorization and satisfaction, controlling
for familiarity. People should indicate less satisfaction when choosing from uncategorized
courses than from categorized courses.
The covariate, familiarity, was related to satisfaction, F(1, 141) = 5.09, p = .03, r = .19, 1-
β = .61. There was no effect though of all categorization (no category, taxonomic, and thematic)
on satisfaction after controlling for familiarity, F(2, 141) = 1.50, p = .23, partial η2 = .02, 1-β =
.32. Planned contrasts revealed that merely categorizing courses did not affect satisfaction
compared to having no categorization at all, t(141) = -1.20, p = .23, r = .10. Thus, hypothesis 1c
was not supported.
Hypothesis 1d: There is a relationship between mere categorization and likelihood to register,
controlling for familiarity. People should indicate a lower likelihood to register for their chosen
courses when choosing from uncategorized courses than from categorized courses.
The covariate, familiarity, was not related to registration likelihood, F(1, 141) = 1.33, p =
.25, r = .10, 1-β = .21. There was also no effect of all categorization (no category, taxonomic,
and thematic) on registration likelihood after controlling for familiarity, F(2, 141) = .30, p = .74,
partial η2 = .00, 1-β = .10. Planned contrasts revealed that merely categorizing courses did not

32
affect registration likelihood compared to having no categorization at all, t(141) = -.30, p = .76, r
= .03. Thus, hypothesis 1d was not supported.
3.3. Thematic versus Taxonomic Testing
Hypothesis 2 was assessed looking at the effects of types of categorization (thematic
versus taxonomic) with familiarity controlled as a covariate. Refer to Table 1 for all
categorization effects of choice overload with familiarity controlled for as a covariate. Refer to
Table 2 for familiarity as a covariate and its relationship with choice overload measures. Refer to
Table 4 for planned contrast testing of type of categorization on choice overload.
Hypothesis 2: There should be a relationship between type of categorization (thematic vs.
taxonomic) and perceived similarity between courses, controlling for familiarity. People should
indicate less perceived similarity between courses when choosing from taxonomically
categorized courses than from thematically categorized courses.
The covariate, familiarity, was not related to perceived similarity, F(1, 141) = 1.05, p =
.31, r = .09, 1-β = .17. There was also no effect of all categorization (no category, taxonomic,
and thematic) on perceived similarity after controlling for familiarity, F(2, 141) = .30, p = .74,
partial η2 = .00, 1-β = .10. Planned contrasts revealed that thematic categorization did not affect
perceived similarity compared to taxonomic categorization, t(96) = .04, p = .97, r = .00. Thus,
hypothesis 2 was not supported.
Hypothesis 3a through 3d were assessed looking at the effects of types of categorization
(thematic versus taxonomic) with familiarity controlled as a covariate. Refer to Table 1 for all

33
categorization effects of choice overload with familiarity controlled for as a covariate. Refer to
Table 2 for familiarity as a covariate and its relationship with choice overload measures. Refer to
Table 4 for planned contrast testing of type of categorization on choice overload.
Hypothesis 3a: There should be a relationship between type of categorization (thematic vs.
taxonomic) and frustration, controlling for familiarity. People should indicate more frustration
when choosing from taxonomically categorized courses than from thematically categorized
courses.
The covariate, familiarity, was not related to frustration, F(1, 141) = 3.40, p = .07, r =
.15, 1-β = .45. There was also no effect of all categorization (no category, taxonomic, and
thematic) on frustration after controlling for familiarity, F(2, 141) = .94, p = .39, partial η2 = .01,
1-β = .21. Planned contrasts revealed that thematic categorization did not affect frustration
compared to taxonomic categorization, t(96) = -.97, p = .34, r = .10. Thus, hypothesis 2 was not
supported.
Hypothesis 3b: There should be a relationship between type of categorization (thematic vs.
taxonomic) and ease of choosing, controlling for familiarity. People should indicate less ease
when choosing from taxonomically categorized courses than from thematically categorized
courses.
The covariate, familiarity, was not related to ease of choice, F(1, 141) = 1.02, p = .31, r =
.08, 1-β = .17. There was also no effect of all categorization (no category, taxonomic, and

34
thematic) on ease of choice after controlling for familiarity, F(2, 141) = 1.16, p = .32, partial η2 =
.02, 1-β = .25. Planned contrasts revealed that thematic categorization did not affect ease of
choosing compared to taxonomic categorization, t(96) = -.99, p = .32, r = .10. Thus, hypothesis
3b was not supported.
Hypothesis 3c: There should be a relationship between type of categorization (thematic vs.
taxonomic) and satisfaction, controlling for familiarity. People should indicate less satisfaction
when choosing from taxonomically categorized courses than from thematically categorized
courses.
The covariate, familiarity, was related to satisfaction, F(1, 141) = 5.09, p = .03, r = .19, 1-
β = .61. There was no effect though of all categorization (no category, taxonomic, and thematic)
on satisfaction after controlling for familiarity, F(2, 141) = 1.50, p = .23, partial η2 = .02, 1-β =
.32. Planned contrasts revealed that thematic categorization did not affect satisfaction compared
to taxonomic categorization, t(96) = -1.23, p = .22, r = .12. Thus, hypothesis 3c was not
supported.
Hypothesis 3d: There should be a relationship between type of categorization (thematic vs.
taxonomic) and likelihood to register, controlling for familiarity. People should indicate a lower
likelihood to register for their chosen courses when choosing from taxonomically categorized
courses than from thematically categorized courses.

35
The covariate, familiarity, was not related to registration likelihood, F(1, 141) = 1.33, p =
.25, r = .10, 1-β = .21. There was also no effect of all categorization (no category, taxonomic,
and thematic) on registration likelihood after controlling for familiarity, F(2, 141) = .30, p = .74,
partial η2 = .00, 1-β = .10. Planned contrasts revealed that thematic categorization did not affect
registration likelihood compared to taxonomic categorization, t(96) = -.74, p = .46, r = .08. Thus,
hypothesis 3d was not supported.
3.4. Thematic versus Taxonomic versus No Category Testing
Hypothesis 4a through 4d were assessed looking at the effects of all types of
categorization (thematic versus taxonomic versus no categorization) with familiarity controlled
as a covariate. Refer to Table 1 for all categorization effects of choice overload with familiarity
controlled for as a covariate. Refer to Table 2 for familiarity as a covariate and its relationship
with choice overload measures.
Hypothesis 4a: There should be a relationship between all categorization (thematic vs.
taxonomic vs. no category) and frustration, controlling for familiarity. People should indicate
more frustration when choosing from taxonomically categorized courses than from thematically
categorized courses, and the most frustration when choosing from uncategorized courses.
The covariate, familiarity, was not related to frustration, F(1, 141) = 3.40, p = .07, r = .15,
1-β = .45. There was also no effect of all categorization (no category, taxonomic, and thematic)
on frustration after controlling for familiarity, F(2, 141) = .94, p = .39, partial η2 = .01, 1-β = .21.
Thus, hypothesis 4a was not supported.

36
Hypothesis 4b: There should be a relationship between all categorization (thematic vs.
taxonomic vs. no category) and ease of choice, controlling for familiarity. People should indicate
less ease when choosing from taxonomically categorized courses than from thematically
categorized courses, and the least ease when choosing from uncategorized courses.
The covariate, familiarity, was not related to ease of choice, F(1, 141) = 1.02, p = .31, r =
.08, 1-β = .17. There was also no effect of all categorization (no category, taxonomic, and
thematic) on ease of choice after controlling for familiarity, F(2, 141) = 1.16, p = .32, partial η2 =
.02, 1-β = .25. Thus, hypothesis 4b was not supported.
Hypothesis 4c: There should be a relationship between all categorization (thematic vs.
taxonomic vs. no category) and satisfaction, controlling for familiarity. People should indicate
less satisfaction when choosing from taxonomically categorized courses than from thematically
categorized courses, and the least satisfaction when choosing from uncategorized courses.
The covariate, familiarity, was related to satisfaction, F(1, 141) = 5.09, p = .03, r = .19, 1-
β = .61. There was no effect though of all categorization (no category, taxonomic, and thematic)
on satisfaction after controlling for familiarity, F(2, 141) = 1.50, p = .23, partial η2 = .02, 1-β =
.32. Thus, hypothesis 4c was not supported.
Hypothesis 4d: There should be a relationship between all categorization (thematic vs.
taxonomic vs. no category) and likelihood of registering, controlling for familiarity. People
37
should indicate less likelihood to register for their chosen courses when choosing from
taxonomically categorized courses than from thematically categorized courses, and the least
likelihood to register for their chosen courses when choosing from uncategorized courses.
The covariate, familiarity, was not related to registration likelihood, F(1, 141) = 1.33, p =
.25, r = .10, 1-β = .21. There was also no effect of all categorization (no category, taxonomic,
and thematic) on registration likelihood after controlling for familiarity, F(2, 141) = .30, p = .74,
partial η2 = .00, 1-β = .10. Thus, hypothesis 4d was not supported.
Hypothesis 4e: There should be a relationship between all categorization (thematic vs.
taxonomic vs. no category) and perceived similarity between courses, controlling for familiarity.
People should indicate less perceived similarity between courses when choosing from
taxonomically categorized courses than from thematically categorized courses, and the least
perceived similarity between courses when choosing from uncategorized courses.
The covariate, familiarity, was not related to perceived similarity, F(1, 141) = 1.05, p =
.31, r = .09, 1-β = .17. There was also no effect of all categorization (no category, taxonomic,
and thematic) on perceived similarity after controlling for familiarity, F(2, 141) = .30, p = .74,
partial η2 = .00, 1-β = .10. Thus hypothesis 4e was not supported.
Although not specifically covered by any hypotheses, participant familiarity with the
course catalog format (which was not used as the measure of familiarity due to reasons that are
explained in the limitations section) was related to the covariate of familiarity (semesters that

38
participants have used the course catalog system), F(1, 141) = 20.06, p = .00, r = .35, 1-β = .99.
There was also a significant effect of all categorization (no category, taxonomic, and thematic)
on familiarity with the course catalog format after controlling for familiarity (semesters that
participants have used the course catalog system), F(2, 141) = 4.23, p = .02, partial η2 = .06, 1-β
= .73.

39
4. Discussion
4.1. General Discussion
4.1.1. Lack of Expected Mere Categorization Effects
The goal of this research was to explore the effects of categorization on an extremely
large assortment of classes, tested in the naturalistic environment of a course catalog system. My
first hypothesis was to test the effects of the mere presence of categorization on choice overload,
which research has shown that by simply categorizing a choice set (no matter what the
categorization system is), choice overload is reduced (Mogilner, Rudnick, & Iyengar, 2008). My
manipulation differed from Mogilner, Rudnick, and Iyengar (2008) in that their stimuli was a one
page menu of choice, whereas my manipulation was a series of online pages in which each
selection would take you to a deeper page within the course catalog. With familiarity controlled
for, there was no relationship between mere categorization and measures of choice overload.
This could potentially be due to the fact that this study in essence was testing relative choice
overload of a static number of choices versus the majority of all other studies testing choice
overload when the number of choices is changed. The fact that my manipulation involved many
tiers of online pages of choice compared to Mogilner, Rudnick, and Iyengar’s (2008) study, and
the fact that the choice set was held static, all of these factors could have contributed to the lack
of expected results found.
4.1.2. Lack of Expected Categorization Effects on Perceived Similarity
My second hypothesis dealt with the effects of looking at the differences between two
specific types of categorization for the course catalogs, namely taxonomic (e.g. Asian American
Studies, Latin) and thematic categorization (e.g. Becoming a Politician, Enjoying Nature).

40
Poynor and Diehl (2007) found that participants perceived New Age drinks (Sobe, Tazo,
Arizona, and Vitamin Water) to be more similar when categorized thematically versus
taxonomically. With familiarity controlled for, I expected that thematic categorization would
increase perceived similarity between courses compared to taxonomic categorization. With
familiarity controlled for though, there was no relationship found between type of categorization
(thematic versus taxonomic) and perceived similarity. This could have been due to the fact that
the terms “thematic” and “taxonomic” were not fully defined by Poynor and Diehl (2007). They
defined thematic categorization as, “thematic groupings are formed in terms of higher-level,
generally abstract connections among items” (p. 53), and taxonomic categorization as,
“taxonomic categories, by contrast, present items in highly intuitive groups” (p. 53). Thus what I
considered “generally abstract” for thematic categorization, or “highly intuitive” for taxonomic
categorization, may have been different than what they considered generally abstract or highly
intuitive. According to my attempts to more fully define “thematic” and “taxonomic”
categorization, it seems that these types of categorization did not affect perceptions of similarity.
4.1.3. Lack of Expected Categorization Effects on Choice Overload
My third hypothesis dealt again with the effects of looking at the differences between
taxonomic and thematic categorization. Poynor and Diehl (2007) suggested that an increase in
perceived similarity may “make a thematically-structured assortment more attractive than a
taxonomically organized set” (p. 66). I wanted to actually test this due to their suggestion of the
potential of future research with regards to this manipulation. Thus I hypothesized that an
increase in perceived similarity would decrease choice overload. Thus, I expected that with
familiarity controlled for, thematic categorization (as opposed to taxonomic categorization)

41
would decrease choice overload. With familiarity controlled for, there was no relationship found
between type of categorization (thematic versus taxonomic) and measures of choice overload.
The fact that I found no difference in perceived similarity between thematic and taxonomic
categorization in my second hypothesis most likely affected the third hypothesis significantly.
Thus again, according to my attempts to more fully define “thematic” and “taxonomic”
categorization, it seems that these types of categorization for a course catalog also did not affect
choice overload.
4.1.4. Lack of Expected All Categorization Effects on Choice Overload
My fourth and last hypothesis was a synthesis of the mere categorization effect
(Mogilner, Rudnick, & Iyengar, 2008) and the effects of thematic versus taxonomic
categorization (Poynor & Diehl, 2007). I expected that with familiarity controlled for, thematic
categorization (as opposed to taxonomic categorization) would decrease choice overload, and
both would decrease choice overload compared to uncategorized courses. With familiarity
controlled for, there was no relationship between all types of categorization and choice overload.
This lack of expected results follows the lack of results from both the mere categorization testing
as well as the type of categorization testing. The difference in manipulation of mere
categorization compared to Mogilner, Rudnick, and Iyengar’s (2008) study, the fact that the
number of choices was held static, and the potential difference in defining thematic and
taxonomic categorization all most likely contributed to the lack of expected results.
42
4.1.5. Familiarity Effect on Satisfaction with Choice and Familiarity with the Course Catalog
Format
Although not predicted by the hypotheses, familiarity was significantly related with
participant satisfaction with their final choice. These results demonstrate the importance of
familiarity on this choice overload. As mentioned in my literature review, familiarity was
considered as influencing choice overload effects, but in past research familiarity was either not
measured or was potentially measured differently across studies. Iyengar and Lepper (2000)
accounted for familiarity, but did not specifically measure for familiarity. Rather, they indicated
that they carefully chose an item that they assumed would be familiar, but not too familiar. They
chose Wilkin & Sons jams, of which they assumed was moderately familiar to participants. They
conducted their study in a real store, with research assistants dressed up as store employees, and
utilized booths that had differing quantities of these jams. Due to the naturalistic setting on their
study and their desire for participants to be unaware that they were being studied, it was probably
almost impossible to pre-test for familiarity. Nonetheless this could have affected their results for
choice overload. Poynor and Diehl (2007) also assumed that their stimuli (Tazo, Sobe, Arizona,
and Vitamin Water) were generally an unfamiliar product category for undergraduate business
students. This is another case in which familiarity was not measured, and there is the possibility
that college students could have been familiar with these drinks in the mid-2000’s since they
were available on the market at that time. Haynes (2009) assumed that items in their choice set
were unfamiliar to college students, such as a hot air balloon ride or a massage treatment. Once
again though, familiarity was not measured even though college students could have been
familiar with experiences such as choosing a massage treatment, and thus this lack of
measurement could have affected their choice overload results. Thus in general, previous studies

43
have either assumed familiarity without measuring it, or have measured constructs that could
have been a partial measurement of familiarity. This inconsistency with regards to measuring
familiarity across studies could have affected results, and these previous studies in choice
overload may have produced differing results if familiarity was measured consistently across
these studies.
One potential reason as to why familiarity has such a strong effect on satisfaction with a
participant’s final choice is mentioned in past literature; Scheibehenne, Greifeneder, and Todd
(2010) write in their meta-analysis of choice overload studies, “experiments on choice overload
have typically used options that decision makers are not very familiar with to prevent strong
prior preferences for a specific option and consequently a highly selective search process that
would allow participants to ignore most of the assortment.” (p. 410).
Familiarity (semesters participants have used the course catalog system to choose
courses) was also significantly related to familiarity with the course catalog format. There was
also a significant effect of category type on levels of familiarity with the course catalog format
when controlling for familiarity (semesters participants have used the course catalog system to
choose courses).
4.1.6. Contributions to Testing Choice Overload
The fact that the hypotheses were not supported could be considered significant due to
the nature of the study. The first factor of significance was that this study was conducted in a
naturalistic environment. Testing college students utilizing a course catalog is in fact a scenario
that college students encounter every semester, as well as it is a scenario upon which there are an
incredibly large number of choices naturally available. Additionally, this study allowed for

44
students to participate at their own pace from whenever they would like and using whatever
device they felt comfortable with. This was again to create as natural of an environment as
possible. Although Iyengar and Lepper’s (2000) original jam study was conducted in a real
physical store environment, many of the choice overload studies since then have been conducted
in lab environments or some sort of controlled environment.
The second factor of significance was that the assortment set size of 389 choices was
much larger than almost all other choice overload studies. Scheibehenne, Greifeneder, and
Todd’s (2010) meta-analysis analyzed 63 choice overload studies, and of those studies, only one
had a greater number of choices (504 choices, of which was part of an unpublished study). 53 of
the 63 studies had choice sets of 90 choices or lower. One has to ask the question as to how
many choices is too much choice? Iyengar and Lepper (2000) stated too much choice as having a
choice set that is, “reasonably large, but not ecologically unusual, number of options.” (p. 996)
389 choices of elective courses seems reasonably large, but clearly not unusually large for a
major public university.
The third factor of significance is the recent meta-analysis of choice overload studies
positing that choice overload effects may not actually exist (Scheibehenne, Greifeneder, & Todd,
2010). In their meta-analysis, they found many studies that could not reproduce choice overload
effects for experiments conducted to replicate prior studies on choice overload. Although choice
overload effects were not found in this study, this study was not a direct reproduction of any
prior studies, but rather a study to build on previous studies on mere categorization (Mogilner,
Rudnick, & Iyengar, 2008) and type of categorization (Poynor & Diehl, 2007) and their effects
on choice overload.

45
4.2. Future Research
Future research could be conducted in the realm of what aspects of an online course
catalog could be manipulated to make the catalog seem more familiar to users. There are certain
elements of a course catalog that we see in online environments everyday, such as organizational
structures of webpages, graphical interface design of webpages, and so forth. Since college
students spend a substantial portion of their time utilizing social media websites, creating course
catalogs that look and feel similar to social media websites could heighten familiarity for
students unfamiliar with course catalogs. This brings to light that how the sites look visually may
play a large part in differences with regards to choice overload.
Another area of future research is looking at categorization types (taxonomic, thematic,
and no categorization) with regards to time spent on sites. When average time spent on each
version of a course catalog was analyzed within Google Analytics, I found that participants that
were assigned to the thematic catalog spent 1.5 times longer on the thematic catalog as a whole
versus the participants assigned to the taxonomic catalog as a whole, and 1.4 times longer on the
thematic catalog as a whole versus participants in the catalog with no categorization as a whole.
Since Google Analytics does not allow us to analyze each visit individually, statistical
comparisons could not be made. With this said, if these differences were significant, this could
potentially have large implications to both course catalogs as well as consumer websites since
this study found that there were no choice overload differences between taxonomic and thematic
catalogs. If utilizing thematic categorization keeps a student browsing a course catalog longer
without overloading them, this could prove beneficial to helping students spend more time
investigating courses as a whole. With regards to consumer websites, if utilizing thematic
categorization keeps consumers browsing longer without additional choice overload, this could

46
prove beneficial both to business as well as be beneficial for online advertisers. Future research
could be conducted with tracking code to separate time spent on sites by user so that statistical
comparisons could be made.
Manipulating category number is also another potential area of future research. Since this
was again a situation in which overall choice of classes could not be reduced, another
manipulation that could be tested is putting all the classes into fewer main categories and testing
to see if that affects choice overload measures at all compared to the natural larger amount of
categories.
Lastly, in the future this study could be broken up into a study building solely on mere
categorization (Mogilner, Rudnick, & Iyengar, 2008) or thematic versus taxonomic
categorization (Poynor & Diehl, 2007) and their effects on choice overload. Due to combining
these two studies and testing manipulations to build on those studies, this current study was
potentially confounded with too many contributing factors that may have affected the results.
4.3. Limitations
Due to my desire to conduct the study in a naturalistic environment, participants were not
monitored in a controlled lab environment. There could have been a higher rate of participants
not taking the study seriously compared to a lab environment. To attempt to control for this, IP
addresses were tracked to check for duplicate submissions, and participants’ browsing patterns
were monitored as a whole utilizing Google Analytics.
Additionally, during the pre-tests, pre-test participants were snowball sampled and
assigned to five different versions of a pre-test site. Due to a personal error, participants were not
randomly assigned to one of the five versions of a pre-test site, but rather participants were put

47
into five groups (aggregated by geographic location such as students working for a campus help
desk group or students from a local religious organization) and each group was assigned a pre-
test site. In future studies, I would most definitely randomly assign these assignments.
Single-item measures were used for this study compared to multiple-item measures due
to looking at the measures of previous choice overload studies, but this could have created
difficulty in appropriately analyzing the study. Participants due to potentially ambiguous
wording of the questions could have interpreted the single-item measures differently. For
example, the measure of familiarity was potentially a bit ambiguous in its wording as I asked
how familiar the course catalog format seemed to the participants. This measure of familiarity of
the format of the course catalog could have both been interpreted differently by participants as
well as could have measured a different familiarity than what was being measured in past
studies. Due to this, semesters that participants have used a course catalog were used for the
measure of familiarity for this study.
In regards to Mogilner, Rudnick, and Iyengar’s (2008) mere-categorization effect,
although I was utilizing a different stimuli organizational structure than their study, their coffee
study stimuli could have been a limitation to both their results as well as my results. The four
versions of their menu were split up into one that was not categorized, one that was
informatively categorized, one that was somewhat informatively categorized, and one that was
completely uninformative in its categorization. Their results showed that categorizing increased
chooser satisfaction for preference-constructing participants, but there was no difference between
the three types of categorization. The first menu looked strikingly different visually than the
other three (see Appendix C), thus the visual differences between the first and the other three
could have contributed to their results rather than the existence of categories versus no

48
categories. In this study, the course catalog without categorization was also visually different
than the taxonomic and thematic catalogs, as it was not possible to structure it in a way where the
no categorization catalog would look visually similar to the categorized catalogs. This was both
due to the number of hyperlinks that needed to be shown on the first page in the no
categorization catalog compared to the categorized catalogs (389 class hyperlinks versus 96
category hyperlinks) as well as due to taxonomic course indicators needing to be attached to
course listings to prevent confusion with classes with the same name (e.g. Undergraduate Open
Seminar) in the no categorization catalog (see Appendix A). Future research could be conducted
with the conditions of categorization and no categorization being visually similar.
An additional measure of asking participants whether or not they had a preference for an
elective course coming into the study would have been beneficial, as it has been found through
past studies that having strong prior preferences for certain choices could affect choice overload
(Scheibehenne, Greifeneder, & Todd, 2010).
Lastly, as explained in the results section, all of the dependent variable measurements
were underpowered and there was the potential for type II error. This was due to the lack of
effect size reporting in past choice overload literature, which produced an inability to accurately
estimate proper sample size requirements. Additional participants will be added in the future to
this study to achieve appropriate power.
4.4. Final Remarks
Despite the lack of expected results from this study, future research including increasing
power may prove fruitful, and investigating choice overload is definitely a worthwhile endeavor.
With the growth of online course offerings such as MOOCs (massive open online course) and

49
the explosion of products offered to consumers within online stores, choice overload will almost
indeed continue to be an ever-growing issue. Future work in this area will most likely need to be
conducted utilizing methods such as big data analysis of website user data sets. Partnerships with
online consumer companies may provide the data and insight needed to more thoroughly test the
construct of choice overload.

50
References
Beaudoin, C. E. (2008). Explaining the relationship between internet use and interpersonal trust:
Taking into account motivation and information overload. Journal of Computer Mediated
Communications, 13, 550-568.
Chernev, A. (2003). When more is less and less is more: The role of ideal point availability and
assortment in consumer choice. Journal of Consumer Research, 30, 170-183.
Chernev, A., Bockenholt, U., & Goodman, J. (2010). Commentary on Scheibehenne,
Greifeneder, and Todd choice overload: Is there anything to it? Journal of Consumer
Research, 37, 426-428.
Chok, J., & Brozyna, G. A. (2011). The “tyranny of choice”: Choice overload as a possible
instance of effort discounting. The Psychological Record, 61, 547-560.
Dar-Nimrod, I., Rawn, C. D., Lehman, D. R., & Schwartz, B. (2009). The maximization
paradox: The costs of seeking alternatives. Personality and Individual Differences, 46,
631-635.
Diehl, K., & Poynor, C. (2010). Great expectations?! Assortment size, expectations, and
satisfaction. Journal of Marketing Research, 47, 312-322.
Estes, Z., Golonka, S., & Jones, L. L. (2011). Thematic thinking: The apprehension and
consequences of thematic relations. In The Psychology of Learning and Motivation:
Advances in Research and Theory (Vol. 54, pp. 249-294). Elsevier Inc.
Faul, F., Erdfelder, E., Buchner, A., & Lang, A. G. (2009). Statistical power analyses using
G*Power 3.1: Tests for correlation and regression analyses. Behavior Research
Methods, 41, 1149-1160.

51
Fasolo, B., Carmeci, F. A., & Misuraca, R. (2009). The effect of choice complexity on
perception of time spent choosing: When choice takes longer but feels
shorter. Psychology and Marketing, 26 (3), 213–28.
Fasolo, B., McClelland, G. H., & Todd, P. M. (2007). Escaping the tyranny of choice: when
fewer attributes make choice easier. Marketing Theory, 7, 13-26.
Gerlanc, D., & Kirby, K. (2013). bootES: Bootstrap effect sizes. (Version 1.01) (Software).
Available from http://cran.r-project.org/web/packages/bootES/index.html.
Haynes, G. A. (2009). Testing the boundaries of the choice overload phenomenon: The effect of
number of options and time pressure on decision difficulty and satisfaction. Psychology
& Marketing, 26, 204-212.
Hiltz, S. R., & Turoff, M. (1985). Structuring computer-mediated communication systems to
avoid information overload. Communications of the ACM, 28(7), 680-689.
Hoch, A. J., Bradlow, E. T., & Wansink, B. (1999). The variety of an assortment. Marketing
Science, 18(4), 527-546.
Inbar, Y., Botti, S., & Hanko, K. (2011). Decision speed and choice regret: When haste feels like
waste. Journal of Experimental Social Psychology, 1-8.
Iyengar, S. S., & Lepper, M. R. (2000). When choice is demotivating: Can one desire too much
of a good thing? Journal of Personality and Social Psychology, 79(6), 95-1006.
Iyengar, S. S., Wells, R. E., & Schwartz, B. (2006). Doing better but feeling worse. Looking for
the “best” job undermines satisfaction. Psychological Science, 17(2), 143-150.
Johns, N., Edwards, J. S. A., Hartwell, H. J. (2013). Menu choice: Satisfaction or overload?
Journal of Culinary Science and Technology, 11, 275-285.
52
Kahn, B., Moore, W. L., & Glazer, R. (1987). Experiments in constrained choice. Journal of
Consumer Research, 14(1), 96-114.
Kirby, K. N., Gerlanc, D. (2013). BootES: An r package for bootstrap confidence intervals on
effect sizes. Behavior Research Methods, 45(4), 905-927.
Lin, E. L., & Murphy, G. L. (2001). Thematic relations in adults' concepts. Journal of
Experimental Psychology, 130(1), 3-28.
Malhotra, N. (1982). Information load and consumer decision making. Journal of Consumer
Research, 8, 419-430.
Mogilner, C., Rudnick, T., & Iyengar, S. S. (2008). The mere categorization effect: How the
presence of categories increases choosers’ perceptions of assortment variety and outcome
satisfaction. Journal of Consumer Research, 35, 202-215.
Polman, E. (2012). Effects of self-other decision making on regulatory focus and choice
overload. Journal of Personality and Social Psychology, 1-14.
Poynor, C., & Diehl, K. (2007). The psychology of category design: How product groupings
influence consumer decision making. MSI Reports, 7(1), 51-71.
Poynor Lamberton, C., & Diehl, K. (2013). Retail choice architecture: The effects of benefit- and
attribute-based assortment organization on consumer perceptions and choice. Journal of
Consumer Research, 393-411.
Scheibehenne, B., Greifeneder, R., & Todd, P. M. (2009). What moderates the too-much-choice
effect? Psychology and Marketing, 26, 229-253.
Scheibehenne, B., Greifeneder, R., & Todd, P. M. (2010). Can there ever be too many options?
A meta-analytic review of choice overload. Journal of Consumer Research, 37, 409-425.

53
Sellier, A., & Dahl, D. W. (2011). Focus! Creative success is enjoyed through restricted choice.
Journal of Marketing Research, 48, 996-1007.
Wilcox, R. R. (2014). WRS: A package of R. R. Wilcox robust statistics functions.
(Version 0.24) (Software). Available from http://r-forge.r-project.org/R/?group_id=468.
Wise, K., Pepple, K. (2008). The effect of available choice on the cognitive processing of
pictures. Computers in Human Behavior, 24, 388-402.
Wright, D. B., London, K., Field, A. P. (2011). Using bootstrap estimation and the plug-in
principle for clinical psychology data. Journal of Experimental Psychopathology, 2(2),
252-270.
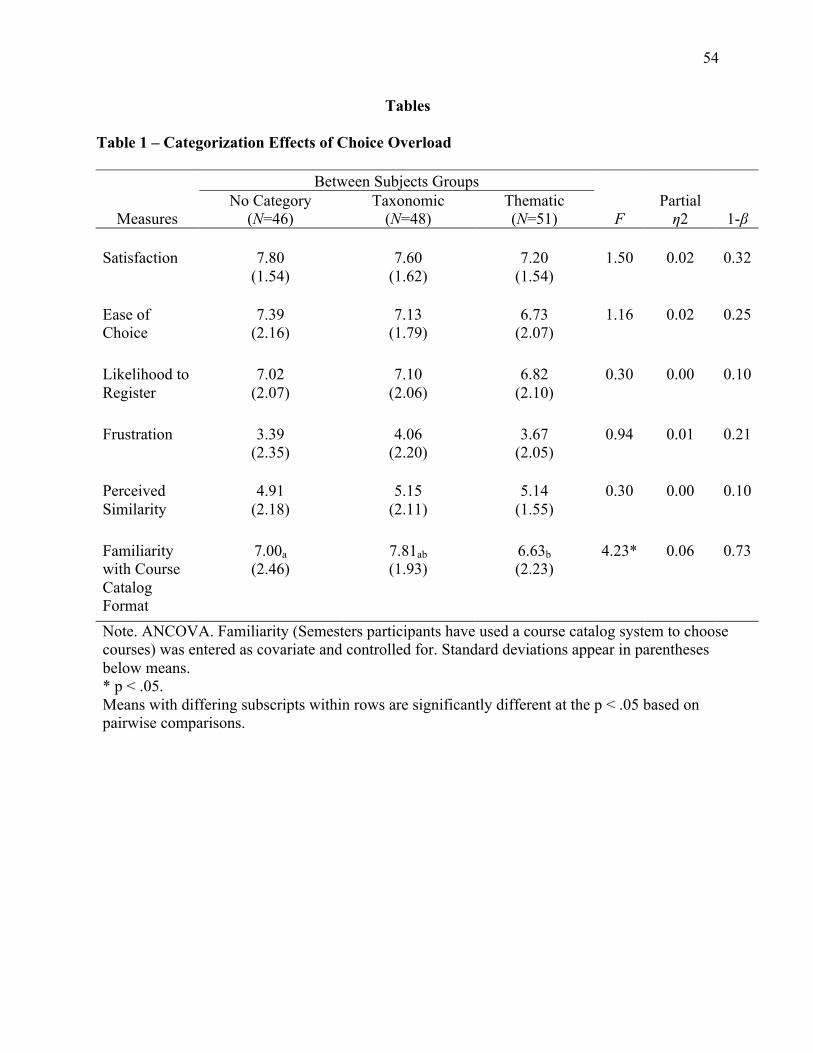
54
Tables Table 1 – Categorization Effects of Choice Overload Between Subjects Groups
Measures No Category
(N=46) Taxonomic
(N=48) Thematic (N=51) F
Partial η2 1-β
Satisfaction 7.80 (1.54)
7.60 (1.62)
7.20 (1.54)
1.50 0.02 0.32
Ease of Choice
7.39 (2.16)
7.13 (1.79)
6.73 (2.07)
1.16 0.02 0.25
Likelihood to Register
7.02 (2.07)
7.10 (2.06)
6.82 (2.10)
0.30 0.00 0.10
Frustration 3.39
(2.35) 4.06
(2.20) 3.67
(2.05) 0.94 0.01 0.21
Perceived Similarity
4.91 (2.18)
5.15 (2.11)
5.14 (1.55)
0.30 0.00 0.10
Familiarity with Course Catalog Format
7.00a (2.46)
7.81ab (1.93)
6.63b (2.23)
4.23* 0.06 0.73
Note. ANCOVA. Familiarity (Semesters participants have used a course catalog system to choose courses) was entered as covariate and controlled for. Standard deviations appear in parentheses below means. * p < .05. Means with differing subscripts within rows are significantly different at the p < .05 based on pairwise comparisons.

55
Table 2 – Familiarity as Covariate and Choice Overload
Measures F p r 1-β
Satisfaction 5.09 0.03* 0.19 0.61
Ease of Choice 1.02 0.31 0.08 0.17
Likelihood to Register 1.33 0.25 0.10 0.21
Frustration 3.40 0.07 0.15 0.45
Perceived Similarity 1.05 0.31 0.09 0.17
Familiarity with Course Catalog Format** 20.06 0.00* 0.35 0.99 Note. ANCOVA. Familiarity as covariate and its relationship with choice overload measures. * = p < .05. ** Familiarity with course catalog format is a different measure than the familiarity used as a covariate for reasons as explained in the limitations section. Familiarity with course catalog format is not a measure of choice overload.

56
Table 3 – Planned Contrasts for Mere Categorization Testing of Choice Overload
Measures t p r
Satisfaction -1.20 0.23 0.10
Ease of Choice -1.18 0.24 0.10
Likelihood to Register -0.30 0.76 0.03
Frustration 0.98 0.33 0.08 * = p < .05.

57
Table 4 – Planned Contrasts for Type of Categorization (Taxonomic versus Thematic) Testing of Choice Overload
Measures t p r
Satisfaction -1.23 0.22 0.12
Ease of Choice -0.99 0.32 0.10
Likelihood to Register -0.74 0.46 0.08
Frustration -0.97 0.34 0.10
Perceived Similarity 0.04 0.97 0.00 * = p < .05.

58
Appendix A Three Course Catalog Sites
Taxonomic Course Catalog Main Page (Partial Screenshot)
Actual page can be found at http://www.electiveclasschoice.com/tx100

59
Thematic Course Catalog Main Page (Partial Screenshot) Actual page can be found at http://www.electiveclasschoice.com/th200

60
No Category Course Catalog Main Page (Partial Screenshot) Actual page can be found at http://www.electiveclasschoice.com/nc300

61
Appendix B Choice Overload Questionnaire
Freshman
Sophomore
Junior
Senior
Senior+
Not an undergraduate student
Yes
No
Evaluation of the Choice Process
How many semesters have you used a course catalog to choose classes?
Please choose your undergraduate year in school
How familiar did the course catalog format seem to you?
Not at all
familiar - 1 2 3 4 5 6 7 8 9
Extremely
familiar - 10
Were you able to select a course from the catalog that you are interested in registering for?
How satisfied are you with your choice?
Not at all
satisfied - 1 2 3 4 5 6 7 8 9
Extremely
satisfied - 10
How easy was it to make a choice?
Not at all
easy - 1 2 3 4 5 6 7 8 9
Extremely
easy - 10
What is your likelihood that you will actually register for the class that you selected from this course catalog?
Not at all
likely - 1 2 3 4 5 6 7 8 9
Extremely
likely - 10
How frustrated did you feel when attempting to make a choice?
Not at all
frustrated - 1 2 3 4 5 6 7 8 9
Extremely
frustrated -
10

62
1
2
3
4
5
How similar did you feel the classes were to each other?
Not similar at
all - 1 2 3 4 5 6 7 8 9
Very similar -
10
How did you keep record of your class selection? (i.e. wrote it down on a notepad, put it in a note in your phone, etc.)
How many classes did you select?
What do you think the purpose of this study was?
Please write any comments, questions, or suggestions that you may have for us below. (optional)

63
Appendix C Mogilner, Rudnick, and Iyenger’s (2008) Coffee Study Stimuli


![Untitled-1 [] · taxonomic characters. Zoological Nomenclature, origin of code, ICZN. UNIT V : Taxonomic Records And Publications Taxonomic keys, Taxonomic characters description,](https://img.pdfslide.net/doc/110x75/5e60819b810ee55ab507dd7d/untitled-1-taxonomic-characters-zoological-nomenclature-origin-of-code-iczn.jpg)