Embed Size (px)
Citation preview

St. John's University St. John's University
St. John's Scholar St. John's Scholar
Theses and Dissertations
2020
THE EFFECTS OF VIRTUAL LABORATORY ACTIVITIES ON THE EFFECTS OF VIRTUAL LABORATORY ACTIVITIES ON
SCIENCE LEARNING SCIENCE LEARNING
Nathlye Sudlow-Naggie
Follow this and additional works at: https://scholar.stjohns.edu/theses_dissertations

THE EFFECTS OF VIRTUAL LABORATORY ACTIVITIES ON SCIENCE
LEARNING
A dissertation submitted in partial fulfillment
of the requirements for the degree of
DOCTOR OF EDUCATION
to the faculty of the
DEPARTMENT OF ADMINISTRATIVE AND INSTRUCTIONAL LEADERSHIP
of
THE SCHOOL OF EDUCATION
at
ST. JOHN'S UNIVERSITY
New York
by
Nathlye Sudlow-Naggie
Date Submitted ___________
_________________________
Nathlye Sudlow -Naggie
Date Approved ____________
_________________________
Dr. Seokhee Cho
© Copyright by Nathlye Sudlow-Naggie 2020
All Rights Reserved
ABSTRACT
THE EFFECTS OF VIRTUAL LABORATORY ACTIVITIES ON SCIENCE
LEARNING
Nathlye Sudlow-Naggie
The purpose of this research was to observe the impact of technology on
improving science achievement in Elementary students. In specific, this research
investigated the effects of virtual science laboratory activities on the science learning
of 20 African American children in grades four. Using a quasi-experimental design,
students in grades four, were randomly assigned to a treatment (virtual labs) or
comparison (traditional hands-on labs) group. Ten children participated in the
treatment group and ten students participated in the comparison group. The children
conducted science experiments for 50 minutes, one time a week, for 8 weeks. Both
groups were given a pretest and posttest using the Terra Nova 3 Survey Assessment
in Science grade 4 and students’ motivation toward science learning (SMTSL)
questionnaire. Gains between the pretest and posttest scores were investigated for each
instrument using the Mann Whitney U test. The New York State Intermediate Level
Science Assessment Test (ILSAT) for grade 4 was also given to the treatment and
comparison group and investigated using the Mann Whitney U test. Children in the
treatment group did not show any significant gains in scores, on the Terra Nova 3 Survey
Assessment in Science for grade 4 and SMTSL, respectively, than children in the
comparison group. Children in the treatment group for the ILSAT showed a significant
higher score than children in the comparison group. In conclusion, the intervention had a

significant effect on the ILSAT score gains. The limitations of the research and
recommendations for future research were noted.

ii
ACKNOWLEDGEMENTS
I thank The Almighty Father for giving me the opportunity to go to St. Johns
University. I thank Dr. Seokhee Cho, my mentor, for her support and guidance. I also
thank, Dr. Paul Miller, Dr. Tjoe, Dr. Rene Parmar and Dr. Campbell for their guidance.
In addition, I thank the students, teacher and principal that participated in this research
and their commitment to science learning.
I thank my daughter, Catherine, my mother, Victoria, my brother, Neville, my
Sisters, Doreen, Carrie-Bell, my Aunts, Marcia and Jean and my Uncle Maurice for their
encouragement.

iii
TABLE OF CONTENTS
ACKNOWLEDGEMENTS ................................................................................................ ii
LIST OF TABLES ............................................................................................................. vi
LIST OF FIGURES ......................................................................................................... viii
CHAPTER 1 ....................................................................................................................... 1
INTRODUCTION .............................................................................................................. 1
Purpose of the Study ........................................................................................................... 5
Earnings of STEM workers outpace those in other kinds of jobs....................................... 9
Theoretical Framework ..................................................................................................... 14
Theoretical Framework for Analyzing Authentic Scientific Reasoning ........................... 15
Comparing and Contrasting Simple Inquiry Tasks and Authentic Research ................... 24
Significance of Study ........................................................................................................ 30
Research Questions ........................................................................................................... 34
Definition of Terms........................................................................................................... 35
CHAPTER 2 ..................................................................................................................... 38
Review of Related Literature ............................................................................................ 38
Challenges for Science Education at the Elementary School Level ................................. 39
Enhancing How Children Learn ....................................................................................... 40
Actively Engaging Children Learning .............................................................................. 41
Computer Based Technologies in Laboratories ................................................................ 41
Science: Visualization, Modeling, and Simulation Studies .............................................. 44
SPSML Design.................................................................................................................. 51
Scaffolding and Fading ..................................................................................................... 54
Pedagogical design of the SPSML framework ................................................................. 55
Scaffolding ........................................................................................................................ 56
Fading ............................................................................................................................... 58
CHAPTER 3 ..................................................................................................................... 71
Methodology ..................................................................................................................... 71
Research Questions ........................................................................................................... 76

iv
Sample and Population ..................................................................................................... 77
Research Design and Data Analysis ................................................................................. 79
Treatment/Intervention Virtual Computerized Science Experience ................................. 79
Instrument(s) ..................................................................................................................... 87
Procedures ......................................................................................................................... 88
Data Collection and Statistical Analysis ........................................................................... 89
CHAPTER 4 ..................................................................................................................... 92
Results ............................................................................................................................... 92
CHAPTER 5 ..................................................................................................................... 99
Interpretation of Results .................................................................................................... 99
Summary of Findings and Discussion ............................................................................ 102
Limitations of the Study.................................................................................................. 109
Directions for Future Research ....................................................................................... 111
Implications for Future Practice ...................................................................................... 114
APPENDIX A ................................................................................................................. 119
New York State Standards for Grade 4........................................................................... 119
APPENDIX B ................................................................................................................. 124
Classroom Observation Notes......................................................................................... 124
APPENDIX C ................................................................................................................. 133
IRB Approval Letter ....................................................................................................... 133
APPENDIX D ................................................................................................................. 134
Child Assent Form .......................................................................................................... 134
APPENDIX E ................................................................................................................. 135
Parent/Guardian Consent Form....................................................................................... 135
APPENDIX F.................................................................................................................. 136
Sample Traditional Lab................................................................................................... 136
APPENDIX G ................................................................................................................. 138
Sample Student Work (Traditional Lab)......................................................................... 138
APPENDIX H ................................................................................................................. 140
Sample of Student Work (Virtual Lab) ........................................................................... 140
APPENDIX I .................................................................................................................. 144

v
Approval Letter from Principal ....................................................................................... 144
APPENDIX J .................................................................................................................. 145
Students Motivation Towards Science Learning Questionnaire ..................................... 145
REFERENCES ............................................................................................................... 148

vi
LIST OF TABLES
Table 1: Summary of Key Differences Across Four Types of Research Tasks ............... 20
Table 2: Traditional (Comparison) Vs. Virtual Group (Treatment Group) ...................... 71
Table 3: Description of Participants ................................................................................. 78
Table 4: Instrument Validity ............................................................................................. 88
Table 5: Descriptive Statistics for Terra Nova Pre and Post Survey Tests and Mann-
Whitney U Test on the Difference in the Gains between Comparison and Treatment
Groups. .............................................................................................................................. 93
Table 6: Descriptive Statistics for Terra Nova Science Inquiry Pre and Post Survey Tests
and Mann-Whitney U Test on the Difference in the Gains between Comparison and
Treatment Groups. ............................................................................................................ 93
Table 7: Descriptive Statistics for Terra Nova Physical Science Inquiry Pre and Post
Survey Tests and Mann-Whitney U Test on the Difference in the Gains between
Comparison and Treatment Groups. ................................................................................. 93
Table 8: Descriptive Statistics for Terra Nova Life Science Inquiry Pre and Post Survey
Tests and Mann-Whitney U Test on the Difference in the Gains between Comparison and
Treatment Groups. ............................................................................................................ 94
Table 9: Descriptive Statistics for Terra Nova Earth Science Inquiry Pre and Post Survey
Tests and Mann-Whitney U Test on the Difference in the Gains between Comparison and
Treatment Groups. ............................................................................................................ 94

vii
Table 10: Descriptive Statistics for The Intermediate Level Science Assessment Tests and
Mann-Whitney U Test on the Significant Difference between Comparison and Treatment
Groups. .............................................................................................................................. 95
Table 11: Descriptive Statistics for SMTSL Questionnaire Science Learning Value and
Mann-Whitney U Test on the Difference in the Gains between Comparison and
Treatment Science Lab Classes ........................................................................................ 96
Table 12: Descriptive Statistics for SMTSL Questionnaire Science Efficacy and Mann-
Whitney U Test on the Difference in the Gains between Comparison and Treatment
Groups. .............................................................................................................................. 96
Table 13: Descriptive Statistics for Terra Nova Survey and Subcategories Mann-Whitney
U Test on the Difference in the Gains by Gender. ............................................................ 97
Table 14: Descriptive Statistics for ILSAT Score and Mann-Whitney U Test on the
Significant Difference by Sex (Gender). .......................................................................... 97
Table 15: Descriptive Statistics for Science Learning Value and Self Efficacy Gain and
Mann-Whitney U Test on Test on the Difference in the Gains between Comparison and
Experimental Science Lab Classes by Sex (Gender). ....................................................... 98

viii
LIST OF FIGURES
Figure 1: Percentage of U.S. Bachelor’s Degrees Awarded to African Americans in
STEM Fields ....................................................................................................................... 2
Figure 2: Blacks and Hispanics underrepresented across most STEM job ........................ 8
Figure 3:Typical Stem Worker Now Earns Two-Thirds More Than Non-Stem .............. 10
Figure 4: STEM Workers Tend To Earn More Than Similar Educated Non-Stem ......... 11
Figure 5: Three-Quarters of Americans Say They liked K-12 Science Classes ............... 12
Figure 6: Americans See Range of Problem in K-12 Stem Education ............................. 14
Figure 7: Kolb's Experiential Learning Model ................................................................. 51
Figure 8: Three Stage Scaffolding System ....................................................................... 57
Figure 9: Screenshot of Weight & Mass Simulation ........................................................ 81
Figure 10: Sample of Student Exploration Lab Sheet Intro .............................................. 82
Figure 11: Sample of Student Exploration Lab Sheet Activity A .................................... 83
Figure 12: Screenshot of Lab 1 Student Exploration Measuring Volume Simulation ..... 85
Figure 13: Screenshot of Lab 1 Student Exploration Measuring Volume Simulation of a
graduated cylinder underneath a faucet filled with water ................................................. 86
Figure 14: Screenshot of Lab 1 Student Exploration Measuring Volume Simulation
Enlargement of Graduations ............................................................................................. 87
1
CHAPTER 1
INTRODUCTION
As part of a national conversation in the United States (U.S.), authentic and
purposeful standards of teaching and learning have been recognized by all levels of
education policy makers as valuable underpinnings of Science, Technology, Engineering,
and Mathematics (STEM) curriculum (Educational Policy Improvement Center, 2009;
National Research Center, 1996, 2010, 2011, 2012, 2013). In the U.S., an educational
initiative called STEM (Science, Technology, Engineering, and Mathematics) education
has become a hallmark for leading revisions to teaching and learning standards for
science and mathematics related content as well as professional development and
preservice programs to better prepare teachers in the field of science education to be more
authentic and purposeful when approaching teaching and learning (Chiapetta & Koballa,
2010; Luft, Bell, & Gess-Newsome, 2008; Next Generation Science Standards Lead
States, 2013; NRC, 1996; National Science Teachers Association, 2002).
Although these national standards and educational initiatives for science learning
were developed to advance students in elementary and High School in the U.S., many of
these students are failing to obtain college degrees in the areas science, math and
engineering especially African American and Latino American students. Figure 1 below
shows the percentage of U.S. bachelor's degrees awarded to African Americans in
Science, Technology, Engineering, and Mathematics (STEM) fields, as well as the
percentage of college-age Black, Non-Hispanics in the U.S. population from 1997 to
2017 (American Physical Society, 2018). In 2017, only 7% of African Americans

2
received a Bachelor’s degree in Chemistry, 2% in Earth Science, 4% in Math and
Statistics, 8% in Biology, 3% in Physics and 4% in Engineering (American Physical
Society, 2018) .
Figure 1: Percentage of U.S. Bachelor’s Degrees Awarded to African Americans in
STEM Fields
Traditional teaching strategies in science classrooms have leaned heavily towards
teacher-centered instruction in which the teacher teaches and the student listens, and this
model has been challenged with national guidelines for teaching science (Chiapetta,
2008; Chiapetta & Koballa, 2010; Koch, 2010). However, developers of current science
education initiatives are promoting contemporary practices emphasizing student-centered
activities using strategies of inquiry and experiential learning in which the student is
doing as well as listening (Abrams, Southerland, & Silva, 2008; Chiappetta, 2008;
Hodson, 1988; Luft, Bell, & Gess-Newsome, 2008; Rutherford & Ahlgren, 1990;
Windschitl, 2008). In this study students conducted virtual laboratory investigations
(treatment group) that involved computerized simulation exercises and traditional hands-
on inquiry exercises (comparison group) that they were able to do as a student-centered

3
activities.
The current and most innovative approach to national science standards are
referred to as Next Generation Science Standards (NGSS Lead States, 2013; NRC, 2012).
Continued efforts have been made to improve access to math and science education for
all students while also improving the learning experiences that engage young learners to
improve literacy in these areas (Hong & Lin, 2011; Koballa, 2011; Koballa & Crawley,
1985; Lynch, 2000; Mayers & Koballa, 2013; Minger & Simpson, 2006; Naiz, 2011;
NRC, 2010, 2012; Rutherford & Ahlgren, 1990; Smith & Scharman, 1999). The modern
standards for STEM education include using varied teaching strategies with purposeful
science information in an authentic learning environment, for example the incorporation
of project and community based learning (Barmby, Kind, & Jones, 2008; NGSS Lead
States, 2013; NRC, 1996, 2012).
STEM education is an example of a leading U.S. model in science and
mathematics education in which advocates encourage instructional practices that provide
for learning through constructive processes (NRC, 2012; NSTA, 2015). A committee
formed by the National Research Council (NRC, 2011) identified three significant goals
to improving STEM education effectiveness in the United States (U.S.) education.
According to this same report, national studies report a need to address the importance of
preparing students in the U.S. for STEM careers. In a national study, 75% of eighth
graders in the U.S. do not demonstrate effective skills in mathematics for their grade level
(NRC, 2011). As a result, NRC (2011) provided a framework for teachers and education
policy makers from the national to the local levels of education to improve STEM
education effectiveness in the U.S. education system.

4
The NRC (2011) identified goals and criteria for STEM school success.
According to the NRC (2010) the three goals to STEM school success were:
1. Expand the number of students who ultimately pursue advanced degrees and
careers in STEM fields and broaden the participation of women and minorities in
those fields.
2. Expand the STEM-capable workforce and broaden the participation of
women and minorities in that workforce.
3. Increase STEM literacy for all students, including those who do not pursue
STEM-related careers or additional study in the STEM disciplines.
NRC (2011) identified the key factors necessary to make these goals happen in U.S. K-
12 education through effective progress in developing common standards and
curriculum, better preparing teachers, development of more effective and relevant
assessment tools, adequate instruction time, and accessibility of education for all
students.
In science classrooms, inquiry is a teaching methodology that provides varied
opportunities for students to move from passive to active learners, engaging authentically
with the new and previously gained knowledge (Chiappetta & Koballa, 2010; Koch;
2010; Martin, 1997). Students are able to understand the information from a learning
experience because of the active process of learning. According to Frieberg and Driscoll
(2005), a constructivist classroom allows for students to build knowledge through
experiences such as touch, sound, taste, and hearing. Frieberg and Driscoll (2005)
suggested three important aspects to be considered in a learning environment: value of
ideas constructed by students, active engagement in higher order questioning strategies as

5
the students are learning, and emphasis on student thinking rather than rote responses
from memorization strategies.
Purpose of the Study
The intent of the proposed study is to learn about ways in which African American
students can utilize technology in school to improve academically in science. The need
for this study is very urgent. Reaching children during these years is critical to reaching
science education objectives, because the attitudes and interests that these students form
during their middle school years supply the foundation for future academic and personal
decisions (Hueftle, Rakow, and Welsh, 1983). Learning science at the elementary level
can influence whether or not the student chooses a career (doctor, nurse, medical
examiner, science teacher, forensic scientist, astronomer, physicist, pharmacist etc.) in
science.
According to recommended guidelines from the National Science Education
Standards (NSES, 1996) and related STEM education research, learning science through
direct physical experiences must begin early in life and continue as the child matures
through knowledge gained from living and academic interactions (Chiapetta & Koballa,
2010; Marzano, Norford, Paynter, Pickering, & Gaddy, 2001; Worth & Grollman, 2003).
Educators who provide an opportunity for meaningful experiences for young learners can
foster positive memories and experiences that influence a student’s perception of science
education and can thereby improve science literacy (Barmby et al., 2008; Koch, 2010;
Rutherford & Algren, 1990).
The virtual laboratory science activities can allow elementary students to gain
exposure to a multitude of scientific experiments and topics that will help them to pique

6
their curiosity at an early age. Many African Americans attend schools that lack science
resources that necessitate the utilization of equipment for science experimentation.
Because of the nature of the virtual learning platform students can conduct virtual hands
on explorations with various virtual laboratory equipment and supplies that are most
often unavailable for use at the school level. The expectation is that these students will be
exposed to a variety of scientific investigations and conceptual scientific knowledge that
will better prepare them for future STEM courses and stimulate their interests towards a
career in STEM.
African Americans as well Latinos are currently underrepresented in science,
technology, and engineering and math jobs, relative to their presence in the overall U.S.
workforce, particularly among workers with a bachelor’s degree or higher (Funk &
Parker, 2018). According to the research by (Funk & Parker, 2018) most African
Americans in STEM positions consider major underlying reasons for the
underrepresentation of African Americans and Latinos in science, technology,
engineering and math occupations to be limited access to quality education,
discrimination in recruitment and promotions and a lack of encouragement to pursue
these jobs from an early age.
The data in their report (Funk & Parker, 2018) comes from two sources: 1) a Pew
Research Center analysis of the U.S. Census Bureau’s 1990 and 2000 decennial censuses
as well as aggregated 2014-2016 American Community Survey data and 2) a nationally
representative survey of 4,914 U.S. adults, ages 18 and older, conducted July 11-Aug. 10,
2017 which included an oversample of employed adults working in science, technology,
engineering and math (STEM) jobs (Funk & Parker, 2018). The STEM jobs include but

7
are not limited to jobs in Health, Life Science, Math, Physical Science, Computers, and
Engineering (Funk & Parker, 2018).
Analysis of their report shows that African Americans and Latinos made up
around a quarter (27%, 11% for African Americans and 16% for Latinos) of the overall
U.S. workforce as of 2016, but together they accounted for only 16% of those employed
in a STEM occupation (Funk & Parker, 2018). African Americans make up 11% of the
U.S. workforce overall but represent 9% of STEM workers, while Latinos comprise 16%
of the U.S. workforce but only 7% of all STEM workers. And among employed adults
with a bachelor’s degree or higher, African Americans are just 7% and Latinos are 6% of
the STEM workforce. The share of African Americans working in STEM jobs has gone
from 7% in 1990 to 9% today and that for Latinos has gone up from 4% to 7% (Funk &
Parker, 2018). However, African Americans and Latino workers continue to be
underrepresented in the STEM workforce.
Past studies have raised a number of possible reasons for this underrepresentation,
including the need for racially and ethnically diverse mentors to attract more African
Americans and Latinos to these jobs, limited access to advanced science courses, or
socioeconomic factors that may disproportionally affect these communities (MacPhee,
Farro & Canetto, 2013).
When asked about the underlying reasons why African Americans and Latinos are
underrepresented in this type of work, those working in STEM point to factors rooted in
educational opportunities (Funk & Parker, 2018). Some 52% of those with a STEM job
say a major reason for this underrepresentation is because African Americans and Latinos

8
are less likely to have access to quality education that prepares them for these fields,
while 45% attribute these disparities to these groups not being encouraged at an early age
to pursue STEM-related subjects (Funk & Parker, 2018).
In addition, 42% of Americans say limited access to quality education to prepare
them for these fields is a major reason African Americans and Latinos are
underrepresented in the STEM workforce; this view is held by a majority of those
working in STEM who are African Americans (73%) and about half of Latinos (53%),
Asians (52%) and whites (50%) in STEM jobs (Funk & Parker, 2018).
The majority of STEM workers in the U.S. are white (69%), followed by Asians
(13%), African Americans (9%) and Latinos (7%) (Funk & Parker, 2018). According to
Figure 2, compared with their shares in the overall workforce whites and Asians are
overrepresented; African Americans and Latinos are underrepresented in the STEM
workforce as a whole (Funk & Parker, 2018).
Figure 2: Blacks and Hispanics underrepresented across most STEM job

9
[Health technician and nursing jobs have some of the largest shares of
African Americans or Latino workers. For example, 37% of licensed
practical and licensed vocational nurses are either African American or
Latino, as are a quarter or more of health support technicians (27%),
medical records and health information technicians (25%), and clinical
laboratory technologists and technicians (25%). Among registered nurses,
17% are African Americans or Latinos. By comparison, other health-
related jobs have smaller shares of workers who are African Americans or
Latinos including physicians and surgeons (11%), pharmacists (10%),
dentists (9%), and physical therapists (9%). Just 5% of optometrists,
veterinarians and chiropractors are African Americans or Latinos. In the
physical sciences, African Americans and Latinos together comprise 22%
of chemical technicians but only 14% of chemists and materials scientists,
10% of atmospheric and space scientists, 7% of environmental scientists
and 6% of astronomers and physicists. Among mathematical workers,
19% of operations research analysts are African Americans or Latino,
compared with just 5% of actuaries] p.2
Of these African American STEM workers, more of them were likely to be
foreign born than African American workers overall (22% vs. 14%) (Funk & Parker,
2018).
Earnings of STEM workers outpace those in other kinds of jobs
Among full-time, year-round workers ages 25 and older, median earnings for
STEM occupations were $71,000 in 2016 (Fayer, Lacey, & Watson, 2017). Comparable

10
earnings for non-STEM workers were $43,000. According to Figure 3, STEM workers
typically earn about two-thirds more than those in non-STEM jobs (Langdon, McKittrick,
Beede, Khan, & Doms, 2013).
Figure 3: Typical Stem Worker Now Earns Two-Thirds More Than Non-Stem
Even among workers with similar levels of education, STEM workers earn significantly
more than non-STEM workers (Funk & Parker, 2018). Figure 4 shows that among those
with some college education (including those with an associate but not a bachelor’s
degree); the typical full-time, year-round STEM worker earns $54,745 (Funk & Parker,
2018). A similar non-STEM worker earns $40,505, 26% less (Funk & Parker, 2018).

11
Figure 4: STEM Workers Tend To Earn More Than Similar Educated Non-Stem
African Americans and Latinos would have access to this kind of income if they
readily chose STEM careers for their profession. The Funk & Parker’s (2018) study
revealed that one of the first ways Americans encounters science, technology,
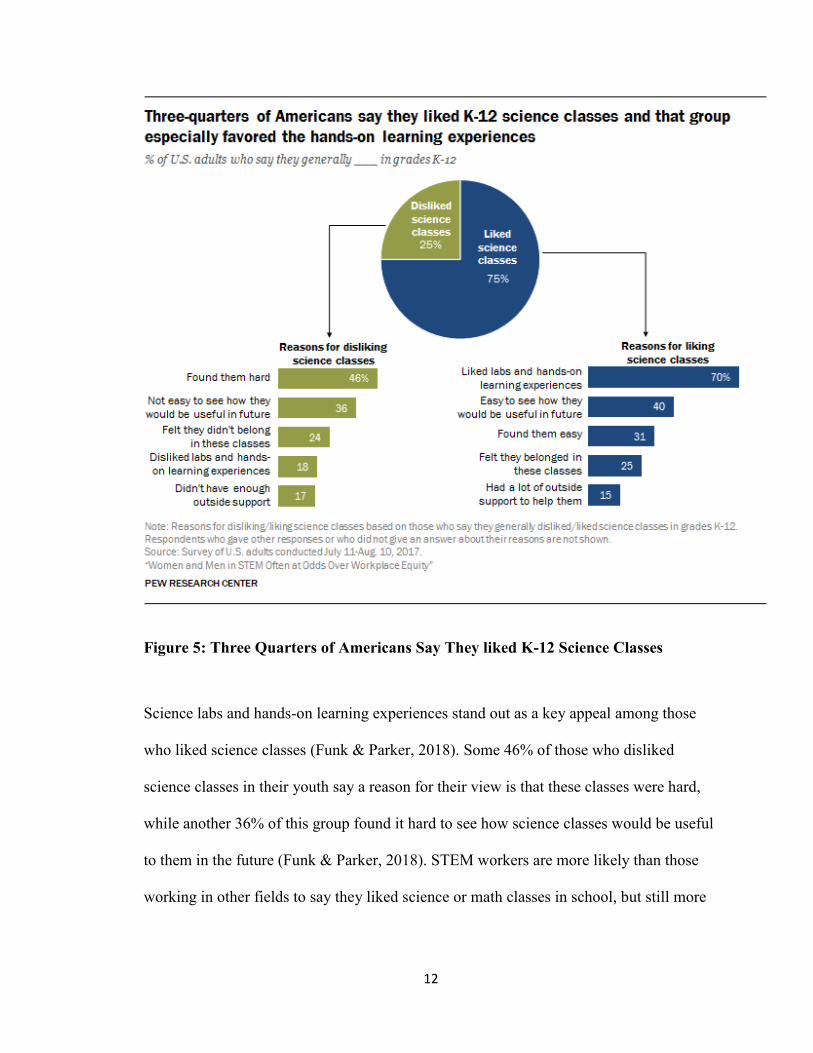
engineering and math is through their early education. Figure 5 shows that as Americans
look back on their own K-12 experiences, three quarters (75%) report that they generally
liked science classes (Funk & Parker, 2018).
12
Figure 5: Three Quarters of Americans Say They liked K-12 Science Classes
Science labs and hands-on learning experiences stand out as a key appeal among those
who liked science classes (Funk & Parker, 2018). Some 46% of those who disliked
science classes in their youth say a reason for their view is that these classes were hard,
while another 36% of this group found it hard to see how science classes would be useful
to them in the future (Funk & Parker, 2018). STEM workers are more likely than those
working in other fields to say they liked science or math classes in school, but still more

13
than four-in-ten non-STEM workers say they liked both subjects in grades K-12 (Funk &
Parker, 2018).
When asked when in their life they were interested in pursuing a STEM
job or career, most pointed to when they were in high school, college or
during their 20s. About four-in-ten (41%) say that they had this interest in
college or during their 20s and another 28% say they were interested in
high school or their teenage years. Fewer say they were interested in
pursuing a STEM career early in life, in elementary school or their
childhood (10%) or later in life over the age of 30 (5%). When asked why
they did not end up pursuing a career or job in STEM, the most commonly
cited reason was cost and time barriers (27%), such as the large amount of
time and money required for education or a general lack of access to
resources and opportunities. Some 14% say that they did not end up in a
STEM career because they struggled to do well in STEM classes or just
lost interest in STEM. A similar share (11%) cites personal or family
circumstances. (p. 7).
A majority of Americans say problems for K-12 STEM education can be
attributed to limited parental involvement as well as failings in student work ethic and
diminished interest in learning (Funk & Parker, 2018). But, at the same time, many adults
believe such problems are the result of teaching methods and curriculum emphasis on
meeting state standards (Funk & Parker, 2018). Roughly half of the public says a big
problem for STEM education comes from teachers rarely using methods that help
students think critically and problem solve (49%), spending too little time on these

14
subjects in elementary school (48%) or not having up-to-date curriculum materials (48%)
according to Figure 6 (Funk & Parker, 2018).
Figure 6: Americans See Range of Problem in K-12 Stem Education
Theoretical Framework
One of the central goals of science education was to promote scientific reasoning
in students (AAAS, 1993; National Research Council, 1996). Many schools employed
students to participate in science based inquiry activities that facilitated writing

15
observations and/or conducting experiments. The main purpose of these tasks was to
allow students to reason in a scientific way and gain cognitive understanding.
In the article “Epistemologically Authentic Inquiry in Schools: A Theoretical
Framework for Evaluating Inquiry Tasks”, Chinn and Maholtra (2002) argued that many
scientific inquiry tasks given to students in schools do not reflect the core attributes of
authentic scientific reasoning. The underpinnings of their research were based on a
theoretical framework that evaluated inquiry tasks in terms of how similar they were to
authentic science (Chinn and Maholtra, 2002). The authors delineated their theoretical
framework by contrasting authentic scientific inquiry with the simple inquiry tasks found
in many textbook-based science curricula (Chinn and Maholtra, 2002). They noted that
textbook inquiry tasks continue to be an important influence on science curricula
(Driscoll, Moallem, Dick, & Kirby, 1994; Kulm, Roseman, & Treistman, 1999; Stinner,
1995) and are often used by science teachers during classroom instruction.
Theoretical Framework for Analyzing Authentic Scientific Reasoning
The primary objective of science education is to enable students to acquire
scientific thinking ability (Chinn and Maholtra, 2002). In order to achieve this goal
students take part in science inquiry activities such as performing science investigations
(Chinn and Maholtra, 2002). Oversimplified forms of science inquiry activities are often
found in schools (AAAS, 1993). Subsequently, students don’t learn to develop theories
that explain a diverse array of evidence, decide what evidence should be used, and
critique explanations and procedures (National Research Council, 1996).

16
The Benchmarks for Science Literacy(AAAS,1993) and The National Science
Education Standards (National Research Council, 1996) highlighted a need to develop a
detailed, systematic analysis of the characteristics of authentic scientific reasoning (Chinn
& Maholtra, 2002).These recommendations focused on helping students learn authentic
scientific inquiry (Chinn & Maholtra, 2002).
Authentic scientific inquiry is a complex activity, employing expensive
equipment, elaborate procedures and theories, highly specialized expertise, and advanced
techniques for data analysis and modeling (Dunbar, 1995; Galison, 1997; Giere, 1988).
Authentic scientific inquiry refers to the research that scientists actually carry out
(Chinn & Maholtra, 2002).
Research essentially conducted by scientists takes on many forms; from case
studies in ecology to complex experiments using particle accelerators (Chinn & Maholtra,
2002). A description of the experiment below shows how an actual authentic scientific
inquiry activity is conducted.
fMRI study. Hirsch, DeLaPaz, Relkin, Victor, Li, Karl, Olyarchuk, &
Georgakakos, (1993) used functional magnetic resonance imaging (fMRI) to
investigate the effects of visual stimulation on neural activity, as indicated by
increased oxygenated blood flow to specific regions of the brain. To provide an
oversimplified overview, in fMRI studies a person lies motionless in a small
space surrounded by a magnet that generates a powerful, uniform magnetic field.
When placed in this magnetic field, paramagnetic atoms, especially hydrogen
atoms, align their polarities with the field, effectively pointing them in the same

17
direction. This alignment is then disturbed by introducing a radio wave frequency
pulse. As the atoms return to their normal state, they emit signals during their
decay that are measured by a detector. Because of differences in magnetic
properties of oxygenated and deoxygenated blood, the decay rate in deoxygenated
blood is greater than that of oxygenated blood. Through complex mathematical
transformations, the decay signals are electronically converted into images in
which higher densities of oxygenated blood in the brain are indicated by lighter
pixels on an image. The goal of the Hirsch et al. study was to investigate how
visual stimulation affects patterns of blood flow in the brain. The researchers
expected that visual stimulation would increase blood flow to three regions of the
brain, called regions 17, 18, and 19. Participants were placed in a magnetic field
that permitted four parallel cross sections of the brain to be imaged. Then a series
of radio pulses was introduced. At each radio pulse, the researchers obtained
images for each cross section of the brain. Images made during visual stimulation
were compared statistically with images taken before and after stimulation, to try
to determine which areas of the brain showed increased blood flow during visual
stimulation. (p. 177-178)
Schools lack the time and resources to reproduce such research tasks (Chinn & Maholtra,
2002). Instead, educators must necessarily develop simpler tasks that can be carried out
within the limitations of space, time, money, and expertise that exist in the classroom
(Chinn & Maholtra, 2002). They must develop relatively simple school inquiry tasks that,
despite their simplicity, capture core components of scientific reasoning (Chinn &

18
Maholtra, 2002). Virtual simulated laboratory activities maybe the bridge needed to link
authentic science research tasks and simple school inquiry.
Most simple inquiry tasks appear regularly in textbooks (e.g., Daniel, Ortleb, &
Biggs, 1995; McFadden & Yager, 1993), trade books (e.g., Murphy, 1991; VanCleave,
1997; Whalley, 1992), educational software (e.g., Houghton Mifflin Interactive, 1997;
Theatrix Interactive, 1995), and websites of science activities (e.g., HIRO Science
Lessons, n.d.; The Science House, n.d.), and incorporate few if any features of authentic
scientific inquiry (Chinn & Maholtra, 2002).
In an analysis of the hands-on research activities in nine middle-school and
upper-elementary-school textbooks, Chinn and Maholtra (2002) found that most simple
inquiry tasks fell into three categories, which they call simple experiments, simple
observations, and simple illustrations (Chinn & Maholtra, 2002). In simple experiments,
students conduct a straightforward experiment, usually evaluating the effects of a single
independent variable on a single dependent variable (Chinn & Maholtra, 2002). For
example, in one experiment in a middle school textbook (McFadden & Yager, 1993),
students affix a meter stick to the edge of a table so that the meter stick extends out from
the table. Students then hang weights of various sizes to the end of the meter stick (Chinn
& Maholtra, 2002). The purpose is to investigate the effect of weight (the sole
independent variable) on how far the meter stick bends (the sole dependent variable)
(Chin & Maholtra, 2002).
In simple observations, students carefully observe and describe objects (Chin &
Maholtra, 2002). In one typical exercise in Warner, Lawson, Bierer, & Cohen (1991),

19
students observe a starfish, measuring features such as its diameter and noting the
location of various structures such as the mouth and tube feet. In simple illustrations,
students follow a specified procedure, usually without a control condition, and
observe the outcome (Chinn & Maholtra, 2002). Thompson, McLaughlin, and Smith,
(1995) presented an activity that will be called the bleach task. The experiment illustrates
a theoretical principle, and the text clearly specifies what the theoretical principle is
(Chinn & Maholtra, 2002).
For example, Students pour 20 ml of liquid laundry bleach into a large test tube
and then add 0.5 g of cobalt chloride to the bleach. Students place their thumbs
over the opening of the test tube to feel what happens (there is pressure from gas
forming); then they insert a blown-out but still glowing match into the top of the
tube. The textbook explains that the match ignites because oxygen is produced in
a chemical reaction. Simple illustrations are inquiry tasks only in the narrowest
sense. Students do encounter new empirical phenomena when they carry out the
procedure, but they have no freedom to explore further. (p. 179).
These simple inquiry tasks are most often conducted by students in a traditional lab
setting.
When scientists conduct scientific investigations they engage in six cognitive
processes. These cognitive processes are generating a research question, designing a
study to address the research question, making observations, explaining results,
developing theories, and studying others’ research (Chinn & Maholtra, 2002). According
to Chinn and Maholtra (2002), the cognitive processes that are needed in authentic

20
scientific inquiry differ with the cognitive processes that are needed in simple inquiry
tasks. As shown in Table 1, key differences of cognitive processes across the four types
of research tasks: authentic inquiry, simple experiments, simple observations, and simple
illustrations are summarized (Chinn & Maholtra, 2002).
Table 1: Summary of Key Differences Across Four Types of Research Tasks
Type of Reasoning Task
Cognitive
Process
Authentic
Inquiry
Simple
Experiments
Simple
Observations
Simple
Illustrations
Generating
research
questions
Scientists
generate their
own research
questions.
Research
question is
provided to
students.
Research
question is
provided to
students.
Research
question is
provided to
students.
Designing Studies
Selecting
variables
Scientists
select and even
invent
variables to
investigate.
There are many
possible
variables.
Students
investigate one
or two provided
variables.
Students
observe
prescribed
features.
Students
employ
provided
variables.
Planning
procedures
Scientists
invent complex
procedures to
address
questions of
interest.
Scientists often
devise analog
models to
address the
research
question.
Students follow
simple
directions on
how to
implement a
procedure.
Analog models
are sometimes
used, but
students do not
reflect on
whether the
models are
appropriate.
Students follow
simple
directions on
what to observe.
Analog
procedures are
usually not used.
Students
follow
simple
directions
on how to
implement
a
procedure.
Analog
models are
sometimes
used, but
students do
not reflect
on whether
the models

21
are
appropriate
.
Controlling
variables
Scientists often
employ
multiple
controls.
It can be
difficult to
determine what
the controls
should be or
how to set
them up.
There is a single
control group.
Students are
usually told
what variables
to control for
and/or how to
set up a
controlled
experiment.
Control of
variables is not
an issue.
Not applicable
Control of
variables is
not an
issue.
Not
applicable
Planning
measures
Scientists
typically
incorporate
multiple
measures of
independent,
intermediate,
and dependent
variables.
Students are told
what to
measure, and it
is usually a
single outcome
variable.
Students are told
what to observe.
Students
are told
what to
measure,
and it is
usually a
single
outcome
variable.
Making
observations
Scientists
employ
elaborate
techniques to
guard against
observer bias.
Observer bias is
not explicitly
addressed,
although
measuring
devices such as
rulers are used.
Observer bias is
not explicitly
addressed,
although
measuring
devices such as
rulers are used.
Observer
bias is not
explicitly
addressed,
although
measuring
devices
such as
rulers are
used.
Explaining results
Transforming
observations
Observations
are often
repeatedly
transformed
into other data
Observations are
seldom
transformed into
other data
formats, except
Observations
are seldom
transformed
into other
data formats,
Observations
are seldom
transformed
into other
data formats,

22
formats.
perhaps
straightforward
graphs.
except
perhaps
straightfor-
ward
drawings.
except
perhaps
straightfor-
ward graphs.
Finding flaws Scientists
constantly
question
whether their
own results and
others’ results
are correct or
artifact of
experimental
flaws.
Flaws in
experiments are
seldom salient.
Flaws in
experiments
are seldom
salient.
If students do
not get the
expected
outcome,
they often
assume that
they did the
experiment
incorrectly.
Indirect
reasoning
Observations
are related to
research
questions by
complex chains
of inference.
Observed
variables are
not identical to
the theoretical
variables of
interest.
Observations are
straightforwardly
related to
research
questions.
Observed
variables are the
variables of
interest.
Observations
are straight-
forwardly
related to
research
questions.
Observed
variables are
the variables
of interest.
Observations
are straight-
forwardly
related to
research
questions.
Observed
variables
differ from
theoretical
variables, but
the text
explains the
link directly.
Generalizations
Scientists must
judge whether
to generalize to
situations that
are dissimilar
in some
respects from
the
experimental
situation.
Students usually
generalize only to
exactly similar
situations.
Students
usually
generalize
only to
exactly
similar
situations.
Students
usually
generalize
only to
exactly
similar
situations.
Types of
reasoning
Scientists
employ
Students employ
simple
Students
employ
Students
employ

23
multiple forms
of argument.
contrastive
reasoning.
simple
inductive
reasoning.
simple
deductive
reasoning.
Developing theories
Level of theory
Scientists
construct
theories
postulating
mechanisms
with
unobservable
entities.
Students usually
uncover
empirical
regularities, not
theoretical
mechanisms.
Students
uncover
empirical
regularities.
Students do
experiments
that illustrate
theoretical
mechanisms,
but they do
not develop or
investigate
theories.
Coordinating
results from
multiple studies
Scientists
coordinate
results from
multiple
studies.
Results from
different
studies may be
partially
conflicting,
which requires
use of
strategies to
resolve
inconsistences.
There are
different types
of studies,
including
studies at the
level of
mechanism and
studies at the
level of
observable
regularities.
Students do just
a single
experiment.
Not applicable
Not applicable
Students only
make a
certain range
of
observations
at one time.
Not
applicable
Not
applicable
Students do
just a single
demonstration.
Not applicable
Not applicable

24
Studying
research reports
Scientists study
other
scientists’
research
reports for
several
purposes.
Students do not
read research
reports.
Students do
not read
research
reports.
Students do
not read
research
reports.
Comparing and Contrasting Simple Inquiry Tasks and Authentic Research
The difference between simple inquiry tasks and authentic research tasks is
significant. In comparison to authentic research tasks, simple inquiry tasks offer a diluted
kind of science exploration that most often impedes the scientific reasoning ability of
young students.
According to Chinn and Maholtra (2002) in simple inquiry tasks, students are told
what the research question is (e.g., find out what happens when you mix bleach and
cobalt chloride). By contrast, in authentic research, scientists must develop and employ
strategies to figure out for themselves what their research question is (Chinn & Maholtra,
2002).
In most simple inquiry tasks, students are told which of several variables to
investigate, and the variables are usually perceptually salient, such as weight and the
distance that a meter stick bends (Chinn & Maholtra, 2002). In authentic research,
scientists select their own variables from a very large pool of potential variables, and they
often invent or construct variables that are conceptually embedded in the theories being
tested (Chinn & Maholtra, 2002).

25
Procedures in most simple inquiry tasks are straightforward, as students follow a
short series of prescribed steps as in a recipe (Chinn & Maholtra, 2002). In
authentic research, procedures are complex and often require considerable ingenuity
in their development (Chinn & Maholtra, 2002).
In simple observations and simple illustrations, there are usually no control
conditions. In simple experiments, what needs to be controlled is usually straight-
forward. For example when conducting experiments to see whether seeds sprout
faster in the light or the dark, students consider a few variables such as the type of
seed used, the depth of the seed, the type of container, and the amount of water
given. Once students understand the control-of-variables strategy, they can almost
routinely go down a list of variables and make sure that all untested variables are
held constant across the conditions. In authentic research, by contrast, it can be
very difficult to know which variables need to be controlled and how to
implement proper controls. The reasoner needs a very good causal model of the
processes being tested in order to know what to control. (p.183-184)
Controlling variables is much more difficult in authentic science than in
simple varieties of school science (Chinn & Maholtra, 2002). Scientists must build up
a great deal of knowledge about the causal processes that operate under various
conditions in order to determine what the proper controls are. In authentic
experimentation, scientists measure many different variables, including
measurements that serve as manipulation checks, measurements of intervening
variables, and multiple outcome measures (Chinn & Maholtra, 2002). In most simple

26
experiments and simple illustrations, by contrast, there is just a single outcome measure,
such as the number of centimeters that a meter stick bends (Chinn & Maholtra, 2002).
In authentic scientific research, methods are complex and uncertain, and scientists
spend a great deal of time and effort worrying about possible errors in methods, both in
their own work and in the work of others (Chinn & Brewer, 1993; Franklin, 1986). By
contrast, simple inquiry tasks are so simple that there is little scope for finding flaws in
methods (Chinn & Maholtra, 2002). Relatively little can go wrong when hanging weights
from meter sticks. Ironically, simple inquiry tasks can lead students to become aware of
experimental error but promote a very unscientific approach to responding to errors
(Chinn & Maholtra, 2002). When conducting simple inquiry tasks as part of science labs,
students generally assume that if the results do not turn out right, they must have done the
experiment wrong (Pickering & Monts, 1982).
In simple inquiry tasks, generalizations are much more straightforward (Chinn &
Maholtra, 2002).
In the meter stick experiment, for example, students are not asked by the textbook
to discuss the extent to which this result generalizes to other situations. Simple
inquiry tasks require only a limited range of reasoning strategies. Simple
experiments require only a simple form of contrastive causal reasoning; for
instance, if the meter stick bends more when more weights are hung, then one
should conclude that increasing the weight makes the meter stick bend more. In
sharp contrast authentic reasoning requires the use of a broad array of diverse
reasoning strategies. Examples include postulating unobservable mechanisms that
27
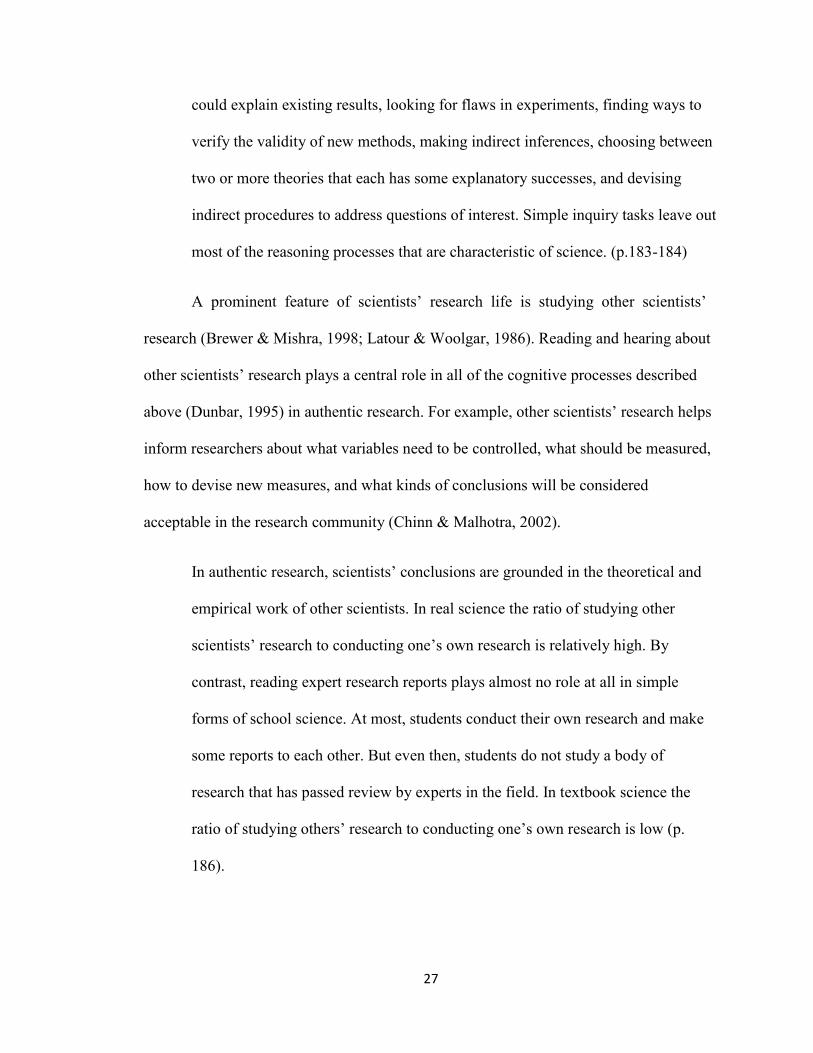
could explain existing results, looking for flaws in experiments, finding ways to
verify the validity of new methods, making indirect inferences, choosing between
two or more theories that each has some explanatory successes, and devising
indirect procedures to address questions of interest. Simple inquiry tasks leave out
most of the reasoning processes that are characteristic of science. (p.183-184)
A prominent feature of scientists’ research life is studying other scientists’
research (Brewer & Mishra, 1998; Latour & Woolgar, 1986). Reading and hearing about
other scientists’ research plays a central role in all of the cognitive processes described
above (Dunbar, 1995) in authentic research. For example, other scientists’ research helps
inform researchers about what variables need to be controlled, what should be measured,
how to devise new measures, and what kinds of conclusions will be considered
acceptable in the research community (Chinn & Malhotra, 2002).
In authentic research, scientists’ conclusions are grounded in the theoretical and
empirical work of other scientists. In real science the ratio of studying other
scientists’ research to conducting one’s own research is relatively high. By
contrast, reading expert research reports plays almost no role at all in simple
forms of school science. At most, students conduct their own research and make
some reports to each other. But even then, students do not study a body of
research that has passed review by experts in the field. In textbook science the
ratio of studying others’ research to conducting one’s own research is low (p.
186).
28
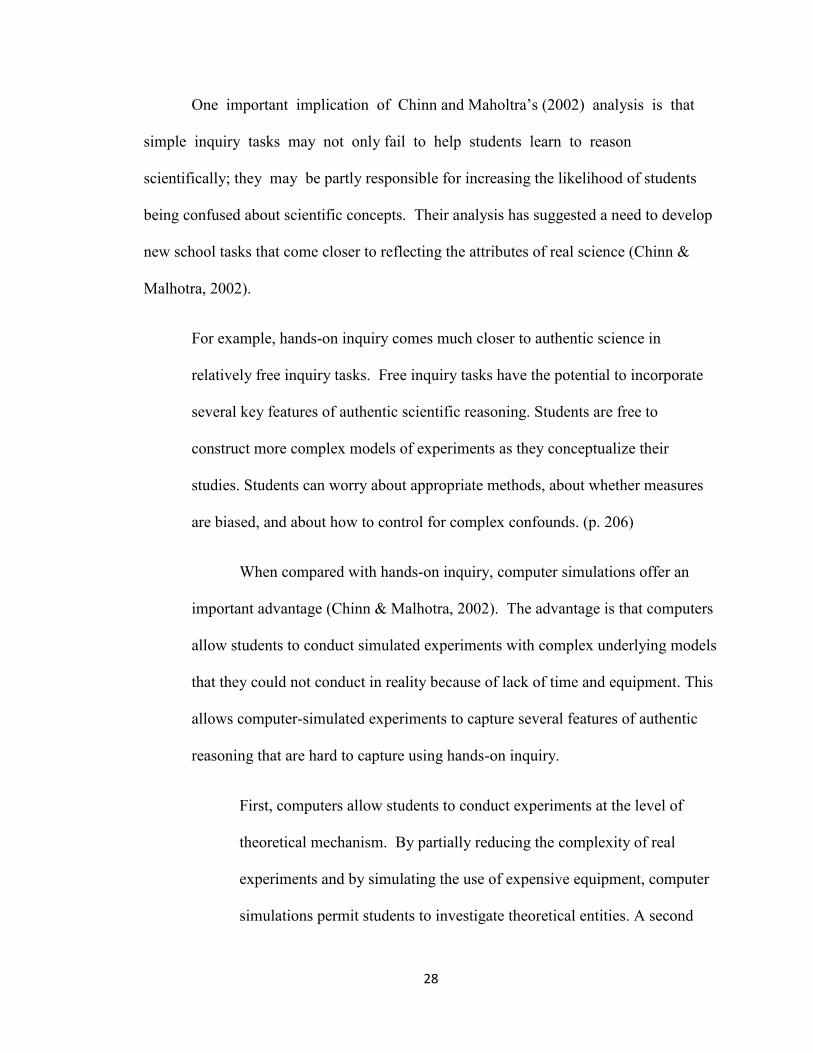
One important implication of Chinn and Maholtra’s (2002) analysis is that
simple inquiry tasks may not only fail to help students learn to reason
scientifically; they may be partly responsible for increasing the likelihood of students
being confused about scientific concepts. Their analysis has suggested a need to develop
new school tasks that come closer to reflecting the attributes of real science (Chinn &
Malhotra, 2002).
For example, hands-on inquiry comes much closer to authentic science in
relatively free inquiry tasks. Free inquiry tasks have the potential to incorporate
several key features of authentic scientific reasoning. Students are free to
construct more complex models of experiments as they conceptualize their
studies. Students can worry about appropriate methods, about whether measures
are biased, and about how to control for complex confounds. (p. 206)
When compared with hands-on inquiry, computer simulations offer an
important advantage (Chinn & Malhotra, 2002). The advantage is that computers
allow students to conduct simulated experiments with complex underlying models
that they could not conduct in reality because of lack of time and equipment. This
allows computer-simulated experiments to capture several features of authentic
reasoning that are hard to capture using hands-on inquiry.
First, computers allow students to conduct experiments at the level of
theoretical mechanism. By partially reducing the complexity of real
experiments and by simulating the use of expensive equipment, computer
simulations permit students to investigate theoretical entities. A second

29
feature of authentic science that can be captured easily by computer
simulations is the use of different types of experiments. Students can
conduct different types of experiments on the same issue in a computer
simulated environment. A third feature of authentic reasoning that can be
incorporated into computer simulations is the possibility of implementing
relatively complex designs. Computer simulations could also be designed
to simulate experiments in which methodology is a major concern. In this
type of simulation learners use different methods to investigate an issue,
and these methods yield conflicting results, which would impel learners to
think about how to reconcile the rival methods or how to decide which is
more reliable. (p. 208)
Chinn and Malhotra (2002) concluded that in order to promote authentic scientific
reasoning in schools, schools must develop,
1. reasoning tasks that afford authentic reasoning,
2. a better understanding of the strategies that scientists use when
reasoning on such tasks and
3. instructional strategies that ensure that students learn these
authentic reasoning strategies when they engage in authentic
inquiry tasks.
Students who learn authentic science reasoning skills at a young age may also be
afforded with more realistic science investigations that may serve to increase their
content knowledge and interest in particular areas of science for future studies.
30
Significance of Study
A focus on science, technology, engineering and mathematics (hereinafter
referred to as STEM) fields in education is needed for the United States to maintain its
competitive position in a global economy (Chen & Weko, 2009). Analysts predict that
the United States needs to produce approximately one million more STEM professionals
over the next ten years, which equates to increasing the number of students earning
STEM degrees by nearly 35% per year over current rates (President’s Council of
Advisors on Science and Technology, 2012). Colleges and universities are therefore
facing an unprecedented need to increase the number of undergraduate students who are
interested in majoring in STEM disciplines (Wang, 2012).
There is a large portion of students who are currently not fully participating in
science and engineering (Sevo, 2009). The United States currently has one of the lowest
rates of STEM to non-STEM bachelor’s degree production worldwide, with STEM
accounting for 17% of all degrees awarded in the United States in 2002 compared to the
international average of 26% (Kuenzi, 2008). The demand for skilled workers in STEM
fields will be difficult, if not impossible, to meet if the nation’s future mathematicians,
scientists, engineers, information technologists, computer programmers, and health care
workers do not reflect the diversity of the population (Institute for Higher Education
Policy (IHEP), 2010). Latinos are the fastest growing and youngest group in the United
States. It is estimated that Latinos will comprise 30 percent of the U.S. population by
2040 and will be the majority group in several states (U.S. Census Bureau, 2008).
At the same time however, Latino students are underrepresented in STEM fields
(U.S. Commission on Civil Rights, 2010). As such, filling the pool of qualified applicants
31
for employment in STEM fields will require a growing number of Latino students
studying STEM fields and earning STEM degrees (Oakes, 1990). Increasing the
percentage of Latinos and other traditionally underrepresented minorities in STEM
occupations is not only ethically and morally correct, as these groups deserve equal
access to STEM fields, but allows minority groups to serve as role models and mentors
for younger members of their own ethnic/racial group (Bonous-Hammarth, 2000;
Grandy, 1998).
The number of students (both Latino and non-Latino) enrolling in STEM fields is
on the rise. Enrollment in STEM fields from 1995-1996 to 2003-2004 increased 21
percent, compared to an increase of 11 percent in non-STEM areas. During that same
time, the percent of Latino students enrolling in STEM fields increased by 33 percent,
representing nearly ten percent of students in STEM fields (United States Government
Accountability Office, 2005). At the same time however, disproportionately low numbers
of Latinos currently persist in STEM (Oakes, 1990; Young, 2005). Although Latino
students have been shown to be equally likely as White students to major in STEM, they
are significantly less likely to earn a degree or certificate in STEM field (Chen & Weko,
2009). According to recent data from the Institute for Higher Education Policy (2010), 16
percent of Latino students who began college in 2004 as STEM majors completed a
STEM degree by 2009, compared to 25 percent of White students.
Data from the Integrated Postsecondary Education Data System (IPEDS)
Completion Survey for the 1999-2000 academic year points out that the most popular
majors in which Latino students earned bachelor’s degrees are in the social sciences,
business, psychology, and education (Crisp & Nora, 2012). In contrast, Latino students

32
are less likely to earn undergraduate degrees in biological and life sciences, computer and
information sciences, engineering, and the health professions and related sciences (Crisp
& Nora, 2012). These discrepancies that exist at the undergraduate level are also seen at
the master’s and doctoral levels, as Latino students are more likely to earn degrees in
education and are less likely to earn a master’s degree in the health professions,
engineering, computer information sciences, and business (Llagas & Snyder, 2003).
African Americans are disproportionately represented in STEM fields as well as
Latinos. In 2007 JBHE (Journal of Black Higher Education) reported that there were
2,275 doctorates awarded by universities in the United States in the fields of geometry,
computing theory and practice, astronomy, meteorology, theoretical chemistry,
geochemistry, geophysics and seismology, paleontology, mineralogy and petrology,
stratigraphy and sedimentation, geomorphology and glacial geology, acoustics,
elementary particle physics, biophysics, nuclear physics, plasma/fusion physics, polymer
physics, hydrology and water resources, oceanography, petroleum engineering, polymer
and plastics engineering, communications engineering, engineering mechanics, ceramic
science engineering, metallurgical engineering, agricultural engineering, engineering
physics, mining and mineral engineering, ocean engineering, animal breeding, animal
nutrition, agricultural plant breeding, plant pathology, horticultural science, fishing and
fisheries science, forest science and biology, forest resources management, wildlife/range
management, biotechnology, bacteriology, plant genetics, plant pathology biology, plant
physiology, botany, anatomy, entomology, zoology, and veterinary medicine; not one of
these 2,275 doctoral degrees went to an African American.

33
As reported in a recent JBHE (2017), data for the annual Survey of Earned
Doctorates shows that universities in the United States conferred 54,641 doctorates in
2017. Of these, 2,963, or 5.4 percent were awarded to African American students (JBHE,
2017).
But African Americans are vastly underrepresented among doctoral degree
recipients in some disciplines. For example, African Americans earned
only 1.2 percent of all doctorates awarded in physics to U.S. citizens and
permanent residents. African Americans earned 0.9 percent of all
mathematics and statistics doctorates, 1 percent of all doctorates in
computer science, 2 percent of all doctorates in chemistry, and only 1.7
percent of all doctorates awarded in engineering disciplines. In 2017, there
were 1,176 doctorates awarded by U.S. universities in the fields of plant
genetics, wildlife biology, medical physics, atmospheric physics, chemical
and physical oceanography, plasma/high temperature physics, geometry,
logic, number theory, robotics, structural engineering, English as a second
language, Italian, Middle/Near East history, classics, music, and music
performance. Not one went to an African American (p. 1).
The statistics regarding the progress of Latinos and African Americans in STEM fields is
disheartening to say the least in an advanced society such as the United States. The data
suggested that there may be an underlying problem with the educational opportunities in
STEM or lack thereof afforded to these disenfranchised groups in their early years of
schooling. This study was conducted for African American students. However, my
research regarding the impact of technology on improving science achievement in

34
Elementary students may be beneficial to Latino students, as they too are
disproportionately represented in STEM fields.
Research Questions
The following research questions and hypotheses were analyzed.
Research Question 1: Will students who conduct science investigations with
computerized virtual science laboratory experiments (treatment group) get significantly
higher scores on Standardized science achievement tests such as the Terra Nova 3
Survey Assessment in Science for grade 4 than students who conduct science
investigations utilizing traditional hands-on science laboratory experiments (comparison
group)?
Hypothesis 1: Students who conduct science investigations with computerized
virtual science laboratory experiments (treatment group) will get significantly higher
scores on Standardized science achievement tests such as the Terra Nova 3 Survey
Assessment in Science for grade 4 than students who conduct science investigations
utilizing traditional hands-on science laboratory experiments (comparison group).
Research Question 2: Will students in the treatment group score significantly
higher on the ILSAT than students in the comparison group?
Hypothesis 2: Students in the treatment group will get significantly higher scores
on the ILSAT than students in the comparison group?
35
Research Question 3: Will students in the treatment group score significantly
higher on their attitudes to science learning and self-efficacy than students in the
comparison group?
Hypothesis 3: Students in the treatment group will score significantly higher on
their attitudes to science learning and self-efficacy than students in the comparison group.
Students were assessed using the Terra Nova 3 Survey Assessment in Science for
grade 4 for Pre and Post-test. Students’ ILSAT examination scores for grade 4 were also
analyzed. SMSTL questionnaires were given as a Pre and Post-test and were analyzed.
Two groups were studied: One group participated in virtual science laboratory
activities and was randomly assigned to a treatment group while one group
participated in the science laboratory activities using traditional hands-on methods
and were assigned to a comparison group.
Definition of Terms
1. Terra Nova 3 Survey Assessment in Science for grade 4- An abbreviated
version of the Complete Battery and provides a general measure of
achievement, with a minimum amount of testing time. The Survey generates
norm-referenced achievement scores, criterion-referenced objective mastery
scores, and performance-level information.
2. Virtual Science lab activities- Virtual Labs help students learn basic
laboratory techniques and practice methods used by lab technicians and
researchers in a variety of careers. (https://www.explorelearning.com/)

36
3. New York Intermediate Level Science Assessment Test Grade 4- The
assessment asks students to demonstrate general knowledge of science, apply
scientific concepts, formulate hypotheses, make predictions, and use other
scientific techniques. The fourth grade science performance test is a timed test
consisting of multiple parts, the written portion of the test and a laboratory
performance examination which evaluates students’ ability to use hands-on
equipment and materials to record observations and answer scientific
questions.
4. Explorer Learning Gizmos- Gizmos are interactive math and science
simulations for grades 3-12. Over 400 Gizmos aligned to the latest standards
help educators bring powerful new learning experiences to the classroom.
5. Traditional Hands on Lab Activities- Traditionally, the terms “laboratory” or
“experiment” have been used to describe practical work done by students
during science class in place of such other methods of instruction as lecture,
reading, recitation, worksheets, and teacher demonstration.
6. STEM- “STEM” is the acronym of science, technology, engineering, and
mathematics. STEM education is an interdisciplinary approach to learning
where rigorous academic concepts are coupled with real-world lessons as
students apply science, technology, engineering, and mathematics in contexts
that make connections between school, community, work, and the global

37
enterprise enabling the development of STEM literacy and with it the ability
to compete in the new economy. (Tsupros, 2009)
7. Science Inquiry- Inquiry-based science adopts an investigative approach to
teaching and learning where students are provided with opportunities to
investigate a problem, search for possible solutions, make observations, ask
questions, test out ideas, and think creatively and use their intuition. In this
sense, inquiry-based science involves students doing science where they have
opportunities to explore possible solutions, develop explanations for the
phenomena under investigation, elaborate on concepts and processes, and
evaluate or assess their understandings in the light of available evidence. This
approach to teaching relies on teachers recognizing the importance of
presenting problems to students that will challenge their current conceptual
understandings so they are forced to reconcile anomalous thinking and
construct new understandings (Bulba, n.d.)
8. Metastrategy- An overarching strategy determining which other strategies to
use in a given situation (Your dictionary.com, 2018)
38
CHAPTER 2
Review of Related Literature
Educational scholars who have examined the factors that contribute to the
academic success of African Americans have focused on primarily two schools of
thought (Bush & Bush, 2010). The first school of thought analyzes individual
characteristics and the second focuses on pre-college indicators, known as cognitive and
non-cognitive variables, respectively (Bush & Bush, 2010). Cognitive variables are
factors such as high school grade point average, level of math completed, test scores, and
placement scores (Bush & Bush, 2010). Non-cognitive variables are factors such as social
interaction, motivation, and a student’s self-concept (Brooks-Leonard, 1991). Johnson
(1993), in his study of success factors for African Americans at the University of South
Carolina, defined cognitive variables, “as those variables that objectively measure
intellectual ability and are exhibited by some numerical score, rank or range” (p. 31).
Johnson defines non-cognitive variables “as affective, psychosocial constructs, subjective
in nature that describe the feeling, perceptions, and/or attitudes” (p. 31).
Research suggests that indicators, such as high school grade point average, test
scores, parental education level, and a positive self-efficacy, are correlated to the success
of African Americans in higher education (Bush & Bush, 2010). In this study, I aim to
propose the use of technology, in the form of computerized virtual lab activities, to
increase science standardized test scores (a cognitive variable) of African American
elementary school children.
39
Challenges for Science Education at the Elementary School Level
According to the research, elementary and middle school students present a
unique challenge for science education. Spanning grades K-8, they are a diverse group,
more varied, physically, intellectually, and socially than any other school age group
(DeHart, Hurd, Robinson, McConnell, & Ross, 1981). Children often lose their early
interest in science during these tumultuous years (Von Blum, 1992). The computer can
serve as an effective technological bridge to help science education meet its goals. For
example, for science & technology computers can simulate laboratory experiences that
are otherwise difficult, dangerous, or impossible to perform in usual classroom settings.
They can provide tools for gathering and analyzing data from simulated experiments or
from hands-on investigations (for example, via probeware) (Von Blum, 1992).
It is generally accepted that students learn best by doing – particularly in science
courses (Dalton, Morocco, Tivnan & Rawson Mead, 1997). In the article, Changing How
and What Children Learn in School with Computer-Based Technologies by Roschelle,
Pea, Hoadley, Gordin, and Means (2000), when students are engaged in “actively
constructing knowledge from a combination of experience, interpretation and structured
interactions with peers and teachers” (Roschelle et al., 2000, p.79), they are more likely
to gain an expert understanding of science concepts. The authors state, that technology
tools are one way to expose children to this type of learning (Roschelle et al., 2000)
because “the structure and resources of traditional classrooms” are often inadequate. With
that being said, “Technology – when used effectively – can enable ways of teaching that
are much better matched to how children learn” (Roschelle et al., 2000, p.79). While
many studies of technology use in the classroom have reported mixed results, the largest

40
gains seem to occur when technology tools are used to teach science and mathematics
(Roschelle et al., 2000).
Much of science learning is hands on, but there are instances when it is
impractical or impossible for students to participate in certain science activities. When
because of cost, time, safety issues, or accessibility–students are unable to engage in
certain activities, computer simulations can be an effective approach (Huppert, Lomask,
& Lazarowitz, 2002). These types of simulations are generally a software program or
online applet “with which children play and discover concepts and cause-effect
relationships through exploration and experimentation” (Henderson, Klemes & Eshet,
2000).
Enhancing How Children Learn
A major scientific accomplishment of the twentieth century has been the great
advancements in understanding cognition that is, the mental processes of thinking,
perceiving, and remembering (Bransford, Brown, & Cocking, 1999). For example,
cognitive research has shown that learning is most effective when four fundamental
characteristics are pre- sent: (1) active engagement, (2) participation in groups, (3)
frequent interaction and feedback, and (4) connections to real- world contexts (Roschelle
et al., 2000).
As scientists have understood more about the fundamental characteristics of
learning, they have realized that the structure and resources of traditional classrooms
often provide quite poor support for learning, whereas technology, when used effectively,

41
can enable ways of teaching that are much better matched to how children learn
(Roschelle et al., 2000).
Actively Engaging Children Learning
Learning research has shown that students learn best by actively "constructing"
knowledge from a combination of experience, interpretation, and structured interactions
with peers and teachers (Bransford, Brown, and Cocking, 1999). When students are
placed in the relatively passive role of receiving information from lectures and texts (the
"transmission" model of learning), they often fail to develop sufficient understanding to
apply what they have learned to situations outside their texts and classrooms (Bransford
&Schwartz, 1999). In addition, children have different learning styles. The use of
methods beyond lectures and books can help reach children who learn best from a
combination of teaching approaches (Tyack & Cuban, 1986). Today's theories of learning
differ in some details according to White House Publication Services, (2000) but
educational reformers appear to agree with the theoreticians and experts that to enhance
learning, more attention should be given to actively engaging children in the learning
process. Curricular frameworks now expect students to take active roles in solving
problems, communicating effectively, analyzing information, and designing solutions--
skills that go far beyond the mere recitation of correct responses (Bruer, 1993).
Computer Based Technologies in Laboratories
A present day methodology of investigative activities for student acquisition in
science is the incorporation of traditional (hands-on) and virtual (computerized) in the
laboratory setting. These inquiry-based scientific practices should take place in the

42
laboratory, the classroom, or the field where students are given opportunities to interact
directly with naturally occurring phenomena or with data originating from such
phenomena (Pyatt & Sims, 2012).
Research has shown that students could be provided effective learning experience
of science through the use of actual inquiry-based experimentation (Hofstein & Lunetta,
2004) and through the use of virtual laboratory environments that support
experimentation (Zacharia & Anderson, 2003). Although active constructive learning can
be integrated in classrooms with or without computers, the characteristics of computer-
based technologies make them a particularly useful tool for this type of learning
(Roschelle et al., 2000). For example,
Students certainly can actively engage in experiments without computers, yet
nearly two decades of research has shown that students can make significant gains
when computers are incorporated into labs under a design called the
"Microcomputer-Based Laboratory" (MBL). Two sixth-grade science classes grab
their palmtop computers with chemical sensors attached, and head out for a field
trip to the local creek. For more than five years, teachers at this school have taken
their sixth-grade science classes on this field trip. But before the advent of
palmtop computers, their students collected water samples and jotted down
observations during the field trip, then returned to the classroom to analyze the
pH, oxygenation, and other measures of the health of the creek. These tests took
days of dripping indicator solutions into test tubes of creek water and laborious
charting of the outcomes. Today, with the help of the palmtop computers, students
can measure the creek and see the results of their data gathering while still in the

43
field. The computers store and graph the data immediately, allowing students to
see how the graphs unfold in real time, directly related to their observations. The
immediacy of the process helps students understand what the graph's time axis
means, a challenge for many students who have only recently learned how to plot
points. In addition, students are able to develop their critical thinking skills by
analyzing their initial results and running follow-up experiments the same day (p.
80).
As illustrated by the description of an MBL, students conducting experiments can
use computers to instantaneously graph their data, thus reducing the time between
gathering data and beginning to interpret it (Roschelle et al., 2000).
In fairly widely replicated studies, researchers have noted significant
improvements in students' graph-interpretation skills, understanding of scientific
concepts, and motivation when using the software (Svec, 1994). For example, one study
of 125 seventh and eighth graders found that use of MBL software resulted in an 81%
gain in the students' ability to interpret and use graphs (Mokros & Tinker, 1987). In
another study of 249 eighth graders, experience with MBL was found to produce
significant gains in the students' ability to identify some of the reasons why graphs may
be inaccurate (Nachmias & Linn, 1987).
Although previous media technologies generally placed children in the role of
passive observers, these new technologies make content construction much more
accessible to students, and research indicates that such uses of technology can have
significant positive effects (Roschelle et al., 2000).

44
Science: Visualization, Modeling, and Simulation Studies
Computer-based applications using visualization, modeling, and simulation have
been proven to be powerful tools for teaching scientific concepts (Roschelle et al., 2000).
Technologies using dynamic diagrams-that is, pictures that can move in response to a
range of input-can help students visualize and understand the forces underlying various
phenomena (Roschelle et al., 2000). One example of this work is ThinkerTools,
http://thinkertools.org/Pages/curricula.html, a simulation program that allows “middle
school students to visualize the concepts of velocity and acceleration…by [showing]
students what they cannot see in the real world” (Roschelle et al., 2000. p.86). Simulated
objects on the screen move according to the laws of physics, with or without gravity and
friction, depending on the settings (Roschelle et al., 2000). Using the computer, students
can add arrows representing, “force, acceleration, and/or velocity, so that for the first
time students can actually ‘see’ the equation F=ma” (Roschelle et al., 2000, p.87). These
types of simulations are not intended to replace classroom experience or traditional lab
work; rather they provide students with the opportunity for repetition and exposure to
multiple representations (Huppert, Lomask, & Lazarowitz, 2002).
In controlled studies, researchers found that middle school students who used
ThinkerTools, developed the ability to give correct scientific explanations of Newtonian
principles several grade levels before the concept usually is taught (Roschelle et al.,
2000). Middle school students who participated in ThinkerTools outperformed high
school physics students in their ability to apply the basic principles of Newtonian
mechanics to real-world situations: the middle schoolers averaged 68% correct answers
on a six-item, multiple-choice compared with 50% for the high school physics students

45
(White and Fredriksen, 1998). Researchers concluded that the use of the ThinkerTools
software appeared to make science interesting and accessible to a wider range of students
than was possible with more traditional approaches (Roschelle et al., 2000).
In the study, Virtual and Physical Experimentation in Inquiry-Based Science
Labs: Attitudes, Performance and Access, Pyatt and Sims (2012), investigated the
learning experiences that occur in physical and virtual inquiry-based lab investigations, in
first-year secondary chemistry classes. The researchers in this study investigated how
physical (also known as traditional) and virtual inquiry-based lab investigations can be
effectively used in an inquiry-based science environment to promote conceptual change
and access (Pyatt & Sims, 2012).
The lab investigations chosen for this study were recommended laboratory
investigations for students in preparation of advanced placement chemistry and were
previously adopted and integrated into the existing chemistry curriculum where the study
took place (Pyatt & Sims, 2012). These investigations focused on the topic of
stoichiometry, which has been shown to be a particularly significant and challenging
concept for students and one which hands-on experimentation can facilitate the formation
of conceptual understanding (Pyatt & Sims, 2012).
This study utilized an experimental crossover design (Kenward, 2005) which
consisted of two separate trials of laboratory investigation: trial 1 Empirical Formula of a
Hydrate; trial 2 Stoichiometry by Loss of CO2.
The crossover design was chosen because it allowed comparisons between control
and treatment groups for each trial, while at the same time allowed each

46
participant to experience two different independent lab experiences. Each of the
two trials used in this study consisted of a treatment (virtual lab experience) and
control (physical experience) for a lab investigation involving chemical
stoichiometry. The laboratory procedures, background material, and required
materials and equipment were identical for the control and experimental group.
The only difference was that the control group ran the laboratory investigation
using actual equipment and materials, while the experimental group ran the
laboratory investigation using only laptop computers. The computers had a
simulation of the same lab. (p. 136)
The simulation software selected for this study was from Late Nite Labs (2008).
This software has been widely used in college-level and high-school level chemistry
courses, and includes a suite of laboratory experiences consistent with those recommend
for preparation of advanced placement chemistry (Late Nite Labs, 2008). Student
performance (cognitive domain) for each laboratory investigation was measured as were
student attitudes (affective domain) towards the virtual and physical laboratory
investigations (Pyatt & Sims, 2012).
This study took place in a public suburban high-school in southwestern USA. The
duration of the study was a 2 year period and involved a total of 8 first-year
chemistry classes (N = 184): 4 classes participated in year one (N = 96); and 4
participated in year two (N = 88). The same instructor taught all 8 of these
classes. Participants were randomly assigned participants to either a control
(physical lab investigation) or treatment group (virtual lab investigation) for the
trial- 1 laboratory investigation. A total of (N = 184) students completed the trial-

47
1 laboratory experience: Empirical Formula of a Hydrate. Ninety-eight students
were assigned to the control group and 86 were assigned to the treatment group.
Trial- 1 was then carried out by participants in each class. The class periods were
approximately 55 min. (p. 136-137)
Following the trial- 1 lab investigation, participants completed a lab assessment
which measured student performance (cognitive domain) (Pyatt & Sims, 2012). It
required students to analyze, interpret and formulate hypotheses from data collected
throughout their lab experience, virtual or physical (Pyatt & Sims, 2012). The assessment
was the same for the control and for the treatment groups (Pyatt & Sims, 2012).
Trial-2 Approximately 1 week later, participants who were assigned to the control
group for trial- 1, crossed-over to the treatment group for trial-2. Similarly, trial- 1
participants who were assigned to the treatment group, crossed-over to the control
group for trial-2. A total of (N = 184) students conducted the laboratory
experience: Stoichiometry by Loss of C02. Eighty- six students (N=86) were
assigned to the control group and (N = 98) were assigned to the treatment group.
The laboratory investigation was then carried out by students in each of the
participating classes. The class periods were 55 min. Following the laboratory
investigation, participants completed a lab assessment which measured student
performance (cognitive domain) and required students to analyze, interpret and
formulate hypotheses from data collected, virtual or physical. Following the
completion of the assessment, participants completed a survey which measured
student attitudes towards the virtual and physical lab experiences for the
laboratory investigation. (p. 138-139)

48
The mean lab performance score for Trial 1, the control group was (M = .49, SD
= .50) and the mean lab performance score for the treatment group was (M = .64, SD =
.48) (Pyatt & Sims, 2012). A t Test was conducted for this sample to determine whether
or not significant differences existed between the mean performance scores for the
control and treatment group. Based on the t Test, ř (l) = 1.71, (p < .09), there was no
significant difference between mean assessment scores for the control (physical lab)
group and for the treatment (virtual lab) group (Pyatt & Sims, 2012). Students who
conducted the trial-1 lab virtual investigation scored the same as students who performed
the identical lab using physical equipment and materials (Pyatt & Sims, 2021).
However, for Trial 2, students who conducted the virtual version of the lab
investigation significantly outperformed students who performed the same lab
using physical equipment and material. The mean lab performance score for the
control group was (M = .068, SD = .25) and the mean lab performance score for
the treatment group was (M = 1.2, SD = 1.3). A t Test was conducted for this
sample to determine whether or not significant differences existed between the
mean performance scores for the control and treatment group. Based on the t Test,
t( 1) = 6.50, (p < .0001), the mean assessment scores for the control (physical
lab) group were significantly lower than the mean assessment scores for the
treatment (virtual lab) group. Virtual lab experiences resulted in greater learning
gains above and beyond those achieved in comparable physical lab experiences.
The findings form this study indicates that, in terms of learning outcomes, virtual
lab experiences were equal to or greater than physical lab experiences. (p. 139)
49
A total of (N = 173) students completed the Virtual and Physical Experimentation
Questionnaire (VPEQ) which measured learner attitudes (affective domain) towards
experimentation in virtual and physical environments (Pyatt & Simms, 2012) in five
scales, usefulness of computers, anxiety towards computers, open-endedness, usability of
lab equipment, usefulness of lab for physical and virtual environments. The survey data
were gathered and analyzed with the statistical analysis package SPSS (Pyatt & Simms,
2012). Pyatt and Simms, (2012) findings revealed that students demonstrated an above
average comfort level with computer use in lab settings (M=3.7, SD=1.1). Moreover,
Pyatt and Simms, (2012) found that students had little or no anxiety towards the use of
computers in classroom and laboratory settings (M = 1.8, SD = 1.0) According to Pyatt
and Simms, (2012), students found the virtual equipment easier to use than the physical
equipment (MP=2.5, SDP=1.1; MV=3.5, SDV=1.1). Students also found virtual
experimentation more open-ended than physical experimentation (MP=2.3, SDP=1.2;
MV=3.7, SDV=1.1) (Pyatt & Simms, 2011). Additionally, Pyatt and Simms’, (2012) data
established that the usefulness of virtual labs and physical labs to be similar, if not the
same for students (MP=3.2, SDP=.086; MV=3.3, SDV=.085).
In the paper, Developing and Implementing a Framework of Participatory
Simulation for Mobile Learning Using Scaffolding, Yin, Song, Tabata, Ogata, & Hwang
(2013) discusses how simulation software can be used to enhance learning in Computer
Science. The underpinnings of their paper stems from research that hypothesizes that
more and more participatory simulations have been developed on mobile devices for
educational use (Klopfer, 2008; Klopfer & Squire, 2008; Squire & Jan, 2007) that can
50
provide models of real-world settings for students to construct knowledge through active
participation in learning activities (Patten, Arnedillo-Sanchez & Tangney, 2006).
Yin et al., (2013) developed an innovative framework called scaffolding
participatory simulation for mobile learning (SPSML), a context-aware participatory
simulation for mobile learning using scaffolding and fading approaches whereby students
can be scaffolded when needed, and the fading strategies are initiated when the students
have achieved what they want to learn.
Yin et al., (2013) uses prior research in describing all aspects of their framework.
For example, according to Dey (2001, p.5) a system is considered context-aware “if the
system uses context to provide relevant information and/or services to the user, where
relevancy depends on the user’s task”. Klopfer & Squire (2008) states that mobile devices
are well suited to context-aware applications due to their sensitivity in gathering and
responding to real or simulated data unique to a particular location, environment and time
The authors also delineated past research that support their framework in their
article. For example, according to past research by Klopfer & Squire (2008) and Patten et
al., (2006), participatory simulations provide models of real-world settings in which
students can construct knowledge through active participation in learning activities.
Additionally, Naismith, Lonsdale, Vavoula, and Sharples, (2004) concluded in their
research that context-aware participatory simulation encourages more active participation
and interaction among students because students “do not just watch the simulation, they
are the simulation” (p.13). According to Dede (2005), participatory simulations (a)
support collaboratively sieving and synthesizing experiences rather than individually

51
locating and retrieving information, (b) enhance active learning based on real and
simulated experiences that offer opportunities for reflection, and (c) facilitate the co-
design of learning experiences personalized to individual needs and preferences.
Yin et al., (2013) states that these approaches which have been incorporated into
the SPSML framework, enables students to become immersed in an augmented learning
environment in which they take an active role in their learning process and enhance their
understanding of abstract concepts in complex learning situations.
SPSML Design
The pedagogical design of the SPSML is premised on Kolb’s experiential
learning model, which focuses on experience as the main force driving learning because
“learning is the process whereby knowledge is created through the transformation of
experience” (Kolb, 1984, p. 38). It happens in a cyclical model (see Figure 7) consisting
of four stages: concrete experience, reflective observation, abstract conceptualization, and
testing in new situations (de Freitas & Neumann, 2009; Kolb, 1984; Lai, Yang, Chen, Ho,
Liang & Wai, 2007).
Concrete Experiences
Abstract Conceptualizations
Testing in New Situations Reflective Observation
Figure 7: Kolb's Experiential Learning Model
52
In order to facilitate the pedagogical design predicated on Kolb’s (1984)
experiential learning model, the SPSML-based system was trialed and evaluated in a
computer science application called learning sorting algorithms with mobile devices
(LSAMD) (Yin et al, 2013). The LSAMD is designed to help students learn abstract
concepts presented in face-to-face classrooms (Yin et al, 2013) with the support of
computerized mobile devices such as tablets and PDAs.
The following describes the four stages of the experiential learning model:
1. Concrete experience: Student experiences can fluctuate between the virtual
environment and real life by enabling digital simulations in authentic problem-solving
situations in which learners play different roles to interact with other entities that have
different skills (Dede, 2009).
2. Reflective observation: Reflection may involve revisiting learning activities.
Although reflection can occur during any stage of the experiential learning cycle, these
explicit virtual tasks ensure that students can engage in reflection (de Freitas & Neumann,
2009).
3. Abstract conceptualization: Students gain new knowledge by integrating
previous observations, interactions and reflections into logically sound concepts, which
provides contexts in which they can consciously create structured understandings of their
experience (Yin et al., 2013). The focus should be on what kinds of abstractions would be
most relevant in student learning contexts, using experiential learning models with a view
to the particular learning outcomes (Yin et al., 2013).
53
4. Testing in new situations: In the on-going iterative cycle, students are expected
to be able to test and practice these concepts by actively experimenting, for example, in a
follow-up practice in new situations (Yin et al., 2013). Thus, as a component of a course
curriculum, the participatory simulation provides a virtual space that complements their
learning in real life and within which they can engage experientially to construct
conceptual knowledge (Yin et al., 2013).
Although comprehensive, the experiential learning model (Kolb, 1984) has its
downsides. First, it lacks a mechanism for making students focus on the learning
objectives in context (Kolb, 1984). Second, students may lack the skills and pay
inadequate attention to abstraction of concepts from experience (Kolb, 1984). In order to
overcome for the shortcomings in the learning model, Yin et al (2013) adopted (a)
Squire’s (2006) and Schank, Fano, Bell, and Jona (1994) goal based approach to
participatory simulations (a constructivist view) was built into to SPMSL based system.
They also built-in scaffolding and fading strategies which will be discussed later.
According to Yin et al., (2013), the important aspects of the goal-based approach
are to focus on the learning goals that should be intrinsically motivating and the role that
the learner plays.
The criteria for the goal based design of learning are as follows:
• Thematic coherence. The process of achieving the goal is thematically
consistent with the goal itself.
• Realism. The design must be authentic to produce varied opportunities
for learning the target skills and knowledge.

54
• Empowerment. The design puts students in control to increase the sense
of agency.
• Responsiveness. Prompt feedback is provided to help students acquire
skills and knowledge.
• Pedagogical goal support. The proposed design is compatible with and
supports the acquisition of skills and knowledge.
• Pedagogical goal resources. Students are provided with appropriate help.
(p.139)
Additionally, the role that the learner plays is important because it necessitates the
reinforcement and exploration of difficult concepts that is often times presented in
teacher-student classroom situations. The participatory simulations provide students with
an opportunity to experience, observe and reflect, form abstract concepts, and test their
solutions in new situations (Yin et al., 2013).
Scaffolding and Fading
Scaffolding and fading built into the participatory simulations is another
important approach utilized into the SPSML based system (Yin et al., 2013). Scaffolding
enables learners to realize their potential by providing assistance when needed, and then
fading out this assistance as meaningful learning takes place (Collins, Brown, &
Newman, 1989). Fading ensures that the child does not become overly dependent on a
particular prompt when learning a new skill (Cooper, Heron, & Heward, 2007).

55
According to Yin et al., (2013), the notion of scaffolding is associated with the
work of Vygotsky (1978) who concludes that a novice learns with a more capable peer,
and learning happens within the novice’s zone of proximal development (ZPD). With the
development of technology, scaffolding tools are specially designed to help students learn
in the complex learning environment (Yin et al., 2013). Different learners in the same
class may have different ZPDs (Yin et al., 2013).
However, in many cases, support for learning provided by the tools “focuses on
providing ‘blanket support’ (i.e., the amount and type of support is constant for everyone
and is not sensitive to the changing level of understanding in learners)” (Puntambekar &
Hübscher, 2005, pp. 7–8). To cater to the different needs of students, in designing
scaffolding in tools, it is important to consider (a) the multiple ZPDs of students, (b)
building fading into the system so that the tools themselves may be removed when
students do not need them anymore, and (c) teacher’s orchestration and facilitation of the
learning process so that students can make good use of the scaffolding tools and
resources for learning (Puntambekar & Hübscher, 2005).
Pedagogical design of the SPSML framework
In Yin et al., ( 2013) study the author’s propose a context-aware participatory
simulation framework called SPSML for designing learning systems on mobile devices
using scaffolding and fading strategies. The SPSML is designed to facilitate students’
experiential learning in either complex social contexts or face-to-face classrooms (Yin et
al., 2013). The scaffolding and fading instructional strategies are used to help students’
experiential learning processes (Yin et al., 2013). It provides opportunities for students to
be involved in active participation and interaction and increases motivation (Yin et al.,

56
2013). The SPSML framework consists of five sequential but cyclic steps that use
Squire’s (2006) goal-based approach and scaffolding and fading strategy.
Step 1. Initial process -Before implementing the SPSML-based system, the teacher will
define: (a) the learning objectives of the activity, (b) the simulation tasks, and (c) the
rules and participant roles for playing the simulation (Squire, 2006).
The learning objectives are to help the students to reach their goals, and they need
to be identified in order to help the students accomplish the tasks successfully. To
begin the activity, the teacher will set up rules and participant roles to configure
the system. The teacher will explain to the students the general ideas of concepts
to be learned in face-to-face classrooms and provide examples to guide them. The
teacher will also explain to the students the learning objectives of the activity and
how to use the system on their mobile devices such as personal digital assistants
(PDAs). (p. 140-141)
Step2. Concrete experience Concrete experience is composed of scaffolding and fading
procedures (Yin et. al., 2013).
Scaffolding
When students start experiencing and acting during the activity, the teacher will
assign different tasks and roles for them to play in the simulation, according to the
rules. The system on the mobile device will guide the students in how to do the
tasks and play the roles if they need help. This step acts like a bridge used to
enable the students to master the conceptual knowledge in face-to-face
classrooms. The system assists students by providing information about where the

57
mistakes are and how to correct them so that they are able to achieve the goals of
the task. This system is composed of three stages: point out mistakes, help to
correct, and discuss (see Figure 8): (p. 141)
1. Point out mistakes. The scaffolding system will assist students by providing
some instructions about where the mistake is immediately after they make the
mistake. It helps the students complete the task effectively.
2. Help to correct. When the students cannot solve the problem themselves, the
system will facilitate them in this regard.
There are three kinds of scaffolds at this stage: hint, illustration and teacher’s
help, as shown in Figure 8. (p. 141)
• Hint. The system will offer a hint about a solution to help the student
find out ways to perform the tasks and play the roles based on an ongoing
diagnosis of student learning (Yin et. al., 2013).
Figure 8: Three Stage Scaffolding System

58
• Illustration. The system will describe the goals of the tasks or provide
key information about how to play the role with a simple example (Yin et. al.,
2013).
• Teacher’s help. If the students want to make an inquiry to a teacher, the
system allows the teacher to provide facilitation (Yin et. al., 2013). The teacher
can observe the status of each student’s participation and the roles they are
playing on the mobile device in order to respond to the inquiry (Yin et. al., 2013).
3. Discuss. The students are allowed to discuss with partners via mobile devices.
Discussion is a source of ideas for other students, using evidence in support of
claims, getting advice, and providing explanations that others can understand, as
well as a vehicle for some of the reflection necessary to turn one’s experiences
into well-informed and well-indexed cases in one’s memory. The students will
construct the learning goals collaboratively via discussion. They construct initial
understandings of the concepts by participating in the discussion after the
concrete experience. (p. 141-142)
Fading
After participatory role play on the mobile device, students will gradually be able
to understand the methods and strategies to solve the problems and become more
experienced with the conceptual knowledge. At this point, the fading process
starts. The students use the fading mode to practice independently. Then, the
system reduces the help messages gradually, and more responsibilities are shifted
to the students. Finally, they will be able to solve the problems themselves
59
without the scaffolding of the system. In the meantime, the teacher can also help
orchestrate the gradual reduction of the system’s help function according to the
level of understanding of the students. (p.142)
Yin et al., (2013) designed the fading mode as three levels depending on the different
ZPDs of learners:
• Level 1. Point out the mistakes only, but require the students to find out how to
correct them. They can discuss with their role-play partners at this level. They can
also seek help from the teacher.
• Level 2. Do not point out the mistakes, but have the students correct them by
themselves. They cannot get help from the teacher, but they can discuss with their
partners.
• Level 3. Do not provide help and discussion, but have everyone complete the
task by him/herself at this level. After all the students pass Level 3, it means that
they have mastered the conceptual knowledge. (P.142)
Step 3. Observation and reflection. After completing the concrete experience of
participatory roles in the simulations, the students carry out discussions and
reflections. They reflect on what they have learned, how well they have
understood, and what else they want to learn. If they need more experience in
participatory simulations, they can restart the simulation from any step such as
from the scaffolding or fading step rather than from the initial step because all
their prior experience has been saved in the database.
60
Step 4. Abstract conceptualization. Because the student experience in the
participatory simulation is recorded and stored in the database and these records
can be converted to a video, the students can review their learning progress by
watching the video or looking at the history record. This step helps the students
transform their learning experience and construct conceptual knowledge to
achieve their learning goals.
Step 5. Testing in new situations. After conceptualizing what they have learned,
the students can try out the concepts in their real-life situations to deepen their
understanding of the conceptual knowledge. (p.142)
To find out if the SPSML-based system would be helpful for the learning process,
Yin et al., (2013) designed an experiment using an SPSML-based learning system called
LSAMD, learning sorting algorithms with mobile devices designed to help students learn
abstract concepts presented in face-to-face classrooms in a Computer Science setting.
The students were given four sorting algorithms in the system: bubble sort,
insertion sort, selection sort, and quick sort. Using this system, all the students
stand in a line with a PDA, and the teacher assigns an array of numbers to the
students and asks them to sort these numbers according to a certain algorithm.
The new position of each step is sent to the server. They receive these tasks,
collaborate, and exchange physical positions according to the algorithm. (p. 142)
As part of the experiment, Yin et al., (2013) set up a control group and an
experiment group to compare the accuracy rate of every sort algorithm (every step was
recorded).
61
Participants A, total of 41 master’s students with prior algorithm-sorting
experience, participated in the experiment. The students had learned the sorting
algorithms about three years earlier, when they were undergraduate students.
However, most of them had not used sorting algorithms for a long time so they
had forgotten the rules. The average age of the students was 22 years old. Their
past examination on sorting algorithms was used as the pretest. They were divided
into two groups according to their average achievement: 21 students were
assigned to be the experimental group (M achievement = 72.5), and 20 students
formed the control group (M achievement = 73). According to their pretest
achievement, it can be inferred that these two groups did not significantly differ
prior to the experiment. (p. 144)
The students in the control group learned with a sorting algorithm system, which
did not provide them with participatory simulations or scaffolding. When using
the system, the students first selected a sorting algorithm, and then the system
generated numbers in an array. The students performed the sorting operations by
exchanging the position of the numbers in the array. If the sorting was wrong, the
system only provided an error message such as “There are some mistakes,” but
did not point out where the mistakes were. These mistakes were stored in the
database. The students could also refer to books before using the system. For the
experiment group, the students learned with LSAMD. They stood in a line with a
PDA and participated in participatory simulations. They could use the scaffolds
“Point out mistakes,” “Hint,” “Illustration,” “Teacher’s help,” and “Discussion.”

62
The mistakes they made as well as the types of scaffolds they used to solve the
problem were stored in the database. (p. 144)
The accuracy rates of the two groups of students who sorted the data with
different algorithms were compared by an independent t-test. For the quick sort,
the average accuracy rate and standard deviation were 81.86 and 10.12 for the
experimental group, and 52.30 and 9.29 for the control group. The average
accuracy rate of the experiment group is higher than that of the control group, and
the difference between the two groups is statistically very significant (t = 9.73, p
< 0.01), indicating that the LSAMD system is helpful to students in enhancing
their conceptual understanding of this sorting algorithm. (p. 145)
On the other hand, for the bubble sort, insertion sort, and selection sort, the
average accuracy rates of the two groups do not show significant difference (Yin et al.,
2013). Because the “quick sort” has been recognized as more complicated than the other
sorting algorithms, it could be concluded that the SPSML framework was helpful to the
students in improving their learning achievement in terms of complicated conceptual
understandings and hence, enhancing their learning (Yin et al., 2013).
In the study, Are Virtual Labs as Effective as Hands-on Labs for Undergraduate
Physics? A Comparative Study at Two Major Universities, Darrah, Humbert, Finstein,
Simon and Hopkins (2014), the researchers investigated how the learning from virtual
experiences compares to learning acquired through hands-on experience. Their research
sought to prove that virtual physics lab experiences can provide for a more cost and time

63
saving virtual alternative or supplement to traditional hands on physics labs which have
become more increasingly expensive to upkeep and staff (Darrah et. al, 2014).
The underpinnings of their research are based on the premise that providing
meaningful laboratory experiences in an introductory physics lab course is necessary to
introduce, demonstrate, and reinforce physics concepts (Darrah et. al, 2014). Moreover,
these meaningful laboratory experiences can be conducted with a well-developed and
pedagogically sound virtual laboratory experience that can serve to supplement or even
replace existing hands-on lab experiences; thereby reducing the need for equipment and
lab space while offering a suitable alternative (Darrah et. al, 2014).
For example, traditional hands on, physics laboratory courses have been taught in
labs equipped with various levels of instrumentation. However as budget cuts
become more prevalent, it has become increasingly difficult, especially for small
colleges, to afford the expense of upgrading lab equipment [while] maintaining
adequate teaching staff. Additionally, in cases where students miss labs for
various reasons, professors find it difficult to set up the labs again for makeup
purposes. (p. 803-804).
Furthermore, with the increased number of online courses being offered, there
also exists a need for the implementation of online or virtual labs as supplements or
replacements for the traditional high school and college labs (Bhargava, Antonakakis,
Cunningham & Zehnder (2006). Darrah et al.,’s (2014) study revealed that virtual
physics lab experiences can provide an alternative or supplement to traditional hands-on
labs which have become of major investments of time and money.
64
The researchers evaluated a comprehensive set of virtual labs for introductory
level college physics courses and compared them to a hands-on physics lab experience
(Darrah et al., 2014). They conducted their research with 224 students from two large
universities and investigated the learning that occurred with students using the virtual
labs either in a lab setting or as a supplement to hands-on labs versus a control group of
students using the traditional hands-on lab only (Darrah et al., 2014).
The Virtual Physics Lab is a next generation computerized resource that seeks to
incorporate research-based active-learning characteristics as described in Meltzer and
Thornton (2012) and also utilizes the most recent technologies (i.e., videos with real
people, 3D interactive game-like simulations) making the experiments more "real world"
and engaging for students.
The labs were developed to provide a variety of problem-solving activities that
can be completed during class time. Students can work alone or in small groups to
complete the labs and receive rapid feedback from the computer simulation. The
simulations require active engagement and provide the material in context.
Conceptual thinking is emphasized, and students have the ability to complete the
experiments over and over to increase understanding. This study seeks to further
illustrate the point that when virtual labs are developed properly to contain all
necessary components, they can be just as effective in producing learning as
hands on labs. The authors wish to address the need for virtual labs while
highlighting the facts that virtual labs are shown to produce positive learning
outcomes for many students in this study (p. 805).

65
Through a Small Business Innovation Research (SBIR) contract funded by the US
Department of Education, Polyhedron Learning Media, Inc. created the Virtual Physics
Lab™, a set of online labs suitable for college level physics (Darrah et al, 2014). This
software incorporates the strategies of the "Five E Cycle" of engagement, exploration,
explanation, elaboration, and evaluation (Bybee, 2003).
In this sequence, students are motivated by a question of interest, such as might be
presented in a physics laboratory experiment, and then apply process skills to
describe findings and apply them in developing deeper understanding. The labs
were developed following a planned sequence that focused on content, technology
integration, and formative assessment. Throughout the development process,
formative assessment for usability, feasibility, and content was completed using a
heuristic approach (p. 805)
Each lab included general background information, theory, objectives, pre-lab
questions, a list of equipment needed to conduct the experiment hands-on, brief video
clips demonstrating an overview of the lab, post-lab questions, and a post-lab quiz
(Darrah et. al 2014). The primary components of the labs are the virtual laboratory
experiments, featuring interactive, real-time 3D simulations of laboratory equipment
along with data collection, analysis, graphing, and reporting tools that will allow users to
perform all phases of the experiment online using simulated equipment (Darrah et al.,
2014).

66
The virtual labs were selected to be part of the testing based on the ability of each
university to provide a true one-to-one comparison in terms of real lab equipment versus
virtual lab equipment (Darrah et al., 2014).
The following labs from Virtual Physics Lab were tested at the two locations:
Auburn University
• Uniformly Accelerated Motion on the Air Table
• Simple Harmonic Motion
• Ideal Gas Law
• Torques and Rotational Equilibrium
And Penn State University
• Uniformly Accelerated Motion on the Air Table
• Newton's Second Law of Motion
• Moment of Inertia and Rotational Motion
• Torques and Rotational Equilibrium of a Rigid Body
• Conservation of Momentum
• Conservation of Energy (p.806-807)
67
In every case, the analysis portion of the hands-on lab was modified to be
identical to the virtual lab analysis (Darrah et al., 2014). All questions, the procedure
followed, the data taking process and the data table, calculation, and questions asked
were the same for the hands-on and the virtual labs (Darrah et al., 2014). Each lab was
accompanied by a video demonstration of how the lab simulation was to be carried out.
Additionally, as each lab was completed, a printable lab report was generated, providing
students with hard copy of their data and graphs, and instructors with a convenient way to
assess student work (Darrah et al., 2014).
Two different sets of participants were used during the first and second phases of
testing. The first set of participants included 68 students from Auburn University.
The students were enrolled in different sections of Physics I. One group of these
students (n = 21) used the labs as a replacement to traditional labs, one group (n =
18) used the labs as a supplement to their traditional lab experience, and two
groups of students (n = 17 and n= 19) were used as control groups and completed
traditional hands-on labs. The groups were assigned at random to one of the two
treatments or control. The second set of participants included 156 students from
Penn State University enrolled in 16 different sections of Physics I. As in the
previous testing at Auburn University, lab sections were randomly assigned to
treatments. Students (n = 60) completed the hands-on labs and were used as a
control group; students (n = 49) completed the virtual labs; and students in
sections (n = 47) used the virtual labs as a supplement to the hands-on lab (p.
808).
68
For the Auburn University, a t- test was used to compare the Lab Quiz Average
(the average of four post-lab quiz grades) of the various sections (Darrah et al., 2014).
First, lab section 1 (M = 59.37, SD = 16.97, n = 23) was compared to section 2
(M = 58.16, SD = 20.86, n = 26). Lab section 1 did only the virtual labs, and lab
section 2 did the hands-on labs. The t-test shows that there is no evidence to
suggest that there is any significant difference between the quiz averages for the
two groups (two tailed p = 0.826). Lab section 3 (M = 52.06, SD = 17.18, n = 24)
completing the hands-on labs with the supplement of the virtual labs and lab
section 4 (M = 49.40, SD = 22.46, n = 21) completing the hands-on labs were
compared to each other. The t-test shows that there is no evidence to suggest that
there is any significant difference between the Average Lab Quiz Scores for the
two groups (two tailed p = 0.66). Lab sections 1 and 3 had access to the virtual
labs in some way, and lab sections 2 and 4 did only the hands-on labs. The t-test
shows that there is no evidence to suggest that there is any significant difference
between the Average Lab Quiz Scores for the two groups (p. 811).
A one-way Analysis of Variance was completed for Test Scores with all students
completing all three tests (Darrah et. al 2014).
First, the Hands-on Group was compared to the Virtual Group. There was no
significant difference found between the groups. Second, the Hands-on Group, the
Virtual Group, and the Supplemental Group Test Scores were all compared using
a one-way Analysis of Variance. There was no significant difference found
among the three groups. A one-way Analysis of Covariance revealed that the

69
difference between Virtual (M = 42.68, SD = 15.30, n = 28) and Hands-on (M =
43.91, SD = 16.58, n = 23) Groups' Test Scores was not statistically significant, F
= 0.43, p = 0.51. A one-way Analysis of Covariance revealed that the difference
among Virtual (M = 42.68, SD = 15.30, n = 28), Hands-on (M = 43.91, SD =
16.58, n = 23), and Supplemental (M = 47.92, SD = 15.94, n = 24) groups' Test
Scores was not statistically significant, F = 0.43, p — 0.65. (p. 811).
The analyses of the data at both universities show no evidence that one of the
treatments (virtual or hands-on) was more effective than the other in conveying the
concepts of the labs to the students and that there was no significant difference noted in
any of the tests, except to say there were significant learning gains for all groups from the
Pre-FCME (Force-Motion Conceptual Evaluation) to the Post-FMCE tests (Darrah et al.,
2014).
Sixty-seven students completed both the FMCE—a widely used and accepted
multiple-choice test to evaluate physics instruction (Sokoloff, Laws & Thornton,
2007). This test was given at the beginning of the semester and also at the end at
the beginning of the semester and at the end of the semester. A paired t- test run
for each individual group (Virtual, Hands-on, and Supplemental) showed that all
groups had significant learning gains from the Pre-FMCE to the Post FMCE.
From this, the researchers concluded that the Virtual Physics Lab software used in
these two introductory physics courses produced similar learning out comes as the
traditional hands-on traditional lab experience (p. 812).
70
Other studies in Darrah et al., (2014) focused on additional benefits of virtual
labs. Bhargava et al., (2006) tested the effectiveness of web based labs and noted that
virtual labs reduced equipment needs, were available at any time from any place, offered
more information to students, and offered students the opportunity to work at their own
pace while exploring difficult or interesting sections. Pyatt and Sims (2007) found
evidence to suggest that the hands-on lab has lost instructional value, while emerging
technologies such as simulations can be used as viable replacements. Wieman and
Perkins (2005) pointed out that the use of a real-life demonstration or lab often includes
an enormous amount of peripheral information, which can be avoided in a carefully
designed computer simulation.
It is evident from past and current research that simulated labs had many benefits
over the hands-on equivalents in that they (1) were perceived to be more open-ended, (2)
easier to use, (3) easier to generate usable data , (4) took less time than hands-on labs, (5)
greatly reduce the cognitive load for the students trying to determine what is important in
the experiment , (6) were readily available to students who were unable to physically
attend class, (7) produce positive learning outcomes for many students (Darrah et al.,
2014).

71
CHAPTER 3
Methodology
The Virtual Lab used in this study is called Explorer Learning Gizmos. Explorer
Learning Gizmo is an online computerized lab program that students utilize to conduct
virtual laboratory experiments. There are over 400 Gizmos aligned to the math and
science curriculum in grades 3-12. Teachers and/or students can search Gizmos according
to academic state standards (NY Standards Grade 4-see Appendix A), grade/topic and/or
textbook publisher.
For this study five Explorer Learning Labs were chosen based on their similarity
to traditional hands-on labs and the science objectives utilized by the classroom teacher
(see Table 2).
Table 2: Traditional (Comparison) Vs. Virtual Group (Treatment Group)
Lab
Number
New York State
Core Curriculum
Standards
Major
Understanding
s/ Objectives
Traditional Virtual
1
4.P3: Matter is
made up of
particles whose
properties
determine the
observable
characteristics
of matter and
its reactivity.
4.P3.1a: Matter
takes up space
and has mass.
Students will
observe,
describe, and
explore the
physical
properties of
water:
Changes in the
amount of space
occupied
(compare using
containers of
different shapes
and sizes),
Unit –Volume/
Capacity
Measuring
Volume
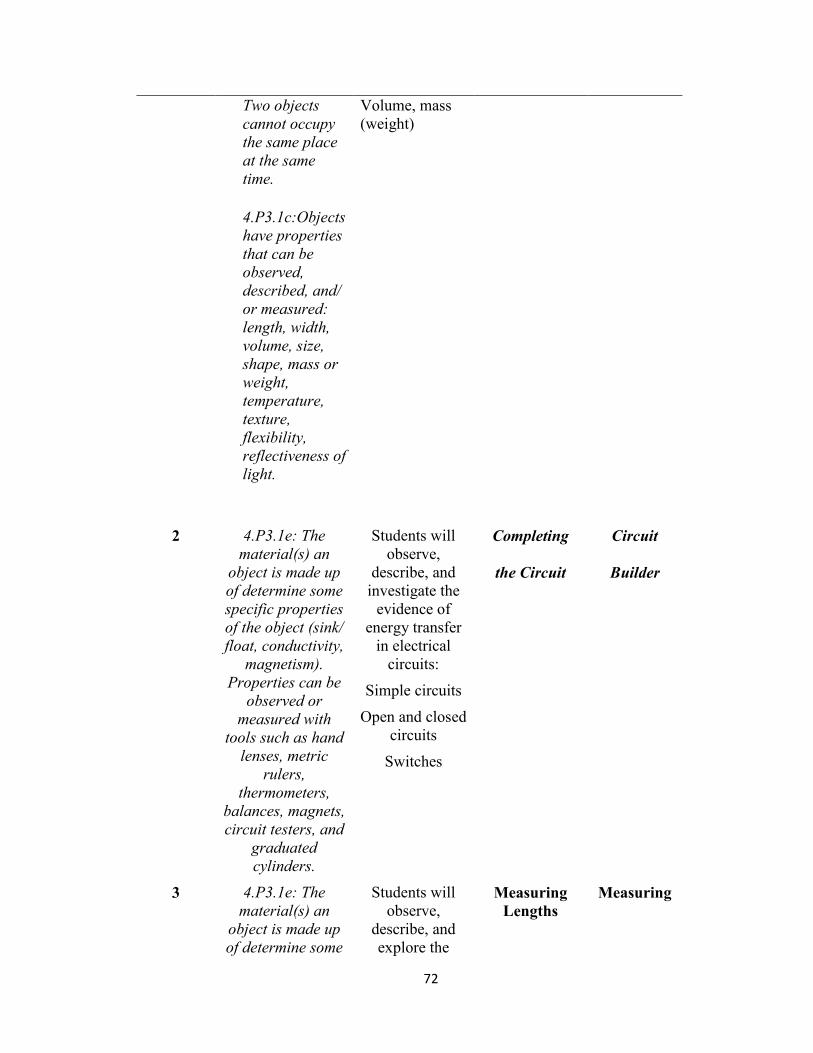
72
Two objects
cannot occupy
the same place
at the same
time.
4.P3.1c:Objects
have properties
that can be
observed,
described, and/
or measured:
length, width,
volume, size,
shape, mass or
weight,
temperature,
texture,
flexibility,
reflectiveness of
light.
Volume, mass
(weight)
2 4.P3.1e: The
material(s) an
object is made up
of determine some
specific properties
of the object (sink/
float, conductivity,
magnetism).
Properties can be
observed or
measured with
tools such as hand
lenses, metric
rulers,
thermometers,
balances, magnets,
circuit testers, and
graduated
cylinders.
Students will
observe,
describe, and
investigate the
evidence of
energy transfer
in electrical
circuits:
Simple circuits
Open and closed
circuits
Switches
Completing
the Circuit
Circuit
Builder
3 4.P3.1e: The
material(s) an
object is made up
of determine some
Students will
observe,
describe, and
explore the
Measuring
Lengths
Measuring

73
specific properties
of the object (sink/
float, conductivity,
magnetism).
Properties can be
observed or
measured with
tools such as hand
lenses, metric
rulers,
thermometers,
balances, magnets,
circuit testers, and
graduated
cylinders.
physical
properties of
solids:
Measuring
length, height,
diameter,
circumference
Trees
4
4.P3.1e: The
material(s) an
object is made up
of determine some
specific properties
of the object (sink/
float, conductivity,
magnetism).
Properties can be
observed or
measured with
tools such as hand
lenses, metric
rulers,
thermometers,
balances, magnets,
circuit testers, and
graduated
cylinders.
Students will
compare the
electrical and
magnetic
properties of
different
materials.
Amazing
Magnets
Magnetism
5
4.P3: Matter is
made up of
particles whose
properties
determine the
observable
characteristics
of matter and
its reactivity.
Students will
observe,
describe, and
explore the
physical
properties of
matter by
differentiating
between weight
and mass.
Measurement
: Weight and
Mass
Weight and
Mass

74
4.P3.1a: Matter
takes up space
and has mass.
Two objects
cannot occupy
the same place
at the same
time.
4.P3.1c: Objects
have properties
that can be
observed,
described, and/ or
measured: length,
width, volume,
size, shape, mass
or weight,
temperature,
texture, flexibility,
reflectiveness of
light.
Before students began the lab experiment, they were given a class User ID and
Password to log on to the Explorer Learning website. After the students logged in to the
website, they searched for the virtual laboratory experiment required for the lesson.
Students were given a lab worksheet with one to three prior knowledge questions. For
example, in the Weight and Mass lab experiment students may be asked to describe what
happens to an object when it sinks or floats. These questions were to be answered by the
students themselves, with a partner or as a class before they utilize the computerized lab
program.
After they read and answered the prior knowledge questions, students were
directed by their teacher to read and carry out the virtual tasks of the lab experiment using

75
their tablets. As the students conducted the virtual lab experiment they answered
questions and wrote down their results. For the remainder of the lab students worked with
a partner.
Different Explorer Learning virtual lab activities were given to the ten students in
the Treatment group each week. Students completed each of the virtual lab experiments
and the accompanying worksheets. The labs allowed students to conduct various
experiments. Students were able to solve problems and make connections to prior
learning. Students worked by themselves or in pairs while carrying out the lab activities.
The virtual lab simulations kept the students engaged and expanded on their conceptual
knowledge. Critical thinking was emphasized, and students learning was assessed,
reinforced and enriched during the lab by the various virtual activities. A Pre-test and
Post-test Terra Nova 3 Survey Assessment in Science grade 4 were given before the
students began the study and after the study, respectively.
The Virtual labs tasks were similar to the Traditional hands on labs. For example
if the Treatment group was conducting an experiment with measuring using virtual rulers.
The comparison group was conducting an experiment with measuring using actual rulers.
The teacher distributed the lab sheets which had instructions to carry out various tasks, a
data table to record data and follow-up questions to answers to the comparison group.
Students performed the lab tasks listed on the lab sheets. Each week the students in the
comparison group conducted a different experiment at the same time as their classmates
in the Treatment group. The traditional group was also given a Pre-test and Post-test
Terra Nova 3 Survey Assessment in Science grade 4 before they began the study and
after the study, respectively.
76
The teacher provided the ten different students-comparison group (n=10) students
with lab equipment in the classroom for each lab tasks. She demonstrated how the lab
was to be done using the lab equipment for each lab, answered questions that students
had and posed questions about the lab to assess the students understanding, in the
beginning, middle and end of the lab. The teacher provided positive or negative feedback
about the students’ participation in the lab.
This study sought to illustrate that virtual labs are more effective in producing
science learning then traditional hands on labs. The research questions that guided the
study are listed below.
Research Questions
Research Question 1: Will students who conduct science investigations with
computerized virtual science laboratory experiments (treatment group) get significantly
higher scores on Standardized science achievement tests such as the Terra Nova 3 Survey
Assessment in Science grade 4 than students who conduct science investigations utilizing
traditional hands-on science laboratory experiments (comparison group)?
Hypothesis 1: Students who conduct science investigations with computerized
virtual science laboratory experiments (treatment group) will get significantly higher
scores on Standardized science achievement tests such as the Terra Nova Science Survey
for grade 4 than students who conduct science investigations utilizing traditional hands-
on science laboratory experiments (comparison group).
Research Question 2: Will students in the treatment group score significantly
higher on the ILSAT than students in the comparison group?

77
Hypothesis 2: Students in the treatment group will get significantly higher scores
on the ILSAT than students in the comparison group?
Research Question 3: Will students in the treatment group score significantly
higher on their attitudes to science learning and self-efficacy than students in the
comparison group?
Hypothesis 3: Students in the treatment group will score significantly higher on
their attitudes to science learning and self-efficacy than students in the comparison group.
Sample and Population
All of the participating students received all of their content instruction in a
general education classroom. There were a total of 20 fourth grade students, ten in the
science treatment group and ten in the comparison group. T h e i r a g e range was from
nine to ten. There were 12 male students and eight female students. All of the participating
students in the study were African American. 100% of them are eligible for free or
reduced lunch. All students used English as their primary language. One female teacher
taught both treatment and comparison groups. The teacher who participated in the study
had a mean 10 years of teaching experience. The teacher is considered “highly effective,”
with state’s licensure to teach students in elementary/middle school science.
The study was conducted in a small urban school in the northeastern United
States. The intervention was conducted in a 4th grade general education by a general
education teacher in a general education fourth grade classroom where the students
regularly received 4th grade instruction. Participants (see Table 3) were selected to
participate in the Treatment group and Comparison group randomly with a coin toss. The

78
teacher asked the 20 students to choose heads or tails before the coin toss. Those who
chose heads used the computerized virtual laboratory experiments and those students who
chose tails before the coin toss used traditional methods to perform hands on laboratory
experiments.
Both classes were scheduled to receive 50 minutes of computerized virtual
laboratory experiments or traditional hands on experiment once a week for 8 weeks.
Students in the treatment and comparison group were given the Terra Nova Science
Survey for grade 4 before and after the intervention. The STMSL questionnaire was
administered pre and post as well. Additionally, both groups continued to receive regular
science instruction for the remainder of the week. The Intermediate Level Science
Assessment Test was administered to each group in May for the Lab Performance Test
and in June for Written Test. Scores from both sections (tests) was added together for a
final score.
Table 3: Description of Participants
Group Number %
Group Treatment 10 50%
Comparison 10 50%
Gender Male 13 60%
Female 7 40%
Primary Language English 20 100%
Ethnicity African American 20 100%

79
Research Design and Data Analysis
Treatment/Intervention Virtual Computerized Science Experience
Explore Learning Gizmos is the world’s largest library of interactive online
simulations for math and science education in grades 3-12. Gizmos Virtual Labs help
students develop a deep understanding of challenging concepts through inquiry and
exploration, ideal for small group work, individual exploration, and whole class
instruction using an LCD projector or interactive whiteboard, designed to supplement the
existing curriculum that are correlated to New York State curriculum standards.
This software incorporates the strategies of the "Five E Cycle" of engagement,
exploration, explanation, elaboration, and evaluation (Bybee 2003). In this sequence,
students are motivated by a question of interest, such as might be presented in a
laboratory experiment, and then apply process skills to describe findings and apply them
in developing deeper understanding (Darrah et. al 2014). The labs focused on content,
technology integration, and formative assessment (Darrah et. al 2014).
Each lab includes a teacher’s guide, student lab sheet, and a vocabulary list. The
teacher’s guide are comprised of learning objectives, vocabulary list, lesson overview,
pre activity suggestions, step by step instructions on how to prepare students to use online
virtual labs and student lab sheet, discussion questions, follow up activities, background
information about the topic, technology connection and web resources. The student lab
sheet contains the title of the lab, vocabulary list with definitions, prior knowledge
questions, directions for utilization of the virtual lab and short response questions about
the virtual lab. The primary features of the virtual laboratory experiments provided

80
students with an interactive, simulation of laboratory investigations involving data
collection, analyses, graphing, and journaling that allowed students to utilize virtual
equipment to perform online labs that go beyond the scope of the traditional elementary
classroom. Screen captures below illustrate one specific lab within the Virtual Lab.
The screen shot in Figure 9 shows how the lab—Weight and Mass simulated a
puppy being weighed on a balance beam. On this screen a large balance scale is in the
middle of a grassy area. Below the balance scale are weights of various measures, i.e.
5kg, 1kg, 500g, 100g 50g and 10g and five different objects i.e., a flower, watermelon,
pumpkin and baseball. Above the balance scale is a drop down menu with different
locations i.e. Earth, Mars, Jupiter. Next to the change location drop down menu is a
button to clear scales and another separate scale that is measured in the units Newton.
The student lab sheet has the procedures for the lab and instructions for doing the
experiment using the simulation.
In this lab students were able to compare the weights of various objects using a
virtual balance. Students placed the object they wanted to find on one side of the scale
and then used the weights on the bottom to balance out the object. The amount of weights
used to balance the object determined the weight/mass of the object. Students were able
to virtually change the location from Earth to other plants i.e. Jupiter etc., to observe how
the weight of the object changed as the location changed. Students were also able to find
the weight of objects using the units Newton by placing the object on a virtual scale
measured in Newton.
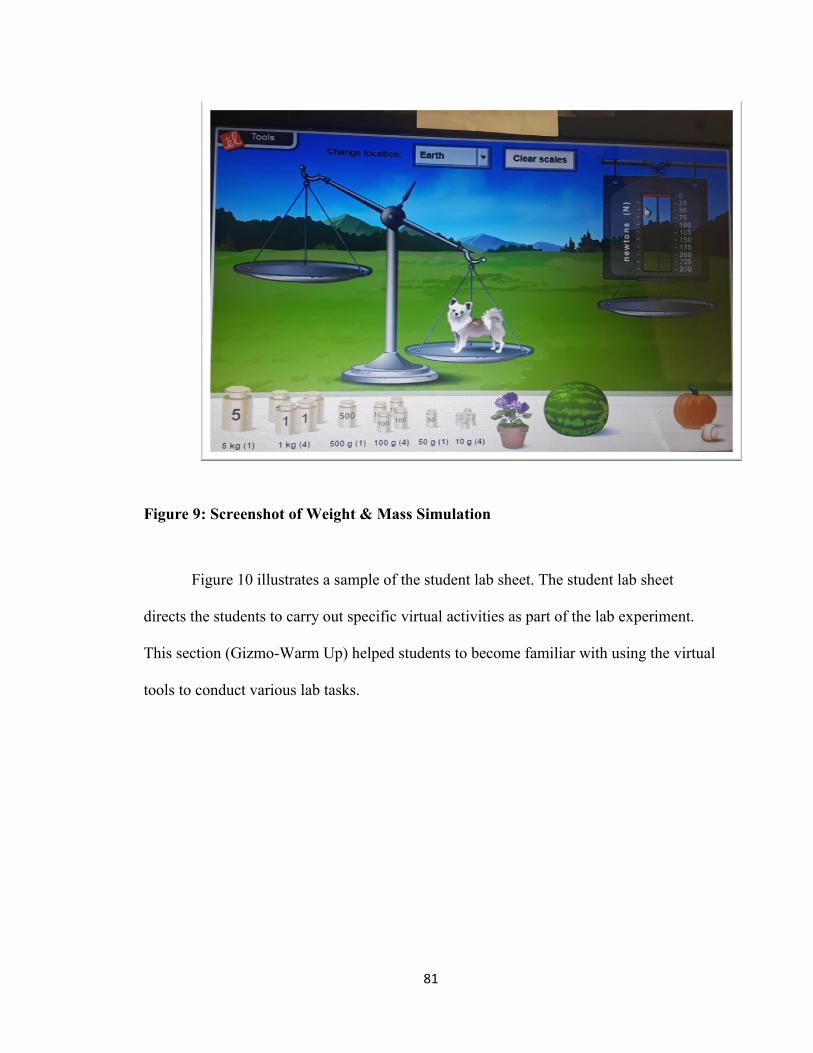
81
Figure 9: Screenshot of Weight & Mass Simulation
Figure 10 illustrates a sample of the student lab sheet. The student lab sheet
directs the students to carry out specific virtual activities as part of the lab experiment.
This section (Gizmo-Warm Up) helped students to become familiar with using the virtual
tools to conduct various lab tasks.
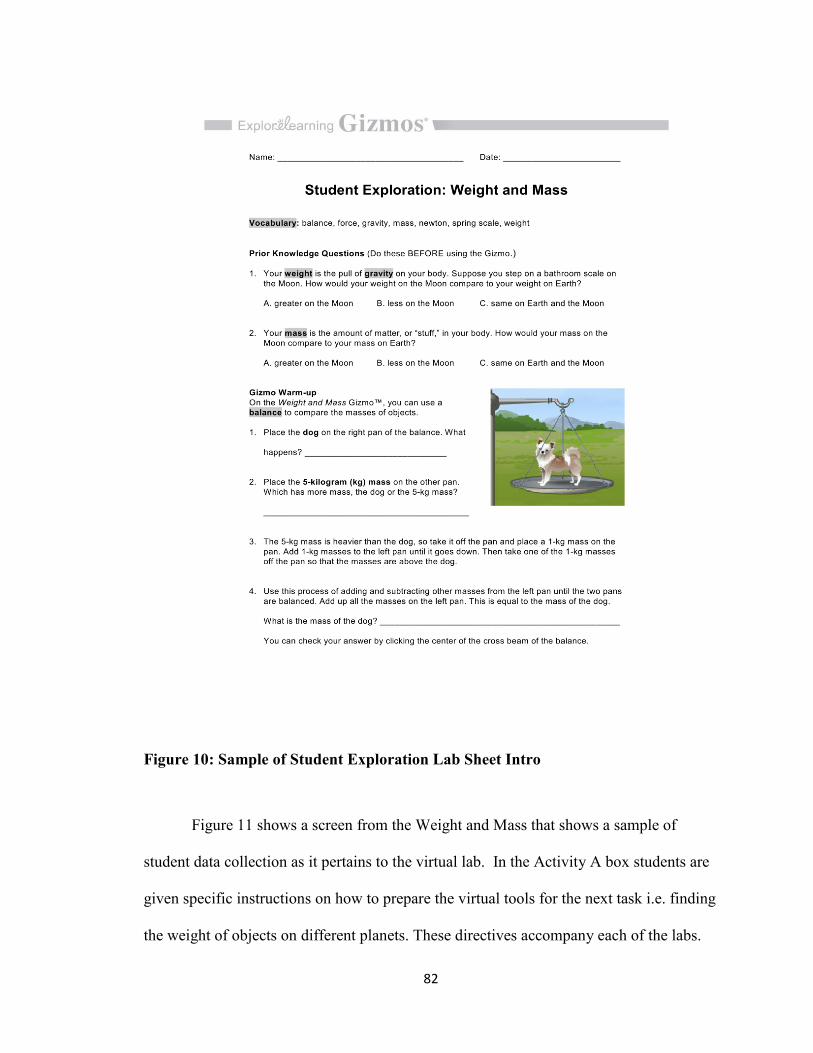
82
Figure 10: Sample of Student Exploration Lab Sheet Intro
Figure 11 shows a screen from the Weight and Mass that shows a sample of
student data collection as it pertains to the virtual lab. In the Activity A box students are
given specific instructions on how to prepare the virtual tools for the next task i.e. finding
the weight of objects on different planets. These directives accompany each of the labs.

83
Figure 11: Sample of Student Exploration Lab Sheet Activity A

84
As each lab is completed, the students return the student lab sheet to their teacher.
The hard copies of student lab sheets provide instructors with a convenient way to assess
student work. The following labs from Virtual Lab were tested: • Measuring Volume •
Circuit Builder • Measuring Trees • Magnetism • Weight and Mass. A great deal of
effort was put into making the hands-on labs and the virtual labs as similar as possible.
The virtual labs listed above were selected to be part of the testing based on the ability of
the teacher to provide a true one-to-one comparison in terms of real lab equipment versus
virtual lab equipment.
In every case, the hands-on lab objectives were identical to the virtual lab
objectives. All questions, the procedure followed, the data taking process and the data
table, calculation, and questions asked were similar for the hands-on and the virtual labs.
The virtual labs focused on content area, use of technology (simulations), and
assessments. The main components of the virtual labs were the simulated interactive
science investigations that used virtual laboratory equipment along with data collection,
analysis, graphing, and reporting tools allowing users to perform all phases of the
experiment online. Each lab includes general background information, theory,
objectives, prelab questions, a list of equipment needed to conduct the experiment,
postlab questions, and a postlab quiz. Screen captures below illustrated one specific lab
within the Virtual Lab.
The screen shot as shown in Figure 12 shows the virtual lab equipment i.e. faucet,
beaker, graduated cylinders, droppers, rulers, magnifying glass etc., used in Lab 1—

85
Student Exploration: Measuring Volume to simulate measuring volume of different
amounts of water with various measuring tools.
Figure 12: Screenshot of Lab 1 Student Exploration Measuring Volume Simulation
The simulation screen, as shown in figure 12, shows various measuring tools that
can be dragged from a lab cabinet or lab bench to measure volume.
As shown in Figure 13, the simulation illustrated a graduated cylinder that was
dragged underneath a faucet and filled with virtual water.

86
Figure 13: Screenshot of Lab 1 Student Exploration Measuring Volume Simulation
of a graduated cylinder underneath a faucet filled with water
As shown in Figure 14, the magnifying glass was dragged from the lab bench and
positioned in front of the 25 mL graduated cylinder in order to get an enlarged view of
the measurements on the graduated cylinder. The close up view of the graduations on the
cylinder provided by the magnifying glass, allowed for a more accurate measurement of
the volume of water, 7.8 mL.

87
Figure 14: Screenshot of Lab 1 Student Exploration Measuring Volume Simulation
Enlargement of Graduations
During each lab students complete statements, questions, data tables, graphs,
drawings and/or diagrams related to the virtual experiment. The student exploration
sheet allowed the student (Figure 10-11), easy to follow instructions to seamlessly carry
out the simulated lab investigations. A great deal of effort was put into making the
traditional hands-on labs and the virtual labs the similar. In every case, the data collection
and analysis section of the traditional hands-on lab was revised to resemble those on the
virtual lab. Additionally, the problem, hypotheses, experiment, and conclusion questions
were similar for both traditional hands-on and the virtual lab.
Instrument(s)
The instrument for the Pre Test/Post Test will be the Terra Nova 3 Survey
Assessment in Science grade 4. Students will also be given the New York State ILSAT –
Performance Based for grade 4 in May and the New York State ILSAT –Written
Examination for grade 4 in June. Both tests were combined for one score. A
questionnaire used for Pretest and Posttest was the SMTSL- which measures Students’

88
Motivation Toward Science Learning in the categories for Self-Efficacy and Science
Learning Value. Table 4 lists the validity for each instrument.
Table 4: Instrument Validity
SMTSL The Cronbach alpha for the entire questionnaire was 0.89; for each scale,
alpha ranged from 0.70 to 0.89 (Tuan , Chin, & Shieh, 2005).
Terra Nova As reported in the Terra Nova 3 Technical Report (2009), the reliability
coefficients are typically at the high 0.80s for the Survey tests and around
the 0.90s for the Complete Battery and Multiple Assessments.
ILSAT The alphas for overall student responses ranged from 0.83 to 0.88 for
science indicating that the tests are highly reliable.
Procedures
Students were told the purpose of the study being conducted and were asked to fill
out a consent form and return it to their teacher. The students’ parents, teacher and
principal were also given consent forms to be completed and returned to the researcher.
For this study, all students and their parents agreed to participate in the study.
Students performed the lab activities in their regular science classes. The Terra
Nova 3 Survey Assessment in Science grade 4 was used to assess the students'
knowledge of the grade 4 science content related to before the study as a pretest and after
the study as a posttest. The same assessment was used with all students. The scores for
the ILSAT were collected for each student from the school.

89
The SMTSL Questionnaire was administered to measure students’ motivation
toward science learning (SMTSL) before the study and after the study. Out of the
SMTSL questionnaire, two scales were used to measure: self-efficacy and science
learning value (Tuan et al., 2005). For this study only results from self-efficacy and
student learning value were utilized.
Data Collection and Statistical Analysis
The following data were collected to be used for quantitative analysis:
Intermediate Level Science Assessment Test (ILSAT) grade 4—A
standardized written and performance level test given to all fourth grade
students in New York once a year in May and June respectively. The
ILSAT written examination was composed of scientific questions for
students to respond to and the performance level test contained laboratory
investigations data collections.
The Terra Nova 3 Survey Assessment in Science Grade 4—The students'
Terra Nova Survey in Science grade 4 was given before the study began
and after the study ended. This Standardized Norm-Referenced
Achievement Test (2011 Norms) provides a general measure of science
achievement with a minimum amount of required testing time.
SMTSL—a 35 question questionnaire that measures students’ motivation
toward science learning (Tuan et. al, 2005). The items were constituted
using five-point Likert-type scales. Items on the scales are anchored at 1 =

90
strongly disagree, 2 = disagree, 3 = no opinion, 4 = agree and 5 = strongly
agree. This test was given at the beginning of the study and also at the end.
Students’ self-efficacy, science learning value (or task values), students’ learning
strategies, the individual’s learning goal, and the learning environment are important
motivational factors that constitute students’ science learning motivation (Tuan et. al,
2005). Thus, the six categories on the SMTSL were self-efficacy, active learning
strategies, science learning value, performance goal, achievement goal, and learning
environment stimulation (Tuan et. al, 2005). Research on motivational theories and
studies of students’ learning (Brophy, 1998, Pintrich and Schunk, 1996) revealed that
self-efficacy; the individual’s goals toward tasks, task value and the learning environment
dominate students’ learning motivation (Tuan et. al, 2005). In this study, two of the four
dominant motivational factors investigated were self-efficacy and science learning value
(or task values).
Self-efficacy assesses students’ belief in their own ability to perform well in
science learning task. Science learning value assesses the value of science
learning which lets students acquire problem-solving competency, experience the
inquiry activity, stimulate their own thinking, and find the relevance of science
with daily life. If they can perceive these important values, they will be motivated
to learn science. (p.643)
Fidelity of program implementation was monitored. For each of the labs used in
the classroom i.e. Virtual and Traditional, a non-participatory observation was conducted
for the duration of each lesson by the researcher to assure fidelity of program
91
implementation and to determine that the students and teacher were participating in the
correct manner. Both Treatment and Comparison groups were taught by the same teacher.
A Non parametric independent sample Mann-Whitney U Test was performed to
analyze the significance of the difference in the gain scores of Terra Nova 3 Survey
Assessment in Science grade 4 and its sub categories i.e. Terra Nova Science Inquiry
(TNSciInq), Terra Nova Physical Science (TNPhysSci), Terra Nova Life Science (TNLifeSci)
and Terra Nova Earth Science (TNEarthSci) between treatment and the comparison groups.
A Non parametric independent sample Mann-Whitney U Test was performed to analyze
the significance of the difference in the gain scores of SMTSL questionnaire, sub-
categories self-efficacy and science learning value. The dependent variables were gain
scores from pretests to posttests for the treatment group and the comparison group. A
Mann-Whitney U test was performed on the ILSAT to analyze the gains between
treatment and the comparison group. A Mann-Whitney U test was also performed to
examine the intervention effectiveness mediated by Gender.
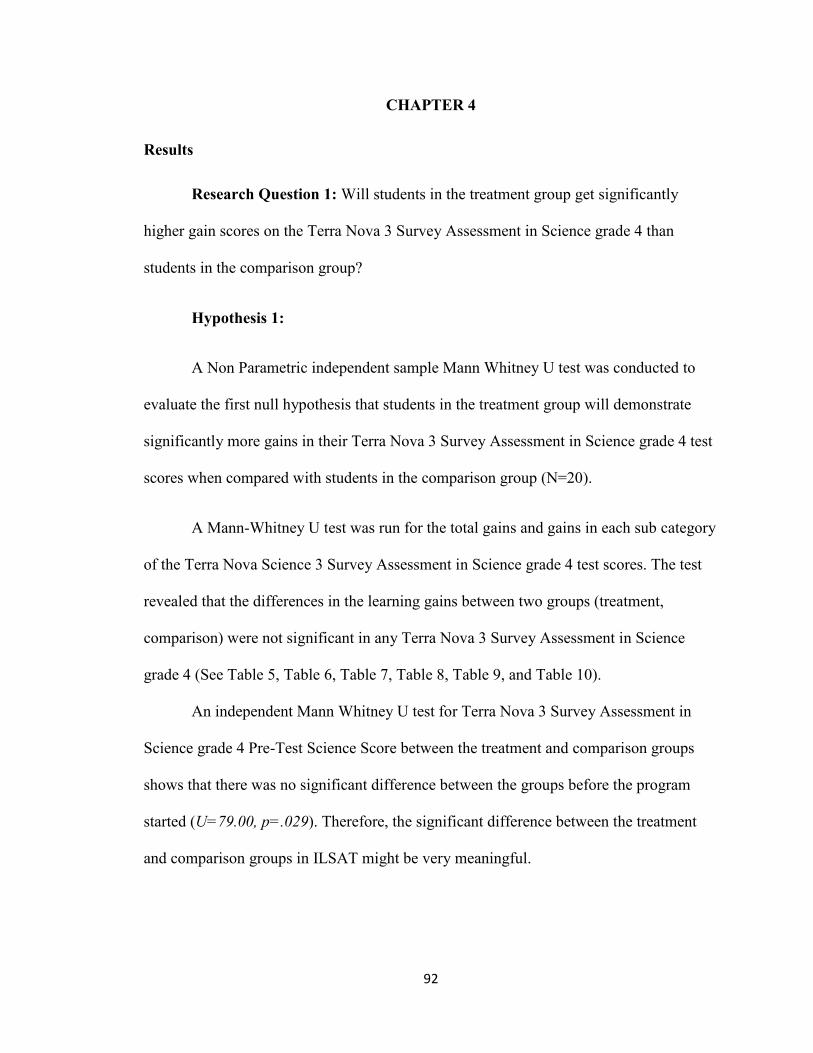
92
CHAPTER 4
Results
Research Question 1: Will students in the treatment group get significantly
higher gain scores on the Terra Nova 3 Survey Assessment in Science grade 4 than
students in the comparison group?
Hypothesis 1:
A Non Parametric independent sample Mann Whitney U test was conducted to
evaluate the first null hypothesis that students in the treatment group will demonstrate
significantly more gains in their Terra Nova 3 Survey Assessment in Science grade 4 test
scores when compared with students in the comparison group (N=20).
A Mann-Whitney U test was run for the total gains and gains in each sub category
of the Terra Nova Science 3 Survey Assessment in Science grade 4 test scores. The test
revealed that the differences in the learning gains between two groups (treatment,
comparison) were not significant in any Terra Nova 3 Survey Assessment in Science
grade 4 (See Table 5, Table 6, Table 7, Table 8, Table 9, and Table 10).
An independent Mann Whitney U test for Terra Nova 3 Survey Assessment in
Science grade 4 Pre-Test Science Score between the treatment and comparison groups
shows that there was no significant difference between the groups before the program
started (U=79.00, p=.029). Therefore, the significant difference between the treatment
and comparison groups in ILSAT might be very meaningful.

93
Table 5: Descriptive Statistics for Terra Nova Pre and Post Survey Tests and Mann-
Whitney U Test on the Difference in the Gains between Comparison and Treatment
Groups.
Group N Pre-test
M (SD)
Post-test
M (SD)
Gain
M (SD)
U p
Comparison 10 610.70(21.62) 628.30(23.14) 17.60(24.13) 68.00 .19
Treatment 10 642.70 (33.00) 673.80 (46.23) 31.10(23.20)
Total 20 626.70 (31.73) 651.05(42.56) 24.35(24.06)
Table 6: Descriptive Statistics for Terra Nova Science Inquiry Pre and Post Survey
Tests and Mann-Whitney U Test on the Difference in the Gains between
Comparison and Treatment Groups.
Group N
Pre-test
M (SD)
Post-test
M (SD)
Gain
M (SD) U
P
Comparison 10 52.70 (18.86) 69.80(18.86) 17.10(19.84) 40.00 .481
Treatment 10 76.20 (21.99) 84.10(19.64) 7.90(9.67)
Total 20 64.45 (23.30) 76.95(20.13) 12.50(15.91)
Table 7: Descriptive Statistics for Terra Nova Physical Science Inquiry Pre and Post
Survey Tests and Mann-Whitney U Test on the Difference in the Gains between
Comparison and Treatment Groups.
Group N
Pre-test
M (SD)
Post-test
M (SD)
Gain
M (SD)
U p
Comparison 10 59.80(6.54) 64.50(6.81) 4.70(6.80) 31.00 .165
Treatment 10 70.40(13.29) 79.60(15.51) 9.20(7.94)
Total 20
65.10(11.54)
72.05(13.95)
6.95(7.56)
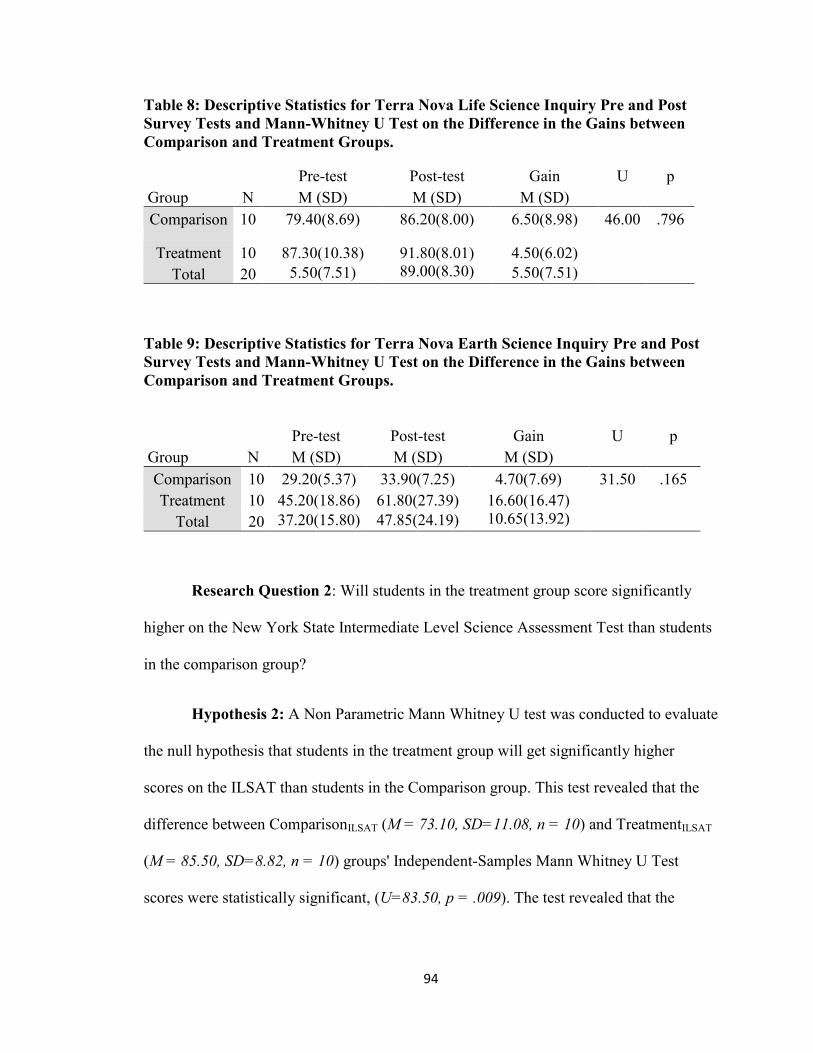
94
Table 8: Descriptive Statistics for Terra Nova Life Science Inquiry Pre and Post
Survey Tests and Mann-Whitney U Test on the Difference in the Gains between
Comparison and Treatment Groups.
Group N
Pre-test
M (SD)
Post-test
M (SD)
Gain
M (SD)
U p
Comparison 10 79.40(8.69) 86.20(8.00) 6.50(8.98) 46.00 .796
Treatment 10 87.30(10.38) 91.80(8.01) 4.50(6.02)
Total 20 5.50(7.51) 89.00(8.30) 5.50(7.51)
Table 9: Descriptive Statistics for Terra Nova Earth Science Inquiry Pre and Post
Survey Tests and Mann-Whitney U Test on the Difference in the Gains between
Comparison and Treatment Groups.
Group N
Pre-test
M (SD)
Post-test
M (SD)
Gain
M (SD)
U
p
Comparison 10 29.20(5.37) 33.90(7.25) 4.70(7.69) 31.50 .165
Treatment 10 45.20(18.86) 61.80(27.39) 16.60(16.47)
Total 20 37.20(15.80) 47.85(24.19) 10.65(13.92)
Research Question 2: Will students in the treatment group score significantly
higher on the New York State Intermediate Level Science Assessment Test than students
in the comparison group?
Hypothesis 2: A Non Parametric Mann Whitney U test was conducted to evaluate
the null hypothesis that students in the treatment group will get significantly higher
scores on the ILSAT than students in the Comparison group. This test revealed that the
difference between ComparisonILSAT (M = 73.10, SD=11.08, n = 10) and TreatmentILSAT
(M = 85.50, SD=8.82, n = 10) groups' Independent-Samples Mann Whitney U Test
scores were statistically significant, (U=83.50, p = .009). The test revealed that the
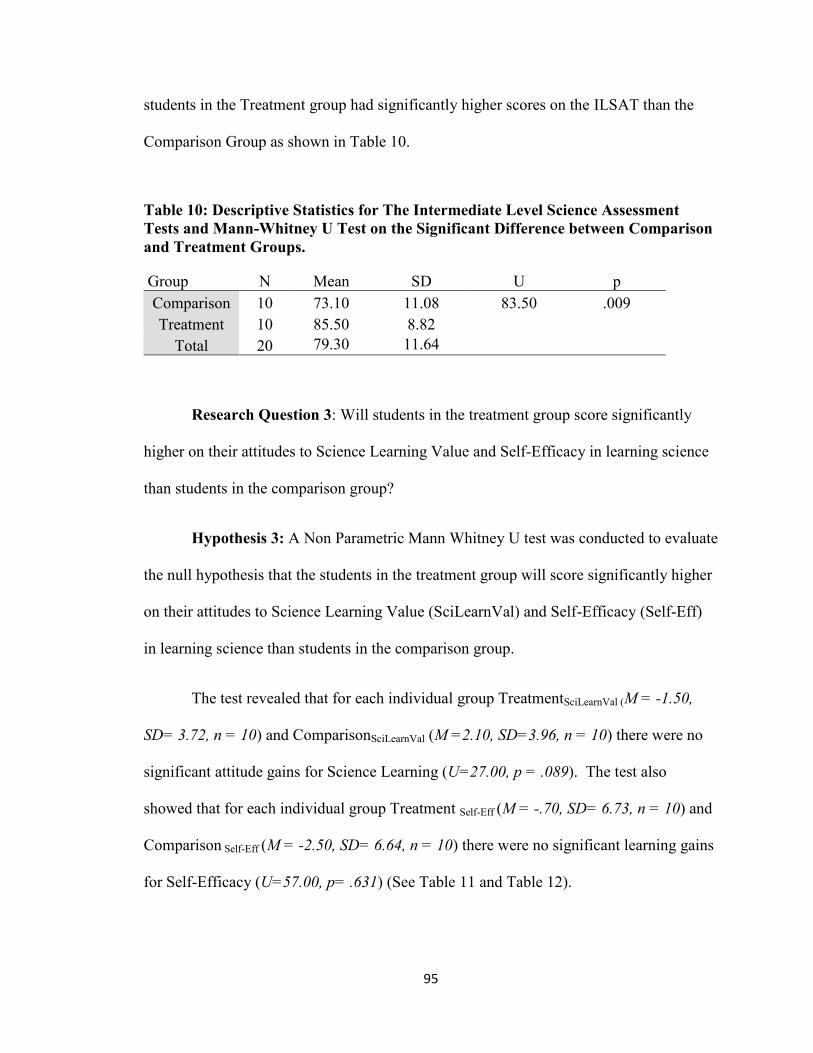
95
students in the Treatment group had significantly higher scores on the ILSAT than the
Comparison Group as shown in Table 10.
Table 10: Descriptive Statistics for The Intermediate Level Science Assessment
Tests and Mann-Whitney U Test on the Significant Difference between Comparison
and Treatment Groups.
Group N Mean SD U p
Comparison 10 73.10 11.08 83.50 .009
Treatment 10 85.50 8.82
Total 20 79.30 11.64
Research Question 3: Will students in the treatment group score significantly
higher on their attitudes to Science Learning Value and Self-Efficacy in learning science
than students in the comparison group?
Hypothesis 3: A Non Parametric Mann Whitney U test was conducted to evaluate
the null hypothesis that the students in the treatment group will score significantly higher
on their attitudes to Science Learning Value (SciLearnVal) and Self-Efficacy (Self-Eff)
in learning science than students in the comparison group.
The test revealed that for each individual group TreatmentSciLearnVal (M = -1.50,
SD= 3.72, n = 10) and ComparisonSciLearnVal (M =2.10, SD=3.96, n = 10) there were no
significant attitude gains for Science Learning (U=27.00, p = .089). The test also
showed that for each individual group Treatment Self-Eff (M = -.70, SD= 6.73, n = 10) and
Comparison Self-Eff (M = -2.50, SD= 6.64, n = 10) there were no significant learning gains
for Self-Efficacy (U=57.00, p= .631) (See Table 11 and Table 12).
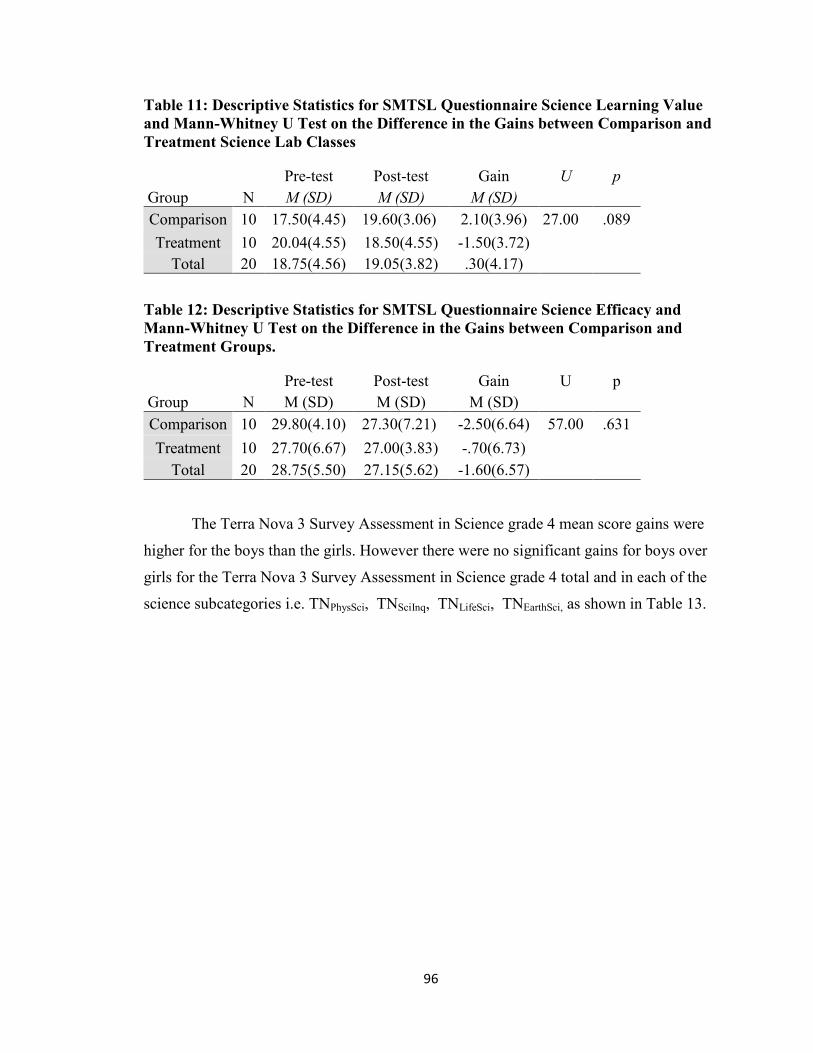
96
Table 11: Descriptive Statistics for SMTSL Questionnaire Science Learning Value
and Mann-Whitney U Test on the Difference in the Gains between Comparison and
Treatment Science Lab Classes
Group N
Pre-test
M (SD)
Post-test
M (SD)
Gain
M (SD)
U p
Comparison 10 17.50(4.45) 19.60(3.06) 2.10(3.96) 27.00 .089
Treatment 10 20.04(4.55) 18.50(4.55) -1.50(3.72)
Total 20 18.75(4.56) 19.05(3.82) .30(4.17)
Table 12: Descriptive Statistics for SMTSL Questionnaire Science Efficacy and
Mann-Whitney U Test on the Difference in the Gains between Comparison and
Treatment Groups.
Group N
Pre-test
M (SD)
Post-test
M (SD)
Gain
M (SD)
U p
Comparison 10 29.80(4.10) 27.30(7.21) -2.50(6.64) 57.00 .631
Treatment 10 27.70(6.67) 27.00(3.83) -.70(6.73)
Total 20 28.75(5.50) 27.15(5.62) -1.60(6.57)
The Terra Nova 3 Survey Assessment in Science grade 4 mean score gains were
higher for the boys than the girls. However there were no significant gains for boys over
girls for the Terra Nova 3 Survey Assessment in Science grade 4 total and in each of the
science subcategories i.e. TNPhysSci, TNSciInq, TNLifeSci, TNEarthSci, as shown in Table 13.
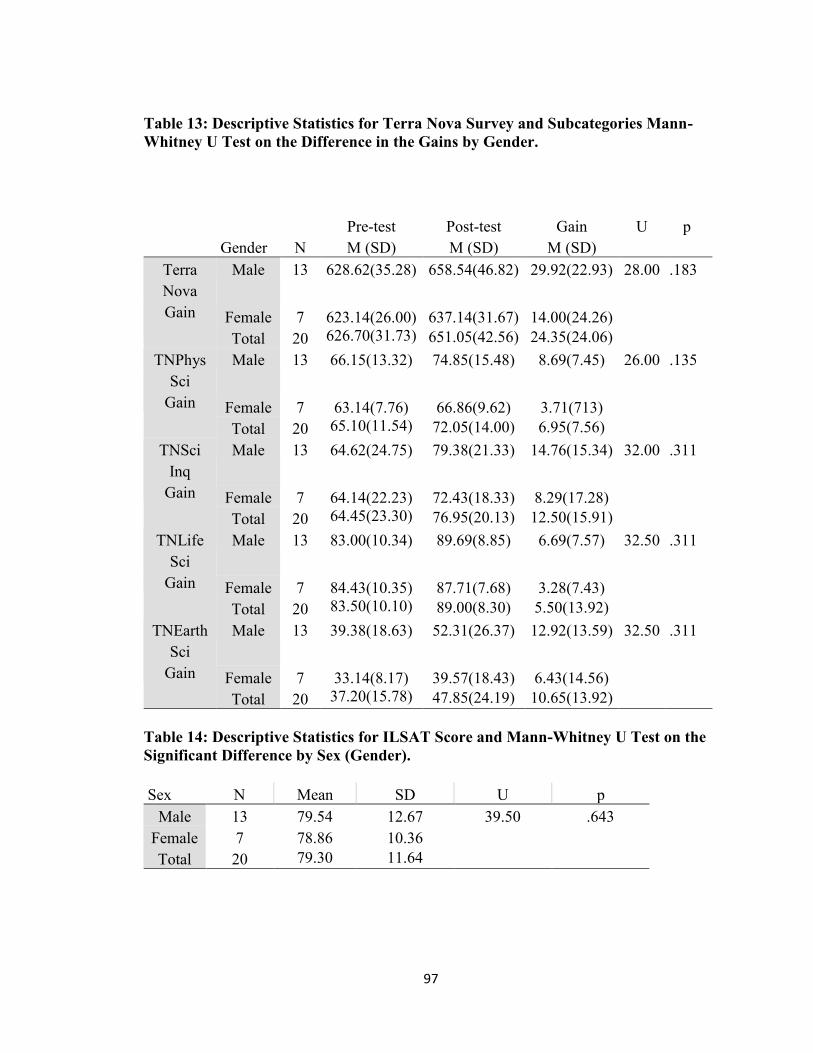
97
Table 13: Descriptive Statistics for Terra Nova Survey and Subcategories Mann-
Whitney U Test on the Difference in the Gains by Gender.
Table 14: Descriptive Statistics for ILSAT Score and Mann-Whitney U Test on the
Significant Difference by Sex (Gender).
Sex N Mean SD U p
Male 13 79.54 12.67 39.50 .643
Female 7 78.86 10.36
Total 20 79.30 11.64
Gender N
Pre-test
M (SD)
Post-test
M (SD)
Gain
M (SD)
U
p
Terra
Nova
Gain
Male 13 628.62(35.28) 658.54(46.82) 29.92(22.93) 28.00 .183
Female 7 623.14(26.00) 637.14(31.67) 14.00(24.26)
Total 20 626.70(31.73) 651.05(42.56) 24.35(24.06)
TNPhys
Sci
Gain
Male 13 66.15(13.32) 74.85(15.48) 8.69(7.45) 26.00 .135
Female 7 63.14(7.76) 66.86(9.62) 3.71(713)
Total 20 65.10(11.54) 72.05(14.00) 6.95(7.56)
TNSci
Inq
Gain
Male 13 64.62(24.75) 79.38(21.33) 14.76(15.34) 32.00 .311
Female 7 64.14(22.23) 72.43(18.33) 8.29(17.28)
Total 20 64.45(23.30) 76.95(20.13) 12.50(15.91)
TNLife
Sci
Gain
Male 13 83.00(10.34) 89.69(8.85) 6.69(7.57) 32.50 .311
Female 7 84.43(10.35) 87.71(7.68) 3.28(7.43)
Total 20 83.50(10.10) 89.00(8.30) 5.50(13.92)
TNEarth
Sci
Gain
Male 13 39.38(18.63) 52.31(26.37) 12.92(13.59) 32.50 .311
Female 7 33.14(8.17) 39.57(18.43) 6.43(14.56)
Total 20 37.20(15.78) 47.85(24.19) 10.65(13.92)
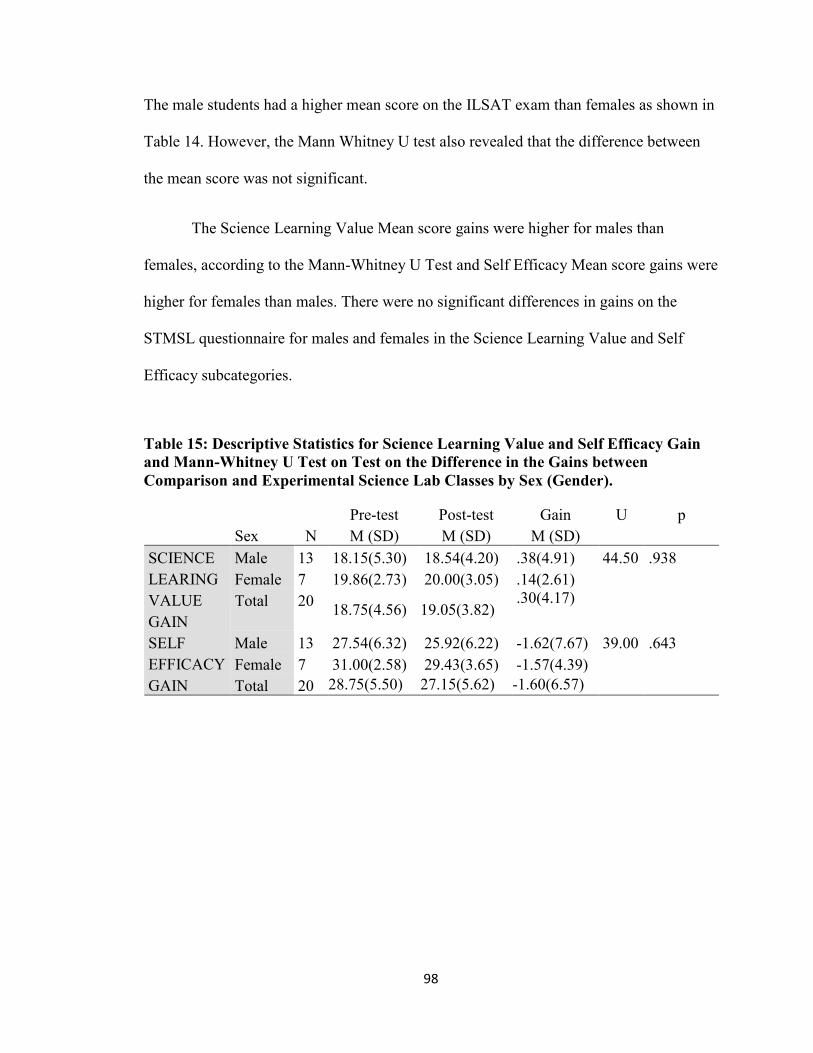
98
The male students had a higher mean score on the ILSAT exam than females as shown in
Table 14. However, the Mann Whitney U test also revealed that the difference between
the mean score was not significant.
The Science Learning Value Mean score gains were higher for males than
females, according to the Mann-Whitney U Test and Self Efficacy Mean score gains were
higher for females than males. There were no significant differences in gains on the
STMSL questionnaire for males and females in the Science Learning Value and Self
Efficacy subcategories.
Table 15: Descriptive Statistics for Science Learning Value and Self Efficacy Gain
and Mann-Whitney U Test on Test on the Difference in the Gains between
Comparison and Experimental Science Lab Classes by Sex (Gender).
Sex N
Pre-test
M (SD)
Post-test
M (SD)
Gain
M (SD)
U p
SCIENCE
LEARING
VALUE
GAIN
Male 13 18.15(5.30) 18.54(4.20) .38(4.91) 44.50 .938
Female 7 19.86(2.73) 20.00(3.05) .14(2.61)
Total 20 18.75(4.56) 19.05(3.82)
.30(4.17)
SELF
EFFICACY
GAIN
Male 13 27.54(6.32) 25.92(6.22) -1.62(7.67) 39.00 .643
Female 7 31.00(2.58) 29.43(3.65) -1.57(4.39)
Total 20 28.75(5.50) 27.15(5.62) -1.60(6.57)

99
CHAPTER 5
Interpretation of Results
The purpose of this study was to determine if virtual lab experimentation was
more effective than the use of traditional lab experimentation in an elementary science
classroom by measuring the pretest and posttest scores of science achievement tests of
students that participated in a virtual lab experience and those that did not. A total of 20
students (13 males and 7 females) were part of this study of which 10 were in the
experimental group and 10 were in the comparison group. All students were in a regular
science class and were asked to participate in pre and posttests exams and questionnaires.
Due to the small sample size n=10 in each of experimental and comparison group,
Mann Whitney U Test, a non- parametric statistical analysis, was performed, on the
results of the Terra Nova 3 Survey Assessment in Science grade 4 and the Terra Nova
Science 3 Survey Assessment in Science grade 4 subcategories. For the research
question, will students in the treatment group get significantly higher scores on the Terra
Nova 3 Survey Assessment in Science grade 4 than students in the comparison group, the
hypothesis was that students in the treatment group will get significantly higher gain
scores on the Terra Nova 3 Survey Assessment in Science grade 4 than students in the
comparison group.
The study found that students who participated in the treatment group
demonstrated the tendency of higher mean gain scores than students who participated in
the comparison group. The non-parametric statistical analysis Mann Whitney U Test was
used in evaluating the first null hypothesis, that students in the treatment group will not

100
demonstrate significant differences in gains on the Terra Nova 3 Survey Assessment in
Science grade 4 scores when compared to students in the comparison group. The
researcher retained the null hypothesis and concluded that 4th
grade elementary students
in the treatment group did not demonstrate significantly higher gain scores in Terra Nova
3 Survey Assessment in Science grade 4 and the Terra Nova 3 Survey Assessment in
Science grade 4 subcategories when compared to the comparison group.
For the research question will students in the treatment group score significantly
higher on the ILSAT than students in the comparison group, the hypothesis was that
students in the treatment group will get significantly higher scores on the ILSAT than
students in the comparison group.
According to the statistical analysis performed on the results of the ILSAT exam,
the study found that participating in the treatment group contributed positively toward
increasing the post-test scores. A non-parametric Mann-Whitney U Test was conducted
to evaluate the first null hypothesis that grade 4 elementary students who participated in
the treatment group will not demonstrate a significant difference in test scores when
compared with the comparison group. The researcher was able to reject the null
hypothesis and conclude that grade 4 students that participated in the treatment group
attained higher mean test scores when compared to students in the comparison group
suggesting that the Virtual Lab contributed positively toward increasing the ILSAT
scores.
For the research question will students in the treatment group score significantly
higher gains on their attitudes to science learning and self-efficacy in learning science
than students in the comparison group, the hypothesis was that students in the treatment

101
group will score significantly higher gains on their attitudes to science learning and self-
efficacy in learning science than students in the comparison group.
A Mann Whitney U Test was conducted to evaluate the first null hypothesis that
students in the treatment group will not demonstrate significant difference in the gains on
the Science Learning Value and Science Efficacy scores (subcategories of the STMSL
questionnaire)when compared with students in the comparison group (N = 20). The
researcher had to retain the null hypothesis and conclude that grade 4 elementary students
who participated in the treatment group did not demonstrate significant gains from Pretest
to Posttest when compared to grade 4 students in the comparison group.
Self-efficacy refers to the individual’s perception of his/her ability in
accomplishing learning tasks (Bandura 1981, 1982, 1997, Pajares 1996). When students
have high self-efficacy, they believe they are capable of accomplishing learning tasks,
whether tasks are difficult or easy (Tuan et. al, 2005). Science learning value refers to
whether or not students can perceive the value of science learning they engage (Tuan et.
al, 2005). In science class, there are many unique features highlighting the value of
science learning, such as problem-solving, science inquiry, thinking, and the relevance of
science knowledge in students’ daily lives (American Association for the Advancement
of Science 1993, NRC 1996).
The Self Efficacy score gains in this study demonstrated that the students’
perception of their ability in accomplishing learning tasks whether difficult or easy were
not significant from pretest to posttest for the treatment group or comparison group,
suggesting that the students’ attitude towards being motivated to learn science tasks in the
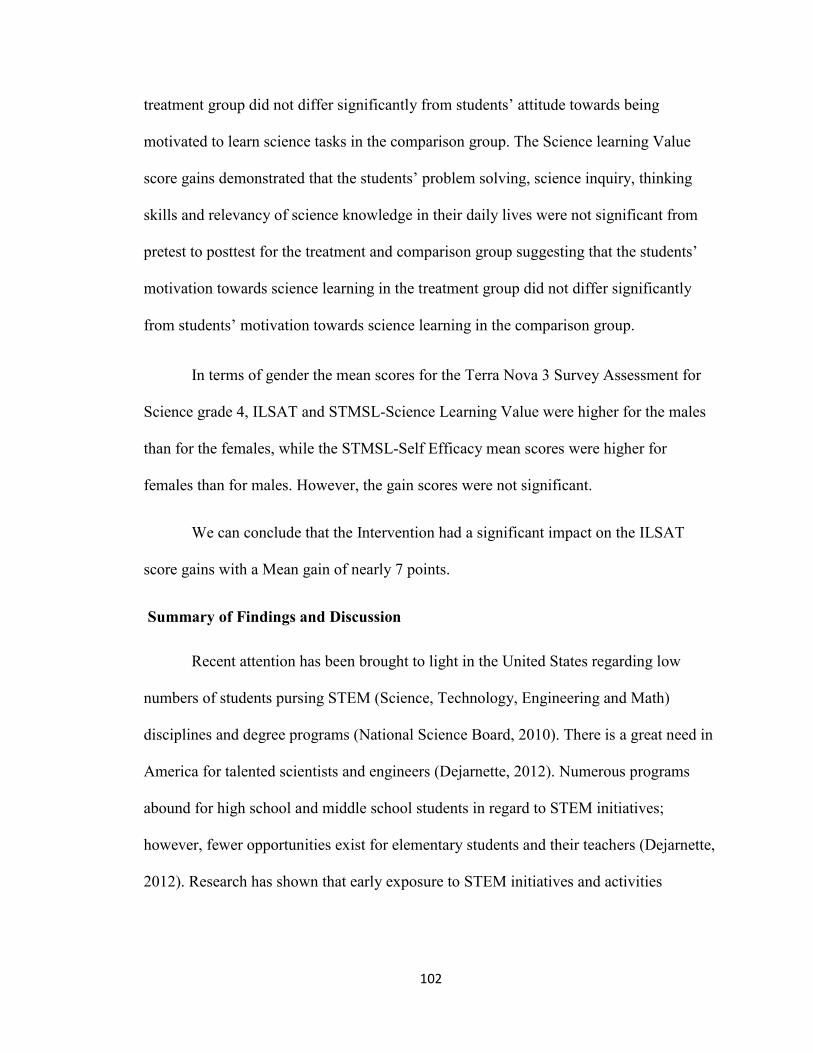
102
treatment group did not differ significantly from students’ attitude towards being
motivated to learn science tasks in the comparison group. The Science learning Value
score gains demonstrated that the students’ problem solving, science inquiry, thinking
skills and relevancy of science knowledge in their daily lives were not significant from
pretest to posttest for the treatment and comparison group suggesting that the students’
motivation towards science learning in the treatment group did not differ significantly
from students’ motivation towards science learning in the comparison group.
In terms of gender the mean scores for the Terra Nova 3 Survey Assessment for
Science grade 4, ILSAT and STMSL-Science Learning Value were higher for the males
than for the females, while the STMSL-Self Efficacy mean scores were higher for
females than for males. However, the gain scores were not significant.
We can conclude that the Intervention had a significant impact on the ILSAT
score gains with a Mean gain of nearly 7 points.
Summary of Findings and Discussion
Recent attention has been brought to light in the United States regarding low
numbers of students pursing STEM (Science, Technology, Engineering and Math)
disciplines and degree programs (National Science Board, 2010). There is a great need in
America for talented scientists and engineers (Dejarnette, 2012). Numerous programs
abound for high school and middle school students in regard to STEM initiatives;
however, fewer opportunities exist for elementary students and their teachers (Dejarnette,
2012). Research has shown that early exposure to STEM initiatives and activities
103
positively impacts elementary students' perceptions and dispositions (Bagiati, Yoon,
Evangelou, & Ngambeki, 2010; Bybee, & Fuchs, 2006).
For question 1, the research examined whether Elementary students conducting
virtual lab activities (treatment group) will get significantly higher gain scores on the
Terra Nova 3 Survey Assessment in Science grade 4 than students conducting traditional
lab experiences the comparison group.
The study concluded that 4th
grade elementary students in the treatment group
demonstrated the tendency of higher mean gain scores in Terra Nova 3 Survey
Assessment in Science grade 4 than students in the comparison group and that the gain
scores were not statistically significant. The statistical insignificance could be the result
of two factors. One, the study utilized a small number of participants. Perhaps a larger
number of participants or sample size would yield more meaningful results or
significantly higher gains.
Two, research (Darrah et al., 2014) has showed that there was no evidence that
one of the treatments (virtual or traditional hands-on) was more effective than the other in
conveying the concepts of the labs to the students and that there was no significant
difference noted in any of the tests. Similarly, research (Pyatt and Simms, 2012) has
showed the usefulness of virtual labs and physical labs to be similar, if not the same for
students.
This study, consistent with prior research, established that schools can get similar
effects with both virtual and traditional hands on labs without making those big purchases
for science laboratory equipment. Oftentimes schools where African American and

104
Latino students are educated can’t afford to purchase lab equipment for experimentation
and research. Subsequently, these students, at an early age, are not afforded with
opportunities that enable them to conduct scientific investigations and increase their
scientific reasoning skills. According to the research, schools can utilize either virtual
laboratory experiments or traditional laboratory experiments in the science classroom,
because neither is more effective than the other for increasing student learning in science.
For question 2, the research examined whether students conducting virtual lab
experiences (treatment group) will get significantly higher scores on the ILSAT than
students conducting traditional hands-on experiences (comparison group). The study
found that grade 4 students who participated in the treatment group attained significantly
higher mean test scores when compared to students in the comparison group. The
statistical significance suggests that students who conducted virtual lab experiences may
have gained scientific experiences that contributed positively toward increasing their
ILSAT scores than students who conducted traditional lab experiences.
This is consistent with research that found that middle school students who used
virtual labs, developed the ability to give correct scientific explanations of Newtonian
principles several grade levels before the concept usually is taught (Roschelle et al.,
2000). Also, middle school students who participated in virtual labs outperformed high
school physics students in their ability to apply the basic principles of Newtonian
mechanics to real-world situations: the middle schoolers averaged 68% correct answers
on a six-item, multiple-choice compared with 50% for the high school physics students
(White and Fredriksen, 1998).

105
This study and prior research concluded that the use of the virtual labs software
appeared to make science interesting and accessible to a wider range of students than was
possible with more traditional approaches (Roschelle et al., 2000).
The ILSAT scores were comprised of a written section (multiple choice and short
extended response questions) and performance (Laboratory stations) section that
pertained to various 4th
grade science standards based concepts. Therefore, the ILSAT
may have measured both conceptual knowledge and scientific reasoning, skills that could
have been better accomplished through the virtual lab experience. Due to the fact, that
there was no pretest demonstrating that students started from the same level in the
beginning of the study on the ILSAT (given in June only), it is not evident whether the
virtual lab contributed to higher ILSAT mean scores observed in the treatment group.
For question 3, the research examined whether students conducting virtual lab
activities (treatment group) will score significantly higher gains on their attitudes to
science learning and self-efficacy in learning science than students conducting traditional
hands-on lab activities (comparison group). The findings showed the tendency of higher
mean gain score on the Science Learning Value Scale for the comparison group than the
treatment group and the tendency of higher mean gains score on the Self Efficacy Scale
for the treatment group than the comparison group.
The findings also showed that grade 4 elementary students who participated in the
treatment group did not demonstrate significantly higher gains from Pretest to Posttest
when compared to grade 4 students in the comparison group which suggesting that
students’ attitude towards being motivated to learn science tasks in the treatment group

106
did not differ significantly from students’ attitude towards being motivated to learn
science tasks in the comparison group.
The reason for these results could be from two factors. One, the study utilized a
small number of participants. Perhaps a larger number of participants or sample size
would yield more meaningful results or significantly higher gains.
Second, there needs to be more immediate or nurturing feedback for virtual labs,
to be motivating for elementary students. When immediate or nurturing feedback is
provided in the traditional lab; more often it is done by the teacher. Virtual lab creators
need to add more feedback, in the form of loud claps, cheers, even visual praise such as a
virtual teacher nodding in agreement and/or smiling. Much prior research has been done
with older students; hence scientists did not cater to the needs of younger students by
adding immediate or nurturing feedback to the virtual labs.
Tuan et al. (2005) indicated that teacher’s teaching strategies and the science
content such as concrete, relevant and perceptual science concepts presented in the class
stimulated students’ motivation toward science learning.
By capturing students' interest in STEM content at an earlier age, a proactive
approach can ensure that students are on track through middle and high school to
complete the needed coursework for adequate preparation to enter STEM degree
programs at institutions of higher learning (Dejarnette, 2012). As a result, programs
focusing on STEM initiatives and content are a growing priority in American schools
with aims to provide early exposure for elementary students (Dejarnette, 2012).

107
Early exposure may motivate students to enroll in more advanced science and
math courses when they are available in middle and high school (Dejarnette, 2012).
Elementary students have the cognitive abilities to engage in STEM content and problem
solving activities which in turn will whet their appetites for more (Dejarnette, 2012). Not
only do STEM lessons and activities excite young learners, but they also build their
confidence and self-efficacy in relation to their own abilities to be successful in more
advanced math and science courses in later school years (Dejarnette, 2012).
Impact on Elementary Teacher Education in STEM Disciplines Teaching inquiry
science is not a common approach used in elementary science classrooms today (Weiss,
2006). The emphasis on standardized testing in America has hampered the growth of
scientific pedagogy in the elementary schools to include inquiry-based projects
(Dejarnette, 2012). Elementary students often learn about scientific theory and the nature
of science rather than doing scientific investigations for themselves. As a result, students
are relying on the knowledge, products and conclusions of others rather than
experiencing it for themselves (Dejarnette, 2012).
Universities around the country as well as public and private organizations are
beginning to offer STEM initiative programs for K-12 students and their teachers
(Dejarnette, 2012). Many of these programs continue to focus on middle and high school
students and often overlook elementary students (Vasquez, 2005; Yasar, Baker,
Robinson, Kurpius, Krause, & Roberts, 2006). However, STEM programs focusing on
elementary students are beginning to surface more and more (Dejarnette, 2012). The first
line of attack should be in teacher education. STEM concepts such as scientific inquiry,
problem-based learning, engineering design and technological activities should
108
encompass the methodology that every elementary preservice teacher receives in their
teacher education programs (Dejarnette, 2012). The United States demands that their
teachers are highly qualified, but many lack confidence to teach scientific inquiry in the
elementary classroom (Bencze, 2010).
Preservice teachers need to be thoroughly prepared to incorporate STEM
initiatives into the existing curriculum wherever they teach (Dejarnette, 2012). By
preparing the preservice teachers of tomorrow, we lay the foundation for change
(Dejarnette, 2012). Second, university teacher educators need to reach out to their
community schools' and provide staff development for veteran teachers (Dejarnette,
2012). Providing instruction and pedagogy on scientific inquiry and technological design
in the elementary classroom will help elementary teachers feel more confident to alter
their existing curricula to incorporate STEM initiatives (Dejarnette, 2012). When teachers
have positive self-efficacy towards instructional methods, they are more likely to engage
students using that method (Ross, 1998). Implementing STEM concepts in the
elementary school curricula involves teaching students through problem-based learning
and collaboration which resembles the workplace of the future (Dejarnette, 2012).
The third suggestion to help motivate American youth to begin rigorous academic
tracks that lead to higher education and careers in STEM disciplines is to provide
ample and equal opportunities for early exposure to STEM related concepts.
Developing summer camps, classes, and workshops for elementary students to
experience hands-on scientific inquiry and technological design activities will
engage young learners with STEM disciplines and content that they might not
otherwise experience. While students are engaged in STEM activities, they will
109
also gain experience with 21st Century skills such as critical thinking,
collaboration and communication that will help prepare them to compete on the
global level. Interactive problem-based learning activities in STEM disciplines are
innovative and exciting for young learners. It is hypothesized that this type of
environment will spark motivation to pursue more advanced math and science
courses and lay the foundation for STEM careers. More research needs to be done
in this area as the United States moves forward to reclaim their status as global
leaders in math and science (p.82).
Providing exposure to even the youngest learners may be the key to long-term
success for American education (Dejarnette, 2012). The opportunity for America to
achieve high ranking status in STEM disciplines in the world markets lies in the hands of
our youth (Dejarnette, 2012). We can achieve these lofty goals by implementing STEM
initiatives as an integral part of the elementary level curricula in America today
(Dejarnette, 2012).
Increasing the STEM initiatives will increase the gains in science achievement
scores for elementary students and science motivation.
Limitations of the Study
Technology integration is thought to be directly influenced by the following four
barriers: (a) teacher’s attitudes and beliefs towards using technology, (b) the teacher’s
knowledge and skills (c) the institution and (d) resources (Brush & Hew, 2007).
Professional development can influence a teacher’s attitudes and beliefs towards
technology (Shaunessy, 2005); as well as provide teachers with the knowledge and skills

110
to employ technology in classroom practice (Fishman & Pinkard, 2001). A review of
relevant literature showed that effective professional development related to technology
integration: ( a) focuses on content, (b) gives teachers opportunities for “hands-on” work
and (c) is highly consistent with teachers’ needs (Brush & Hew, 2007).
Yet, even the best courseware is of limited value unless teachers are
knowledgeable about the content and comfortable with the technology used to deliver it
(Von Blum, 1992). Teachers must have strategies for integrating courseware within their
other classroom activities (Shavelson et al., 1984). Technology integration cannot occur
if the teacher lacks the knowledge or skills to operate computers and software (Brush &
Hew, 2007). In this study there was difficulty in selecting a teacher who had
technological skills as well as science skills adept enough to teach the students. More
professional development in science and technology can help teachers who need
assistance in infusing technology into their science classroom. This limitation did not
allow for the study to accommodate more treatment groups i.e. grades 5, 6, 7 and 8. The
sample size was small n=20 because of this limitation as well.
Oftentimes administrators cite budgetary constraints for not funding science labs.
By using computerized software to conduct lab experiments, administrators can utilize
the numerous computers in the building and prolong the purchases of expensive lab
equipment used in dissections, magnifications and /or chemical titrations. However, even
sometimes when computers are available, they may be off limits to other subject teachers.
The computers may be broken or outdated. Additionally, some of the computers could be
unable to support the internet or certain graphic software. Administrators need to ensure
that there technological resources are available for use by other teachers besides the
111
technology teacher. They also need to ensure that they are up to date and repaired or
replaced when needed.
In this study, many of the tablets used in this experiment had to be updated in
order to support the virtual labs. Laptops would have been better for students to use or
computers with large screens but they weren’t readily available.
An additional limitation was that the school had very limited science equipment
for students to utilize. The equipment was practically new but very few in numbers to
accommodate students working in pairs. Additionally, there was not a wide variety of
equipment to accommodate the various lab activities. Therefore, the lab choices for both
Virtual and Traditional were limited to the equipment that could be used by traditional
groups since students in both groups must to carry out the same science objectives.
Another limitation was the time frame for the study. Due to the school being a
faith based school the teacher who also doubles as the choir director had to plan her
schedule around the church activities. The study would have been more weeks if the time
for science did not have to be missed due to the teacher instructing choir rehearsal for
church, recitals and/or plays. The study was conducted for 8 weeks.
Directions for Future Research
There is not much research done in the areas of elementary school science and
technology. Many of the research regarding science and technology are directed towards
middle school, high school, undergraduate and graduate science classes. More research
has to be done in the areas of elementary school and science learning utilizing
technology. Elementary school students are different from Middle school, High School

112
and College students in the way that they learn. The Elementary school classroom is
more teachers centered. The elementary students constantly look for feedback, guidance,
encouragement, constructive criticism from their teacher. The elementary students are
children looking for nurturing and hand holding from their teachers. Elementary school
students expect their teacher to be very active in their learning i.e. reading to them,
praising them for good work or letting them know when they have make mistakes. High
school and college students require less “hand holding” from their teachers. With proper
instructions High school and college students can conduct classroom labs by themselves
with little or no praise or feedback. Hence, the virtual group which is pretty much self -
lead, may pose a small challenge to elementary school students. The virtual lab, however,
keeps more students in engaged and for a longer time. There needs to be more qualitative
data collected during instruction with technological infused learning.
Many of the computerized virtual software may have a feedback mechanism that
states “nice job”. Yet, a computerized program can’t give a high five or a pat on the back
for a job well done. The computerized program can’t smile at the student or give them a
treat for doing a good job. These types of praise are common for elementary students to
expect from their teacher. Elementary students need this type “nurturing feedback”.
The computerized science programs can afford elementary students laboratory
experiences with virtual equipment and tasks that go far beyond the scope of the
laboratory experiences that they could be done in class. Yet, the computerized science
program cannot provide elementary school students with the feedback they need
regarding using certain science equipment correctly such as balances and/ or
microscopes. The computerized version calibrates the balances automatically to get the

113
weight of an object once the object is placed on the virtual balance. Even after the virtual
lab the students would not be able to utilize, calibrate, or trouble shoot problems with the
balance. The students would have to learn that from their teacher.
In the virtual lab, the microscope zooms in on the specimen, once the specimen is
placed on the slide automatically at the power the student chooses. In a traditional lab, the
students would have to zoom on the specimen by physically adjusting the course
objective knobs, diaphragm, and slide. Also, in a traditional lab, a glass slide may break,
if the student uses the high power objective to close to the slide or while taking the slide
to his seat. In a traditional lab, the student would have to retrieve another slide from the
teacher, prepare a new slide, and/or follow the correct lab safety procedures to deal with
the breakage. They would have to learn these procedures from their teacher as well.
A computerized program cannot provide feedback as to the pace the lab should be
conducted. In Physical Chemistry labs the timely mixing of chemicals are necessary to
attain a certain reaction. In a virtual lab, these nuances are not an issue because the
program doesn’t allow for those real life occurrences. Yet, these real life experiences will
occur if these students decide to take high school or college science classes, pursue a
career as a pharmacist, phlebotomist, doctor, lab technician, biologist or chemist. Virtual
labs that correct for these nuances should be researched to better fit the reality of
traditional labs and elementary students. Virtual labs should also provide an immediate,
yet nurturing feedback mechanism for elementary students.
Research shows that there is an advantage of using the videos as a prelab activity
for students—even for those students who perform the lab with actual equipment (Darrah
et al., 2014). Professors in one study reported that a great deal of time is typically spent at
114
the beginning of each lab period explaining the procedures to the students (Darrah et al.,
2014). Using the videos to provide this preliminary explanation can save time in class,
which can be better used to debrief after the lab is completed (Darrah et al., 2014).
However, elementary students have a short attention span and have usually had a
“mother/child relationship with the teacher. The actual teacher would probably have to
record herself doing the lab in order for the students to pay attention.
Based on this study, computerized labs programs should be done in tandem with
traditional labs. On an elementary school level traditional labs and computerized labs
should be done as a mixed method as well as be teacher centered.
Implications for Future Practice
The research literature abounds with successful computer applications that have
enabled students to master concepts usually considered too sophisticated for their grade
level (Rochelle et. al, 2000). Based on my research, virtual labs help more advanced
Elementary students to progress. Many of the appropriate scaffolding, fading and
feedback mechanisms should be incorporated into the virtual lab especially for
Elementary school students. Scaffolding enables learners to realize their potential by
providing assistance when needed, and then fading out this assistance as meaningful
learning takes place (Collin et. al., 1989). Fading ensures that the child does not become
overly dependent on a particular prompt when learning a new skill (Cooper, Heron, &
Heward, 2007).
Feedback mechanisms should be more readily built into virtual programs as well
as verbal/visual cues and narration. Prompt feedback is provided to help students acquire

115
skills and knowledge (Yin et. al., 2013). Mandatory surveys at the end of each lab should
be utilized to assess usability. Students in every group should discuss how they felt doing
labs. A qualitative interview can also be done by the teacher.
More Math, ELA, and elective classes such as Spanish should have virtual and
traditional methods of learning. In this way, students who are able to advance in the
course would be afforded the opportunity to increase their learning instead of waiting for
other students who might not be on their level. Additionally, 3rd
, 4th
, 5th
graders, typically
elementary school grades, when standardized testing begins should experience virtual,
traditional and mixed methods of learning during instruction and research data on pretest
/posttest gains should be collected.
The tablets used should be roughly the size of a notebook and touch screen
enabled. The tablets/Chromebooks or IPADS given to elementary students in schools
have screens that are too small and aren’t touch screen. The larger screens help younger
students to better see the virtual activities. Touch screen assists them with usability. A
narrative or closed captioning should be available to help them listen to or read
directions. Additionally, the virtual labs should be in different languages to accommodate
second language learners.
The research should take place from September to June, the entire school year. In
an elementary class the same teacher should utilize traditional, virtual and mixed
methods. A researcher could then compare student gains, for each group. For example, a
third of the semester, traditional methods are used; the second third of the semester
virtual methods are used. For the last 3 months, students will be taught with both
traditional and virtual methods. This procedure can be used for differing subjects i.e.
116
Math, Ela, Spanish and elementary grades, 3, 4, 5. Pretest/Posttest gains from each class,
subject and grade could then be analyzed to determine how the same class with same
teacher (since one teacher teaches all subjects in one elementary class) progressed using
the varying methods of instruction.
The Elementary school teacher is important to students’ learning at a small age.
This is because elementary students rely greatly on teacher feedback and nurturing. The
teacher can make the lab interesting and make students want to learn more about the
science lab in elementary setting providing that she is well versed in the subjects that she
teaches. The teacher must be able to impart the appropriate knowledge and deliver the
instruction in a fashion suitable for piquing the interest in young learners. Schools in
lower socioeconomic areas, often times have inexperienced teachers, due to high turnover
rate, and/or lack of experience (5years or less), that are not well versed in their content
area. This puts elementary students of color who are learning science at a disadvantage.
In order to meet the academic needs of these students, schools in which African
American and Latino attend should employ teachers with proficient content knowledge in
Science.
Virtual and traditional labs should be utilized together such that the students’
experience using both methods to conduct the same type of lab. For example, if the
students are learning about magnets, the teacher should allow the students in lab class to
use magnets so that the students can actually experience the pull of attraction and push of
repulsion, respectively, when the north and south poles are close together or when the
north and North Pole or south and south poles are together. The teacher should also allow
the students to observe the patterns of attraction and repulsion of a magnet when using

117
iron filings. Students should be allowed to explore what surfaces “stick” to the magnet
and which ones don’t.
After the traditional lab on magnets, students should then be afforded the
opportunity to conduct a virtual lab. The virtual lab will enable students to go above and
beyond the use of magnets in the classroom. For example, they will be able to see
attraction/repulsion using virtual magnets and iron filings. Additionally, they will be able
to use a virtual wrecker car magnet to pick up and move virtual cars and measure the
force using a virtual spring scale.
Schools in which African American and Latino students attend should be outfitted
with the appropriate laboratory equipment for traditional labs and up to date technology
for virtual labs. Often times, African American and Latino students are placed in schools
that fail to provide necessary scientific resources for students in the science classroom.
For example, in many of these schools science lab equipment used in the traditional
setting may be broken, outdated or few in number. To conduct the virtual labs, Wi-Fi
connectivity may be slow or weak, computers may be broken or contain outdated
software and /or mobile devices such as tablets and chrome books may be too few for the
number of students in the science classroom. This puts elementary students of color who
are learning science at a disadvantage. Schools in which African American and Latino
students attend should have upgraded and sufficient science lab/technological equipment
to meet the scientific academic needs of their elementary students.
The students should be assessed before and after each lab activity and they should
explain the pros and cons of both methods as it pertains to self- efficacy and science
learning for that particular lab. A pre and post-test questionnaire such as the STMSL
118
could be utilized. A qualitative and quantitative study (mixed method research) would be
better for determining the effects of virtual laboratory activities on science learning for
elementary school students.

119
APPENDIX A
New York State Standards for Grade 4
Students will understand and apply scientific concepts, principles, and theories pertaining
to the physical setting and living environment and recognize the historical development
of ideas in science.
4.E: Energy
4-PS3-1: Use evidence to construct an explanation relating the speed of an object to the
energy of that object.
4-PS3-2: Make observations to provide evidence that energy is conserved as it is
transferred and/or converted from one form to another.
4-PS3-4: Apply scientific ideas to design, test, and refine a device that converts energy
from one form to another.
4-ESS3-1: Obtain and combine information to describe that energy and fuels are derived
from natural resources and their uses affect the environment.
4.W: Waves: Waves and Information
4-PS4-1: Develop a model of waves to describe patterns in terms of amplitude and
wavelength and that waves can cause objects to move.
4.SFI: Structure, Function, and Information Processing
4-LS1-1: Construct an argument that plants and animals have internal and external
structures that function to support survival, growth, behavior, and reproduction.
4-LS1-2: Use a model to describe that animals receive different types of information
through their senses, process the information in their brain, and respond to the
information in different ways.
4.ES: Earth’s Systems: Processes that Shape the Earth

120
4-ESS1-1: Identify evidence from patterns in rock formations and fossils in rock layers to
support an explanation for changes in a landscape over time.
4-ESS2-1: Make observations and/or measurements to provide evidence of the effects of
weathering or the rate of erosion by water, ice, wind, or vegetation.
4-ESS2-2: Analyze and interpret data from maps to describe patterns of Earth’s features.
4.P1: The Earth and celestial phenomena can be described by principles of relative
motion and perspective.
4.P1.1a: Natural cycles and patterns include:
4.P1.1a.1: Earth spinning around once every 24 hours (rotation), resulting in day and
night
4.P1.1a.3: the length of daylight and darkness varying with the seasons
4.P2: Many of the phenomena that we observe on Earth involve interactions among
components of air, water, and land.
4.P2.1c: Water is recycled by natural processes on Earth.
4.P2.1c.1: evaporation: changing of water (liquid) into water vapor (gas)
4.P2.1c.2: condensation: changing of water vapor (gas) into water (liquid)
4.P2.1c.3: precipitation: rain, sleet, snow, hail
4.P2.1c.4: runoff: water flowing on Earth s surface
4.P2.1c.5: groundwater: water that moves downward into the ground
4.P3: Matter is made up of particles whose properties determine the observable
characteristics of matter and its reactivity.
4.P3.1a: Matter takes up space and has mass. Two objects cannot occupy the same place
at the same time.
121
4.P3.1c: Objects have properties that can be observed, described, and/ or measured:
length, width, volume, size, shape, mass or weight, temperature, texture, flexibility,
reflective- ness of light.
4.P3.1e: The material(s) an object is made up of determine some specific properties of
the object (sink/ float, conductivity, magnetism). Properties can be observed or measured
with tools such as hand lenses, metric rulers, thermometers, balances, magnets, circuit
testers, and graduated cylinders.
4.P3.1f: Objects and/ or materials can be sorted or classified according to their
properties.
4.P3.1g: Some properties of an object are dependent on the conditions of the present
surroundings in which the object exists. For example:
4.P3.1g.2: lighting -shadows, color
4.P3.2b: Temperature can affect the state of matter of a substance.
4.P4: Energy exists in many forms, and when these forms change energy is conserved.
4.P4.1a: Energy exists in various forms: heat, electric, sound, chemical, mechanical,
light.
4.P4.1b: Energy can be transferred from one place to another.
4.P4.1c: Some materials transfer energy better than others (heat and electricity).
4.P4.1d: Energy and matter interact: water is evaporated by the Sun s heat; a bulb is
lighted by means of electrical current; a musical instrument is played to produce sound;
dark colors may absorb light, light colors may reflect light.
4.P4.1e: Electricity travels in a closed circuit.
4.P5: Energy and matter interact through forces that result in changes in motion.
4.P5.1b: The position or direction of motion of an object can be changed by pushing or
pulling.
4.P5.1c: The force of gravity pulls objects toward the center of Earth.
4.P5.1d: The amount of change in the motion of an object is affected by friction.

122
4.P5.1f: Mechanical energy may cause change in motion through the application of force
and through the use of simple machines such as pulleys, levers, and inclined planes.
4.L1: Living things are both similar to and different from each other and from
nonliving things.
4.L1.1b: Plants require air, water, nutrients, and light in order to live and thrive.
4.L1.2a: Living things grow, take in nutrients, breathe, reproduce, eliminate waste, and
die.
4.L2: Organisms inherit genetic information in a variety of ways that result in
continuity of structure and function between parents and offspring.
4.L2.1a: Some traits of living things have been inherited (e.g., color of flowers and
number of limbs of animals).
4.L2.2a: Plants and animals closely resemble their parents and other individuals in their
species.
4.L2.2b: Plants and animals can transfer specific traits to their offspring when they
reproduce.
4.L3: Individual organisms and species change over time.
4.L3.1b: Each plant has different structures that serve different functions in growth,
survival, and reproduction.
4.L3.1b.3: stems, stalks, trunks, and other similar structures provide support for the plant
4.L3.1b.5: flowers are reproductive structures of plants that produce fruit which contains
seeds
4.L4: The continuity of life is sustained through reproduction and development.
4.L4.1a: Plants and animals have life cycles. These may include beginning of a life,
development into an adult, reproduction as an adult, and eventually death.
4.L4.1d: Life cycles of some plants include changes from seed to mature plant.
4.L4.2a: Growth is the process by which plants and animals increase in size.

123
4.L5: Organisms maintain a dynamic equilibrium that sustains life.
4.L5.1a: All living things grow, take in nutrients, breathe, reproduce, and eliminate
waste.
4.L6: Plants and animals depend on each other and their physical environment.
4.L6.1a: Green plants are producers because they provide the basic food supply for
them- selves and animals.
4.L6.1b: All animals depend on plants. Some animals (predators) eat other animals
(prey).
4.L6.1c: Animals that eat plants for food may in turn become food for other animals. This
sequence is called a food chain.
4.L6.1d: Decomposers are living things that play a vital role in recycling nutrients.
4.L6.2b: The Sun s energy is transferred on Earth from plants to animals through the
food chain.
4.L6.2c: Heat energy from the Sun powers the water cycle (see Physical Science Key Idea
2).

124
APPENDIX B
Classroom Observation Notes
Week Duration Observations
1 50 min Traditional Lab-Volume
Teacher gave students who were placed in groups of four their
graduated measuring cups. Teacher directed students to
conduct the Volume lab. She went from group to group to
check for understanding. Teacher explained how to measure
liquids with a measuring cup using graduations. Students
filled out lab sheet. The teacher had students use graduated
measuring cups to measure different amounts of water. The
teacher asked “how close can you get to the correct amount of
liquid”. Students shared equipment, but the lab was mostly
teacher directed. Students struggled with counting
graduations but teacher kept redirecting the students and
assisting them with the lab for the entire time. The traditional
lab was confusing because students used graduated measuring
cups and not actual graduated cylinders to measure volume
which the lab activity recommended. The graduated
containers they used, however, were similar to those that
would be used on the 4th
grade State exam, but not what the
lab called for. This left some students confused even though
the teacher tried showing them how to use it. When the
teacher asked a student what he was doing, he said that he was
measuring liquids (water) using the measuring cups. Many
students had not completed all of the questions, but they were
able to measure out different amounts of water in different
amounts of measuring containers. The group was talking
loudly. Perhaps it would have been better if they worked in
pairs. However, this is how the teacher conducts lab work
with her students in the traditional sense. At the end of 50
minutes the teacher collected all of the students work. The
two groups within the traditional lab did not completely
finish. Teacher directed one group mostly, even though both
groups needed direction. Teacher explained how to measure
with measuring cups using graduations. Students filled out lab
sheet. Teacher asked, “How close can you get?” Teacher
helped students arrive at the answer. Students struggled with
counting graduations. Students were not using graduated
cylinder, they were using graduated containers where the
graduations weren’t that pronounced. Traditional labs were
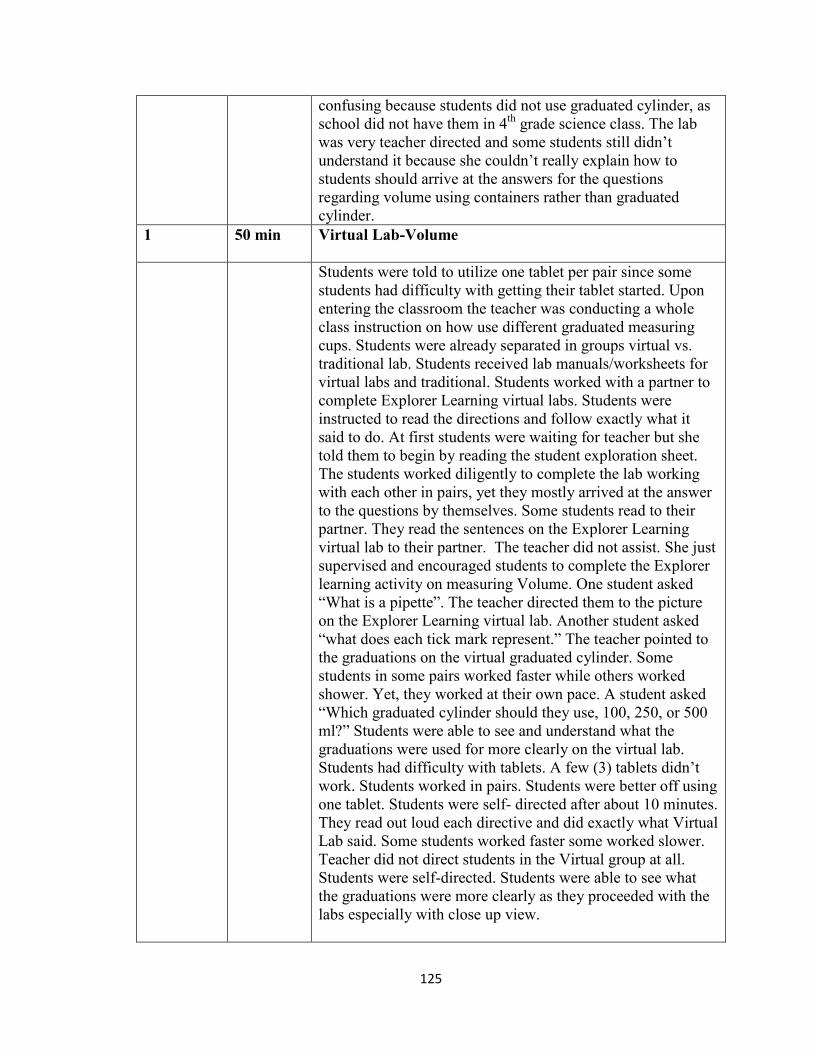
125
confusing because students did not use graduated cylinder, as
school did not have them in 4th
grade science class. The lab
was very teacher directed and some students still didn’t
understand it because she couldn’t really explain how to
students should arrive at the answers for the questions
regarding volume using containers rather than graduated
cylinder.
1 50 min Virtual Lab-Volume
Students were told to utilize one tablet per pair since some
students had difficulty with getting their tablet started. Upon
entering the classroom the teacher was conducting a whole
class instruction on how use different graduated measuring
cups. Students were already separated in groups virtual vs.
traditional lab. Students received lab manuals/worksheets for
virtual labs and traditional. Students worked with a partner to
complete Explorer Learning virtual labs. Students were
instructed to read the directions and follow exactly what it
said to do. At first students were waiting for teacher but she
told them to begin by reading the student exploration sheet.
The students worked diligently to complete the lab working
with each other in pairs, yet they mostly arrived at the answer
to the questions by themselves. Some students read to their
partner. They read the sentences on the Explorer Learning
virtual lab to their partner. The teacher did not assist. She just
supervised and encouraged students to complete the Explorer
learning activity on measuring Volume. One student asked
“What is a pipette”. The teacher directed them to the picture
on the Explorer Learning virtual lab. Another student asked
“what does each tick mark represent.” The teacher pointed to
the graduations on the virtual graduated cylinder. Some
students in some pairs worked faster while others worked
shower. Yet, they worked at their own pace. A student asked
“Which graduated cylinder should they use, 100, 250, or 500
ml?” Students were able to see and understand what the
graduations were used for more clearly on the virtual lab.
Students had difficulty with tablets. A few (3) tablets didn’t
work. Students worked in pairs. Students were better off using
one tablet. Students were self- directed after about 10 minutes.
They read out loud each directive and did exactly what Virtual
Lab said. Some students worked faster some worked slower.
Teacher did not direct students in the Virtual group at all.
Students were self-directed. Students were able to see what
the graduations were more clearly as they proceeded with the
labs especially with close up view.
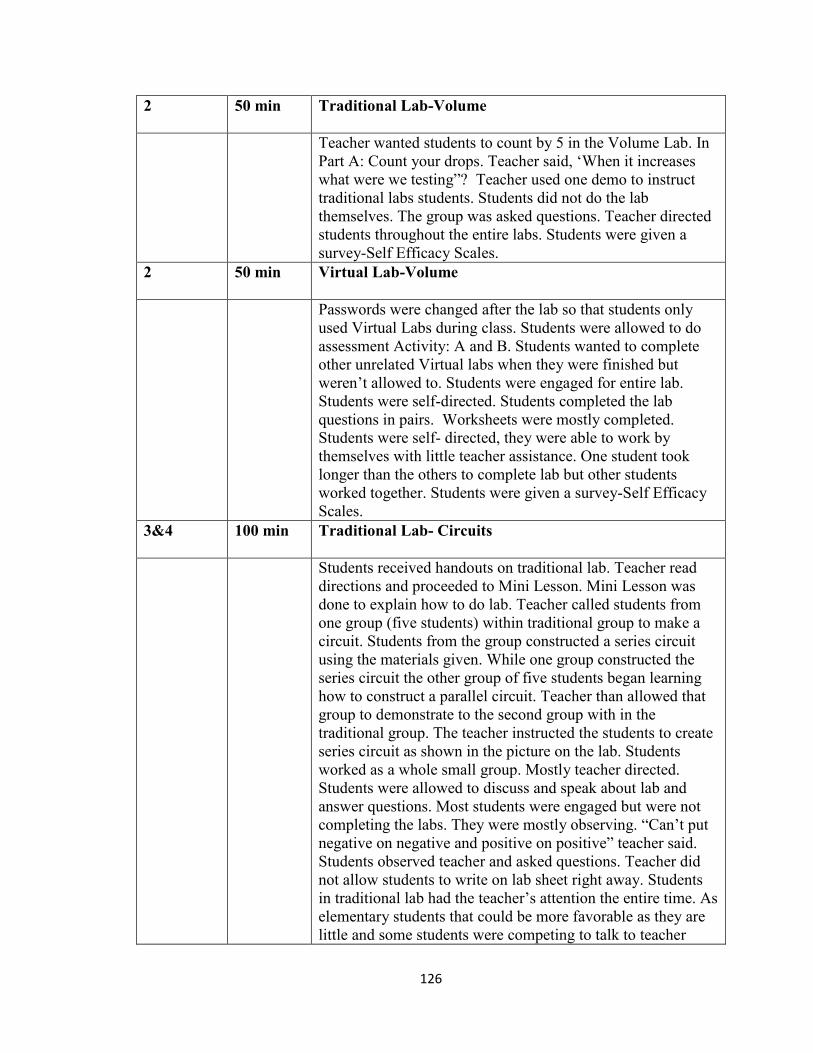
126
2 50 min Traditional Lab-Volume
Teacher wanted students to count by 5 in the Volume Lab. In
Part A: Count your drops. Teacher said, ‘When it increases
what were we testing”? Teacher used one demo to instruct
traditional labs students. Students did not do the lab
themselves. The group was asked questions. Teacher directed
students throughout the entire labs. Students were given a
survey-Self Efficacy Scales.
2 50 min Virtual Lab-Volume
Passwords were changed after the lab so that students only
used Virtual Labs during class. Students were allowed to do
assessment Activity: A and B. Students wanted to complete
other unrelated Virtual labs when they were finished but
weren’t allowed to. Students were engaged for entire lab.
Students were self-directed. Students completed the lab
questions in pairs. Worksheets were mostly completed.
Students were self- directed, they were able to work by
themselves with little teacher assistance. One student took
longer than the others to complete lab but other students
worked together. Students were given a survey-Self Efficacy
Scales.
3&4 100 min Traditional Lab- Circuits
Students received handouts on traditional lab. Teacher read
directions and proceeded to Mini Lesson. Mini Lesson was
done to explain how to do lab. Teacher called students from
one group (five students) within traditional group to make a
circuit. Students from the group constructed a series circuit
using the materials given. While one group constructed the
series circuit the other group of five students began learning
how to construct a parallel circuit. Teacher than allowed that
group to demonstrate to the second group with in the
traditional group. The teacher instructed the students to create
series circuit as shown in the picture on the lab. Students
worked as a whole small group. Mostly teacher directed.
Students were allowed to discuss and speak about lab and
answer questions. Most students were engaged but were not
completing the labs. They were mostly observing. “Can’t put
negative on negative and positive on positive” teacher said.
Students observed teacher and asked questions. Teacher did
not allow students to write on lab sheet right away. Students
in traditional lab had the teacher’s attention the entire time. As
elementary students that could be more favorable as they are
little and some students were competing to talk to teacher

127
about lab. “If the circuit is open, will the circuit work?” the
teacher said. Teacher had students’ attention. After teacher
demonstration, students completed the lab worksheet. Teacher
asked, “While it is a conductor, light bulb will light up but if
it’s an insulator the light bulb will not light up. Why did the
paper clip light up the bulb?” Teacher assisted students with
response. Students had to leave the lab to go to Chorus
practice.
3&4 100 min Virtual Lab-Circuits
Students were given the lab and they quickly signed on and
began working in pairs to complete the lab. Virtual Lab
students worked very well independently. They were able to
navigate through the various instructions in order to carry out
the experiments. Students worked in pairs. Students read the
directions and relied on each other for help. Most students
were engaged for the entire period; 9 out of 10 students
specifically. Students conducted the different experiments for
electricity and they were all engaged for the duration of the
lab. Students were eager to show their virtual circuits to the
teacher.
5 50min Traditional Lab-Circuits
Students begin after teacher directed them. Teacher directed
students, yet half of the students were not engaged. They were
talking or waiting for the teacher. One student was waiting
after teacher told him to draw a series circuit on their papers.
At most 5 out of 10 children were not engaged. Some students
followed the teachers’ instruction and drew the circuits, she
asked them to draw. One student said that “It was hard”. 5/10
students were not engaged at about 20 minutes into period.
Students just waited for the teacher to answer the questions on
the lab. Teacher worked with five students at a time, while the
other five remained disengaged. After she showed 5 students
how to do the lab, she left them and went to the other group to
show the other 5 students. The other 5 students sat and
socialized until the teacher came back. Teacher explained the
differences and similarities of parallel and series circuit. She
spoke to one group of 5 students. She said, “What do you
notice about wires? Each wire has two sides”. Teacher
provided feedback to students’ pictures and made corrections
to their paper, while the other 5 students waited for her to
come back to them. Students waited for teacher to come back
from working with other group, even though she left that
group with materials to work independently as a group.

128
Teacher showed 5 students what a series circuit was and she
actually put it together herself while the students watched. 3
students from the other group came over to watch the bulbs
light up in a series circuit. The teacher than brought both
groups together to model making a parallel and series circuit.
Teacher told students “Connect wires to make a parallel
circuit”. She then asked, “Why didn’t bulb light up?” The
teacher discussed similarities between series and parallel
circuits. She went to 5 students to introduce the portion of the
lab, by saying “What is the conductor and what is an
insulator? The others finished the series and parallel circuits’
portion. About 5 minutes later, she put both groups together
to conduct lab. She instructed all the students how to fill in the
table. Teacher asked, “What is the battery source?” She then
said, “Complete the table for what objects you predicted will
conduct electricity and what object actually did”. It was
evident that the teacher’s back was getting tired, because she
was doing the lab for the students, testing each object herself
for conductivity. A student said “Magnets are made out of
metal will it conduct electricity”. Teacher said, “You are
supposed to write magnet, we will wait for you”. Teacher had
all groups together as a group of 10. Teacher said, “Did you
guys put your prediction first?” Teacher helped students
complete data table. She said, “you guys all guessed what?
It’s an insulator”. Everybody write down aluminum foil on
table. “You guys got the prediction wrong for aluminum foil.”
Teacher gave immediate feedback. Teacher instructed each
student had to write down what their predictions were for each
item being tested. Teacher had students test rubber bands for
conductivity by having them watch her do the testing. She
instructed them to write down the actual observations,
whether the rubber bands were conductors or insulators.
Some students said nickel is a metal. Teacher said, “What is
conductor we are using?” Students replied, “penny”. The
teacher then gave out the setups to groups of two to test each
item. Teacher, said “I didn’t say to start yet” because she
wanted to see each group working simultaneously. Teacher
checked each pair to make sure they had the correct setup,
then she told them to start. “Good job,” she praised them.
“Good team work”, she said. “There you go”; “good job”,
teacher said. “You deserve a round of applause”, teacher said.
“Which insulator should be used spoon or paper clip”, teacher
asked? Students replied, “paper clip”. Students began arguing
with others about the answer, paper clip. She asked students to
unplug and redo the testing. She said,” Ready, Set, Go”. Some
students finished right away and then began to talk. Teacher

129
praised students by saying, “Good job”. Teacher waited for
the group to write nail, for the next test item. Teacher then
walked away from the group. Students did not engage when
teacher walked away, instead they waited until she came back
to begin working.
5 50min Virtual Lab-Circuits
Students logged on to explore learning and began reading
instructions for activity B&C. Some students had problems
with the tablets, some students worked with a partner, others
worked alone. Cyber lab students relied on each other or
themselves for answers to the questions in the activity. “How
does that make any sense”, said a student and then he asked
another student for help. Students asked, “What does
orientation mean?” Another student asked,” Does the
conductor have a different effect on the light bulb lighting
up?” By 9:35am only one student did not complete cyber lab.
Students were self-directed for the entire lab. All students
were engaged at 9:07. Students were self-directed for the
entire duration of cyber lab. Most students were almost
finished with Cyber lab activity A&B. Students were all up to
C by 9:25. Student showed another student that if she charged
the lightbulb with too much power the light bulb blew out. By
9:30, 5 students had finished.
6 50 min Traditional Lab- Measuring
Students were learning how to use a ruler. Teacher used the
Smart Board to show students how to do the math as it
pertains to the ruler such as measuring in between the lines of
the ruler graduations. In the measure length lab, students
practice making metric measurements. Five out of 10 were
engaged, only 5 students were raising their hands. Students
waited for teacher directions to complete table. Students only
engaged when teacher is present at the group. Teacher will
show students how to measure in inches. Students were
allowed to move closer to the teacher so that they could watch
her demonstrate how to use a ruler. Measuring the distance
using a meter-stick between 2 objects. It goes over the ruler
you mark it and then start it again. Teacher counted with
students the lines on the ruler to measure the object with the
ruler in inches. The measured 16 lines like “ 1…2…3…”.
Some students were looking around at least 5 out of 10 of
them. Someone’s paper even fell through the window.
Teacher would work with 5 students and leave the others then
go back. While in traditional, they had to work together and
the teacher said that they worked too slow especially some of

130
them. Teacher set up items with different distances and asked
students to measure each one from 1…2…3…etc., The entire
group of students worked as a team to complete the labs. 10
students were huddled at one station. Teacher said, use large
ruler, for farther distances. Teacher included Math, Simplify,
9/36, 5/35, 8/36, 8/32, 10/20, to reinforce the fractions on the
ruler in inches.
6 50 min Virtual Lab- Measuring
Students were doing a whole group instruction on measuring
afterwards. Students broke up into their group to do the Cyber
Lab on Measuring trees. Student asked questions like “Which
ring should be counted”. Students worked in pairs or alone.
They used the virtual ruler to measure the diameter of the
trees cross section. Most students worked with their partner to
answer the questions on the sheet. Student- directed totally.
Students were able to measure the height, circumference, age
and diameter of cross section of trees with virtual ruler. Only
one student worked by himself. One student was off task. One
student was up to the Extension activity while other groups
were up to only Activity B and some were up to Activity A.
Students were allowed to work at their own pace.
7 50 min Traditional Lab-Magnets
Teacher said, “What is that a magnet?” Teacher had all
students stand around her as she showed them how a
demonstration on how to work with magnets. Students
gathered around her with their lab sheets. “Did you feel that
pull”?, Teacher said. Then she told 5 students to sit down and
wait for her while the other five watched her do the demo.
Teacher put various objects in the sand to see if the magnet
would pick them up. Teacher said, “What happened when you
put magnet over sand?” Student answered that the objects/
items will connect to magnet. Teacher said, “What is another
name for connect. Students responded, “Attract”. Teacher
showed two magnets and showed how opposite poles attract
while same poles repel. She gave the two magnets to other
students to show that like poles, repel and opposite poles
attract. Teacher spoke to the group as a whole. She said,
“Which types of materials are attracted to a magnet?” She
said, “Predict first. Write down in your chart. Paper clip”. The
lesson is very teacher directed. Students took a long time to
write paper clip. Some students with group of 10 finish sooner
than others and then they just wait. During whole group

131
instruction students are engaged. Constant teacher feedback
and constant teacher directive. Teacher said, “Do you guys
remember what aluminum foil did with conducting electricity.
Let’s see if it attracts to the magnet.” Teacher also helped
students with spelling and grammar. Students wrote down
there predictions. Completion took longer because students
had to wait on each other. 5/10 people were not engaged.
Engagement is on and off depending on whether the
demonstration is whole group or with individual students.
Teacher said a student was not paying attention. Teacher
posed, “Did penny conduct electricity”. Is everything that
conducts electricity, magnetic?” Students responded, “No.”
Teacher was able to scaffold to facts learned during electricity
lesson, 2 days ago.
7 50 min Virtual Lab-Magnets
Students logged into Cyber Lab Magnetism. Students with
Virtual Lab worked well with each other in pairs to complete
the lab questions. Students asked, “Does iron stick?, Does
copper stick?” “Maybe we are using the wrong pole”, a
student said. Students trouble shoot on their own or with their
partner. Students relied heavily on their partner for feedback
from the lab. Students followed directions as they were on the
lab sheets. At any given time 10 out of 10 students were
engaged. One student asked, “Do you see a pattern?” Instead
of asking teacher for help, students relied on themselves and
their classmates for help.
8 50 min Traditional Lab-Weight and Mass
Students were given a scale to find the mass of various
objects. Teacher followed the lab manual with the students so
that they can find the mass of various objects using a balance
scale. Students relied on the teacher to read the questions and
review answers. The teacher showed the students how to use
the balance scale and how to add weights to balance the scale.
When teacher posed high order or low order questions, 5 out
of 10 students raise their hand at any given time.
Teacher said, “What is the best mass to use to find the weight
of a 4th
grader?” 5 out of 10 students raised their hands.
Teacher then said, “To find the weight for average 4th grader
grams is very small.” Students said, “We need something
bigger than grams.” Teacher told students to double grams to
get pounds.
“1KG=2pounds, 2kg=4pounds, and 5kg= 10 pounds.”
Teacher said, “An average 4th
grader should be a little over
30kg”. Teacher said, “What is the best estimate for the weight

132
of a handful of grapes. Student said, “Would it be
7000grams”?
8 50 min Virtual Lab-Weight and Mass
Students conducted the weight and mass lab. One of the
questions on the lab was, “What is the difference between a
pound and kg which one is bigger?” Students quickly found
the lab, Weight and Mass and began working on it in pairs
together. Students relied totally on each other to obtain
answers. They even showed each other how to arrive at the
answer using virtual lab equipment. The experiment that they
conducted was “Look at the dog weight on Jupiter.” All
students were engaged for the duration of the lab and relied on
each other. They showed each other how to do the
experiment. Students even corrected other students’ behavior.
Students relied on each other for help. Virtual labs were
student directed, paced and students supplied their own
feedback to each other.
133
APPENDIX C
IRB Approval Letter

134
APPENDIX D
Child Assent Form
135
APPENDIX E
Parent/Guardian Consent Form
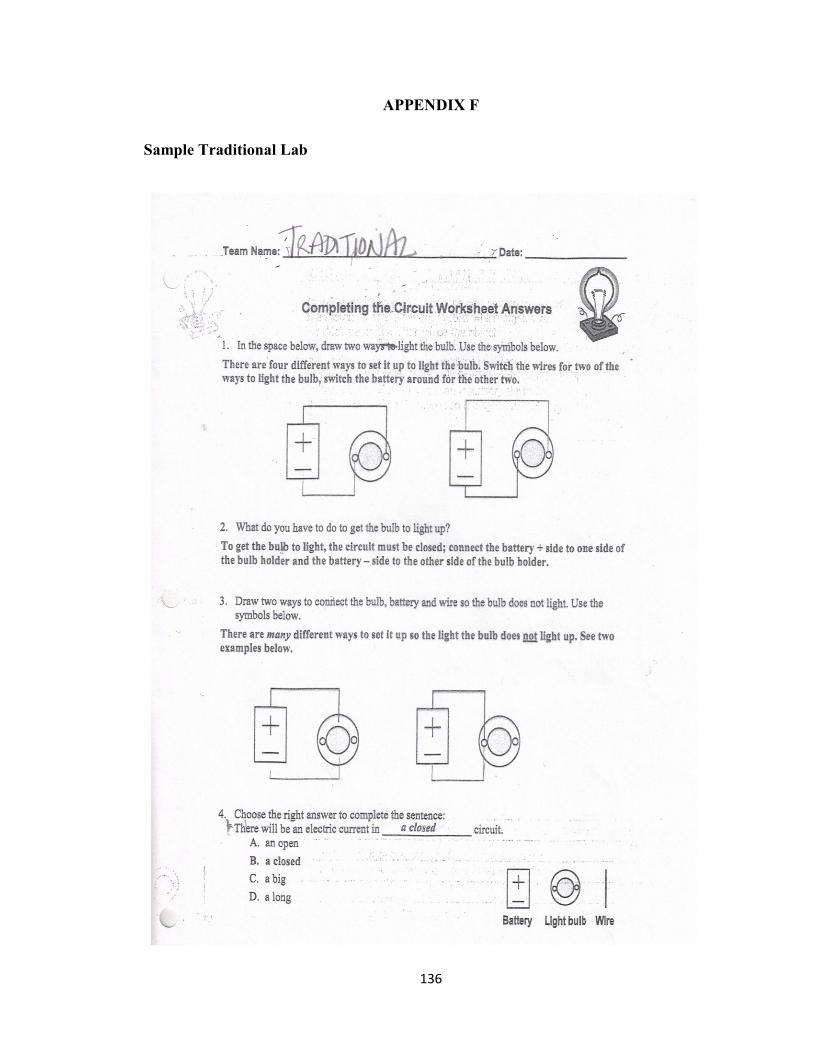
136
APPENDIX F
Sample Traditional Lab

137
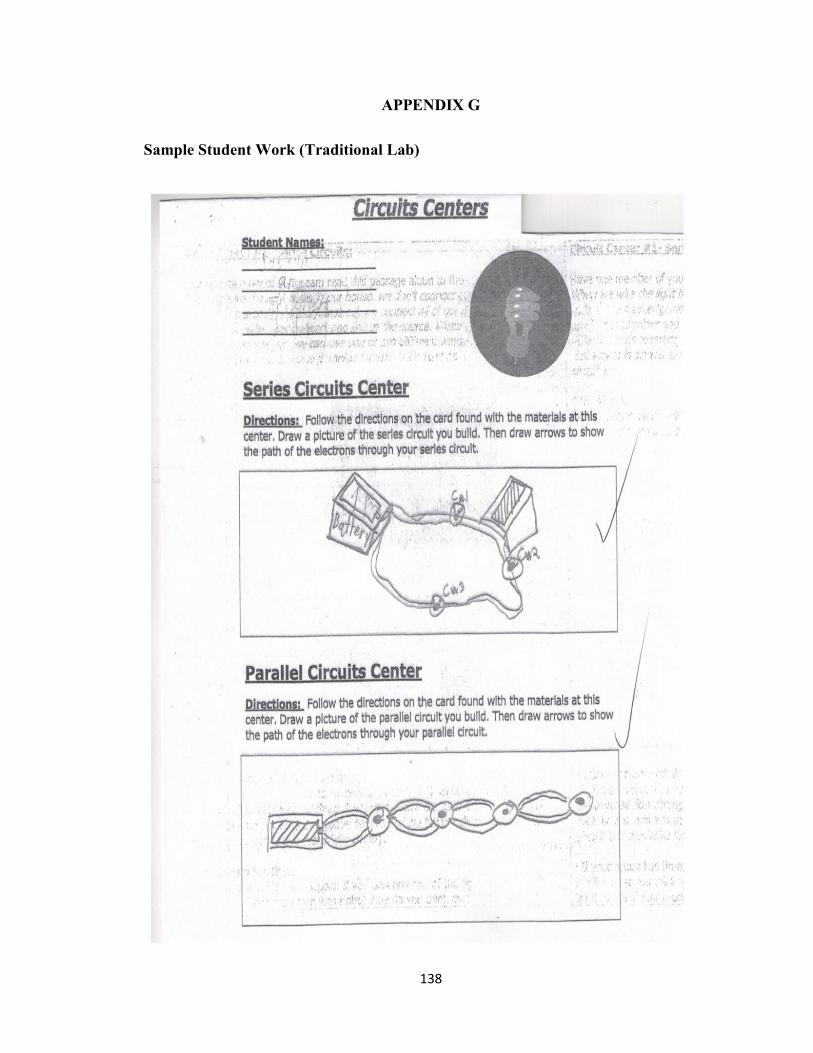
138
APPENDIX G
Sample Student Work (Traditional Lab)

139

140
APPENDIX H
Sample of Student Work (Virtual Lab)

141

142

143

144
APPENDIX I
Approval Letter from Principal

145
APPENDIX J
Students Motivation Towards Science Learning Questionnaire
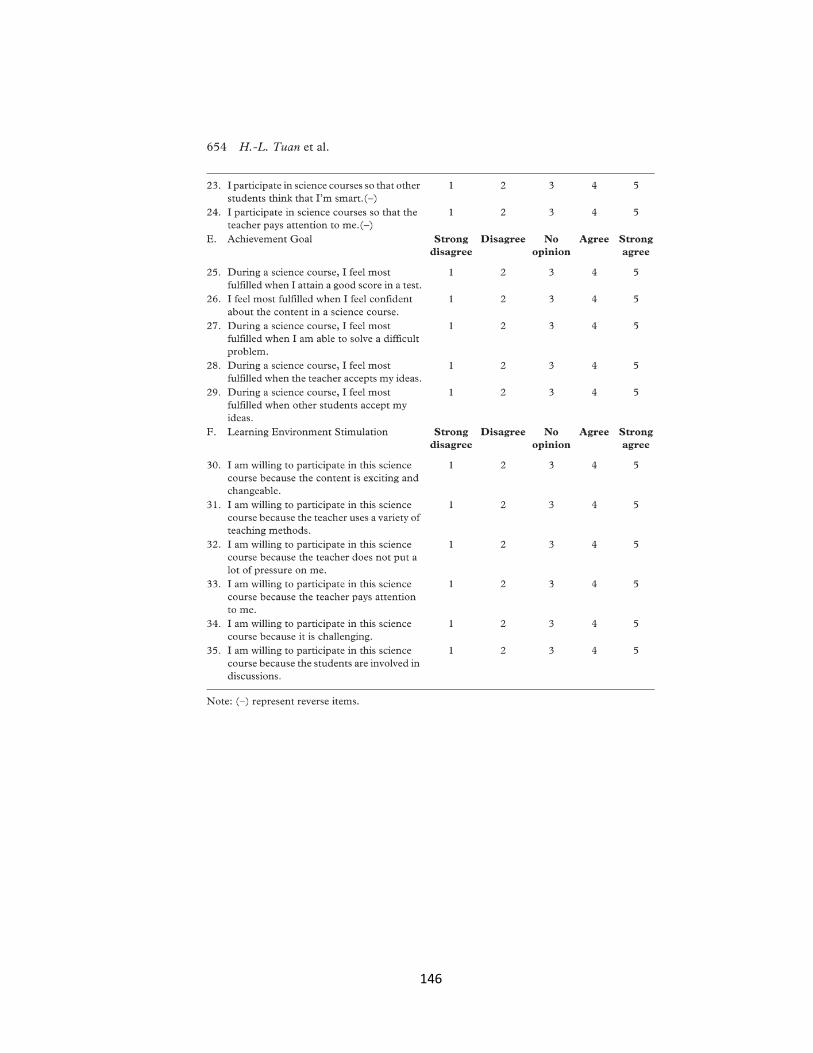
146

147
148
REFERENCES
Abrams, E., Southerland, S. A., & Silva, P. C. (2008). Inquiry in the classroom: Realities
and opportunities. Charlotte, NC: International Academy Publishing.
Adams, C.M. (2003). Talent development in science. In P. Olzewski-Kubilius,
L.Limburg-Weber, & S. Pfeiffer (Eds.), Early gifted: Recognizing and nurturing
children’s talents (19-38). Waco, TX: Prufrock Press.
Adams, C. M., & Pierce, R. L. (2008). Science, elementary. In Plucker, J. A., & Callahan,
C. M., (Eds.), Critical issues and practices in gifted education (563-577). Waco,
TX: Prufrock Press.
American Association for the Advancement of Science (AAAS). (1993). Benchmarks for
science literacy. New York, NY: Oxford University Press.
American Physical Society (2018). Bachelor’s Degrees Earned by African Americans,
by Major Graph. Retrieved on 12/27/18 from
https://www.aps.org/programs/education/statistics/aamajors.cfm
Ausubel, D., Novak, and Hanesian, H. (1978). Educational Psychology; a Cognitive
View, 2nd
ed. Holt, Rinehart, and Winston, New York.
Bagiati, A., Yoon, S.Y., Evangelou, D., Ngambeki,I. (2010). Engineering curricula in
early education: Describing the landscape of open resources. Early Childhood
Research & Practice. 12 (2)
Bangert-Drowns, R., Kulik, J., and Kulik, C. (1985). Effectiveness of computer based
education in secondary schools. Journal of Computer-Based Instruction 12(3),
59-68.
Barmby, P., Kind, M., & Jones, K. (2008). Examining changing attitudes in secondary
school science. International Journal of Science Education, 30(8), 1075-1093.
Bencze, J. (2010). Promoting student-led science and technology projects in elementary
149
teacher education: Entry into core pedagogical practices through technological
design. International Journal of Technology & Design Education, 20 (1), 43-
63
Bhargava P, Antonakakis J, Cunningham C, Zehnder AT (2006) Web-
based virtual torsion laboratory. Comput Appl Eng Educ I4( 1); 1—8
Bonous-Hammarth, M. (2000). Pathways to success: Affirming opportunities for science,
mathematics, and engineering majors. The Journal of Negro Education, 69(1/2),
92-111.
Bransford, J.D., Brown, A.L., and Cocking, R.R., (1999). How people learn: Brain, mind,
experience and school. Washington, DC: National Academy Press
Bransford, J.D., and Schwartz, D.L. , (1999). Rethinking transfer: A simple proposal with
interesting implications. In Review of research in education, 24. Washington, DC:
American Educational Research Association.
Brewer, W. F., & Mishra, P. (1998). Science. In W. Bechtel & G. Graham (Eds.), A
companion to cognitive science (pp. 744–749). Oxford: Blackwell.
Brooks-Leonard, C. (1991). Demographic and academic factors associated with first to
second term retention in a two-year college. Community/Junior College, 15, 57-
69.
Bruer, J. (1993) Schools for thought. Cambridge, MA: MIT Press
Brush, T. and Hew, F. K.(2007), Educational Technology Research and Development,
55, (3), 223-252.
Bush, E. C. and Lawson-Bush, V. (2010). Calling Out the Elephant: An Examination of
African American Male Achievement in Community Colleges, Journal of African
American Males in Education 1, 40-62
Bybee, R.W. (2003).Science curriculum reform in the United States.
150
Washington, DC: National Academy of Sciences.
http://www.nas.edu/rise/backg3a.htm. Assessed 30 May 2014
Bybee, R. W., & Fuchs, B. (2006). Preparing the 21st century workforce: A new reform
in science and technology education. Journal of Research in Science Teaching,
43(4), 349-352.
Carey, S., Evans, R., Honda, M., Jay, E., & Unger, C. (1989). “An experiment is when
you try it and see if it works”: A study of grade 7 students’ understanding of the
construction of scientific knowledge. International Journal of Science Education,
11, 514–529.
Chen, X., and Weko, T. (2009). Students who study science, technology, engineering,
and mathematics (STEM) in postsecondary education. Institute of Education
Sciences, National Center for Education Statistics, U.S. Department of Education
NCES 2009-161.
Chiappetta, E. L. (2008). Historical development of teaching science as inquiry. In J.
Luft, R. L. Bell, & J. Gess-Newsome (Eds.), Science as inquiry in the secondary
setting (pp. 21-30). Arlington, VA: National Science Teachers Association.
Chiappetta, E. L., & Koballa, T. R. (2010). Science instruction in the middle and
secondary schools: Developing fundamental knowledge and skills (7th ed.).
Boston, MA: Allyn & Bacon.
Chinn, C., & Brewer, W. (2001). Models of Data: A Theory of How People Evaluate
Data. Cognition and Instruction, 19(3), 323-393. Retrieved from
http://www.jstor.org/stable/3233918
Chinn, C. A., and Malhotra, B. E. (2002). Epistemologically authentic inquiry in schools:
A theoretical framework for evaluating inquiry tasks, Science Education, 86 (2),
175-218.
Collins, A., Brown, J. S., & Newman, S. E. (1989). Cognitive apprenticeship: Teaching
151
the crafts of reading, writing, and mathematics. In L. B. Resnick (Ed.), Knowing,
learning, and instruction: Essays in honor of Robert Glaser (pp. 347–361).
Hillsdale, NJ: Lawrence Erlbaum Associates.
Cooper, J. O., Heron, T. E., & Heward, W. L. (2007). Applied behavior analysis (2nd
ed.). Upper Saddle River, NJ: Pearson Education, Inc.
Crisp, G., & Nora, A. (2012). Overview of Hispanics in science, mathematics,
engineering and technology (STEM): K-16 representation, preparation and
participation. The Journal of Higher Education.
Cuban, L. Teachers and machines: The classroom uses of technology since 1920. New
York: Teachers College Press, 1986; see also Tyack, D., and Cuban, L. Tinkering
toward utopia: A century of public school reform. Cambridge, MA: Harvard
University Press, 1995.
Dalton, B., Morocco C. C, Tivnan T., Rawson Mead, P. L. (1997). Supported inquiry
science: teaching for conceptual change in urban and suburban science
classrooms. Journal of Learning Disabilities, 30 (6), 670-684.
Daniel, L., Ortleb, E. P., & Biggs, A. (1995). Merrill life science. New York: McGraw-
Hill.
Darrah, M., Humbert, R., Finstein, J., Simon, M., Hopkins, J., (2014). Are Virtual Labs
as Effective as Hands-on Labs for Undergraduate Physics? A Comparative Study
at Two Major Universities. Journal of Science Education and Technology. 23,
803-814.
Dede, C. (2005). Planning for neomillennial learning styles. EDUCAUSE Quarterly,
28(1), 7–12.
Dede, C. (2009). Immersive interfaces for engagement and learning. Science, 323(59),
66–69.
de Freitas, S., & Neumann, T. (2009). The use of “exploratory learning” for supporting
immersive learning in virtual environments. Computers & Education 52, 343–
352.
DeHart Hurd, P., Robinson, J., McConnell, M., and Ross, N. (1981). The Status of Middle
152
School and Junior High School Science, Center for Educational Research and
Evaluation, BSCS, Volume I Summary Report, December.
Dejarnette, Nancy. (2012). America's Children: Providing early exposure to STEM
(Science, Technology, Engineering, & Math) Initiatives. Education. 133(1), 77-
84.
Dey, A. K. (2001). Understanding and using context. Personal and ubiquitous computing,
5, 4–7.
Driscoll, M. P., Moallem, M., Dick, W., & Kirby, E. (1994). How does the textbook
contribute to learning in a middle school science class? Contemporary
Educational Psychology, 19, 79– 100.
Dunbar, K. (1995). How scientists really reason: Scientific reasoning in real-world
laboratories. In R. J. Sternberg & J. E. Davidson (Eds.), The nature of insight
(365–395). Cambridge, MA:MIT Press
Educational Policy Improvement Center. (2009). Creating college readiness: Profiles of
38 schools that know how. Eugene, OR: Author
ExploreLearning (2014). Gizmos. Retrieved on 11/2/14 from
http://www.explorelearning.com/index.cfm?method=cUserSecure.dspTeacherHo
me
Fayer, S., Lacey, A., & Watson, A. (2017). STEM Occupations: Past, Present, and
Future., Spotlight on Statistics. U.S. Bureau Of Labor Statistics. Retrieved on
5/14/19 from https://www.bls.gov/spotlight/2017/science-technology-
engineering-and-mathematics-stem-occupations-past-present-and-
future/home.htm
Fishman, B.J., & Pinkard, N. (2001). Bring urban schools into the information age:
Planning for technology vs. technology planning. Journal of Educational
Computing Research, 25(1), 63-80.

153
Freiberg, H. J., & Driscoll, A. (2005). Universal teaching strategies (4th ed.). Boston,
MA: Pearson Education.
Franklin, A. (1986). The neglect of experiment. Cambridge: Cambridge University Press.
Funk, C. & Parker,K. (2018). “Women and Men in STEM Often at Odds Over
Workplace Equity, Pew Research Center. Retrieved on 5/4/2020
https://www.pewsocialtrends.org/2018/01/09/women-and-men-in-stem-often-at-
odds-over-workplace-equity/
Galison, P. (1997). Image and logic: A material culture of microphysics. Chicago:
University of Chicago Press.
Giere, R. N. (1988). Explaining science: A cognitive approach. Chicago: University of
Chicago Press
Grandy, J. (1998). Persistence in science of high-ability minority students: Results of a
longitudinal study. The Journal of Higher Education, 69(6), 589-620.
Harlen, W. (Ed.), (1985). Primary Science: Taking the Plunge. London: Heinemann
Educational Books.
Harlen, W., & Holroyd, C. (1997). Primary teachers ' understanding of concepts of
science:Impact on confidence and teaching. International Journal of Science
Education,19(1),93-105
Henderson L., Klemes J., & Eshet Y. (2000). Just playing a game? Educational
simulation software and cognitive outcomes. Journal of Educational Computing
Research, 22 (1), 105-129.
HIRO Science Lessons (n.d.). URL:http://homepage2.nifty.com/sympathy
/jikken/jikken.htm
Hirsch, J., DeLaPaz, R., Relkin, N., Victor, J., Li, T., Karl, K., Olyarchuk, J., &

154
Georgakakos, B. (1993). Single voxel analysis of functional magnetic resonance
images (fMRI) obtained during human visual stimulation. Investigative
ophthalmology and visual science, 35, 1438.
Hodson, D. (1988). Towards a Kuhnian approach to curriculum development. School
Organization, 8(1) 5-11.
Hofstein, A. & Lunetta, V.N. (2004). The laboratory in science education: Foundation for
the 21st century. Science Education, 88, 28-54
Hofwolt, C. (1985). Instructional strategies in the science classroom. In Holdzkom D.,
and Lutz, (EDs.), Teachers Association, Washington, D.C.
Hong, Z. R., & Lin, H. S. (2011). An investigation of students' personality traits and
attitudes toward science. International Journal of Science Education, 33(7), 1001-
1028.
Houghton Mifflin Interactive (1997). Inventor Labs Technology. [Computer software,
CD-ROM]. Somerville, MA: Houghton Mifflin Interactive
Hsiao‐Lin, T., Chi‐Chin C., & Shyang‐Horng S., (2005) The development of a
questionnaire to measure students' motivation towards science learning,
International Journal of Science Education, 27(6), 639-654
Hueftle, S.,Rakow, S., and Welsh, W. (1983).Images of Science: A Summary of the
Results from the 1981-82 National Assessment in Science, University of
Minnesota, Science Assessment and Research Project, Minneapolis.
Huppert J., Lomask, S. M., & Lazarowitz, R. (2002). Computer simulations in the
highschool: students’ cognitive stages, science process skills and academic
achievement in microbiology. International Journal of Science Education, 24 (8),
803-821.
Institute for Higher Education Policy. (2010). Diversifying the STEM pipeline: The
155
model replication institutions program. Washington, D.C.: Institute for Higher
Education Policy.
Johnson, R. E. (1993). Factors in the academic success of African American college
males. Unpublished Dissertation, University of South Carolina, South Carolina.
Katehi, L., Pearson, G., & Feder, M.,(2009). Engineering in K-12
education:Understanding the status and improving the prospects. Washington,
DC: National Academies Press
Klahr, D. (2000). Exploring science: The cognition and development of discovery
processes.Cambridge: MA: MIT Press
Kenward MG (2005) Crossover design (encyclopedia of statistics in behavioral science).
Wiley, NY
Katehi, Linda; Pearson, Greg; & Feder, Michael (Eds.). (2009). Engineering in K-12
education: Understanding the status and improving the prospects. Washington,
DC: National Academies Press.
Klopfer, E. (2008). Augmented learning: Research and design of mobile educational
games. Cambridge, MA: MIT Press.
Klopfer, E., & Squire, K. (2008). Environmental detectives: The development of an
augmented reality platform for environmental simulations. Educational
Technology Research & Development, 56(2), 203–228.
Koballa, T. (2011). Framework for the affective domain in science education. Retrieved
from http://serc.carleton.edu/NAGTWorkshops/affective/framework.html
Koballa, T. R., & Crawley, F. E. (1985). The influence of attitude on science teaching
and learning. School Science and Mathematics, 85(3), 222–232.
Koch, J. (2010). Science stories: Science methods for elementary and middle school
teachers (4th ed.). Belmont, CA: Wadsworth.

156
Kolb, D. A. (1984). Experiential learning: Experience as the source of learning and
development. Englewood Cliffs, NJ: Prentice Hall.
Kulik, J., Kulik, C., and Bangert-Drowns, R. (1985). Effectiveness of Computer Based
Education in Elementary Schools. Computers in Human Behavior 12:3.
Kuenzi, J. J. (2008). Science, Technology, Engineering, and Mathematics (STEM)
Education: Background, Federal Policy, and Legislative Action. Congressional
Research Service Reports. Paper 35. Retrieved from:
http://digitalcommons.unl.edu/crsdocs/35
Kulm, G., Roseman, J., & Treistman, M. (1999). A benchmarks-based approach to
textbook evaluation. Science Books and Films, 35, 147–153.
Lai, C. H., Yang, J. C., Chen, F. C., Ho, C. W., Liang, J. S., & Wai, C. T. (2007).
Affordances of mobile technologies for experiential learning: The interplay of
technology and pedagogical practices. Journal of Computer Assisted Learning,
23(4), 326– 377.
Langdon, D., McKittrick, G., Beede, D., Khan, B & Doms, M. (2013). STEM: Good jobs
now and for the future. U.S. Department of Commerce Economics and Statistics
Administration. Retrieved on 5/14/2019 from https://www.purdue.edu/hhs/
hdfs/fii/wp-content/uploads/2015/07/s_iafis04c01.pdf
Late Nite Labs (2008). http://www.latenitelabs.com/. Accessed Aug 2007
Latour, B., & Woolgar, S. (1986). Laboratory life: The construction of scientific fact (2nd
ed.). Princeton, NJ: Princeton University Press.
Llagas, C. & Snyder, T. D. (2003). Status and trends in the education of Hispanics.
Washington D.C.: U.S. Department of Education, National Center for Educational
Statistics. (NCES 2003-008).
Luft, J., Bell, R. L., & Gess-Newsome, J. (2008). Science as inquiry in the secondary
setting. Arlington, VA: National Science Teachers Association Press.

157
MacPhee, D., Farro, S., Canetto, S. S. (2013). “Academic self-efficacy and performance
of underrepresented STEM majors: Gender, ethnic and social class patterns.”
Analyses of Social Issues and Public Policy. 13(1), 347-369.
McFadden, C., & Yager, R. E. (1993). SciencePlus°R: Technology and society. Austin,
TX: Holt, Rinehart, and Winston.
Martin, D. J. (1997). Elementary science methods: A constructivist approach. Albany,
NY: Delmar
Marzano, R. J., Norford, J., Paynter, J. S., Pickering, D. E., & Gaddy, B. B. (2001). A
handbook for classroom instruction that works. Alexandria, VA: Association for
Supervision and Curriculum Development
Mayers, R. L., & Koballa, T. (2013, January). Mathematics connections: Common Core
State Standards-Mathematics and the NGSS. San Antonio, TX: National Science
Teachers Association Council of State Science Supervisors.
McFadden, C., and Yager, R. (1993). Science Plus: Technology and Society, Holt,
Rinehart and Winston, Chicago.
Minger, M. A., & Simpson, P. (2006). The impact of a standards-based science course for
preservice elementary teachers on teacher attitudes toward science teaching.
Journal of Elementary Science Education, 18(2), 46-60
Mechling, K., Bires, N., Kepler, L., Oliver, D., and Smith, B. (1985) A Recommended
Science Competency Continuum for Grades K-6 for Pennsylvania Schools.
Harrisburg, PA. Pennsylvania Department of Education
Meltzer D.E., Thornton R.K. (2012) Resource letter ALIP-1: active learning
instructions in physics.Am J Phys (0002-9505)
Moore J.A. (1984). “Science as a way of knowing: Evolutionary Biology.” American
Zoologist, 24 (2), 421-534.

158
Mokros, J.R., and Tinker, R.F. (1987) The impact of microcomputer-based labs on
children’s ability to interpret graphs. Journal of Research in Science Teaching 24
(22), 369–83.
Murphy, B. (1991). Experiment with light. Minneapolis, MN: Lerner.
Nachmias, R., and Linn, M.C. Evaluations of science laboratory data: The role of
computer presented information. Journal of Research in Science Teaching (1987)
24, 491–506.
Naismith, L., Lonsdale, P., Vavoula, G., & Sharples, M. (2004). Literature review in
mobile technologies and learning (Report 11). Retrieved from
http://archive.futurelab.org.uk/resources/documents/lit_reviews/Mobile_Review.p
df
Naiz, M. (2011). Innovating science teacher education: A history and philosophy of
science perspective. New York, NY: Routledge.
National Center for Improving Science Education. (1991). The high stakes of high school
science. Washington, DC: Author.
National Research Council (NRC). (1996). National Science Education Standards.
Washington, DC: National Academies Press.
National Research Council. (2010). Preparing teachers: Building evidence for sound
policy. Washington, DC: National Academies Press.
National Research Council. (2011). Successful K-12 STEM education: Identifying
effective approaches in science, technology, engineering, and mathematics.
Washington, DC: National Academies Press.
National Research Council. (2012). A framework for K-12 science education: Practices,
crosscutting concepts, and core Ideas. Washington DC: National Academies
Press.
National Research Council. (2013). Monitoring progress toward successful K-12 STEM
education: A nation advancing? Washington, DC: National Academies Press.
National Science Board. (2010). Science & Engineering Indicators 2010. Arlington,

159
VA: National Science Foundation.
National Science Foundation National Center for Science and Engineering Statistics
(NCSES) (2019) Doctorate Recipients from U.S. Universities 2018 | Alexandria,
VANSF 20-301 | December 03, 2019
National Science Teachers Association (NSTA) (1982). Positions on Issues in Science
Education, Washington, D.C.
National Science Teachers Association (NSTA). (2002). Careers in STEM. Retrieved
from http://science.nsta.org/enewsletter/2002-10/member.htm
National Science Teachers Association. (2015). NSTA position statement: Scientific
inquiry. Retrieved from http://www.nsta.org/about/positions/inquiry.aspx
National Survey of Science and Mathematics Education (2012). Science and
Mathematics Courses Chapter 4 Horizons Research, Inc. Retrieved from
http://www.horizon-research.com/2012nssme/wp-content/uploads/2013/02/2012-
NSSME-Chapter-4.pdf
Next Generation Science Standards Lead States (NGSS Lead States). (2013). Next
Generation Science Standards: For states, by states. Washington, DC: National
Academies Press.
Oakes, J. (1990). Opportunities, achievement and choice: Women and minority students
in science and mathematics. Review of Research In Education, 16, 153-222.
Olson, S., & Loucks-Horsley, S. (Eds.). (2000). Inquiry and the National Science
Education Standards: A guide for teaching and learning. Washington, DC:
National Research Council.
Patten, B., Arnedillo-Sanchez, I., & Tangney, B. (2006). Designing collaborative,
constructionist and contextual applications for handheld devices. Computers &
Education, 46(3), 294–308.
160
Pickering, M., & Monts, D. L. (1982). How students reconcile discordant data: A study
of lab report discussions. Journal of Chemical Education, 59, 794–796
President’s Council of Advisors on Science and Technology. (2012, February 7). Engage
to excel: Producing one million additional college graduates with degrees in
science, technology, engineering, and mathematics. A Report by the President’s
Council of Advisors on Science and Technology. Retrieved from
http://www.whitehouse.gov/sites/default/files/microsites/ostp/fact_sheet_final.pdf
Puntambekar, S. & Hübscher, R. (2005). Tools for Scaffolding Students in a Complex
Learning Environment: What Have We Gained and What Have We Missed?
EDUCATIONAL PSYCHOLOGIST, 40(1), 1–12 Lawrence Erlbaum Associates,
Inc.
Pyatt, K., & Sims, R. (2012). Virtual and Physical Experimentation in Inquiry-Based
Science Labs: Attitudes, Performance and Access. Journal of Science Education
and Technology, 21(1), 133-147. Retrieved from
http://www.jstor.org/stable/41413292
Raizen, S. (1997). Making Way for Technology Education, Journal of Science
Education and Technology, 6(1), 59-70
Roschelle, J. M., Pea, R. D., Hoadley, C. M., Gordin, D. N., & Means, B. M. (2000).
Changing how and what children learn in school with computer-based
technologies. The Future of Children, 10( 2), 76-101.
Ross, J.A. (1998). The antecedents and consequences of teacher efficacy. In J. Brophy
(Ed.)Advances in research on teaching 7, 49-74.Greenwich, CN: JAL
Russell, S. H., Hancock, M. P., & McCullough, J. (2007).Benefits of undergraduate
Research experiences. Science, 316, 548-549
Russell, T. (1999). The challenge of change in teaching and teacher education. In: J.R.
Baird, (1999) Editor, Reflecting, teaching, learning: Perspectives on educational

161
improvement. Hawker Brownlow Education, Cheltenham. Victoria, Australia,
219-238.
Rutherford, J. F., & Ahlgren, A. (1990). Science for all Americans: Project 2016. New
York, NY: Oxford University Press.
Schank, R. C., Fano, A., Bell, B., & Jona, M. (1994). The design of goal-based scenarios.
Journal of the Learning Sciences, 3, 305–345.
Sevo, R. (2009). The Talent Crisis in Science and Engineering. In B. Bogue & E. Cady
(Eds.). Apply Research to Practice (ARP) Resources. Retrieved from
http://www.engr.psu.edu/AWE/ARPResources.aspx
Shaunessy, E. (2005). Assessing and addressing teachers’ attitudes toward information
technology in the gifted classroom. Gifted Child Today, 28(3), 45-53.
Shavelson, R., Winkler, J., Stasz, C., Fiebel, W., Robyn, A., and Shaha, S.
(1984).Teaching Mathematics and Science: Patterns of Microcomputer Use,
Prepared for NIE. Rand PublicationR-3180-NIE/RC, March, Santa Monica,
California.
Sheingold, K., Kane, J., and Endreweit, M (1983). Microcomputer Use in Schools.
Developing a Research Agenda, Harvard Educational Review 53:4.
Simon, H. A. (1973). Does scientific discovery have a logic? Philosophy of Science, 40,
471- Scientific Reasoning 106 480.
Simon, H. A. (1986). Understanding the processes of science: The psychology of
scientific discovery. In T. Gamelius (Ed.), Progress in science and its social
conditions (pp. 159- 170). Oxford: Pergamon Press.
Simon, H. A. (1989). The scientist as problem solver. In D. Klahr & K. Kotovsky (Eds.),
Complex information processing: The impact of Herbert A. Simon (pp. 375-398).
Hillsdale, NJ: Lawrence Erlbaum

162
Squire, K. (2006). From content to context: Videogames as designed experience.
Educational Researcher, 35(8), 19–29.
Squire, K. D., & Jan, M. (2007). Mad city mystery: Developing scientific argumentation
skills with a place-based augmented reality game on handheld computers. Journal
of Science Education and Technology, 16(1), 5–29.
Smith, K. and Welliver, P. (2000) The Science Process Assessment for Elementary
Students Retrieved 10/25/14 http://scienceprocesstests.com/
Smith, M. U., & Scharmann, L. C. (1999). Defining versus describing the nature of
science: A pragmatic analysis for classroom teachers and science educators.
Science Education, 83, 493-509.
Sokoloff DR, Laws PW, Thornton RK (2007) Real time physics:
active learning labs transforming the introductory laboratory. Eur J Phys 28:583-
594.
Stinner, A. (1995). Science textbooks: Their present role and future form. In S. M. Glynn
& R. Duit (Eds.), Learning science in the schools: Research reforming practice
(pp. 275–296). Mahwah, NJ: Erlbaum
Svec, M.T. (1994). Effect of microcomputer-based laboratory on students’ graphing
interpretation skills and conceptual understanding of motion. Ph.D. Dissertation,
Indiana University, Bloomington, IN, Department of Education, June 1994;
Swift, T. M., & Watkins, S. E. (2004). An engineering primer for outreach to K-4
education. Journal of STEM Education:Innovations and Research, 5(3/4), 67-76.
From http://skillfulthinking.org/stem/research/item2_engr_k4_outreach.pdf.
Thornton, R.K., and Sokoloff, D.R. Learning motion concepts using real-time
microcomputer-based laboratory tools. American Journal of Physics (1990)

163
58(21), 858–66
The JBHE Foundation (2007/2008) Once Again, A Decline in Doctoral Degree Awards
to African Americans, the Journal of Blacks in Higher Education 58, 6-9
The JBHE Foundation(2017) Academic Fields Where Blacks Earn Few or No Doctoral
Degrees in 2017, the Journal of Blacks in Higher Education Retrieved 4/27/20
https://www.jbhe.com /2018/12/academic-fields-where-blacks-earn-few-or-no-
doctoral-degrees-in-2017/
The Science House (n.d.). URL: http:// www.ncsu.edu/science house/index.html.
Theatrix Interactive. (1995). Bumptz Science Carnival [Computer software, CD-ROM].
Emeryville, CA: Theatrix Interactive
Thompson, M., McLaughlin, C. W., Smith, R. G. (1995). Merrill physical science. New
York: McGraw-Hill
Tuan, H.L., Chin, C.C & Shieh, S.H. (2005): The development of a questionnaire to
measure students' motivation towards science learning, International Journal of
Science Education, 27:6, 639-654
Tyack, D., and Cuban, L. Tinkering toward utopia: A century of public school reform.
Cambridge, MA: Harvard University Press, 1995.
United States Government Accountability Office (2005). Higher Education: Federal
Science, Technology, Engineering, and Mathematics Programs and Related
Trends (GAO-06- 114). Retrieved from
http://www.gao.gov/new.items/d06114.pdf
United States Census Bureau. (2008). American Community Survey; Matrices generated
using American Factfinder. Retrieved from http://factfinder.census.gov
U.S. Commission on Civil Rights. (2010). Encouraging minority students to pursue
science, technology, engineering and math careers. A briefing before the United
States Commission on Civil Rights held in Washington, D.C. Briefing report.
164
Washington, DC: Author. Retrieved from
http://www.eric.ed.gov/PDFS/ED524622.pdf
Vasquez, J. A. (2005). You may be the only scientist your students will ever know. The
ScienceTeacher 72 (4), 10
VanCleave, J. (1997). Janice VanCleave’s guide to the best science fair projects. New
York: Wiley.
Von Blum, R. (1992) Computer –Simulated Laboratory Explorations for Middle School
Life, Earth, and Physical Science. Journal of Science Education and Technology,
1(2), 121-134.
Vygotsky, L. S. (1978). Mind in society: The development of higher psychological
process. Cambridge, MA: Havard University Press.
Whalley, M. (1992). Experiment with magnets and electricity. Minneapolis, MN: Lerner
Warner, L. A., Lawson, S. A., Bierer, L. K., & Cohen, T. L. (1991). Life science: The
challenge of discovery. Lexington, MA: Heath.
Wang, X. (2012). Modeling student choice of STEM fields of study: Testing a conceptual
framework of motivation, high school learning, and postsecondary context of
support.
Wieman C, Perkins K (2005) Transforming physics education. Phys
Today 58(11), 36-41
Wisconsin Center for the Advancement of Postsecondary Education. University of
Wisconsin–Madison
White, B.Y. ThinkerTools: Causal models, conceptual change, and science education.
Cognition and Instruction (1993) 10:1–100. Interactive Physics is a commercial product
that works along similar lines; it is used by professional physicists as both a
teaching tool and to simulate real-world physics problems.

165
White, B.Y., and Fredriksen, J.R. (1998) Inquiry, modeling, and metacognition: Making
science accessible to all students. Cognition and Instruction 16 (63), 90–91.
White House Publications Service. From digital divide to digital opportunity: A strong
record of working to close the digital divide. February 2, 2000. Available online
at http://www.whitehouse.gov/WH/New/digitaldivide/index.html
Windschitl, M. (2008). What is inquiry? A framework for thinking about authentic
scientific practice in the classroom. In J. Luft, R. L. Bell, & J. Gess-Newsome
(Eds.), Science as inquiry in the secondary setting (pp. 1-20). Arlington, VA:
NSTA Press.
Worth, K., & Grollman, S. (2003). Worms, shadows and whirlpools: Science in the early
childhood classroom. Portsmouth, NH: Heinemann.
Yasar, S., Baker, D., Robinson-Kurpius, S.,Krause, S., Roberts, C. (2006). Development
of a Survey to Assess K-12 Teachers' Perceptions of Engineers and Familiarity
with Teaching Design, Engineering, and Technology. Journal of Engineering
Education, 95 (3), 205-16
Yin, C., Song, Y., Tabata, Y., Ogata, H., & Hwang, G.-J. (2013). Developing and
Implementing a Framework of Participatory Simulation for Mobile Learning
Using Scaffolding. Educational Technology & Society, 16 (3), 137–150.
Young, H. (2005). Secondary education systematic issues: Addressing possible
contributors to a leak in the science education pipeline and potential solutions.
Journal of Science Education & Technology, (14)2, 205-216.
Zacharia, Z., & Anderson, O. (2003). The effects of an interactive computer-based
simulation prior to performing a laboratory inquiry-based experiment on students’
conceptual understanding of physics. American Journal of Physics, 71, 618.
Zacharia, Z., Olympiou, G., & Papaevripidou, M. (2008). Effects of experimenting with

166
physical and virtual manipulatives on students' conceptual understanding in heat
and temperature. Journal of Research in Science Teaching, 45(9), 1021-1035.

167
VITA
Name Nathlye Sudlow-Naggie
Baccalaureate Degree
Bachelor of Arts, Hunter College, CUNY, NY
Major: Chemistry
Date Graduated December, 1995
Master’s Degree Master of Science, Adelphi University, Garden
City NY,
Major: Biology and Secondary Education 7-12
grades
Date Graduated August, 1999
Certificates Professional Diploma, Queens College, CUNY,
NY
Major: Administration and Supervision
Date Graduated February, 2002