Embed Size (px)
Citation preview
CGD Policy Paper 109September 2017
The Electricity Situation in Ghana:
Challenges and Opportunities
In the past decade, Ghana has experienced severe electricity supply challenges costing the nation an average of US $2.1 million in loss of production daily. This situation has developed even though installed generation capacity has more than doubled over the period; increasing from 1,730 MW in 2006 to 3,795 MW in 2016. The peak electricity demand only increased by 50 percent during this same period, increasing from 1,393 MW in 2006 to 2,087 MW in 2016. The electricity supply challenges can be attributed to a number of factors, including a high level of losses in the distribution system, which is mainly due to the obsolete nature of distribution equipment, as well as non-payment of revenue by consumers. Other factors are overdependence on thermal and hydro sources for electricity generation and a poor tariff structure, which makes it
difficult for the utility companies to recover the cost of electricity production.
In the face of these challenges, however, Ghana could achieve universal access by the year 2020 with an annual electrification rate of about 4.38 percent. 82.5 percent of Ghana’s population had access to electricity by 2016. Solving Ghana’s electricity challenges would require measures including, but not limited to, diversifying the electricity generation mix through the development of other hydro power and renewable energy sources for which the country has huge potential, expanding the prepaid metering system to include all public and private institutions, restructuring the tariff regime to ensure utilities can recover their cost of generation, and promoting energy efficiency programs.
www.cgdev.org
Ebenezer Nyarko Kumi1
Center for Global Development2055 L Street NWFifth FloorWashington DC 20036202-416-4000 www.cgdev.org
This work is made available under the terms of the Creative Commons Attribution-NonCommercial 4.0 license.
Abstract
Ebenezer Nyarko Kumi. 2017. “The Electricity Situation in Ghana: Challenges and Opportunities.” CGD Policy Paper. Washington, DC: Center for Global Development. https://www.cgdev.org/publication/electricity-situation-ghana-challenges-and-opportunities
1 University of Energy and Natural Resources, Sunyani, Ghana
CGD is grateful for contributions from the Nathan Cummings Foundation and Pritzker Innovation Fund in support of this work.
Contents Preface ................................................................................................................................................ 1
Executive Summary ......................................................................................................................... 2
Abbreviations .................................................................................................................................... 3
Introduction ...................................................................................................................................... 5
Ghana's Electricity Situation .......................................................................................................... 6
The Electricity Access Situation ................................................................................................ 6
The Electricity Demand and Supply Nexus ............................................................................ 8
The Electricity Generation Mix ............................................................................................... 11
The Structure of Ghana’s Power Sector ..................................................................................... 14
National Stakeholders ............................................................................................................... 14
Regional Stakeholders ............................................................................................................... 16
International Agencies .............................................................................................................. 16
Challenges and Opportunities in Ghana’s Electricity Sector .................................................. 17
Losses in the Electricity Distribution System ....................................................................... 18
Tariff Structure ........................................................................................................................... 19
Diversity in the Electricity Generation Mix .......................................................................... 20
Energy Efficiency Measures ..................................................................................................... 25
Conclusions ..................................................................................................................................... 25
References........................................................................................................................................ 27
1
Preface
CGD’s work on energy has focused principally on definitions of energy access, data analysis, and the efficacy of international tools available to spur investment in the power sector in developing countries. Ghana has been, since independence in 1957, a bellwether country for development trends and this is also true with energy. As one of the first African countries to aggressively pursue electrification, Ghana has among the highest access rates on the continent. Yet, the country also suffers from chronic power shortages and has struggled to expand capacity to meet growing demand. To better understand Ghana’s context and the role of international actors, we commissioned this paper from Ebenezer Nyarko Kumi from the Mechanical and Manufacturing Engineering Department at the University of Energy and Natural Resources in Sunyani, Ghana. Kumi outlines the web of challenges that Ghana faces in expanding its power sector and some of the opportunities for national and international actors to contribute toward greater progress.
Todd Moss Senior Fellow Center for Global Development
2
Executive Summary
Ghana’s electricity sector dates back to the Gold Coast era where electricity supply was mainly from diesel generators owned by industrial establishments including factories and mines as well as other institutions such as hospitals and schools. The sector was revolutionised with the completion of the Akosombo Hydroelectric Power Station which also saw the export of electricity to neighbouring countries including Togo, Burkina Faso and Benin. Electricity demand has since grown significantly to the point where supply is not enough to meet the demand, resulting in severe power crises over the last decade. In a bid to solve the crisis, a power sector reform was implemented in the late 1990s to open up the electricity market for private sector participation to help deal with the power crises.
Ghana committed to universal access to electricity as far back as 1989 when only 15–20 percent of the population had access to electricity. The National Electrification Scheme was established to oversee and implement the National Electrification Master Plan which sought to extend electricity to every part of the country by the year 2020. Through programmes like the Self-Help Electrification Program (SHEP), the scheme has been able to extend electricity to about 82.5 percent of the population as of the end of 2016. However, more efforts will be needed to ensure universal access is attained by the year 2020.
Demand for electricity in Ghana has increased by about 52 percent over the last decade (2006–2016) whiles installed generation capacity has more than doubled over the same period. In spite of this, the country still suffers from persistent power supply challenges. This situation can be attributed to the fact that most of the installed generation facilities are not available for generation due to fuel supply challenges. Ghana’s electricity sector has been heavily dependent on the Akosombo Dam which has seen water levels drop consistently below acceptable operational levels. In recent times however, significant amounts of thermal generation sources running on mostly natural gas have been introduced into the sector. The problem with these sources is that supply of natural gas by the West African Gas Pipeline (WAGP) has been very unreliable.
Other challenges plaguing the sector include high levels of distribution losses, lack of revenue due to the non-payment of bills and also poor tariff structure, which makes it difficult for the power utilities to make significant investments to improve the sector due to financial constraints. Opportunities, however, remain in the sector for the introduction of renewable energy sources into the generation mix, seeing that the country has potential for solar power generation and other renewable energy sources. In light of this, the necessary regulatory frameworks have been provided notable among these is the passage of the Renewable Energy Act in 2011.
3
Abbreviations
ACEP African Center for Energy Policy AfDB African Development Bank Group BPA Bui Power Authority CIDA Canadian International Development Agency CSO Civil Society Organisation DFO Distillate Fuel Oil EC Energy Commission ECG Electricity Company of Ghana ECREEE ECOWAS Centre for Renewable Energy and Energy Efficiency ERERA ECOWAS Regional Electricity Regulatory Authority GDP Gross Domestic Product GEDAP Ghana Energy Development and Access Programme GEF Global Environment Facility GHG Green House Gas GoG Government of Ghana GRIDCo Ghana Grid Company GWh Giga Watt Hour HFO Heavy Fuel Oil IEA International Energy Agency IPP Independent Power Producer IRENA International Renewable Energy Agency ISSER Institute of Statistical, Social and Economic Research kV Kilo Volt kWh Kilo Watt Hour LCO Light Crude Oil LNG Liquified Natural Gas MCC Millenium Challenge Corporation MOFEP Ministry of Finance and Economic Planning MOP Ministry of Power Mscf Million Standard Cubic Feet MW Mega Watt NED Northern Electricity Department NEDCo Northern Electricity Distribution Company NES National Electrification Scheme NG Natural Gas NITS National Interconnected Transmission System PURC Public Utilities Regulatory Commission PWD Public Works Department SHEP Self Help Electrification Programme T & D Transmission and Distribution UNEP United Nations Environment Programme USAID United States Agency for International Development VALCO Volta Aluminum Company
4
VRA Volta River Authority WAGP West African Gas Pipeline WAGP Co West African Gas Pipeline Company WAPP West Africa Power Pool
5
Introduction
Electricity is one of the major determinants of the economic prosperity of any country. It plays a significant role in undertaking daily activities from cooking, lighting, heating to powering machines in the industrial sector. Electricity is also essential for quality healthcare delivery, education, transport, effective communication, mineral exploration and many more; serving as the building block on which every sector of a nation’s economy thrives. This emphasizes how crucial and indispensable electricity is for human existence in the 21st century.
Ghana’s electricity sector dates back to the colonial days of the Gold Coast, where electricity supply was mostly from isolated diesel generator plants dispersed across the country. Industrial establishments such as mines and factories, municipalities and other institutions including hospitals and schools owned most of these systems. The Gold Coast Railway Administration established the first public electricity generation system in 1914, to supply electricity for the operations of the railway sector in Sekondi (ISSER, 2005). This was extended to Takoradi in 1928. By the year 1955, electricity had been extended to some major cities in Ghana including Kumasi, Tema, Accra, Nsawam, Tamale and Bolgatanga under the auspices of the Public Works Department (PWD). However, in 1947, an Electricity Department was established within the Ministry of Works and Housing to take over electricity supplies from the Public Works Department and the Railways Administration. The major electricity source during this period was Diesel Generator Plants.
The completion of the Akosombo Dam Project over the Volta River in 1972 provided a total installed capacity of 912 MW for electricity generation. Although the primary aim of the project was to provide electricity for the aluminium industry, it also made it possible for most of the major electricity consumed to be switched from diesel generators to hydroelectricity. The major consumers of electricity during this period were the Volta Aluminum Company (VALCO) and the National Electricity Distribution Company. The completion of the Akosombo Dam also saw the Volta River Authority (VRA), managers of the Akosombo Hydroelectric Power Station, commence supply of electricity to neighbouring Togo and Benin. In 1982, the Kpong Hydroelectric Power Station was commissioned, increasing the installed generation capacity by 160 MW.
Ghana, in spite of the increase in generation capacity, experienced its first electricity crisis in 1984. This was a result of a severe drought that occurred between 1982 and 1984, during which the total inflow into the Akosombo Dam was less than 15 percent of the long term expected total. The crisis led to the introduction of Thermal Power Plants into Ghana’s generation mix. The first of these thermal plants was a 550 MW facility (Tapco and Tico) at the Takoradi Thermal Plant managed by VRA. The total installed capacity of thermal power plants in Ghana has increased to 2,053 MW as at the end of 2015 (Energy Commission of Ghana, 2016a). Electricity crisis has become a household phenomenon in Ghana leading to the adoption of the local word “Dumsor” to describe the situation. In December 2013, the 400 MW Bui Hydroelectric Power Station was commissioned to provide electricity to support the peak load of the country, which has been on an ever-increasing trajectory.
6
This paper presents the state of the electricity sector in Ghana and discusses the roles of the various stakeholders in the sector. It also discusses pertinent issues relating to demand and supply of electricity including unfulfilled and future demand for electricity. The paper concludes with a discussion of the challenges plaguing the electricity sector and the opportunities available in sector.
Ghana's Electricity Situation
Ghana’s power sector has, over the past decade, been plagued with power supply challenges resulting in considerable impact on the economic situation of the country. The World Bank ranked electricity as the second most important constraint to business activities in the country and estimated that Ghana lost about 1.8 percent of GDP during the 2007 power crisis (Mathrani, et al., 2013). Also, the Institute of Statistical, Social and Economic Research (ISSER) at the University of Ghana estimated in a 2014 study that Ghana, on the average, lost production worth about US $2.1 million per day (or, US $55.8 million per month) through the power crisis alone (ISSER, 2015). This means that the country lost about US $680 million (2 percent of GDP) in 2014 due to the power crisis.
The Electricity Access Situation
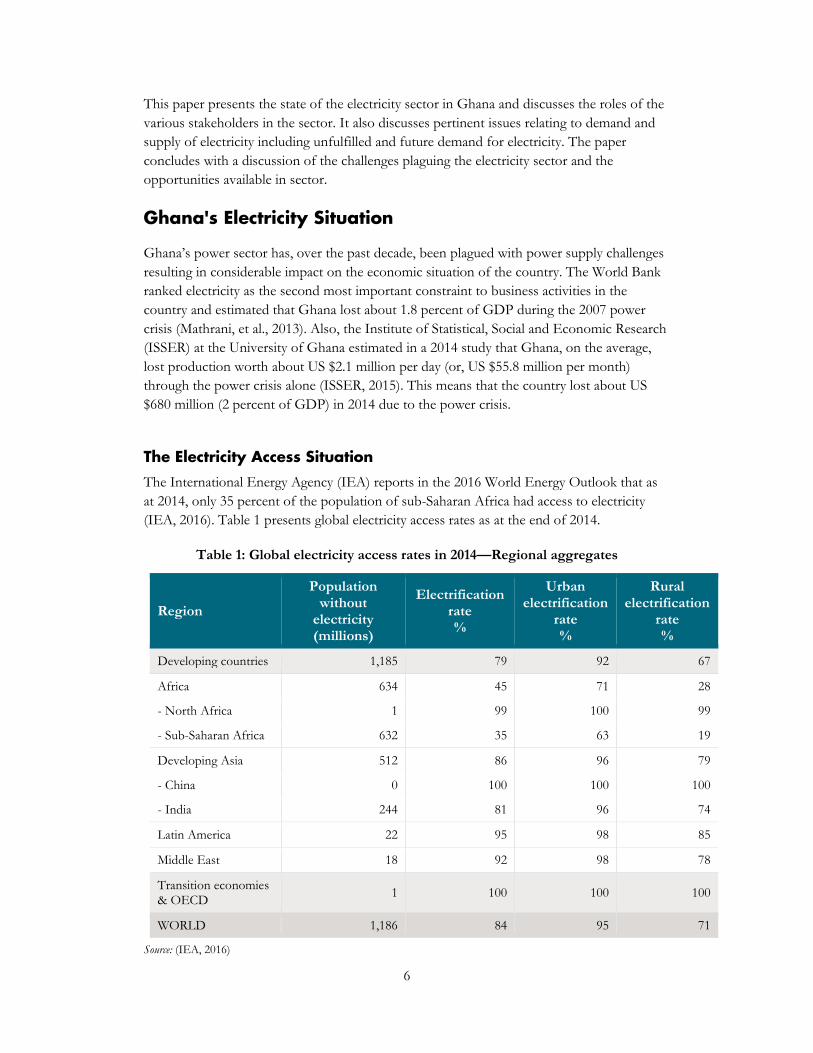
The International Energy Agency (IEA) reports in the 2016 World Energy Outlook that as at 2014, only 35 percent of the population of sub-Saharan Africa had access to electricity (IEA, 2016). Table 1 presents global electricity access rates as at the end of 2014.
Table 1: Global electricity access rates in 2014—Regional aggregates
Region
Population without
electricity (millions)
Electrification rate %
Urban electrification
rate %
Rural electrification
rate %
Developing countries 1,185 79 92 67
Africa 634 45 71 28
- North Africa 1 99 100 99
- Sub-Saharan Africa 632 35 63 19
Developing Asia 512 86 96 79
- China 0 100 100 100
- India 244 81 96 74
Latin America 22 95 98 85
Middle East 18 92 98 78
Transition economies & OECD 1 100 100 100
WORLD 1,186 84 95 71
Source: (IEA, 2016)
7
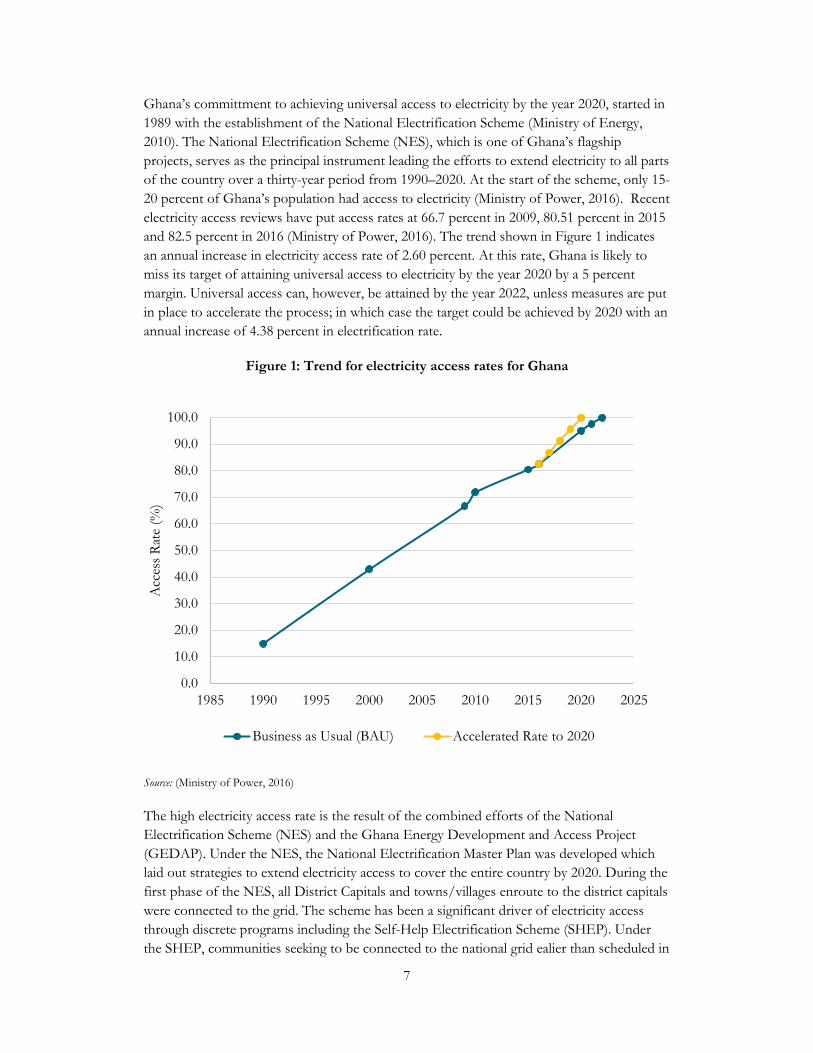
Ghana’s committment to achieving universal access to electricity by the year 2020, started in 1989 with the establishment of the National Electrification Scheme (Ministry of Energy, 2010). The National Electrification Scheme (NES), which is one of Ghana’s flagship projects, serves as the principal instrument leading the efforts to extend electricity to all parts of the country over a thirty-year period from 1990–2020. At the start of the scheme, only 15-20 percent of Ghana’s population had access to electricity (Ministry of Power, 2016). Recent electricity access reviews have put access rates at 66.7 percent in 2009, 80.51 percent in 2015 and 82.5 percent in 2016 (Ministry of Power, 2016). The trend shown in Figure 1 indicates an annual increase in electricity access rate of 2.60 percent. At this rate, Ghana is likely to miss its target of attaining universal access to electricity by the year 2020 by a 5 percent margin. Universal access can, however, be attained by the year 2022, unless measures are put in place to accelerate the process; in which case the target could be achieved by 2020 with an annual increase of 4.38 percent in electrification rate.
Figure 1: Trend for electricity access rates for Ghana
Source: (Ministry of Power, 2016)
The high electricity access rate is the result of the combined efforts of the National Electrification Scheme (NES) and the Ghana Energy Development and Access Project (GEDAP). Under the NES, the National Electrification Master Plan was developed which laid out strategies to extend electricity access to cover the entire country by 2020. During the first phase of the NES, all District Capitals and towns/villages enroute to the district capitals were connected to the grid. The scheme has been a significant driver of electricity access through discrete programs including the Self-Help Electrification Scheme (SHEP). Under the SHEP, communities seeking to be connected to the national grid ealier than scheduled in
0.0
10.0
20.0
30.0
40.0
50.0
60.0
70.0
80.0
90.0
100.0
1985 1990 1995 2000 2005 2010 2015 2020 2025
Acc
ess R
ate
(%)
Business as Usual (BAU) Accelerated Rate to 2020
8
the National Electrification Master Plan were expected to contribute some of the logistics required to complement government’s efforts. These communities had to provide low voltage electricity poles and electricity meters in addition to ensuring that at least 30 percent of households in the community were wired (Kemausuor & Ackom, 2016). This made electricity extension to some communities take place earlier than it would have, if the government alone were to bare the full cost.
The objective of the Ghana Energy Development and Access Project (GEDAP), which commenced in 2007 and funded by the World Bank, is to improve the operational efficiency of the electricity distribution system and increase the population’s access to electricity through improving the distribution network to reduce losses, enhancing the capacity of the managers of the distribution system and introducing renewable energy as a means of improving access to electricity.
It is, however, important to note that electricity access does not only mean having a house connected to the electricity grid but also ensuring the reliable supply of affordable electricity to the household (Mensah, Kemausuor, & Brew-Hammond, 2014). Unfortunately, Ghana’s power sector seems to be suffering the curse of unreliable power supply, which could negatively impact the achievements made towards universal access. Ghana suffered severe power rationing/load shedding in the years 1983–1984, 1997–1998, 2003, 2006–2007, 2011–date; a situation that could be largely attributed to fuel supply challenges including the low levels of water in the Akosombo dam and natural gas shortages.
The Electricity Demand and Supply Nexus
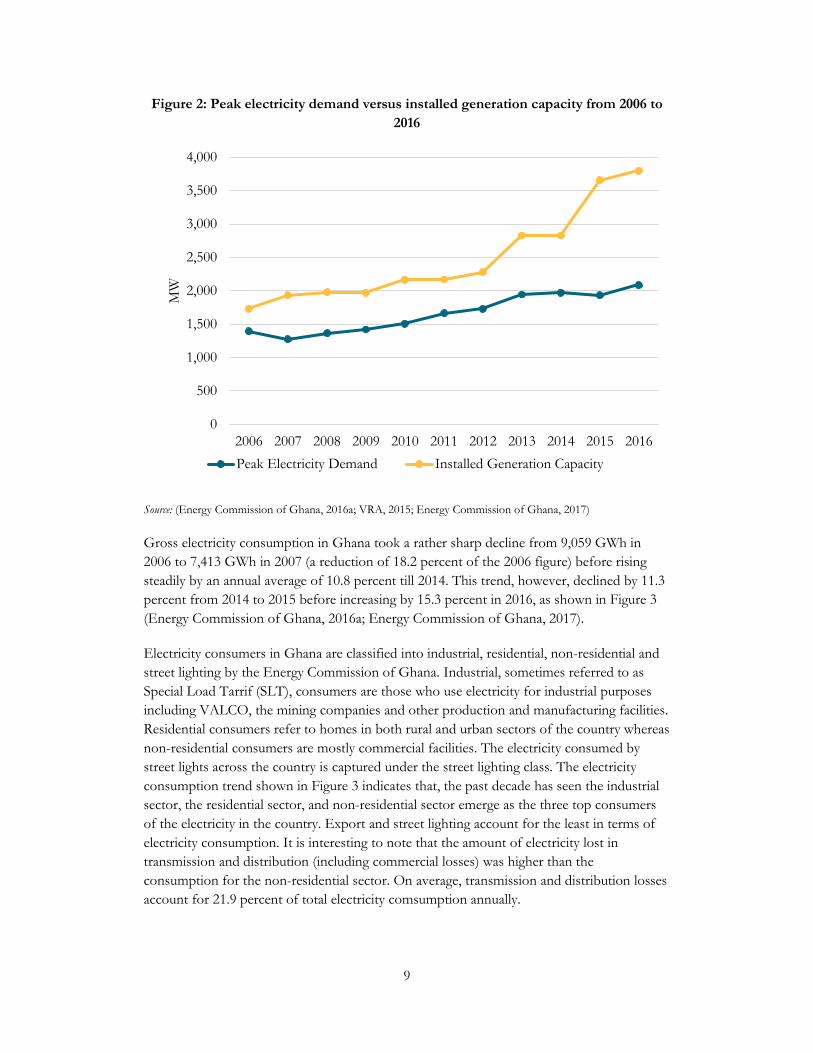
Ghana has experienced an increase of 49.8 percent in peak load over the last 10 years; increasing from 1,393 MW in 2006 to 2,087 MW in 2016 (Energy Commission of Ghana, 2016a; VRA, 2015; Energy Commission of Ghana, 2017). This translates into an annual increase of 4.29 percent in peak load over the period shown in Figure 2. Generation capacity on the other hand has more than doubled over the same period; from 1,730 MW in 2006 to 3,759 MW in the year 2016, an average annual increase of 8.60 percent. In addition, the installed generation capacity saw a 29.14 percent increase in 2015 over the 2014 figure of 2,831 MW and a further 3.79 percent increase in 2016; whereas demand decreased by 1.88 percent in 2015 before increasing by 7.97 percent in 2016. In spite of this, the country is still confronted with power supply shortage, which has been the case over the last decade.
9
Figure 2: Peak electricity demand versus installed generation capacity from 2006 to 2016
Source: (Energy Commission of Ghana, 2016a; VRA, 2015; Energy Commission of Ghana, 2017)
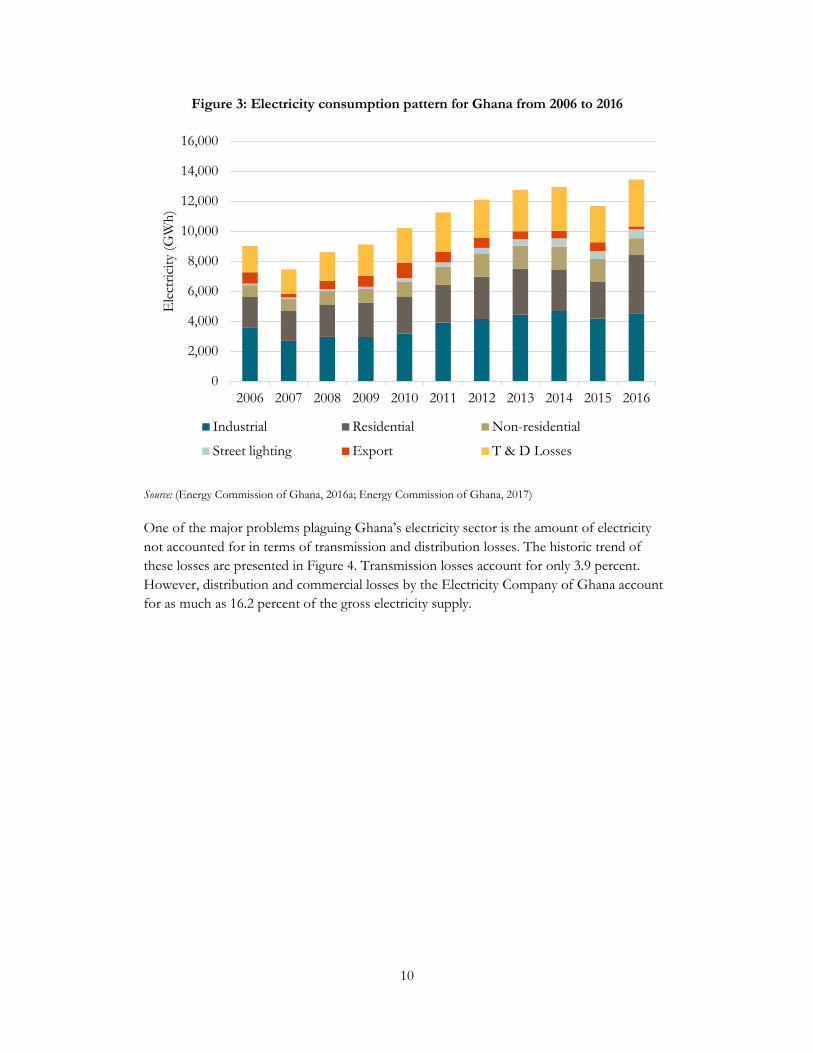
Gross electricity consumption in Ghana took a rather sharp decline from 9,059 GWh in 2006 to 7,413 GWh in 2007 (a reduction of 18.2 percent of the 2006 figure) before rising steadily by an annual average of 10.8 percent till 2014. This trend, however, declined by 11.3 percent from 2014 to 2015 before increasing by 15.3 percent in 2016, as shown in Figure 3 (Energy Commission of Ghana, 2016a; Energy Commission of Ghana, 2017).
Electricity consumers in Ghana are classified into industrial, residential, non-residential and street lighting by the Energy Commission of Ghana. Industrial, sometimes referred to as Special Load Tarrif (SLT), consumers are those who use electricity for industrial purposes including VALCO, the mining companies and other production and manufacturing facilities. Residential consumers refer to homes in both rural and urban sectors of the country whereas non-residential consumers are mostly commercial facilities. The electricity consumed by street lights across the country is captured under the street lighting class. The electricity consumption trend shown in Figure 3 indicates that, the past decade has seen the industrial sector, the residential sector, and non-residential sector emerge as the three top consumers of the electricity in the country. Export and street lighting account for the least in terms of electricity consumption. It is interesting to note that the amount of electricity lost in transmission and distribution (including commercial losses) was higher than the consumption for the non-residential sector. On average, transmission and distribution losses account for 21.9 percent of total electricity comsumption annually.
0
500
1,000
1,500
2,000
2,500
3,000
3,500
4,000
2006 2007 2008 2009 2010 2011 2012 2013 2014 2015 2016
MW
Peak Electricity Demand Installed Generation Capacity
10
Figure 3: Electricity consumption pattern for Ghana from 2006 to 2016
Source: (Energy Commission of Ghana, 2016a; Energy Commission of Ghana, 2017)
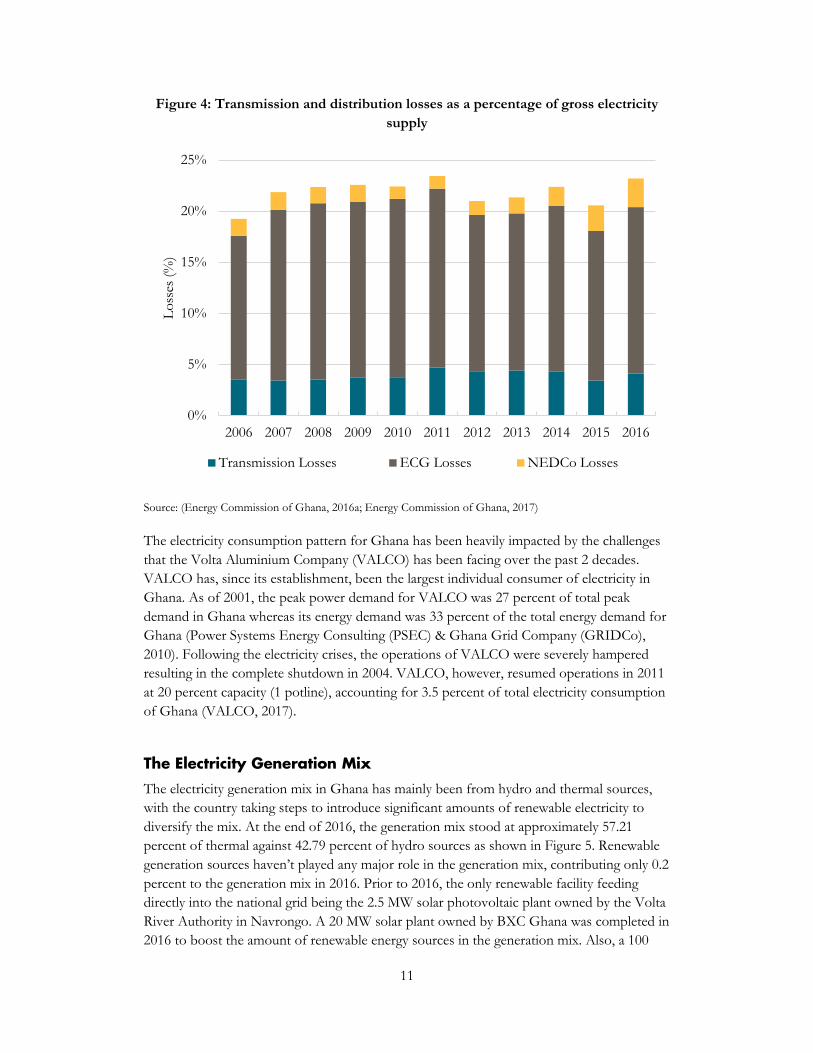
One of the major problems plaguing Ghana’s electricity sector is the amount of electricity not accounted for in terms of transmission and distribution losses. The historic trend of these losses are presented in Figure 4. Transmission losses account for only 3.9 percent. However, distribution and commercial losses by the Electricity Company of Ghana account for as much as 16.2 percent of the gross electricity supply.
0
2,000
4,000
6,000
8,000
10,000
12,000
14,000
16,000
2006 2007 2008 2009 2010 2011 2012 2013 2014 2015 2016
Ele
ctric
ity (G
Wh)
Industrial Residential Non-residential
Street lighting Export T & D Losses
11
Figure 4: Transmission and distribution losses as a percentage of gross electricity supply
Source: (Energy Commission of Ghana, 2016a; Energy Commission of Ghana, 2017)
The electricity consumption pattern for Ghana has been heavily impacted by the challenges that the Volta Aluminium Company (VALCO) has been facing over the past 2 decades. VALCO has, since its establishment, been the largest individual consumer of electricity in Ghana. As of 2001, the peak power demand for VALCO was 27 percent of total peak demand in Ghana whereas its energy demand was 33 percent of the total energy demand for Ghana (Power Systems Energy Consulting (PSEC) & Ghana Grid Company (GRIDCo), 2010). Following the electricity crises, the operations of VALCO were severely hampered resulting in the complete shutdown in 2004. VALCO, however, resumed operations in 2011 at 20 percent capacity (1 potline), accounting for 3.5 percent of total electricity consumption of Ghana (VALCO, 2017).
The Electricity Generation Mix
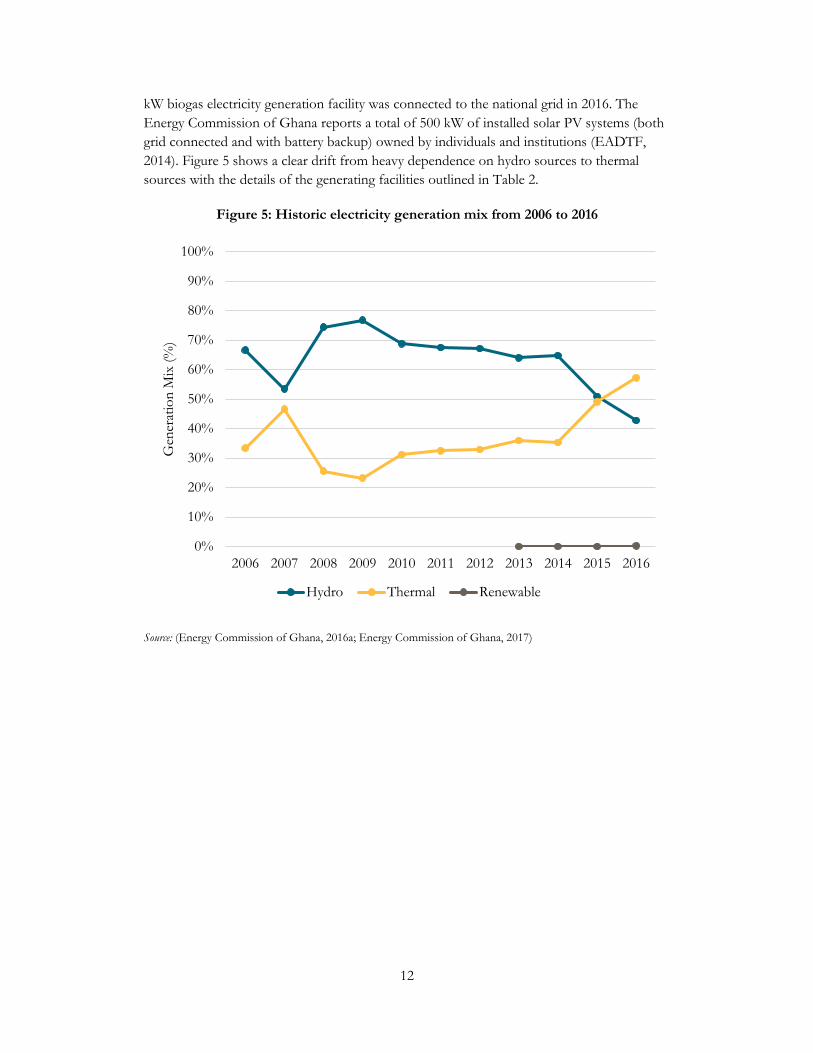
The electricity generation mix in Ghana has mainly been from hydro and thermal sources, with the country taking steps to introduce significant amounts of renewable electricity to diversify the mix. At the end of 2016, the generation mix stood at approximately 57.21 percent of thermal against 42.79 percent of hydro sources as shown in Figure 5. Renewable generation sources haven’t played any major role in the generation mix, contributing only 0.2 percent to the generation mix in 2016. Prior to 2016, the only renewable facility feeding directly into the national grid being the 2.5 MW solar photovoltaic plant owned by the Volta River Authority in Navrongo. A 20 MW solar plant owned by BXC Ghana was completed in 2016 to boost the amount of renewable energy sources in the generation mix. Also, a 100
0%
5%
10%
15%
20%
25%
2006 2007 2008 2009 2010 2011 2012 2013 2014 2015 2016
Loss
es (%
)
Transmission Losses ECG Losses NEDCo Losses
12
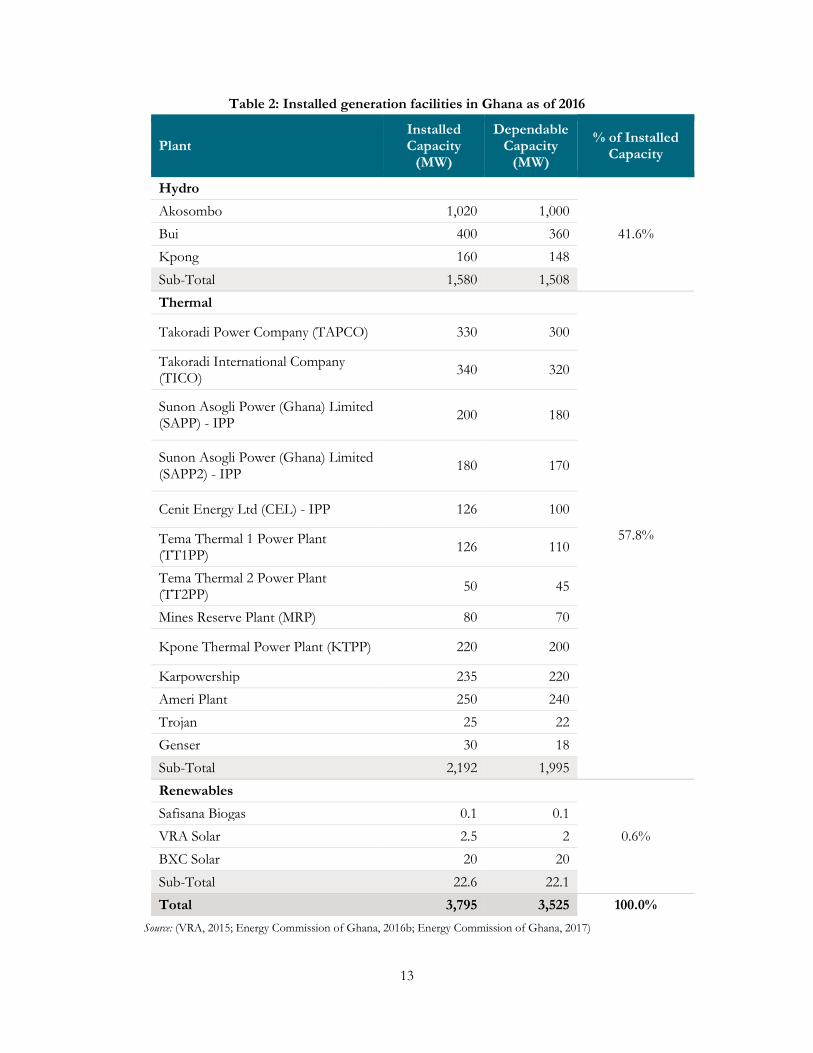
kW biogas electricity generation facility was connected to the national grid in 2016. The Energy Commission of Ghana reports a total of 500 kW of installed solar PV systems (both grid connected and with battery backup) owned by individuals and institutions (EADTF, 2014). Figure 5 shows a clear drift from heavy dependence on hydro sources to thermal sources with the details of the generating facilities outlined in Table 2.
Figure 5: Historic electricity generation mix from 2006 to 2016
Source: (Energy Commission of Ghana, 2016a; Energy Commission of Ghana, 2017)
0%
10%
20%
30%
40%
50%
60%
70%
80%
90%
100%
2006 2007 2008 2009 2010 2011 2012 2013 2014 2015 2016
Gen
erat
ion
Mix
(%)
Hydro Thermal Renewable
13
Table 2: Installed generation facilities in Ghana as of 2016
Plant Installed Capacity
(MW)
Dependable Capacity
(MW)
% of Installed Capacity
Hydro
41.6% Akosombo 1,020 1,000 Bui 400 360 Kpong 160 148 Sub-Total 1,580 1,508 Thermal
57.8%
Takoradi Power Company (TAPCO) 330 300
Takoradi International Company (TICO) 340 320
Sunon Asogli Power (Ghana) Limited (SAPP) - IPP 200 180
Sunon Asogli Power (Ghana) Limited (SAPP2) - IPP 180 170
Cenit Energy Ltd (CEL) - IPP 126 100
Tema Thermal 1 Power Plant (TT1PP) 126 110
Tema Thermal 2 Power Plant (TT2PP) 50 45
Mines Reserve Plant (MRP) 80 70
Kpone Thermal Power Plant (KTPP) 220 200
Karpowership 235 220 Ameri Plant 250 240 Trojan 25 22 Genser 30 18 Sub-Total 2,192 1,995 Renewables
0.6% Safisana Biogas 0.1 0.1 VRA Solar 2.5 2 BXC Solar 20 20 Sub-Total 22.6 22.1 Total 3,795 3,525 100.0%
Source: (VRA, 2015; Energy Commission of Ghana, 2016b; Energy Commission of Ghana, 2017)
14
The Structure of Ghana’s Power Sector
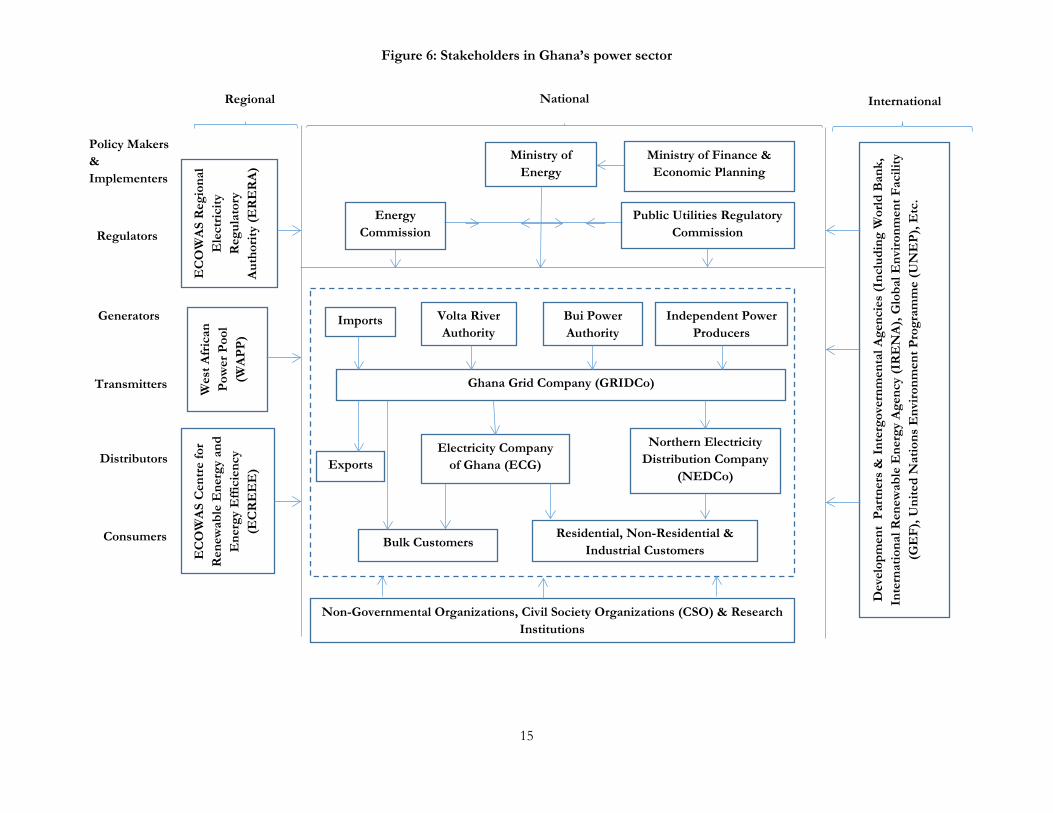
Ghana’s power sector, before the late 1990s, was a vertically integrated monopoly, which had the Volta River Authority (VRA), generating and transmitting electricity to every region of the country while also distributing to the Northern Sector through its subsidiary the Northern Electricity Department (NED). The Electricity Company of Ghana was responsible for electricity distribution in the southern sector of the country. Power sector reform in the late 1990s saw the Volta River Authority (VRA), split into a separate generation and transmission system operations which also made it possible for other Independent Power Producers (IPP) to enter the market. Edjekumhene, Amadu and Brew-Hammond (2001) identify power supply constraints vis-à-vis growing electricity demand as well as the difficulties associated with securing financial support from the traditional financiers of the sector, including the World Bank, as the major drivers of the power sector reform in Ghana. Stakeholders in Ghana’s power sector cut across national, regional and international institutions as demonstrated in Figure 6. They include policy making and implemention institutions, regulatory agencies, generation, transmission and distribution companies, consumers, research and advocacy groups as well as financial institutions.
National Stakeholders
The Ministry of Energy is responsible for formulating, monitoring and evaluating policies, programmes and projects for the power sector in Ghana with financial support from the Ministry of Finance and Economic Planning (MOFEP). The Ministry is also directly responsible for the implementation of the National Electrification Scheme in various parts of the country.
The Energy Commission (EC) and the Public Utilities Regulatory Commission (PURC) are responsible for regulating the activities of the power sector. The EC is responsible for technical regulation of the power sector, including licensing of operators and also advising the Minister of Energy on matters relating to energy policy and planning. The PURC, on the other hand, is an independent regulatory agency responsible for economic regulation of the power sector, specifically approving rates for electricity sold by distribution utilities to the public. PURC is also responsible for monitoring the quality of electricity services delivered to consumers.
15
Figure 6: Stakeholders in Ghana’s power sector
Northern Electricity Distribution Company
(NEDCo)
Volta River Authority
Independent Power Producers
Ghana Grid Company (GRIDCo)
Electricity Company of Ghana (ECG) Exports
Bulk Customers Residential, Non-Residential &
Industrial Customers
Imports Bui Power Authority
Non-Governmental Organizations, Civil Society Organizations (CSO) & Research Institutions
Dev
elop
men
t Pa
rtne
rs &
Int
ergo
vern
men
tal A
genc
ies
(Inc
ludi
ng W
orld
Ban
k,
Inte
rnat
iona
l Ren
ewab
le E
nerg
y A
genc
y (I
RE
NA
), G
loba
l Env
ironm
ent F
acili
ty
(GE
F), U
nite
d N
atio
ns E
nviro
nmen
t Pro
gram
me
(UN
EP)
, Etc
.
Regional
Regulators
Generators
Transmitters
Consumers
Distributors
National International
Policy Makers & Implementers
Energy Commission
Ministry of Energy
Public Utilities Regulatory Commission
EC
OW
AS
Reg
iona
l E
lect
ricity
R
egul
ator
y A
utho
rity
(ER
ER
A)
Wes
t Afr
ican
Po
wer
Poo
l (W
APP
)
Ministry of Finance & Economic Planning
EC
OW
AS
Cen
tre
for
Ren
ewab
le E
nerg
y an
d E
nerg
y E
ffici
ency
(E
CR
EE
E)
16
Power generation in Ghana is carried out by three major groups; the Volta River Authority (VRA), Bui Power Authority (BPA) and Independent Power Producers (IPP). The sources of generation include hydro power plants, thermal power plants and solar photovoltaic power plants. The Volta River Authority, a state-owned company, is the largest electricity generation company in Ghana with a total installed capacity of 2,435 MW as at the end of 2015 , which makes up 66.1 percent of the country’s total installed capacity (VRA, 2015; Energy Commission of Ghana, 2016b). VRA also owns what used to be the largest solar photovoltaic plant in the country, a 2.5 MW plant situated in Navrongo. The Bui Power Authority manages the Bui Hydro Power Plant whose installed capacity is 400 MW. The Independent Power producers together contribute a total installed capacity of 850 MW to the generation mix including a newly installed 20 MW solar photovoltaic plant owned by BXC Ghana. In 2016, a 100 kW biogas electricity generation facility was connected to the grid (Energy Commission of Ghana, 2017).
The transmission of electricity from the generation companies to the distribution companies is done through the National Interconnected Transmission System (NITS) owned and operated by the state-owned Ghana Grid Company Ltd (GRIDCo).
Distribution of electricity to final consumers is the responsibility of two state owned companies, the Electricity Company of Ghana (ECG) and the Northern Electricity Distribution Company (NEDCo). ECG distributes electricity to the southern sector of Ghana whiles NEDCo distributes electricity to the northern sector.
KITE, Energy Foundation (EF), The Energy Center – KNUST and other non-governmental organizations including the African Center for Energy Policy (ACEP) in Ghana provide different kinds of support to the power sector including research, advocacy and the promotion of energy efficiency and renewable energy solutions.
Regional Stakeholders
Regional bodies like the West African Power Pool (WAPP) and the ECOWAS Regional Electricity Regulatory Authority (ERERA) promote interstate electricity trade in the West African sub-region. Whereas WAPP supports the development of power generation and transmission facilities, ERERA provides the regulations for these interstate electricity exchanges. ECOWAS Centre for Renewable Energy & Energy Efficiency (ECREEE) on the other hand contributes to improving access to modern, reliable and affordable energy services, energy security as well as the reduction of energy related externalities such as GHG emissions and local pollution.
International Agencies
Ghana’s power sector has received enormous support from international agencies. The support ranges from technical assistance in developing power infrastructure to financing power infrastructure projects. There has also been support towards the development of the renewable energy sector from these international agencies.
17
International Development Partners and Intergovernmental Agencies including the World Bank Group, the African Development Bank (AfDB), USAID and CIDA have been the bedrock of financial support for the development of various power projects in Ghana including the financing of the Akosombo and Kpong hydropower plants as well as investments towards the achievement of universal access to electricity by the year 2020 (Edjekumhene, Amadu, & and Brew-Hammond, 2001). The United States Power Africa Initiative launched in 2013 aims at increasing electricity access in sub-Saharan Africa by adding more than 30,000 megawatts of cleaner, more efficient electricity generation capacity and 60 million new homes and business connections. The technical assistance provided by Power Africa to the Ghana government helped to bring the CenPower (348 MW) IPP transaction to a financial closure. The initiative also facilitated the development of Ghana’s first offshore natural gas field, the Jubilee fields (USAID, 2017). Other projects currently benefiting from the Power Africa support include Bridge power (400 MW), Ghana 1000 (375 + 375 MW), Amandi (192 MW), Globaleq (450 MW) and Jacobsen (400 MW), as well as a number of renewable energy projects (USAID, 2017). The Millenium Challenge Corporation (MCC) and the GoG signed a US $498.2 million “Compact II” whose keystone project aims to improve the creditworthiness of the Electricity Company of Ghana (ECG) and the management of the Northern Electricity Distribution Company, the nation’s off-takers and distributors of electric power, by supporting the transformation of their management and operation to private sector principals (USAID, 2017).
The international community has not only provided financial support to Ghana’s power sector but also support the sector with technical know-how. The construction of the various power sector infrasture have been carried out by international companies. Impregillo-Recchi constructed the Akosombo and Kpong hydropower plants. Sinohydro Corporation Limited constructed the Bui hydropower plant with financial support from the Exim Bank of China and GoG. Other projects include Sunon Asogli Power (Ghana) Limited and the BXC Ghana solar project which were all carried out by the Chinese.
The International Renewable Energy Agency (IRENA), United Nations Environments Programme (UNEP) and Global Environment Facility (GEF) have provided supports leading to the promotion and development of renewable energy and energy efficiency programmes in the country. These efforts resulted in the passage of the Renewable Energy Act and also the implementation of various programmes aimed at improving energy efficiency in the country.
Challenges and Opportunities in Ghana’s Electricity Sector
The Ministry of Energy and the Energy Commission developed various policy and regulatory instruments to guide the operation of the electricity sector, following the implementation of the power sector reform in the late 1990s. These include the National Electrification Scheme aimed at spearheading the achievement of universal access to all Ghanaians by the year 2020; the National Energy Policy and its accompanying National Energy Stratey which outlines GoG’s policy directions towards addressing the challenges facing the energy sector; the Renewable Energy Act 2011, the Feed-in Tariff and Net Metering Schemes to help promote the development and implementation of renewable
18
energy for electricity generation and other energy uses. The Public Utilities Regulatory Commission (PURC) established to ensure equity and fairness in the pricing of electricity in the country provides various levels of support towards the development and implementation of these instruments. It is however unfortunate that, in spite of these measures, the sector has not been able to provide satisfactory service to consumers over the past decade owing to a number of challenges including lack of diversity in the electricity generation mix, high levels of losses plaguing the distribution systems, and a poor tariff structure impacting on the financial stability of the utility companies. Addressing these challenges in addition to implementing demand side management (DSM) measures to help promote efficient use of electricity and the adoption of renewable energy sources such as solar, wind and mini-hydro could help improve the present situation.
Losses in the Electricity Distribution System
Ghana’s electricity distribution system has suffered lots of setbacks over the past decade. It has been reported in Figure 4 of this report that, about 21.7 percent of gross electricity generated over the last decade has been lost annually through transmission and distribution. Whereas transmission losses for this period only averaged 3.9 percent, distribution losses which also includes commercial losses accounted for 16.2 percent annually by the nation’s biggest distribution company ECG. These losses can be associated with inefficiency of some equipment in the distribution systems due to their obsolete nature and also the loss of revenue for electricity consumed due to non payment of bills and power theft. It is reported that at the end of 2015, the Government of Ghana owed ECG to the tune of GH¢ 950 million in subsidies and non-payment of bills by state institutions incuding ministries, departments, and agencies (MMDAs) (Bokpe, 2016). The private sector and individuals also owed ECG some GH¢ 610 million (Bokpe, 2016). These debts have made it difficult for the distribution companies and the other institutions they owe including the VRA to meet their obligations to their suppliers including WAPGCo.
The nationwide implementation of prepaid electricity metering systems for both the private sector and government agencies holds the potential of helping the utility companies properly account for the electricity consumed. Whiles prepaid meters are been implemented among some in the private sector, those in the government sector are still on credit meters, hence the huge debt levels. The state owned utility companies are not autonomous since the government appoints the board members and some top management officials. This interference makes it difficult for the utilities to fully hold government institution accountable for the electricity they consume. One challenge to the implementation of the prepaid metering system in the private sector is the lack of education on the part of the utility companies to the consumers. A successful implementation of the prepaid metering system in both the private and public sector will ensure funds are available for the effective operation of the sector including the replacement of obsolete transmission and distribution equipment to help improve on the technical losses.
19
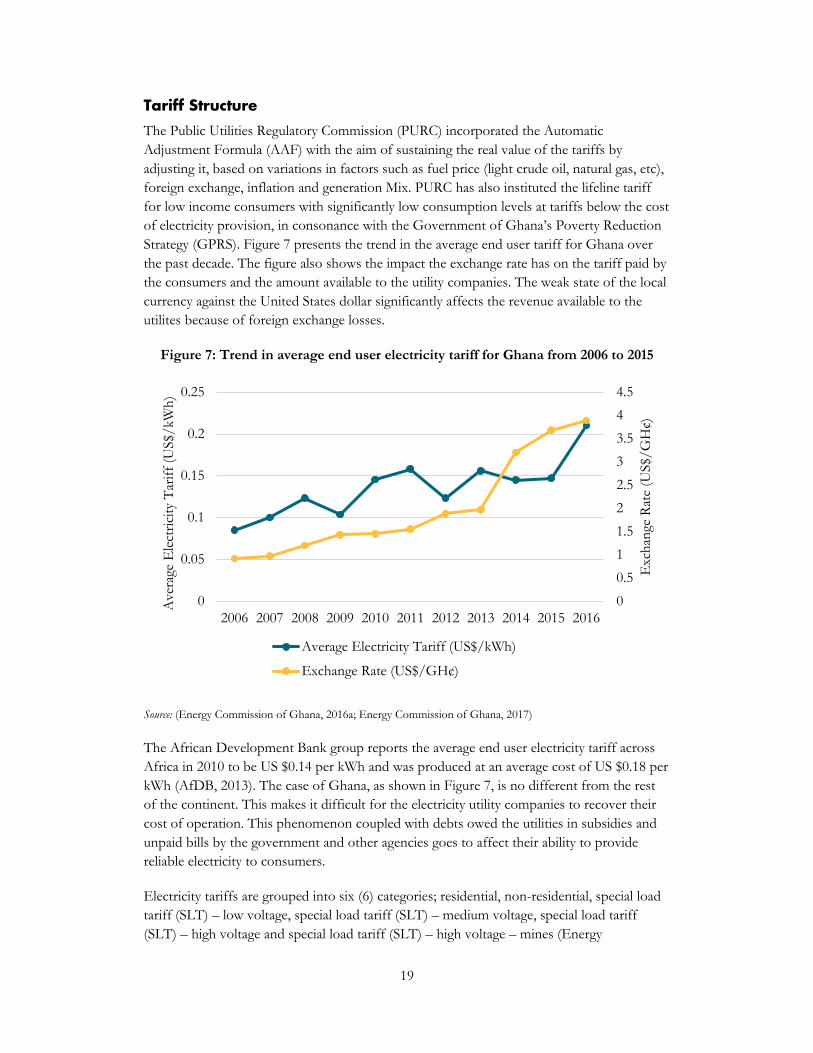
Tariff Structure
The Public Utilities Regulatory Commission (PURC) incorporated the Automatic Adjustment Formula (AAF) with the aim of sustaining the real value of the tariffs by adjusting it, based on variations in factors such as fuel price (light crude oil, natural gas, etc), foreign exchange, inflation and generation Mix. PURC has also instituted the lifeline tariff for low income consumers with significantly low consumption levels at tariffs below the cost of electricity provision, in consonance with the Government of Ghana’s Poverty Reduction Strategy (GPRS). Figure 7 presents the trend in the average end user tariff for Ghana over the past decade. The figure also shows the impact the exchange rate has on the tariff paid by the consumers and the amount available to the utility companies. The weak state of the local currency against the United States dollar significantly affects the revenue available to the utilites because of foreign exchange losses.
Figure 7: Trend in average end user electricity tariff for Ghana from 2006 to 2015
Source: (Energy Commission of Ghana, 2016a; Energy Commission of Ghana, 2017)
The African Development Bank group reports the average end user electricity tariff across Africa in 2010 to be US $0.14 per kWh and was produced at an average cost of US $0.18 per kWh (AfDB, 2013). The case of Ghana, as shown in Figure 7, is no different from the rest of the continent. This makes it difficult for the electricity utility companies to recover their cost of operation. This phenomenon coupled with debts owed the utilities in subsidies and unpaid bills by the government and other agencies goes to affect their ability to provide reliable electricity to consumers.
Electricity tariffs are grouped into six (6) categories; residential, non-residential, special load tariff (SLT) – low voltage, special load tariff (SLT) – medium voltage, special load tariff (SLT) – high voltage and special load tariff (SLT) – high voltage – mines (Energy
0
0.5
1
1.5
2
2.5
3
3.5
4
4.5
0
0.05
0.1
0.15
0.2
0.25
2006 2007 2008 2009 2010 2011 2012 2013 2014 2015 2016
Exc
hang
e R
ate
(US$
/GH
¢)
Ave
rage
Ele
ctric
ity T
ariff
(US$
/kW
h)
Average Electricity Tariff (US$/kWh)
Exchange Rate (US$/GH¢)
20
Commission of Ghana, 2016b). The residential and non-residential categories are classified into consumer below 50 kWh, 51–300 kWh, 301–600 kWh and those above 600 kWh (Energy Commission of Ghana, 2017). All residential consumers enjoy some form of government subsidy for the first 50 kWh of electricity a priviledge which should have been given to only consumers whose total monthly consumption is less than 50 kWh. This means the residential sector tariffs are unrealistic, making it difficult for the utility companies to fully recover the cost of providing elerctricity. This situation also encourages the inefficient use of electricity in the residential sector; putting more pressure on the power utilities. Restructuring the tariff regime to ensure that subsidies are directed to only the poor in the society would go a long way to help save the utility companies from financial crises.
The PURC, in taking steps to review the tariff structure, undertook a major tariff review in 2013 where the state owned utitlity companies, VRA, GRIDCo, ECG and NEDCo presented proposals seeking upward adjustment of tariffs. This exercise resulted in an upward review of tariffs although not up to the levels requested by the utility companies. The government also introduced the energy sector levies to help repay the debts owed by the utitlity companies.
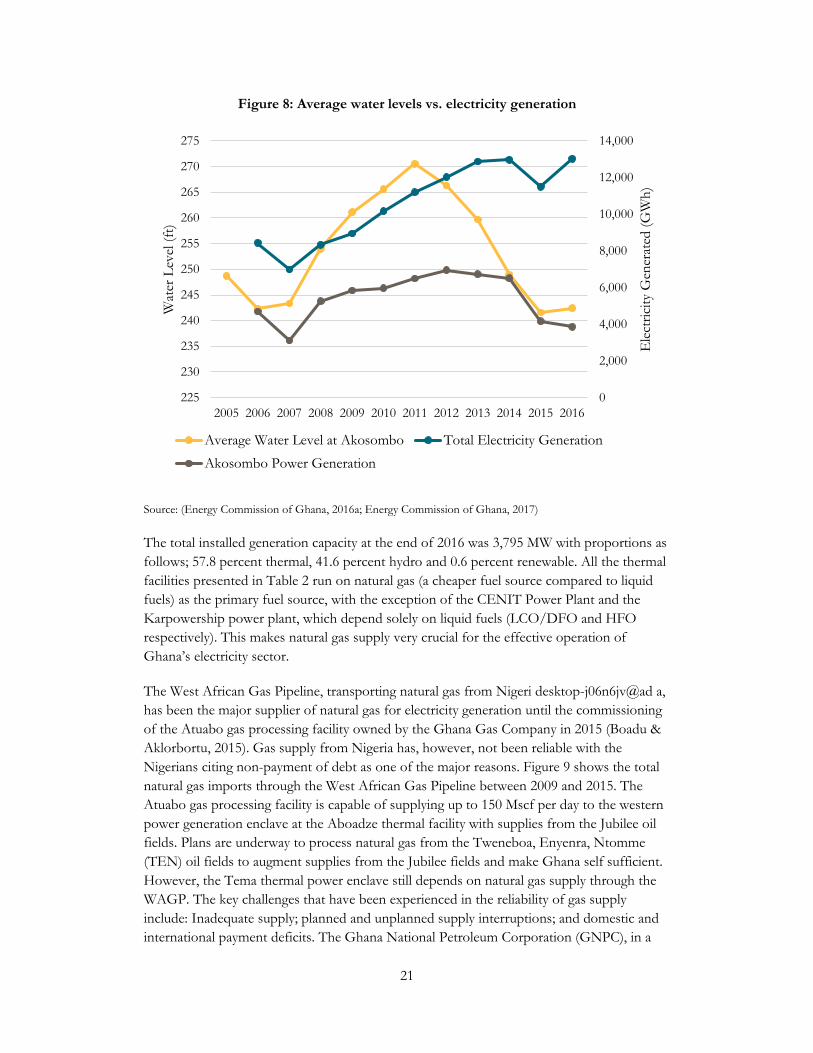
Diversity in the Electricity Generation Mix
Ghana has been heavily dependent on hydro sources, mainly from the Akosombo dam, for electricity generation as demonstrated in Figure 5 and Table 2. This has been because hydro sources are known to provide the cheapest source of electricity as compared to thermal and renewable energy sources. It is therefore not surprising that for 2006/2007, the period the Akosombo dam experienced its lowest water levels, the country recorded the lowest amount of electricity generation. Figure 8 shows the relationship between average water levels recorded for the Akosombo dam and annual electricity generation.
21
Figure 8: Average water levels vs. electricity generation
Source: (Energy Commission of Ghana, 2016a; Energy Commission of Ghana, 2017)
The total installed generation capacity at the end of 2016 was 3,795 MW with proportions as follows; 57.8 percent thermal, 41.6 percent hydro and 0.6 percent renewable. All the thermal facilities presented in Table 2 run on natural gas (a cheaper fuel source compared to liquid fuels) as the primary fuel source, with the exception of the CENIT Power Plant and the Karpowership power plant, which depend solely on liquid fuels (LCO/DFO and HFO respectively). This makes natural gas supply very crucial for the effective operation of Ghana’s electricity sector.
The West African Gas Pipeline, transporting natural gas from Nigeri desktop-j06n6jv@ad a, has been the major supplier of natural gas for electricity generation until the commissioning of the Atuabo gas processing facility owned by the Ghana Gas Company in 2015 (Boadu & Aklorbortu, 2015). Gas supply from Nigeria has, however, not been reliable with the Nigerians citing non-payment of debt as one of the major reasons. Figure 9 shows the total natural gas imports through the West African Gas Pipeline between 2009 and 2015. The Atuabo gas processing facility is capable of supplying up to 150 Mscf per day to the western power generation enclave at the Aboadze thermal facility with supplies from the Jubilee oil fields. Plans are underway to process natural gas from the Tweneboa, Enyenra, Ntomme (TEN) oil fields to augment supplies from the Jubilee fields and make Ghana self sufficient. However, the Tema thermal power enclave still depends on natural gas supply through the WAGP. The key challenges that have been experienced in the reliability of gas supply include: Inadequate supply; planned and unplanned supply interruptions; and domestic and international payment deficits. The Ghana National Petroleum Corporation (GNPC), in a
0
2,000
4,000
6,000
8,000
10,000
12,000
14,000
225
230
235
240
245
250
255
260
265
270
275
2005 2006 2007 2008 2009 2010 2011 2012 2013 2014 2015 2016
Ele
ctric
ity G
ener
ated
(GW
h)
Wat
er L
evel
(ft)
Average Water Level at Akosombo Total Electricity Generation
Akosombo Power Generation
22
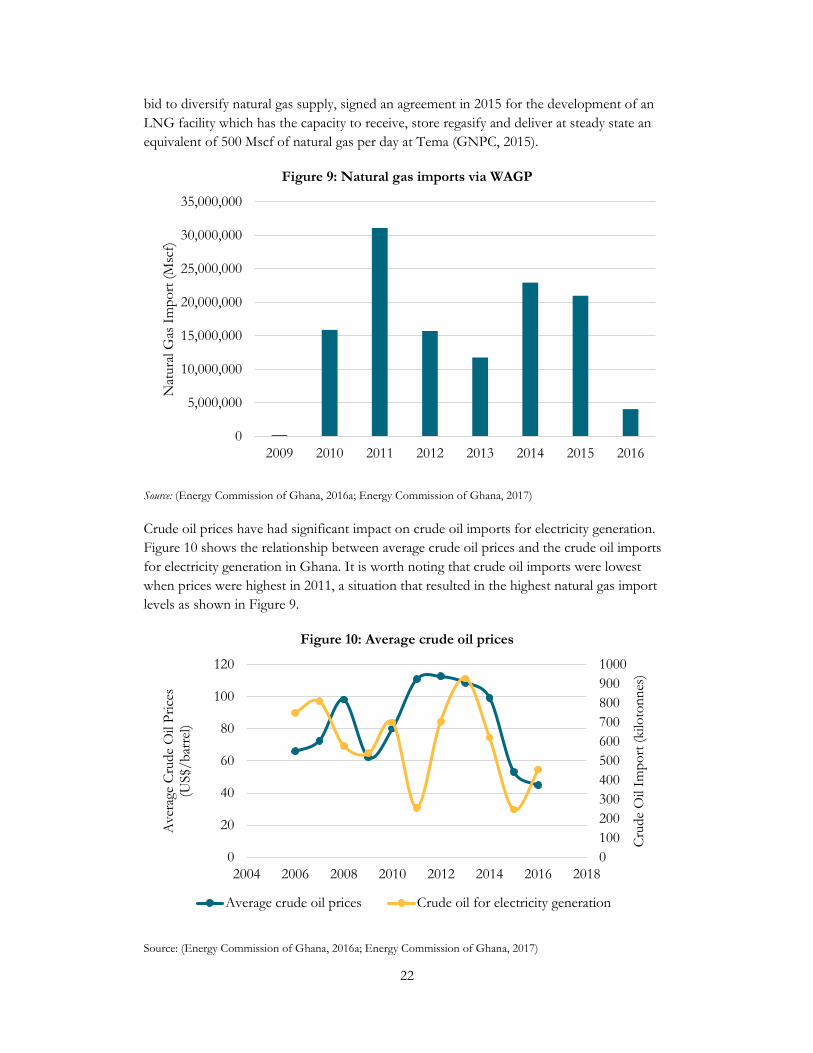
bid to diversify natural gas supply, signed an agreement in 2015 for the development of an LNG facility which has the capacity to receive, store regasify and deliver at steady state an equivalent of 500 Mscf of natural gas per day at Tema (GNPC, 2015).
Figure 9: Natural gas imports via WAGP
Source: (Energy Commission of Ghana, 2016a; Energy Commission of Ghana, 2017)
Crude oil prices have had significant impact on crude oil imports for electricity generation. Figure 10 shows the relationship between average crude oil prices and the crude oil imports for electricity generation in Ghana. It is worth noting that crude oil imports were lowest when prices were highest in 2011, a situation that resulted in the highest natural gas import levels as shown in Figure 9.
Figure 10: Average crude oil prices
Source: (Energy Commission of Ghana, 2016a; Energy Commission of Ghana, 2017)
0
5,000,000
10,000,000
15,000,000
20,000,000
25,000,000
30,000,000
35,000,000
2009 2010 2011 2012 2013 2014 2015 2016
Nat
ural
Gas
Impo
rt (M
scf)
01002003004005006007008009001000
0
20
40
60
80
100
120
2004 2006 2008 2010 2012 2014 2016 2018
Cru
de O
il Im
port
(kilo
tonn
es)
Ave
rage
Cru
de O
il Pr
ices
(U
S$/b
arre
l)
Average crude oil prices Crude oil for electricity generation
23
Ghana has potential for alternative sources of electricity including medium-sized hydropower, mini hydropower and other renewable energy sources mainly solar and wind energy. Developing these potential sources will reduce the burden on the traditional electricity generation facilities, help reduce the losses in transmitting electricity over long distances from generation centres (mostly located in the south) to the consumption centres in the middle and northern part of the country. These sources will, in the long run, help reduce the import of crude oil and natural gas and could go a long way to impact positively on the cost of electricity to both generators and consumers alike.Renewable Energy Options
Renewable energy provides viable alternatives to the power crises, seeing that the country is endowed with abundant renewable energy resources particularly solar. The Renewable Energy Act was therefore passed into law in 2011 to provide the legal framework for the adoption of renewable energy sources into the generation mix. Following the passage of the Renewable Energy Act, the Energy Commission has developed regulations for the sub-sector including the renewable energy grid code and together with the PURC developed feed-in tariffs for investment in the sector. The Act provides for the establishment of a Renewable Energy fund to provide financial resources for the promotion, development, sustainable management and utilization of renewable energy sources. The fund also provides financial incentives for the development of mini grid and off grid renewable power systems for remote areas and island communities. Under the feed-in tariff scheme the PURC is mandated to set the feed-in tariff rates for the sector based on which developer could sign power purchase agreements with the distribution companies following a written approval from the PURC.
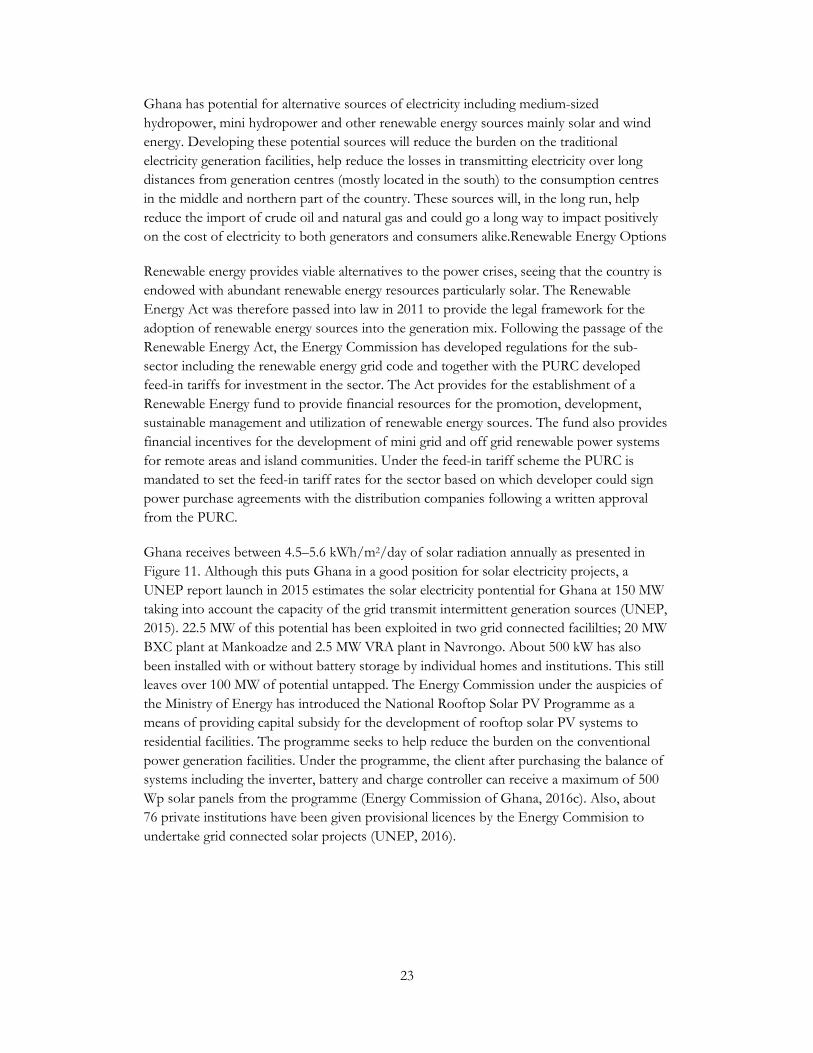
Ghana receives between 4.5–5.6 kWh/m2/day of solar radiation annually as presented in Figure 11. Although this puts Ghana in a good position for solar electricity projects, a UNEP report launch in 2015 estimates the solar electricity pontential for Ghana at 150 MW taking into account the capacity of the grid transmit intermittent generation sources (UNEP, 2015). 22.5 MW of this potential has been exploited in two grid connected facililties; 20 MW BXC plant at Mankoadze and 2.5 MW VRA plant in Navrongo. About 500 kW has also been installed with or without battery storage by individual homes and institutions. This still leaves over 100 MW of potential untapped. The Energy Commission under the auspicies of the Ministry of Energy has introduced the National Rooftop Solar PV Programme as a means of providing capital subsidy for the development of rooftop solar PV systems to residential facilities. The programme seeks to help reduce the burden on the conventional power generation facilities. Under the programme, the client after purchasing the balance of systems including the inverter, battery and charge controller can receive a maximum of 500 Wp solar panels from the programme (Energy Commission of Ghana, 2016c). Also, about 76 private institutions have been given provisional licences by the Energy Commision to undertake grid connected solar projects (UNEP, 2016).
24
Figure 11: Solar radiation map for Ghana
Source: (EADTF, 2014)
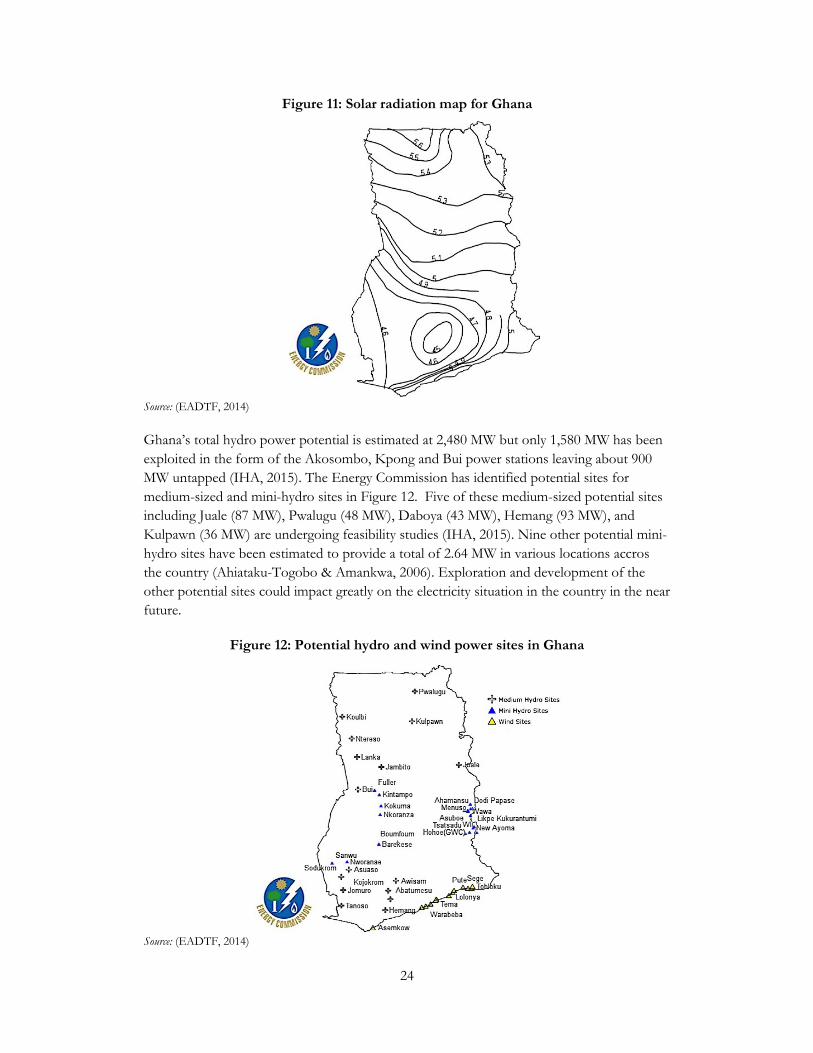
Ghana’s total hydro power potential is estimated at 2,480 MW but only 1,580 MW has been exploited in the form of the Akosombo, Kpong and Bui power stations leaving about 900 MW untapped (IHA, 2015). The Energy Commission has identified potential sites for medium-sized and mini-hydro sites in Figure 12. Five of these medium-sized potential sites including Juale (87 MW), Pwalugu (48 MW), Daboya (43 MW), Hemang (93 MW), and Kulpawn (36 MW) are undergoing feasibility studies (IHA, 2015). Nine other potential mini-hydro sites have been estimated to provide a total of 2.64 MW in various locations accros the country (Ahiataku-Togobo & Amankwa, 2006). Exploration and development of the other potential sites could impact greatly on the electricity situation in the country in the near future.
Figure 12: Potential hydro and wind power sites in Ghana
Source: (EADTF, 2014)
25
Wind speeds measures at various locations across the country range from 6 m/s to 9 m/s (EADTF, 2014). Whiles there are no existing wind power facilities presently operating in the country, Figure 12 presents potential wind power sites indentified by the Energy Commission. The Volta River Authority, as part of its diversification programme, plans to implement upto 150 MW of wind energy projects of 74 MW capacity each along the cost of Keta in the Volta Region and Ada in the Greater Accra Region (VRA, 2016).
Energy Efficiency Measures
The easiest approach GoG has adopted to dealing with the power crises has been to build new power plants, an approach that requires high capital investments. The Energy Commission has developed rules and regulations that feed into the national policy of energy efficiency and conservation. The Commission has since 2007 implemented programmes that have saved Ghana a lot of investments which would have otherwise gone into building of power plants. One of such programmes is the energy efficiency standards and labellings for air conditioners under which every air conditioner imported into the country is required to meet a certain minimum energy efficiency standard set by the Energy Commission and verified by the Ghana Standards Authority. This projected was estimated to offset the national peak demand by about 250 MW (Gyamfi, Amankwa Diawuo, Kumi, Sika, & Modjinou, 2017) The commission carried out another programme to replace all incandescent bulbs with compact fluorescent lamps (CFL), a project which ended up saving 200–240 MW of generation capacity (Gyamfi, Amankwa Diawuo, Kumi, Sika, & Modjinou, 2017). In a refrigerator rebate scheme, the commission sought to replace all second-hand inefficient refrigerators with new and more efficient ones that bare energy efficiency labels similar to that of the air conditioners. These programmes have helped to reduce the burden on the generation facilities and more could be achieved if the citizenry are educated to practice energy saving measures.
Conclusions
Ghana has been committed to providing universal access to electricity by the year 2020. This has seen the establishment of the National Electrification Scheme, in which programmes such as the SHEP has extended electricity to about 82.5 percent of the population of Ghana as of the end of 2016. This pace of electrification, however, cannot guarantee the country universal access to electricity by the year 2020 unless the annual average electrification rate is increased from 2.6 percent to 4.4 percent.
The electricity sector in Ghana has been plagued with severe power supply challenges, characterised by persistent load shedding over the last decade. These challenges are not as a result of lack of installed generation capacity since the total installed generation capacity is far above the peak power demand for the country. The challenges can however be attributed to the unavailability of adequate generation capacity due to fuel supply challenges, inefficient distribution systems leading to high distribution losses and loss of revenue resulting from non payment of bills as well as a poor tariff structure; making it difficult for electricity utility companies to recover their investments in the sector.
26
Efforts aimed at addressing some of these challenges include the MCC Compact II which seeks to provide financing for the enhancement of the grid infrastructure to mitigate some of the distribution losses and also provide technical as well as managerial capacity to the country’s distribution companies. The government is also developing the other gas resources from the country’s oil fields to provide stability in supply of natural gas to the nation’s thermal generation facilities. There has also been proposals to establish an LNG regasification unit to augment local gas supply.
The country has potential in smaller hydro power and renewable energy sources which when fully exploited, would bring diversity into the country’s generation mix thereby curbing the heavy dependence on the Akosombo dam and the major thermal generation facilities. The role of renewable energy in helping achieve electricity self sufficiency cannot be over emphasized. The introduction of the Renewable Energy Act has provided the impetus for development of the sector. However, the government needs to strengthen the enforcement of the of the Act and the various sub regulations as well as introducing more incentives to attract investments into the renewable energy space.
27
References
AfDB. (2013). The High Cost of Electricity Generation in Africa. Retrieved from African Development Bank Group: https://www.afdb.org/en/blogs/afdb-championing-inclusive-growth-across-africa/post/the-high-cost-of-electricity-generation-in-africa-11496/
Ahiataku-Togobo, W., & Amankwa, K. (2006). Hydro Power Development in Ghana. Retrieved August 2017, from http://www.unido.org/fileadmin/import/52380_Mr._Kennedy_Amankwa.pdf
Boadu, K. A., & Aklorbortu, D. K. (2015). Prez Mahama unveils Atuabo Gas Plant; Says it's a game changer. Retrieved from Graphic Online: http://www.graphic.com.gh/news/general-news/prez-mahama-unveils-atuabo-gas-plant-says-it-s-a-game-changer.html
Bokpe, S. J. (2016). Government owes ECG GH¢728 million; Repayment to be spread over 5 years — Terkper. Retrieved from GRAPHIC ONLINE: http://www.graphic.com.gh/news/general-news/government-owes-ecg-gh-728-million-repayment-to-be-spread-over-5-years-terkper.html
EADTF. (2014). The Ghana Energy Access (GhEA) Database. Retrieved Feb 2017, from Energy Access Data Task Force: http://151.80.133.24:90/gheatweb/Home/Project
Edjekumhene, I., Amadu, B. A., & and Brew-Hammond, A. (2001). Power Sector Reform in Ghana: The Untold Story.
Energy Commission of Ghana. (2016a). National Energy Statistics (2006-2016). Retrieved from Energy Commission of Ghana: http://energycom.gov.gh/files/National%20Energy%20Statistics_2016.pdf
Energy Commission of Ghana. (2016b). 2016 Energy (Supply and Demand) Outlook for Ghana. Retrieved from The Energy Commission of Ghana: http://energycom.gov.gh/files/Energy%20Commission%20-%202016Energy%20Outlook%20for%20Ghana_final.pdf
Energy Commission of Ghana. (2016c). Energy Commission of Ghana. Retrieved from National Rooftop Solar PV Programme: http://www.rooftopsolar.energycom.gov.gh/about-nrp
Energy Commission of Ghana. (2017). National Energy Statistics (2007 - 2016). Retrieved from http://energycom.gov.gh/files/ENERGY_STATISTICS_2017.pdf
Eshun, M., & Amoako-Tuffour, J. (2016). A Review of the Trends in Ghana’s Power Sector. Energy, Sustainability and Society.
GNPC. (2015). GNPC and Quantum Power Signs an Agreement to Construct Tema LNG Terminal. Retrieved August 9, 2017, from Ghana National Petroleum Corporation: http://www.gnpcghana.com/press3.html
Gyamfi, S., Amankwa Diawuo, F., Kumi, E. N., Sika, F., & Modjinou, M. (2017). The Energy Efficiency Situation in Ghana. Renewable and Sustainable Energy Reviews.
IEA. (2016). World Energy Outlook 2016. International Energy Agency, Paris. IHA. (2015). Ghana: assessing the sustainability of new hydropower sites. (A. Khalil, Producer)
Retrieved August 4, 2017, from International Hydropower Association: https://www.hydropower.org/blog/ghana-assessing-the-sustainability-of-new-hydropower-sites
ISSER. (2005). Guide to Elerctric Power in Ghana. Institute of Statistical, Social and Economic Research, Accra.
28
ISSER. (2015). Electricity insecurity and its Impact on Micro and Small Businesses in Ghana. Electricity Insecurity and Its Impact on the Economy of Ghana. Accra: Institute of Statistical, Social and Economic Research.
Kapika, J., & Eberhard, A. (2013). Power-Sector Reform and Regulation in Africa: Lessons from Kenya, Tanzania, Uganda, Zambia, Namibia and Ghana. Retrieved from http://www.hsrcpress.ac.za/downloadpdf.php?pdffile=files%2FPDF%2F2305%2FPSeBook.pdf&downloadfilename=Power-sector%20reform%20and%20regulation%20in%20Africa%20-%20Entire%20eBook
Kemausuor, F., & Ackom, E. (2016). Toward universal electrification in Ghana. WIREs Energy Environment, 6(10).
Mathrani, S., Santley, D., Hosier, R., Bertholet, F., Braud, A., Dawson-Amoah, G., . . . Reinoso, G. (2013). Energizing Economic Growth in Ghana : Making the power and Petroleum Sectors Rise to the Challenge. Retrieved from http://documents.worldbank.org/curated/en/485911468029951116/Energizing-economic-growth-in-Ghana-making-the-power-and-petroleum-sectors-rise-to-the-challenge
Mensah, G. S., Kemausuor, F., & Brew-Hammond, A. (2014). Energy access indicators and trends in Ghana. Renewable and Sustainable Energy Reviews, 30, 317–323.
Ministry of Energy. (2010). Natinoal Energy Policy. Retrieved from http://www.petrocom.gov.gh/assets/national_energy_policy.pdf
Ministry of Power. (2016). Power News. The Official News Magazine for the Ministry of Power, Maiden Edition. Accra.
Power Systems Energy Consulting (PSEC) & Ghana Grid Company (GRIDCo). (2010). Ghana Power Reliability Assessment. Power Systems Energy Consulting.
UNEP. (2015). Ghana Solar Export Potential Study. Geneva: UNEP. UNEP. (2016). GE-TOP Ghana Strategy Proposal – Realizing solar PV projects in a cross-border
power supply context. Geneva: UNEP. USAID. (2017). Ghana: Power Africa Fact Sheet. Retrieved from USAID: https://www.usaid
.gov/powerafrica/ghana VALCO. (2017). History. Retrieved from Volta Aluminium Company (VALCO):
http://www.valcotema.com/about-us/history.html VRA. (2015). Power Generation: Facts and Figures. Retrieved March 20, 2015, from Volta River
Authority: http://vraghana.com/resources/facts.php VRA. (2016). Wind Energy. Retrieved August 2017, from Volta River Authority:
http://www.vra.com/our_mandate/wind_energy.php