Embed Size (px)
Citation preview

MURDOCH UNIVERSITY
The Electrodialysis of Lithium Sulphate to Lithium Hydroxide ENG470 – Engineering Honours Thesis
Thesis submitted to the School of Engineering and Information Technology, Murdoch
University, to fulfil the requirements for the degree of Chemical and Metallurgical
Engineering Honours.
Written by: Hollie Harrison
Unit Coordinator: Professor Parisa Arabzadeh Bahri & Dr. Gareth Lee
Thesis Supervisors: Dr Aleks Nikoloski

This page was intentionally left blank

I
Author’s Declaration I declare that this thesis is my own account of my research and contains as its main
content work which has not previously been submitted for a degree at any tertiary
education institution.
Hollie Harrison

II
Acknowledgements
Firstly, I would like to sincerely thank my supervisor, Dr. Aleks Nikoloski for his
unwavering support and encouragement throughout this project. I would also like to
acknowledge and wholeheartedly thank Kwang-loon Ang (Allan) for his hours of
work in helping me to complete this research, without whom I would not have been
able to complete this thesis. I would also like to thank Jacqueline Briggs for all of her
vital assistance and patience with the ion-chromatography machine.
To my friends within the university, I would like to thank you for your help,
support and advice, without which this project and university life would have been the
most stressful experience of my life. Each one of you has helped me to the best of
your ability, and I am so very grateful for that.
To my family for their complete and unconditional love, support and
encouragement throughout my entire student career. I would not have had the ability
to complete this degree without you, and for that I cannot thank you guys enough.
Lastly to my amazing partner, Bevan Green, thank you for all of the lunches you
brought me when I had no time to get food. Thank you for your unconditional support
and all of the encouragement you’ve given me over the past year.

III
Abstract
There is currently an increasing demand for lithium-ion batteries, and therefore a
push within the industry to produce lithium hydroxide. Electrodialysis has been
shown to be a promising new technology for producing lithium hydroxide.
A three-compartment batch electrodialysis cell was constructed, utilising an
anionic exchange membrane and a cationic exchange membrane. This cell was
constructed in order to produce lithium hydroxide from lithium sulphate salt. The cell
was run under multiple different conditions to observe the effect that they would have
on the recovery of lithium within the lithium hydroxide of the catholyte compartment
within the cell. The initial pH of the solution, the temperature of the system, the initial
concentration of lithium sulphate and the residence time within the cell were all tested
in separate experiments in order to observe how they would influence the system and
the production of lithium hydroxide.
The results of this study indicated that by decreasing the initial concentration of the
lithium sulphate within the cell, the lithium recovery is dramatically increased, at 30
wt.% lithium sulphate, 18.3% of the lithium is recovered within 4 hours into the
catholyte solution as lithium hydroxide. At 5 wt.% lithium sulphate, 81.2% of the
lithium is recovered within 4 hours into the catholyte as lithium hydroxide.
The results also suggest, the rate of production of lithium hydroxide is fastest when
the residence time within the cell is reduced, however, a longer residence time within
the cell will increase the lithium recovery. A 4-hour test at 30 wt.% of lithium
sulphate yielded a 23.1% lithium recovery within the catholyte solution. When this
residence time was doubled, the recovery was increased to 37% lithium within the
catholyte as lithium hydroxide.

IV
This page was intentionally left blank

V
Table of Contents
Author’s Declaration ...................................................................................................... I
Acknowledgements ....................................................................................................... II
Abstract ........................................................................................................................ III
Table of Tables ........................................................................................................... VI
Table of Figures ......................................................................................................... VII
1. Chapter 1- Introduction .......................................................................................... 1
2. Chapter 2- Literature Review ................................................................................. 3
2.1. Introduction to Lithium .................................................................................. 3
2.1.1. Uses for Lithium ........................................................................................ 3
2.1.2. History of Lithium ..................................................................................... 5
2.1.3. Lithium Hydroxide (LiOH) ....................................................................... 6
2.2. Electrodialysis ................................................................................................ 7
2.3. Membranes ................................................................................................... 11
2.3.1. Types of membranes explored ................................................................. 11
2.4. Electrolytic Solutions ................................................................................... 20
2.4.1. Catholyte .................................................................................................. 21
2.4.2. Anolyte .................................................................................................... 22
2.5. Factors That Can Affect Efficiency ............................................................. 22
2.6. Conclusions and Recommendations ............................................................ 25
3. Chapter 3- Materials and Methods ....................................................................... 28
3.1. Solution Preparation..................................................................................... 28
3.2. Analytical Methods ...................................................................................... 29
3.3. Experimental Materials and Set-up ......................................................... 30
3.4. Experimental Method................................................................................... 35
3.4.1. Preliminary Experiment ........................................................................... 35
3.4.2. pH Alteration ........................................................................................... 37
3.4.3. Temperature ............................................................................................. 37
3.4.4. Initial Concentration of Li2SO4 ............................................................... 37
3.4.5. Residence Time ....................................................................................... 38
4. Chapter 4- Results and Discussion ...................................................................... 39
4.1. Preliminary Experiment ............................................................................... 39
4.2. Effect of pH.................................................................................................. 43
4.3. Effect of Temperature .................................................................................. 48
4.4. Effect of Starting Concentration .................................................................. 54
4.5. Effect of Residence Time ............................................................................. 62
4.6. General Discussion ...................................................................................... 70
5. Chapter 5- Conclusion and Recommendations .................................................... 73
5.1. Future Work ................................................................................................. 74
6. References ............................................................................................................ 75
7. Appendix .............................................................................................................. 80

VI
Table of Tables Table 1: Calculated lithium demand (Basic Scenario) forecast and share in 2020 for
different applications Modified from (Martin et al., 2017). .................................. 4
Table 2: Operating conditions for each experiment ..................................................... 35
Table 3: Mass transfer and recovery, experiment 1: preliminary ................................ 43
Table 4: Mass transfer and recovery, experiment 2: pH 11 ......................................... 47
Table 5: Mass transfer and recovery, experiment 3: pH 7 ........................................... 48
Table 6: Mass transfer and recovery, experiment 4: 40°C,.......................................... 54
Table 7: Mass transfer and recovery, experiment 5: 60°C,.......................................... 54
Table 8: Mass transfer and recovery, experiment 6: 15 wt.% ..................................... 61
Table 9: Mass transfer and recovery, experiment 7: 10 wt.% ..................................... 61
Table 10: Mass transfer and recovery, experiment 8: 5 wt.% ..................................... 62
Table 11: Mass transfer and recovery, experiment 9 ................................................... 69
Table 12: Mass transfer and recovery, experiment 10 ................................................. 69
Table 13: Mass transfer and recovery, experiment 11 ................................................. 69
Table 14: System mass balance, experiment 1: preliminary........................................ 84
Table 15: System mass balance, experiment 2: pH 11 ................................................ 85
Table 16: System mass balance, experiment 3: pH 7 .................................................. 86
Table 17: System mass balance, experiment 4: 40°C .................................................. 87
Table 18: System mass balance, experiment 5: 60°C .................................................. 88
Table 19: System mass balance, experiment 6: 15 wt.% ............................................. 89
Table 20: System mass balance, experiment 7: 10 wt.% ............................................. 90
Table 21: System mass balance, experiment 8: 5 wt.% ............................................... 91
Table 22: System mass balance, experiment 9: 2 hours .............................................. 92
Table 23: System mass balance, experiment 10: 4 hours ............................................ 93
Table 24: System mass balance, experiment 11: 8 hours ............................................ 94

VII
Table of Figures Figure 1: The movement of ions within an electrodialysis cell. Modified from
(Mroczek et al. 2015). ............................................................................................ 7
Figure 2: Separation test of Li and Cl ions by electrodialysis. Modified from
(Hoshino. 2013). .................................................................................................... 9
Figure 3: Electrodialysis process for turning lithium sulphate into lithium hydroxide
and sulphuric acid. Modified from (Ying et al., 2008). ....................................... 10
Figure 4: Recovery ratio (% of lithium recovered) achieved by electrodialysis (a) IL-i-
OM and (b) High-durability IL-i-OM. Modified from (Hoshino, 2013). ............ 12
Figure 5: Nanofiltration membrane with monovalent ions permeating through the
membrane wall. Modified from (Ge et al., 2015). ............................................... 14
Figure 6: nanotube membrane technology in the desalination of water. Modified from
(Das et al., 2013). ................................................................................................. 15
Figure 7: Flow sheet for the conventional production of ultra-pure water. Modified
from (Xu and Huang, 2008). ................................................................................ 17
Figure 8: Flow sheet for the production of ultra-pure water utilizing conventional
electrodialysis. Modified from (Xu and Huang, 2008). ....................................... 18
Figure 9: Flow sheet for the production of ultra-pure water utilizing electrodialysis
with a bipolar membrane. Modified from (Xu and Huang, 2008). ...................... 19
Figure 10: Electrodialysis cell for the production of lithium hydroxide. Modified from
(Ying et al., 2008). ............................................................................................... 21
Figure 11: Electrodialysis cell with cationic and anionic movement of particles.
Modified from (Valero et al., 2011)..................................................................... 23
Figure 12: Production of lithium hydroxide at varying current densities. Modified
from (Ying et al. 2008). ....................................................................................... 24
Figure 13: Energy consumption (squares) and the current efficiency (circles) as
related to the current density. Modified from (Ying et al. 2008). ........................ 25
Figure 14: Front View of Electrodialysis cell .............................................................. 31
Figure 15: Top view of Electrodialysis cell ................................................................. 32
Figure 16: Cathode ....................................................................................................... 33
Figure 17: Experimental Setup .................................................................................... 34
Figure 18 Concentration of lithium within the salt and catholyte chambers,
experiment 1: preliminary .................................................................................... 39
Figure 19: Concentration of sulphate within the anolyte and salt chambers,
experiment 1: preliminary .................................................................................... 40
Figure 20: Cell voltage, anodic and cathodic potentials, experiment 1: preliminary .. 41
Figure 21 Concentration of lithium within the catholyte and salt chambers,
experiment 2: pH 11............................................................................................. 44
Figure 22: Concentration of lithium within the catholyte and salt chambers,
experiment 3: pH 7............................................................................................... 44
Figure 23: Concentration of sulphate within the anolyte and salt compartments,
experiment 2: pH 11............................................................................................. 45

VIII
Figure 24: Concentration of sulphate within the anolyte and salt compartments,
experiment 3: pH 7............................................................................................... 45
Figure 25: Cell voltage, anodic and cathodic potentials, experiment 2: pH 11 ........... 46
Figure 26: Cell voltage, anodic and cathodic potentials, experiment 3: pH 7 ............. 46
Figure 27: Concentration of lithium within the catholyte and salt chambers,
experiment 4: 40°C .............................................................................................. 49
Figure 28: Concentration of lithium within the catholyte and salt chambers,
experiment 5: 60°C .............................................................................................. 49
Figure 29: Concentration of sulphate within the anolyte and salt compartments,
experiment 4: 40°C .............................................................................................. 50
Figure 30: Concentration of sulphate within the anolyte and salt compartments,
experiment 5: 60°C .............................................................................................. 51
Figure 31: Cell voltage, anodic and cathodic potentials, experiment 4: 40°C ............ 52
Figure 32: Cell voltage, anodic and cathodic potentials, experiment 5: 60°C ............. 52
Figure 33: Concentration of lithium within the catholyte and salt chambers,
experiment 6: 15 wt.% ......................................................................................... 55
Figure 34: Concentration of lithium within the catholyte and salt chambers,
experiment 7: 10 wt.% ......................................................................................... 56
Figure 35: Concentration of lithium within the catholyte and salt chambers,
experiment 8: 5 wt.% ........................................................................................... 56
Figure 36: Concentration of sulphate within the anolyte and salt compartments,
experiment 6: 15 wt.% ......................................................................................... 57
Figure 37: Concentration of sulphate within the anolyte and salt compartments,
experiment 7: 10 wt.% ......................................................................................... 58
Figure 38: Concentration of sulphate within the anolyte and salt compartments,
experiment 8: 5 wt.% ........................................................................................... 58
Figure 39: Cell voltage, anodic and cathodic potentials, experiment 6: 15 wt.% ........ 59
Figure 40: Cell voltage, anodic and cathodic potentials, experiment 7: 10 wt.% ........ 60
Figure 41: Cell voltage, anodic and cathodic potentials, experiment 8: 5wt.% ........... 60
Figure 42: Concentration of lithium within the catholyte and salt chambers,
experiment 9: 2 hours........................................................................................... 63
Figure 43: Concentration of lithium within the catholyte and salt chambers,
experiment 10: 4 hours......................................................................................... 63
Figure 44: Concentration of lithium within the catholyte and salt chambers,
experiment 11: 8 hours......................................................................................... 64
Figure 45: Concentration of sulphate within the anolyte and salt compartments,
experiment 9: 2 hours........................................................................................... 65
Figure 46: Concentration of sulphate within the anolyte and salt compartments,
experiment 10: 4 hours......................................................................................... 65
Figure 47: Concentration of sulphate within the anolyte and salt compartments,
experiment 11: 8 hours......................................................................................... 66
Figure 48: Cell voltage, anodic and cathodic potentials, experiment 9: 2 hours ......... 67
Figure 49: Cell voltage, anodic and cathodic potentials, experiment 10: 4 hours ....... 67
Figure 50: Cell voltage, anodic and cathodic potentials, experiment 11: 8 hours ....... 68

IX
Figure 51: Current efficiency and the lithium recovery of experiments 1-11. ............ 71
Figure 52: Lithium hydroxide and sulphuric acid production rates from each test ..... 71
Figure 53 Middle compartment of electrodialysis cell ................................................ 81
Figure 54: Dimensions of Electrodialysis Cell ............................................................ 82
Figure 55 Apparatus placement within the electrodialysis cell ................................... 83

1
1. Chapter 1- Introduction
At the beginning of 2017, the largest global use for lithium was batteries (Unites
States Geological Survey, 2017; Martin et al., 2017). These batteries are used in
handheld devices, computers and other products where a lead based battery is heavy
and impractical. Currently there is a major push in the research field to investigate
new or improved ways to increase our ability to have portable power. Lithium is also
being looked at in order to develop car batteries for electric and hybrid cars in the
future (Hoshino, 2014; Hwang et al., 2016; Tahil, 2007). Their appeal comes from
their ability to store more energy within handheld devices with fewer charges (Tahil,
2007), and this innovation could potentially be transferred into the new car battery
technology.
Lithium recovery from lithium chloride salts has been researched extensively.
However lithium chloride resources are becoming limited and other means of lithium
recovery must be looked into (Hoshino, 2014). Sulphate brines are in abundance, but
the technology to produce lithium hydroxide from sulphates has not yet been properly
established (Hoshino, 2014). It has been suggested that electrodialysis could possibly
be a relatively simple and cost effective method for producing lithium hydroxide from
lithium sulphate.
The aim of this study is to improve technology to produce lithium hydroxide. In
order to do this, electrodialysis will be carried out on lithium sulphate salt to
determine:
1. That electrodialysis is a possible method for producing lithium hydroxide from
lithium sulphate.

2
2. The effect that the pH of the solution has on the production of lithium hydroxide.
3. The effect of temperature on the production of lithium hydroxide.
4. The effect of the initial concentration on the production of lithium hydroxide
5. The effect on the production of lithium hydroxide in relation to residence time
within the cell.
3
2. Chapter 2- Literature Review
2.1. Introduction to Lithium
Lithium is a resource that is increasingly becoming more popular as new
technologies are being developed to incorporate lithium ion batteries into their
functionality. To decrease the cost these new technologies, and therefore make them
more appealing to consumers, the cost of production of lithium needs to be reduced, it
has been suggested that this could be done through electrodialysis (Ying et al., 2008;
Hoshino, 2013; Hoshino, 2014). Currently, the electrodialysis of lithium chloride has
been investigated and extensively researched, making the process of extracting
lithium from chloride brines efficiently methodized, however the chloride brine
resource is becoming increasingly limited in its natural economical supply, whereas
sulphate brines are plentiful, but the research towards the extraction of lithium from
these brines is yet to be determined fully (Hoshino, 2014).
Lithium is found in hard rock, such as pegmatites. These igneous rocks are formed
by crystalized magmatic fluid, forming minerals that contain lithium such as
spodumene, lepidolite and petalite (Evans, 2008; Tahil, 2007). Lithium is also present
in the form of brines in salt lakes and additionally can be found in seawater. This
occurs when hard rocks are leached and the concentration of the brine and seawater
can vary greatly depending on the location of the sample (Evans, 2008; Tahil, 2007).
2.1.1. Uses for Lithium
In 1976 a National Research Council Panel estimated that the demand for lithium
was approximately 3,200 tonnes per year. In 2008, the demand equated to
approximately 16,000 tonnes of elemental lithium (Evans, 2008). In 2015, 35% of
lithium consumed that year went towards batteries, with ceramic and glass

4
applications being the second biggest use for lithium, consuming 32%. The demand
for lithium in this year was calculated to be approximately 173,000 tonnes and in
2020 the basic demand for lithium is forecast to be around 270,000 tonnes (Martin et
al., 2017).
Table 1: Calculated lithium demand (Basic Scenario) forecast and share in 2020 for
different applications Modified from (Martin et al., 2017).
Demand 2015
[t]
Share 2015
[%]
Demand 2020
[t]
Share 2020
[%]
Batteries 53,629 35 76,673 34
Glasses and
Ceramics 0,549 32 86,717 38
Lubricating
greases 13,840 9 14,507 7
Polymers 8,650 4 2,315 1
Air
conditioning 8,650 5 5,325 2
Aluminium 1,730 1 0 0
Continuous
casting 10,380 5 18,478 8
Other 15,570 9 22,235 10
Sum 172,998 100 226,250 100
Today lithium ion batteries are being used in a rage of technologies, lithium is
being used as opposed to lead due to its lower density, making it a much lighter
battery, therefore a more attractive alternative to the lead acid battery. Lithium-ion
batteries are also greatly attractive due to their ability to store more energy, allowing
portable devices to last longer with fewer charges (Tahil, 2007). Lithium is also being
used in a range of medical devices as lithium micro-batteries (Hwang et al., 2016).
As a means of combatting the issue with the depleting fossil fuels resource, and the
growing environmental crisis of global warming, lithium-ion batteries are
increasingly being developed and utilized in hybrid cars (Hoshino, 2014; Hwang et

5
al., 2016; Tahil, 2007). Lithium is also widely used in glass and ceramics production,
this application of lithium is the second largest next to batteries in the industry
(Martin et al., 2017). In glasses and ceramics, lithium improves their durability when
temperature is involved (Dakota Minerals, 2017). Not only does lithium increase the
performance of glass and ceramics in terms of their thermal qualities, it also enhances
the mechanical strength of ceramics and the colourfastness of glasses (Martin et al.,
2017).
2.1.2. History of Lithium
Lithium was first discovered in the 1790s in the form of the mineral petalite (Royal
Society of Chemistry, 2017). Traditionally, Lithium has been recovered from salt
lakes or in other words, brines. South America produced a large amount of the
world’s lithium, with two of its salt lakes, one in Argentina, the other in Chile, these
Salt Lakes produced approximately 70% of the world’s lithium (Hoshino, 2013;
Hoshino, 2014).
Lithium Reserves are part of lithium reserve bases in which lithium can be
economically produced from at the time of production, they denote the holding of
realistic recoverable lithium (Tahil, 2007). The term, reserve base is the identified
source of lithium; it includes the lithium reserves, i.e. the economically recoverable
lithium, the marginal reserves, the lithium that is only marginally economical to
produce and the sub-economic reserves of lithium. These reserves will only be
economical to produce in the event that new technologies are developed or the global
price of lithium rises sufficiently in order to extract the lithium in these reserves
economically (Tahil, 2007). However, the industry cannot rely on lithium prices to
increase in order to have the ability to economically extract from the currently sub-

6
economic reserves, therefore the industry must find alternative, economical methods
of production.
2.1.3. Lithium Hydroxide (LiOH)
Lithium hydroxide (LiOH), in its anhydrous form (containing no water) is a white
crystalline (solid) substance that is soluble in water and will produce an alkaline
(basic) liquid. Lithium hydroxide is insoluble in ether and only slightly soluble in
ethanol. When in its crystalline form, lithium hydroxide has a melting point of 450°C
and will decompose at 924°C (Daintith, 2008). Reacting lithium salts or lithium ores
with lime can make this particular compound. Lithium hydroxide can also be
produced by reacting lithium metal or lithium hydride with water, however this
reaction is exothermic and therefore quite aggressive (Daintith, 2008).
Lithium hydroxide is one of the materials used in the production of electric vehicle
batteries. As such, as the demand for electrically run vehicles increases, so does the
demand for lithium hydroxide (Warburton, 2016). Lithium hydroxide was previously
produced by aqueous causticisation reactions between lime, which is produced by
hydrating calcium oxide with water, and lithium carbonate. However, as one of the
main applications of lithium hydroxide is in the production of lithium batteries, in
which the lithium hydroxide is used to produce the cathode material within the
battery. The lithium hydroxide produced needs to be of battery grade, meaning that it
needs to be very pure, and almost completely free of contaminants. Producing lithium
hydroxide through causticisation means that obtaining a battery grade lithium
hydroxide product is problematic (Buckley et al., 2011).
Usually, the lithium hydroxide produced through causticisation is obtained from
spodumene ore or brine water in which the lithium is present as a salt, quite usually
lithium chloride or lithium sulphate (Sharma, 2016). Lithium Hydroxide can also be

7
produced through converting lithium chloride into lithium carbonate utilizing soda
ash (Sharma, 2016).
2.2. Electrodialysis
A physical process would be a process in which lithium ions are physically or
mechanically separated from a substance or compound, these methods are typically
not the most accurate of separation methods, allowing for other metallic ions to be
recovered alongside lithium. However, chemical processes in comparison, are a lot
more selective than physical processes (Hwang et al., 2016).
Figure 1: The movement of ions within an electrodialysis cell. Modified from
(Mroczek et al. 2015).
Electrodialysis was invented in the 1950s in order to desalinate brackish water
(Valero et al., 2011; Reahl, 2006). It is essentially an extension of electrolysis, which

8
is an electrochemical process in which ions in solution are passed to an anode or
cathode, oxidation of the solution occurs at the anode and reduction occurs at the
cathode.
The system incorporates ion exchange membranes; cationic membranes and
anionic membranes can be used. Usually these membranes are alternated with 3 fluid
streams, the dilute stream, that contains the substance to be extracted, the concentrate
and the electrolyte that can be described as the catholyte and the anolyte. The
electrolytic liquid provides the ions with a mode of transport between the semi-
permeable membranes (Mroczek et al., 2015). Figure 1 illustrates the movement of
anions through the anionic membranes and the movement of cations through the
cationic membrane.
The chlor-alkali industry had adapted diaphragm cells that were used to produce
chlorine and caustic soda, to produce electrodialysis cells. Instead of having a
diaphragm, an ionic membrane known as an ion-exchange membrane is used
(O’Brien et al., 2005). Diaphragms were originally made of asbestos; the anode of the
cell would be placed between the two diaphragms and a copper gauze after each
diaphragm acted as the cathodes of the system (O’Brien et al., 2005).
In earlier years, electrodialysis was initially used to produce sodium hydroxide
from rock salt, sodium chloride. Initially, sodium hydroxide was produced by
electrolysis, which had been experimented with. Diaphragms and mercury cathodes
were explored in order to produce other products rather than just sodium hydroxide
and chlorine gas (Mazrou et al., 1997). Thus electrodialysis utilizing anionic and
cationic exchange membranes was able to produce not only sodium hydroxide, but
hydrochloric acid as well (Mazrou et al., 1997).

9
The pH, voltage, flow rate and the number of membranes in the electrodialysis cell
are the numerical factors, along with the electrolyte used, that will greatly influence
the recovery of lithium ions. Therefore, these factors need to be optimised in order to
efficiently and economically recover lithium ions through electrodialysis (Hwang et
al., 2016). For example, Figure 2 shows the separation of lithium and chloride
utilizing cationic and anionic membranes, with an anolyte of water and a catholyte of
hydrochloric acid in an electrodialysis cell.
Figure 2: Separation test of Li and Cl ions by electrodialysis. Modified from
(Hoshino. 2013).
As can be seen in Figure 2, lithium ions will penetrate through to the cathode
through the cation exchange membrane, while the chloride ions will permeate towards
the anode through the anion exchange membrane.

10
Figure 3: Electrodialysis process for turning lithium sulphate into lithium hydroxide
and sulphuric acid. Modified from (Ying et al., 2008).
Figure 3 illustrates a continuous electrodialysis cell in which lithium sulphate salt
is put into solution to produce lithium hydroxide and sulphuric acid. The dilute stream
in this particular example would be the lithium sulphate solution, while the
concentrate would be the lithium hydroxide that is being produced, and the
electrolytes used in this cell were lithium hydroxide and sulphuric acid. The Li2SO4 is
pumped into the compartment between the cationic membrane (CEM) and the anionic
membrane (AEM). The lithium ions within the solution will them permeate through
the cationic membrane towards the anode to produce lithium hydroxide along with
hydrogen gas. The sulphate ions will pass through the anionic membrane to produce
sulphuric acid and oxygen gas. Figure 10 depicts a simpler schematic of this cell
(Ying et al., 2008).
The reactions taking place within the cell are as follows:
Overall reaction: Li2SO4 (aq) + 2H2O H2SO4 (aq) + 2LiOH (aq) (1)
Half-cell reactions:
Anode: H2O (aq) 2H+ (aq) + 1/2O2 (g) +2e- (2)
Cathode: 2H2O (aq) +2e- H2 (g) +2OH-(aq) (3)

11
2.3. Membranes
Membranes can be used in a wide range of technologies; they are not limited to
their use in electrodialysis. Other uses include gas separation and simple physical
separation of particles. Gas separation, employs specialty robust and highly selective
membranes that are used in order to economically separate certain gasses. Gas
separation membranes can be used in fuel cells for cars or other vehicles, and reactors
that utilize membranes for the production of hydrocarbons (Koros. 2002).
The industrial application of membranes first started in 1950, this was when
artificial membranes were invented (Tanaka et al., 2012). Membranes become
‘stacked’ alternating between cation and anion specific membranes. Depending on the
membrane, only certain ions will be able to permeate through the membrane. The way
the membranes are layered in the stack will also determine which ions will be
extracted from the dilute stream into the concentrate (Mroczek et al., 2015).
Different ion-exchange membranes have different permselectivities, this means
that the membrane is selective in the cations or the anions that can pass through. This
broadly has to do with whether they are monovalent or multivalent cations and anions
(Mroczek et al., 2015; Ball and Boatang., 1987). Lithium, being a monovalent cation
can be separated from multivalent cations by using a permselective membrane.
2.3.1. Types of membranes explored
Although ion-exchange membranes are the conventional membranes used when
running an electrodialysis cell, bipolar membranes can be used in electrodialysis in
place of or in addition to ion-exchange membranes.
2.3.1.1. Ion-Exchange Membranes
Ion-exchange across membranes had initially been investigated through the use of
biological membranes prior to the invention of artificial ion-exchange membranes

12
(Tanaka et al., 2012). This specific type of membrane is now the primary membrane
used in the purification of water and demineralisation industries. Ion-exchange
membranes can also be used in the treatment and recycling of sewage water for reuse
within households and membrane reactors (Tanaka et al., 2012).
Figure 4: Recovery ratio (% of lithium recovered) achieved by electrodialysis (a) IL-i-
OM and (b) High-durability IL-i-OM. Modified from (Hoshino, 2013).

13
Ion-exchange membranes are a type of polymeric membrane in which the polymer
matrix has charged groups attached (Rottiers et al., 2015). Hoshino, (2013) used ionic
liquid impregnated organic membranes, IL-i-OM (Gore-TexTM) and high-durability
IL-i-OM (Nafion 324) membranes in order to recover lithium from sea water, the
recovery of unwanted minerals and the recovery of lithium was then calculated and
recorded. In Figure 4 it can be seen that the high-durability membrane recovered more
lithium in the same amount of time as opposed to the normal IL-i-OM. Nafion
membranes tend to have a high durability and have the ability to be subjected to harsh
environments while retaining their ion-exchange properties (O’Brien et al., 2005).
Anionic exchange membranes allow negatively charged ions to permeate through
the membrane as the groups attached to the polymer matrix within the membrane are
positively charged (Rottiers et al., 2015).
Mroczek et al., (2015) had originally purchased Nafion membranes, however they
had to cut them to shape and found that procedure to be tedious and inaccurate.
Instead, they were able to use a PCCell electrodialysis system that had an anionic and
cationic membrane provided.
Nie et al., (2017) utilized and Asahi Glass Selmion ASA anionic membrane to
allow for the anions in the feed solution to migrate through a 40 cell stack to the
anolyte.
Cationic exchange membranes allow positively charged ions to permeate the
membrane as the groups attached to the polymer matrix within the membrane are
negatively charged (Rottiers et al., 2015).
Hoshino, (2013) recovered the lithium in the form of lithium chloride. Later it was
stated that a cation exchange membrane was used in order to allow the lithium ions to

14
permeate through to the concentrate. An anon exchange membrane was used for the
chloride ions to permeate through using a 0.1M HCl solution.
A SELMIONTMCMV membrane allows cations, such as lithium to permeate
through to the cathode side of the cell. At the same time, it prevents ionic liquid and
water from permeating through to the concentrate (Hoshino, 2014).
2.3.1.2. Non-ionic membranes
Non-ionic membranes are membranes that do not require charged particles to
function, their selectivity is non-ion specific. Instead their permselectivity is based on
other traits such as particle or molecule size, organic or inorganic etc. Nanofiltration
membranes are a form of membrane that do not work in the same way as ion-
exchange membranes. Instead of allowing an ion of a specific charge to permeate the
membrane, monovalent ions are instead allowed to permeate through the membrane
while other multivalent ions are unable to permeate (Ge et al., 2015).
Figure 5: Nanofiltration membrane with monovalent ions permeating through the
membrane wall. Modified from (Ge et al., 2015).
Ultrafiltration membranes are another type of non-ion-exchange membrane that
have been used in electrodialysis cells. Serre et al., (2016) utilized an ultrafiltration

15
membrane to neutralize the organic acids that are retained in cranberry juice in an
attempt to reduce the acidity of the juice. This was explored, as raw cranberry juice is
too acidic to be deemed consumable by the market.
Carbon nanotube membranes have been used to purify saline water. These
membranes are being explored due to the depleting amount of fresh water that is in
existence and accessible at this point in time. Global warming is a big factor in the
ever-increasing contamination of fresh water with salts, as fresh water is vital in order
to produce food and other commodities such as lithium, it is important that other
means of desalination be explored (Das et al., 2013).
Figure 6: nanotube membrane technology in the desalination of water. Modified from
(Das et al., 2013).
The nanotubes are made from sheeted graphite that are subsequently rolled up into
a tube. When the sheets are rolled, they are either rolled singularly or rolled up with

16
multiple sheets to produce a nanotube with multiple layers. The water molecules will
pass through the nanotube membranes while the salts in the water will be retained
within the membrane (Das et al., 2013). However, as this type of membrane is
permselective only to water, its application in industry is limited to only water
purification until such time wherein other potential uses could be further investigated.
2.3.1.3. Bipolar Membranes
Bipolar Membranes comprise of two layers, a cationic- exchange and an anionic-
exchange layer. These features give the bipolar membranes the ability to split solvents
into their sub-part. For example, water can be split into H+ and OH- (Xu and Huang,
2008). However bipolar membranes are not limited to electrodialysis, they can be
utilized in food processing, food control and chemical or biochemical synthesis (Xu
and Huang, 2008).
Hwang et al., (2016), using a bipolar membrane, Neosepta BP-1 together in
alternating stacking with a cation-exchange membrane Neosepa CMX, was able to
produce hydroxyl and hydrogen ions. This is due to water splitting in the catalytic
layer occurring when voltage was applied to the system. The hydroxyl ions together
with the lithium ions within the feed solution then produce lithium hydroxide.
Ultrapure water production is a prime example of the ability for electrolysis and
electrodialysis to simplify a conventional process. See Figure 7, Figure 8 and Figure
9.

17
Figure 7: Flow sheet for the conventional production of ultra-pure water. Modified
from (Xu and Huang, 2008).
Figure 7 illustrates the conventional method in which ultra-pure water is produced.
Initially, the feed water is fed into microfiltration that is then passed through to the
softener and into a storage tank. The water then undergoes reverse osmosis before
going into a degasifying column. The water is then put through another round of
reverse osmosis and then into UV-sterilization. Once it has been sterilized, it’s put
through a mix-bed ion exchange and subsequently undergoes ultrafiltration to then be
stored and in-situ filtered to produce ultra-pure water.

18
Figure 8: Flow sheet for the production of ultra-pure water utilizing conventional
electrodialysis. Modified from (Xu and Huang, 2008).
Figure 8 depicts the process that is used to produce ultra-pure water utilizing
electrodialysis. Compared to Figure 7, this process is condensed, requiring fewer unit
operations such as ultrafiltration and in-situ filtration. The feed is pre-treated before
going into microfiltration and de-gassing. It is then UV- sterilized and put through
reverse osmosis, entering the final step of the process where the water is purified and

19
stripped of any salts by electrodialysis. The feed comes into the middle of the cell. As
can be seen in Figure 8, the chloride ions in the solution migrate towards the anode
and the sodium ions migrate towards the cathode. Within this particular cell, as shown
in Figure 8, there are 2 cationic-exchange membranes and 2 anionic-exchange
membranes. By having a second set of membranes within the cell, the chances of
impurities permeating the membranes into the concentrate are minimized.
Figure 9, fits into the flow sheet of Figure 8, however a bipolar membrane is
present in this particular cell. By having the bipolar membrane present, the voltage
drop in the system is minimized resulting in better energy efficiency (Xu and Huang.,
2008).
Figure 9: Flow sheet for the production of ultra-pure water utilizing electrodialysis
with a bipolar membrane. Modified from (Xu and Huang, 2008).

20
When using bipolar membranes in an electrodialysis system (BMED), gas
production is reduced, energy consumption of the system has added efficiency. The
installation and performance of the system are also increased. In addition, their
compact size makes them convenient and versatile in their application (Xu and
Huang., 2008). While bipolar membranes improve the performance of electrodialysis,
they also increase the cost of the system (Wang et al., 2010).
2.4. Electrolytic Solutions
The electrolytic solution in electrodialysis is the medium in which the ions travel
from the feed solution to the anode and the cathode through the membranes within the
electrodialysis cell. The electrolytic solution can be broken into two solutions known
as the catholyte and the anolyte.
In order for lithium ions to be liberated from lithium manganese oxide, they need
to be replaced with hydrogen ions, therefore hydrochloric acid was used in this
particular process. However, because of the characteristics of the bipolar membrane
used, water can also be used to produce lithium hydroxide. This is because the water
splitting within the catalytic layer of the membrane produced the hydroxyl ion and
hydrogen (Hwang et al., 2016).

21
Figure 10: Electrodialysis cell for the production of lithium hydroxide. Modified from
(Ying et al., 2008).
As can be seen in Figure 10, water was used along with a cationic and anionic
membrane. A 1.0 mol/L solution of lithium sulphate salt is placed in the cell between
the two membranes. The anolyte and the catholyte are both water, the sulphate ions in
the lithium salt permeates through the anionic membrane into the anolyte to produce
sulphuric acid and oxygen through oxidation. While the lithium ions will permeate the
cationic membrane to produce lithium hydroxide and hydrogen gas through reduction
(Ying et al., 2008).
2.4.1. Catholyte
In the case of a 3 or more compartment cell, the catholyte resides in the
compartment of the cell that the positively charged ion has permeated through the
membrane into. This is where the cation will migrate to and become most commonly
a hydroxide. Figure 10 illustrates this; the catholyte resides in the same compartment
of the electrodialysis cell as the cathode. This is also true of a 2-compartment
electrodialysis cell if the membranes being used are cationic. However, if the

22
membranes being used are anionic, then the cathode will be submerged in the original
salt solution, with an anionic membrane either side of the catalytic compartment. For
example, lithium sulphate is being used to produce sulphuric acid and lithium
hydroxide, with sulphuric acid being the main product of the process. The lithium
ions will stay within the catalytic compartment as they cannot permeate through the
anionic membranes and the sulphate ions will permeate through to the anolyte to react
and produce sulphuric acid (the concentrate).
2.4.2. Anolyte
The anolyte resides in the compartment of the anode; usually the anolyte within the
cell is the feed containing the lithium to be extracted from the lithium salt. For a 3-
compartment cell, the anolyte, the catholyte, the dilute and the concentrate would be
3-4 different solutions. The anolyte and the catholyte can be the same solution that
will react to produce two different solutions. For example, in Figure 10, the catholyte
and the anolyte are both H2O. However, in order for the water in the cell to become
sufficiently ionised to carry a charge in order to allow the process to eventuate, there
must be some lithium hydroxide already present in the catholyte. In this case some
sulphuric acid present in the anolyte. If this were a 2-compartment cell however, the
sulphuric acid would be produced within the dilute solution, in Figure 10, this
solution is labelled salt, as the anode would be submerged in the lithium sulphate
solution, thus making it the anolyte and already conductive.
2.5. Factors That Can Affect Efficiency
The voltage applied to the electrodialysis cell is the driving force of the entire
process. Direct voltage is applied to the system to drive the anions to the anode and
the cations to the cathode (Valero et al., 2011), as illustrated in Figure 11.

23
Figure 11: Electrodialysis cell with cationic and anionic movement of particles.
Modified from (Valero et al., 2011).
Direct current (DC) is used as this means that the current only flows in one
direction. Alternating current (AC) would result in the current being supplied to the
system would reverse periodically, therefore reversing the voltage in the system, and
there would not be a continuous current running through the system. Therefore, this
would have an effect on the transfer of the lithium ions.
While increasing the voltage of the system will increase the transfer rate of the
lithium within the cell, the membranes will be detrimentally affected by this increase
in power supply (Mroczek et al., 2015). Therefore, a balance between the voltage

24
supplied to the system and the degradation rates of the membranes must be optimized
in order to economically produce lithium ions.
Hoshino (2014) utilized a voltage of 2 V to concentrate the lithium ions to the
cathode side of the cell, allowing the concentration to increase with time. After 2
hours of this applied dialysis voltage, the concentration of lithium ions had reached
24.5% recovery. Another study found that a voltage 6.5 V per membrane, using a
bipolar membrane, with all flow rates of 0.44 mL/(cm2min) yielded extraction rates of
lithium manganese oxide to be approximately 70% (Hwang et al., 2016).
The pH of the initial salt solution is one of the factors that may have an effect on
the rate at which lithium will be transferred from the feed. With a lower pH, the rate
of transfer of lithium from the lithium salt was increased (Hwang et al., 2016).
Mroczek et al., (2015) observed that at a pH range of approximately 2-4, the optimal
transfer rates were achieved using a 3-membrane stack in an electrodialysis unit. The
highest transfer rate obtainable under these parameters was 0.28 mg/(hour.cm2).
Figure 12: Production of lithium hydroxide at varying current densities. Modified
from (Ying et al. 2008).
0
0.3
0.6
0.9
1.2
0 100 200 300 400
LiO
H C
on
cen
tra
tio
n (
mo
l/L
)
Time (min)
700 A/m^2
1000 A/m^2
1400 A/m^2
1800 A/m^2

25
Figure 13: Energy consumption (squares) and the current efficiency (circles) as
related to the current density. Modified from (Ying et al. 2008).
Figure 12 illustrates that higher current densities will improve the rate at which
lithium hydroxide is produced. However, increasing the current density results in
increasing the energy consumption, which will ultimately increase the cost of
production. As can be seen in Figure 13, 500 A/m2 was found to have the optimal
current density as there was a current efficiency of 80%.This current density also had
the lowest energy consumption for this particular experiment at 6 kWh/kg of lithium
hydroxide (Ying et al., 2008).
2.6. Conclusions and Recommendations
Whilst electrodialysis has been used and proven to work for multiple salts and
other processes, the electrodialysis of lithium sulphate to lithium hydroxide has not
been extensively covered. Lithium hydroxide has been produced in a 3-compartment
electrodialysis cell using lithium sulphate and water; see Figure 3 and Figure 10.
However, as the reaction between sulphate and water will produce sulphuric acid, this
0
3
6
9
12
15
0
20
40
60
80
100
400 800 1200 1600
En
erg
y C
on
sum
pti
on
(k
Wh
/k
g(L
iOH
))
Cu
rre
nt
efi
cie
ncy
(%
)
Current Density (A/m^2)
Current efficiecy
Energy consumption

26
adds some complication if a 2-compartment cell is being used. Sulphuric acid will be
produced within the anolyte compartment where the dilute solution is residing.
Considering this, the compartment that will retain the sulphuric acid must have the
ability to withstand the acidity of the sulphuric acid in the concentration at which it
will be produced. As the sulphuric acid would be produced while the dilute solution is
being split into lithium and sulphate ions, the process would need to be a batch
process as it would be burdensome to attempt to remove the sulphuric acid without
affecting the amount of lithium ions within the solution from permeating a cationic
membrane.
While water can be used as an electrolyte, more specifically, a catholyte, the
conductivity will be increased if a dilute solution of lithium hydroxide is used in order
to drive the process forward to produce lithium hydroxide from the lithium sulphate.
Membrane selection is a factor that will have an impact on the production of
lithium hydroxide, to what degree is unknown. Nafion membranes have been used in
the past and have been shown to be durable and effective (O’Brien et al., 2005;
Hoshino, 2013). However, bipolar membranes have also been becoming increasingly
popular in the electrodialysis field of study, their ability to increase the efficiency of
the system is an attractive feature that they offer, however they do not seem to
eliminate the need for any other ion-exchange membrane and may not work in a 2-
compartment electrodialysis cell.
The temperature at which the process is run will have an effect on the kinetics of
the system, however this has not been a factor researched to a great extent.
Temperature should therefore be varied in ongoing experiments to investigate
whether it has any effect on the production of lithium hydroxide and/or the efficiency
of the system. The temperature will also have an effect on the corrosive nature of the

27
sulphuric acid, which could detrimentally affect the membrane durability and the
analytic compartment within the cell.
Current density through the electrodes will also influence the production of lithium
hydroxide. Investigating how optimal current densities coincide with the optimal
temperature and voltage of the system and their effect on the current efficiency can
also be taken into consideration in future research of the production of lithium
hydroxide from lithium sulphate through the means of electrodialysis.
Future research should consist of lithium hydroxide being produced from lithium
sulphate. The temperature of the system should be explored in order to observe how it
influences the efficiency of the system, whether it has a positive or a negative effect
on the transfer of lithium ions through the cationic membranes and the production of
lithium hydroxide. The current density alongside the voltage supplied to the system
can also be manipulated to observe the effects of ion transfer across the membrane
and the production of lithium hydroxide. Different membranes can also be tested and
compared once the optimal parameters have been set in order to see if different
membranes produce better results in terms of the production of lithium hydroxide.

28
3. Chapter 3- Materials and Methods
Eleven experiments were carried out in this study. The first experiment was to
determine whether the electrodialysis cell would produce any lithium hydroxide when
run under normal conditions. Subsequent experiments were then carried out to
observe the effects of pH, the effect of the temperature, initial concentration and the
residence time within the cell.
3.1. Solution Preparation
Three solutions were prepared before each experiment. The first of the solutions is
the anolyte, which was made up of 5 wt.% of sulphuric acid. Measuring 102 gram of
98% concentrated sulphuric acid solution into a 2 L volumetric flask does this. The
solution is then made up with deionised water to the mark on the flask and thoroughly
mixed.
The next solution to be made is the catholyte, which also a 5 wt.% solution,
although this solution is made up of 5 wt.% lithium hydroxide monohydrate. 100
grams is measured into a 2 L volumetric flask and deionised water is then added to
sufficiently dissolve the material. Once dissolved, the solution is then made up with
deionised water to the mark on the volumetric flask and thoroughly mixed.
The final solution is the salt solution, which was made of 30 wt.% lithium
sulphate. This is made using either 349.17 g of lithium sulphate monohydrate, or 300
g of lithium sulphate. The lithium sulphate monohydrate is easier to dissolve than the
lithium sulphate.
When the materials were hard to dissolve, a stirrer bar was placed inside the
volumetric flask and left to dissolve on a hot plate set to stir. This could take multiple
days in the case of the lithium sulphate.

29
3.2. Analytical Methods
The concentration of the lithium present in each of the salt and catholyte samples
was determined using an Inductively Coupled Plasma Mass Spectrometry (ICP-MS)
machine. This was done by carrying out a 1,000,000 times dilution, 0.1 mL was
diluted into 10 mL for each sample, this was then repeated twice more.
The sulphate concentration both within the anolyte and the salt samples was
determined using Ion Chromatography. This was done by carrying out a 10,000 times
dilution by diluting 10 μL into 100 mL and then transferred into the instrument.
An acid-base titration was also carried out in order to determine the concentration
of acid produced within the anolyte. This was done using 0.1 M sodium hydroxide
(NaOH), a 1 mL sample of the anolyte (H2SO4) was placed in a beaker and diluted
with approximately 10 mL of deionized water. A pH meter was placed in the diluted
sample to read the pH. As the NaOH is added, the pH increased, when the pH
changed to read above 7, the amount of titrant was recorded. This was then used to
calculate the concentration of acid, the equations for this can be found in the
appendix.
Both the cell voltage and the cell current were measured and recorded at regular
sampling intervals with a multimeter that was clipped to the anode and cathode at the
top of the cell. The current and voltage on the power supply were also recorded at
these intervals.
An Hg/HgSO4 in 3 M K2SO4 reference electrode was used connected to a
multimeter to measure the cathodic and anodic potentials. The reference electrode
was immersed into a Luggin capillary, which was held close to the surface of the
immersed cathode and anode. The measurement was taken and recorded at every
sampling interval.

30
Three separate thermometers were submerged within each compartment of the cell
and the temperature was read and noted at every sampling interval.
3.3. Experimental Materials and Set-up
Each of the 11 experiments carried out using an electrodialysis cell consisting of 3
compartments all made of acrylic that is held together by silicone glue. The cell was
equipped with 2 membranes a Fumasep FAB-PK-103 anionic membrane and a
Fumasep FKB-PK-130 cationic membrane. The membranes are attached to the
middle compartment in circular windows on either side of the centred compartment,
the membranes are then held in place with nylon screws. Figure 53 (in Appendix)
shows the dimensions of the middle compartment of the cell. In order to prevent
leakage, or damage to the membrane, a rubber washer was used to separate the
membrane from the acrylic of the cell, and then another rubber washer was used
between the membrane and a silicone washer. This was all screwed into place tightly
to ensure no leakage. These membranes must be kept wet at all times and need to be
stored in deionised water when not in use.
Figure 54 (in Appendix), which can be found in the appendix, illustrates the
dimensions of the cell and the fixtures for the apparatus that is to go into the cell. The
height of the cell without the top covers is the same as the height of the middle cell,
17.3 cm. The middle compartment is capable of holding approximately 0.7 L while
the left and right compartments are capable of holding approximately 1.9 L each.
Figure 14 shows the experimental setup of the electrodialysis cell, the catholyte
resides in the left compartment of the cell, the salt resides in the middle compartment,
and the anolyte resides in the right compartment.

31
Figure 14: Front View of Electrodialysis cell

32
Figure 15: Top view of Electrodialysis cell
Figure 15 shows the top view of the electrodialysis cell and where all of the
apparatus is placed. Figure 55 shows a schematic of Figure 15. The apparatus consists
of:
Three condensers, which are placed in the back left opening of the left
compartment, the back opening of the middle compartment and the back right
opening of the right compartment.
Two aquarium heaters, which are placed in the openings below the condensers in
the left and right compartments of the cell.

33
Two temperature sensors, which are placed to the right and the left of the
aquarium heaters in the left and right compartments respectively.
Three thermometers, which are placed in the bottom left opening of the left
compartment, the bottom opening of the middle compartment and the bottom right
of the right compartment.
Two aeration tubes, placed in the back right of the left compartment and the back
left of the right compartment.
One N2 gas sparging tube placed into the middle opening of the middle chamber to
provide a cooling effect.
Two luggin capillaries, which are placed in the remaining openings beside the
anode and the cathode.
The cathode resides in the left compartment with the catholyte, while the anode
resides in the compartment with the anolyte, left and right compartments respectively
as seen in Figure 15 The cathode and the anode are made of titanium (Ti) mesh as can
be seen in Figure 16. The anode however, is coated in iridium oxide (IrO2).
Figure 16: Cathode

34
The entire experimental setup can be seen in Figure 17. The power supply, placed
below the fume hood is connected to the anode and cathode; the anode is connected to
the positive output while the cathode is connected to the negative output. The
aquarium heaters are both connected to the controllers to the right of Figure 17 with
the control for the pump to the aerator sitting on top of the aquarium controllers. The
pump to the aerators can be seen in Figure 14 and Figure 15 behind the cell. Tubing is
run from the bath around the cell to syphon water out from the ice bath to maintain
the temperature of the cell.
Figure 17: Experimental Setup

35
3.4. Experimental Method
Table 2 summarises all of the operating conditions for all experiments 1-11.
Experiment 1 was the preliminary experiment in which the experiment was conducted
under the standard conditions as a base line. This involved a pH of 2, a temperature
range of 20-30 °C, an initial lithium sulphate concentration of 30 wt.% with a
residence time of 4 hours at a current of 3 A.
Experiments 2 and 3 were conducted with the initial salt solution’s pH altered to
11 and 7 respectively. Experiments 4 and 5 were conducted with elevated
temperatures, while experiments 6, 7 and 8 were conducted with the initial salt
concentration decreased. Finally experiments 9, 10 and 11 were conducted to
determine what affect the residence time within the cell had on the recovery of
lithium hydroxide.
Table 2: Operating conditions for each experiment
Experiment
ID No.
pH Temperature
range (°C)
Salt (Li2SO4)
concentration
(wt.%)
Residence
time (hour)
Current
(A)
1 2 20-30 30 4 3
2 11 20-30 30 4 3
3 7 20-30 30 4 3
4 2 35-45 30 4 3
5 2 50-60 30 4 3
6 2 20-30 15 4 3
7 2 20-30 10 4 3
8 2 20-30 5 4 1.8-2.7
9 2 20-30 30 2 3
10 2 20-30 30 4 3
11 2 20-30 30 8 3
3.4.1. Preliminary Experiment
The electrodialysis cell was set up as shown in Figure 17. For each experiment, 1 L
of 5 wt.% LiOH solution was added to the left compartment of the cell and 1 L of 5

36
wt.% H2SO4 solution was added to the right compartment. The Li2SO4 salt solution
was added to the middle compartment in a quantity of 0.4 L at 30 wt.%. Before
setting the power source, the water was turned on to run through the condensers and
the pump was turned on for the aeration to provide sufficient mixing of the solutions.
The power supply, a galvanostat, was then set to output a constant current at its
maximum of 3 amperes. The power supply and the timer were simultaneously started
and the first samples were taken. Samples of 3 mL are taken at 30-minute intervals
from each compartment of the cell. Measurements are also taken and recorded at
these intervals; the current and the voltage being displayed on the power supply were
recorded along with the measured value taken from a multimeter. The anodic and
cathodic potentials were also recorded along with the temperature from each
compartment of the cell.
Throughout the duration of the experiment the temperature needed to be monitored
and kept within the 20-30°C range. In order to do this, ice was placed in a bath around
the cell. To prevent the cell from possible cooling, the aquarium heaters were being
set to 25°C. As the ice melted within the bath, the water was syphoned out. The level
of the middle salt compartment also needed to be monitored, as the level of the
solution had to sit above the membrane window. This was done by adding deionised
water to top up the compartment at each sampling interval.
When the cell had run for 4 hours the final samples and measurements were taken
and recorded before the power supply is turned off. Once the power supply had been
turned off, along with all of the pumps, water and heaters, the apparatus, apart from
the aerators, was removed from the cell and washed. The remaining solution was then
taken out by reversing the pumps on the aerators and bottled. The cell is then
thoroughly rinsed and filled with deionised water to maintain the membranes.

37
3.4.2. pH Alteration
A 2 M solution of LiOH-H2O was made up by dissolving 8.4 g of LiOH-H2O into
100 mL of deionised water in a volumetric flask. This solution was then used to
increase the pH of the Li2SO4 salt solution while it was in the cell and being mixed by
the N2 gas sparging and monitored by a pH meter. Once the pH reached 11 for
experiment 2 and pH 7 for experiment 3, the experiments were run in the same way as
experiment 1 under the conditions stated in Table 2.
3.4.3. Temperature
For experiment 4, before the power supply output was set, the aquarium heaters
were set to 40°C and the solution was left to heat to this temperature. Once the outer
compartments of the cell had reached this temperature, the power supply was set and
the experiment was run under the conditions stated in Table 2.
Experiment 5 required additional heating in order to get the anolyte and catholyte
to 60°C. The solutions were first placed in beakers on hotplates and heated to 60°C as
it would take the aquarium heaters too long to reach this temperature at that volume.
Once the solutions had reached the desired temperature they were placed in the cell in
their corresponding compartments and the experiment was run under the conditions
stated in Table 2.
At these temperatures the lithium sulphate would precipitate into the end of the N2
gas sparging tube. A pair of tweezers and deionised water was used to flush out the
blockage and keep the salt within the salt compartment of the cell.
3.4.4. Initial Concentration of Li2SO4
Solutions of 15 wt.%, 10 wt.% and 5 wt.% Li2SO4 were made up by dissolving 75
g of Li2SO4 salt into 500 mL of deionised water, 50 g of Li2SO4 salt into 500 mL of
deionised water and 25 g of Li2SO4 salt into 500 mL of deionised water respectively

38
for experiments 6,7 and 8. These experiments were then run under the conditions
stated in Table 2. Experiment 8 was unable to run at a current of 3 amperes, and the
current needed to be reduced as the concentration of the Li2SO4 salt reduced within
the middle compartment.
3.4.5. Residence Time
Experiments 9, 10 and 11 were run in the same way as the initial experiment, as
stated in Table 2 however the sampling times were different. In experiment 9, samples
and measurements were taken and recorded every 20 minutes in order to provide
enough data points for a 2-hour test. Experiment 10 had samples and measurements
taken every half an hour as per the previous tests, and experiment 11 samples and
measurements were taken every hour in order to avoid too many samples.

39
4. Chapter 4- Results and Discussion
4.1. Preliminary Experiment
The initial experiment was conducted in order to identify whether lithium
hydroxide could be produced from lithium sulphate by bath electrodialysis. Ying et
al., (2008) previously found that using a continuous method of electrodialysis, lithium
hydroxide and sulphuric acid can be produced from lithium sulphate salt.
Figure 18 Concentration of lithium within the salt and catholyte chambers,
experiment 1: preliminary
Figure 18 illustrates that the concentration of lithium within the salt solution
gradually decreases over time while the lithium concentration within the catholyte
chamber is increasing. This indicates that lithium hydroxide is being produced within
the catholyte chamber, confirming that electrodialysis is a potential method for
producing lithium hydroxide. The lithium present in the salt decreased from 36.84 g/L
to 30.11 g/L and the catholyte lithium concentration increased from 7.68 g/L to 10.01
g/L.
0
5
10
15
20
25
30
35
40
0 0.5 1 1.5 2 2.5 3 3.5 4 4.5Lit
hu
m i
Co
nm
cen
tra
tio
n (
g/
L)
Time (hours)
Catholyte
Salt

40
Figure 19: Concentration of sulphate within the anolyte and salt chambers,
experiment 1: preliminary
Figure 19 shows that there is a steady increase of sulphate within the anolyte
chamber. As for the salt chamber, it appears that there were some disturbances during
the sample assay, but the overall trend depicts that the sulphate within the salt
chamber has decreased while the anolyte chamber has increased. The anolyte consists
of sulphuric acid, a by-product of this particular system that could later be
concentrated and sold in practical application of this system. The sulphate within the
anolyte increased from 2.55 g/L to 4.32 g/L while the salt decreased from 28.45 g/L
to 22.35 g/L.
0
5
10
15
20
25
30
35
0 1 2 3 4
Lit
hu
m i
Co
nm
cen
tra
tio
n (
g/
L)
Time (hours)
Anolyte
Salt

41
Figure 20: Cell voltage, anodic and cathodic potentials, experiment 1: preliminary
Figure 20 shows that over time, the anodic and cathodic potentials remained
similar for the duration of the experiment. The cell voltage decreased throughout the
course of the experiment, while throughout the experiment the cell ran at a consistent
current this would imply that the resistance within the cell is decreasing in keeping
with Ohm’s law. This is due to the increase in ionic conductivity as a result of the
increased concentrations of lithium and sulphate ions in both the anolyte and
catholyte chambers.
The current density of this system can be calculated using the surface area of the
anode. The anode having dimensions of 64 mm x88 mm x1 mm has a surface area
without the diamond voids of 11,504 mm2. The diamonds are 9 across and 9 down on
the anode and give a total space of 166 mm2. The total of the diamond shaped voids
was then calculated to be 2,988 mm2. The rest of the empty area of the anode that did
not have a total diamond shape to it (refer to Figure 16 is 28 mm2 therefore the total
0
2
4
6
8
10
12
14
16
18
0 0.5 1 1.5 2 2.5 3 3.5 4 4.5
Po
ten
tia
l (V
)
Time (hours)
Cell Voltage
Cathode Potential
Anode Potential

42
void within the mesh of the anode is 3,016 mm2. The total active anode area is then
calculated by:
∑ 𝐴 = ∑ 𝐴𝑎𝑛𝑜𝑜𝑑𝑒 𝑠𝑢𝑟𝑓𝑎𝑐𝑒 − 2 ∑ 𝐴𝑣𝑜𝑖𝑑 𝑖𝑛 𝑚𝑒𝑠ℎ + ∑ 𝐴𝑖𝑛𝑠𝑖𝑑𝑒 𝑑𝑖𝑎𝑚𝑜𝑛𝑑𝑠 − ∑ 𝐴 𝑏𝑎𝑠𝑒
= 11,504 – (3,016 × 2) + (166 × 26 × 1) – (64 × 0.5 × 1)
=8,096 mm2
Using this, a current of 10 A would result in a current density of 125 mA/cm2. And
applied current of 3 A gives 37.1 mA/cm2, which converts to 371 A/m2.
The amount of salt transferred in terms of lithium during this experiment was 0.36
mole this was calculated using equation (9) (Ying et al., 2008).
𝑛𝐿𝑖(𝑇𝑟𝑎𝑛𝑠𝑓𝑒𝑟𝑟𝑒𝑑) = (𝐶𝐿𝑖,𝑡 × 𝑉𝐿𝑖,𝑡) − (𝐶𝐿𝑖,0 × 𝑉𝐿𝑖,0) (9)
Where CLi,t is the concentration of lithium in the final catholyte sample, CLi,0 is the
concentration of lithium in the initial catholyte sample, VLi,t is the final volume of the
catholyte and VLi,0 is the initial volume of the catholyte.
Using the moles of lithium transferred and equation (10), the current efficiency (ŋ)
can be calculated:
𝐶𝑢𝑟𝑟𝑒𝑛𝑡 𝐸𝑓𝑓𝑖𝑐𝑖𝑒𝑛𝑐𝑦 (ŋ) = 𝑛𝐿𝑖𝐹
𝐼𝑡× 100 (10)
Here F is Faraday’s constant, I is the current applied to the cell and t is the duration
of the experiment in seconds. For experiment 1, the current efficiency in relation to
lithium transfer from the salt to the catholyte was 80%.
Table 14, which can be found in the appendix, shows the mass balance for
experiment 1. The concentration of lithium was determined by Inductively Coupled
Plasma Mass Spectrometry (ICP-MS), while the concentration of sulphate was
determined by Ion Chromatography (IC). 98.74% of the lithium was accounted for
within the experimental data, the remaining 1.26% could be due to lithium hydroxide
and lithium sulphate precipitating onto the equipment in small quantities or

43
evaporation of lithium sulphate and lithium hydroxide solution from the catholyte and
the salt compartments of the cell. The salt compartment tended to run slightly hotter
than the other two compartments within the cell. This is due to its smaller volume of
solution held within the compartment.
Table 3: Mass transfer and recovery, experiment 1: preliminary
Lithium Sulphate
g % g %
Mass transferred from salt 3.14 19.2 2.77 22.8
Li Recovery in catholyte 2.48 17.3 - -
Recovery in anolyte - - 1.67 14.9
g/h g/h
Average Transfer Rate 0.66 0.53
Table 3 depicts the transfer and recovery of both lithium and sulphate within the
system. 17.3% of the total lithium within the original salt solution was recovered into
the catholyte. 14.9% of the sulphate was recovered in the anolyte from the original
salt solution. The transfer rates in Table 3 refer to the rate of transfer of the lithium
and sulphate through the cationic and anionic membranes into the catholyte and
anolyte respectively.
4.2. Effect of pH
Experiments 2 and 3 were run in order to observe the impact that the pH of the
lithium sulphate solution would have on the recovery of lithium in the form of lithium
hydroxide from the catholyte compartment. Experiments 2 was run at a pH of 11 and
experiment 3 was run at a pH of 7 under the conditions as stated in Table 2.

44
Figure 21 Concentration of lithium within the catholyte and salt chambers,
experiment 2: pH 11
Figure 22: Concentration of lithium within the catholyte and salt chambers,
experiment 3: pH 7
Figure 21 and Figure 22 illustrate the increase in concentration within the catholyte
chamber in experiments 2 and 3, respectively, and the decrease in the lithium
concentration within the salt chambers. Experiment 2 saw the salt concentration
reduced from 30.53 g/L to 18.44 g/L while the lithium concentration increased from
6.74 g/L to 8.22 g/L. Experiment 3 shows that the concentration within the salt
0
5
10
15
20
25
30
35
0 0.5 1 1.5 2 2.5 3 3.5 4 4.5Lit
hu
m C
on
mce
ntr
ati
on
(g
/L
)
Time (hours)
Catholyte
Salt
0
5
10
15
20
25
30
35
40
0 1 2 3 4 5
Lit
hu
m C
on
mce
ntr
ati
on
(g
/L
)
Time (hours)
Catholyte
Salt

45
chamber went from 33.40 g/L to 27.85 g/L and the lithium concentration in the
catholyte chamber increased from 7.75 g/L to 9.74 g/L. This data suggests that a
change in pH does not overwhelmingly influence the increase in lithium concentration
within the catholyte.
Figure 23: Concentration of sulphate within the anolyte and salt compartments,
experiment 2: pH 11
Figure 24: Concentration of sulphate within the anolyte and salt compartments,
experiment 3: pH 7
Figure 23 and Figure 24 illustrate the increase in concentration within the anolyte
chamber in experiments 2 and 3, respectively, and the decrease in the sulphate
concentration within the salt chambers. Experiment 2 saw that the salt concentration
0
5
10
15
20
25
30
0 1 2 3 4 5
Su
lph
ate
Co
nm
cen
tra
tio
n (
g/
L)
Time (hours)
Anolyte
Salt
0
5
10
15
20
25
30
0 0.5 1 1.5 2 2.5 3 3.5 4 4.5Lit
hu
m C
on
cen
tra
tio
n (
g/
L)
Time (hours)
Anolyte
Salt

46
decreased from 26.75 g/L to 19.49 g/L while the sulphate concentration increased
from 2.91 g/L to 5.05 g/L within the anolyte chamber. Experiment 3 shows that the
concentration within the salt chamber changed from 23.58 g/L to 19.87 g/L and the
sulphate concentration in the anolyte chamber increased from 4.04 g/L to 4.94 g/L.
Figure 25: Cell voltage, anodic and cathodic potentials, experiment 2: pH 11
Figure 26: Cell voltage, anodic and cathodic potentials, experiment 3: pH 7
0
2
4
6
8
10
12
14
16
18
0 0.5 1 1.5 2 2.5 3 3.5 4 4.5
Po
ten
til
(V)
Time (hours)
Cell Voltage
Cathodic potential
Anode potential
0
2
4
6
8
10
12
14
16
18
0 0.5 1 1.5 2 2.5 3 3.5 4 4.5
Po
ten
til
(V)
Time (hours)
Cell Voltage
Cathodic potential
Anode potential

47
The cell voltage and the electrode potentials differ very slightly between the
experiments run at different pH. This is shown in Figure 25 and Figure 26. There was
a greater voltage drop across the cell throughout the duration of the test run at pH 7.
Again this data suggests that there is a drop in resistance over time within the cell in
compliance with Ohms law. However, there was a greater drop in resistance when
running at a pH of 7 than there was when running at a pH of 11.
The number of moles of lithium transferred in experiment 2, 0.22 moles is less
than the number of moles transferred in experiment 3, 0.29 moles. Both of these tests
also had a lesser transfer of moles of lithium across the membrane than experiment 1,
which had 0.36 moles transfer across the membrane from the salt chamber into the
catholyte. These numbers also correspond to the current efficiency, the lower the
number of moles that transfer, the lower the current efficiency. Experiment 2 had a
current efficiency of 49% and experiment 3 had a current efficiency of 64%, both
lower than the 80% current efficiency that was found in experiment 1.
Table 4: Mass transfer and recovery, experiment 2: pH 11
Lithium Sulphate
g % g %
Mass transferred from salt 5.07 39.3 3.15 27.1
Li Recovery in catholyte 1.53 13.0 - -
Recovery in anolyte - - 1.98 19.1
g/h g/h
Average Transfer Rate 0.77 0.60
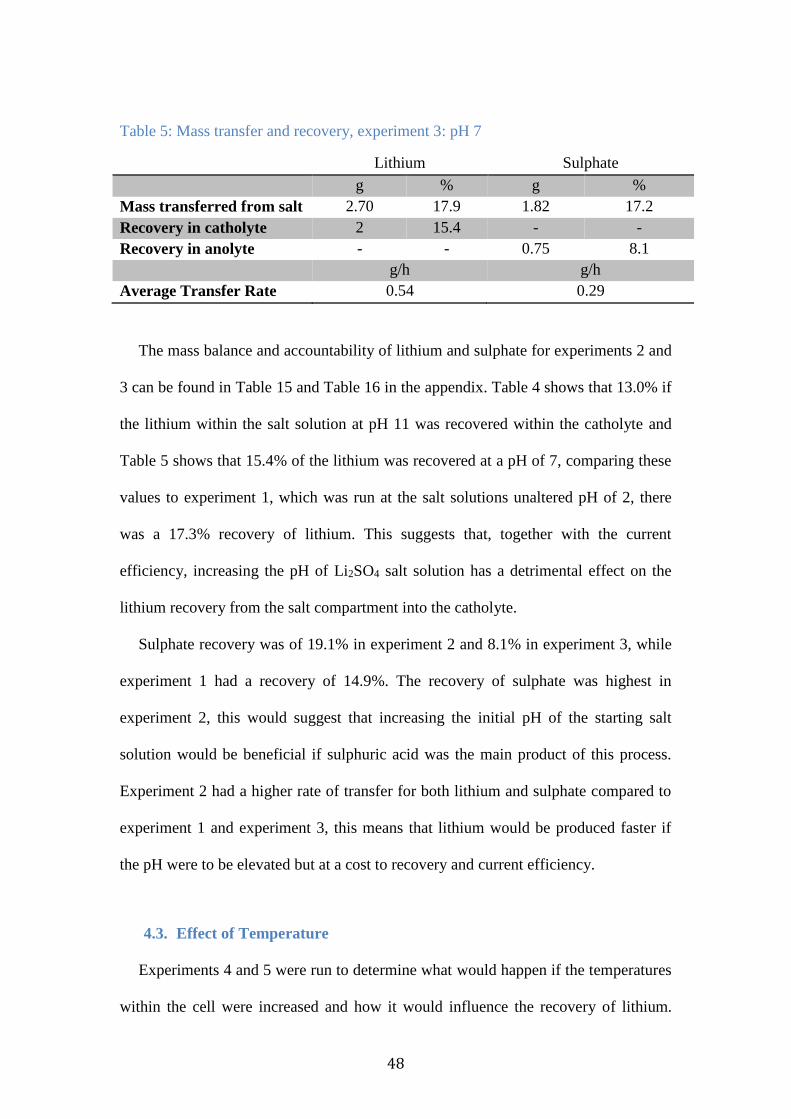
48
Table 5: Mass transfer and recovery, experiment 3: pH 7
Lithium Sulphate
g % g %
Mass transferred from salt 2.70 17.9 1.82 17.2
Recovery in catholyte 2 15.4 - -
Recovery in anolyte - - 0.75 8.1
g/h g/h
Average Transfer Rate 0.54 0.29
The mass balance and accountability of lithium and sulphate for experiments 2 and
3 can be found in Table 15 and Table 16 in the appendix. Table 4 shows that 13.0% if
the lithium within the salt solution at pH 11 was recovered within the catholyte and
Table 5 shows that 15.4% of the lithium was recovered at a pH of 7, comparing these
values to experiment 1, which was run at the salt solutions unaltered pH of 2, there
was a 17.3% recovery of lithium. This suggests that, together with the current
efficiency, increasing the pH of Li2SO4 salt solution has a detrimental effect on the
lithium recovery from the salt compartment into the catholyte.
Sulphate recovery was of 19.1% in experiment 2 and 8.1% in experiment 3, while
experiment 1 had a recovery of 14.9%. The recovery of sulphate was highest in
experiment 2, this would suggest that increasing the initial pH of the starting salt
solution would be beneficial if sulphuric acid was the main product of this process.
Experiment 2 had a higher rate of transfer for both lithium and sulphate compared to
experiment 1 and experiment 3, this means that lithium would be produced faster if
the pH were to be elevated but at a cost to recovery and current efficiency.
4.3. Effect of Temperature
Experiments 4 and 5 were run to determine what would happen if the temperatures
within the cell were increased and how it would influence the recovery of lithium.
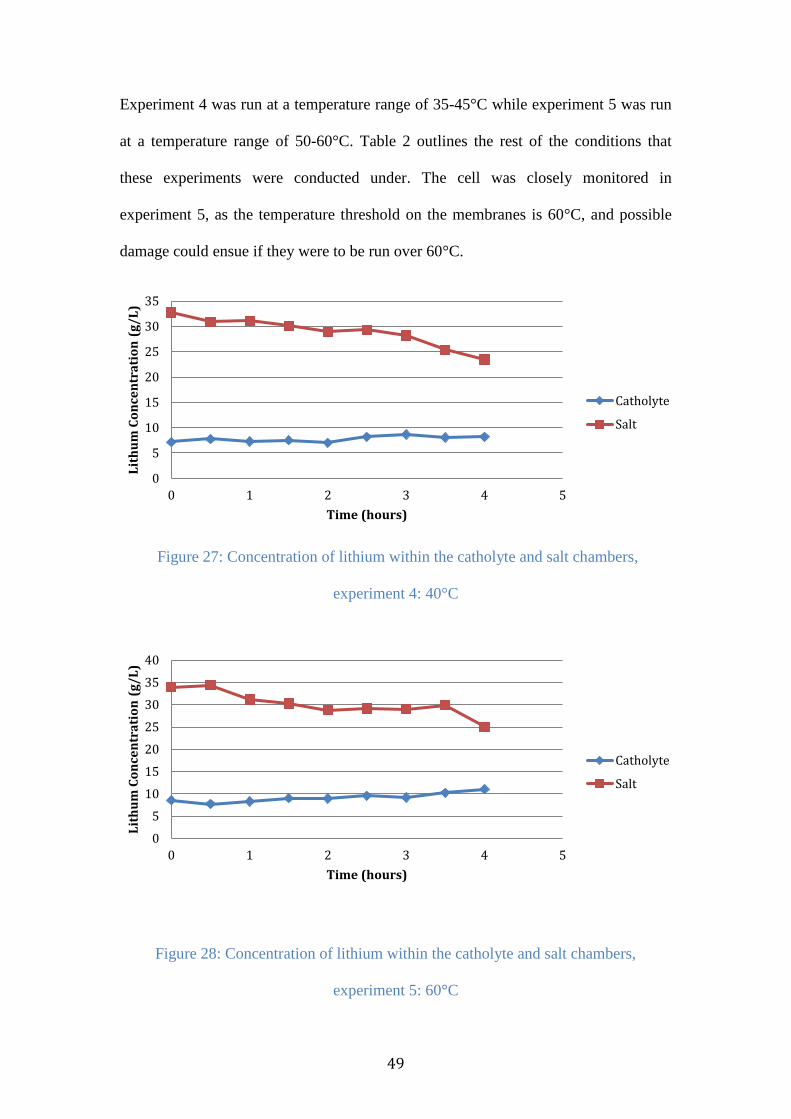
49
Experiment 4 was run at a temperature range of 35-45°C while experiment 5 was run
at a temperature range of 50-60°C. Table 2 outlines the rest of the conditions that
these experiments were conducted under. The cell was closely monitored in
experiment 5, as the temperature threshold on the membranes is 60°C, and possible
damage could ensue if they were to be run over 60°C.
Figure 27: Concentration of lithium within the catholyte and salt chambers,
experiment 4: 40°C
Figure 28: Concentration of lithium within the catholyte and salt chambers,
experiment 5: 60°C
0
5
10
15
20
25
30
35
0 1 2 3 4 5
Lit
hu
m C
on
cen
tra
tio
n (
g/
L)
Time (hours)
Catholyte
Salt
0
5
10
15
20
25
30
35
40
0 1 2 3 4 5
Lit
hu
m C
on
cen
tra
tio
n (
g/
L)
Time (hours)
Catholyte
Salt

50
Figure 27 and Figure 28 show the change in concentration within the salt and
catholyte chambers in experiments 4 and 5 respectively. Experiment 4 saw the lithium
concentration decrease in the salt cell from 32.75 g/L to 23.48 g/L and experiment 5
saw the salt chamber change from 33.92 g/L to 24.99 g/L. The catholyte chamber in
experiment 4 increased in the lithium concentration from 7.18 g/L to 8.23 g/L and
experiment 5 had the lithium concentration increase from 8.54 g/L to 11.00 g/L in the
catholyte chamber. This suggests that elevating the temperature from 40°C to 60°C
increased the concentration slightly in the catholyte.
Figure 29: Concentration of sulphate within the anolyte and salt compartments,
experiment 4: 40°C
0
5
10
15
20
25
0 1 2 3 4 5Su
lph
ate
Co
nce
ntr
ati
on
(g
/L
)
Time (hours)
Anolyte
Salt

51
Figure 30: Concentration of sulphate within the anolyte and salt compartments,
experiment 5: 60°C
Figure 29 and Figure 30 illustrate the increase in concentration within the anolyte
chamber in experiments 4 and 5 respectively and the decrease in the sulphate
concentration within the salt chambers. Experiment 4 saw the salt concentration
reduce from 22.59 g/L to 19.42 g/L while the sulphate concentration increased from
23.78 g/L to 5.06 g/L. Experiment 3 shows that the concentration within the salt
chamber went from 22.63 g/L to 18.27 g/L and the sulphate concentration in the
catholyte chamber increased from 3.83 g/L to 4.89 g/L. In comparison to the graphs,
there is not much effect in the increase in concentration of sulphate within the anolyte.
0
5
10
15
20
25
0 1 2 3 4 5Su
lph
ate
Co
nce
ntr
ati
on
(g
/L
)
Time (hours)
Anolyte
Salt

52
Figure 31: Cell voltage, anodic and cathodic potentials, experiment 4: 40°C
Figure 32: Cell voltage, anodic and cathodic potentials, experiment 5: 60°C
Figure 31 and Figure 32 show that the anodic and cathodic potentials for
experiments 4 and 5 are relatively similar. However, there is a greater voltage drop in
experiment 5 at the higher temperature of 60°C, suggesting that there is less resistance
within the cell at a higher temperature. Ionic conductivity between the chambers
would naturally increase with elevated temperature.
0
2
4
6
8
10
12
14
16
0 0.5 1 1.5 2 2.5 3 3.5 4 4.5
Po
ten
tia
l (V
)
Time (hours)
Cell Voltage
Cathode Potential
Anode Potential
0
2
4
6
8
10
12
14
16
0 0.5 1 1.5 2 2.5 3 3.5 4 4.5
Po
ten
tia
l (V
)
Time (hours)
Cell Voltage
Cathode Potential
Anode Potential

53
The number of moles transferred from the salt to the catholyte was greater in
experiment 5 than in experiment 4. Experiment 5 has 0.21 moles of lithium transfer
across the membrane into the catholyte while experiment 4 had 0.15 moles transfer.
When compared to experiment 1 though, with a transfer of 0.36 moles, it seems to
suggest that increasing the temperature of the system is detrimental. Experiment 4 had
a current efficiency of 34% while experiment 5 had an increased current efficiency of
48%, however these current efficiencies are not great compared to experiment 1
where the current efficiency was 80%. This would suggest that the increase in
temperature is uneconomical as it hinders the transfer of lithium ions yet also
decreases the current efficiency.
Table 17 and Table 18 in the appendix, show the mass balances for experiments 4
and 5 respectively. The accountability for lithium in both of these experiments is
lower compared to that of the other experiments. This is due to the lithium sulphate
beginning to precipitate at 40°C, some of the solid salt was then lost when flushed out
of the N2 gas sparging tubing, where the bulk of the precipitation occurred, as it was
preventing the gas from cooling and mixing within the camber and had to be
removed. Lithium sulphate precipitating in the salt chamber is an issue, as the solid
cannot pass through the membrane, therefore making the process inefficient.

54
Table 6: Mass transfer and recovery, experiment 4: 40°C,
Lithium Sulphate
g % g %
Mass transferred from salt 4.38 31.7 1.82 18.1
Recovery in catholyte 1.05 8.2 - -
Recovery in anolyte - - 1.05 12.0
g/h g/h
Average Transfer Rate 0.64 0.33
Table 7: Mass transfer and recovery, experiment 5: 60°C,
Lithium Sulphate
g % g %
Mass transferred from salt 4.41 30.7 2.36 24.2
Recovery in catholyte 1.48 11.2 - -
Recovery in anolyte - - 0.901 10.2
g/h g/h
Average Transfer Rate 0.69 0.38
Table 6 and Table 7 show that when the cell is run at 40°C 8.2% of the lithium
within the salt is recovered into the catholyte, while at 60°C this recovery is increased
to 11.2% suggesting that an increase in temperature from 40°C to 60°C is beneficial
when trying to increase recovery of the lithium material. These two recoveries are
both still lower, however, than that of experiment 1 at 14.9% which seems to suggest
a detrimental effect from operating at elevated cell temperature. Table 6 and Table 7
also show that when the temperature is increased from 40°C to 60°C, that the rate of
transfer is increased, however the rate of transfer is only lightly faster in experiment 5
than it is in experiment 1.
4.4. Effect of Starting Concentration
The impact that the initial concentration of the salt solution has on the recovery of
lithium is tested in experiments 6, 7 and 8. Experiment 6 had the salt concentration

55
reduce from 30 wt.% to 15 wt.%, in experiment 7 the concentration was further
reduced to 10 wt.%, and in experiment 8 the concentration was again reduced to 5
wt.% lithium sulphate. Table 2 outlines the rest of the operating conditions that
experiments 6, 7 and 8 were conducted under.
Figure 33: Concentration of lithium within the catholyte and salt chambers,
experiment 6: 15 wt.%
0
2
4
6
8
10
12
14
16
18
20
0 0.5 1 1.5 2 2.5 3 3.5 4 4.5
Lit
hu
m C
on
cen
tra
tio
n (
g/
L)
Time (hours)
Catholyte
Salt

56
Figure 34: Concentration of lithium within the catholyte and salt chambers,
experiment 7: 10 wt.%
Figure 35: Concentration of lithium within the catholyte and salt chambers,
experiment 8: 5 wt.%
Figure 33, Figure 34 and Figure 35 show the concentration of lithium within the
catholyte and the salt compartments in the cell over time. Experiment 6 shows that the
lithium centration within the salt decreases from 17.07 g/L to 10.78 g/L while the
0
2
4
6
8
10
12
14
0 0.5 1 1.5 2 2.5 3 3.5 4 4.5
Lit
hu
m C
on
cen
tra
tio
n (
g/
L)
Time (hours)
Catholyte
Salt
0
1
2
3
4
5
6
7
8
9
10
0 0.5 1 1.5 2 2.5 3 3.5 4 4.5
Lit
hu
m C
on
cen
tra
tio
n (
g/
L)
Time (hours)
Catholyte
Salt

57
catholyte increases from 7.60 g/L to 9.29 g/L. Experiment 7 shows that the lithium
concentration within the salt decreases from 11.90 g/L to 6.28 g/L and the catholyte
increased from 7.32 g/L to 8.67 g/L. Finally, in experiment 8, the lithium
concentration decreases in the salt from 5.92 g/L to 1.08 g/L and increases from 7.21
g/L to 9.01 g/L in the catholyte. From these graphs, it is clear that the test run at 5
wt.% has the largest increase in concentration within the catholyte chamber.
Figure 36: Concentration of sulphate within the anolyte and salt compartments,
experiment 6: 15 wt.%
0
2
4
6
8
10
12
0 1 2 3 4 5Su
lph
ate
Co
nce
ntr
ati
on
(g
/L
)
Time (hours)
Anolyte
Salt

58
Figure 37: Concentration of sulphate within the anolyte and salt compartments,
experiment 7: 10 wt.%
Figure 38: Concentration of sulphate within the anolyte and salt compartments,
experiment 8: 5 wt.%
Figure 36 shows the concentrations of the anolyte and salt chambers for sulphate in
experiment 6. The salt chamber in experiment 6 decreases from 10.57 g/L to 7.43 g/L
while the anolyte chamber increases from 3.91 g/L to 5.29 g/L. Figure 37 shows the
concentrations of the anolyte and the salt chambers for experiment 7, where the
0
1
2
3
4
5
6
7
8
0 0.5 1 1.5 2 2.5 3 3.5 4 4.5
Su
lph
ate
Co
nce
ntr
ati
on
(g
/L
)
Time (hours)
Anolyte
Salt
0
0.5
1
1.5
2
2.5
3
3.5
4
4.5
5
0 0.5 1 1.5 2 2.5 3 3.5 4 4.5
Su
ph
ate
co
nce
ntr
ati
on
(g
/L
)
Time (hours)
Anolyte
Salt

59
original concentration of the salt was 10 wt.% Li2SO4. The figure shows that the
initial salt concentration was 6.92 g/L that then decreased to 3.82 g/L. The anolyte
chamber initially started at 3.54 g/L but increased to 4.56 g/L. Figure 38 illustrates the
increasing concentration of the anolyte chamber, 3.69 g/L to 4.55 g/L, and the
decreasing concentration of the salt chamber, 3.08 g/L to 1.07 g/L in experiment 8.
From these graphs, the increase in sulphate concentration within the anolyte is
relatively similar in each experiment. This suggests that decreasing the initial
concentration of the lithium sulphate salt solution could have a positive effect on the
increase in concentration of lithium while there is not an obvious negative effect on
the sulphate concentration.
Figure 39: Cell voltage, anodic and cathodic potentials, experiment 6: 15 wt.%
0
2
4
6
8
10
12
14
16
18
0 0.5 1 1.5 2 2.5 3 3.5 4 4.5
Po
ten
tia
l (V
)
Time (hours)
Cell Voltage
Cathode Potential
Anode Potential

60
Figure 40: Cell voltage, anodic and cathodic potentials, experiment 7: 10 wt.%
Figure 41: Cell voltage, anodic and cathodic potentials, experiment 8: 5wt.%
Figure 39, Figure 40 and Figure 41 illustrate the cell voltages and the potentials of
experiments 6-8. Experiments 7 and 8 initially decreased in cell voltage, but later on
began to increase, more so for experiment 8. This suggests an increase in resistance,
or a restriction of ion manoeuvrability therefore creating resistance within the cell. As
the ions begin to decrease in the salt compartment, there is less conductivity within
that compartment. In experiment 8, the applied current had to be repeatedly lowered
0
2
4
6
8
10
12
14
16
18
0 0.5 1 1.5 2 2.5 3 3.5 4 4.5
Po
ten
tia
l (V
)
Time (hours)
Cell Voltage
Cathode potential
Anode Potential
0
5
10
15
20
25
0 0.5 1 1.5 2 2.5 3 3.5 4 4.5
Po
ten
tia
l (V
)
Time (hours)
Cell Voltage
Cathode Potential
Anode Potenial

61
as the concentration decreased within the salt cell to prevent the voltage passing
through the cell from increasing uncontrollably.
The molar transfer of lithium for experiments 6, 7 and 8 were 0.24 moles, 0.2
moles and 0.26 moles respectively. The lower concentration allowed for more lithium
molar transport across the membrane from the salt compartment to the catholyte.
These values correspond to a current efficiency of 54% for experiment 6, 45% for
experiment 7 and 75% for experiment 8.
Table 19, Table 20 and Table 21 show the mass balance and accountability for
lithium and sulphate from experiments 6, 7 and 8 respectively. The accountability for
each of these experiments is relatively high. The small loss of lithium and sulphate
could be due to precipitation.
Table 8: Mass transfer and recovery, experiment 6: 15 wt.%
Lithium Sulphate
g % g %
Mass transferred from salt 2.70 37.7 1.38 30.7
Recovery in catholyte 1.18 17.8 - -
Recovery in anolyte - - 1.23 30.0
g/h g/h
Average Transfer Rate 0.46 0.31
Table 9: Mass transfer and recovery, experiment 7: 10 wt.%
Lithium Sulphate
g % g %
Mass transferred from salt 2.34 47.7 1.29 45.3
Recovery in catholyte 1.40 30.4 - -
Recovery in anolyte - - 0.59 22.1
g/h g/h
Average Transfer Rate 0.45 0.23

62
Table 10: Mass transfer and recovery, experiment 8: 5 wt.%
Lithium Sulphate
g % g %
Mass transferred from salt 1.95 81.6 0.74 58.2
Recovery in catholyte 1.83 80.8 - -
Recovery in anolyte - - 0.58 49.1
g/h g/h
Average Transfer Rate 0.46 0.16
Table 8, Table 9 and Table 10 show that the recovery of lithium from the salt
solution to the catholyte drastically increased from 17.8% in experiment 6 to 30.4% in
experiment 7 and finally to 80.8% in experiment 8, as the concentration of the initial
salt solution is decreased. However, the mass transfer rates are relatively the same
within these three experiments, they are however, slower than that of experiment 1.
These concentrations are a more accurate representation of what might be used in
industry as initial concentrations.
4.5. Effect of Residence Time
Experiments 9, 10 and 11 were conducted in order to determine what the impact
residence time within the cell has on the recovery of lithium. Experiment 9 was run
for 2 hours, experiment 10 was run for 4 hours and experiment 11 was run for 8
hours, the conditions at which these tests were run can be found in Table 2.

63
Figure 42: Concentration of lithium within the catholyte and salt chambers,
experiment 9: 2 hours
Figure 43: Concentration of lithium within the catholyte and salt chambers,
experiment 10: 4 hours
0
5
10
15
20
25
30
35
40
0 0.5 1 1.5 2 2.5
Lit
hu
m C
on
cen
tra
tio
n (
g/
L)
Time (hours)
Catholyte
Salt
0
5
10
15
20
25
30
35
40
0 0.5 1 1.5 2 2.5 3 3.5 4 4.5
Lit
hu
m C
on
cen
tra
tio
n (
g/
L)
Time (hours)
Catholyte
Salt

64
Figure 44: Concentration of lithium within the catholyte and salt chambers,
experiment 11: 8 hours
Figure 42, Figure 43 and Figure 44 depict the concentrations of lithium within the
salt and the catholyte in experiments 9, 10 and 11 respectively. In experiment 9, the
lithium concentration decreased in the salt chamber from 33.25 g/L to 29.68 g/L and
the catholyte increased from 6.89 g/L to 8.29 g/L. Experiment 10 ran for 2 hours
longer than experiment 9 and the salt went from 33.25 g/L to 2.64 g/L and the
catholyte went from 6.89 g/L to 9.12 g/L. Finally, experiment 11 ran for a total of 8
hours and the concentration within the salt compartment went from 33.25 g/L to 19.03
g/L while the catholyte increased from 6.89 g/L to 10.93 g/L. From these graphs it is
evident that there is an increase in lithium concentration within the catholyte.
0
5
10
15
20
25
30
35
40
0 1 2 3 4 5 6 7 8
Lit
hu
m C
on
cen
tra
tio
n (
g/
L)
Time (hours)
Catholyte
Salt

65
Figure 45: Concentration of sulphate within the anolyte and salt compartments,
experiment 9: 2 hours
Figure 46: Concentration of sulphate within the anolyte and salt compartments,
experiment 10: 4 hours
0
5
10
15
20
25
0 0.5 1 1.5 2 2.5
Su
lph
ate
co
nce
ntr
ati
on
Time (hours)
Anolyte
Salt
0
5
10
15
20
25
0 0.5 1 1.5 2 2.5 3 3.5 4 4.5
Su
lph
ate
Co
nce
ntr
ati
on
(g
/L
)
Time(hours)
Anolyte
Salt

66
Figure 47: Concentration of sulphate within the anolyte and salt compartments,
experiment 11: 8 hours
Figure 45, Figure 46 and Figure 47 show the concentration of sulphate in
experiments 9, 10 and 11 respectively. In experiment 9, the salt concentration within
the salt compartment decreased from 22.78 g/L to 20.61 g/L and the sulphate within
the anolyte increased from 3.72 g/L to 4.17 g/L. Experiment 10, which is depicted in
Figure 46, shows that the concentration of sulphate further decreases from 22.78 g/L
to 19.01 g/L and that the sulphate within the anolyte further increases from 3.72 g/L
to 4.83 g/L. Finally, Figure 47, which shows the sulphate concentration for
experiment 11 that was run for 8 hours. The salt decreased more in this experiment
from 22.78 g/L to 17.86 g/L, and the anolyte increased further from 3.72 to 5.65 g/L.
These graphs clearly show that with an increase in residence time within the cell,
there is a notable increase in the concentration of sulphate.
0
5
10
15
20
25
0 1 2 3 4 5 6 7 8
Su
lph
ate
Co
ncn
tra
tio
n (
g/
L)
Time (hours)
Anolyte
Salt

67
Figure 48: Cell voltage, anodic and cathodic potentials, experiment 9: 2 hours
Figure 49: Cell voltage, anodic and cathodic potentials, experiment 10: 4 hours
0
2
4
6
8
10
12
14
16
18
20
0 0.5 1 1.5 2 2.5
Po
ten
tia
l (V
)
Time (hours)
Cell Voltage
Cathode Potential
Anode Potential
0
2
4
6
8
10
12
14
16
18
20
0 0.5 1 1.5 2 2.5 3 3.5 4 4.5
Po
ten
tia
l (V
)
Time (hours)
Cell Voltage
Cathode Potential
Anode Potential

68
Figure 50: Cell voltage, anodic and cathodic potentials, experiment 11: 8 hours
Figure 48, Figure 49 and Figure 50 show the cell voltage and potentials for
experiments 9, 10 and 11 respectively. The cell voltage initially decreases in
experiment 9 and then gradually increases over the 2 hours, while the voltage overall
decreases in experiments 10 and 11.
With an increase in residence time, there is an increase in molar transfer.
Experiment 9 had 0.20 moles transfer with a current efficiency of 90%, experiment 10
had 0.32 moles transfer at a current efficiency of 72% and experiment 11 had 0.58
moles transfer at a current efficiency of 65%. It can be deduced, that with an increase
in time, there is a decrease in current efficiency.
0
2
4
6
8
10
12
14
16
18
20
0 0.5 1 1.5 2 2.5 3 3.5 4 4.5 5 5.5 6 6.5 7 7.5 8 8.5
Po
ten
tia
l (V
)
Time (hours)
Cell Voltage
Cathode Potential
Anode Potential

69
Table 11: Mass transfer and recovery, experiment 9
Lithium Sulphate
g % g %
Mass transferred from salt 1.82 13.2 1.14 11.7
Recovery in catholyte 1.40 10.6 - -
Recovery in anolyte - - 0.33 3.7
g/h g/h
Average Transfer Rate 0.79 0.17
Table 12: Mass transfer and recovery, experiment 10
Lithium Sulphate
g % g %
Mass transferred from salt 4.26 29.8 1.76 18.1
Recovery in catholyte 2.24 17.4 - -
Recovery in anolyte - - 0.95 10.7
g/h g/h
Average Transfer Rate 0.76 0.32
Table 13: Mass transfer and recovery, experiment 11
Lithium Sulphate
g % g %
Mass transferred from salt 5.93 42.2 2.20 20.9
Recovery in catholyte 4.05 31.7 - -
Recovery in anolyte - - 1.76 20.1
g/h g/h
Average Transfer Rate 0.59 0.45
Table 11, Table 12 and Table 13 show the mass transfer of lithium and sulphate
with their respective recoveries for experiments 9,10 and 11. These tables indicate
that, with an increase in time, there is an increase in recovery. Experiment 9 had a
lithium recovery of 10.6%, experiment 10 had a recovery of 17.4% for lithium and
experiment 11 had a lithium recovery of 31.7%. But when comparing the lithium
mass transfer rates, over time the mass transfer decreases significantly.

70
In terms of the sulphate, the recovery roughly doubles each time with a doubling in
residence time within the cell. In experiment 9, the recovery for sulphate was 3.7%;
this is after 2 hours within the cell. In experiment 10, the residence time doubles from
2 hours to 4 hours and the recovery for sulphate more than doubles to 10.7%. Finally,
in experiment 11, the residence time within the cell doubles again and the recovery
for sulphate is 20.1%, roughly doubled again.
4.6. General Discussion
Figure 51 shows the recovery of lithium with the corresponding current
efficiency from each experiment. From this graph is can be deduced that experiment
8, where the initial starting concentration of the Li2SO4 salt was lowered to 5 wt.%,
had the highest recovery of lithium within the catholyte chamber. This particular
experiment also had a significant current efficiency in the transfer of lithium from the
salt compartment to the anolyte.
The highest current efficiency was found in experiment 9, where the cell was
only run for 2 hours. This indicates that the lithium transfer from the salt chamber to
the catholyte chamber was fast during the run time of the cell, however, there is a
poor lithium recovery at this retention time.
Experiment 11 was run for 8 hours, and Figure 51 shows that this test had the
highest recovery for lithium out of all of the tests that began at a concentration of 30
wt.% Li2SO4. When compared to experiment 1 and 10, the recovery was more than
doubles with only a minor loss in current efficiency within the cell.

71
Figure 51: Current efficiency and the lithium recovery of experiments 1-11.
Figure 52: Lithium hydroxide and sulphuric acid production rates from each test
0
10
20
30
40
50
60
70
80
90
100
1 2 3 4 5 6 7 8 9 10 11
%
Experiment no.
Current efficiency
Lithium Recovery
0
0.5
1
1.5
2
2.5
1 2 3 4 5 6 7 8 9 10 11
g/
h
Experiment no.
LiOH production rate
H2SO4 production rate

72
Figure 52 shows the production rates of each experiment for both lithium
hydroxide and sulphuric acid. It can be seen, that experiment 9, where the cell was
run for 2 hours under conditions outlined in Table 2, had the fastest rate of production
for lithium hydroxide at 2.29 g/h of lithium hydroxide being produced. Experiment 1,
conducted under conditions outlined in Table 2, also yielded a relatively high rate of
production and from Figure 51 had a higher recovery of lithium than experiment 9,
however, the current efficiency for experiment 9 was greater than that of experiment
1.
Experiments 10 and 11 also produced relatively high rates of lithium hydroxide
production, these experiments were run for 4 and 8 hours respectively under the
conditions outlined in Table 2.

73
5. Chapter 5- Conclusion and Recommendations
This study aimed to determine whether it was possible to produce lithium
hydroxide from lithium sulphate salt through the means of electrodialysis using a 2
membrane, 3 compartment cell. It was found, that in reduced concentrations of the
initial lithium sulphate salt, that the recovery of lithium as lithium hydroxide within
the catholyte compartment of the cell was maximised. It was also found that the rate
of production of lithium hydroxide was at its fastest when the cell was run for a
shorter time period. However, in running the cell for longer, the recovery of lithium
was increased.
The residence time within the cell was found to have a significant impact on the
recovery of lithium as lithium hydroxide within the catholyte compartment of the cell.
The longer the cell ran for, the recovery of lithium increased, however the current
efficiency deteriorated, and the transfer of lithium ions through the cationic
membrane slowed over time. However, it was observed that a doubling of residence
time leads to a doubling in the recovery of lithium as lithium hydroxide, with less
than a 10% decrease to the current efficiency.
It is recommended, that changing the pH of the initial pH solution of the lithium
sulphate should not be done, as it has detrimental effects on both the recovery of
lithium as lithium hydroxide and the current efficiency of the system. Similarly, this
process is recommended to be carried out at room temperature in order to achieve
maximum results. At elevated temperatures, technical issue with the lithium sulphate
precipitating in the salt chamber results in less lithium ions available to migrate
through the cationic membrane to produce lithium hydroxide. Likewise, there is less
sulphate ions available to pass through the anionic membrane to produce sulphuric

74
acid. Running the cell at elevated temperatures also significantly reduce the current
efficiency of the system.
5.1. Future Work
It is recommended that different membrane pairs be experimented with in order to
observe the effects of their permiselectivity and the resulting purity of the lithium
hydroxide produced. Different membrane pairs may also influence the recovery of the
lithium within the catholyte. It may be necessary to install more than one membrane
pair to obtain greater purity of the final product.
The addition of impurities into the lithium sulphate salt should also be
experimented with in order to observe their effects on the production of lithium
hydroxide in situation when the salt is not pure. The migration of impurities to the
catholyte should, ideally, be minimised in the production of lithium hydroxide for
commercial use.

75
6. References
Ball, Donald L and Daniel A.D. Boatang. 1987.Method for the Recovery of Lithium
from Solutions by Electrodialysis. US4636295A.
Buckley, David, J. David Genders and Dan Atherton. 2011. Method of Making High
Purity Lithium Hydroxide and Hydrochloric Acid. US2011/0044882A1.
Daintith, John, ed. 2008. Oxford Dictionary of Chemistry. 6th ed. Oxford University
Press
Dakota Minerals. 2017. Lithium uses.
https://www.dakotaminerals.com.au/lithium/lithium-uses (Accessed:
15/6/2017)
Das, Rasel, Md. Eaqub Ali, Sharifah Bee Abd Hamid, Seeram Ramakrishna and Zara
Zaman Chowdhury. 2013. “Carbon nanotube membranes for water purification:
A bright future in water desalination.” Desalination 336: 97-109
http://dx.doi.org/10.1016/j.desal.2013.12.026.
Evans, R. Keith. 2008. An Abundance of Lithium.
http://citeseerx.ist.psu.edu/viewdoc/download?doi=10.1.1.363.1242&rep=rep1
&type=pdf.
Ge, Liang, Bin Wu, Qiuhua Li, Yaqin Wang, Dongbo Yu, Liang Wu, Jiefeng Pan,
Jibin Miao and Tongwen Xu. 2015. “Electrodialysis with nanofiltration
membrane (EDNF) for high-efficiency cations fractionation” Journal of
Membrane Science 498: 192-200.
http://dx.doi.org/10.1016/j.memsci.2015.10.001.
Hoshino, Tsuyoshi. 2013. Preliminary Studies of Lithium Recovery Technology from
Seawater by Electrodialysis using ionic Liquid Membrane. Japan: Elsevier B.V.
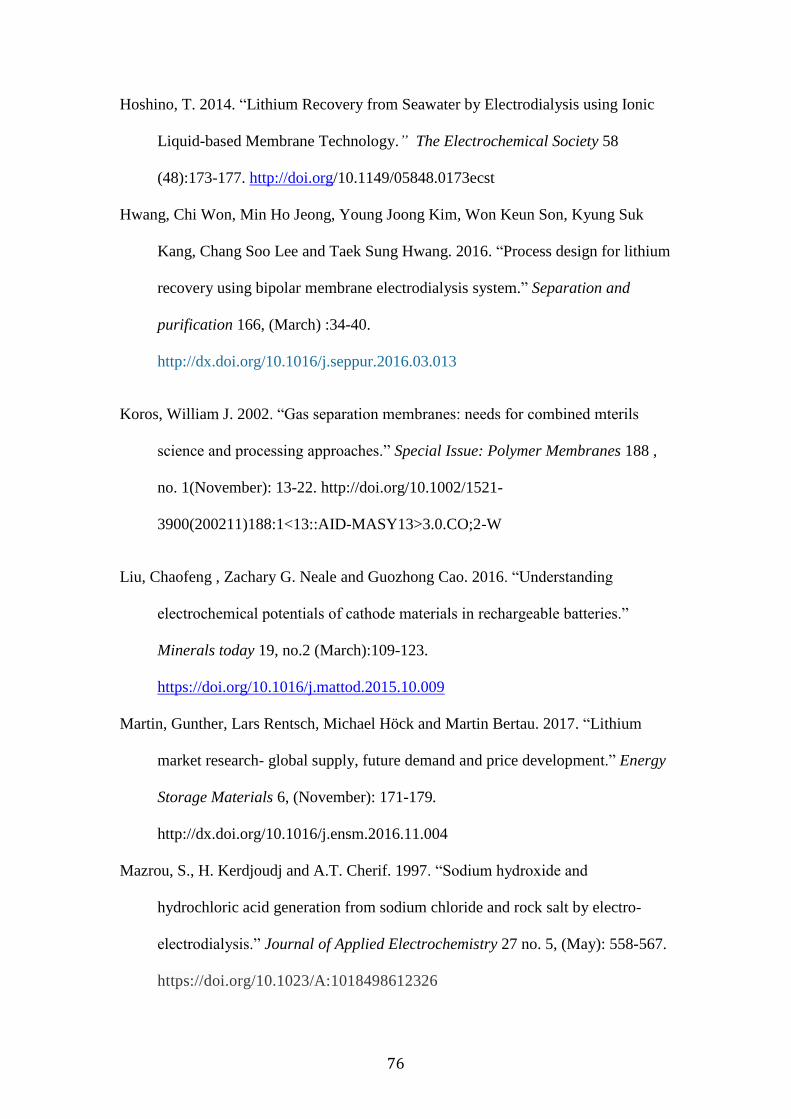
76
Hoshino, T. 2014. “Lithium Recovery from Seawater by Electrodialysis using Ionic
Liquid-based Membrane Technology.” The Electrochemical Society 58
(48):173-177. http://doi.org/10.1149/05848.0173ecst
Hwang, Chi Won, Min Ho Jeong, Young Joong Kim, Won Keun Son, Kyung Suk
Kang, Chang Soo Lee and Taek Sung Hwang. 2016. “Process design for lithium
recovery using bipolar membrane electrodialysis system.” Separation and
purification 166, (March) :34-40.
http://dx.doi.org/10.1016/j.seppur.2016.03.013
Koros, William J. 2002. “Gas separation membranes: needs for combined mterils
science and processing approaches.” Special Issue: Polymer Membranes 188 ,
no. 1(November): 13-22. http://doi.org/10.1002/1521-
3900(200211)188:1<13::AID-MASY13>3.0.CO;2-W
Liu, Chaofeng , Zachary G. Neale and Guozhong Cao. 2016. “Understanding
electrochemical potentials of cathode materials in rechargeable batteries.”
Minerals today 19, no.2 (March):109-123.
https://doi.org/10.1016/j.mattod.2015.10.009
Martin, Gunther, Lars Rentsch, Michael Höck and Martin Bertau. 2017. “Lithium
market research- global supply, future demand and price development.” Energy
Storage Materials 6, (November): 171-179.
http://dx.doi.org/10.1016/j.ensm.2016.11.004
Mazrou, S., H. Kerdjoudj and A.T. Cherif. 1997. “Sodium hydroxide and
hydrochloric acid generation from sodium chloride and rock salt by electro-
electrodialysis.” Journal of Applied Electrochemistry 27 no. 5, (May): 558-567.
https://doi.org/10.1023/A:1018498612326

77
Mroczek, Ed, Gaetano Dedual, Duncan Graham and Lew Bacon. 2015. Lithium
Extraction from Wairakei Geothermal Fluid using Electrodialysis. Melbourne:
Proceedings World Geothermal Congress.
https://pangea.stanford.edu/ERE/db/WGC/papers/WGC/2015/39000.pdf
Nie, Xiao-Yao, Shu-Ying Sun, Xingfu Song and Jian-Guo Yu. 2017. “Further
investigation into lithium recovery from salk lake brines with different feed
characteristics by electrodialysis.” Journal of Membrane Science 530, (May):
185-191. http://dx.doi.org/10.1016/j.memsci.2017.02.020
O’Brien, Thomas F., Tilak V.Bommaraju and Fumio Hine. 2005. Handbook of Chlor-
Alkali Technology Volume I: Fundamentals. New York: Springer Science +
Business Media Inc.
Reahl, Eugene. R. 2006. Half a Century of Desalination With Electrodialysis.
https://pdfs.semanticscholar.org/5391/c71537ced99f87e457413e9fb38776dc4ab
c.pdf
Rottiers, T., G De la Marche , B.Van der Bruggen and L Pinoy . 2015. “Co-ion fluxes
of simple inorganic ions in electrodialysis metathesis and conventional
electrodialysis.” Journal of Membrane Science 492, (October): 263-270.
http://dx.doi.org/10.1016/j.memsci.2015.05.066
Royal Society of Chemistry. 2017. Periodic table, Lithium.
http://www.rsc.org/periodic-table/element/3/lithium (Accessed: 20/4/2017)
Serre, Elodie, Elodie Rozoy, Karine Pedneault, Stella Lacour and Laurent Bazinet.
2016. “Deacidification of cranberry juice by electrodialysis: Impact of
membrane types and configurations on acid migration and juice

78
physicochemical characteristics.” Separation and Purification Technology 163,
(May):228-237. http://dx.doi.org/10.1016/j.seppur.2016.02.044
Sharma, Yatendra. 2016. Production of lithium hydroxide. CA 2966525 A1.
https://encrypted.google.com/patents/CA2966525A1?cl=en
Sociedad Minera Salar de Atacama.1999. Production of Lithium Carbonate from
Brines. US5993759 A. https://www.google.com/patents/US5993759
Tahil, William. 2007. The Trouble with Lithium. http://www.meridian-int-
res.com/Projects/Lithium_Problem_2.pdf
Tanaka, Yoshinobu, Seung-Hyeon Moon, Victor V.Nikonenko and Tongwon Xu.
2012. “Ion-Exchange Membranes.” International Journal of Chemical
Engineering 2012, (August): 1-3.http://doi.org/10.1155/2012/906952
Unites States Geological Survey. 2017. Mineral Commodity Summaries: Lithium.
https://minerals.usgs.gov/minerals/pubs/commodity/lithium/mcs-2017-lithi.pdf
Valero, Fernando, Angel Barcelo and Ramon Arbos. 2011. Electrodialysis
Technology- Theory and Applications. Desalination, Trends and Technologies.
Michael Schorr (ed.), ISBN:978-953-307-311-8, InTech. Available from:
http://www.intechopen.com/books/desalination-trends-and-
technologies/electrodialysistechnology-theory-and-applications
Ying, Xu, Wang Xiaolin, Chen Feiguo and Yu Lixin. 2008. “Preparation of lithum
hydroxide from lithium sulphate in a three- compartment membrane
electrodialysis system.” ProQuest Dissertations & Theses Global (1026937088),
http://libproxy.murdoch.edu.au/login?url=http://search.proquest.com/docview/1
026937088?accountid=12629
Wang, Yaoming, Xu Zhang and Tongwen Xu. (2010). “integration of conventional
electrodialysis and electrodialysis with bipolar membranes for production

79
of organic acids.” Journal of Mmbrane Science 365 (1-2): 294-301
https://doi.org/10.1016/j.memsci.2010.09.018
Warburton, Simon. 2016. “FMC triples lithium hydroxide production.” MLA 8.
http://www.todaysmotorvehicles.com/article/fmc-lithium-expansion-
electric-vehicles-battery-052416/ (Accessed 13/7/2017)
Xu, Tongwen and Chuanhui Huang. (2008). “Electrodialysis- Based Separation
Technologies: A Critical Review.” AIChE Journal 54, (12) : 3147-3159.
http://doi.org/10.1002/aic.11643

80
7. Appendix Equations for determining the concentration of sulphate from the acid-base titration:
Moles of NaOH used:
𝑁𝑁𝑎𝑂𝐻 = 𝑇𝑖𝑡𝑟𝑎𝑛𝑡 𝑣𝑜𝑙𝑢𝑚𝑒 (𝐿) × 𝑀𝑜𝑙𝑎𝑟𝑖𝑡𝑦 𝑜𝑓 𝑇𝑖𝑡𝑟𝑎𝑛𝑡 (4)
𝐻2𝑆𝑂4 + 2𝑁𝑎𝑂𝐻 → 2𝐻2𝑂 + 𝑆𝑂42− + 2𝑁𝑎 (5)
∴ 1 𝑚𝑜𝑙 𝑜𝑓 𝐻2𝑆𝑂4 𝑡𝑜 2 𝑚𝑜𝑙 𝑜𝑓 𝑁𝑎𝑂𝐻
Moles of H2SO4:
𝑁𝐻2𝑆𝑂4=
𝑁𝑁𝑎𝑂𝐻
2= 𝑁𝑆𝑂4
(6)
Equation 3 depicts that the number of moles of sulphate within the acid is a
stoichiometric ratio of 1:1 so the number of moles of acid is equal to the number of
moles of sulphate within the 1 mL sample.
𝐶𝑆𝑂4(𝑚𝑜𝑙 𝐿⁄ ) =
𝑁𝑆𝑂4
0.001 (7)
𝐶𝑆𝑂4(𝑔 𝐿⁄ ) = 𝐶𝑆𝑂4
(𝑚𝑜𝑙 𝐿⁄ ) × 𝑀𝑆𝑂4 (8)

81
Figure 53 Middle compartment of electrodialysis cell
10.4 cm
4 cm
17.3 cm
5 cm
6.5 cm
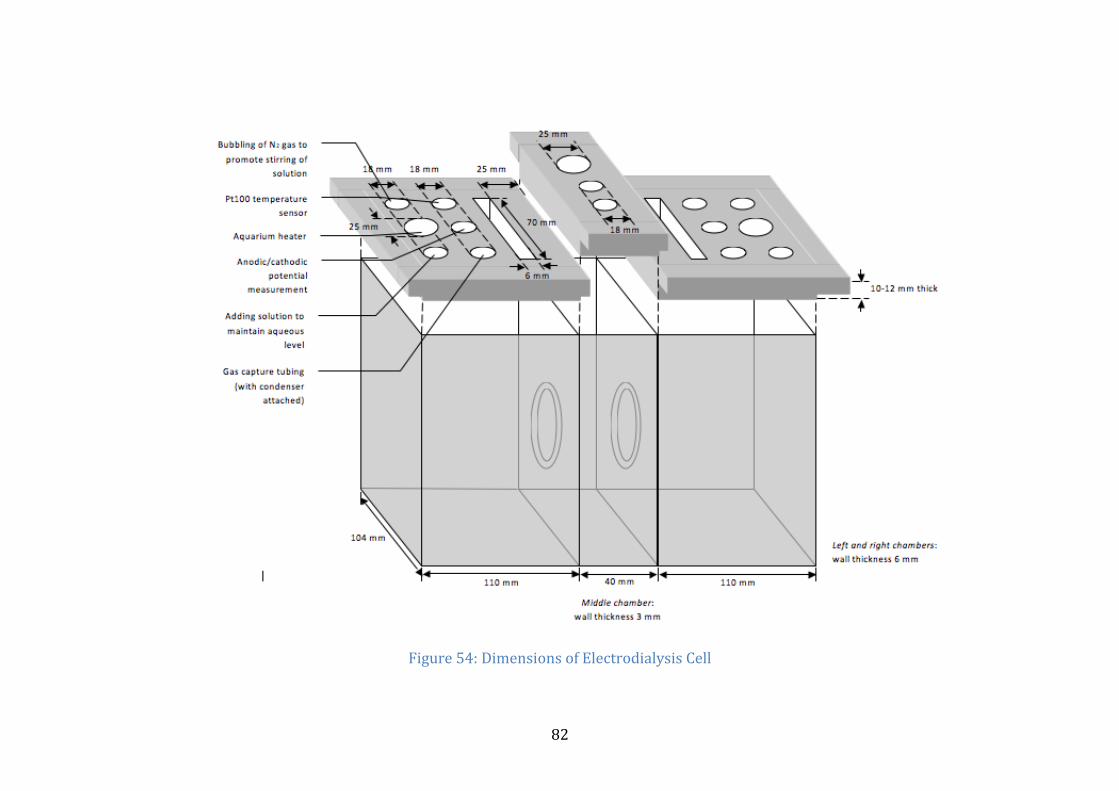
82
Figure 54: Dimensions of Electrodialysis Cell

83
Figure 55 Apparatus placement within the electrodialysis cell

84
Table 14: System mass balance, experiment 1: preliminary.
Lithium
Initial
Concentration (g/L) Volume (L) Mass of Lithium
(g) Salt 36.84 400 14.74 Catholyte 7.68 1000 7.68
Total 22.41 Final Salt 30.12 385 11.59
Catholyte 10.01 1015 10.16 Total 21.75
Mass lost due to sampling 0.38
Mass unaccounted for 0.28 Deviation (%) 1.26 Accountability (%) 98.74
Sulphate Initial Concentration (g/L) Volume (mL) Mass of Sulphate
(g)
Salt 28.45 400 11.38 Anolyte 2.55 1000 2.55 Total 13.93
Final Salt 22.35 385 8.61 Anolyte 4.32 978 4.22
Total 12.83 Mass lost due to sampling 0.23 Mass unaccounted for 0.879
Deviation (%) 6.41 Accountability (%) 93.58

85
Table 15: System mass balance, experiment 2: pH 11
Lithium
Initial Concentration (g/L) Volume (L) Mass of Lithium
(g) Salt 30.53 400 12.21
Catholyte 6.74 1000 6.74 Total 18.95 Final Salt 18.44 387 7.14 Catholyte 8.22 1007 8.27
Total 15.41
Mass lost due to sampling 0.45 Mass unaccounted for 3.09 Deviation (%) 16.70
Accountability (%) 83.30 Sulphate
Initial
Concentration (g/L) Volume (mL) Mass of Sulphate
(g) Salt 26.75 400 10.70 Anolyte 2.914 1000 2.914
Total 13.61
Final Salt 19.49 387 7.54 Anolyte 5.05 969 4.89
Total 12.44 Mass lost due to sampling 0.35 Mass unaccounted for 0.83
Deviation (%) 6.24 Accountability (%) 93.76

86
Table 16: System mass balance, experiment 3: pH 7
Lithium
Initial Concentration (g/L) Volume (L) Mass of Lithium
(g) Salt 33.40 400 13.36
Catholyte 7.75 1000 7.75 Total 21.11 Final Salt 27.85 383 10.67 Catholyte 9.74 1001 9.75
Total 20.41
Mass lost due to sampling 0.36 Mass unaccounted for 0.34 Deviation (%) 1.62
Accountability (%) 98.38 Sulphate
Initial
Concentration (g/L) Volume (mL) Mass of Sulphate
(g) Salt 23.58 400 9.43 Anolyte 4.04 1000 4.04
Total 13.47
Final Salt 19.87 383 7.61 Anolyte 4.98 962 4.79
Total 12.41 Mass lost due to sampling 0.24 Mass unaccounted for 0.83
Deviation (%) 6.28 Accountability (%) 93.71

87
Table 17: System mass balance, experiment 4: 40°C
Lithium
Initial Concentration (g/L) Volume (L) Mass of Lithium
(g) Salt 32.75 400 13.10
Catholyte 7.18 1000 7.18 Total 20.28 Final Salt 23.48 371.5 8.27 Catholyte 8.23 1000 8.23
Total 16.95
Mass lost due to sampling 0.33 Mass unaccounted for 3.00 Deviation (%) 15.03
Accountability (%) 84.97 Sulphate
Initial
Concentration (g/L) Volume (mL) Mass of Sulphate
(g) Salt 22.59 400 9.04 Anolyte 3.78 1000 3.78
Total 12.82
Final Salt 19.42 371.5 7.21 Anolyte 5.05 952 4.83
Total 12.05 Mass lost due to sampling 0.23 Mass unaccounted for 0.53
Deviation (%) 4.21 Accountability (%) 95.78

88
Table 18: System mass balance, experiment 5: 60°C
Lithium
Initial
Concentration (g/L) Volume (L) Mass of Lithium
(g) Salt 33.92 400 13.57 Catholyte 8.54 1000 8.54
Total 22.10 Final Salt 24.99 366.5 9.16
Catholyte 10.23 979 10.02 Total 19.18
Mass lost due to sampling 0.35
Mass unaccounted for 2.57 Deviation (%) 11.82 Accountability (%) 88.18
Sulphate Initial Concentration (g/L) Volume (mL) Mass of Sulphate
(g)
Salt 22.63 400 9.05 Anolyte 3.83 1000 3.83 Total 12.88
Final Salt 18.27 366.5 6.69 Anolyte 4.88 968 4.73
Total 11.42 Mass lost due to sampling 0.21 Mass unaccounted for 1.24
Deviation (%) 9.79 Accountability (%) 90.21

89
Table 19: System mass balance, experiment 6: 15 wt.%
Lithium
Initial
Concentration (g/L) Volume (L) Mass of Lithium
(g) Salt 17.08 400 6.83 Catholyte 7.60 1000 7.60
Total 14.43 Final Salt 10.78 383 4.13
Catholyte 8.79 999 8.78 Total 12.91
Mass lost due to sampling 0.20
Mass unaccounted for 1.32 Deviation (%) 9.30 Accountability (%) 90.70
Sulphate Initial Concentration (g/L) Volume (mL) Mass of Sulphate
(g)
Salt 10.57 400 4.23 Anolyte 3.91 1000 3.91 Total 8.13
Final Salt 7.43 383 2.85 Anolyte 5.29 971 5.14
Total 7.98 Mass lost due to sampling 0.13 Mass unaccounted for 0.03
Deviation (%) 0.33 Accountability (%) 99.66
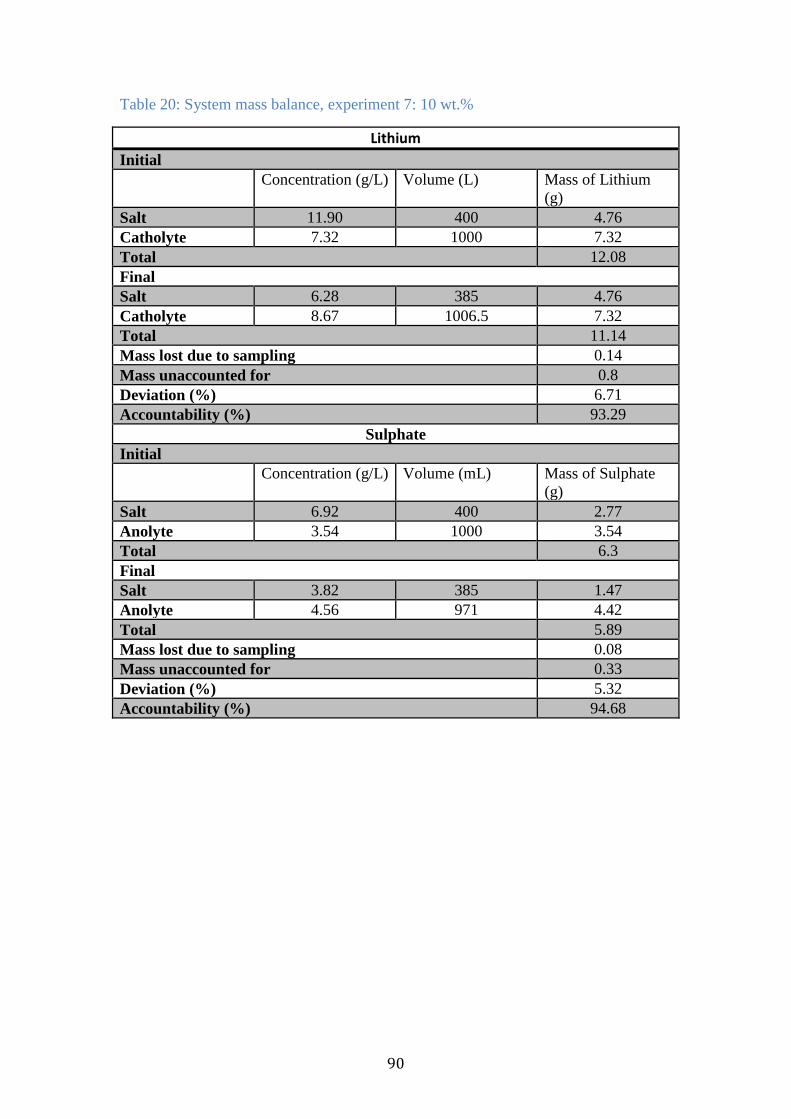
90
Table 20: System mass balance, experiment 7: 10 wt.%
Lithium
Initial
Concentration (g/L) Volume (L) Mass of Lithium
(g) Salt 11.90 400 4.76 Catholyte 7.32 1000 7.32
Total 12.08 Final Salt 6.28 385 4.76
Catholyte 8.67 1006.5 7.32 Total 11.14
Mass lost due to sampling 0.14
Mass unaccounted for 0.8 Deviation (%) 6.71 Accountability (%) 93.29
Sulphate Initial Concentration (g/L) Volume (mL) Mass of Sulphate
(g)
Salt 6.92 400 2.77 Anolyte 3.54 1000 3.54 Total 6.3
Final Salt 3.82 385 1.47 Anolyte 4.56 971 4.42
Total 5.89 Mass lost due to sampling 0.08 Mass unaccounted for 0.33
Deviation (%) 5.32 Accountability (%) 94.68

91
Table 21: System mass balance, experiment 8: 5 wt.%
Lithium
Initial
Concentration (g/L) Volume (L) Mass of Lithium
(g) Salt 5.92 400 2.37 Catholyte 7.21 1000 7.21
Total 9.57 Final Salt 1.08 384.5 0.42
Catholyte 1.08 384.5 0.42 Total 9.45
Mass lost due to sampling 0.11
Mass unaccounted for 0.02 Deviation (%) 0.19 Accountability (%) 99.81
Sulphate Initial Concentration (g/L) Volume (mL) Mass of Sulphate
(g)
Salt 3.08 400 1.23 Anolyte 3.69 1000 3.69 Total 4.922
Final Salt 1.0667 384.5 0.41 Anolyte 4.55 978 4.45
Total 4.86 Mass lost due to sampling 0.05 Mass unaccounted for 0.01
Deviation (%) 0.11 Accountability (%) 99.89

92
Table 22: System mass balance, experiment 9: 2 hours
Lithium
Initial
Concentration (g/L) Volume (L) Mass of Lithium
(g) Salt 33.25 400 13.30 Catholyte 6.89 1000 6.89
Total 20.19 Final Salt 29.68 387 11.49
Catholyte 8.29 1000 8.29 Total 19.77
Mass lost due to sampling 0.07
Mass unaccounted for 0.34 Deviation (%) 1.71 Accountability (%) 98.29
Sulphate Initial Concentration (g/L) Volume (mL) Mass of Sulphate
(g)
Salt 32.78 400 9.11 Anolyte 3.72 1000 3.72 Total 12.83
Final Salt 20.61 387 7.97 Anolyte 4.18 970 4.05
Total 12.02 Mass lost due to sampling 0.08 Mass unaccounted for 0.73
Deviation (%) 5.71 Accountability (%) 94.29

93
Table 23: System mass balance, experiment 10: 4 hours
Lithium
Initial
Concentration (g/L) Volume (L) Mass of Lithium
(g) Salt 33.25 400 13.30 Catholyte 6.89 1000 6.89
Total 20.19 Final Salt 23.36 387 9.04
Catholyte 9.13 1000 9.13 Total 18.17
Mass lost due to sampling 0.42
Mass unaccounted for 1.61 Deviation (%) 8.12 Accountability (%) 91.88
Sulphate Initial Concentration (g/L) Volume (mL) Mass of Sulphate
(g)
Salt 22.78 400 9.11 Anolyte 3.72 1000 3.72 Total 12.83
Final Salt 19.01 387 7.36 Anolyte 4.83 970 4.68
Total 12.03 Mass lost due to sampling 0.13 Mass unaccounted for 0.66
Deviation (%) 5.23 Accountability (%) 94.76

94
Table 24: System mass balance, experiment 11: 8 hours
Lithium
Initial
Concentration (g/L) Volume (L) Mass of Lithium
(g) Salt 33.25 400 13.30 Catholyte 6.89 1000 6.89
Total 20.19 Final Salt 19.04 387 7.37
Catholyte 10.94 1000 10.94 Total 18.31
Mass lost due to sampling 0.54
Mass unaccounted for 1.34 Deviation (%) 6.81 Accountability (%) 93.19
Sulphate Initial Concentration (g/L) Volume (mL) Mass of Sulphate
(g)
Salt 22.78 400 9.11 Anolyte 3.72 1000 3.72 Total 12.83
Final Salt 17.86 387 6.91 Anolyte 5.65 970 5.48
Total 12.39 Mass lost due to sampling 0.37 Mass unaccounted for 0.07
Deviation (%) 0.58 Accountability (%) 99.42


![REVERSE ELECTRODIALYSIS’’’’’’’’’’’’’’’ PROJECT’REPORT · determine! the! feasibility of! using reverse ]electrodialysis to! supplement! a! small! portion!](https://img.pdfslide.net/doc/110x75/5aedd4ea7f8b9aa17b8b7a6e/reverse-electrodialysis-projectreport.jpg)