Embed Size (px)
Citation preview

The EPA Clean Power Plan:Update on New Jersey’s CPP Evaluation
New Jersey Clean Air Council MeetingApril 13, 2016
Office of Air and Energy AdvisorNJ Department of Environmental Protection
1
Today’s briefing topics
1. Litigation Update and Possible Timeline2. New Jersey Energy Mix and Trends3. Thoughts on PJM Reference Model Prelim Results4. New Jersey’s Regulated Facilities Under the CPP5. Renewable Energy and Energy Efficiency: Interaction
with the CPP 6. Review of Mass-based Allowance Deficit and Rate-
based ERC Surplus in NJ 7. Resources for Additional Information
2

Litigation Update and Possible Timeline
Andrea FriedmanNJDEP Office of Air and Energy Advisor
3

Litigation Update
• Oral arguments scheduled for June 2nd (and 3rd if necessary) in the U.S. Court of Appeals for the District of Columbia Circuit.
• The D.C. Circuit Court could:o uphold or vacate the rule in whole or in part, and/oro remand portions of the rule to EPA
• After the decision, either side can petition the D.C. Circuit Court for en banc review of the D.C. Circuit panel decision.
4

Litigation Update
• After the D.C. Circuit Court decision, either side can petition the Supreme Court to hear the case.
• The rule remains stayed unless:• neither side petitions the Supreme Court• the Supreme Court refuses to hear the case• the Supreme Court hears the case and issues a decision
5

Possible Timeline
June 2016 D.C. Circuit Court hears oral arguments
Fall 2016 D.C. Circuit issues decision
Jan 2017 New Federal Administration
2017/18 Supreme Court decision grants or deniespetition and/or issues a ruling
6

Bottom Line
• States will not submit CPP extension requests or state plans before 2017/18.
• The EPA Proposed Federal Implementation Plan and Model Rule will not be finalized before 2017/18.
• All deadlines and compliance periods in the rule will need to be revisited by EPA.
7

New Jersey’s Energy Mix and Trends
Tom McNevinNJDEP Office of Air and Energy Advisor
8

0%
5%
10%
15%
20%
25%
30%
35%
40%
45%
0
10,000,000
20,000,000
30,000,000
40,000,000
50,000,000
60,000,000
70,000,000
80,000,000
90,000,000
2000 2001 2002 2003 2004 2005 2006 2007 2008 2009 2010 2011 2012 2013 2014
% Im
port
ed P
ower
MW
hTotal NJ Electric Generation and Retail Sales
NJ Total Generation NJ Retail Sales Percent of Imported Power Linear (NJ Total Generation)9

0
5,000,000
10,000,000
15,000,000
20,000,000
25,000,000
30,000,000
35,000,000
40,000,000
2000 2001 2002 2003 2004 2005 2006 2007 2008 2009 2010 2011 2012 2013 2014
MW
hNJ Fossil Generation
Total Coal Natural Gas 10
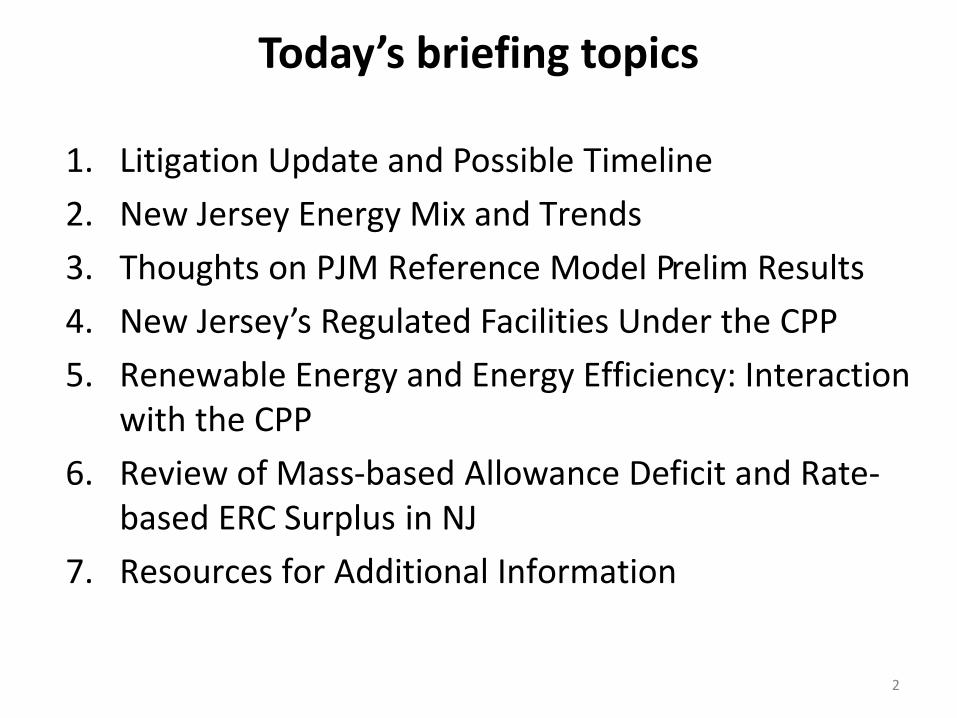
39%
35%
31%31%
26%
23%
21%
19%
15% 15%
9%
0%
5%
10%
15%
20%
25%
30%
35%
40%
45%
0
5,000,000
10,000,000
15,000,000
20,000,000
25,000,000
30,000,000
35,000,000
2004 2005 2006 2007 2008 2009 2010 2011 2012 2013 2014
% Im
port
ed P
ower
MW
hTotal NJ Gas-Fired Electric Generation with Imported Power
NJ Gas Generation Percent of Imported Power Linear (NJ Gas Generation) 11
Thoughts on PJM Reference Model (not including the CPP) :
4/8/16 Preliminary Results
William O’SullivanNJDEP Office of Air and Energy Advisor
12

13

14

Thoughts on PJM Reference Case Levelized Electric Costs
1. The lower gas price ($3.43) has a significant effect on electric costs (about 14% less), as compared to the higher gas price ($5.14).
2. Implementation of existing Renewable Portfolio Standards (RPS) does not significantly impact the average cost of electricity production in PJM.
3. Results will be different on a state by state basis.
4. The 2 gas prices studied are neither the lowest or highest possible.
15

Thoughts on Changes in Capacity for Different Generating Types
1. NGCC new builds increase significantly, more so if gas is lower price.
2. Coal decreased significantly, much more so if gas is lower price.
3. Solar new builds are significantly higher with low gas price.
4. Wind is significantly higher with RPS implementation.
16

17
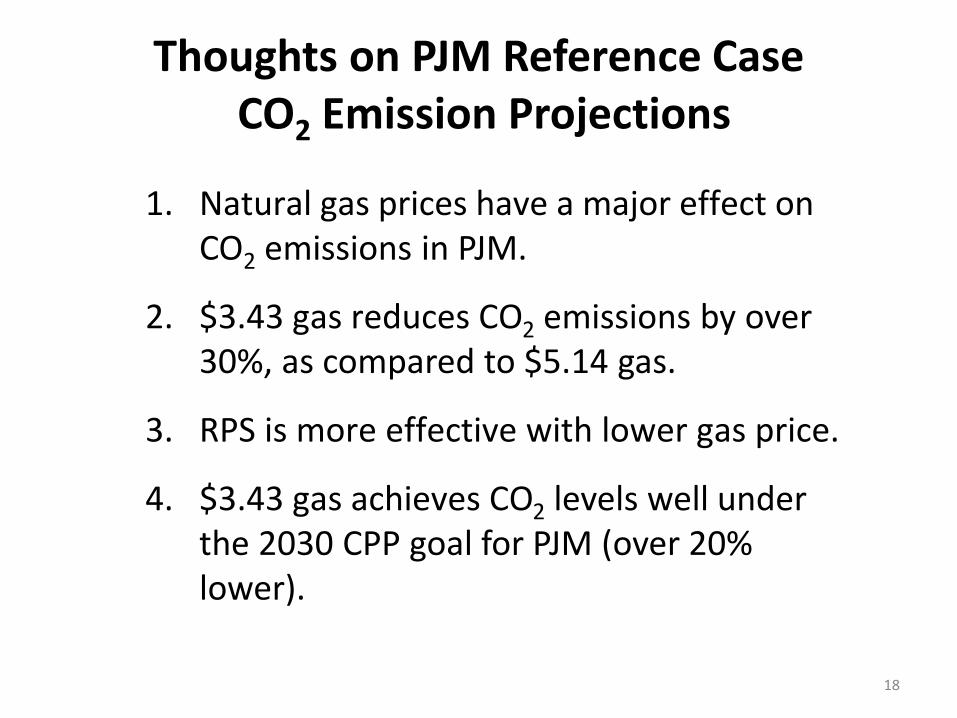
Thoughts on PJM Reference CaseCO2 Emission Projections
1. Natural gas prices have a major effect on CO2 emissions in PJM.
2. $3.43 gas reduces CO2 emissions by over 30%, as compared to $5.14 gas.
3. RPS is more effective with lower gas price.
4. $3.43 gas achieves CO2 levels well under the 2030 CPP goal for PJM (over 20% lower).
18

New Jersey’s Regulated Facilities Under the CPP
Tom McNevinNJDEP Office of Air and Energy Advisor
19

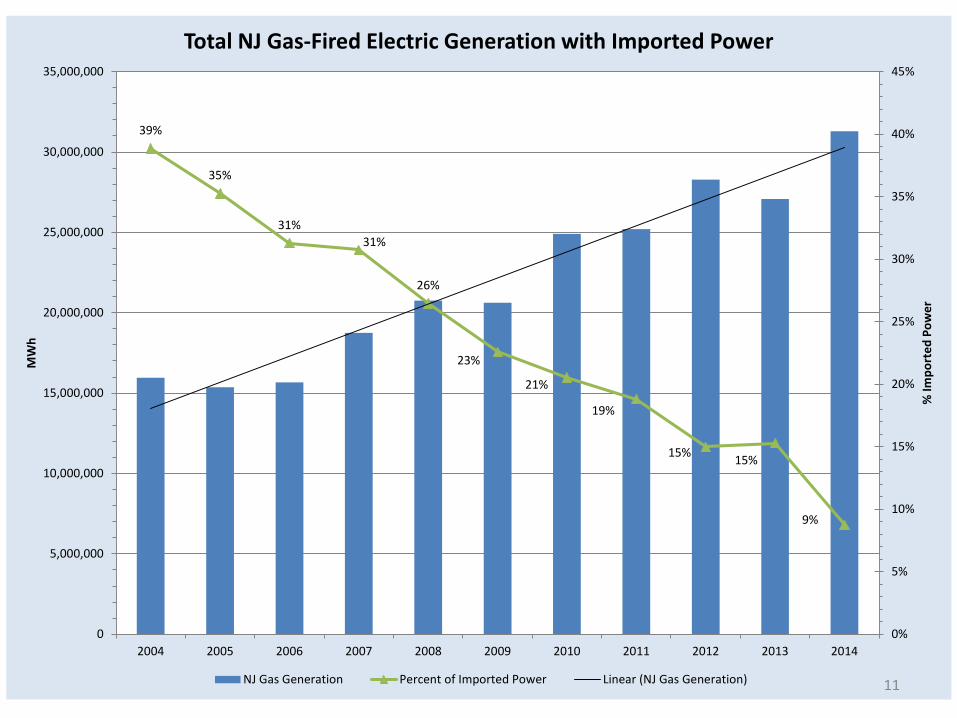
62%
30%
64%
58% 57%
51%
64% 63%
26%
21%
62%
49%
76%
13%17%
32%
16%
25% 27% 27%
0%
10%
20%
30%
40%
50%
60%
70%
80%
90%
100%
0
500,000
1,000,000
1,500,000
2,000,000
2,500,000
3,000,000
Perc
ent o
f Em
issi
ons
not c
over
ed b
y Al
low
ance
s
CO2
(ton
s)Mass-Based
NJ 24 CPP Plants: 2012 Emissions with 2030 Allocations based on EPA Proposed FIP, with 3 "Under Construction" Plants Operating at 75% Capacity Factor
2012 Emissions 2030 Allocations Percent of Emissions not covered by Allowances
Plants under construction in 2012 run at 75% CF
Output-based set asides applied to 4 eligible plants: Woodbridge, Newark, Red Oak, West Deptford
20
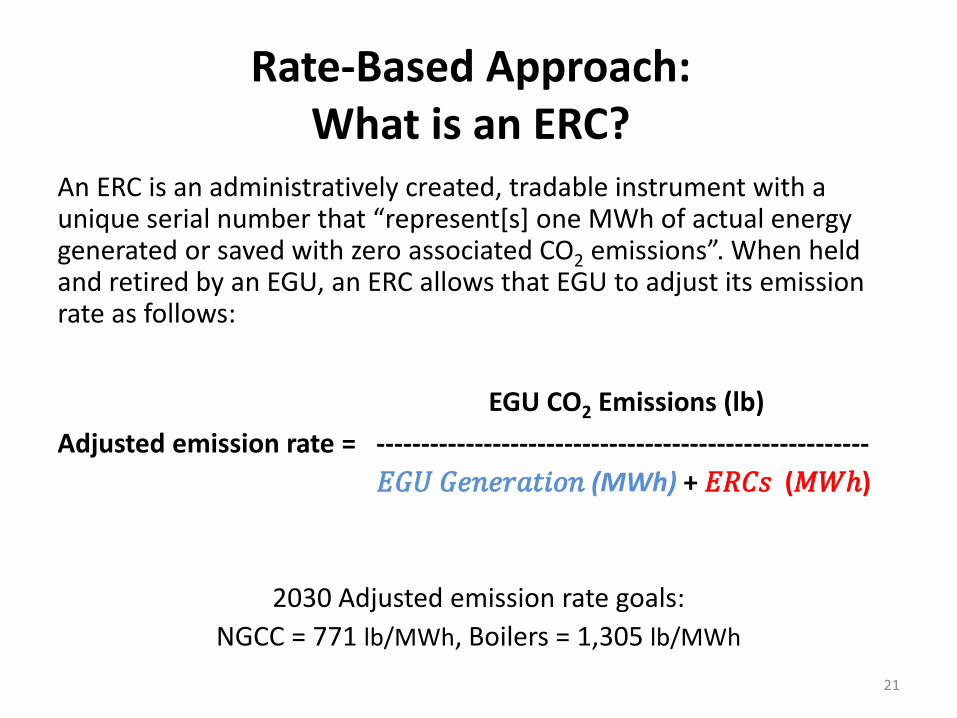
Rate-Based Approach:What is an ERC?
An ERC is an administratively created, tradable instrument with a unique serial number that “represent[s] one MWh of actual energy generated or saved with zero associated CO2 emissions”. When held and retired by an EGU, an ERC allows that EGU to adjust its emission rate as follows:
EGU CO2 Emissions (lb)Adjusted emission rate = -------------------------------------------------------
𝐸𝐸𝐺𝐺𝑈𝑈 𝐺𝐺𝑒𝑒𝑛𝑛𝑒𝑒𝑟𝑟𝑎𝑎𝑡𝑡𝑖𝑖𝑜𝑜𝑛𝑛 (MWh) + 𝐸𝐸𝑅𝑅𝐶𝐶𝑠𝑠 (𝑀𝑀𝑊𝑊ℎ)
2030 Adjusted emission rate goals: NGCC = 771 lb/MWh, Boilers = 1,305 lb/MWh
21

-12%
22%
14%
-1%
-20%
0%
20%
40%
60%
80%
100%
-1,000,000
0
1,000,000
2,000,000
3,000,000
4,000,000
5,000,000
6,000,000
7,000,000
8,000,000
ERCs
Nee
ded
as %
of
(Gen
erat
ion
+ ER
Cs)
MW
hRate-Based:
NJ CPP Plants: 2010-2012 Generation with ERCs needed at 2030 Emission Rates, with Adjustments for 4 CHP Plants with Steam Customers in 2015
Generation ERCs needed % ERCs
Plants under construction in 2012 run at 75% CF
22

1,898
1,238
0
200
400
600
800
1,000
1,200
1,400
1,600
1,800
2,000
2012
lb/M
Wh
Hudson-2 Average 2012 - 2015 CO2 Rates, Coal vs Gas-fired Generation
Coal Gas
2030 Goal = 1,305
23

Renewable Energy and Energy Efficiency: Interaction with the CPP
Joseph CarpenterNJDEP Office of Air and Energy Advisor
24

NJ RPS Trajectory(Note: Pre-2013 activities are not credited under CPP)
25
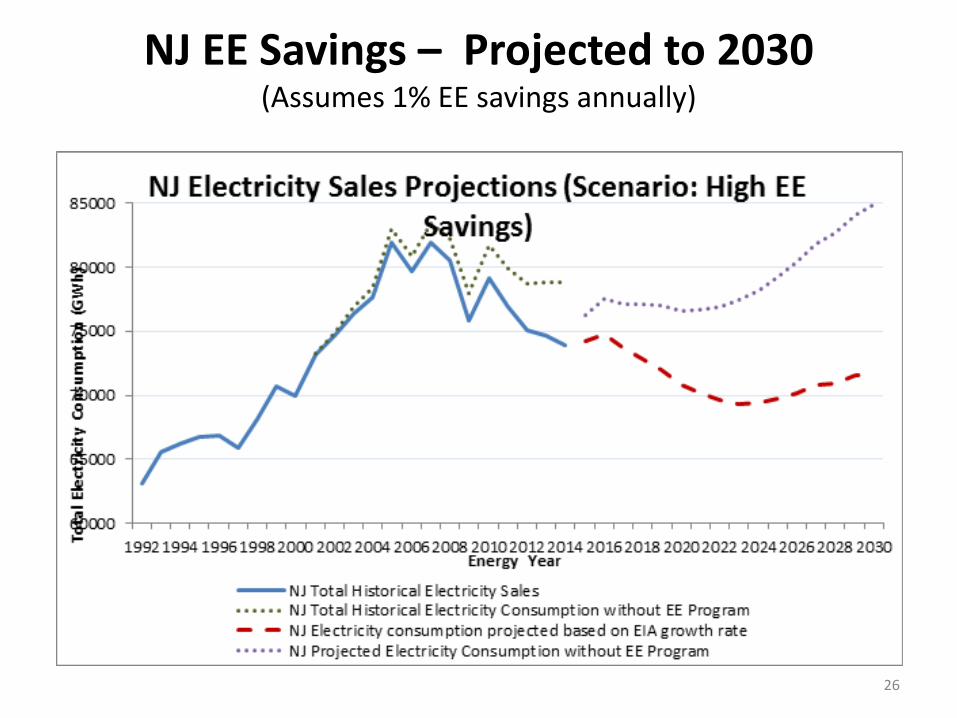
NJ EE Savings – Projected to 2030(Assumes 1% EE savings annually)
26

RE Treatment in a Mass Based Program
• MWh of RE reduces demand, which helps keep state under the emission cap
• RE can receive allowance allocation from set-aside (state discretion) for sale to regulated generators
• 5% RE set-aside in FIP for new source leakage• Utility scale wind, solar, geothermal,
hydropower can be set-asides to address leakage
27

RE Treatment in a Rate Based Program
• RE MWhr generates tradeable ERCs for compliance purposes
• Post-2012 wind, solar, geothermal power, hydropower(EPA solicits comment on inclusion of qualifying biomass feedstocks)
• Rate based requires RE or EE for compliance
28

EE Treatment in a Mass Based Program
• MWh savings from EE help keep state under the emission cap
• Do not result in a tradeable compliance mechanism – therefore no direct financial incentive, aside from optional allowance allocation under a state plan
29

EE Treatment in a Rate Based Program
• Post-2012 EE actions create tradeable ERCs for compliance
• All measurable EE qualifies, provided verified using EPA-accepted EM&V protocols
• State and utility EE programs, project based demand-side EE, state building codes, state appliance standards, conservation voltage reduction, CHP
30

Review of Mass-based Allowance Deficit and Rate-based ERC Surplus in NJ
William O’SullivanNJDEP Office of Air and Energy Advisor
31

Mass-Based Approach
• New Jersey 2030 Cap = 16.6 million tons
– Existing Sources = 12.4 million tons (75%)(directly allocated)
– Renewable Energy Set-Aside = 0.8 million tons (5%)(indirectly available)
– Output-Based Set-Aside = 3.4 million tons (20%)(directly allocated to certain efficient NGCCs)
32

3,413,100
829,987
0
5,000,000
10,000,000
15,000,000
20,000,000
25,000,000
2012 Ops 2012 + UC s 2012 + UC s - Retirees 2012 + UC s - Retirees +Stakeholder's 2030 Projections
2030 Cap
CO2
(sho
rt to
ns/y
ear)
NJ Estimated Actual CO2 Emissions Compared with 2030 Emissions Cap
"2012 Ops" = Annual 2012 emissions from 21 plants "2012 + UCs" = Actual 2012 emissions plus emissions from 3 plants then Under Construction operating at a 75% capacity factor "2012 = UCs - Retirees" = "2012 + UCs" - 5 plants scheduled to retire
Existing Source
Allocations
OB set-aside for NGCC
RE set-aside
RE = Renewable EnergyOB = Output-based
2030 Cap
15.3 million
20.4 million19.7 million
23.4 million
12,356,662
16.6 million
2012 + UCs - Retirees + Power Companies' 2030 Projections
33

2030 Mass Based Allowance Shortfall Per Year
2030 Allowance Need* 23.5 million
2030 Allowance Allocation 16.6 million__________________________________________________
2030 Allowance Deficit - 6.9 million (30%)
*Based on company expectations for 2030 electric generation.- Under construction units at 75% capacity- 5 facilities are shut down or replaced with
new units
34

Note: This graph is based on EPA CPP data.
Fossil Steam, (8% of MWhs at 2380 lb/MWh)
Fossil Steam Goal Rate, (8% at 1305 lb/MWh)
Operating NGCC, (68% of MWhs at 949 lb/MWh)
NGCC Goal Rate, (92% at 771 lb/MWh)
NGCC Under ConstructionAdjustment, (24% of MWhs
at 949 lb/MWh)
2012 Baseline 2030 Goal
2012 Baseline Rate: 1058 lb/MWh Combined Goal Rate: 812 lb/MWh
-23%
CPP Rate-based Goal for New Jersey
35

See attachment (2 pages)
Rough Accounting for Hypothetical NJ Rate Based Program (in 2030 Based on 2012 Electric Generation)
36

Conclusions1. NJ has an allowance deficit if it selects mass based
- 30% short for existing CPP regulated facilities
- 50% short if include new facilities (based on permitted or planned facilities)
2. NJ would need to depend on excess allowances in other states to comply with a mass based program.
3. Including new sources (as is done in RGGI) would add to the difficulty of compliance with the EPA’s mass-based program.
37

Conclusions (cont’d)
4. NJ may have an ERC surplus if it selects rate based
5. ERC credit depends on EPA final rules
6. EPA’s proposed rules cannot be met by NJ under existing energy law. EPA regulation at the wholesale market is primary problem.
38

Resources for Additional Information
Background Material on the Clean Power Plan on the CAC website at http://www.state.nj.us/dep/cleanair/hearings/pdf/cpp.pdf
Includes: Text of the CPP and the Proposed Federal Plan and Model Rules Resources from the U.S. Environmental Protection Agency Resources from Universities Resources from Other Sources The State of New Jersey’s Response to the CPP New Jersey Energy Master Plan Litigation Materials
Background Material on the Clean Power Plan was updated on 3/31/16. If you see an older version on the CAC website, refresh your web browser. (The date is on the bottom of the last page.)
39

There is much to consider…
Adapted from Understanding EPA’s Clean Power Plan: A Webinar for State Energy & Environmental Regulators, Great Plains Institute and Duke Nicholas Institute for Environmental Policy Solutions 40