Embed Size (px)
Citation preview

354
Models of disease and injury facilitate our
understanding of their etiology or causes.
Etiology is the science of causation.
The Epidemiological Triad
The best known, but most dated model of
communicable disease is the Epidemiologic
Triad (Figure 1). This model comprises a
susceptible host (the person at risk for the
disease), a disease agent (the proximate
cause), and an environmental context for the
interaction between host and agent.
Figure 1: The Epidemiological Triad
In the case of many communicable diseases,
such as malaria, the agent can only reach the
host via a third party, called the vector (Figure
2). The vector is animate. For example, the
vector for malaria is the female anopheles
mosquito. She can convey the malaria
parasite to a susceptible host when she
consumes a blood meal.
The Epidemiologic Triad has been applied to
the study of injury by scientists at the Centers
for Disease Control and Prevention (CDC)
(Figure 3). For injury, the agent is any one of
the five forms of physical energy: kinetic or
mechanical energy, chemical energy, thermal
energy, electricity, and radiation. This energy
is conveyed to the host via a vector, such as a
biting dog or snake, or its inanimate
counterpart, the vehicle. Examples of
potential injury vehicles are crashing
automobiles and speeding bullets.
Figure 2: Factors involved in the Natural History of Disease
Levels of Prevention:
In the world of public health, we delineate
three levels of prevention: primary
prevention aims at preventing occurrence of a
disease or injury; secondary prevention aims
to minimize damage when it occurs; and
tertiary prevention covers follow-up medical
and hospital care and rehabilitation.
The Haddon Matrix, a framework named for
its creator, the engineer-physician-
epidemiologist William Haddon, combined the
three levels of prevention with the
Descriptive Epidemiology for Public Health Professionals - Part 2
I am Ian Rockett, a native of Australia and Professor of
Epidemiology in the Department of Community Medicine
at West Virginia University. Before you move through this
module on descriptive epidemiology I would like to set the
scene. The initial target audience was public health
professionals, but in the spirit of the Supercourse I now
seek to reach any audience who might find this material
of interest or use.
ABOUT SUPERCOURSE:
SUPERCOURSE is a repository of lectures on global
health and prevention designed to improve the
teaching of prevention. Supercourse has a network
of over 64000 scien/sts in 174 countries who are
sharing for free a library of 3623 lectures in 26
languages. The Supercourse has been produced at
the WHO Collaborating Center, University of
Pittsburgh, with core developers Ronald LaPorte,
Ph.D., Faina Linkov, Ph.D., Mita Lovalekar, M.D.,
Ph.D., and Eugene Shubnikov M.D. For more info
visit: h5p://www.pi5.edu/~super1/

355
Descriptive Epidemiology for Public Health Professionals – Part 2
Haddon Matrix (bombings)
Factors
Phases
Person Vehicle/
Vector (bomb / bomber)
Physical Environ.
Social Environ.
Pre-event Teach to recognize
suspicious
persons
Detectable
bombs
No vehicle zones
Reduce animosity
Event
(explosion &
collapse
Wear protective clothes
Slower acting
explosives
Shatter-
proof glass
Strengthen norms for rescue volunteers
Post-event
Train people in first aid ??
Emergency
call boxes
Strengthen public health
infrastructure
Epidemiologic Triad (Figure 4). This
framework can greatly enhance our
understanding of injury events (Figure 5).
Figure 3: The Epidemiologic Triad applied to Injury
Epidemiologists in the Injury Prevention
Research Center at the University of North
Carolina in Chapel Hill applied the Haddon
Matrix to an injury problem about which we
in the United States harbor much more
concern since the September 11, 2001
terrorist attack on the World Trade Center
(Figure 6).
Factors
Phases
Human
Factors
Agent or
Vehicle
Physical
Environment
Socio-
cultural/
Environmental
Pre-event
Event
Post-
event
Figure 4: The Haddon Matrix
Figure 5: The Haddon Matrix applied to Motor Vehicle Crash Injury.
The Wheel of Causation
The Wheel of Causation (Mausner & Kramer,
1985) de-emphasizes the agent as the sole
cause of disease, while emphasizing the
interplay of physical, biological and social
environments (Figure 7). It also brings
genetics into the mix.
Figure 7: The Wheel of Causation
One application of The Wheel of Causation
model was to elucidate the potato famine that
devastated Ireland in the mid-19th century.
The famine was the synergistic product of a
fungal invasion of potato crops, a
predominantly peasant population subsisting
on a potato diet, and repressive British
colonial rule.
Figure 6: The Haddon Matrix applied to Terrorist Bombings
356
Descriptive Epidemiology for Public Health Professionals – Part 2
Web of Causation
Like the Wheel of Causation, the Web of
Causation de-emphasizes the agent in
explaining disease, but this model also
provides for multifactoral causes that traverse
various pathways. Mirroring reality, these
causal webs can be highly intricate and
complex.
Source: Ian R.H. Rockett. Population and Health: An Introduction to
Epidemiology. Popula*on Bulle*n 54(4); 1999: 18. Adapted from R.A.
Stallones, Public Health Monograph 76; 1966:53.
Wider Application of the Web
1. Epidemiologic Triad (devised to enhance
search for understanding communicable
disease)
2. Web of Causation (devised to address chronic
disease – can also be applied to communicable
disease)
While the Web of Causation was conceived to
enhance understanding of noncommunicable
chronic disease, this model also has
application to communicable disease and
injury. One interesting communicable disease
example involves unanticipated consequences
of economic development, and more
particularly Trypanosymiosis or “sleeping
sickness” that spread across Africa in the
wake of new roads. The agent was carried
behind trucks by its vector, the tsetse fly, with
fly bites being the mode of disease
transmission.
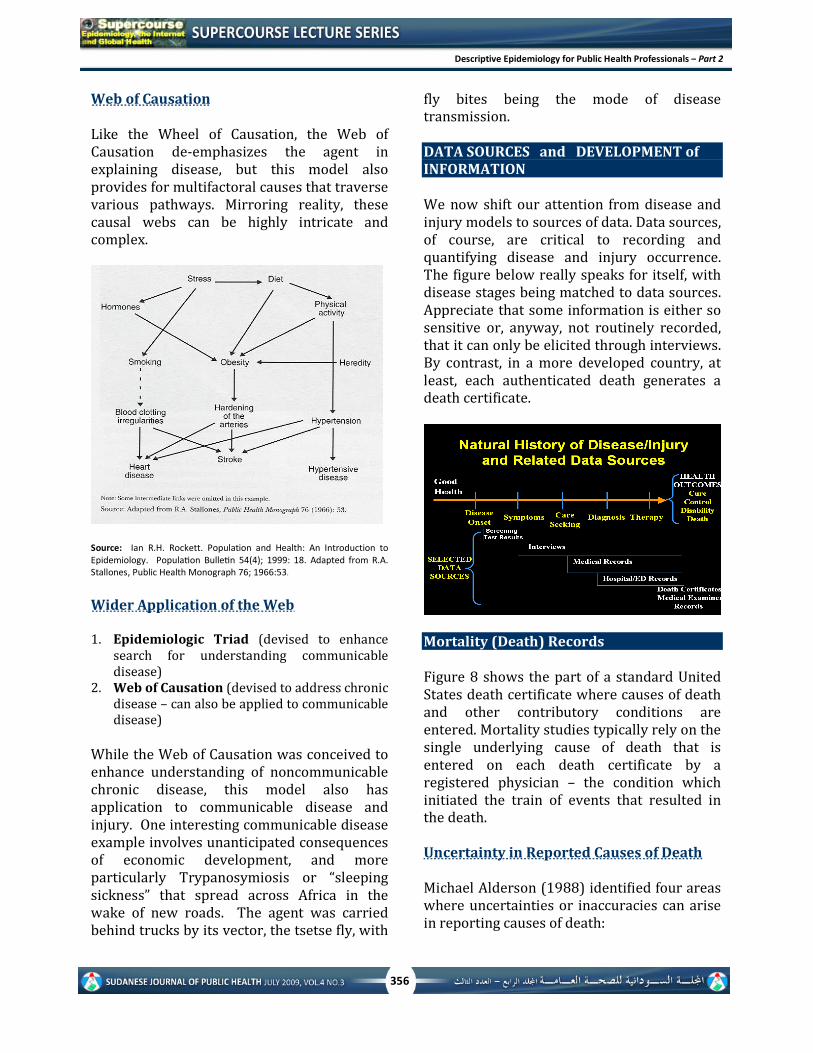
DATA SOURCES and DEVELOPMENT of
INFORMATION
We now shift our attention from disease and
injury models to sources of data. Data sources,
of course, are critical to recording and
quantifying disease and injury occurrence.
The figure below really speaks for itself, with
disease stages being matched to data sources.
Appreciate that some information is either so
sensitive or, anyway, not routinely recorded,
that it can only be elicited through interviews.
By contrast, in a more developed country, at
least, each authenticated death generates a
death certificate.
Mortality (Death) Records
Figure 8 shows the part of a standard United
States death certificate where causes of death
and other contributory conditions are
entered. Mortality studies typically rely on the
single underlying cause of death that is
entered on each death certificate by a
registered physician – the condition which
initiated the train of events that resulted in
the death.
Uncertainty in Reported Causes of Death
Michael Alderson (1988) identified four areas
where uncertainties or inaccuracies can arise
in reporting causes of death:

357
Descriptive Epidemiology for Public Health Professionals – Part 2
1. incorrect diagnosis (last attending physician
and/or autopsy)
2. incorrect completion of death certificate
3. inaccurate processing and publication of the
mortality statistics
4. invalid classification of diseases/injuries
Figure 8: Part of a Standard Death Certificate
Multiple Cause-of-Death Analysis
The fact that the death certificate forces the
certifying physician to choose a single
underlying cause of death for each decedent
can be problematic, especially for an elderly
one, who may have been afflicted with as
many as eight or more potentially lethal
conditions. In the United States, state health
departments are now routinely forwarding
multiple cause-of-death data to the National
Center for Health Statistics to permit more
realistic national and state mortality analyses.
Distinguishing Natural from Other Causes
of Death
It is crucial for legal, as well as for social,
psychological, and epidemiologic reasons, to
distinguish suicides, homicides and accident
deaths (unintentional injury deaths) from
deaths due to natural causes.
Use of Medical Examiner and Coroner
Records to supplement Death Certificate
Data
Only when homicide, suicide and “accident”
are ruled out can a death validly be classified
as natural. For example, discovery of a dead
infant, who apparently had been healthy and
sleeping in his or her cot just prior to death,
might implicate the Sudden Infant Death
Syndrome or SIDS as the killer. Obviously
suicide can immediately be ruled out. But
more investigation, typically involving the
Medical Examiner or Coroner’s Office, would
be necessary to eliminate homicide or
“accident” as the cause of the infant death.
Mortality as Tip of the Iceberg
Whether we are talking about disease or
injury deaths, mortality is only the tip of the
ill-health iceberg. In proportional terms,
morbidity exerts far greater influence.
Morbidity Data Sources
As mortality has its data sources, so too does
morbidity. Morbidity is defined in the fourth
edition of The Dictionary of Epidemiology
(New York: Oxford University Press;
2001:118), edited by John Last, as “any
departure, subjective or objective, from a
state of physiological or psychological well-
being.” Epidemiologists generally feel more
comfortable analyzing objective morbidity
data, as captured in physician-diagnosed
diseases, injuries, and disabilities, than
subjective morbidity data as self-reported by
individuals or reported on behalf of
individuals by non-physician third parties.
Prominent morbidity data sources include
disease registries, hospital emergency
department and admission records, periodic
health surveys, public and private health

358
Descriptive Epidemiology for Public Health Professionals – Part 2
insurance records, and sickness-absence
records for schools and workplaces.
Taken from The Injury Chartbook, published
by the United States Department of Health
and Human Services in 1997, the injury
example above clearly demonstrates the
limitation of the iceberg mortality tip in
reflecting the true dimensions of a public
health problem. A much more complete
picture can emerge from adding morbidity
information.
General Sources of Morbidity Data
Leon Gordis reported diverse sources of
morbidity data in the fourth edition of his
excellent textbook entitled Epidemiology
(Saunders, 2009: 47):
1. Disease reporting – communicable
diseases, cancer registries
2. Data accumulated as a by-product of
insurance and prepaid medical care plans
a. Group health and accident insurance
b. Prepaid medical care plans
c. State disability insurance plans
d. Life insurance companies
e. Hospital insurance plans
f. Railroad Retirement Board
3. Tax-financed public assistance and
medical care plans
a. Public assistance, aid to the blind, aid
to the disabled
b. State or federal medical care plans
c. Armed Forces
d. Veterans Administration
4. Hospitals and clinics
5. Absenteeism records -- industry and
schools
6. Pre-employment and periodic physical
examinations in industry and schools
7. Case-finding programs
8. Selective service records
9. Morbidity surveys on population samples
(e.g., National Health Survey, National
Cancer Surveys)
ICD and ICD-CM
The International Statistical Classification of
Diseases and Related Health Problems (ICD)
can be used for coding and classifying mortality
data from death certificates
The International Classification of Diseases
Clinical Modification (ICD-CM) can be used to
code and classify disease and injury morbidity
data from inpatient and outpatient records
A number of systems exist for classifying and
coding disease and injury mortality and
morbidity. Now in its 10th revision, the best
known is the International Classification of
Disease and Injury (ICD). The ICD-Clinical
Modification, used in American hospitals,
provides extra digits to classify and code more
detail on morbid conditions as needed.
Dynamic Classification
Causes of disease, injury and disability may
wax and wane. ICD needs to be flexible,
especially in responding to new
circumstances such as manifested in new
diseases and politically-motivated violence:
e.g. SARS, terrorism-attributable health
outcomes as from such varied causes as
asphyxiation, chemical burns, falls and
jumping from buildings, and suicide and
suicide attempts.

359
Descriptive Epidemiology for Public Health Professionals – Part 2
• Primary data are new data collected by or for
the investigator
• Secondary data refer to existing data
Limited epidemiologic research can be
conducted using existing data, referred to as
secondary data. Frequently, however,
important questions can only be answered
through collecting new and targeted
information, which we label primary data.
Stages of Development of Information
CDC has spelled out four stages in developing
public health information: public health
surveillance; risk group identification; risk
factor identification; and program
development, implementation, and
evaluation.
1. Public health surveillance –
development and refinement of data
systems for the ongoing and systematic
collection, analysis, interpretation and
dissemination of information
2. Risk group identification – identification
of persons at greatest risk of disease or
injury and the places, times, and other
circumstances that are associated with
elevated risks
3. Risk factor identification – analytic
exploration of potentially causative risk
factors for disease, injury or death as
suggested by the high risk population and
other research
4. Program development, implementation,
and evaluation – design, implementation
and evaluation of preventive interventions
based on degree of understanding of the
population-at-risk and the risk factors for
the outcome of interest
The first two stages fall under the realm of
descriptive epidemiology. Stages three and
four involve analytic epidemiology, with its
capacity to evaluate both putative cause-and-
effect relationships and interventions based
on this etiologic understanding. Combining
stages 1 and 2, and separating program
development and evaluation from
implementation of a tested program, the
Public Health Approach take us from
recognition of a public health problem
through its solution (Figure 9).
Figure 9: The Public Health Approach to Problem Solving
A Caveat on Data Quality: (“garbage in and
garbage out”)
On the subject of garbage in/garbage out, a
caustic assertion by the inimitable British
economist, Sir Josiah Stamp (1880-1941),
cautions us about never underestimating the
scientific imperative to collect, code, process,
analyze, and report data of the highest quality.
"The government is very keen on amassing
statistics. They collect them, add them, raise
them to the nth power, take the cube root and
prepare wonderful diagrams. But you must never
forget that every one of these figures comes in the
first instance from the village watchman, who just
puts down what he damn well pleases".