Embed Size (px)
Citation preview
University of Plymouth
PEARL https://pearl.plymouth.ac.uk
Faculty of Arts and Humanities Plymouth Business School
2016-07
The estimation of minimum efficient
scale of the port industry
Seo, Y-J
http://hdl.handle.net/10026.1/4592
10.1016/j.tranpol.2016.04.012
Transport Policy
All content in PEARL is protected by copyright law. Author manuscripts are made available in accordance with
publisher policies. Please cite only the published version using the details provided on the item record or
document. In the absence of an open licence (e.g. Creative Commons), permissions for further reuse of content
should be sought from the publisher or author.
The estimation of minimum efficient scale of the port industry
Abstract
Terminal scale has been the subject of discrete episodes of hotly contested policy debates. From
the perspective of port authorities or governments, knowing the Minimum Efficient Scale
(MES) is salient, because they sometimes determine the port development or expansion based
on the port capacity or the existing size of the terminal. Notwithstanding the importance of
knowing the exact MES, extant literature has not managed to estimate MES in the port industry.
This study aims to estimate the MES in the port industry in South Korea in order to identify
whether Container Terminal Operators (CTOs) are under economies of scale, constant
economies of scale or diseconomies of scale; we explore a bottom point of the average cost
curve in order to suggest an adequate scale for the port industry in Korea. The finding
demonstrates that undercapacity may be a strong issue in Korean container ports. However,
CTOs in Busan port are in an overcapacity area given the market demand of container
throughput in 2013, which is approximately 25 times larger than the estimated MES; in fact,
all CTOs in Busan port operate at more than 20% of MES. This study then can provide port
policy makers with a helpful tool to derive ex-ante MES level at the terminal designing stage
and to adjust ex-post port investment decisions at the additional port capacity designing stage,
which may contribute to avoiding overcapacity.
Keywords: MES; overcapacity ; port; container terminal; port capacity
1. Introduction
Rapid port development in North-East Asia which sought to dominate the market ahead of
adjacent countries and achieve hub-port status has triggered severe competition between
container ports. Although South Korea (hereafter Korea) has played a crucial role in the
international shipping and port industry as an economy that handled the fourth largest global
container port throughput of approximately 23 million TEU in 2013 and owned the fifth largest
fleet in terms of dead weight tonnage with leading container shipping lines such as Hanjin
shipping and Hyundai Merchant Marine and the second largest shipbuilding industry globally
(UNCTAD, 2014), Container Terminal Operators (CTOs) particularly in Korea have suffered
overcapacity problems which are unprecedented (Korea Shipping Gazette, 2014). This has
devastated CTOs’ financial status, since a number of factors such as the increased bargaining
power of shipping lines stemming from mergers and acquisitions, strategic alliances amongst
major shipping lines, withdrawal of sales from particular CTOs, and new entrants into existing
ports have had a negative impact on container terminal markets overall. As a result, the terminal
handling charge per TEU in ports was significantly less than in both China and Japan (Korea
Shipping Gazette, 2013). This causes a loss of profits and an outflow of national wealth from
Korea’s viewpoint.
Terminal scale has been the subject of discrete episodes of hotly contested policy debates
(Asteris and Collins, 2010). From the perspective of economic theories, CTOs should be keen
on a scale that is equivalent to the minimum efficient scale (MES), which is defined as the
long-run output where the internal economics of scale have been fully exploited (Kaselimi et
al., 2011). CTOs are essentially interested in identifying the terminal scale in order to enter the
market and compete with other CTOs, although the scale may vary according to locations with
different costs (Kaselimi et al., 2011). From the perspective of port authorities or governments,
knowing the MES is vital, because they sometimes determine the way in which existing assets
should be subdivided for port concession. In addition, they may utilise this information
regarding the MES, when they plan to develop new ports based on the port capacity or the
existing size of the terminal. Central or regional governments or port authorities have strived
for the optimal port capacity, because it is directly connected to both national and regional
economics as an economic springboard (Tongzon and Heng, 2007; Bottasso et al., 2013; Deng
et al., 2013; Song and van Geenhuizen, 2014; Chang et al., 2014; Park and Seo, 2016).
Underestimation of port capacity results in constructing too many berths and equipment,
whereas the overestimation leads to vessel congestion (Chang et al., 2012). For example, if the
CTO pursues 100% berth utilisation, it can minimise its costs per ship for ship owners, but it
generates costs due to waiting for berth (De Weille and Rai, 1974). Also, if the CTOs construct
and operate many berths to minimise the vessels’ waiting time, they have to face high costs of
constructing and operating the berths (De Weille and Rai, 1974). In fact, the relationship
between the port capacity and waiting time is a trade-off. In this regard, Jansson and Shneerson
(1982) pointed out that the decisions on port investment should be in concert with the long-run
total cost, incorporating port development costs and waiting costs of ships and cargo.
Identifying the optimum port capacity is not easy, because it is required to reflect multiple
perspectives of related players (e.g. ship owners and CTOs). This sometimes results in
compromised port capacity rather than the optimum one. Accordingly, various stakeholders
seek awareness of when the market becomes sufficiently large for the new terminal
construction in the same ports via the estimation of the MES (Kaselimi et al., 2011).
The estimation of MES for the service sector such as sea transport, aviation, travel, insurance,
and land transport is rare owing to the difficulty of making such estimates, and MES for the
service sector is likely to be lower than the manufacturing sector (Pratten, 1988). In the port
context, some extant studies investigate the concept of ‘global optimum size’ of a terminal or
a notion of critical mass of the container terminal (Musso et al., 1999; Wiegmans et al., 2009).
Interestingly, Kaselimi et al. (2011) have attempted to identify the preferred scale of the
container terminals, but they failed to find solutions due to different port governance, market
size, structure and operational considerations. Surprisingly, notwithstanding the importance of
knowing the exact MES (Theys et al., 2010; De Langen and Pallis, 2006), extant literature has
not managed to estimate the MES in the port industry. A paucity of extant works on the MES
in the port stimulated this study. Therefore, bearing in mind this research gap, the main purpose
of this study is to estimate the MES in the port industry in Korea in order to identify whether
CTOs are under economies of scale, constant economies of scale or diseconomies of scale so
that we can explore a bottom point of the average cost curve. By doing so, this study can
provide port planners and port policy makers with a helpful tool to derive ex-ante MES level
at the terminal designing stage and to adjust ex-post port investment decisions at the additional
port capacity designing stage, which may contribute to mitigating overcapacity. This study
deals with the real issues in Korea, but the approach of this study might be applied to other
regions of the world that suffer overcapacity issues (e.g. port of Colombo in Sri Lanka, see
Galhena, 2015).
Section 2 reviews the literature on overcapacity and the MES. Section 3 explains the main
methodology this study employed. Section 4 presents the results. Finally, the research
implication and conclusions are drawn in section 5.
2. Literature review
2.1. The overcapacity issues and MES
Traditionally, industrial organisations have been concerned with the optimum firm size and
industrial plant capacity in order to minimise costs and maximise profits. Market structure is
generally categorised into perfect competition, oligopoly, duopoly and monopoly. Such a
structure is determined by the number of firms within the industry, the distribution of the firm
size, product differentiation and entry condition. Amongst them, the number of firms may be a
major determinant for the industry’s structural characteristics such as monopoly and perfect
competition. Also, entry barrier, minimum capital for optimum scale and MES affect the
market structure. In the area of industrial organisation the MES concept is of paramount
importance, because large MES can significantly reduce unit cost and might cause high
concentration and significant entry barriers (Caves et al., 1975; Cory, 1981). In this paper, the
main focus lies in capacity issues as well as MES.
Overcapacity occurs due to the misallocation of resources and a situation where superfluous
infrastructure exists (Barzdukas et al., 2000). Haralambides (2002) pointed out that higher
competition may bring a greater need for overcapacity of ports, and highlighted that the
competition and overcapacity mix is an explosive cocktail. The advent of containerisation
forces ports to remain capital-intensive and make tremendous investment in both port
infrastructure and container handling equipment. Furthermore, the long life of terminals,
capital indivisibilities, shipping liners’ interest in minimising ship waiting time, economies of
scale in port construction and the optimism of port planners may be attributed to the risk of
excess capacity of ports (Haralambides, 2002; Heaver, 1995).
According to Porter (1998), expanding capacity is the most important strategic decision
confronting firms in terms of the capital and the complexity of the decision-making problem
since capacity adding requires lead times for years and capacity persists for a long time.
Therefore, thorough expectations such as future demands and competitor’s future behaviour
should be made before capacity expansion. There would be hostile consequences if a large
number of competitors participate in expanding capacity. It is worth noting here that unlike a
manufacturing sector which is able to produce for the future and manage capacity and demand
by storing the products, transport service industries such as port, shipping, airline and rail are
likely to face capacity issues due to the fact that the services they offer are not storable (De
Weille and Rai, 1974). In most container ports in Korea, terminal markets seem to be oligopoly
(Korea Shipping Gazette, 2013), in which CTOs are mutually inter-dependent. Each CTO
strategic movement is centred on enhancing market share, while avoiding overcapacity. In
general, ports decide to expand their facilities based on an expectation of a future cargo
throughput, and internally-driven and customer-compelled strategies of each terminal may
result in excessive duplication and overcapacity (Slack, 1993). Overcapacity would result in
inefficient use of port infrastructure (Chang et al., 2012). In the port sector, there always exists
a conflict between monopoly power and concern for excess capacity (Heaver, 1995). Monopoly
tends to hinder innovation and efficiency while overcapacity results in inefficiencies due to
superfluous duplication, which wastes high capital investment (Barzdukas et al., 2000).
Knowing the MES would play a vital role in providing the most efficient and effective service
at a minimum cost (Chang et al., 2012), especially when CTOs are likely to provide
homogenous service and compete based on the cost reduction. In terms of differentiation, CTOs
tend to provide homogeneous services: the transfer of boxes between ship and ashore (Ashar,
2001). The fact that services are not differentiated makes cost reduction important to their
competition. The overcapacity problem often occurs when competitors aim at preemptive
behaviour in pursuit of a cost advantage and the MES because larger plants are likely to be
more efficient than smaller plants. The MES of a container terminal is defined as “the smallest
scale at which output can be produced at minimum average long run cost” (Kaselimi et al.,
2011, p. 72). If the MES of a current CTO is large compared with the market size, potential or
new entrants may encounter competitive disadvantage owing to a smaller scale or need for
building a similar capacity to that of the CTO (De Langen and Pallis, 2007). This may lead
both of them to the possibility of price war and profit loss because of the considerable excess
supply (De Langen and Pallis, 2007).
2.2. Overcapacity issues: the case of ports in Korea
Recently, very low container cargo handling fees have been a controversial issue in Korea due
to overcapacity (Korea Shipping Gazette, 2014). Busan port, the largest container port in Korea
aims to become a major hub port in North-East Asia by building and developing New port from
2006 up to now under the base of North port. When allowing new entrants into the port, policy
should be very careful regarding creating conditions that allow entry without directly hindering
the survival and growth of incumbents (De Langen and Pallis, 2007). Unfortunately, many
CTOs in Korea have suffered overcapacity problems derived from the Korean government’s
expanding plans based on too optimistic forecasts (Korea Shipping Gazette, 2013). This
decision to expand container ports on a large scale has led to overcapacity. After a number of
new CTOs entered the port market, they have sought to occupy cargoes. Market entry was too
rapid and easy due to government support, even though this adding capacity in large lumps
should be carried out with caution. As a result, they have started to compete with each other
based on price reduction to capture more cargoes and shipping lines, although when changing
the port price they should be extremely careful (Gardner et al., 2006). This drastically
exacerbates the CTO’s margin. According to a game theoretic approach, it is not likely that the
outcomes of price war lead to a predatory situation if entry barriers are not significant (Flor
and Defilippi, 2003). Even if the CTO temporarily reduces the price below its cost, it would be
unable to recover its losses even after eliminating competition, since price increase may foster
the entry of new players (Flor and Defilippi, 2003). In reality, however, some CTOs in Busan
port tend to be myopic, so they simply start to reduce the price without allowing for a
competitor’s response. Since 2011, container cargo throughput has been tied up while the
supply of terminal facilities has gradually increased. It causes an imbalance between demand
and supply. In turn, CTOs were about to lower their price at break-even point in 2013 (Korea
Shipping Gazette, 2014). The main reasons for the overcapacity stemmed from incorrect
forecast of port demand. Busan New port has been initiated based on this forecast, since
demand for Busan port is expected to increase in the long-term perspective. However, this
forecast does not fit real demands for terminal facilities, so overcapacity problems occur. Prior
to the Busan New port construction, insightfully, a report from OECD (2004) warned that the
rush towards the costly building of mega container ports may lead to the pitfall of
overinvestment, and pointed out that such a rush for ever heavier investment is lucrative only
when economic growth remains strong.
In 2013, the container handling fee per TEU in Busan port approximately cost $45-50,
significantly less than in both Shanghai port ($80-90) in China and Tokyo port ($160-180) in
Japan (Korea Shipping Gazette, 2013). This handling fee in Busan port is equivalent to that of
1/8 of LA port in USA and 2/3 of Kaohsiung port in Taiwan. Of course, CTOs are interested
in reducing or stabilising the container handling fee as long as they can maximise the profits
(Bassan, 2007). High price may simply guide the port to extinction while low prices may attract
customers but investment costs may not be recovered in the long-run (Haralambides, 2002).
The aforementioned overcapacity issues in the ports of Korea and the fact that quantitative
approaches to the determination of MES remain hugely untouched territory, where most port
economists have approached this issue to a limited extent and mostly in a qualitative manner
(Theys et al., 2010), stimulate the current study.
3. Methodology
3.1. Finding MES
As firms start producing output such as goods, services or throughput in the case of CTOs, they
will initially face increasing returns to scale (RTS). In other words, they can obtain a
proportionally larger amount of output than the increase in inputs. Consequently, their average
costs will decline with more output, which is called economies of scale. However, if the firms
increase production further until economies of scale are exploited, increasing RTS will
eventually turn into constant and then decreasing RTS where only proportionally smaller
output is generated given the same increase in input. Concurrently, average costs will decrease,
hit a minimum and then start going up. This change corresponds with a U-shaped total average
cost curve that is commonly used in economics.
The MES is technically defined as the optimal amount of production that minimises total
average cost. It can be found at the minimum point of the average cost (AC) function. On the
other hand, the MES can be also derived using the RTS function. This is because the minimum
point of the AC function is located where increasing RTS (RTS>1) changes to decreasing RTS
(RTS<1). That is, the MES occurs where RTS is 1. Zellner and Revankar (1969) first
introduced the method of finding MES using the RTS function based on the generalised
production function and then Zellner and Ryu (1998) elaborated the method by additionally
deriving the AC function from the RTS function. Our study follows their method as explained
below.
3.2. The production function to the RTS function
Suppose a generic production function
𝑓 = 𝑓(𝐾, 𝐿) (1)
where f is a homogeneous function of degree μ, K and L are factors of production and 𝑑𝑓
𝑑𝐾> 0
and 𝑑𝑓
𝑑𝐿> 0. K and L commonly represent the amount of capital and labour, but any main
factors of production can be used for this purpose.
The monotonic transformation of f yields a homothetic production function (y), which is
defined as a generalised production function (Zellner and Revankar, 1969).
𝑦 = 𝑦(𝑓) (2)
where y=0 if f=0 and 𝑑𝑦
𝑑𝑓> 0. The main property of a homothetic production function is that
marginal rate of technical substitution between K and L is homogenous of degree zero, i.e. it
does not depend on the proportional increase of the factors of production.
Then, the RTS function is defined as Zellner and Ryu (1998).
𝛼(𝑦) = 𝛼(𝑑𝑦/𝑦)/(𝑑𝑓/𝑓) (3)
where α is a scale parameter which is also an initial value of RTS at y=0.
Its functional form can be specified following Zeller and Ryu (1998).
𝛼(𝑦) = 𝛼/(1 + 𝜃𝑦) (4)
If θ>0, RTS decreases as y goes up, but it increases if θ<0.
3.3. MES and the average cost (AC) function
Rearrange the RTS function (4) for y,
𝑦 = (𝛼 − 𝛼(𝑦))/𝛼(𝑦)𝜃 (5)
The average cost minimising production level, i.e. the minimum efficient scale (MES), is found
where RTS is 1. Thus, the value of the MES is:
𝑦∗ = (𝛼 − 1)/𝜃 (6)
On the other hand, the RTS function is alternatively defined as:
α(y) = AC(y)/MC(y) (7)
where AC(y) is an average cost function and MC(y) is a marginal cost function. Since a total
cost (TC) function is defined in terms of an average cost function as TC(y) = 𝑦AC(𝑦), solving
the optimisation problem of the total cost function yields1:
ln𝑇𝐶(𝑦) = 𝑐 + ∫ (1/𝛼(𝑦)𝑦)𝑑𝑦 (8)
where c is the constant of integration.
1 See Zellner and Ryu (1998) for technical details.
Then, using the specified RTS function in (4) and solving the above equation, the average cost
(AC) function can be fully derived.
ln 𝐴𝐶 = ln (𝑐) + ((1 − 𝛼)ln𝑦 + 𝜃𝑦)/𝛼 (9)
3.4. Estimation method
Substitute (4) for α(y) in (3) and solve the differential equation.
𝑙𝑛𝑦 + 𝜃𝑦 = 𝑙𝑛𝑓 (10)
Now substitute a Cobb-Douglas production function 𝑓(𝐾, 𝐿) = 𝛾𝐾𝛼(1−𝛿)𝐿𝛼𝛿 for f.
𝑙𝑛𝑦 + 𝜃𝑦 = ln𝛾 + 𝛼(1 − 𝛿)𝑙𝑛𝐾 + 𝛼𝛿𝑙𝑛𝐿 (11)
where α is a scale parameter as defined above and δ is a weight parameter.
Assuming an identically and independently distributed error term that follows a normal
distribution, the log likelihood (LL) function of (11) can be derived.
𝐿𝐿 = 𝑐′ + (𝑁/2)ln [∑{𝑙𝑛𝑦 + 𝜃𝑦 − 𝑙𝑛𝛾 − 𝛼(1 − 𝛿)𝑙𝑛𝐾 − 𝛼𝛿𝑙𝑛𝐿}2
𝑁
𝑖=1
]
+ ∑ ln (1 + 𝜃𝑦)
𝑁
𝑖=1
(12)
where N is observation size, i is an observation index and c’ is a constant
The individual contribution (ll) is:
𝑙𝑙 = −(1/2)lnσ2 − (1/2𝜎2){𝑙𝑛𝑦 + 𝜃𝑦 − 𝑙𝑛𝛾 − 𝛼(1 − 𝛿)𝑙𝑛𝐾 − 𝛼𝛿𝑙𝑛𝐿}2
+ ln (1 + 𝜃𝑦) (13)
Then, the numerical optimisation in the Maximum Likelihood Estimation (MLE) method can
estimate the unknown parameters, σ, θ, α and δ. We use Marquardt algorithm (Marquardt, 1963)
for this study. The value of α is obtained by adding two coefficient estimates (α = α(1-δ) + αδ)
and the value of δ is subsequently obtained by dividing αδ by α. Finally, the AC function and
the MES value can be obtained as outlined in (6) and (9).
3.5. Data
The sample used in this study consists of 24 CTOs in ten Korean ports, which covered95.8%
of total throughput of Korea in 2013. The data are combined from Data Analysis, Retrieval and
Transfer (DART) System of Financial Supervisory Service (FSS) of the Korean government,
Korea Port Logistics Association (KPLA), the Korea Chamber of Commerce and Industry
(KCCI), the website of port authorities, website of each Regional Oceans & Fisheries
Administration (ROFA), the website of Shipping and Port Integrated Data Centre (SP-IDC)
and website of each CTO. The list of the CTOs is reported in Table 1.
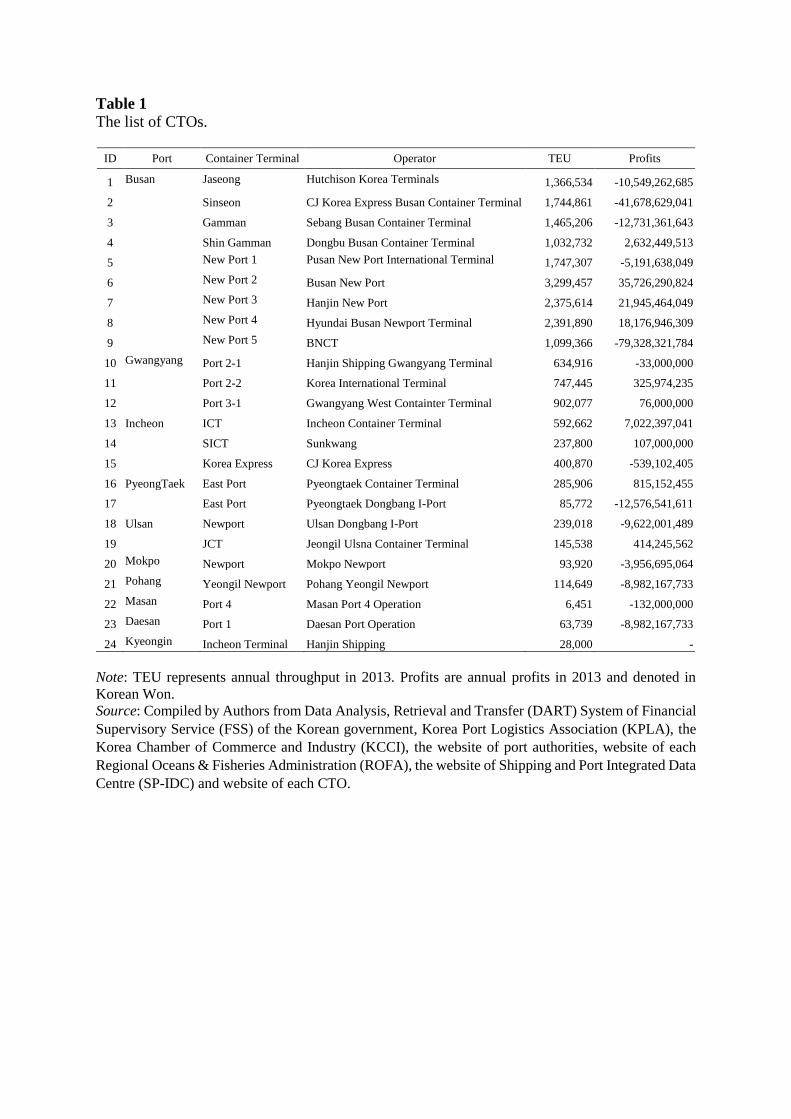
Table 1
The list of CTOs.
ID Port Container Terminal Operator TEU Profits
1 Busan Jaseong Hutchison Korea Terminals 1,366,534 -10,549,262,685
2 Sinseon CJ Korea Express Busan Container Terminal 1,744,861 -41,678,629,041
3 Gamman Sebang Busan Container Terminal 1,465,206 -12,731,361,643
4 Shin Gamman Dongbu Busan Container Terminal 1,032,732 2,632,449,513
5 New Port 1 Pusan New Port International Terminal 1,747,307 -5,191,638,049
6 New Port 2 Busan New Port 3,299,457 35,726,290,824
7 New Port 3 Hanjin New Port 2,375,614 21,945,464,049
8 New Port 4 Hyundai Busan Newport Terminal 2,391,890 18,176,946,309
9 New Port 5 BNCT 1,099,366 -79,328,321,784
10 Gwangyang Port 2-1 Hanjin Shipping Gwangyang Terminal 634,916 -33,000,000
11 Port 2-2 Korea International Terminal 747,445 325,974,235
12 Port 3-1 Gwangyang West Containter Terminal 902,077 76,000,000
13 Incheon ICT Incheon Container Terminal 592,662 7,022,397,041
14 SICT Sunkwang 237,800 107,000,000
15 Korea Express CJ Korea Express 400,870 -539,102,405
16 PyeongTaek East Port Pyeongtaek Container Terminal 285,906 815,152,455
17 East Port Pyeongtaek Dongbang I-Port 85,772 -12,576,541,611
18 Ulsan Newport Ulsan Dongbang I-Port 239,018 -9,622,001,489
19 JCT Jeongil Ulsna Container Terminal 145,538 414,245,562
20 Mokpo Newport Mokpo Newport 93,920 -3,956,695,064
21 Pohang Yeongil Newport Pohang Yeongil Newport 114,649 -8,982,167,733
22 Masan Port 4 Masan Port 4 Operation 6,451 -132,000,000
23 Daesan Port 1 Daesan Port Operation 63,739 -8,982,167,733
24 Kyeongin Incheon Terminal Hanjin Shipping 28,000 -
Note: TEU represents annual throughput in 2013. Profits are annual profits in 2013 and denoted in
Korean Won.
Source: Compiled by Authors from Data Analysis, Retrieval and Transfer (DART) System of Financial
Supervisory Service (FSS) of the Korean government, Korea Port Logistics Association (KPLA), the
Korea Chamber of Commerce and Industry (KCCI), the website of port authorities, website of each
Regional Oceans & Fisheries Administration (ROFA), the website of Shipping and Port Integrated Data
Centre (SP-IDC) and website of each CTO.
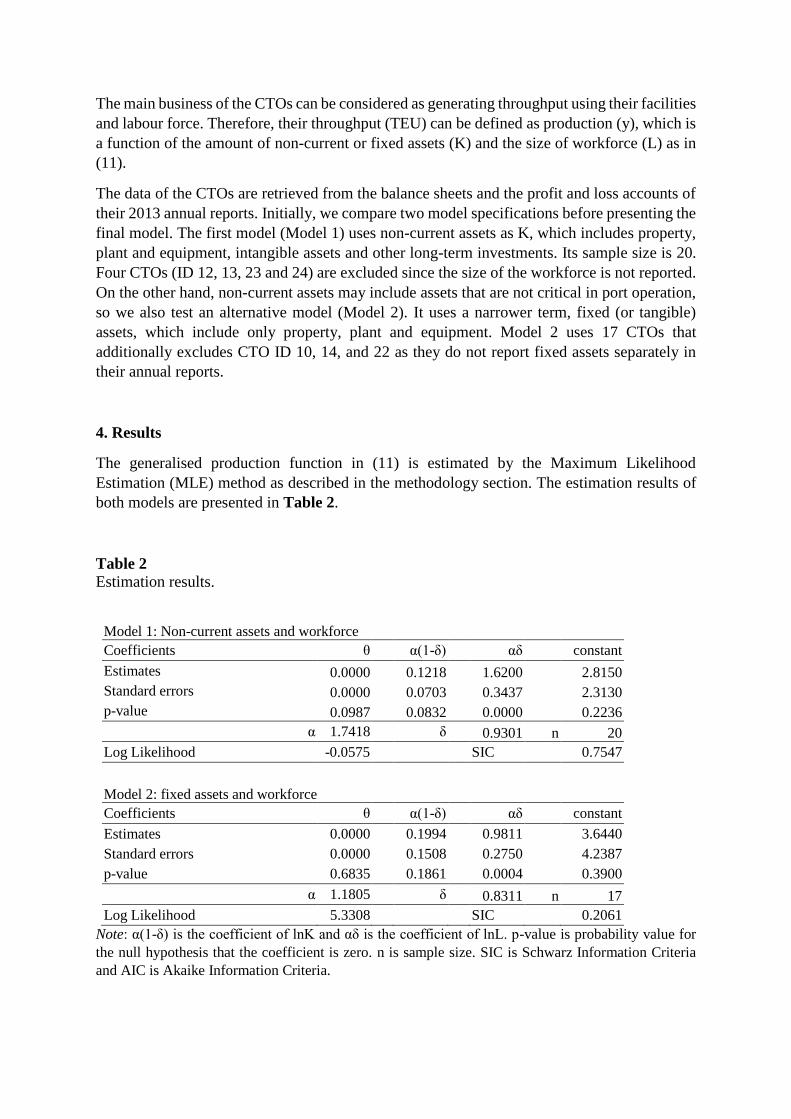
The main business of the CTOs can be considered as generating throughput using their facilities
and labour force. Therefore, their throughput (TEU) can be defined as production (y), which is
a function of the amount of non-current or fixed assets (K) and the size of workforce (L) as in
(11).
The data of the CTOs are retrieved from the balance sheets and the profit and loss accounts of
their 2013 annual reports. Initially, we compare two model specifications before presenting the
final model. The first model (Model 1) uses non-current assets as K, which includes property,
plant and equipment, intangible assets and other long-term investments. Its sample size is 20.
Four CTOs (ID 12, 13, 23 and 24) are excluded since the size of the workforce is not reported.
On the other hand, non-current assets may include assets that are not critical in port operation,
so we also test an alternative model (Model 2). It uses a narrower term, fixed (or tangible)
assets, which include only property, plant and equipment. Model 2 uses 17 CTOs that
additionally excludes CTO ID 10, 14, and 22 as they do not report fixed assets separately in
their annual reports.
4. Results
The generalised production function in (11) is estimated by the Maximum Likelihood
Estimation (MLE) method as described in the methodology section. The estimation results of
both models are presented in Table 2.
Table 2
Estimation results.
Model 1: Non-current assets and workforce
Coefficients θ α(1-δ) αδ constant
Estimates 0.0000 0.1218 1.6200 2.8150
Standard errors 0.0000 0.0703 0.3437 2.3130
p-value 0.0987 0.0832 0.0000 0.2236
α 1.7418 δ 0.9301 n 20
Log Likelihood -0.0575 SIC 0.7547
Model 2: fixed assets and workforce
Coefficients θ α(1-δ) αδ constant
Estimates 0.0000 0.1994 0.9811 3.6440
Standard errors 0.0000 0.1508 0.2750 4.2387
p-value 0.6835 0.1861 0.0004 0.3900
α 1.1805 δ 0.8311 n 17
Log Likelihood 5.3308 SIC 0.2061
Note: α(1-δ) is the coefficient of lnK and αδ is the coefficient of lnL. p-value is probability value for
the null hypothesis that the coefficient is zero. n is sample size. SIC is Schwarz Information Criteria
and AIC is Akaike Information Criteria.
The size of workforce (L) significantly and positively affects the amount of throughput in both
models as the coefficients, αδ, indicate. That is, the larger workforce leads to more TEU
processed. It is consistent with what is usually expected from container port operation. The
weight of workforce (δ) in producing throughput is also large. On the other hand, the
importance of non-current or fixed assets (K) is relatively weak in both estimation results and
only significant in Model 1. When two models are compared in terms of their explaining power,
Model 1 seems to be a stronger model in terms of the significance of individual coefficients
and the higher values of information criteria, although log likelihood value is larger in Model
2. This is probably because Model 2 uses smaller sample size and a narrower definition of
assets.
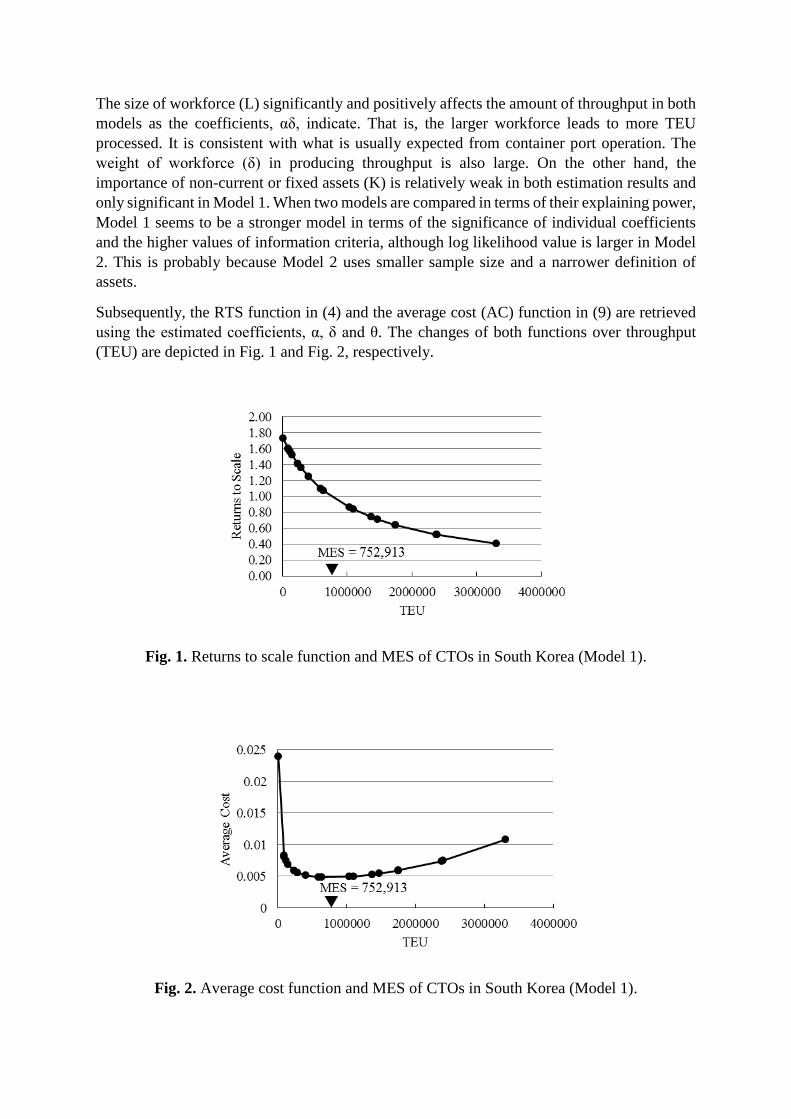
Subsequently, the RTS function in (4) and the average cost (AC) function in (9) are retrieved
using the estimated coefficients, α, δ and θ. The changes of both functions over throughput
(TEU) are depicted in Fig. 1 and Fig. 2, respectively.
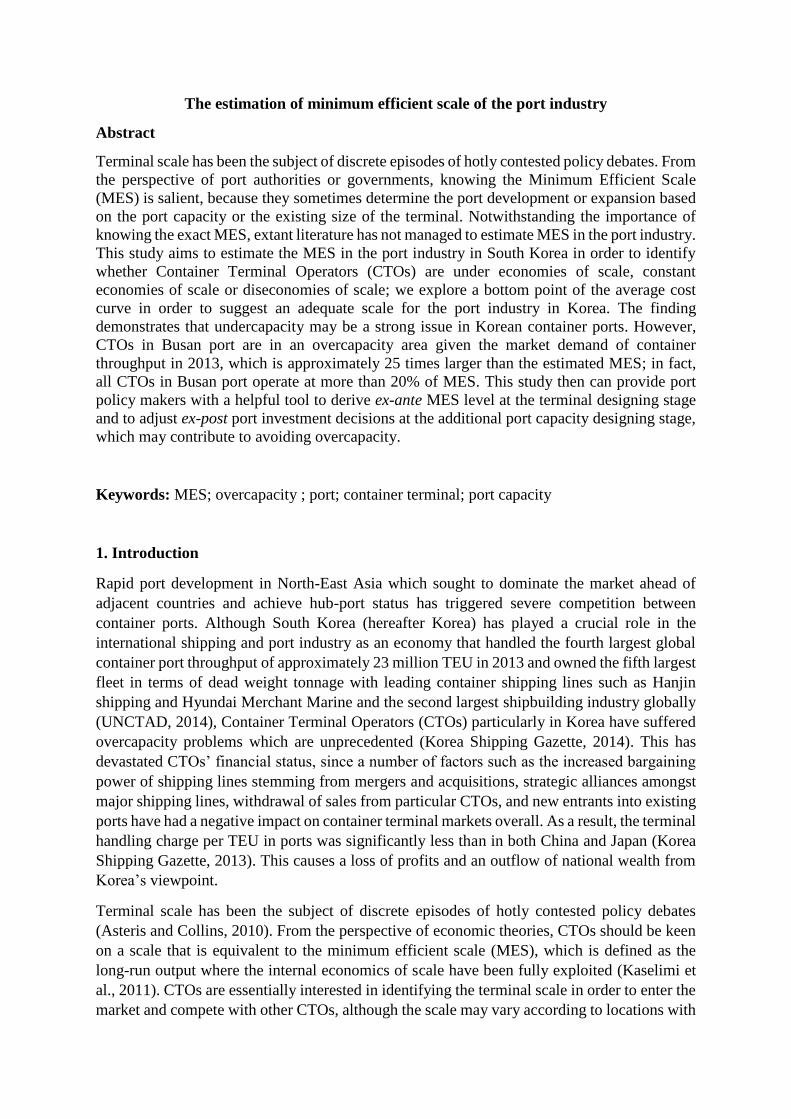
Fig. 1. Returns to scale function and MES of CTOs in South Korea (Model 1).
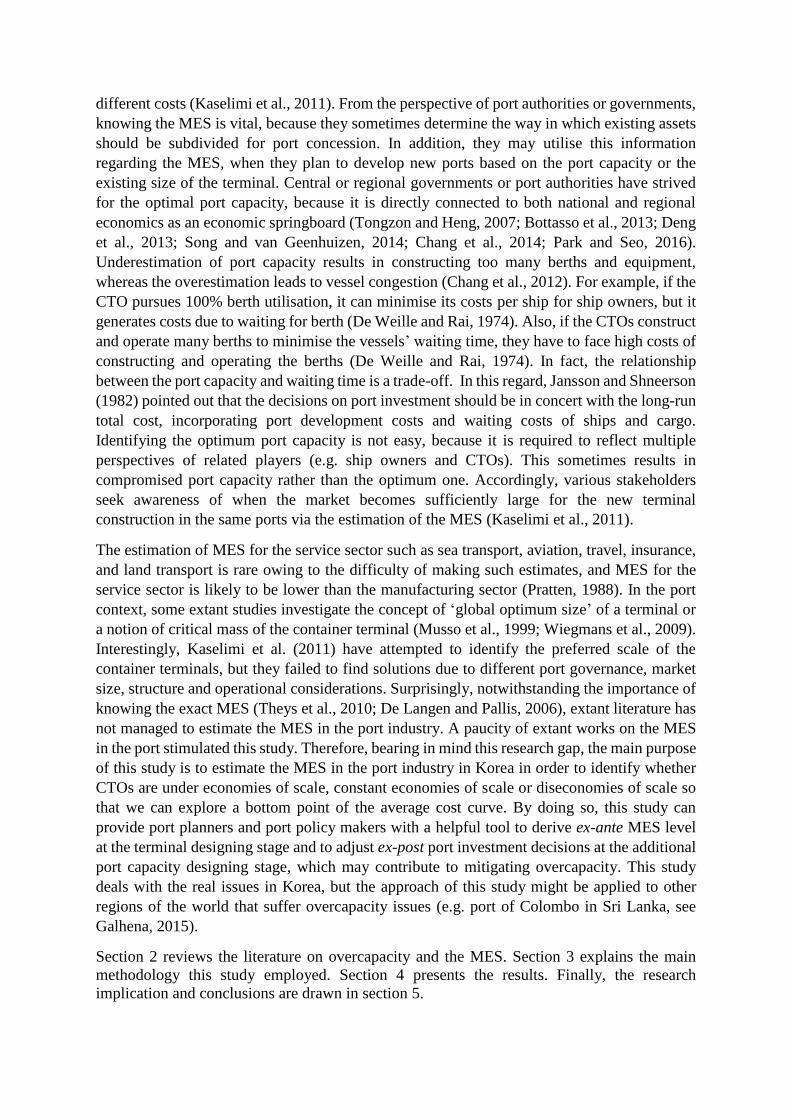
Fig. 2. Average cost function and MES of CTOs in South Korea (Model 1).
Note: Each dot represents the returns to scale or the average cost of container terminal operators. The
constant of integration in (9) is not estimated due to the lack of cost data. Therefore, average costs in y
axis do not correspond to the container terminal operators’ estimated costs.The value of the MES is
calculated as 752,913 TEU using (6). In Fig 1, the value of RTS starts from 1.7418 (α at y=0),
which corresponds to increasing RTS (RTS>1), and declines as throughput (y) increases. RTS
reaches 1 at the MES and eventually goes below 1, showing decreasing RTS. In Fig. 2, average
cost function declines quickly to a minimum point, i.e., the MES, and then increases relatively
slowly afterwards. This curvature of the average cost function is similar to what was anticipated
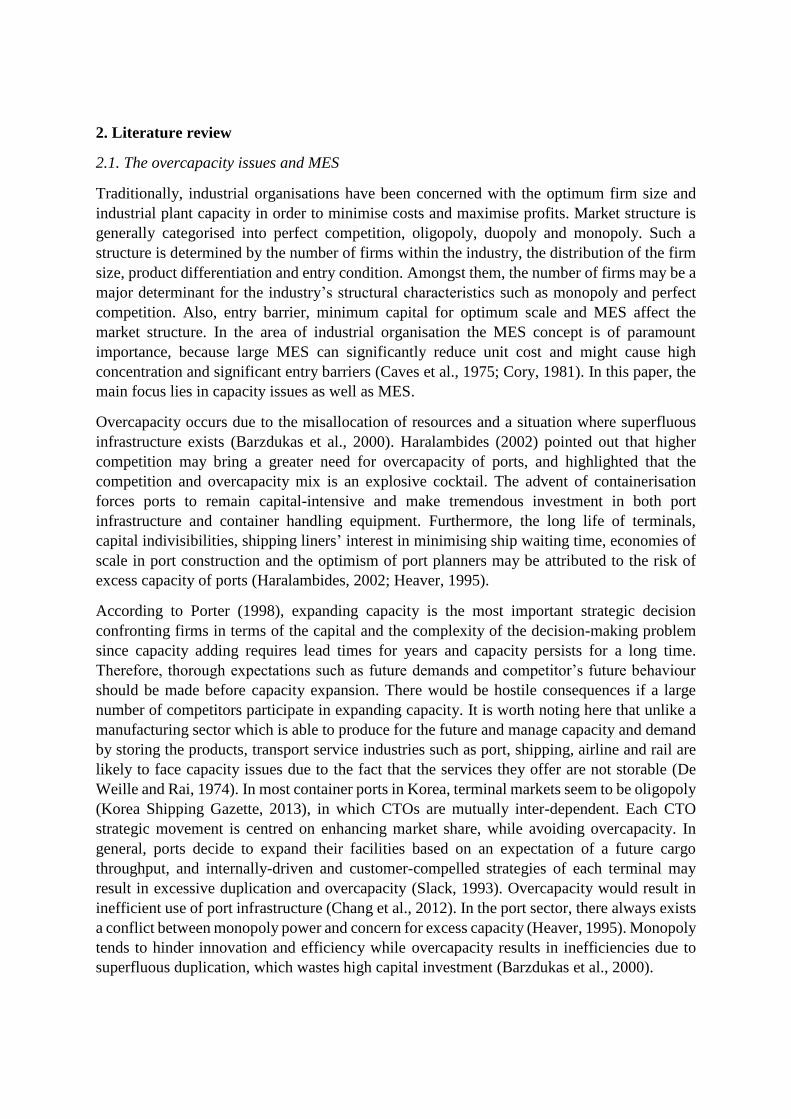
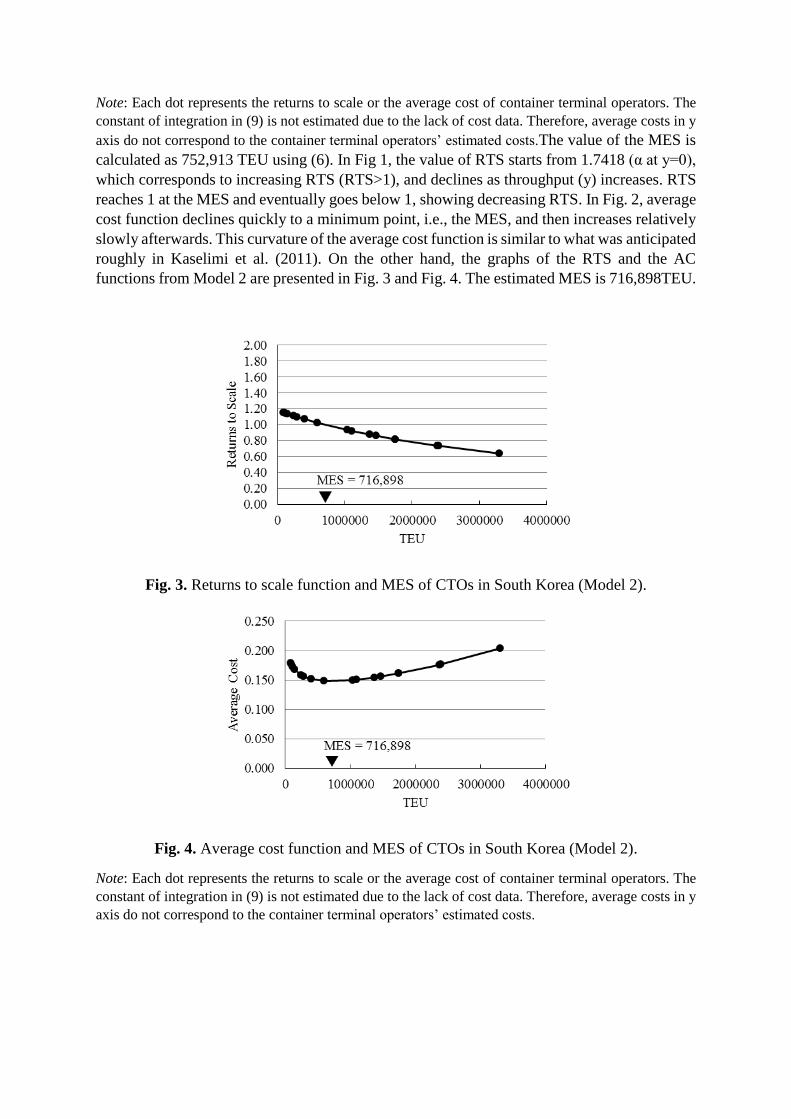
roughly in Kaselimi et al. (2011). On the other hand, the graphs of the RTS and the AC
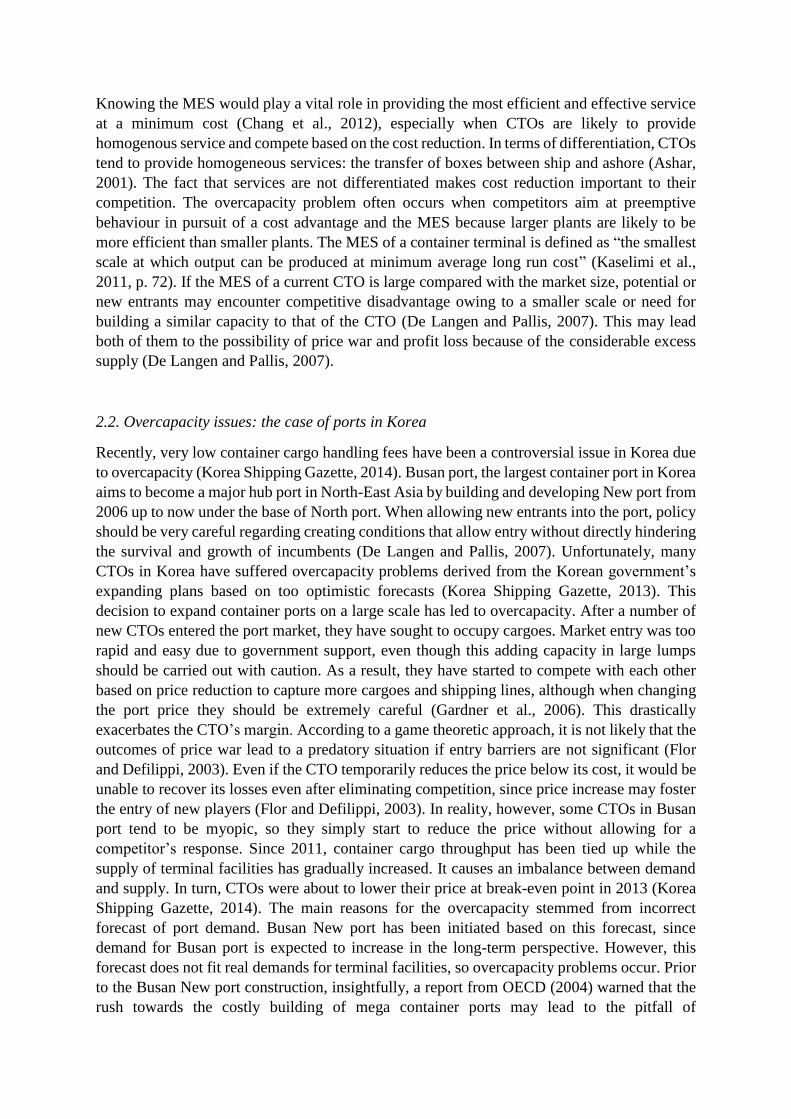
functions from Model 2 are presented in Fig. 3 and Fig. 4. The estimated MES is 716,898TEU.
Fig. 3. Returns to scale function and MES of CTOs in South Korea (Model 2).
Fig. 4. Average cost function and MES of CTOs in South Korea (Model 2).
Note: Each dot represents the returns to scale or the average cost of container terminal operators. The
constant of integration in (9) is not estimated due to the lack of cost data. Therefore, average costs in y
axis do not correspond to the container terminal operators’ estimated costs.
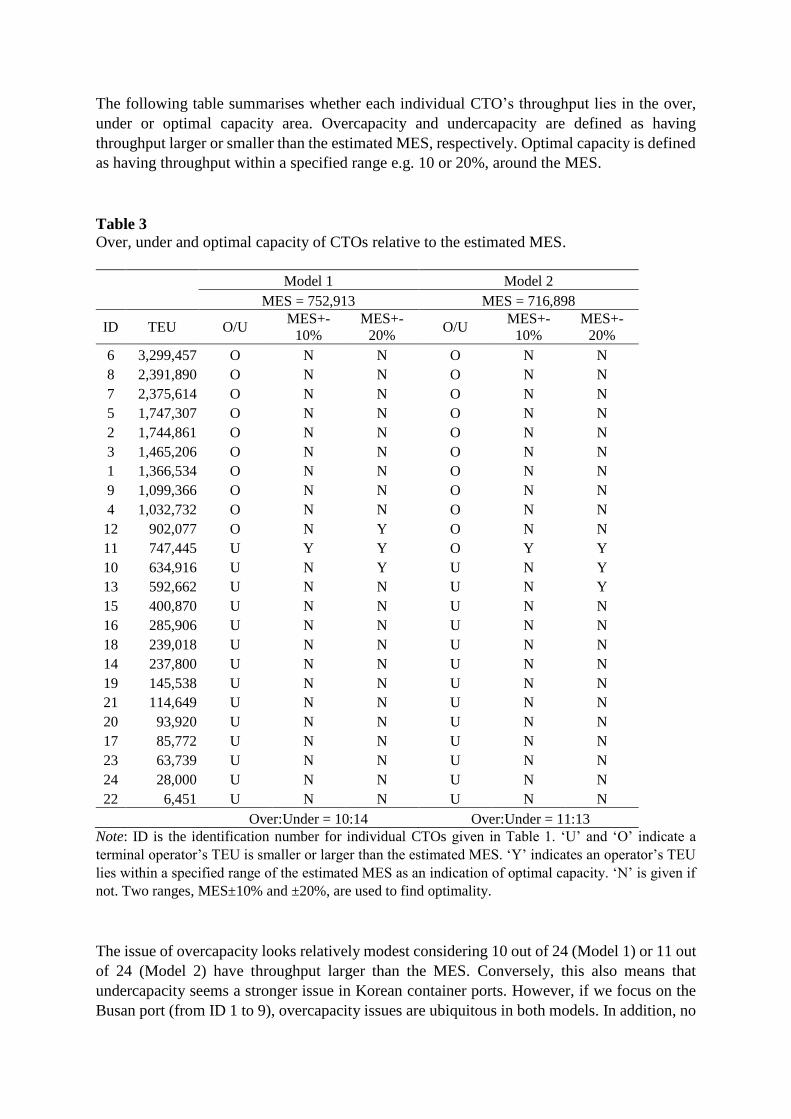
The following table summarises whether each individual CTO’s throughput lies in the over,
under or optimal capacity area. Overcapacity and undercapacity are defined as having
throughput larger or smaller than the estimated MES, respectively. Optimal capacity is defined
as having throughput within a specified range e.g. 10 or 20%, around the MES.
Table 3
Over, under and optimal capacity of CTOs relative to the estimated MES.
Model 1 Model 2
MES = 752,913 MES = 716,898
ID TEU O/U MES+-
10%
MES+-
20% O/U
MES+-
10%
MES+-
20%
6 3,299,457 O N N O N N
8 2,391,890 O N N O N N
7 2,375,614 O N N O N N
5 1,747,307 O N N O N N
2 1,744,861 O N N O N N
3 1,465,206 O N N O N N
1 1,366,534 O N N O N N
9 1,099,366 O N N O N N
4 1,032,732 O N N O N N
12 902,077 O N Y O N N
11 747,445 U Y Y O Y Y
10 634,916 U N Y U N Y
13 592,662 U N N U N Y
15 400,870 U N N U N N
16 285,906 U N N U N N
18 239,018 U N N U N N
14 237,800 U N N U N N
19 145,538 U N N U N N
21 114,649 U N N U N N
20 93,920 U N N U N N
17 85,772 U N N U N N
23 63,739 U N N U N N
24 28,000 U N N U N N
22 6,451 U N N U N N
Over:Under = 10:14 Over:Under = 11:13
Note: ID is the identification number for individual CTOs given in Table 1. ‘U’ and ‘O’ indicate a
terminal operator’s TEU is smaller or larger than the estimated MES. ‘Y’ indicates an operator’s TEU
lies within a specified range of the estimated MES as an indication of optimal capacity. ‘N’ is given if
not. Two ranges, MES±10% and ±20%, are used to find optimality.
The issue of overcapacity looks relatively modest considering 10 out of 24 (Model 1) or 11 out
of 24 (Model 2) have throughput larger than the MES. Conversely, this also means that
undercapacity seems a stronger issue in Korean container ports. However, if we focus on the
Busan port (from ID 1 to 9), overcapacity issues are ubiquitous in both models. In addition, no
CTOs in Busan port are within the range of optimal capacity around the MES. Only 3 out of
24 CTO throughputs are within the 20% range of the MES in both Model 1 and 2.
5. Concluding Remarks
Notwithstanding the importance of MES in any industry, extant literature has failed to estimate
the MES of the port industry. Although some approaches (see Kaselimi et al. 2011) have been
undertaken to seek MES, no single study accurately estimated the MES in the port industry.
By adopting Zellner and Revankar (1969) and Zellner and Ryu (1998), this study suggests and
applies a new approach to estimate the MES of the port industry with Korean data, which may
contribute to providing port policy makers and port planners with insights when they consider
reshaping policies pertaining to port competition, port concession, port planning and
overcapacity. When they have no confidence in future demands in the near future and need to
estimate the proper terminal scale, the results of this study by estimating the MES can offer
valuable information.
The results from the calculated value of the MES indicate that 14 (Model 1) or 13 (Model 2)
out of 24 CTOs operate in sub-MES scale i.e. their TEU’s are smaller than the MES (Model
1). This finding may indicate that an excessive number of CTOs exist in the market, which also
increases overcapacity and worsens their cost structure as seen in their negative profits in Table
1. Additionally, Fig. 1 and 2 show that the CTOs’ TEUs are widely spread around the estimated
MES. That is, their operations are overall far from optimal in terms of the distance of their
TEUs from the MES. Also, only three CTOs are within the 20 % range of the MES (Table 3).
Most of them are not likely to efficiently operate the terminal, because average costs are
relatively high. It implies that CTOs that have small scales undertake the terminal operation
with high operating costs. However, it can be argued that overall the port capacity in Busan
port may lean towards overcapacity since all of the CTOs in Busan operate at more than 20%
of MES. This finding is consistent with major Korean shipping news that in particular Busan
port has encountered overcapacity (Korea Shipping Gazette, 2014). De Langen and Pallis
(2006; p. 9) ascertained “an important condition for the viability of intra competition is that the
market should be at least twice as large as the MES for providing a port service”. In the case
of Busan port, their market demand of container throughput in 2013 was approximately
17,686,099TEU 2 (KPLA, 2015), which is approximately 25 (17,686,099/716,898=24.67)
times that of the MES. This may cause excessive intra competition, since large market size
relative to the MES leads to intra-port competition. It is found that the number of CTOs in
Korea is increasing, whereas their profits have been decreasing over recent years, causing
overcapacity issues. Interestingly, this finding would be similar to Chang et al. (2012)’s
findings that the Korean government appeared to have over-invested in recent port
developments.
A possible explanation for the above results would be that since 1997 the Korean government
has changed the policy from the license system to the registration one when CTOs enter the
port market. At the same time, the registration requirement has been significantly alleviated
(Korea Shipping Gazette, 2014). As a result, many CTOs could easily enter the market. Then,
2 This is slightly different from the sum of TEU in Busan port in Table 1, since some terminals (e.g. Gamcheon
Hanjin terminal: 264TEU, Uam terminal: 514,920TEU, General terminal: 598,215TEU, multi-purpose terminal:
49,734TEU) were not included in the analysis due to the lack of data availability (e.g. turnover and profit).
there has been overcapacity. This devastated the existing and new CTOs’ profits. Notably, this
phenomenon is contrary to the EU case. As an example, until the mid 1990s, EU was likely to
be protectionist by awarding new terminals to incumbents when their terminal business was
not lucrative and financial condition was weak (Rodrigue et al., 2011). Interestingly, De
Langen and Pallis (2007) found that there is only one CTO in almost half the ports they
surveyed in the EU. On the other hand, for instance, Busan North port had ten CTOs before the
construction of new ports, but over five CTOs entered the port market in the period between
2007 and 2010. It can be argued that the overcapacity issue is not surprising given that there
are too many CTOs in one port who are attracting the same customers in similar geographical
ranges. Hutchison Korea Terminals, subsidiary of Hong Kong’s Hutchison Port Holdings
(HPH) suspended the one berth at Gamman terminal, and declared that they would return the
berth to the Busan port authority because of overcapacity and financial difficulty, although it
has obtained a concession period between 2002 and 2027 (Monthly Maritime Korea, 2013).
This phenomenon typically shows that the HPH, whose port operation expertise is the best in
the world, also could not manage to deal with overcapacity of Busan port in Korea. As a matter
of fact, this issue should be carefully handled by government intervention and new port policy,
since there may be no room for implementing strategic movement under such overcapacity.
Terada (2002; p. 3) argued that for under/overcapacity issues in ports “government intervention
is necessary to correct the market failure and attain the socially optimal quantity of the public
service that the facility generates”. Economic theories claimed that when an incumbent faces
new entrants in the market, it tends to adopt a pre-emptive pricing strategy or to establish
excessive capacity so as to defend its market status (Spence, 1977; Eaton and Lipsey, 1977).
However, if the entrants have competitive advantage such as better location or technology, then
the above actions do not prevent the growth of the entrants (Luo et al., 2012). Interestingly,
Busan North ports, which are incumbents, encounter financial difficulty, whilst the profit of
Busan New port’s CTOs (entrants) seems adequate (see Table 1). The reason for this would be
that Busan New port has faster container cargo handling equipment, deeper water depth and
better location to accommodate the mega container ships.
Before awarding concession, government or port authorities therefore should try to find a
balance between economies of scale and overcapacity so as to make sure economies of scale
are passed on to the customers and CTOs earn appropriate profits (Kaselimi et al., 2011). In
order to exploit the economies of scale, the Korean government may initiate the integration of
CTOs that have not reached the MES as long as their geographical location is in proximity.
Central government body (Ministry of Ocean and Fisheries) recognised the need for integration
of the CTOs, so it has tried to integrate four CTOs into one at Gamman terminal of Busan
North port. Gamman terminal has four berths. It was operated by four CTOs, each of which
was in charge of one berth. Further, government policy promotes the integration between
Sinsundae terminal and Uam terminal of Busan North port. Once, integration is complete, they
operate the combined berths together. It may be interpreted that this integration is a belated
effort to mitigate overcapacity on purpose. This promotion of integration was not based on the
estimation of the MES. If the government conducted the estimation of the MES in regard to
whether awarding one terminal or splitting it into multiple CTOs before allowing too many
CTOs to enter this market (Theys et al., 2010), it would avoid the wasteful overcapacity of the
port industry in Korea. In terms of port policy, it should not be overlooked that the aim of
government and port authorities is to maximise the annual cargo throughput per area so as to
shun constructing new terminal capacities until all existing capacities are fully exploited and
the level of ship waiting time and berth occupancy is intolerable (Bassan, 2007). It would be
plausible that in order to increase port capacity and avoid additional berth construction port
planers should concentrate on improving operational productivity by employing re-layouts of
port facilities and horizontal integration between CTOs (Vis, 2006; Chang et al., 2012). The
managers of CTOs also should be aware that setting prices below costs to entice cargoes from
other rivals amidst intense intra and inter competition is not an advisable strategy
(Haralambides, 2002), because it drives all CTOs towards a zero-sum game.
Prior to concluding this paper, it should be noted that this paper argues that ports (or CTOs)
might compete primarily on cost due to the rather substitutable nature of the service when the
shipping line chooses the CTO. However, numerous previous studies on port competitiveness
and port selection contended that there are a number of other determinants such as physical
location, reliability of schedules in port, faster handling operations, inter-modal link, port
congestion, port safety, skilled port labour etc (Tongzon and Heng, 2005; Yeo et al., 2008;
Chang et al., 2008; Wang et al., 2014; Yang and Chen, 2016). As Kaselimi et al. (2011) stressed
that many other factors affect the preferred scaled observed in practice compared to the actual
MES, it may be plausible to admit that identifying the MES is only part of the story pertaining
to the optimal level of output. Owing to a difficulty in identifying MES which derived from
other considerable factors such as different port governance, market size, structure and
operational considerations (Kaselimi et al., 2011), in practice, it can be argued that many ports
in the world operate with half that level of output and consider themselves easily large enough
to be achieving economies of scale.
Despite this study’s novelty, it has several limitations. The estimation results show that the
amount of throughput is explained by the size of the workforce well. However, the causation
may not be uni-directional since the larger throughput could cause more employment. Also,
different specifications of the RTS functions could be tested in the future research. On the other
hand, non-current or fixed assets are not strongly significant in producing throughput in the
results. A couple of reasons could be behind this finding. First, the large amount of non-current
or fixed assets does not always guarantee the increase in throughput since they are more closely
related to the capacity not actual processing. Thus, the linkage between non-current or fixed
assets and throughput seems weaker than normally expected. Second, the accounts of non-
current and fixed assets in annual reports may not fully reflect the essential assets in container
terminal operation. The use of more relevant datasets is recommended for future research. This
study has a weakness in terms of generalisation because the data were collected from only
Korea. Nonetheless, the main application of this research might be applied to other regions
such as China and South-East Asia where overcapacity is getting fierce. Finally, this study only
explored the container port industry. Accordingly, future research can investigate the liquid
and dry bulk port sector.
Acknowledgements
The authors express their gratitude to the editor, Prof. José Manuel Vassallo, and anonymous
referees for their constructive and insightful comments on this paper.
References
Ashar, A., 2001. Strategic pricing in newly privatised ports. Maritime Economics & Logistics
3 (1), 52-78.
Asteris, M., Collins, A., 2010. UK container port investment and competition: impediments
to the market. Transport Reviews 30 (2), 163-178.
Barzdukas, D., Devore, J., Gamble, H., Kopp, J., 2000. Competition and cooperation as trade
policy: past lessons and future opportunities for the port of Tacoma and port of Seattle.
University of Washington Global Trade, Transportation, and Logistics Studies.
Bassan, S., 2007. Evaluating seaport operation and capacity analysis-preliminary
methodology. Maritime Policy & Management 34 (1), 3-19.
Bottasso, A., Conti, M., Ferrari, C., Merk, O., Tei, A., 2013. The impact of port throughput
on local employment: evidence from a panel of European regions. Transport Policy 27, 32-
38.
Caves, R.E., Khalilzadeh-Shirazi, J., Porter, M.E., 1975. Scale economies in statistical
analyses of market power. The Review of Economics and Statistics 57 (2), 133-140.
Chang, Y.-T., Shin, S.-H., Lee, P.T.-W., 2014. Economic impact of port sectors on South
African economy: an input-output analysis. Transport policy 35, 333-340.
Chang, Y.-T., Tongzon, J., Luo, M., Lee, P. T.-W., 2012. Estimation of optimal handling
capacity of a container port: an economic approach. Transport Reviews 32 (2), 241-258.
Chang, Y.-T., Lee, S.-Y., Tongzon, J.L., 2008. Port selection factors by shipping lines:
different perspectives between trunk liners and feeder service provider. Marine Policy 32 (6),
877-885.
Cory, P.F., 1981. A technique for obtaining improved proxy estimates of minimum optimal
scale. The Review of Economics and Statistics 63 (10), 96-106.
De Langen, P.W., Pallis, A.A., 2007. Entry barriers in seaports. Maritime Policy and
Management 34 (5), 427-440.
De Langen, P.W., Pallis, A.A., 2006. Analysis of the benefits of intra-port competition.
International Journal of Transport Economics 33 (1), 69-85.
De Weille, J., Ray, A., 1974. The optimum port capacity. Journal of Transport Economics
and Policy 8 (3), 244-259.
Deng, P., Lu, S., Xiao, H., 2013. Evaluation of the relevance measure between ports and
regional economy using structural equation modelling. Transport Policy 27, 123-133.
Eaton, B.C., Lipsey, R.G., 1979. The theory of market pre-emption: the persistence of excess
capacity and monopoly in growing spatial markets. Economica 46 (182), 149-158.
Flor, L., Defilippi, E., 2003. Port infrastructure: an access model for the essential facility.
Maritime Economics & Logistics 5 (2), 116-132.
Galhena, R., 2015. Container port overcapacity is bad! The Sunday Leader.
http://www.thesundayleader.lk/2015/03/01/container-port-overcapacity-is-bad/
Gardner, B., Marlow, P., Pettit, S., 2006. Full cost recovery in EU ports operating as
commercial undertaking. Transport Policy 13, 2-21.
Haralambides, H., 2002. Competition, excess capacity, and the pricing of port infrastructure.
International Journal of Maritime Economics 4 (4), 323-347.
Heaver, T.D., 1995. The implications of increased competition among ports for port policy
and management. Maritime Policy & Management 22 (2), 125-133.
Jansson, J.O., Shneerson, D., 1982. Port Economics. The MIT Press, London.Kaselimi, E.N.,
Notteboom, T.E., Pallis, A.A., Farrell, S., 2011. Minimum efficient scale (MES) and
preferred scale of container terminals. Research in Transportation Economics 32 (1), 71-80.
Korea Shipping Gazette, 2013.
http://www.ksg.co.kr/news/news_print.jsp?bbsID=news&bbsCategory=KSG&pNum=88579.
Korea Shipping Gazette, 2014.
http://ksg.co.kr/news/news_view.jsp?bbsID=news&pNum=96579&bbsCategory=KSG&cate
goryCode=RKC.
KPLA., 2015. Port handling brochure, Korea Port Logistics Association.
Luo, M., Liu, L., Gao, F., 2012. Post-entry container port capacity expansion. Transportation
Research Part B: Methodological 46 (1), 120-038.
Marquardt, D.W., 1963. An algorithm for least-scares estimation of nonlinear parameters.
Journal of the Society for Industrial and Applied Mathematics 11 (2), 431-441.
Monthly Maritime Korea, 2013.
http://monthlymaritimekorea.com/news/articleView.html?idxno=12285.
Musso, E., Ferrari, C., Benacchio, M., 1999. On the global optimum size of port terminals.
International Journal of Transport Economics 26 (3), 415-437.
OECD., 2004. OECD Territorial Reviews: Busan, Korea. http://www.oecd-
ilibrary.org/urban-rural-and-regional-development/oecd-territorial-reviews-busan-korea-
2005_9789264007604-en;jsessionid=25c3694ge05j2.x-oecd-live-03.
Park, J.S., Seo, Y.-J., 2016. The impact of seaports on the regional economies in South
Korea: panel evidence from the augmented Solow model. Transportation Research Part E:
Logistics and Transportation Review 85, 107-119.
Porter, M.E., 1998. Competitive Advantage: Creating and Sustaining Superior Performance.
Free Press, New York.
Pratten, C., 1988. A Survey of the Economics of Scale. Commission of the European
Communities, Brussels.
Rodrigue, J.-P., Notteboom, T., Pallis, A.A., 2011. The financialization of the port and
terminal industry: revisiting risk and embeddedness. Maritime Policy & Management 38 (2),
1-23.
Slack, B., 1993. Pawns in the game: ports in a global transportation system. Growth and
Change 24 (4), 579-588.
Song, L., van Geenhuizen, M., 2014. Port infrastructure investment and regional economic
growth in China: panel evidence in port regions and provinces. Transport Policy 36, 173-183.
Spence, A.M., 1977. Entry, capacity, investment and oligopolistic pricing. The Bell Journal
of Economics 8 (2), 534-544.
Terada, H., 2002. An analysis of the overcapacity problem under the decentralized
management system of container ports in Japan. Maritime Policy & Management 29 (1), 3-
15.
Theys, C., Notteboom, T.E., Pallis, A.A., De Langen, P.W., 2010. The economics behind the
awarding of terminals in seaports: Towards a research agenda. Research in Transportation
Economics 27 (1), 37-50.
Tongzon, J., Heng, W., 2005. Port privatization, efficiency and competitiveness: some
empirical evidence from container ports (terminals). Transportation Research Part A: Policy
and Practice 39 (5), 405-424.UNCTAD., 2014. Review of Maritime Transport. Geneva.
Vis, I., 2006. A comparative analysis of storage and retrieval equipment at a container
terminal. International Journal of Production Economics 103 (2), 680-693.
Wang, Y., Yeo, G.-T., Ng, A.K.Y., 2014. Choosing optimal bunkering ports for liner
shipping companies: a hybrid Fuzzy-Delphi-TOPSIS approach. Transport Policy 35, 358-
365.Wiegmans, B.W., Konings, R., Priemus, H., 2009. Critical mass for the development of a
new container port in Vlissingen. Maritime Economics & Logistics 11 (4), 399-417.
Yang, Y.-C., Chen, S.-L., 2016. Determinants of global logistics hub ports: comparison of the
port development policies of Taiwan, Korea, and Japan. Transport Policy 45, 179-189.
Yeo, G.-T., Roe, M., Dinwoodie, J., 2008. Evaluating the competitiveness of container ports
in Korea and China 42 (6), 910-921.
Zellner, A., Revankar, N.S., 1969. Generalized production functions. The Review of
Economic Studies 36 (2), 241-250.
Zellner, A., Ryu, H., 1998. Alternative functional forms for production, cost and returns to
scale function. Journal of Applied Econometrics, 13, 101-127.