Embed Size (px)
Citation preview
NASA Technical Memorandum 86664 7- 76 * t
N87-12869 ( N B S A - T f l - E t b 6 4 ) THE E V A L U A ' I I C N CF A NUMBER CP PErOTOTPPES ECE T E E FREE-TIE HOTOR C O N S I A N T - f l O H E N T C C N T R C L L E R ( E i A S A ) 76 p
CSCL Olc U n c l a s G3/37 44614
The Evaluation of a Number of Prototypes for the Free-Tip Rotor Constant-Moment Controller Larry A. Young
February 1986
National Aeronautics and Space Administration
https://ntrs.nasa.gov/search.jsp?R=19870003436 2020-06-14T12:09:33+00:00Z

NASA Technical Memorandum 86664
The Evaluation of a Number of Prototypes for the Free-Tip Rotor Constant-Moment Controller Larry A. Young, Ames Research Center, Mof fe t t Field, California
February 1986
National Aeronautics and
Ames Research Center Moffett Field California 94035
CFIonn A A . - . v ~ ~ ~ + ~ - + ~ ~ ~ dpaLc nul I 1 1 1 IIJLI aiiui I

SUMMARY
This paper describes the development of several prototypes of a constant moment controller, a critical component of the free-tip rotor (FTR) concept. sented are the experimental results of a whirl test designed to select a final controller configuration to be included in a future wind-tunnel test of this innova- tive rotor system. A brief explanation of the FTR concept and its history are included. The paper documents the controller design constraints, each prototype's operating principle, the evaluation test, and the individual prototype test results. A recommended design is identified, along with the selection rationale.
Also pre-
CF
cA
e
IC
'e
I FT
IS
K
KA
KS
1
m
LIST OF SYMBOLS
centrifugal force of controller active mass, N
aerodynamic damping, N-m sec/rad
lag hinge offset, m
2 acceleration caused by gravity, 9.8 m/sec
2 controller polar moment of inertia, kg-m
equivalent polar moment of inertia of the controller and free tip, kg-m 2
free-tip moment of inertia, kg-m 2
2 controller output shaft polar moment of inertia, kg-m
controller spring constant, N-m/rad
aerodynamic spring constant, N-m/rad
spring constant of the helical spring resisting the controller torque output, N-m/deg
torsion strap, active length, m
controller active mass, kg
1

sn r
rC
cg r
P r
rS
T
Tf
TO,T1
V
W
X
8
6
1-I
0
e PT
A0
4
a
w
radial location of controller active mass, with respect t o the axis of rotation, m
torsion strap controller strap moment arm, m
moment arm of the dual cam controller pin action, before cam angular dis- placement, m
moment arm of dual cam controller cam c.g, m
mass-on-string controller pulley radius, m
controller output shaft radius and moment arm length, m
controller output torque, N-m
moment caused by controller friction, N-m
special case torque expressions used in estimating controller torque varia- tion with angular displacement, N-m
velocity of the controller active mass, caused by controller output shaft angular velocity, m/sec
weight of controller assembly, used for Tf calculation, N
controller active mass radial translation caused by output shaft angular displacement, m
controller out-of-plane angle, with reference plane perpendicular to axis of rotation, deg
change in controller torque output, 5
controller friction coefficient, dimensionless
controller output shaft angular displacement, deg
torsion strap pretwist, deg
torsion strap incremental displacement from pretwist angle, deg
angular displacement of controller cam, or torsion strap slope, deg
test bed angular velocity, rad/sec
estimated parameter error
2
Wd
5
controller damped natural frequency, rad/sec
controller in-plane angle, with the reference line perpendicular to the rotation axis and on a radial line from the hub centerline to the con- troller, deg
INTRODUCTION
Two major goals of helicopter research are rotor performance improvements and fixed-system vibration reductions. typically evolutionary in nature--a slow process of change in airfoil shapes, rotor twist, taper, spanwise camber distributions, tip shapes, and sweep angles. Simi- larly, hub vibration reduction studies seek to manipulate subtle parameters such as rotor mass distribution, and rotor and hub components' elastic stiffness and damp- ing. The goal of an innovative concept, however, is to provide significant benefits by radically departing from conventional designs.
Present studies to improve performance are
This paper is one of a series of publications describing the developmental history of the free-tip rotor (FTR) concept, references 1-5. The goals of the free- tip rotor are the reduction of fixed-system vibrations and increases in rotor per- formance while in forward flight, especially at high advance ratios. deals with the development and testing of the constant moment controller, a critical component of the FTR concept.
This paper
The free-tip rotor is a conventional rotor except that the outermost portion of the blades have been modified to accommodate a free pitching tip (see figs. 1 and 2). changes its angle of attack in order to maintain nearly constant lift during the azimuthal sweep of the blade. the aerodynamic, inertial, and centrifugal moments on the tip and a moment that is applied by the controller.
Because of a moment balance about the tip's pitch axis, the tip passively
The moment balance about the free tip is composed of
Reference 1 indicates that a major portion of the total blade dynamic air loads are from the tip region (the outermost 10% of the blade). By torsionally decoupling the tip from the inner blade, and by allowing it to weathervane, the total dynamic loads should be reduced. However, two problems still remain. First, flapwise and chordwise loads will still be transmitted down the length of the blade. The FTR does, however, minimize these bending loads by forcing the tip to operate with a nearly constant lift. Second, in order to achieve complete torsional decoupling of the tip, the moment that is applied by the controller must be independent of the tip pitch angle, i.e., zero spring constant. This is difficult to accomplish. Thus, minimization of the spring constant is a major goal of FTR controller development.
The reasons for rotor performance improvements that result from the free-tip
Using a rotor performance program, comparisons were made between a are not obvious. the free-tip. conventional rotor and a free-tip rotor.
Reference 2 presents the original analytical feasibility study of
The analysis was performed on a
3

three-bladed rotor, with a cruise speed of 140 knots, and a
ence 2 cites the more uniform lift distribution of the blade about the azimuth as being the mechanism for the FTR performance gains.
C /a = 0.07. The results indicated a 10% reduction in rotor Cp/a because of t Tl e free tip. Refer-
~
The developmental history of the free-tip rotor has been a long one. The predecessor of the FTR is the constant-lift rotor, reference 3. After the early analytical effort of reference 2, a program was initiated to develop a prototype FTR controller and to test the resulting mechanism by performing a wind tunnel test. The results are documented in references 4 and 5. From this study a prototype was developed that met the concept requirements. As can be seen from figure 3 , this early controller design's mechanics were simple. The principle of operation of the controller was the same as that of a power screw: an axial force acting on a heli- cal surface imparts not only a normal force to the surface but also a torque. In the case of the free-tip controller the axial force was the tip's centrifugal force and the resulting torque was the controller moment. However, the unavoidable sur- face contact force caused significant problems during the wind tunnel test. The results of this first forward-flight wind tunnel test showed that the FTR incorpo- rating this helical angle controller had little tip pitch response as the blade rotated to different azimuthal positions. Analysis of the test results and the mechanism components supported the conclusion that the high stresses resulting from the contact force led to elastic deflections which were sufficient to cause partial immobilization of the follower pin and, consequently, the tip. Since the restric- tion of tip pitching motion is detrimental to the free-tip concept, and as the contact force could not be reduced without significantly reducing the desired torque output, the helical guide/follower prototype was found to be impractical. Reducing controller component elastic deformations by using a stiffer material was consid- ered, but a material could not be found that had a satisfactory yield strength.
In order to experimentally evaluate the free-tip concept, it was necessary to have a viable device that provided the required torque output and that allowed the tip to pitch with minimum restriction. Therefore, because of the helical guide/ follower prototype controller's failure, a new controller design was needed.
Despite the inability to meet the primary goal of the first wind tunnel test, valuable lessons were learned from the experience. stration of the difficulty of designing mechanisms to survive the high centripetal accelerations and loads of helicopter blade tips. Another was the need for a new approach to the controller problem. Wind tunnel tests are too expensive and time- consuming to develop or to evaluate a large number of controller prototypes.
ment stage using an inexpensive means to apply centrifugal loading to the control- lers was necessary.
The first was a tangible demon-
To be ' able to refine the new generation of proposed controllers, an intermediate develop-
i
4

DESIGN APPROACH
A comprehensive controller development program, which is the subject of this
Improvements in the paper, was initiated subject to one precept: to not enter into a wind tunnel test again until a workable FTR controller had been demonstrated. prototype design approach were made. The original approach eliminated competing concepts early in the design process, leaving only a single candidate to undergo complete development. The first prototype was incapable of providing the required performance. discovered late in the program. Therefore, four guidelines were adopted as the basic philosophy for this new controller development program to increase the likeli- hood of developing a successful free-tip controller.
This design was not adequately tested prior to tunnel entry. This was
The four prototype development guidelines were:
1. Maximize the number of controller concepts considered in the preliminary stages of the development program. (The key to this objective is to avoid early assessment of implementation feasibility.) troller concepts were likely to improve the chances for identifying a successful prototype.
A greater diversity and number of con-
2. Maximize the use of common components for noncritical features and subsys- The advantage of this policy is that it minimizes the time tems of the prototypes.
required for the design, fabrication, and testing of a controller by reducing the number of unique components. increased through compatibility.
The quality and number of prototypes could then be
3 . Maximize the number of controller prototypes to reach the testing phase of the development program, by emphasizing diversity in prototype operating principles. By meeting this objective, the likelihood of eliminating all prototype candidates during the feasibility testing is reduced.
4. Subject each controller design to the same constraints as the wind tunnel model configuration. By doing this, two things can be accomplished: the redesign effort that is necessary to arrive at a free-tip rotor which is compatible with the controller is minimized, and the likelihood of accepting an infeasible design is reduced.
Aside from the above guidelines, the first step in any design process is the In this case, the controller prototypes were conceptual and package constraints. Concep-
definition of the technical problem. subject to two types of constraints: tual constraints are those mandatory design requirements which the prototype must satisfy. Package specifications are those constraints that must be satisfied in order to have a design that can be physically realized for the particular applica- tion considered. A brief example is "constant moment," which is a conceptual con- straint, whereas controller dimensions are package constraints. The following items comprise the list of the applicable conceptual FTR controller constraints.
5

1. The FTR controller must be capable of applying a moment to a rotor-blade tip. The moment should be preflight-adjustable from 0 to 6.78 N-m. upper limit was based on an estimated pitch-axis offset and maximum lift for the tip shapes that were considered for the FTR concept.
The moment
2. The controller should have a zero spring constant; therefore, within speci- fied tip pitch limits the torque output of the controller should not vary signifi- cantly. Because of friction and other factors, this is not attainable. Therefore, for this design exercise and the subsequent prototype evaluation testing, the fol- lowing realistic requirements were established: for the allowable pitch range of _+loo the controller torque was not to vary by more than 10% of the average value.
3. The controller mechanism must be capable of operating under centrifugal and aerodynamic loading equivalent to that which it would have to endure during a wind tunnel test at full-scale rotor tip speeds.
4. Limit the controller shaft/tip bending alternating stresses so as to have a fatigue life of at least 100 hr, under maximum centrifugal loading. Therefore, controller candidates must be subjected to cyclic loading in order to determine fatigue life as a part of the prototype testing.
The package constraints are as follows:
1. The controller must fit within the steel D spars of a 5.1-m d i m model rotor having a V23010-1.58 airfoil contour and a solidity of 0.085. maximum thickness of the controller was limited to 0.015 m, and its outer contour was determined by the D spar's interior dimensions.
Therefore, the
2. The controller had to accommodate a 10% 0.254-111 span tip. For acceptable tip dynamic characteristics, the tip was required to be mass-balanced about the pitch axis. This further increased the centrifugal loading to which the controller had to react. The loads were estimated by doubling the mass of a previously tested 5% tip (ref. 4).
3. The method of attaching the controller to the rotor blade must ensure a high structural factor of safety (greater than 2, based on yield strength), and allow the controller to be detachable (without damaging the blade or the controller).
4. The design should minimize the necessity of removing the controller from the blade to make minor mechanical adjustments. For example, it must be possible to be able to vary the torque output without removing the controller.
Using the above constraints, four controller prototypes were designed. These controllers were designated as: dual cam controller (DCC); mass-on-the-string controller, pulley version (MOS); mass-on-the string controller, cam version (MOS2); and torsion strap controller (TSC).
6
CONTROLLER DESIGNS
This section will concentrate on describing the actual mechanisms that were tested, including their operating principles and their design details. troller prototypes were considered in the testing phase. trate the final designs. tions of each individual prototype.
Four con-
The next several paragraphs will be devoted to descrip- Figures 4 through 7 illus-
The Dual-Cam Controller
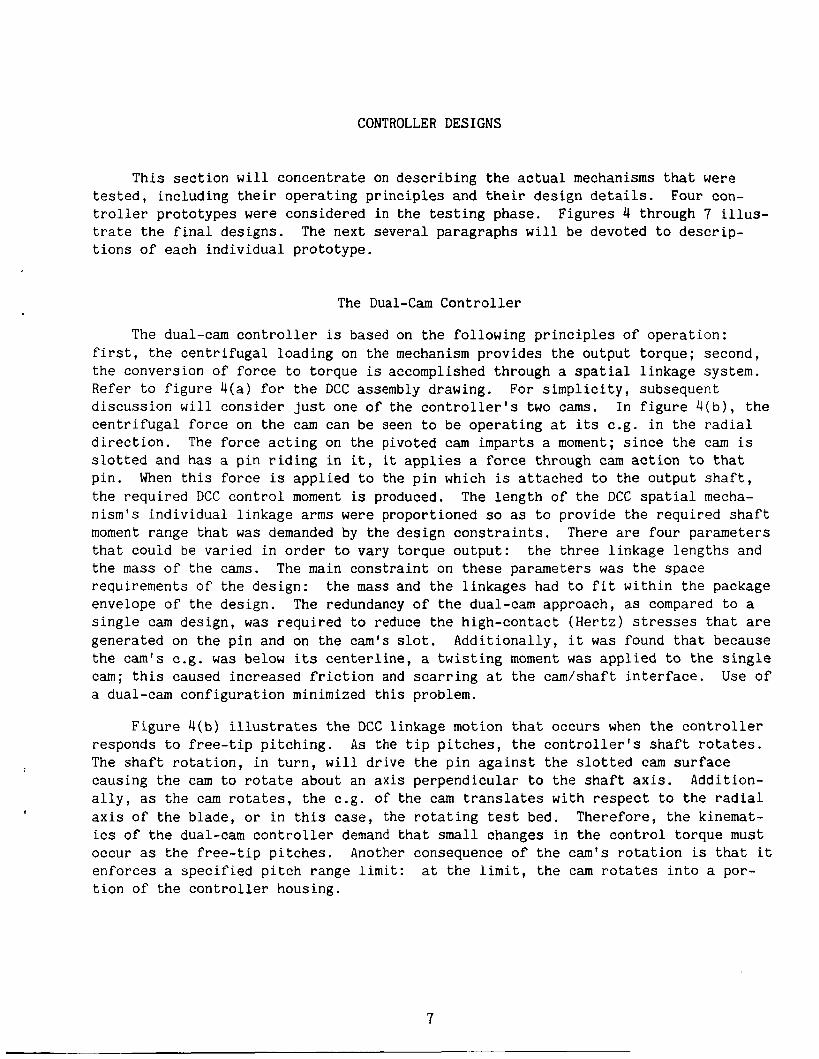
The dual-cam controller is based on the following principles of operation: first, the centrifugal loading on the mechanism provides the output torque; second, the conversion of force to torque is accomplished through a spatial linkage system. Refer to figure 4(a) for the DCC assembly drawing. For simplicity, subsequent discussion will consider just one of the controller's two cams. centrifugal force on the cam can be seen to be operating at its c.g. in the radial direction. The force acting on the pivoted cam imparts a moment; since the cam is slotted and has a pin riding in it, it applies a force through cam action to that pin. When this force is applied to the pin which is attached to the output shaft, the required DCC control moment is produced. The length of the DCC spatial mecha- nism's individual linkage arms were proportioned so as to provide the required shaft moment range that was demanded by the design constraints. There are four parameters that could be varied in order to vary torque output: the three linkage lengths and the mass of the cams. The main constraint on these parameters was the space requirements of the design: the mass and the linkages had to fit within the package envelope of the design. The redundancy of the dual-cam approach, as compared to a single cam design, was required to reduce the high-contact (Hertz) stresses that are generated on the pin and on the cam's slot. Additionally, it was found that because the cam's c.g. was below its centerline, a twisting moment was applied to the single cam; this caused increased friction and scarring at the cam/shaft interface. Use of a dual-cam configuration minimized this problem.
In figure 4(b), the
Figure 4(b) illustrates the DCC linkage motion that occurs when the controller responds to free-tip pitching. As the tip pitches, the controller's shaft rotates. The shaft rotation, in turn, will drive the pin against the slotted cam surface causing the cam to rotate about an axis perpendicular to the shaft axis. Addition- ally, as the cam rotates, the c.g. of the cam translates with respect to the radial axis of the blade, or in this case, the rotating test bed. Therefore, the kinemat- ics of the dual-cam controller demand that small changes in the control torque must occur as the free-tip pitches. Another consequence of the cam's rotation is that it enforces a specified pitch range limit: at the limit, the cam rotates into a por- tion of the controller housing.
7

Mass-on-String Controller, Pulley Version
Figure 5 shows the mass-on-string controller, pulley version (MOS). Fig- ure 5(a) is an assembly drawing of the controller; figure 5(b) is its free-body diagram and kinematic sketch. The MOS controller, like the DCC, also derives its output torque from centrifugal force. version of force to torque. the solution. A mass attached to one end of the cable provides the centrifugal loading; the cable wrapped around the pulley and the output shaft allows the cable tension to be applied to the shaft's outer radius resulting in the desired control momen t .
The critical problem is the mechanical con- In this particular design a cable and pulley system is
Referring to figure 5(b), the MOS controller torque output is the mass centrif- ugal load multiplied by the shaft moment arm, rs. govern the MOS control moment are the rotating frame rpm, the active-mass c.g. location with respect to the rotating frame axis (Q) , the output shaft radius (rs), and the active-mass magnitude (m). Of these four parameters, only m can be varied significantly without violating design constraints or structural limits. Package size limits are not violated by moderate mass increases if the length of the mass is increased.
Therefore, the parameters which
The major advantages of the MOS approach are its mechanical simplicity and the increased capacity for torque output as compared to the DCC design. disadvantage is the poor durability of the kevlar chord when the chord comes in contact with the shaft's small turn radii. Another minor disadvantage of the MOS design is a nonzero spring constant, which is in this case due to a change in the centrifugal load of the active mass resulting from the mass translation along a radial line necessitated by output shaft pitching. However, the MOS spring constant is well within design constraints as will be demonstrated in the analytical results section. Mass translation as a result of output shaft angular displacement can be clearly seen in figure 5(b). As the output shaft displaces an angle 8, the cable unwinds a set length which is equal to the fraction of the circumference of the output shaft that a point located on the nominal diameter would rotate. The mass c.g. translates radially by that amount.
Its chief
Mass-on-String Controller, Cam Version
Figure 6 shows the mass-on-string controller, cam version (MOS2). The opera- tive principle of this prototype is the same as the MOS controller. There is only one hardware difference between the two controllers: instead of a pulley, there is a cam to change the cable translation direction. All other controller components are compatible. The only significant difference that can be seen between the two controllers in figure 6 (the force free-body diagram) is that the cam offers a mechanical advantage over the pulley in that additional leverage can be applied; therefore, with the MOS2 design, the mass centrifugal load can be reduced and an equivalent torque output can still be obtained. cal advantage is
An expression for the cam mechani-
,
a

mechanical advantage = h
In terms of k inemat i c s , t h e cam v e r s i o n p r o t o t y p e is similar t o t h e MOS des ign .
I$ causes a g r e a t e r t r a n s l a t i o n of t h e a c t i v e mass t h a n t h e p u l l e y However, a s i g n i f i c a n t d i f f e r e n c e between the two d e s i g n s is that f o r a g iven t h e cam r o t a t i o n p r o t o t y p e does, because of t h e mechanical advan tage o f t h e cam des ign .
8,
Torsion S t r a p C o n t r o l l e r
F igu re 7 ( a ) is t h e assembly drawing of t h e t o r s i o n s t r a p c o n t r o l l e r ( T S C ) ; f i g u r e 7 ( b ) is a free-body diagram of one of the c o n t r o l l e r ' s two f i n e wire s t r a p s . The mechanics o f t h i s c o n t r o l l e r are very s imple . The TSC d e r i v e s its t o r q u e o u t p u t from two s o u r c e s : t h e m a j o r i t y of the t o r q u e comes from t e n s i l e l o a d i n g of twis ted wire s t r a p s , whereas the remainder is due to t h e e las t ic p r o p e r t i e s o f t h e wires and e l a s t o m e r i c f i l l e r when under t o r s i o n . c e n t r i p e t a l a c c e l e r a t i o n on t h e mass of t h e o u t p u t shaft and on t h e hardware attached t o it ( i n c l u d i n g t h e t i p mass i n t h e FTR model).
The s t r a p t e n s i l e l oad ing is due t o the
F i g u r e 7 ( b ) shows t h e o p e r a t i o n of t h e TSC. The t o r q u e o u t p u t o f the c o n t r o l - ler is a f u n c t i o n of t h e s t r a p r a d i u s and t h e c e n t r i f u g a l l oad o f t h e c o n t r o l l e r a c t i v e mass. The active mass is t h e combined mass o f t h e o u t p u t s h a f t , t o r s i o n s t r a p s , and , i n t h e case o f the w h i r l test, a s p r i n g assembly. R e f e r r i n g t o t h e f i g u r e i n s e t s o f an incrementa l strap segment, t h i s torque-producing force component is found t o be dependent n o t on ly on the CF, b u t a l s o on t h e s t r a p twist. The s t r a p twist is a f u n c t i o n o f t h e s t r a p l e n g t h , s t r a p r a d i u s ,
+ A9; t h e TSC s t r a p and the a b s o l u t e a n g u l a r d i sp lacement o f t h e o u t p u t s h a f t , can have a p r e t w i s t , OPT, as well as a A8 disp lacement under c e n t r i f u g a l l o a d i n g . Because o f des ign c o n s t r a i n t s ( s i ze l i m i t a t i o n s on t h e s t r a p r a d i u s and l e n g t h , and s t r u c t u r a l l i m i t a t i o n s on the a c t i v e mass c e n t r i f u g a l l o a d ) t h e TSC t o r q u e o u t p u t was v a r i e d d u r i n g t h e w h i r l test by varying t h e s t r a p p r e t w i s t a n g l e ,
I $ , d e f i n e d for t h e TSC as
e PT
€IpT.
Common C o n t r o l l e r Components
One of the o b j e c t i v e s o f t h i s development program was t h e use of common con- t r o l l e r f e a t u r e s so as t o s i m p l i f y t h e d e s i g n , f a b r i c a t i o n , and t e s t i n g of t h e p r o t o t y p e s . S e v e r a l f e a t u r e s o f c o n t r o l l e r component c o m p a t i b i l i t y are d i s c u s s e d below.
The dual-cam c o n t r o l l e r (refer t o f i g . 4 (a ) ) i n c o r p o r a t e s a f e a t u r e common t o t h r e e o f t h e c o n t r o l l e r des igns : t h e method for a x i a l l y r e s t r a i n i n g t h e s h a f t and t i p . The cable assembly a l l o w s as much f l e x i b i l i t y for s h a f t r o t a t i o n as p o s s i b l e so as t o minimize t h e s p r i n g c o n s t a n t of the c o n t r o l l e r . The c a b l e assembly is f a s t e n e d t o t h e inboard end o f t h e c o n t r o l l e r o u t p u t s h a f t . With t h e e l i m i n a t i o n of t h r u s t b e a r i n g s as component cand ida te s f o r t h i s t a s k , because of s i ze and l o a d c o n s t r a i n t s , a long t h i n cable was cons idered t o b e the n e x t bes t s o l u t i o n .
9

The DCC, MOS, and MOS2 controllers utilized the same basic housing and output shaft using only minor modifications. controllers designed is the general features of the torque output/tip attachment shaft. Finally, in all controllers that were tested during the whirl test, the same general provision was made for connecting the controllers to a mechanical spring so as to simulate an aerodynamic spring and also to provide a means for resisting the controller's torque output.
The next common feature for most of the
WHIRL TEST APPARATUS
Whirl Rig
Figure 8 is a photograph of the whirl rig. The rig was a centrifuge designed for the prototype evaluation test. The purpose of this rig was to provide a rotat- ing test bed that could impart the same centrifugal loads that the controllers would have to undergo during a rotor wind-tunnel test. The rig was 1.68 m high and had a diameter of 2.0 m. housed in an aluminum block, and clamped into place by a collar. The electric motor drove the centrifuge's main shaft through a v-belt and a spindle. The whirl rig main shaft was hollow so as to provide a convenient conduit for the instrumentation cables that ran up the rotating test bed.
The rig was powered by a 93.2 kw electric motor; the motor was
The whirl rig test bed was an aluminum plate upon which the experimental appa- ratus was mounted. Figure 9 shows the test bed with the equipment assemblies mounted on it. The rotating test bed was a rectangular plate with rounded ends. There were three major assemblies on the plate during the evaluation testing of the controller prototypes: the controller, the counterweight, and the exciter. The exciter was a critical hardware component. which to pitch the controller output shaft during the whirl test, so as to observe the effect of e on torque. Additionally, the exciter displaced the controller output shaft from its steady-state position so that the transient response of each design could be measured.
The exciter provided the means with
Exciter
Figure 10 is an assembly drawing of the exciter. Looking inboard, the exciter consists of a remote-controlled cam and trip-lever assembly for perturbing each controller prototype from its equilibrium point.
The apparatus that was used to perturb the controller static moment equilibrium is composed of two major components: a torsion spring assembly and the exciter. A helical torsion spring was used to resist the torque output of the controllers. The helical torsion spring, with mandrel, was attached at opposite ends to both the output shaft and the whirl rig test bed. In addition to making a steady state moment balance possible, the spring assembly mandrel was designed so as to also act as the trip lever for the exciter cam.
10

The exciter cam was driven by an aluminum shaft which was connected to a con- stant velocity electric motor that was mounted close to the rotating test bed axis (see fig. 9 ) . The cam was a small diameter dowel that was mounted on a disk face. clockwise or counterclockwise, the extended dowel would engage the trip lever and displace the controller/torsion spring from the equilibrium point (see fig. 10). the cam continued to rotate, the trip lever would slip off the dowel. of the controller/torsion spring dynamic system to this perturbation was measured.
Electric current was supplied through the whirl rig slip ring. By rotating either
As The response
WHIRL TEST PROCEDURES
The following is a general outline of the whirl test procedures:
1. Set whirl rig rpm to specified value.
2. Record transducer values indicating controller output shaft angular deflec- tions. Readings made by means of a multichannel voltmeter.
3 . Determine the magnitude and relative location of the maximum Hall effect voltage by disturbing the shaft from its equilibrium point through clockwise and counterclockwise exciter rotations. The shaft angle transducer calibration is thereby completed.
4. Produce controller dynamic responses to exciter clockwise and counterclock- wise perturbations. Record the response on analog tape and oscillograph paper. Log the new equilibrium points.
5. Return to the first step until maximum rpm has been attained.
During the test there were four transducers that provided information about controller performance under centrifugal loading: the Hall effect device, foil and semiconductor strain gages, and a resistance (wiper) pot. Not all of these trans- ducers were applicable to all of the controllers, nor were all of the transducers working nominally all the time. The first transducer to be discussed is the Hall effect.
The Hall effect (ref. 6) is an electrical circuit whose voltage output is sensitive to magnetic flux. The Hall effect transducer was a small semiconductor device based on this principle. In this test the transducer was used to measure e ; it was the primary data measurement of the experiment. Since magnetic flux varies with distance from the source, by locating the transducer on the controller housing with a permanent magnet attacned t o tne exciter-cam follower, a measurement of the controller's shaft rotation can be made by the decrease in the magnetic flux as the magnet rotates away from the transducer (refer to fig. 11). The pitch angle, given the spring constant of the torsional spring, was used to calculate each controller's moment output. Both the voltage vs pitch and the pitch vs torque relationships for the Hall effect transducer were developed through calibration.
11

The combined procedure for the Hall effect transducer calibration and for obtaining the spring constant of the output shaft spring assembly was as follows:
1; A pulley/cable assembly was mated to the end of the output shaft.
2. Knowing the radius of the pulley, a torque was applied to the shaft by adding known weights to the end of the cable.
3. The applied torque deflected the torsion spring to an angle.
4. Both the Hall-effect voltage and the trip-lever scale measurements were recorded.
5. The spring constant was determined by a linear fit of the spring deflection and the applied moment data set.
A wiper pot transducer was installed as an alternative to the Hall-effect device, and the same type of calibrations and calculations are applicable. Unfor- tunately, the wiper pot was plagued throughout the test with failures: with the whirl rig set at zero rpm, the pot gave linear, repeatable calibrations; with the whirl rig rotating, the wiper pot signal degenerated into noise.
The foil and semiconductor strain gages both rely upon the same basic principle to provide an estimate of the controller's torque. strain gages were arranged about the circumference of the output shaft, as shown in figure 12. The gages were oriented and bridged to measure only the strain caused by torsion and not to react to tensile or bending loads. The calibration hardware used was the same as that used in the torque vs pitch measurements. The strain gage voltages were measured to obtain a torque vs voltage curve. Therefore, at each test point, the strain gage voltages were measured and compared to the calibration curve, and the controller torque output was estimated. When compared to results obtained by the Hall-effect technique, the strain gages worked satisfactorily for one of the two controller prototypes, but performed poorly on the second. Further investiga- tion revealed that the second pair of strain gages were improperly oriented on the shaft so that bending and tensile loads were also being measured.
The foil and semiconductor
Therefore, the Hall-effect device was the only reliable transducer that was used during this test, and it was the primary source of experimental results. However, potential errors in the estimates of the controller torque output, beyond those of instrumentation accuracy, are possible.
Friction is detrimental to controller performance. Friction could possibly either restrict shaft rotation or reduce torque output. mate the resisting moment caused by the friction of the controller and spring assem- bly. equilibrium position by using clockwise and counterclockwise exciter rotations. perturbing the shaft from its equilibrium position, motion restricted by friction should be apparent from the dynamic response. Additionally, differences in equilib- rium points could be in part due to friction.
Steps were taken to esti-
This included conducting an rpm sweep and perturbing the controller from its By
12

Another potential torque output estimate error source is the effect of cable stretch on the experimental measurements. As stated previously, the Hall-effect transducer output voltage is dependent upon not only angular displacements, but it is also a function of the total distance from the magnetic source. attached to the shaft of three of the four controllers is subjected to the centrif- ugal load of the whole free-tip assembly. As the cable stretches under centrifugal load, the output of the Hall-effect transducer changes, even if no pitch motion occurs. In order to minimize the errors that are due to cable stretch, the maximum Hall-effect voltage and its angular location relative to the equilibrium point was noted at each test point. pitch angle, the Hall-effect calibration curve can be scaled for each test point. In this manner the e measurements were corrected for cable stretch.
The cable
By assuming that the maximum voltage occurs at a constant
The mechanical torsion spring has two attachment points which allow it to resist the torque that is produced by the controller. the controller housing and the other is connected to the output shaft. terminations were loosely attached. potential inaccuracy in the pitch equilibrium point, thus affecting the torque calculation. consistent upper and lower limit to the pitch angle measurements at all rpms. portion of this experimental uncertainty of the torque estimates must be due to the spring play; some of the remaining contributions to this data scatter are friction and instrumentation accuracy.
One attachment point is on The spring
The consequence of this loose attachment is a
Alternating the direction of the exciter perturbations did reveal a A
ANALYTICAL RESULTS
The free-tip motion can be modeled by the expression
Iee + CAe + (KA + K)e + Tf = M(t)
where are the pitch angle, system inertia, aerodynamic damping and spring, controller spring, and the torque friction component, respec- tively. M(t) is a summation of external moments as a function of time (azimuth). These moments include: the controller output torque, centrifugal-tip moment, and inertial moments, steady-state pitch displacement.
e, I,, CA, KA, K, and Tf
Further, the summation of these moments determines the free-tip's
Analytical expressions for I,, K, Tf, and the controller output torque for each of the prototypes are summarized below. tion of viable controller prototypes that are suitable for wind-tunnel testing of the free-tip rotor concept.
The purpose of this work is the selec-
Two analytical models are derived for controller torque output. One is a simplistic model that ignores the effect of controller shaft pitching deflections on the control moment. effects.
The other model takes into account the angular displacement The two models are identified respectively as the theta-independent and
13
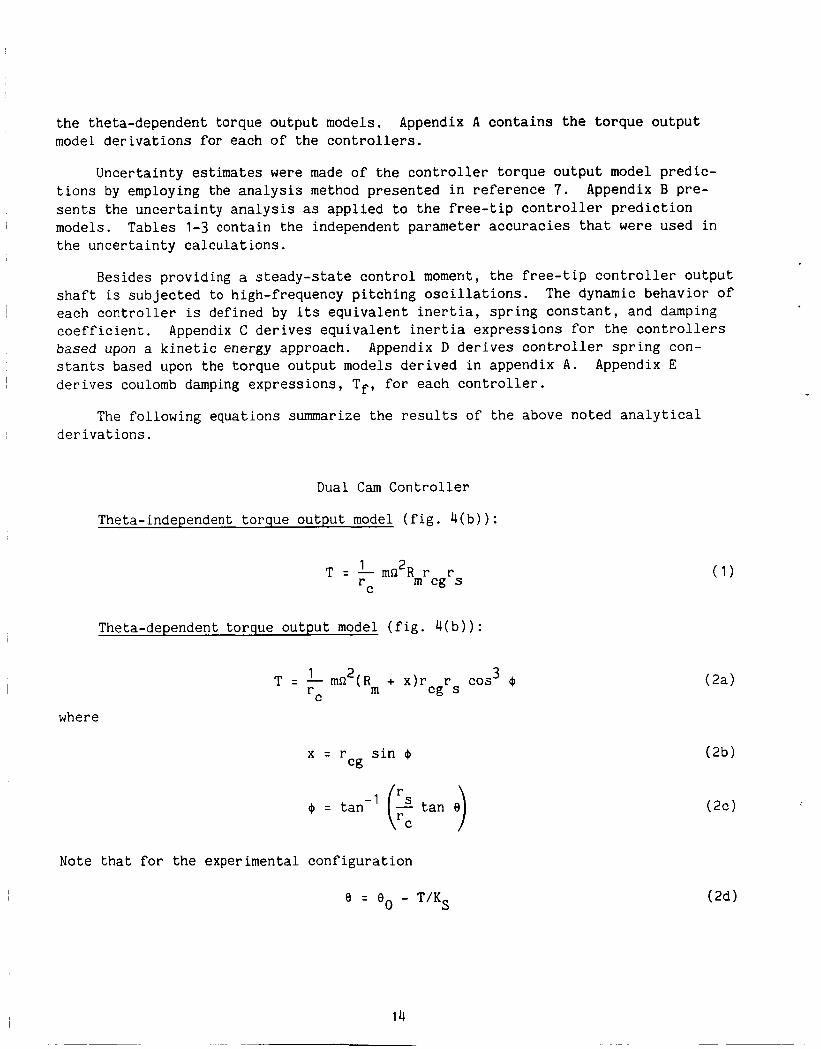
the theta-dependent to rque o u t p u t models. model d e r i v a t i o n s f o r each o f t h e c o n t r o l l e r s .
Appendix A c o n t a i n s t h e t o r q u e o u t p u t
Uncer ta in ty estimates were made of t he c o n t r o l l e r t o r q u e o u t p u t model p r e d i c - t i o n s by employing t h e a n a l y s i s method p resen ted i n r e f e r e n c e 7 . s e n t s t h e u n c e r t a i n t y a n a l y s i s as a p p l i e d t o t h e f r e e - t i p c o n t r o l l e r p r e d i c t i o n models. Tables 1-3 conta in t h e independent parameter a c c u r a c i e s t h a t were used i n t h e u n c e r t a i n t y c a l c u l a t i o n s .
Appendix B p re -
Besides provid ing a steady-state c o n t r o l moment, t h e f r e e - t i p c o n t r o l l e r o u t p u t shaf t is s u b j e c t e d t o high-frequency p i t c h i n g o s c i l l a t i o n s . The dynamic behavior of each c o n t r o l l e r is def ined by its e q u i v a l e n t i n e r t i a , s p r i n g c o n s t a n t , and damping c o e f f i c i e n t . based upon a k i n e t i c energy approach. s t a n t s based upon the t o r q u e o u t p u t models d e r i v e d i n appendix A . d e r i v e s coulomb damping e x p r e s s i o n s , T f , f o r each c o n t r o l l e r .
Appendix C d e r i v e s e q u i v a l e n t i n e r t i a e x p r e s s i o n s for t h e c o n t r o l l e r s Appendix D derives c o n t r o l l e r s p r i n g con-
Appendix E
The fo l lowing equa t ions summarize the r e s u l t s of t h e above noted a n a l y t i c a l d e r i v a t i o n s .
Dual Cam C o n t r o l l e r
Theta-independent t o r q u e o u t p u t model ( f i g . 4 ( b ) ) :
1 2 r m cg s T = - m m n R r r
C
Theta-dependent t o rque o u t p u t model ( f i g . 4 ( b ) ) :
1 2 r m cg s
T = - ma (R + x > r r c0s3 4 C
where
x = r s i n Q cg
Note t h a t f o r t h e exper imenta l c o n f i g u r a t i o n
0 = 0 0 - T/KS

Equivalent inertia (ref. 8)
Spring constant
2
'e - - IFT + Is +Ic(; )
= mn Kdcc
Damping coefficient (figs. 13 and l4(a))
Tf = Tf(shaft) + Tf(dcc)
where
( 3 )
(4)
r = v Ndcc
s
Tf(dcc) C
and
= Wdcc cos 8 + CFdcc sin 8 Ndcc
Mass-on-String, Pulley Version (fig. 5 ( b ) )
Theta-independent torque output model:
2 T = m n R r m s
Theta-dependent torque output model:
2 T mn [Rm + ers]rs
or for the whirl test
2 mS2 Rmr 2 2
[ 1 - (rs/KS)mn I T =
15
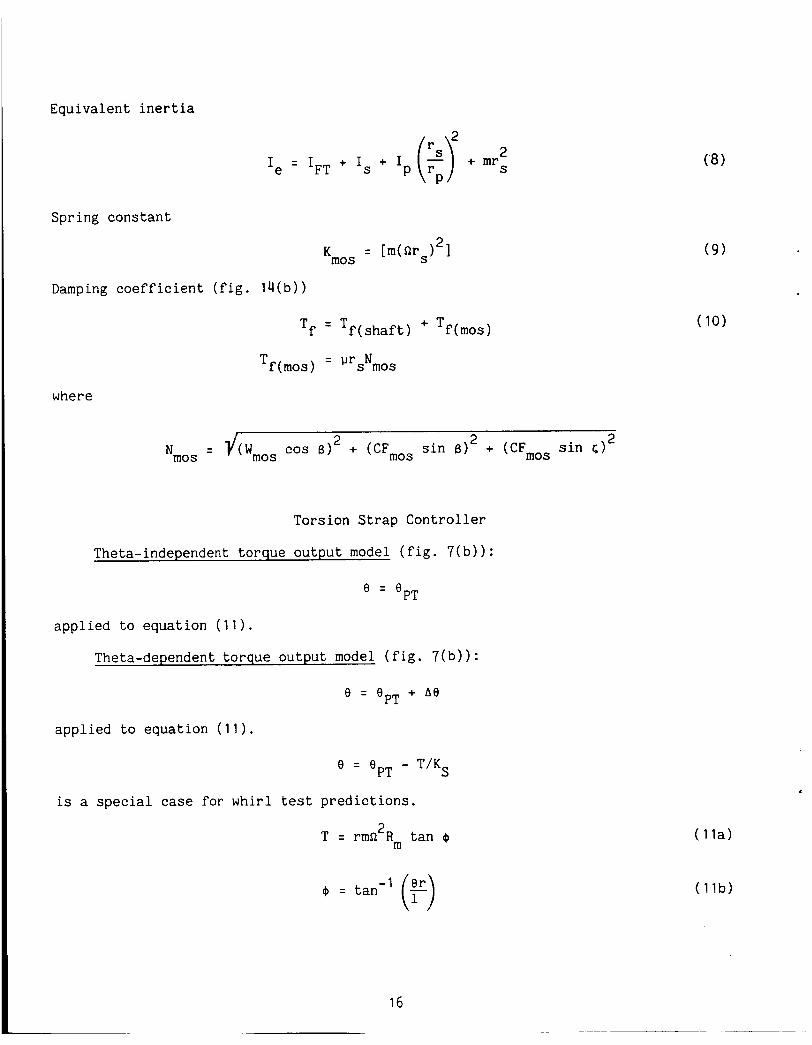
Equivalent inertia
I = IFT + Is + I ('p + mr2 S
rP e
Spring constant 2 Kmos = [m(nrs) 1
Damping coefficient (fig. 1 4 ( b ) )
where
Nmos = 2 sin 6) 2 + (CF,,, sin 5 ) 2 tGp mos cos 6) + (CFmos
Torsion Strap Controller
Theta-independent torque output model (fig. 7 ( b ) ) :
PT e = e
applied to equation (11).
Theta-dependent torque output model (fig. 7 ( b ) ) :
e = e + h e PT
applied to equation ( 1 1 ) .
e = e - T/KS PT
is a special case for whirl test predictions.
2 T = rmO Rm tan I$
16
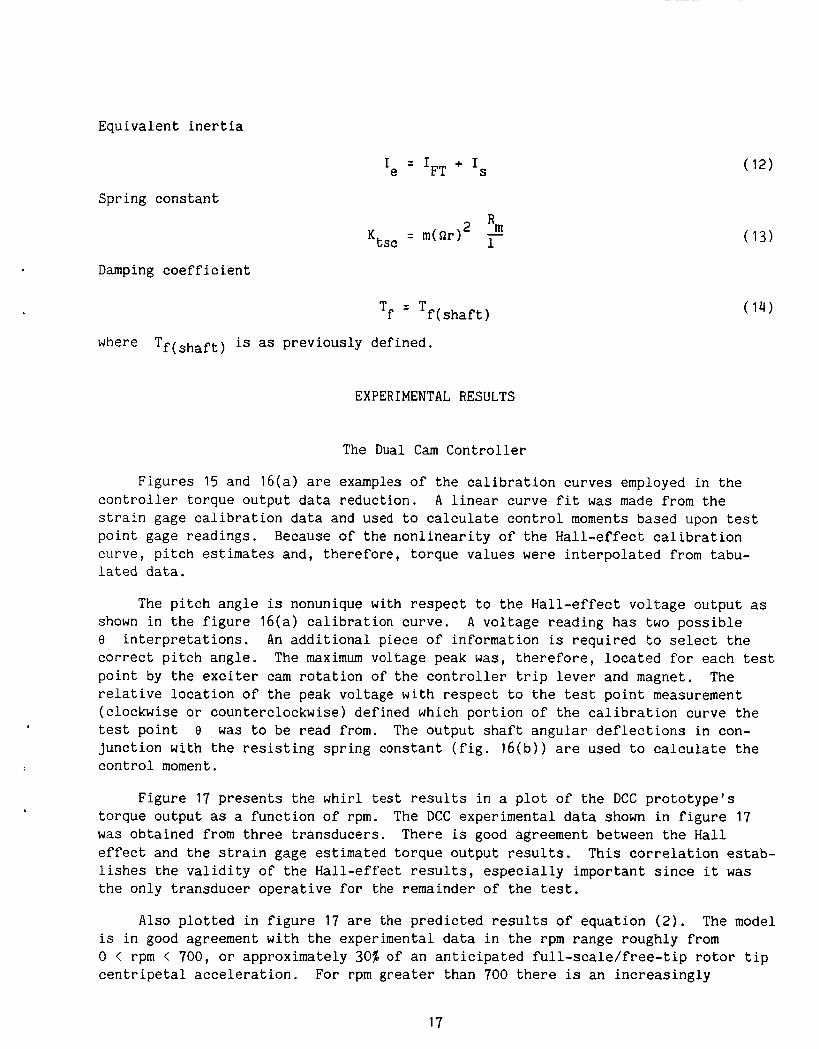
Equivalent inertia
Spring constant
Damping coefficient
Ie = IFT + Is
where Tf(shaft) is as previously defined.
EXPERIMENTAL RESULTS
The Dual Cam Controller
Figu s 15 a d 16(a) are examples of the calibration curves employed in the controller torque output data reduction. A linear curve fit was made from the strain gage calibration data and used to calculate control moments based upon test point gage readings. curve, pitch estimates and, therefore, torque values were interpolated from tabu- lated data.
Because of the nonlinearity of the Hall-effect calibration
The pitch angle is nonunique with respect to the Hall-effect voltage output as shown in the figure 16(a) calibration curve. 8 interpretations. An additional piece of information is required to select the correct pitch angle. The maximum voltage peak was, therefore, located for each test point by the exciter cam rotation of the controller trip lever and magnet. relative location of the peak voltage with respect to the test point measurement (clockwise or counterclockwise) defined which portion of the calibration curve the test point 8 was to be read from. The output shaft angular deflections in con- junction with the resisting spring constant (fig. 16(b)) are used to calculate the control moment.
A voltage reading has two possible
The
Figure 17 presents the whirl test results in a plot of the DCC prototype's torque output as a function of rpm. The DCC experimental data shown in figure 17 was obtained from three transducers. There is good agreement between the Hall effect and the strain gage estimated torque output results. lishes the validity of the Hall-effect results, especially important since it was the only transducer operative for the remainder of the test.
This correlation estab-
Also plotted in figure 17 are the predicted results of equation (2). The model is in good agreement with the experimental data in the rpm range roughly from 0 < rpm < 700, or approximately 30% of an anticipated full-scale/free-tip rotor tip centripetal acceleration. For rpm greater than 700 there is an increasingly
17
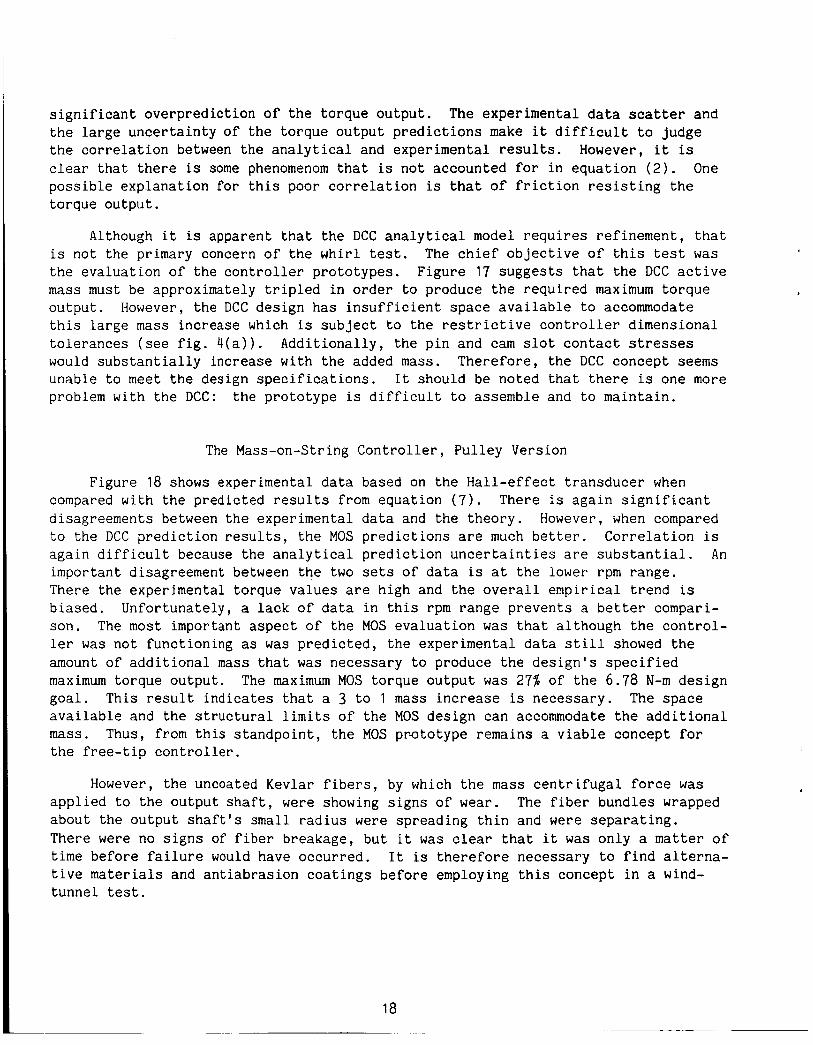
significant overprediction of the torque output. the large uncertainty of the torque output predictions make it difficult to judge the correlation between the analytical and experimental results. However, it is clear that there is some phenomenom that is not accounted for in equation (2). One possible explanation for this poor correlation is that of friction resisting the torque output.
The experimental data scatter and
Although it is apparent that the DCC analytical model requires refinement, that is not the primary concern of the whirl test. the evaluation of the controller prototypes. Figure 17 suggests that the DCC active mass must be approximately tripled in order to produce the required maximum torque output. However, the DCC design has insufficient space available to accommodate this large mass increase which is subject to the restrictive controller dimensional tolerances (see fig. 4(a)). Additionally, the pin and cam slot contact stresses would substantially increase with the added mass. Therefore, the DCC concept seems unable to meet the design specifications. It should be noted that there is one more problem with the DCC: the prototype is difficult to assemble and to maintain.
The chief objective of this test was
The Mass-on-String Controller, Pulley Version
Figure 18 shows experimental data based on the Hall-effect transducer when compared with the predicted results from equation (7). disagreements between the experimental data and the theory. However, when compared to the DCC prediction results, the MOS predictions are much better. Correlation is again difficult because the analytical prediction uncertainties are substantial. An important disagreement between the two sets of data is at the lower rpm range. There the experimental torque values are high and the overall empirical trend is biased. Unfortunately, a lack of data in this rpm range prevents a better compari- son. The most important aspect of the MOS evaluation was that although the control- ler was not functioning as was predicted, the experimental data still showed the amount of additional mass that was necessary to produce the design's specified maximum torque output, The maximum MOS torque output was 27% of the 6.78 N-m design goal. This result indicates that a 3 to 1 mass increase is necessary. The space available and the structural limits of the MOS design can accommodate the additional mass. Thus, from this standpoint, the MOS prototype remains a viable concept for the free-tip controller.
There is again significant
However, the uncoated Kevlar fibers, by which the mass centrifugal force was applied to the output shaft, were showing signs of wear. about the output shaft's small radius were spreading thin and were separating. There were no signs of fiber breakage, but it was clear that it was only a matter of time before failure would have occurred. It is therefore necessary to find alterna- tive materials and antiabrasion coatings before employing this concept in a wind- tunnel test.
The fiber bundles wrapped
18
The Mass-on-String Controller, Cam Version
This concept was proposed as a means to retain the basic conceptual character- istics of the MOS prototype, while at the same time reducing fiber abrasion: the fiber abrasion would be reduced because the fibers would no longer be rubbing along a pulley, but would instead be bonded directly to the cam.
Fabrication problems and also tight dimensional tolerances prohibited the testing of the MOS2 concept. cation so that the cam could completely rotate within its package limits and yet the cord about the output shaft would not have a significant tensile load applied to it. for this prototype.
A small amount of cord slack resulted from the fabri-
Subsequent modification efforts were unsuccessful and so data was not acquired
The Torsion Strap Controller
It was demonstrated (eq. ( 1 1 ) ) that the torsion strap controller's torque output was a function of two parameters which were varied during the whirl test: the controller tensile loading and the strap pretwist angle. The controller cen- trifugal force (CF)/tensile load was varied by changing the whirl-rig rpm. Fig- ures 19 through 22 are plots of the experimental and predicted TSC torque as a function of both these parameters. Similar to the other controller designs, the TSC torque output predictions have large uncertainties, given the accuracy of the input parameters used in the model. Table 3 contains the value and accuracies of the TSC parameters. The table values are based upon measurements of the TSC design that was tested during the whirl test. In addition to the prediction uncertainty, there is significant data scatter in the torque measurements. This data scatter is due to a number of factors including instrumentation sensitivity, poor spring assembly attachment to the controller output shaft, and friction. For these reasons the TSC (and the other controllers) theoretical and experimental comparisons are only quali- tative. However, the functional nature of both trends demonstrate similarities.
To determine whether or not the functional form of the analytical TSC model (i.e., parabolic with respect to rpm and linear for 0 ) is representative of the experimental data, a regression analysis was performed. linearized equation ( 1 1 ) (with respect to 8) was proposed.
A semiempirical form of a
(15) 2 T = CeQ
where C is a constant derived by least square regression of one of the four TSC experimental data sets. The constant C in the semiempirical model replaces the s t rap geemetry parmeters of the amlyt ica l model. Both the analytical and semi- empirical model are to be considered representative of the experimental data if the value of C derived by regression analysis is approximately the value analytically specified, resulting in prediction improvements of the other data sets.
For tne TSC wniri test comparison, the resisting helical spring torque con- straint must be applied, i.e.,

e = epT - T / K ~ Therefore, for the regression analysis of the whirl test data the semiempirical model, taking into account the spring constraint, must be expressed as
c e pTn2 T =
[ 1 + (Cn2/K)1
if the controller output shaft pitch angles are expressed in terms of the initial strap pretwist angle, OPT, and the resisting spring deflection.
Alternatively, equation (15) can be used for the regression analysis if the experimental e measurements are included in the calculation in addition to the torque and rpm values.
For the following analysis, equation (15) was used to define the least-square regression error function. After deriving the constant C, equation (16) was used to calculate the resulting semiempirical predictions.
Therefore, the error function can be defined as
2 2 N
i=O E = [mini - Ti]
where ei, Qi, and Ti are the regression analysis input parameters.
By minimizing the error function the coefficient, C, is determined
thus
2 i=O i i i
N T.8.0
2 2 N
i=O
c = (eini)
(17)
Using the 8pT = 67" data set for the least-square fit, the above equation resulted in an empirical coefficient, C, which was only 8% different from the analytically derived coefficient. However, the semiempirical predictions of equation (16) demonstrate a large correlation improvement with the remaining data sets, as shown in figures 23 through 25. correction resulting in 20-30$ prediction improvement is that the torque dependence on C in equation (16) is nonlinear. Additionally, the spring deflection (thus, a
ePT The reason for the 8% coefficient
20

portion of the nonlinear ei
C dependence) was accounted for by using experimental values in the regression analysis, equation (15) .
Because there is only a small difference between the analytical and experimen- tal derivation of cal model with experimental data, the functional form of both the analytical and semiempirical models are correct. To obtain reasonable future TSC torque output predictions, two approaches can be taken.
C, and because of the satisfactory correlation of the semiempiri-
First, the analytical model may be used if extreme accuracy in specifying the input parameters is achieved. This task is difficult because of the small size and construction of the TSC. It is further complicated by small but significant geome- try changes that are caused by the application of tensile loads on the straps while under CF.
Second, the semiempirical model can be used if a TSC pull test calibration is
By using the pull test data set, conducted where the straps can be pretwisted, tensile loads can be applied, and the straps' resulting torque output can be measured. the above demonstrated regression analysis can be performed. analysis can be used as an accurate semiempirical TSC model.
As a result, this
Unlike the other controller prototypes, space limitations do not necessarily limit the TSC torque output; the maximum pitch pretwist angle is not limited by the space requirements. Increasing the controller's active mass is an alternative approach to increasing torque output, but this method is constrained by package limits. In this particular test, torque was restricted by a pretwist structural limit. However, it appears likely that the TSC design is capable of meeting the design constraint of the controller's maximum torque output.
Dynamic Characteristics
The experimental apparatus provided information about each prototype's dynamic
the controller-spring system had responses measured These
behavior. perturbed revealed two things: in the hundredths of a second and all but the TSC responses were overdamped. factors made analysis impossible for all prototypes except for the TSC, and deter- mination of the dynamic coefficients of that controller was extremely difficult. Two methods were employed to experimentally estimate the TSC spring constant and damping coefficient.
Oscillograph traces of the Hall-effect voltage as the prototypes were
The first method determined the Tf of the total torsion spring-controller systen! frox the static deflection data. In acquiring dynamic traces it was observed that the TSC steady-state equilibrium output torque was dependent on the direction of the initial deflection. This observation agrees with the dynamic behavior of a mechanical system which has large coulomb damping. If it is assumed that the dif- ferences in torque output were due completely to static friction, then an estimate of Tf contribution could be made. 'The first step in this anaiysis is t o calculate the mean torque output per test point. The second step is the calculation of the
21

test-point torque output standard deviation. alternating exciter perturbations were assumed for a worst-case analysis to be totally due to static friction, the standard deviation estimate is also a measure of Tf (the torque component that is due to friction). The estimates for Tf when the above statistical calculations are performed are shown in table 4.
Since differences in torque output for
The average Tf from table 4 was approximately 0.0226 N-m. Equation (14) to be 0.0113 N-m, for a friction coefficient of 0.5 (a valid estimates the
number for the brass on steel controller bearing surface), assuming that the out-of- plane contributions to the controller contact forces are negligible except for the output shaft assembly weight. It is obvious, given the Tf disagreement, that the shaft bearing contact forces are greater than that estimated in the equation (14) prediction because of small but significant controller misalignment with respect to the rotational plane and radial arm.
Tf
The second method was more direct in estimating the dynamic constants for the controller-torsion spring system than the first method. Transient response time- histories were recorded on an oscillograph as the TSC was perturbed by the exciter. By measuring the amplitude decay of the response curves and, additionally, the sinusoidal period, estimates were made of the TSC Table 5 contains the results of the above analysis. There are considerable differences between the Tf values in table 4 and table 5.
K, Wd, and Tf (ref. 9).
From table 4 the average Tf was equal to 0.0226 N-m, whereas the table 5 average estimate was 0.083 N-m, which was almost a 4 to 1 difference. An indication of the accuracy of the second method is seen when a comparison is made of the theo- retical versus the experimental values for the system spring constant, K, and for the frequency response, Wd. The theoretical TSC value when averaged for K is equal to 1.73 N-m/rad and the experimental averaged K is 1.5 N-m/rad, which is an 8.52 difference. The averaged theoretical frequency response (using an empirical system inertia value) is equal to 567 rad/sec whereas the corresponding averaged experimental frequency is 540 rad/sec, which is a 4.8% difference. difficulties in defining the Tf and experimental comparison cannot be made. However, the table 5 estimates are more likely to be accurate than the table 4 estimates, since satisfactory comparisons were made for able. Still, the inadequate time-history trace resolution probably has resulted in large uncertainties in the Tf values in table 5.
Because of the input parameters of equation (14), a theoretical
K and Wd. The validity of the assumptions in method 1 is question-
Two important conclusions can be drawn from the above experimental dynamic characteristics analysis. First, it is feasible to adequately measure the high- frequency output-shaft dynamic oscillations of a constant momrent controller using a Hall-effect transducer and standard acquisition and recording instrumentation. It is also, therefore, feasible to acquire free-tip dynamic response data by using this instrumentation. Second, basic analysis techniques have been defined and verified to estimate controller (and free-tip) dynamic coefficients, assuming that the response characteristics are those of an approximately single degree of freedom, constant coefficient, second-order differential equation.
22

CONCLUSIONS
In order to properly evaluate the free-tip-rotor concept, a satisfactory design for a constant moment controller was required. ated for the FTR application: shaft pin, resulting in control moment; ( 2 ) mass-on-string (pulley version)--a kevlar chord and pulley arrangement where the chord tension applies the moment; ( 3 ) mass-on-string (cam version)--same operating principle as the above except for the replacement of the pulley by a cam; ( 4 ) torsion strap controller--a twisted strap set unwinds under CF loading to produce the required control moment.
Four designs were tested and evalu- ( 1 ) dual cam controller--cam CF drives the output
The results of the whirl test made the selection of a suitable controller design possible for the FTR evaluation. The controller test results were: ( 1 ) dual cam controller--(a) a complex design that was hard to assemble and maintain; (b) scarring on the cam housing surfaces indicated high-friction loads on the cams; (c) large contact forces on the pin and cam slots manifested by localized plastic yielding; (d) analytical models substantially overpredict controller torque output at centrifugal loads greater than 30% of that anticipated at full-scale rotor-tip speeds; (e) empirical evidence indicates the design has inadequate space available for the additional mass required to meet the design torque output goal. (2) Mass- on-string (pulley version)--(a) analytical models overpredict controller torque output, but to a lesser extent than does the DCC; (b) empirical evidence indicates that the design does have sufficient space for the mass required to meet the torque output goals; (c) the design demonstrated a problem with kevlar-chord fatigue and abrasion. (3) Mass-on-string (cam version)--(a) there were critical assembly prob- lems with the design; (b) the controller produced little measurable torque output; no test data were acquired. ( 4 ) Torsion strap controller--(a) the controller was a simple design and easy to assemble; (b) analytical models overpredicted the torque output; however, a semiempirical model demonstrated satisfactory agreement with the experimental data; (c) strap pretwist limits prevented testing the controller to meet the design torque output goal; however, the pretwist limit was unique to the controller whirl tested. The overall design concept was considered capable of meeting the goal.
Given the above results, the TSC was selected for the model rotor test of the free-tip rotor.
In addition to the constant moment controller evaluations, instrumentation and
These experimental tools are particularly important for analysis techniques were defined and tested for the whirl test that are applicable to free-tip rotor testing. free-tip dynamic response measurements.
23

APPENDIX A
Dual Cam Controller
Referring to figure 4(b), it can be seen that for the theta-independent case, the DCC torque output is governed by the following equation
T = r F S
F is the resultant contact force at the pin/cam interface that is due to the centrifugal load of the cam itself
= r mn2Rm C
where, for simplicity, m is the total mass of both cams. Therefore, the expression for the controller torque output, for the theta-independent case, is
1 2 = - r mn Rmrcgrs
C
The DCC torque output model can be extended to account for output shaft pitching and for torque variation by noting: ( 1 ) as e changes, the cam c.g. radial location also changes, resulting in a variation of CF and torque; (2) as 8 changes, there is a change to the cam moment arm length, rc, caused by the shaft pins shifting position in the cam slot; ( 3 ) as 9 the pin tends to rotate its way out of the cam slot; and (4) only components of the cam CF and pin contact force contribute to the cam moment balance (these force components are dependent upon
changes, there is a change in the radius, rs, as
I$ and e ) .
The first DCC torque variation contribution (the cam c.g. position shift) can be accounted for by replacing the CF term in equation (Al) by the expressions shown below.
2 CF = ma (Rm + x)
x = r sin I$ cg
where x is the cam c.g. translation distance (fig. 4(c)). To complete the defini- tion of x it is necessary to obtain an expression for I$, the cam angular dis- placement. As shown in figure 4(b), a point that is coincident on both the shaft
24
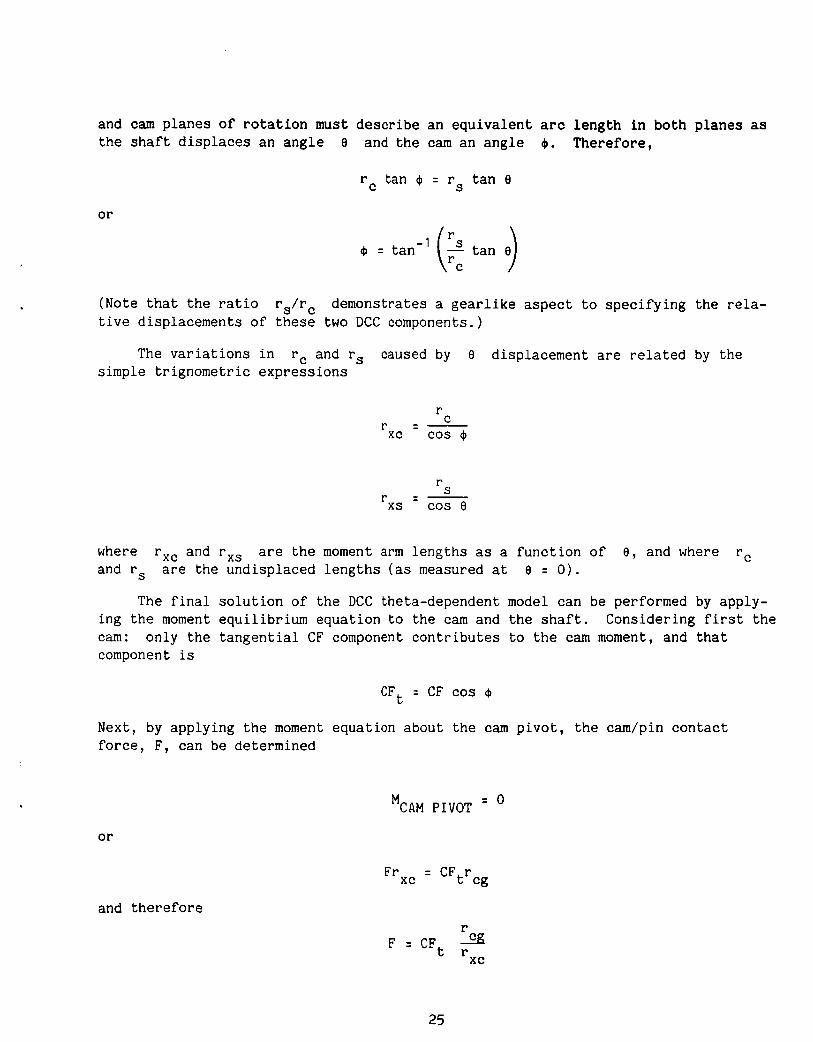
and cam p l a n e s of r o t a t i o n must d e s c r i b e a n e q u i v a l e n t arc l e n g t h i n b o t h p l a n e s as the s h a f t d i s p l a c e s a n a n g l e 8 and t h e cam a n a n g l e 4 . T h e r e f o r e ,
r tan I$ = rs t a n e C
o r
4 = tan-’ ( z t a n B> (Note t h a t t h e r a t io rs/rc t i v e d isp lacements of these two DCC components.)
demonstrates a g e a r l i k e a s p e c t t o s p e c i f y i n g the rela-
The v a r i a t i o n s i n rc and rs caused by 8 disp lacement are related by t h e s imple t r i g n o m e t r i c e x p r e s s i o n s
r C r = -
xc cos I$
r S r = - xs COS e
where rxc and rxs are t h e moment arm l e n g t h s as a f u n c t i o n of 0, and where rc and rs are t h e undisp laced l e n g t h s (as measured a t 8 = 0).
The f i n a l s o l u t i o n o f t he DCC theta-dependent model can be performed by apply- i n g t h e moment e q u i l i b r i u m e q u a t i o n t o t h e cam and t h e sha f t . Cons ider ing f irst t h e cam: o n l y t h e t a n g e n t i a l CF component c o n t r i b u t e s to the cam moment, and t h a t component is
CFt = CF COS I$
Next, by apply ing t h e moment equat ion about t h e cam p i v o t , t h e cam/pin c o n t a c t f o r c e , F, can be determined
= o M~~~ PIVOT
o r
= CF r Frxc t cg
and t h e r e f o r e
25

However, it should be noted t h a t it is on ly a component of F t r i b u t e s t o the shaft t o r q u e . the normal component of F a p p l i e s t h e to rque . After, d e f i n i n g
t h a t a c t u a l l y con- Refe r r ing t o t h e cam frame of r e f e r e n c e , it is o n l y
t h a t is p e r p e n d i c u l a r t o t h e shaft axis and the reby
FN = F COS 4
t h e above two equa t ions can be s e t e q u a l t o each o t h e r and r e s u l t s i n t he e x p r e s s i o n
- - FN h c o s I$ - CFt r x c
o r
FN = mi2 2 ( R m + x ) c o s 2 r c g I$
x c
F i n a l l y , on ly a component o f t h e c o n t a c t f o r c e components, FN, c o n t r i b u t e s t o t he shaf t t o r q u e . A moment equa t ion a p p l i e d a t t he s h a f t a x i s
= o M~~~~~
g i v e s t h e fo l lowing express ion f o r t h e DCC t o r q u e o u t p u t .
T = ( F N c o s 9 ) r x s
Next , s u b s t i t u t i n g i n t o t h e to rque e x p r e s s i o n t h e r e l a t i o n s h i p d e r i v e d for g i v e s
FN
r
T = mQ2(Rm + x ) c o s 9 cos "cg r x s
x c - 2
S u b s t i t u t i o n of t h e expres s ions f o r c o n t r o l moment. For t h e the ta -dependent case, t h e t o r q u e e x p r e s s i o n is
rxs and rxc comple tes t h e s o l u t i o n f o r t h e DCC
1 2 r cg s
T = - ma ( R ~ + x > r r c0s3 4 C
26

where
x = r s i n I$ cg
Note t h a t f o r t h e w h i r l t e s t c o n f i g u r a t i o n
e = e 0 - T / K ~ ( A2d 1
where are t h e i n i t i a l s h a f t a n g l e wi thout t h e a p p l i c a t i o n o f t o r q u e , t h e r e s i s t i n g s p r i n g c o n s t a n t , and t h e c o n t r o l l e r o u t p u t t o r q u e , r e s p e c t i v e l y . This s p r i n g d e f l e c t i o n c o n s t r a i n t must be a p p l i e d t o t h e to rque o u t p u t equa t ion set i n o r d e r t o compare a n a l y t i c a l p r e d i c t i o n s wi th t he w h i r l test data.
eo, KS, and T
One o f t h e performance c o n s t r a i n t s o f t he f r e e - t i p c o n t r o l l e r is the r e q u i r e - ment t h a t t h e t o r q u e o u t p u t v a r i a t i o n should be less than 10% o f t h e nominal v a l u e while v a r i e d w i t h i n a 210" p i t c h range. provide an estimate of t h e DCC percent t o r q u e v a r i a t i o n , and w i l l t h e r e f o r e show whether or n o t t h e p r o t o t y p e v i o l a t e s t h e c o n s t r a i n t .
The n e x t expres s ion t o be developed w i l l
Let To be t h e t o r q u e estimate o f e q u a t i o n ( A l ) , and l e t T1 be t h e t o r q u e estimate o f e q u a t i o n (A2) a t some a r b i t r a r y e . The re fo re
- To x 100% T 1 6 = TO
making t h e proper s u b s t i t u t i o n s
3 r
Rm 6 = 3 s i n I$ c o s 4
where 9 is d e f i n e d i n equa t ion (A2c).
Using t h e DCC p r o t o t y p e i n p u t parameters i n t a b l e 1 and a maximum 9 deflec- t i o n o f l oo t h e above equa t ion r e s u l t s i n 6 = 0.25$, exc lud ing f r i c t i o n effects. The DCC concep tua l ly sa t isf ies t h e des ign c o n s t r a i n t s .
Mass-on-String
The second c o n t r o l l e r t o be modeled is t h e MOS. Again, as i n t h e DCC, two models w i l l be developed f o r t h e the ta - independent and dependent assumpt ions .
27
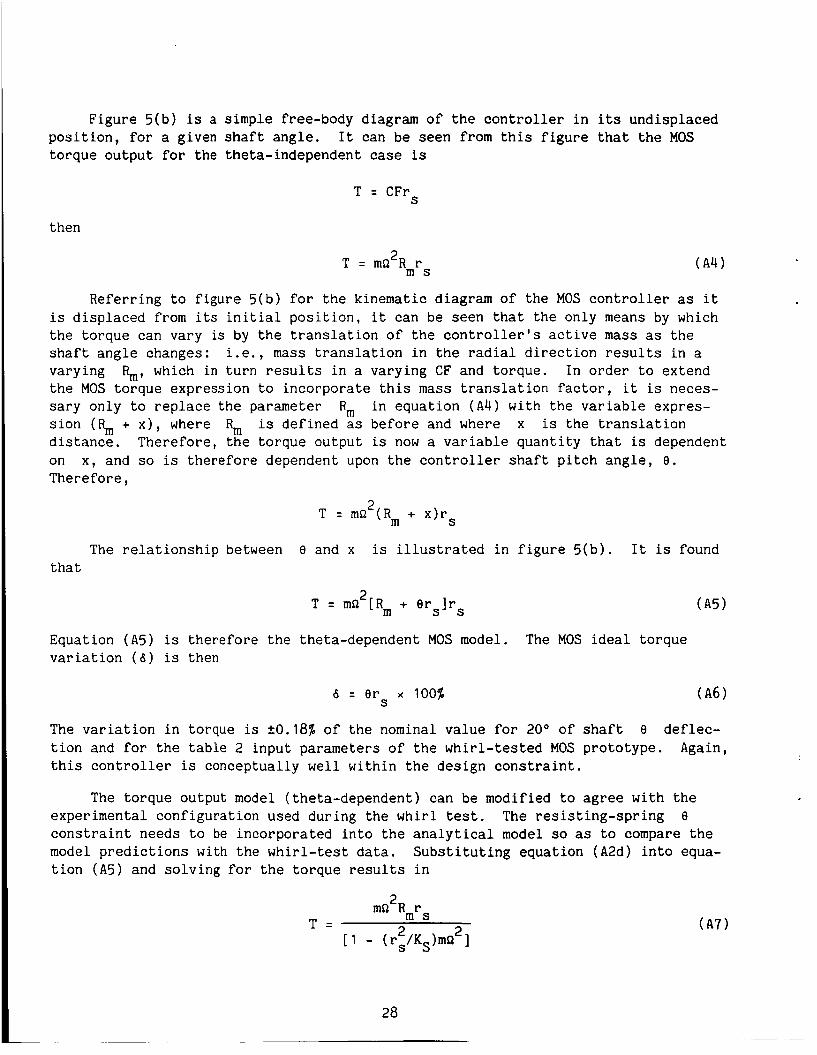
Figure 5(b) is a simple free-body diagram of the controller in its undisplaced position, for a given shaft angle. torque output for the theta-independent case is
It can be seen from this figure that the MOS
T = CFrs
then
Referring to figure 5 b
2 T = m n R r m s
for the kinematic Liagram of the 10s controller as it is displaced from its initial position, it can be seen that the only means by which the torque can vary is by the translation of the controller's active mass as the shaft angle changes: i.e., mass translation in the radial direction results in a varying the MOS torque expression to incorporate this mass translation factor, it is neces- sary only to replace the parameter sion (R, + x), where % is defined as before and where x is the translation distance. Therefore, the torque output is now a variable quantity that is dependent on x, and so is therefore dependent upon the controller shaft pitch angle, e . Therefore,
G, which in turn results in a varying CF and torque. In order to extend
in equation (A4) with the variable expres- %
2 T = ma (Rm + x)r S
The relationship between 8 and x is illustrated in figure 5(b). It is found that
2 T = ma [Rm + Ors]rs
Equation (A5) is therefore the theta-dependent MOS model. The MOS ideal torque variation ( 6 ) is then
6 = or x 100% (A61 S
The variation in torque is 20.18% of the nominal value for 20" of shaft 8 deflec- tion and for the table 2 input parameters of the whirl-tested MOS prototype. Again, this controller is conceptually well within the design constraint.
The torque output model (theta-dependent) can be modified to agree with the experimental configuration used during the whirl test. The resisting-spring 8 constraint needs to be incorporated into the analytical model so as to compare the model predictions with the whirl-test data. Substituting equation (A2d) into equa- tion (A5) and solving for the torque results in
2 mn Rmrs
[ 1 - (rs/KS)mn ] T = 2 2
28

Torsion Strap Controller
The TSC model for both cases, theta-independent and theta-dependent as applied to the whirl-test apparatus, is essentially the same. application of different 8 conditions. For the theta-independent case, 8 = BPT, and for the theta-dependent case, 0 = pretwist angle.
The only difference is the
+ A8 where 8pT is the torsion strap e PT
The analysis derives torque output equations for the TSC. It assumes that the
The analysis also makes three additional simplifying assump- torsional elastic properties of the mechanism to be negligible and considers only rigid body mechanics. tions: loading, and the strap width (which is twice the moment arm length) does not vary along the length of the strap. All three geometry changes occur, however, with the TSC pretwisted and loaded under tension. that these small geometry changes will have a major influence on the torque output predictions.
the strap length and strap width are not a function of the strap tensile
The experimental results section notes
As can be seen in figure 7(b), the torque output is the consequence of a normal force couple, ‘FN, as it is applied about the strap moment arm, r. Therefore
T = FNr
Referring to the incremental strap segment shown in figure 7(b), the force FN twisted torsion strap. Therefore, as per the strap free-body diagram
is seen to be a component of the centrifugal force that is applied to the
CF = FT COS $
or rearranged as
CF - - FT - cos 41
and
FN = FT sin $
Combining the above equations the TSC torque output is
T = rCF tan Q
The strap twist angle, 4 , is dependent upon the magnitude of 8 and on the strap geometry, r and 1. Additionally, as the free end of’ tne torsion strap is twisted, it will describe a geometric arc in space. The arc length is another parameter that is important in defining $. If the assumption is made that the strap slope for a given pitch angle is constant, then trigonometric identities can be related to the slope? to the arc length of the twisted strap, and to the strap length. These parameters can be thought of as an angle and as line segments being
29

mapped upon a cylindrical surface, forming a triangle. relationship is
The resulting geometric
X tan 4 = - 1
or
where x 0 ' . Therefore
is the arc length described by a point on the shaft that is rotated by
x = 0r
Given the information provided and making the appropriate substitutions, the model governing equations are therefore
( A8a) 2 T = rmn R tan 4 m
where for the whirl-test prediction comparisons, a special case of the theta- dependent condition is applied, i.e.,
0 = ePT - T/KS
APPENDIX B
Dual Cam Controller
,
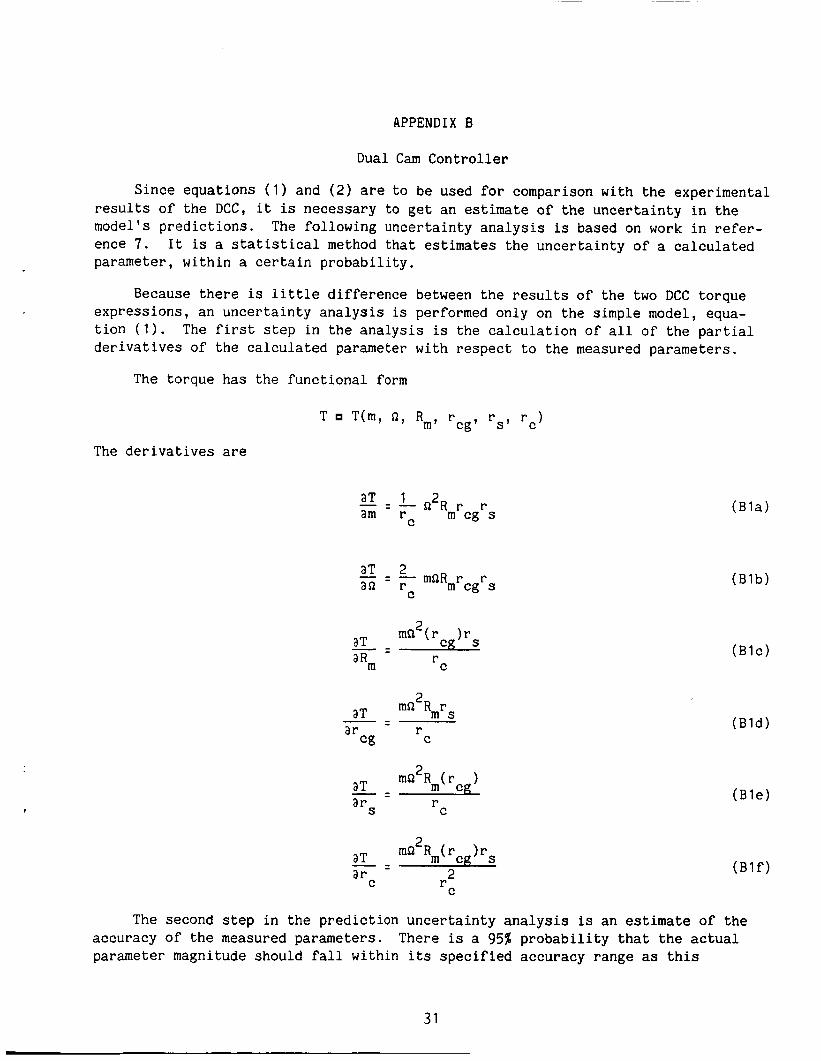
Since equations (1) and ( 2 ) are to be used for comparison with the experimental results of the DCC, it is necessary to get an estimate of the uncertainty in the model's predictions. ence 7. parameter, within a certain probability.
The following uncertainty analysis is based on work in refer- It is a statistical method that estimates the uncertainty of a calculated
Because there is little difference between the results of the two DCC torque expressions, an uncertainty analysis is performed only on the simple model, equa- tion (1). derivatives of the calculated parameter with respect to the measured parameters.
The first step in the analysis is the calculation of all of the partial
The torque has the functional form
T T ( m , n, Rm, cg' rs' 'c) r
The derivatives are
- - - aT - Q ~ R r r m cg s C
am r
r C
r C
The second step in the prediction uncertainty analysis is an estimate of the accuracy of the measured parameters. parameter magnitude should fall within its specified accuracy range as this
There is a 95% probability that the actual
31
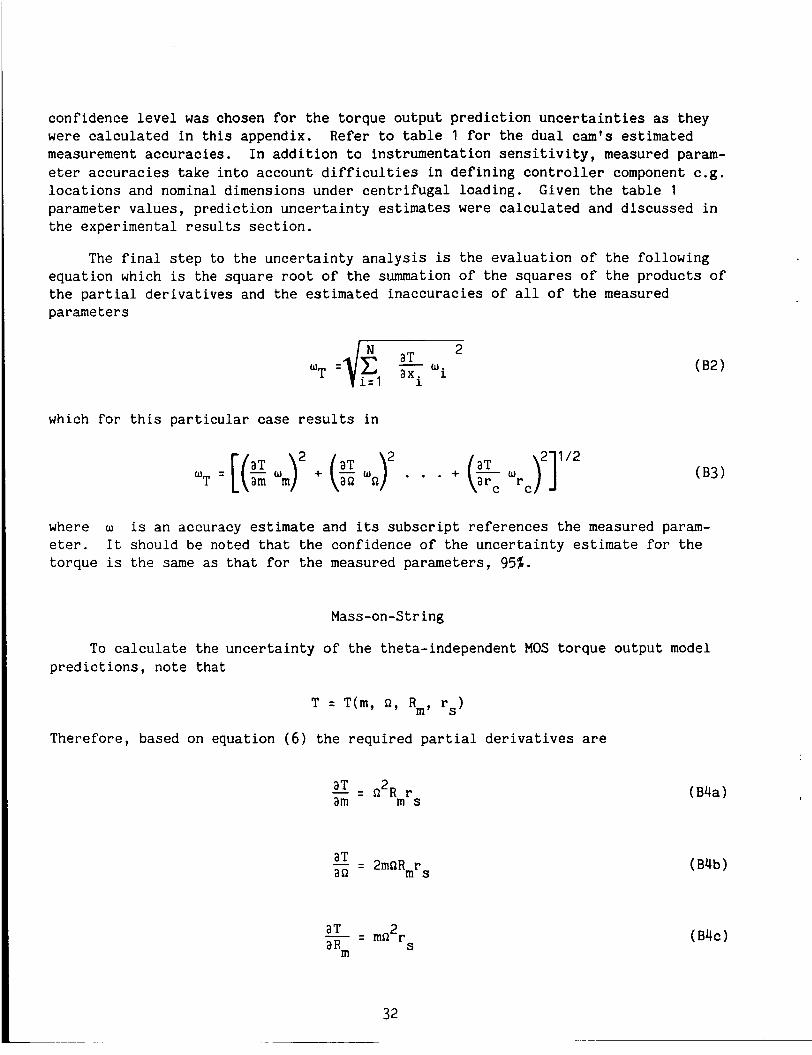
confidence level was chosen for the torque output prediction uncertainties as they were calculated in this appendix. Refer to table 1 for the dual cam’s estimated measurement accuracies. In addition to instrumentation sensitivity, measured param- eter accuracies take into account difficulties in defining controller component c.g. locations and nominal dimensions under centrifugal loading. Given the table 1 parameter values, prediction uncertainty estimates were calculated and discussed in the experimental results section.
The final step to the uncertainty analysis is the evaluation of the following equation which is the square root of the summation of the squares of the products of the partial derivatives and the estimated inaccuracies of all of the measured parameters
which for this particular case results in
-[(Ew)* - am m + (” an w n . . . +
where w is an accuracy estimate and its subscript references the measured param- eter. torque is the same as that for the measured parameters, 95%.
It should be noted that the confidence of the uncertainty estimate for the
Mass-on-String
To calculate the uncertainty of the theta-independent MOS torque output model predictions, note that
T = T(m, n, Rm, rs)
Therefore, based on equation (6) the required partial derivatives are
aT 2 - = i2 Rmrs am
aT - = 2mPRmrs an
2 - - S
aT - mn r a Rm
2 - - m aT - mn R
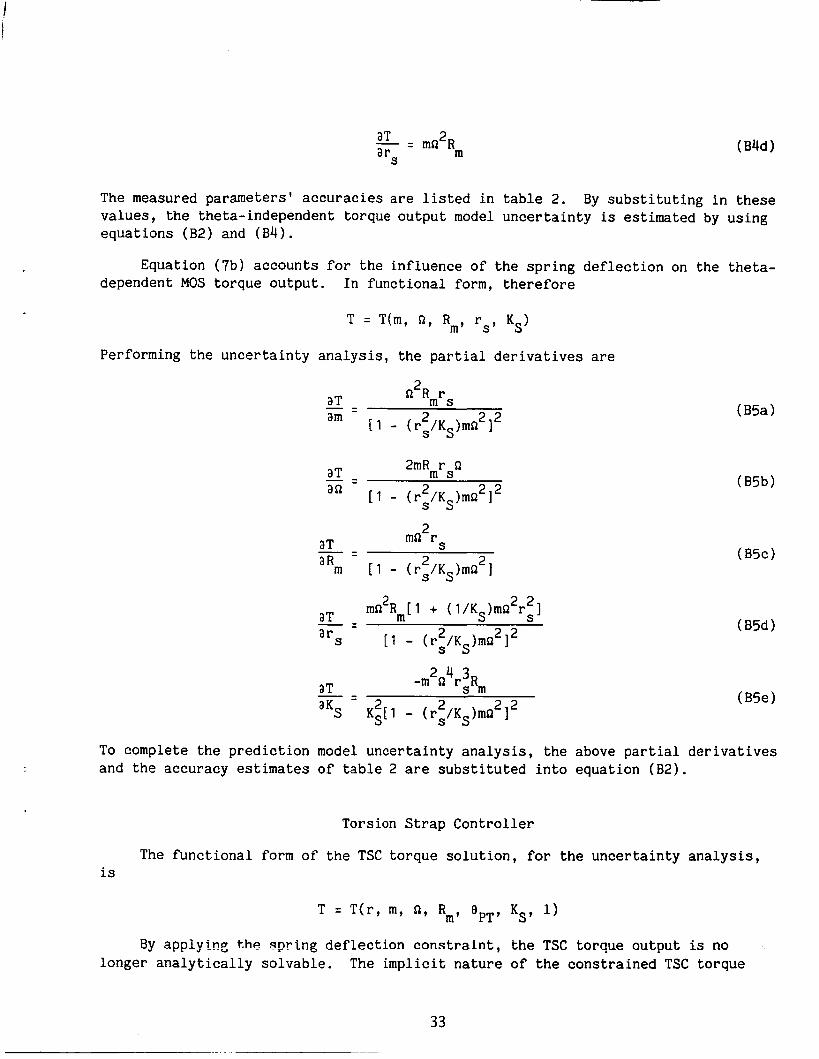
arS
The measured parameters' accuracies are listed in table 2. values, the theta-independent torque output model uncertainty is estimated by using equations (B2) and (B4).
By substituting in these
Equation (7b) accounts for the influence of the spring deflection on the theta- dependent MOS torque output. In functional form, therefore
T = T(m, a, Rm, rs, Ks)
Performing the uncertainty analysis, the partial derivatives are ,.
2mR r a
[ 1 - (rs/KS)mn ]
aT m s an 2 2 2 - - -
L mn rs 2 2
- - aT aRm - [ 1 - (rs/KS)mQ ]
2 2 2 mn R,[l + (1/KS)rnn r 3 S - - -
2 aT arS [ l - ( ~ ~ / K ~ ) m n ~ ] ~
2 4 3 - m n r R aT s m - - - 2 2 2 2 Ks[l - (rs/KS)mn ]
To complete the prediction model uncertainty analysis, the above partial derivatives and the accuracy estimates of table 2 are substituted into equation (B2).
Torsion Strap Controller
The functional form of the TSC torque solution, for the uncertainty analysis, is
By applying t h e spring deflection constraint, the TSC torque output is no longer analytically solvable. The implicit nature of the constrained TSC torque
33

output model prevents an analysis of the partial derivatives that are necessary for this prediction uncertainty. approximate these derivatives. Using first-order finite-difference expressions, the derivative calculations were based upon iterative solutions of the torque output for a converging interval about each specified parameter's nominal value, whereas all other parameters retained their nominal value.
Therefore an algorithm was devised to numerically
Table 3 presents the TSC parameter accuracy estimates used in the torque uncer- tainty calculations.
APPENDIX C
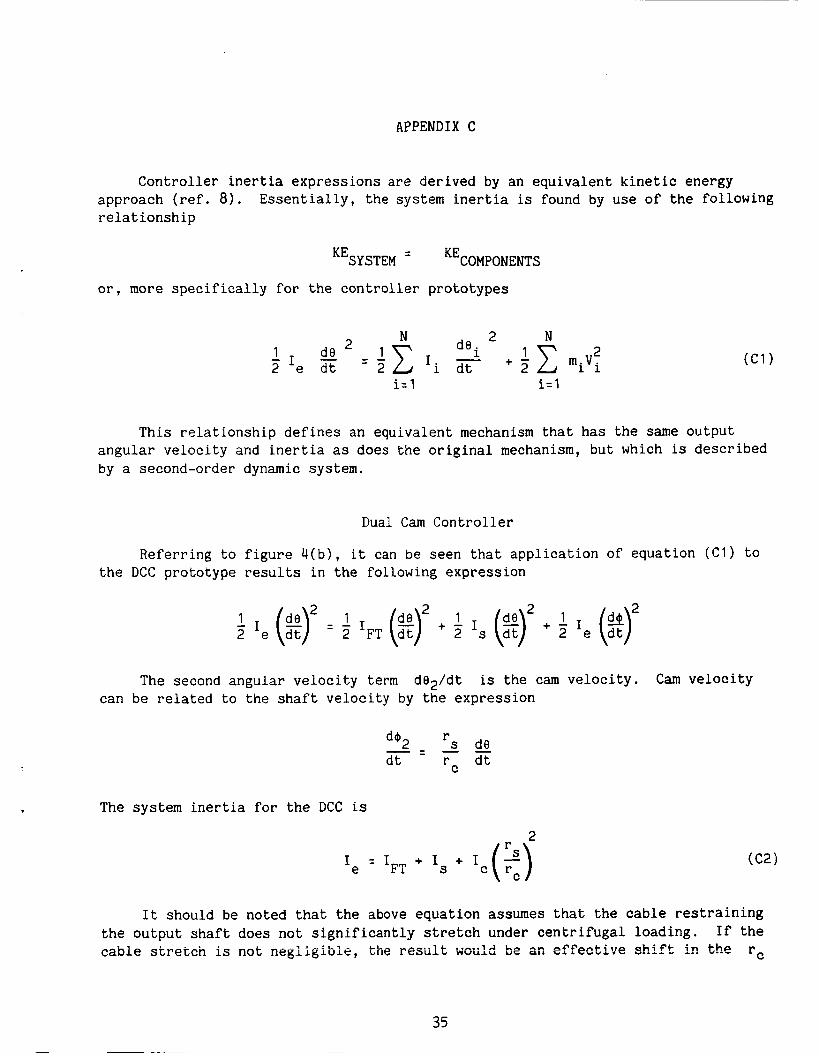
Controller inertia expressions are derived by an equivalent kinetic energy approach (ref. 8). relationship
Essentially, the system inertia is found by use of the following
K E ~ ~ ~ ~ ~ ~ = K E ~ ~ ~ ~ ~ ~ ~ ~ ~ ~ or, more specifically for the controller prototypes
2 2 miVi
dei N 2 1 de - I 2 e d t i= 1 i= 1
This relationship defines an equivalent mechanism that has the same output angular velocity and inertia as does the original mechanism, but which is described by a second-order dynamic system.
Dual Cam Controller
Referring to figure 4(b), it can be seen that application of equation (C1) to the DCC prototype results in the following expression
The second angular velocity term dO*/dt is the cam velocity. Cam velocity can be related to the shaft velocity by the expression
s a r r dt
d+2 - - - C dt -
The system inertia for the DCC is
2 I e = I FT + I 5: +Ic(?)
It should be noted that the above equation assumes that the cable restraining If the the output shaft does not significantly stretch under centrifugal loading.
is not LL ...--.. 1 e ...... 1 A C L I l S 1-l=auJ.CI W U U l U be a:: effective shift ir? the r
35
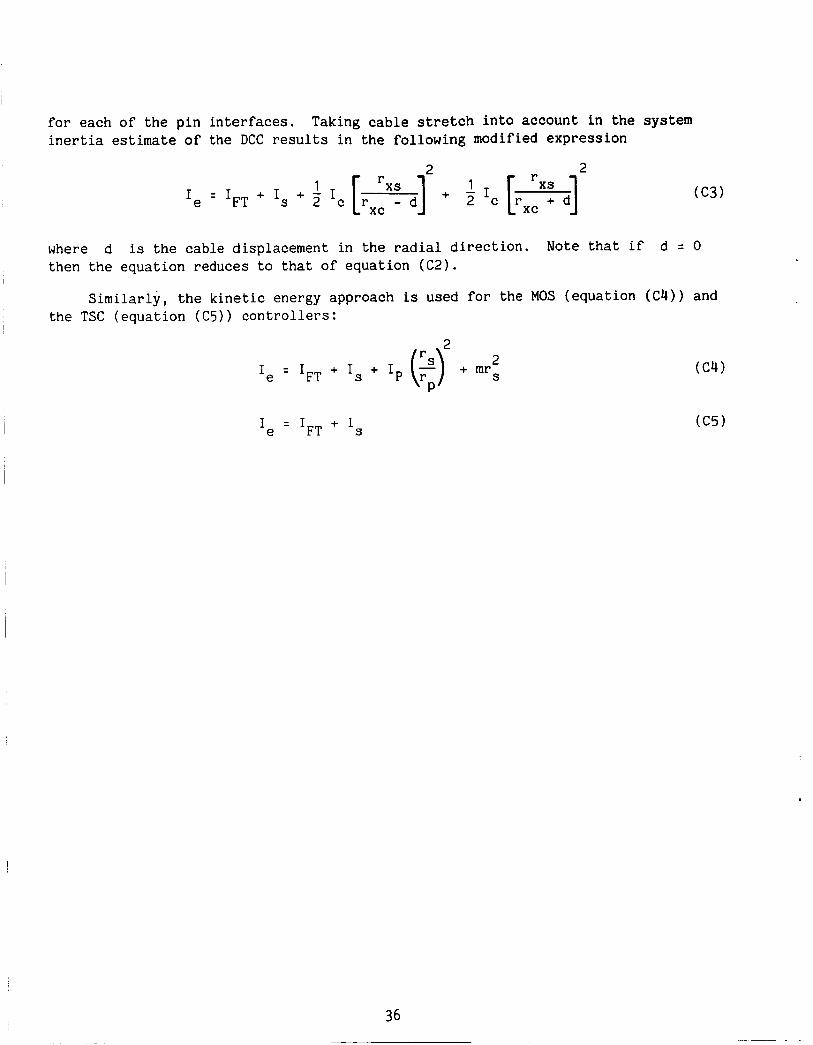
f o r each o f t h e p i n i n t e r f a c e s . i n e r t i a estimate of the DCC r e s u l t s i n t h e fo l lowing modified expres s ion
Taking cable s t r e t c h i n t o account i n t h e sys tem
2 2
= IFT + Is + dl + ' I [ ": d] rxc
where d is the cable d isp lacement i n t h e radial d i r e c t i o n . Note that i f d = 0 then the equa t ion reduces t o t h a t o f equa t ion (C2).
S i m i l a r l y , t h e k i n e t i c energy approach is used f o r t h e MOS ( equa t ion (C4)) and t h e TSC ( e q u a t i o n (C5)) c o n t r o l l e r s :
2 I = IFT + Is + I p (t) + m r s 2 e
I e = IFT + I S
36

APPENDIX D
Estimates for the prototypes' spring constants can be derived by considering the controller theta-dependent torque output expressions, equations (2), (7a), and ( 1 1 ) . calculated.
The equations can be linearized and the spring constant can be
The DCC theta-dependent torque output model can be linearized by a small-angle assumption. The DCC design tested during the whirl test had a 8 hard-stop restriction of +loo. Using equation (2c) and the data in table 1 , the Q range for the DCC that was tested was +6". angle approximations used below.
Both these angles are acceptable for the small-
Now the applicable DCC torque output expressions are
1 2 r cg s
T = - ma ( R ~ + x>r r c0s3 4 C
and r
tan Q = - tan e r S
C
The torque model can be linearized by the following small-angle approximations: cos 4 J 1 , sin I$ J 4 , tan e J e, and tan 6 :: Q. The linear model is
Therefore, by definition
For the MOS controller, referring to equation (7a) 2 2 2 T = mQ Rmrs + [mn rS]9
results in
37
The TSC analytical model, equation ( l l ) , is nonlinear tan 4 ZJ simplified by use of the following approximation:
Thus
The TSC expression can then be linearized and has the
2 Rm = m(ar) - Ktsc 1
The equation can be 4 for small 4 .
form :

APPENDIX E
The major contribution to controller damping is friction. There are two funda- mental problems with arriving at an estimate of the controllers' damping coefficient (Tf): ( 1 ) arriving at a reasonable normal contact force estimate, and (2) specify- ing the friction coefficients.
A friction coefficient value is unique to each mechanical system and is not easily calibrated. There are handbooks containing ranges of FI values for differ- ent material combinations, but the uncertainty in application is large. Though the physics of defining an out-of-plane normal force are straightforward, the contact friction forces are dependent on localized conditions that are not easily defined or measured. ment, then scouring could occur prohibiting any damping analysis.
8 , 5, and mechanism component misalignment-- If there is misalign-
At best, what can be accomplished is an approximate estimate of the magnitude of solution is the reduction of the torque coulomb damping constant into individual components. The result is the following expression:
Tf, but one where the physics are clearly outlined. The first step to the
Tf = Tf(shaft) + Tf(controller active elements)
+ T f(the torsional spring resisting component)
The frictional torque from the controller's active elements can be further subdivided into contributions from individual mechanical elements, and is therefore unique to each controller that is analyzed. frictional torque from the shaft is the same. nent will be analyzed first; the unique contributions will be analyzed later.
In all four controllers studied, the For this reason this damping compo-
The shaft friction component can be expressed as Tf(shaftt = prsN where u , rs, and N are the friction coefficient, the shaft radius, and he bearing normal contact force, respectively.
- The normal force, N, must be defined. For this experiment, as the plane of
rotation is assumed to be rigid, there are three contributions to N: the weight of the controller's active mass, the out-of-plane CF component caused by coning, or nonzero 8 , and the in-plane normal CF component caused by lead-lag, or nonzero 5. A free-body diagram of these mormal force components is shown in figure 13. These components are vectorally added to arrive at the resultant force, N. The expression for N is:
N = d(W cos s ) ~ + (CF sin S)2 + (CF sin 5 cos 6 ) 2
39
and so the complete expression for the Tf shaft component is:
40 I ~
(E2) 2 = vrs d(w cos 812 + (CF sin e)' + (CF sin 5 cos e ) Tf (shaft)
Since the above equation has been developed for the common and the largest friction term for all four prototypes, it is now necessary to derive the additional terms that are due to unique prototype mechanical components. For the TSC control- ler, equation (E2) is the only friction contribution.
The DCC controller has a single additional Tf
Referring to figures 14(a) and l4(b), the free-body diagrams illus-
term that needs to be derived, i.e., the friction contribution of the cams that come into contact with the control- ler housing. trate two items necessary for the term Tf(dccl. First, each cam has its own normal force component which acts against the control er's housing--this must be estimated. Second, the friction forces will impart a resisting torque to the cam's motion, which in turn applies a torque to the output with its magnitude governed by the mechanical advantage ratio of the cams.
The cam contact force, taking centrifugal out-of-plane components into account, can be expressed as:
= Wdcc COS 8 + CFdcc sin 8 Ndcc
Only the 8 contribution results in a friction force. The 5 component does not act normal to the cadhousing surface. derived earlier was found to be
The cam mechanical advantage ratio as
%grs C
Tshaft = Fcam r
In the original equation tionship is applicable for determining the resisting torque that is due to friction force, since both forces act through the cam's c.g. and the same kinematic linkage.
FC, was the centrifugal force; however, the same rela-
Therefore, the additional Tf term in DCC is found to be:
rcgrs Ndcc
C Tf(dcc) = ' r
The above equation assumes that the pitch-angle displacement is small. Given the minor variation in torque output as seen in the dynamic DCC model, this is a suitable approximation.
For the remaining controller, the MOS, the damping estimate can be completed by again noting that the mechanism contact force is still governed by equation ( E l ) , only now with the weight and centrifugal load being that of the translating
mass. resisting torque can be found by referring back to the controllers' torque perfor- mance equation, in this case equation (6).
Similarly, the transformation of the translating mass friction force to a
Therefore, it is seen that the MOS mass friction contribution is simply
where
This completes the equation set for estimating the friction resistance to
The mechanical spring damping is a combination of coulomb and controller dynamic oscillations. left undefined. strain energy damping. The friction contribution is undefinable because the load path of the mechanical spring cannot be directly analyzed. pation term can only be empirically determined.
Only the final term, Tf (mechanical spring) is
The strain energy dissi-
41
REFERENCES
1. Hooper, W. E.: The Vibratory Airloading of Helicopter Rotors. Ninth-European Rotorcraft Forum, Stresa, Italy, Paper No. 46, Sept. 1983.
2. Stroub, Robert H.: Performance Improvements with the Free-Tip Rotor. AHS National Specialists' Meeting, Rotor System Design, Oct. 1980.
3. Stroub, Robert H.: A Constant Lift Rotor for a Heavier Than Air Craft. U.S. Patent 4,137,010, Jan. 30, 1979.
4. McVeigh, M. A.; Rosenstein, H.; Bartie, K.; and McHugh, F. J.: Investigation of a Rotor System Incorporating a Constant-Lift Tip. Contract NAS2-10769) NASA CR-166361, 1981.
(Boeing Vertol Co.; NASA
5. Stroub, Robert H.: An Experimental Investigation of a Free-Tip Rotor Configura- tion in a Forward Flight Wind-Tunnel Test. NASA TM-84409, 1983.
6. Tipler, P. A,: Physics. Worth Publishers, Inc., 1976.
7. Holman, J. P.; and Gajda, Jr., W. J . : Experimental Methods for Engineers, Third ed., McCraw-Hill, 1978.
8. Shigley, J. E.: Mechanical Engineering Design. Third ed., McGraw-Hill, 1977.
9. Vierck, R. K.: Vibration Analysis. Second ed., Harper and Row, 1979.
42

TABLE 1.- DCC DESIGN GEOMETRY AND OPERATING CONDITIONS
Parameter Nominal value xi
0.039 kg
8.45~10'~ m 1.88~10'~ m 5.08~10'~ m Variable
.8 m
uracies Accuracy wx:
24.08~ 1 0-3 kg 21.3~10'~ m 21.588~10'~ m 21 ~88x10'~ m 28. ~ 8 x 1 0 ' ~ m 2.5 rad/sec
TABLE 2.- MOS DESIGN GEOMETRY AND OPERATING CONDITIONS
MOS parameter accuracies Parameter 1 Nominal value xi I Accuracy wxi
KS m %I
rS n
0.0395 N-m/deg .045 kg .813 m
5.08~10-~ m Variable
5 . 6 5 ~ iod3 k6.8~ 1 0-3 kg 22.54~10'~ m k7.62~10'~ m k.5 rad/sec
TABLE 3 . - TSC DESIGN GEOMETRY AND OPERATING CONDITIONS
Parameter
I
TSC parameter accuri Nominal value xi
0.0395 N-m/deg .0667 m .288 kg 1.052 m 5.08~10-~ m Variable Experimental values: 17O, 47", 67", 89"
:ies Accuracy w
xi
25.65.1 0-3 k3.175~10'~ m k4.54~ kg +1.27~10-~ m +7.62~10-~ m 2.5 rad/sec +_lo% nominal
43
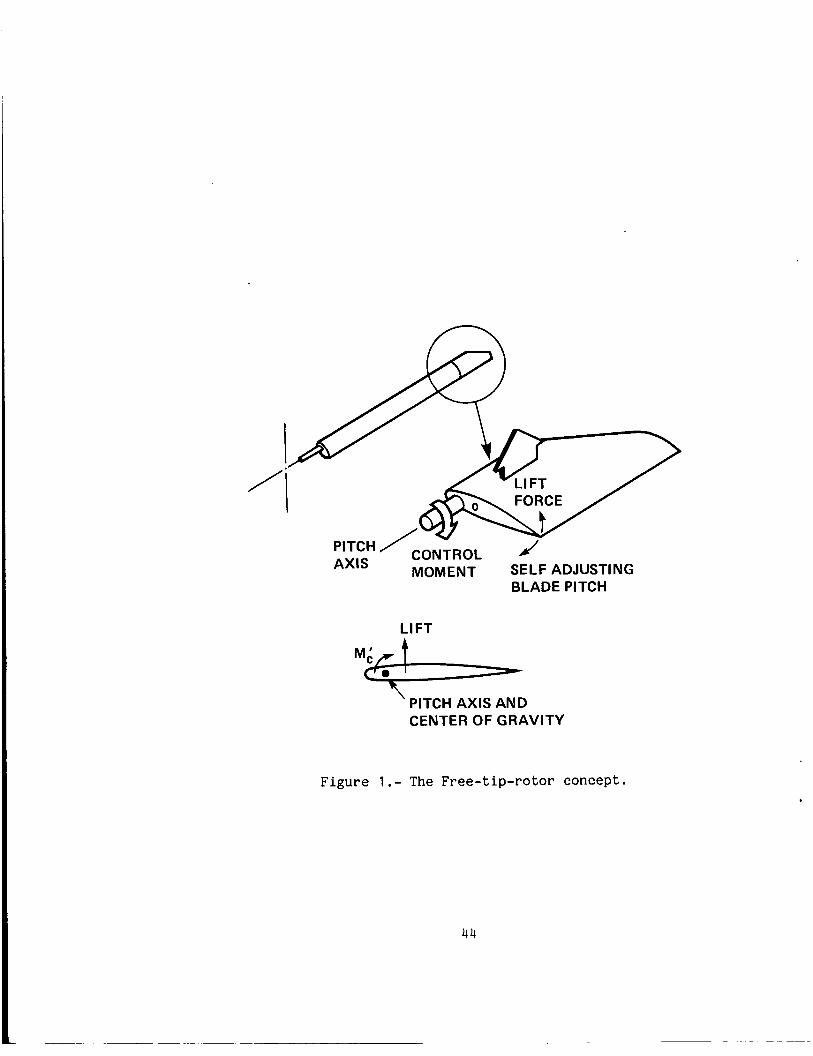
CONTROL MOMENT SELF ADJUSTING AXIS
BLADE PITCH
' PITCH AXIS AND CENTER OF GRAVITY
Figure 1.- The Free-tip-rotor concept.
44

-.. L 0 0 0 L
a 4 0 I
Q, Q, L trr I
N
45

SPI RAL GUI DEg
SHAFT EXTENSION, /'
\ 5 PERCENT TIP
EXISTING BLADE
Figure 3 . - First-constant-moment-controller design.
46

I 1
0 I I O
0
A I VIEW A-A
I I
(a) Assembly.
Figure 4.- Dual cam controller.
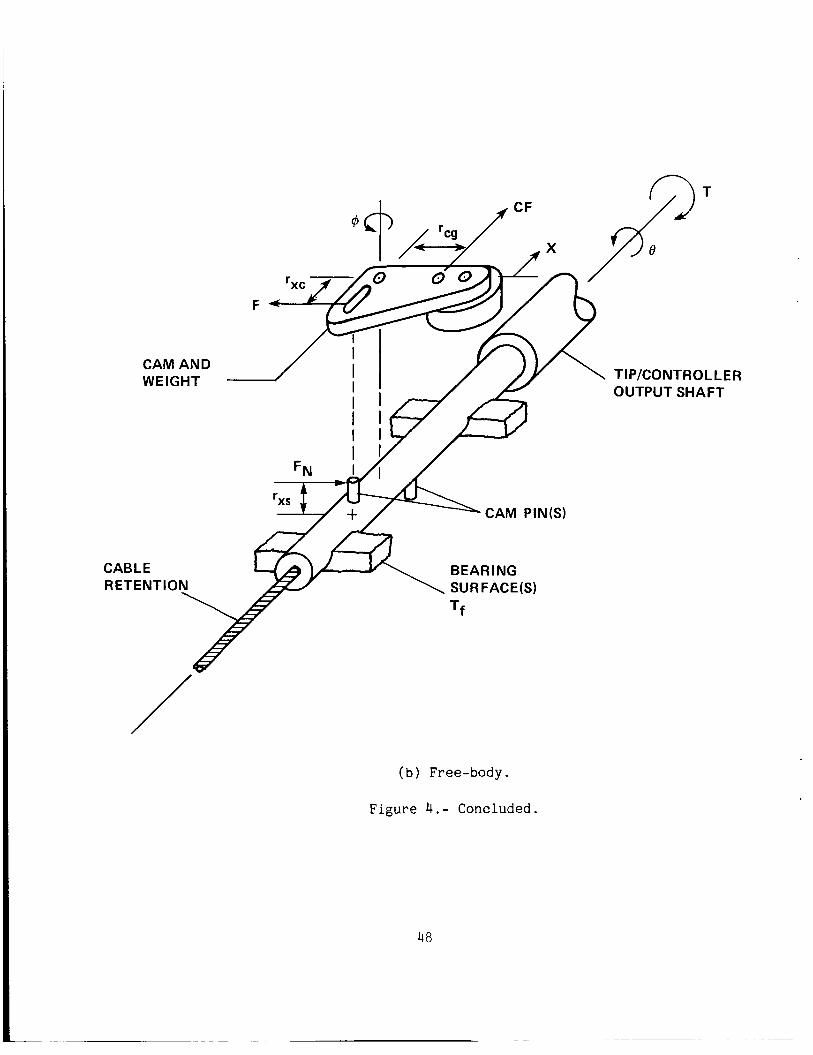
TI PKONTRO L L E R OUTPUT SHAFT
CAM AND
CABLE
(b) Free-body.
Figure 4.- Concluded.
48

0
0
-I I ---
I 0
(a) Assembly.
Figure 5.- Mass-on-string (pulley version).
VIEW A-A
49

v) v) a E
i 50
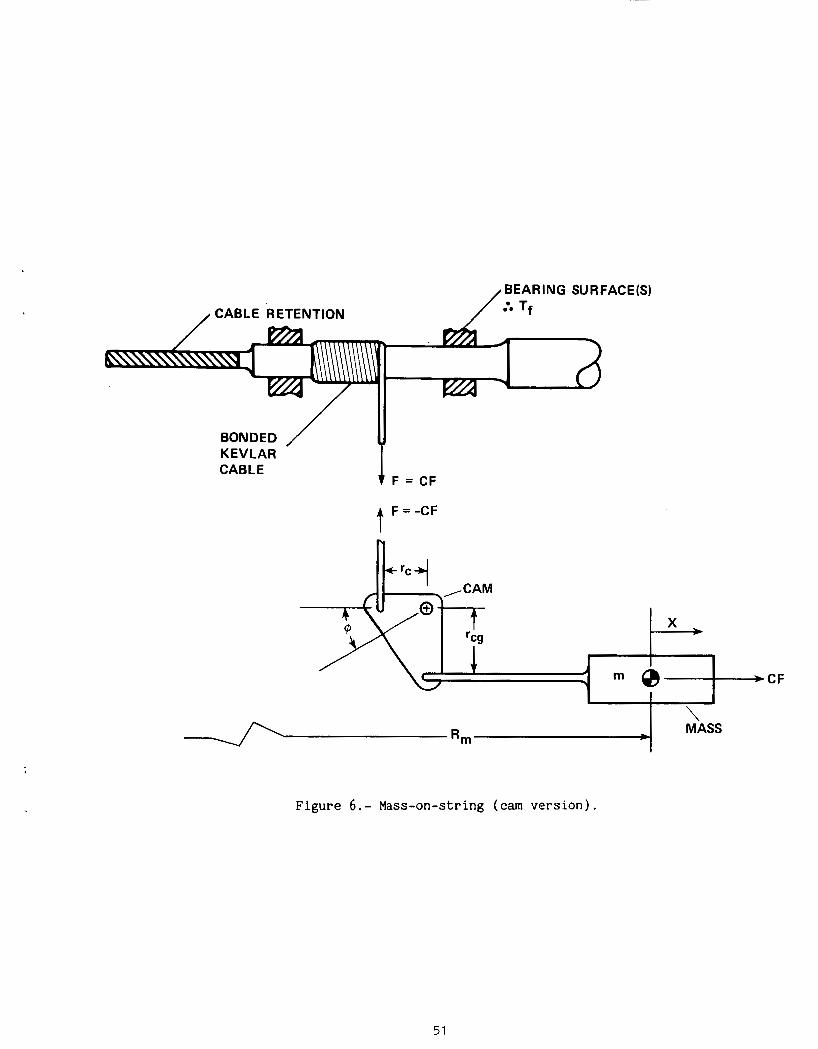
/ CABLE RETENTION
t ‘cg
/ BEARING SURFACE(S) :e Tf
X
Y F = CF
BONDED / KEVLAR CABLE
J 7
t F = - c F
m e *
Figure 6.- Mass-on-string (cam version).
CF
51
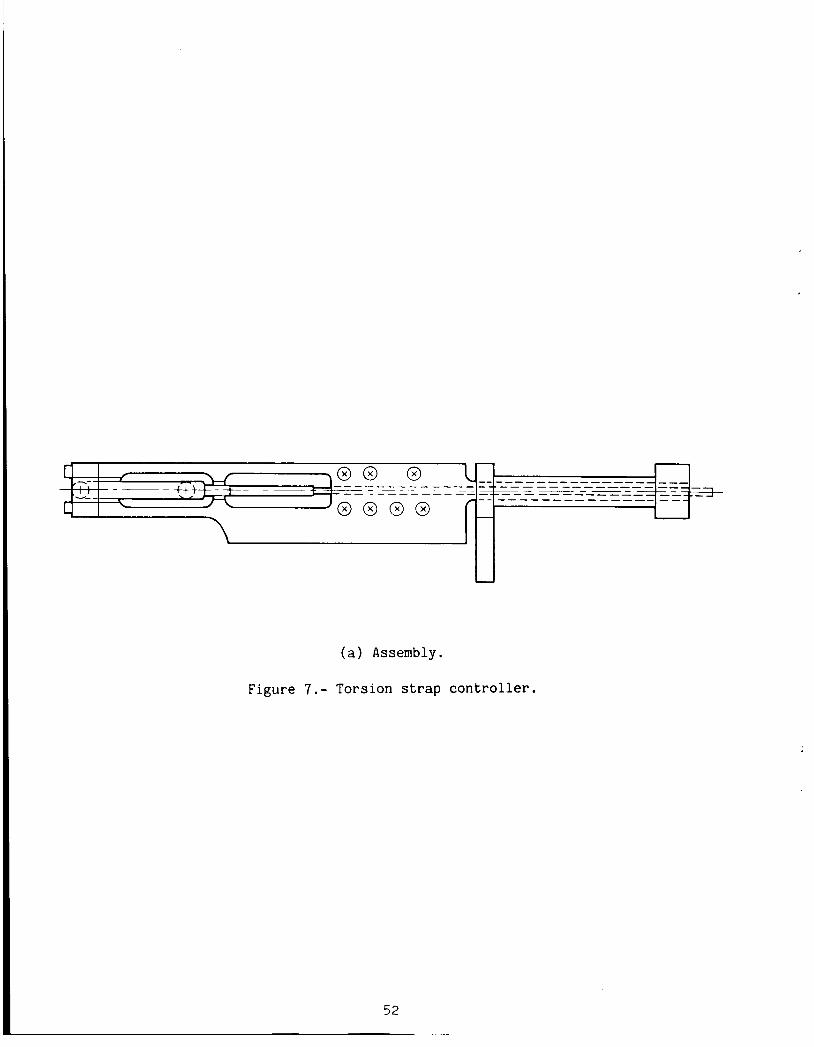
(a) Assembly.
Figure 7.- Torsion strap controller.
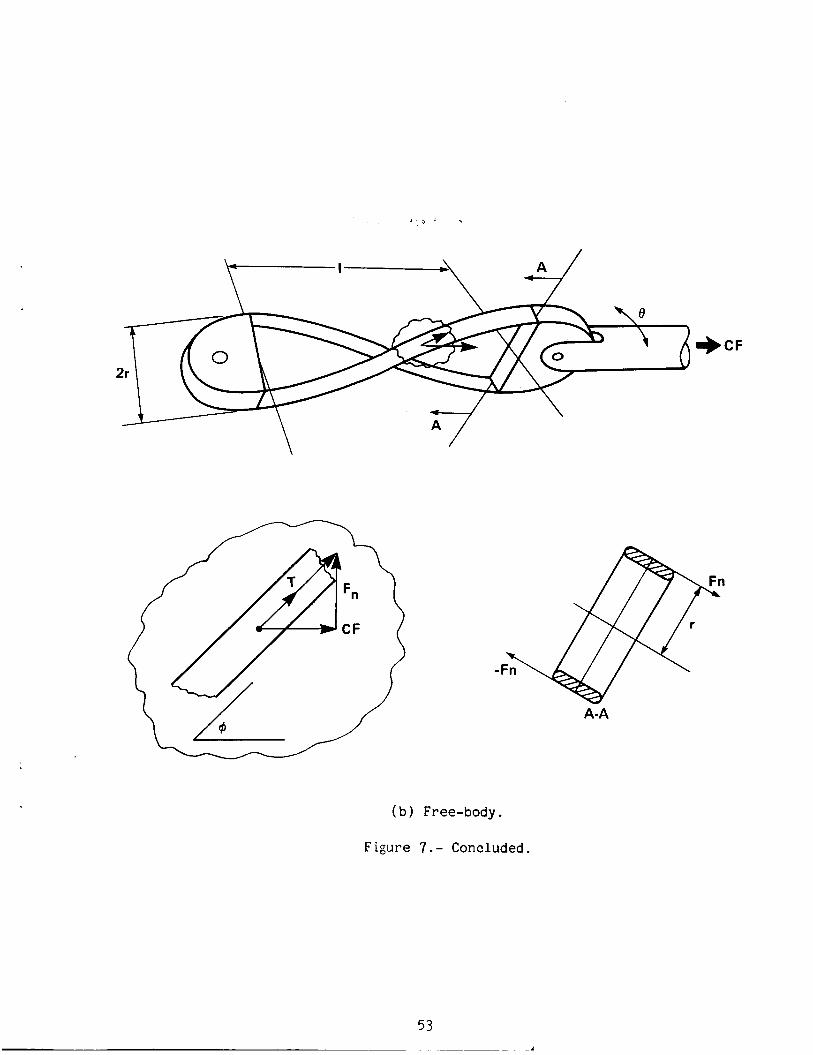
A-A
(b) Free-body.
F i g u r e 7.- Concluded.
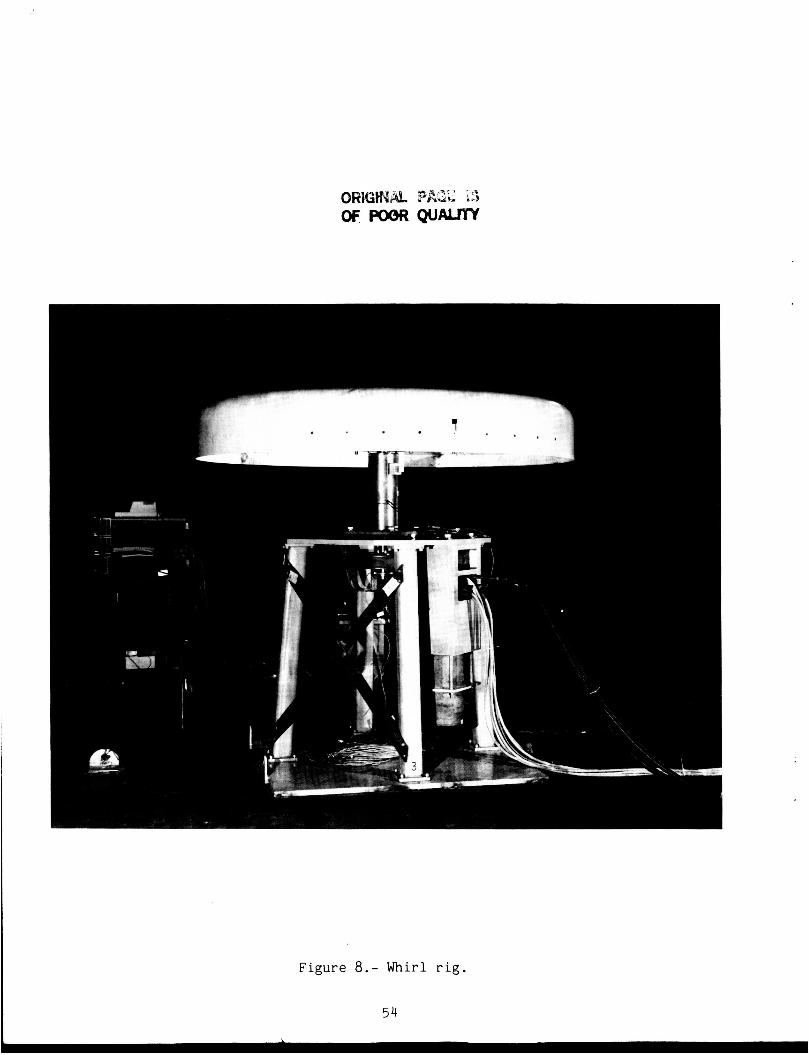
Figure 8.- Whirl r i g .
54

ELECTRIC MOTOR DRIVEN , EXCITOR WITH CAM WHIRL RIG / i . TFST R F n
CONTROLLER PROTOTYPE WITH TRIP LEVER AND SPRING ASSEMBLY
Figure 9.- C o n t r o l l e r test bed.
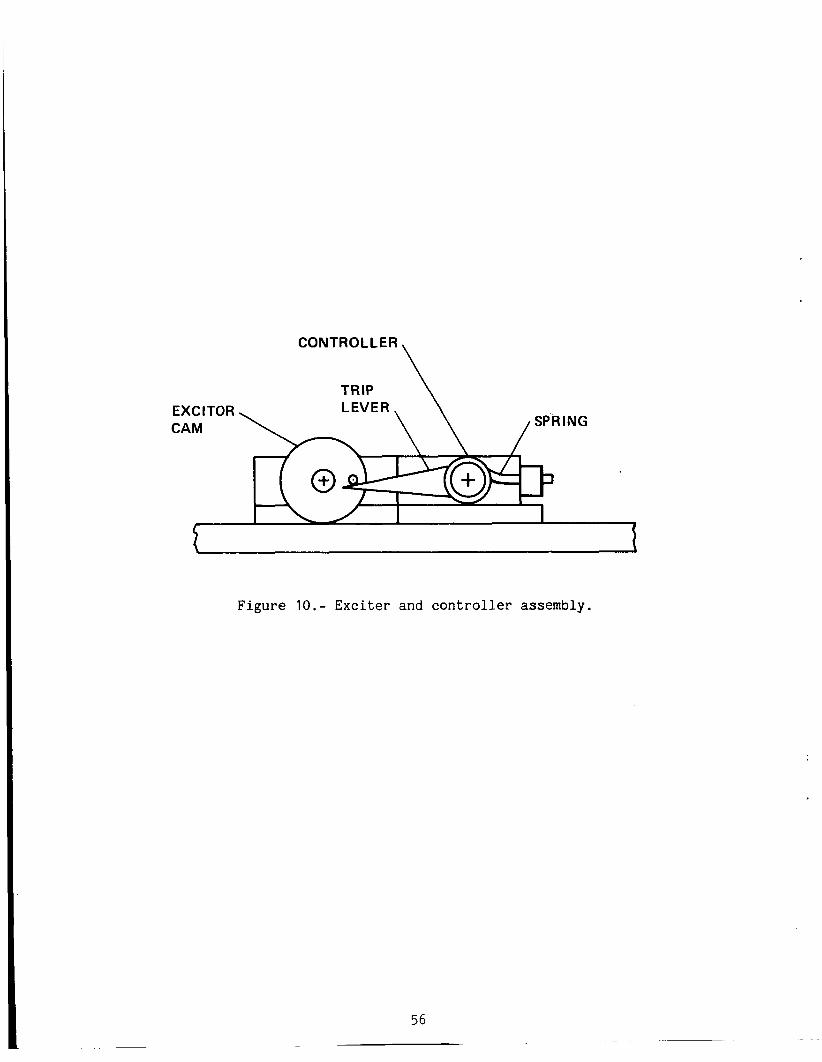
\ CONTROLLER
TRIP EXCITOR CAM
5 I t \
Figure 10.- Exciter and controller assembly.
56

LEVER
OPPOSING TORQUE
DETACHABLE
CALIBRATION F I XTU R E
CABLE-PULLEY
W (WEIGHTS IMPOSE CALI BRAT I ON TORQUE )
Figure 11.- Spring assembly torque calibration.
57
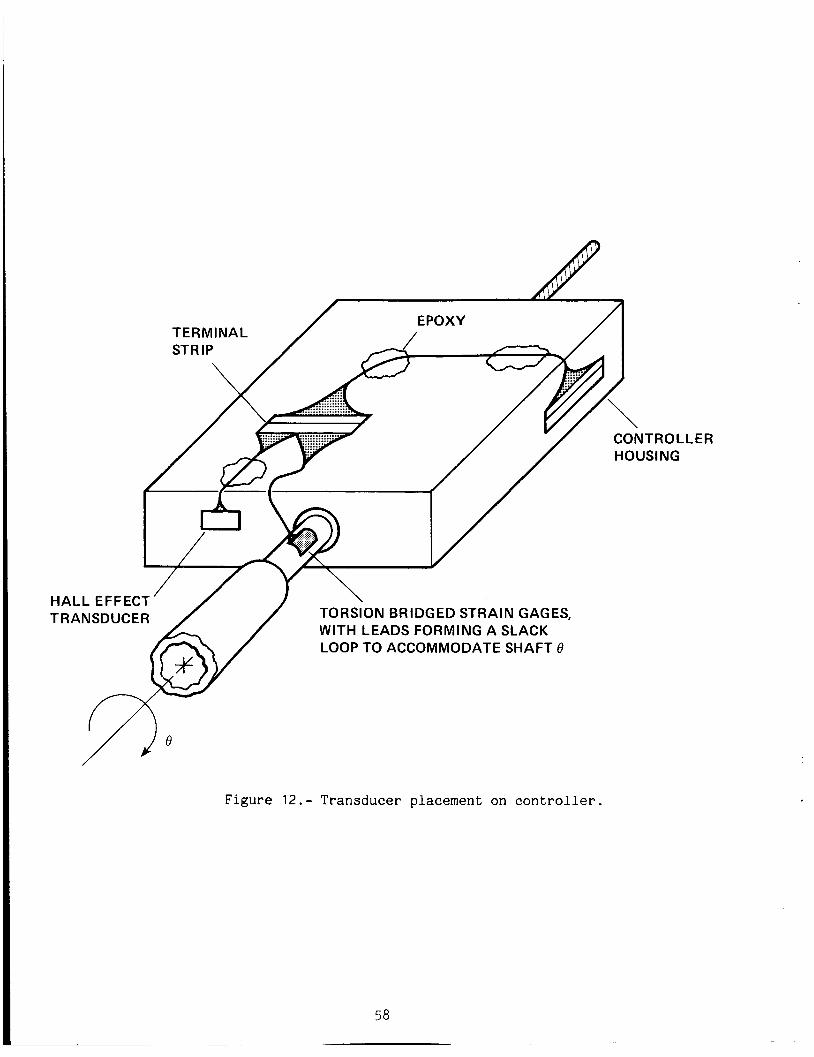
Figure 12.- Transducer placement on controller.
58
.LER
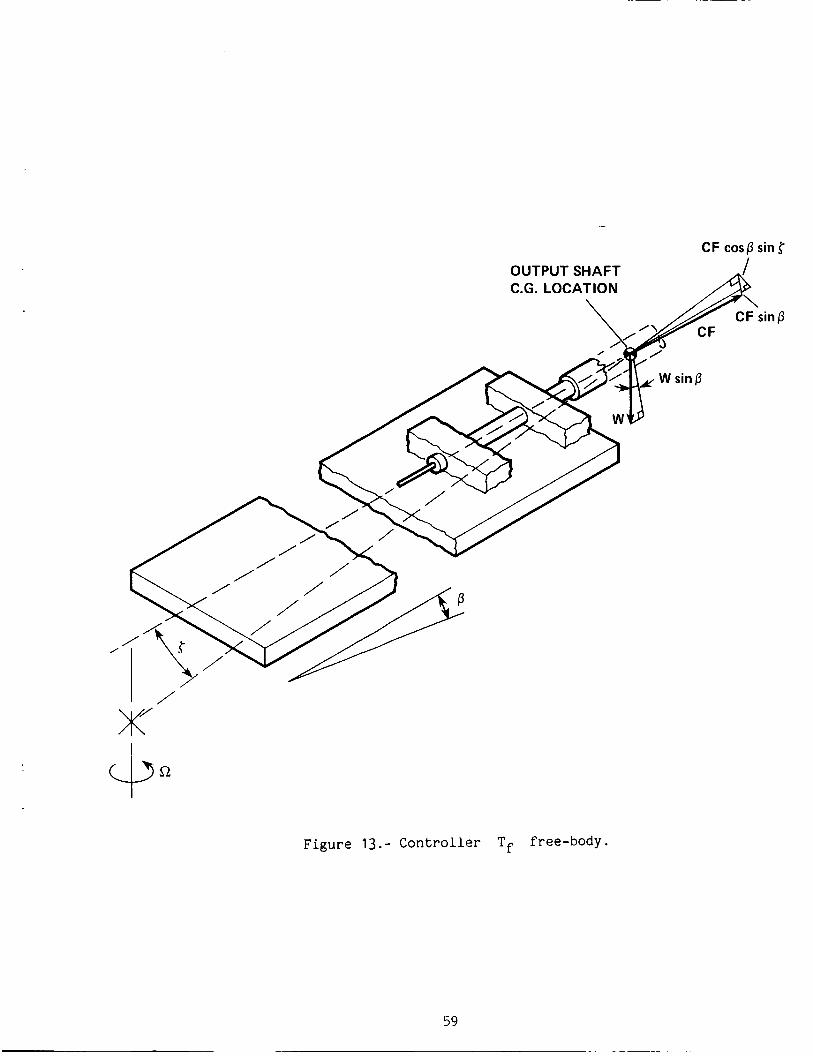
-
CF cos0 sin S OUTPUT SHAFT I
Figure 13.- Controller Tf free-body.
59

CAM HOUSING CONTACT SURFACE
(a) DCC Tf component.
Figure 14.- Unique controller contributions to T f .
60

TRANSLATING MASS
F = CF, * Ff
/ 07- TORQUE OUTPUT SHAFT
F = CF, f Ff \
I 1 - I CFX I I
'//////////////,/////,//// ////////////////////////// , - (b) MOS Tf component.
Figure 14.- Concluded.

0 FOIL 0 SEMI-CONDUCTOR
STRAIN GAGE OUTPUT, mV
Figure 15.- Torsion-bridged strain gage calibration curve.
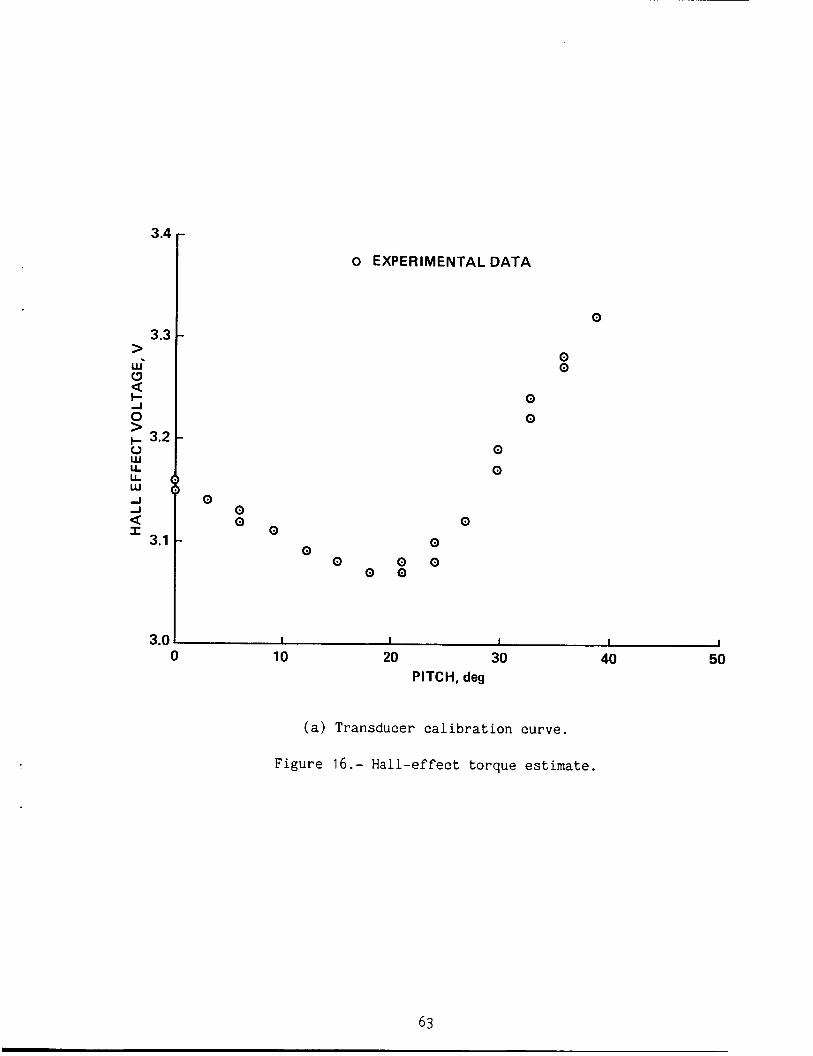
0 EXPERIMENTAL DATA
3.4
3.3 > W' Q a 5
%
0 > + 3.2
LA LL
0
-
-
-
-I -I
I a
3.1
3.0
0 0
0 0 0 0
0 - 0 0 0 0 0
0 0
I 1 1 I I
0 0
(a) Transducer calibration curve.
Figure 16.- Hall-effect torque estimate.
63
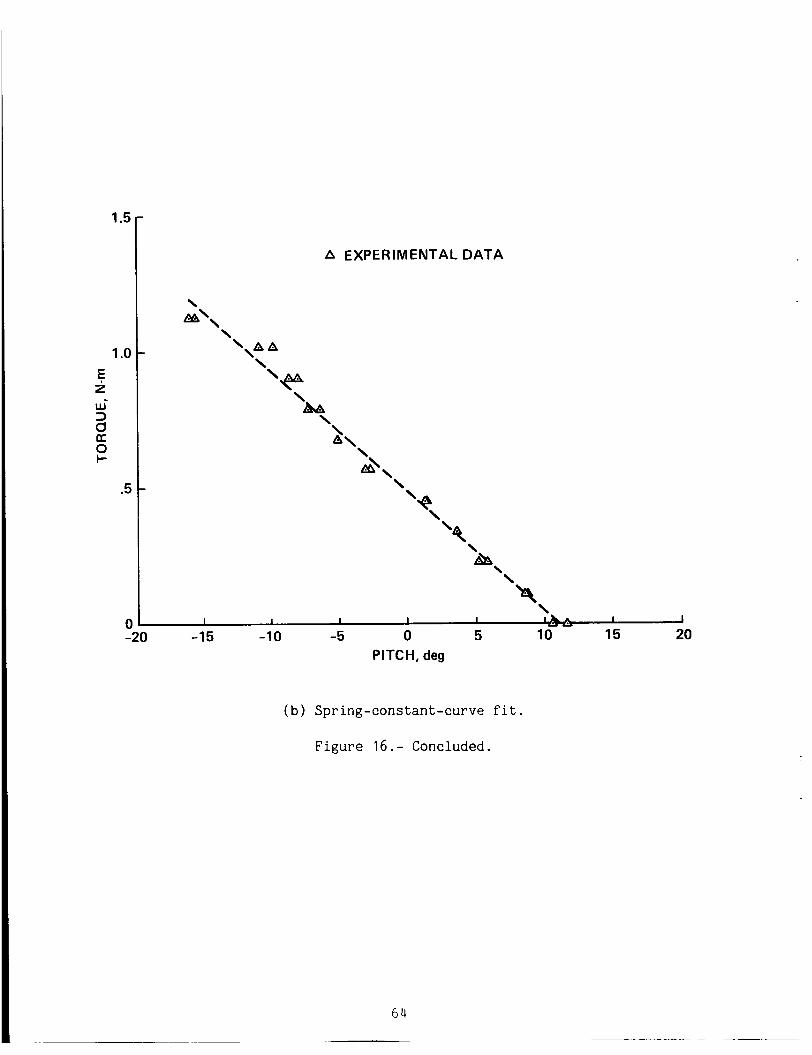
1.5
1 .o E 2 u- 3 d K 0 I-
.5
C -
A EXPERIMENTAL DATA
\ &A'\
\ \\a A
\
'e ' ' \ A\
\ A,
\
'+? ' \
' Q \
&A ' ' 's
I I
I -15 -10 -5 0 5 10 15 20 PITCH, deg
(b) Spring-constant-curve fit.
Figure 16.- Concluded.
64

8.0
7.2
6.4
E 5-6 i
I- : 4.0 w 3 CI 3.2 a
2.4 e
1.6
.8
0
0 HALL EFFECT TRANSDUCER * FOIL STRAIN GAGE /
- /
- 0 SEMI-CONDUCTOR STRAIN GAGE / / / --- UPPER UNCERTAINTY LIMIT --- LOWER UNCERTAINTY LIMIT / - ANALYTICAL PREDICTION
-
-
-
-
-
-
150 300 450 600 750 900 1050 1200 1350 1500 rpm
Figure 17.- Dual-cam-controller-torque output.
65

4.5
4.0
3.5
E 2 3.0 +- 3
2.5 3 0 2 2.0 U a
1.5
1 .o
.5
0
L
v EXPERIMENTAL DATA - / ANALYTICAL PR ED1 CT ION
UPPER UNCERTAINTY LIMIT / --- --- LOWER UNCERTAINTY LIMIT
200 400 600 800 1000 1200 r Pm
Figure 18.- Mass-on-string (pulley version) torque output.
1400
66

2
E z
U z
TORSION STRAP CONTROLLER TORQUE OUTPUT AS A FUNCTION OF RPM
89" STRAP PRETWIST
/ 0
/
0 0 A EXPERIMENT
ANALYTICAL
UNCERTAINTY BOUNDS
----
-
I 0 400 800 1200
rPm
Figure 19.- T o r s i o n - s t r a p - c o n t r o l l e r t o r q u e o u t p u t (89" s t r a p p r e t w i s t ) .
67
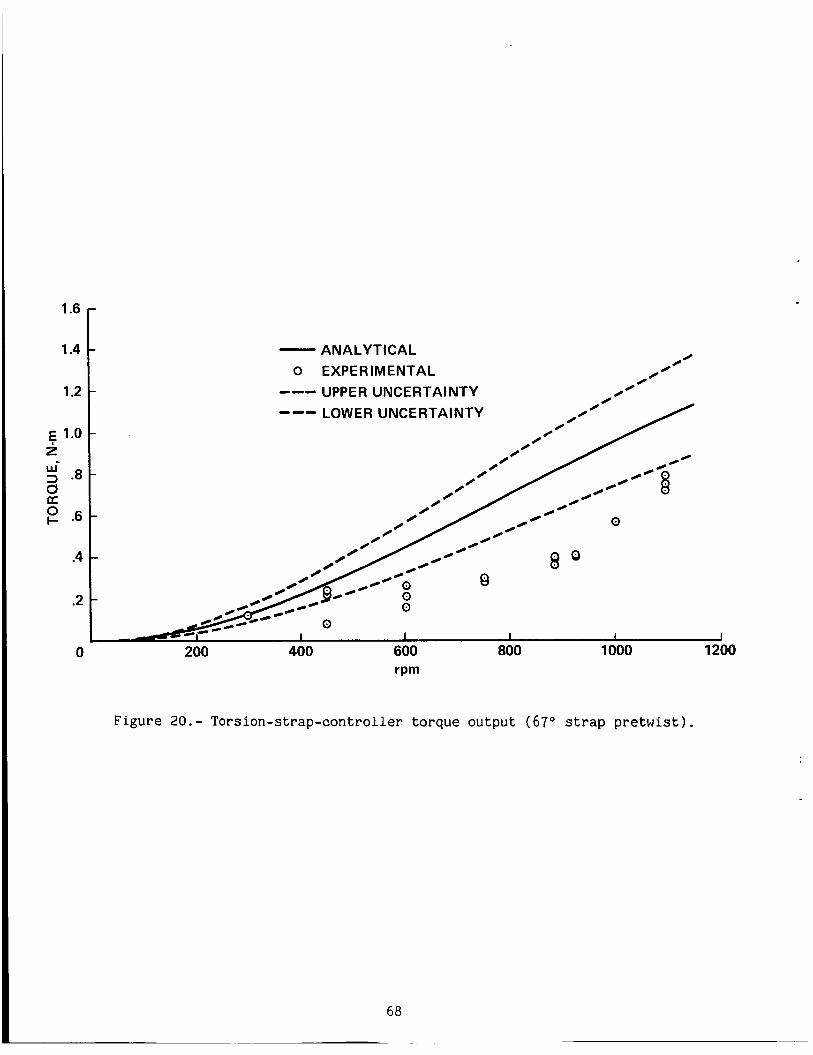
- ANALYTICAL 0 EXPERIMENTAL --- UPPER UNCERTAINTY
.--- LOWER UNCERTAINTY

1.2
w'
U a 0 I- .4
0 - --- ---
EXPERIMENTAL ANALYTICAL UPPER UNCERTAINTY LOWER UNCERTAINTY
.2 -
Y 1 0 100 200 300 400 500 600 700 800 900 1000 1100 1200
Figure 21.- TSC to rque ou tpu t (47" s t r a p p r e t w i s t ) .

.8
€ .6 2
0 EXPERIMENTAL -ANALYTICAL --- UPPER UNCERTAINTY --- LOWER UNCERTAINTY
Figure 22.- TSC t o r q u e o u t p u t (17" s t r a p p r e t w i s t ) .
70

.4
€ .3 z % .2 U K 0 I- .1
0
CURVE FIT - 0 EXPERIMENTAL DATA
-
-
-
-
1 - Y I
I 1
200 400 6y60 800 1000 1200
Figure 23.- TSC semiempirical model ( 1 7 O pretwist).
71
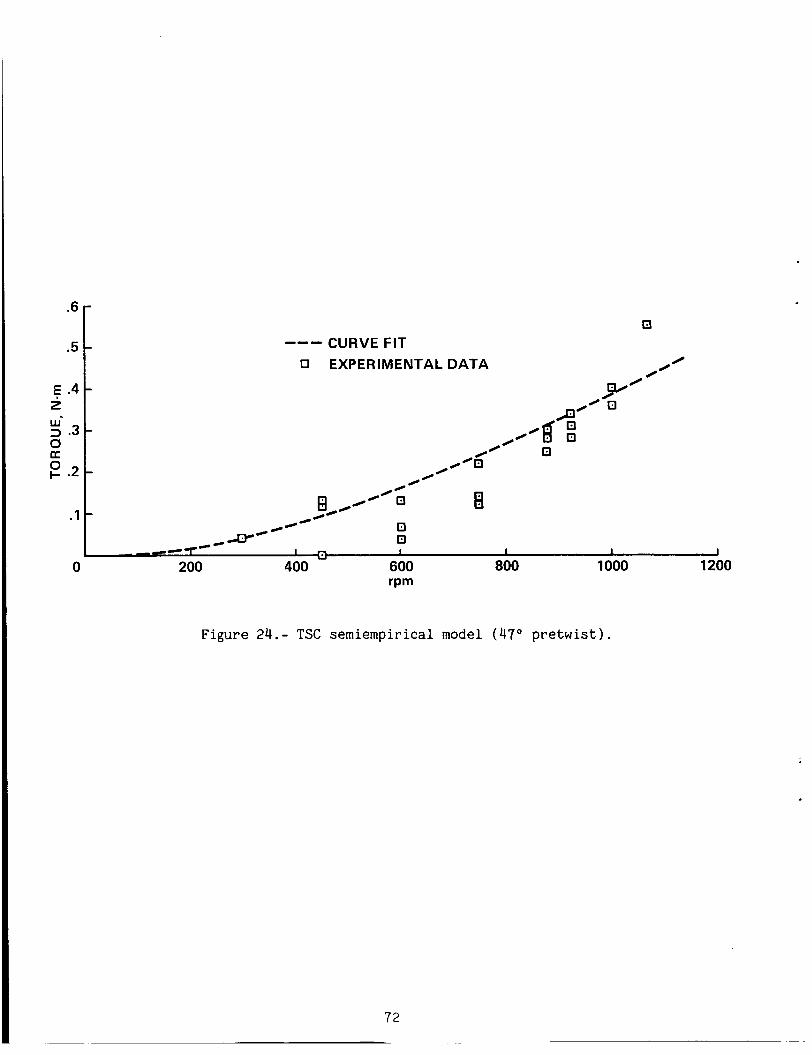
.5 .6 [I E .4 2
5 3
p .2
CY K
.1
--I CURVE FIT 0 EXPERIMENTAL DATA
-
-
-
-
I - ---
0
rPm
Figure 24.- TSC semiempirical model ( 4 7 O pretwist).
72
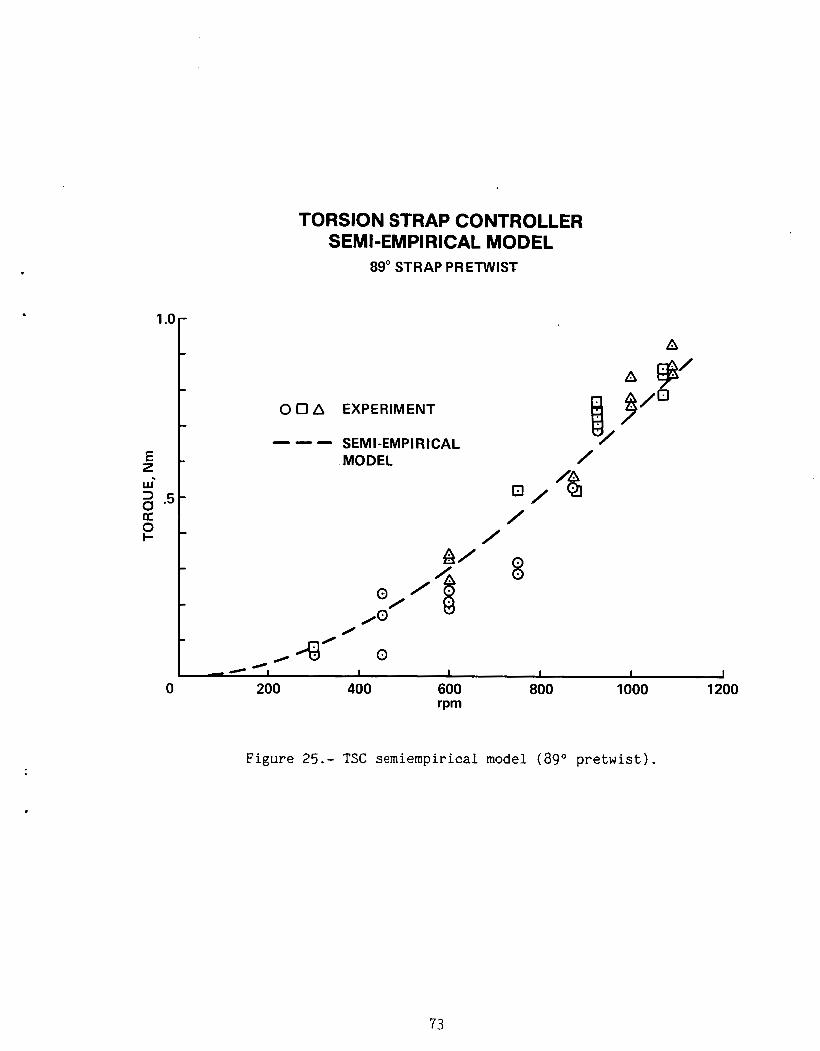
z t - a n v-
TORSION STRAP CONTROLLER SEMI-EMPIRICAL MODEL
89" STRAP PRETWIST
A
0 0 A EXPERIMENT
--- SEMI-EMPI RlCAL MODEL /
/ /
0 I I I I
200 400 600 800 1000 1200
Figure 25.- TSC semiempirical model (89" pretwist).
73
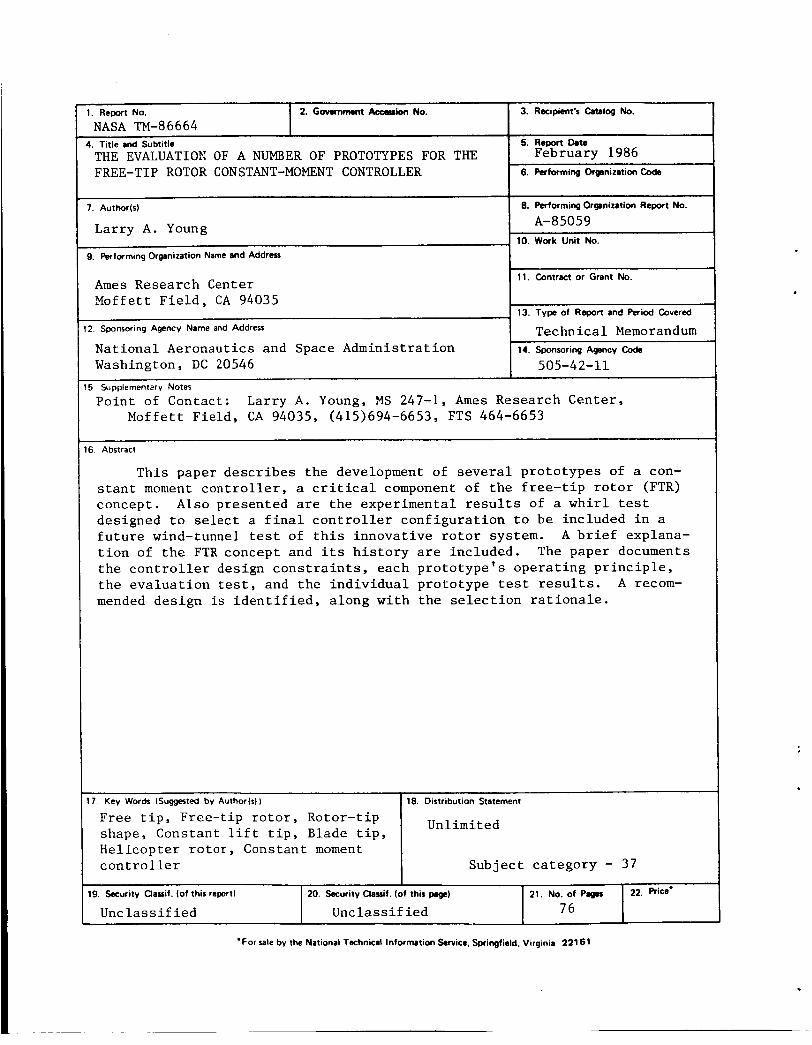
1. Report No.
NASA TM-86664 2. Government Acc#rion No. 3. Recipient's Catalog No.
r l l . Contract or Grant No. A m e s Research Center
4. Title and Subtitle THE EVALUATION OF A NUMBER OF PROTOTYPES FOR THE FREE-TIP ROTOR CONSTANT-MOMENT CONTROLLER
5. Report Date
6. Performing Organization Code
February 1986
7. Author(s)
Larry A. Young ,
9. Performing Organization Name and Address
.
8. Performing Orgrnization Report No.
A- 8 505 9 10. Work Unit No.
Moffet t F i e l d , CA 94035
2 Sponsoring Agency Name and Address
Nat iona l Aeronautics and Space Adminis t ra t ion Washington , DC 20546
13. Type of Report and Period Covered
T e c hn ica 1 Memorandum
505-42-11 14. Sponsoring Agency Code
17. Key Words (Suggested by AuthorWI
Free t i p , Free- t ip r o t o r , Rotor- t ip shape, Constant l i f t t i p , Blade t i p , Hel icopter r o t o r , Constant moment c o n t r o l l e r
18. Distribution Statement
Un 1 i m i t ed
Subject ca tegory - 37
19. !Security aauif. (of this report) 20. Security Clauif. (of this pag~) 21. No. of Pages
Unclas s i f i ed Unc las s i f i ed 76 22.