Embed Size (px)
Citation preview

1
The Evolution of Emerging Economies and Equity Markets in the Bullish Period between 2003 and 2007: A Descriptive Study
Autoria: Gabriel Geller Abstract: Following the 2008 credit crunch, the fact that the G20 (group of rich and emerging economies) instead of the G8 (group of the 7 most powerful rich economies plus Russia) was chosen as the forum for discussion and proposition of solutions regarding world’s financial markets represents the consolidation of emerging economies as central players in the new 21st century world governance. Although this can be considered an important historical fact, the rise of emerging economies has been noticed much before in the economic world and academia (see for instance Demirguç-Kunt and Levine, 1996). To understand how stock markets have evolved in a certain period of time is particularly important given the impact financial markets have on economic growth. Studies relating financial markets to economic growth have probably started with the work of Schumpeter (1959), followed by others like Robinson (1952) and Patrick (1966). More recent literature (i.e. Demetriades and Hussein, 1996 and Levine et al., 2000; Beck and Levine, 2004) seems to have agreed that there is a positive relation between the development and growth of financial (and stock) markets growth in a certain country/region and its economic growth, although there is no consensus regarding the causal relation between them. Using a sample of 102 countries that covers 97% of world´s GDP, 98% of its total market cap and 92% of all listed companies, this work intends to describe in quantitative terms the development of emerging economies and stock markets during the bullish period between 2003 and 2007, assessing their performance against developed markets and also comparing the various emerging regions among themselves, in an attempt to provide a better picture of the depth of the changes in the global economic scenario and to measure how different regions have been part of these changes. Data shows that from 2003 to 2007 emerging markets have presented an increase in their importance in terms of GDP (19% to 26% of the world) and stock market cap (9% to 25% of the world), while developed markets have presented a decrease in their importance (GDP from 78% to 71% and market cap from 88% to 74%). Emerging markets´ evolution is also impressive in terms of equity markets development measured by market capitalization to GDP (coming from 41% in 2003 to 110% in 2007), quickly catching up with developed countries (98% in 2003 to 122% in 2007). Regarding the number of listed companies, developed countries are still far ahead with an average of 30 companies per million inhabitants in 2007 against 4 in emerging markets, and the evolution of this variable in the period is also higher in developed countries, which might be explained by the strengthening of stock exchanges standards in several emerging regions (leading to numerous delistings) and the consolidation in some industries (through mergers and acquisitions). In addition, data show that all emerging regions have significantly developed their equity markets in the period, and in general Asia has shown even more impressive numbers while assessed against other regions.
2
1. The Emergence of the Emerging
Following the 2008 credit crunch, the fact that the G20 (group of rich and emerging economies) instead of the G8 (group of the 7 most powerful rich economies plus Russia) was chosen as the forum for discussion and proposition of solutions regarding world’s financial markets represents the consolidation of emerging economies as central players in the new 21st century world governance. Although this can be considered an important historical fact, the rise of emerging economies has been noticed much before in the economic world and academia.
For example, Demirguc-Kunt and Levine (1996) had already called attention for the increase of the participation of emerging stock markets in total world’s market cap in the period between 1985 and 1995, a trend that has been confirmed in the last decade and resisted to the Russian, the Mexican and the Asian crises of the late 1990s that were originated in the heart of emerging economies, and also to the internet bubble and the corporate governance crises of the early 2000s originated in the developed world. In 2001 the Goldman Sachs economist Jim O’Neill has coined the now famous acronym BRIC to refer to the fast-growing developing economies of Brazil, Russia, India and China, to which we could easily add countries like Mexico, Turkey, South Africa and several others. Since then, the debate around the ‘emergence of the emerging’ has taken increasing importance in the business and academic environments.
From 2003, after successive crises in the emerging world and a major corporate governance crisis in the US, until the beginning of the current credit crunch, the world has lived a bullish period of high investments and high growth. This period has helped to consolidate the importance of new emerging economies as the growth rate of some of these countries GDPs and stock markets has been significantly higher than those of developed countries, and their weight in world’s economy has become just too high to be ignored or underestimated.
To understand how stock markets have evolved in a certain period of time is particularly important given the impact financial markets have on economic growth. Studies relating financial markets to economic growth have probably started with the work of Schumpeter (1959), followed by others like Robinson (1952) and Patrick (1966). More recent literature (i.e. Demetriades and Hussein, 1996 and Levine et al., 2000; Beck and Levine, 2004) seems to have agreed that there is a positive relation between the development and growth of financial (and stock) markets growth in a certain country/region and its economic growth, although there is no consensus regarding the causal relation between them.
The most obvious channel of contagion between finance and economic growth is through the promotion of a better allocation of resources in society (Khan and Senhadji, 2000; Levine, 1999a; Bencivenga and Smith, 1991; Beck et al., 2000; Greenwood and Jovanovic, 1990). There has been extensive discussion on the academic world about whether a bank-based system or a market-based system would be optimal to perform this role (see Shleifer and Vishny 1986; Allen and Galle 1999; Levine 2002), but this debate seems now to be outdated as several studies claim that banks and the market play complementary roles in financial systems (LLSV, 1997, 2000; Levine, 1997) and argue that the level of investor protection is the more relevant issue in this discussion. Empirical work has demonstrated that stock markets are better developed in countries with better investor protection (LLSV, 1997;

3
Djankov et. al., 2008). There are also reasons to believe that where better investor protection mechanisms are in place equity markets are more closely related to growth, as they can more efficiently perform the role of smart allocation of resources in society.
Having in mind the increasing importance of emerging markets and relevance of understanding how markets have evolved recently, the present work describes the development of emerging economies and stock markets during the bullish period between 2003 and 2007, assessing their performance against developed markets and also comparing the various emerging regions among themselves, in an attempt to provide a better picture of the depth of the changes in the global economic scenario and to measure how different regions have been part of these changes.
2. Methodology & Data
This research is based on a descriptive analysis of the evolution of emerging equity markets using the following measures: GDP and population as a proportion of world´s figures, GDP growth, market capitalization to GDP and as a proportion of world’s market cap, companies listed per million inhabitants and companies listed as a proportion of total companies listed in the world. A comparison will be made between emerging and developed countries in the whole sample, between a selected ‘Emerging G7’ (most important emerging markets by market cap in 2007) and the 7 most important developed markets (the G7), and finally the emerging markets will also be compared among themselves considering 5 different regions: Africa, Latin America and Caribbean, Middle East, Central and Eastern Europe and Asia, considering the 5 most important markets by market cap in 2007 in each region.
The economic data were collected from different sources according to availability. Notably the International Monetary Fund, the World Bank and the CIA World Factbook were used as sources of data (a complete list of variables and respective sources can be found in Table 2). The sample used in the present study contains data of 72 emerging economies from 5 different regions (Africa - 15, Asia - 16, Central and Eastern Europe - 15, Latin America and Caribbean - 18, Middle East – 8) as well as 30 developed economies. The distinction between emerging and developed markets followed the International Monetary Fund classification, and the different emerging regions were also classified according to the IMF criteria, although countries originally classified by the IMF as ‘Commonwealth of Independent States’ were re-classified here as being part either of Central and Eastern Europe or Asia, depending on their cultural and historical identification and also geographic location.
TABLE 1 – THE SAMPLE
EMERGING REGION COUNTRIES IN THE SAMPLE
AFRICA Botswana*, Cote D’Ivoire*, Egypt, Ghana, Kenya, Mauritius*, Morroco, Namibia*, Nigeria, South Africa, Swaziland*, Tanzania*, Tunisia, Zambia*, Zimbabwe
ASIA Bangladesh*, China, Fiji*, India, Indonesia, Kazakhstan, Kyrgyzstan*, Malaysia, Mongolia**, Nepal***, Pakistan, Papua New Guinea*, Philippines, Sri Lanka, Thailand, Vietnam*
CENTRAL AND EASTERN Armenia*, Bulgaria, Croatia, Czech Republic, Estonia*, Georgia*,

4
EUROPE Hungary, Latvia, Lithuania, Macedonia*, Poland, Romania, Russia, Turkey, Ukraine
LATIN AMERICA AND CARIBBEAN
Argentina, Barbados**, Bolivia, Brazil, Chile, Colombia, Costa Rica*, Ecuador, El Salvador, Guyana*, Jamaica, Mexico, Panama, Peru, Trinidad and Tobago*, Uruguay, Venezuela
MIDDLE EAST Bahrain*, Iran*, Jordan, Kuwait*, Lebanon*, Oman*, Qatar*, Saudi Arabia*, United Arab Emirates*
DEVELOPED
Australia, Austria, Belgium, Canada, Cyprus*, Denmark, Finland, France, Germany, Greece, Hong Kong, Iceland, Ireland, Israel, Italy, Japan, South Korea, Luxembourg, Malta*, Netherlands, New Zealand, Norway, Portugal, Singapore, Slovak Republic, Slovenia*, Spain, Sweden, Switzerland, United Kingdom, United States
* Countries missing the variable ‘anti-self-dealing index’ ** Countries missing the variable ‘anti-self-dealing index’ and ‘investment to GDP’; *** Countries missing the variable ‘anti-self-dealing index’ and ‘investment to GDP’ and ‘credit to the private sector/GDP’;
There were some missing data as observed in Table 1: 2 countries (Barbados and Mongolia) have missing data on both anti-self-dealing index and investment as a proportion of GDP, while 1 country (Nepal) has missing data on anti-self-dealing index, investment as a proportion of GDP and credit to the private sector to GDP. In total, for all analyses that use anti-self-dealing index the sample is reduced to 43 emerging countries and 27 developed countries as this index is only available for those countries. Table 2 shows de description of each variable used in the main database and their respective sources where applicable.
TABLE 2 – DESCRIPTION OF VARIABLES
VARIABLE DESCRIPTION
COUNTRY Name of the country
CODE Code of the country expressed in 3 letters (i.e.: Botswana = BWA)
REGION Code of the Emerging region to which the country belongs. Africa = AFR, Asia = ASI, Central and Eastern Europe = CEE, Latin America and Caribbean = LAC, Middle East = ME, Developed Countries = DEV.
YEAR Year to which the data in that row refers to MARKET CAPITALIZATION OF LISTED COMPANIES
The sum of market value of all domestic listed companies expressed in US$ Source: Kindly provided by Prof. Florencio Lopez-de-Silanes
TOTAL LISTED COMPANIES
Total number of domestic listed companies Source: Kindly provided by Prof. Florencio Lopez-de-Silanes
GDP Gross Domestic Product of the country expressed in current US$ billion Source: International Monetary Fund
REAL GDP GROWTH Real Growth of the Gross Domestic Product of that Country in the referred year in relation to the previous year (nominal growth discounted for inflation). Source: International Monetary Fund
GDP PER CAPITA Gross Domestic Product per inhabitant expressed in current US$, used as a measure of the level of household income in that country Source: International Monetary Fund
POPULATION Total population, expressed in million inhabitants Source: International Monetary Fund
MARKET CAP/COMPANIES
Variable ‘Market Capitalization of Listed Companies’ divided by the variable ‘total listed companies’, used to measure the average size of a

5
domestic listed company
MARKET CAP/GDP Variable ‘Market Capitalization of Listed Companies’ divided by the variable ‘GDP’, used as a comparative measure of the development of equity markets in each country
LISTED COMPANIES/POPULATION
Variable ‘Total listed companies’ divided by the variable ‘Population’, indicating the number of listed companies per million inhabitant, as an alternative measure of the development of equity markets.
ANTI-SELF-DEALING INDEX
Reflects the Djankov et al. (2008) anti-self-dealing index attributed to the country. Used here as a measure of legal protection to equity investors.
The database relied on different sources given that the priority was to find data available for free. Although it would be better to have all or most of the data provided by the same source, this was not possible given that no private database provider agreed on providing data for free for this study. The timeline considered was from 2003 to 2007, and the choice of the time interval was made given the latest bullish business cycle when emerging markets came to the centre of the scene so economic news throughout this period lead us to believe that the ´big jump´ has occurred during this period.
Regarding the timeline of data, there was also a small issue of missing data for 5 countries: Fiji, Guyana, Uruguay and Vietnam have some ‘growth’ data missing for 2003, as there was no complete data available from 2002; data from 2007 is missing for Uganda, Venezuela, Papua New Guinea and Tanzania, and data from 2003 and 2004 is missing for Qatar.
TABLE 3 – SAMPLE COVERAGE
GDP Population Mkt Cap Listed C.
Emerging 26,3% 70,8% 24,8% 34,3%
Developed 70,5% 14,4% 73,9% 58,1%
Total 96,8% 85,2% 98,7% 92,4%
Full sample coverage (% of the World in 2007)
The full sample of 102 countries used in this study covers (as for 2007) 96.8% of world´s GDP, 85.2% of its population, 98.7% of world’s market cap and 92.4% of world’s listed companies. Table 3 illustrates the sample coverage and distinguishes between emerging and developed countries.
3. Empirical Results
The analysis of the recent evolution of equity markets is better illustrated while compared to a benchmark, so the in this study emerging market figures are compared to the developed world figures in absolute values and specially as a proportion to the whole world figures.
Table 4 describes data for the full sample of 102 countries separated between emerging and developed according to IMF criteria. GDP and Market Cap figures are nominal figures, so their change in the period can be more clearly understood while analyzed relative to the world. Charts 1 and 2 help us to visualize the evolution of emerging equity markets in the period.

6
TABLE 4 – FULL SAMPLE STATISTICS EMERGING X DEVELOPED
2003 2007 Change 2003 2007 Change
GDP ($ billion) 7200 14518 101.6% 29167 38984 33.7%
GDP (% World) 19% 26% 7.0 78% 71% -7.7
Population (million) 4526 4737 4.7% 942 966 2.6%
Population (% World) 72% 71% -1.1 15% 14% -0.5
Market Cap ($ Billion) 2949 16027 443.4% 28675 47699 66.3%
Market Cap (% World) 9% 25% 15.8 88% 74% -14.3
Listed Companies 17108 17132 0.1% 27364 28985 5.9%
Listed Companies (% World) 33.7% 34.3% 0.7 53.8% 58.1% 4.2
Market Cap/GDP 41.0% 110.4% 69.4 98.3% 122.4% 24.0
Listed Companies/Million Inhab. 3.78 3.62 -4.3% 29.06 30.00 3.2%
Investor Protection 0.42 0.42 0.51 0.51
Real GDP Avg. Growth 5.97% 3.46%
Full Sample Statistics
Emerging (Full Sample) Developed (Full Sample)
* Changes in percentage figures are expressed in percentage points.
Some interesting points can be drawn from these data: Market cap to GDP in emerging economies went up from 41% in 2003 to 110% in 2007 (a 69 percentage points growth), while it went up from 98.3% to 122.4% in developed economies (‘only’ 24 percentage points growth). In the same line, the emerging markets’ proportion of total global market cap went up from around 9% to around 25%, while in developed economies it went down from 88% to 74%.
This new proportion reflects more accurately their participation in global GDP. In 2003 emerging markets (our sample) represented 20% of global GDP but only 9% of market cap, and in 2007 they represented 26% of world’s GDP and 25% of its market cap. These numbers are even more impressive if we consider that in 1985 emerging economies represented less than 4% of world’s market cap (see Demirguc-Kunt and Levine, 1996). The information above indicates that between 2003 and 2007 there has been a very quick catch-up period in emerging stock markets in relation to the developed world.
CHARTS 1 & 2– MARKET CAP AND MARKET CAP TO GDP
Market Cap to GDP (full sample)
0%
20%
40%
60%
80%
100%
120%
140%
2003 2007
Emerging Developed
Market Cap (% World)
0%
20%
40%
60%
80%
100%
2003 2007
Emerging Developed

7
It can also be observed that the figures for listed companies have not changed much in the period, and while analyzed in relation to population developed economies have a huge advantage. This gap between emerging and developed countries is observed in all measurements related to population (as for example GDP per capita or market cap per capita). Although the IPO movement has been high in emerging economies during the period studied, the overall evolution of the number of listed companies was negatively affected by various compulsory ‘delisting’ in an effort to improve standards (as in the cases of Egypt and India for instance), as well as by mergers and acquisitions. The gap in terms of GDP per capita is decreasing as we can observe that the population in relation to world’s population remained stable both for emerging and developed economies in the sample (around 70% and 15% respectively), while GDP proportion has changed as previously observed.
In addition, important information is that the average yearly real GDP growth between 2003 and 2007 for countries considered as ‘emerging’ was around 6%, compared to 3.5% observed in developed economies. This further reinforces the idea that equity markets depth is linked to economic growth, although it doesn’t mean much for causality analysis.
TABLE 5 – E7 X G7
2003 2007 Change 2003 2007 Change
GDP ($ billion) 4280 8803 105.7% 23689 30464 28.6%
GDP (% World) 11.5% 15.9% 4.5 63.5% 55.1% -8.4
Population (million) 2889 3003 4.0% 710 726 2.3%
Population (% World) 45.9% 44.9% -1.0 11.3% 10.9% -0.4
Market Cap ($ Billion) 1973 12665 541.9% 23711 36395 53.5%
Market Cap (% World) 6.1% 19.6% 13.5 73% 56% -16.5
Listed Companies 8176 7845 -4.0% 16189 17109 5.7%
Listed Companeis (% World) 16.1% 15.7% -2.3% 31.9% 34.3% 7.6%
Market Cap/GDP 46.1% 143.9% 97.8 100.1% 119.5% 19.4
Listed Companies/Million Inhab. 2.83 2.61 -7.7% 22.81 23.56 3.3%
Investor Protection 0.52 0.52 0.54 0.54
Real GDP Avg. Growth 6.29% 2.12%
E7 X G7 Statistics
E7 G7
* Changes in percentage figures are expressed in percentage points.
Table 5 compares a group of the most important emerging countries according to market cap in 2007, here called the ´E7´ (China, Brazil, India, Mexico, Russia, Saudi Arabia and South Africa) and the developed countries members of the G7 group (Canada, France, Germany, Italy, Japan, United Kingdom and United States). Together, these 2 groups represent more than 75% of world’s market cap and more than 70% of its GDP.
Once more, it is observed a quick ‘emergence’ of emerging economies and a relative loss of power of developed economies in terms of GDP and stock market capitalization. The E7 represented in 2007 20% of global market cap against only 7% in 2003, while the G7 has decreased its proportion from 73% to 56% in the same period. In relation to GDP as a percentage of global GDP, although the gap is also still large (55% for the G7 against 16% for the E7), it has significantly decreased (in 2003 it was 63.5% against 11.5%).

8
CHART 3 & 4 – MARKET CAP (% WORLD) E7 X G7 AND MARKET CAP TO GDP E7 X G7
A very interesting feature in this E7 X G7 comparison (shown in chart 4) is the fact that the market cap to GDP relation for the E7 emerging economies has overtaken that of G7 developed economies. South Africa, China and India all with levels above 150% market cap to GDP, together with Brazil, Russia and Saudi Arabia (all above 100%) drive these figures up. This movement shows the increase in investors’ confidence in emerging markets during the period and particularly reflects the growth opportunities that investors see in these regions.
In terms of investor protection, it can be observed that the gap between the average investor protection index in developed and emerging economies is higher while considering the full sample (0.51 for developed against 0.42 for emerging) in comparison to the E7 X G7 assessment (0.54 against 0.52 respectively), which indicates that de most relevant emerging markets are not far from developed economies in terms of investor protection, and also that they are a level above most of their emerging peers in this field. In this sense, Brazil (0.29) and Mexico (0.18) are the disappointing cases, with Russia (0.48) in the middle and China (0.78), India (0.68) and South Africa (0.85) leading the figures. No data was available for Saudi Arabia regarding this indicator.

9
TABLE 6 – G5 EMERGING REGIONS – SUMMARY DATA
2003 2007 Change 2003 2007 Change 2003 2007 Change 2003 2007 Change 2003 2007 Change
GDP ($ billion) 380 683 80,0% 2702 5350 98,0% 1093 2685 145,7% 1515 2891 90,7% 496 976 96,9%
GDP (% World) 1,0% 1,2% 0,2 7,2% 9,7% 2,4 2,9% 4,9% 1,9 4,1% 5,2% 1,2 1,3% 1,8% 0,4
Population (million) 187 200 6,9% 2699 2812 4,2% 307 306 -0,3% 360 379 5,2% 100 109 9,7%
Population (% World) 3,0% 3,0% 0,0 42,9% 42,0% -0,9 4,9% 4,6% -0,3 5,7% 5,7% -0,1 1,6% 1,6% 0,0
Market Cap ($ Billion) 322 1148 256,9% 1305 8779 572,9% 358 2182 509,0% 498 2174 336,2% 292 1015 246,9%
Market Cap (% World) 1,0% 1,8% 0,8 4,0% 13,6% 9,6 1,1% 3,4% 2,3 1,5% 3,4% 1,8 0,9% 1,6% 0,7
Listed Companies 1697 1194 -29,6% 8591 8125 -5,4% 913 1283 40,5% 1070 1102 3,0% 728 956 31,3%
Listed Companeis (% World) 3,3% 2,4% -0,9 16,9% 16,7% -0,3 1,8% 2,6% 0,8 2,1% 2,2% 0,1 1,4% 1,9% 0,5
Market Cap/GDP 84,7% 168,0% 83,3 48,3% 164,1% 115,8 32,8% 81,3% 48,5 32,9% 75,2% 42,3 59,0% 103,9% 44,9
Listed Companies/Million Inhab. 9,1 6,0 -34,2% 3,2 3,0 -7,2% 3,0 4,2 41,0% 3,0 2,9 -2,1% 7,3 8,7 19,7%
Investor Protection 0,52 0,52 0,76 0,76 0,33 0,33 0,39 0,39 0,16 0,16
Real GDP Avg. Growth* 5,57% 7,35% 6,55% 5,54% 7,30%
G5 AFRICA: EGYPT, KENYA, MORROCO, NIGERIA, SOUTH AFRICA
G5 ASIA: CHINA, INDIA, INDONESIA, MALAYSIA, THAILAND
G5 CENTRAL AND EASTERN EUROPE: CZECH REP., POLAND, RUSSIA, TURKEY, UKRAINE
G5 LATIN AMERICA AND CARIBBEAN: ARGENTINA, BRAZIL, CHILE, MEXICO PERU
G5 MIDDLE EAST: IRAN, JORDAN, KWAIT, SAUDI ARABIA, UNITED ARAB EMIRATES
* Computed as the average of the average GDP growths of the countries in the region, and not as a real GDP growth of the region
G5 EMERGING REGIONS - SUMMARY DATA
AFRICA ASIA CENTRAL AND EAST EUR LATIN AM. AND CARIBBEAN MIDDLE EAST
Focusing now on the cross-regional comparison between emerging markets, table 6 shows the summary data for each emerging region. The criteria used to define the members of each region’s G5 was the absolute value of market cap in 2007, but few exceptions were made and will be commented and justified while talking about each region individually. Before comparing the 5 emerging regions among themselves, it is necessary to make some comments concerning each region individually.
Regarding the G5 Africa, Zimbabwe was among the top 5 market caps in the region in 2003, but it has lost its place to Kenya already in 2004 due to a big economic downturn. Its average GDP real growth from 2003 to 2007 was -6%, with a negative peak of -10.4% in 2003. Absolute and relative indicators of GDP and Market cap have grown in the region, although indicators for listed companies have decreased. The indicator of market cap in relation to GDP is boosted by the incredible numbers of South Africa that represented 73% of market cap in this G5 by 2007 (although coming down from more than 80% in 2003) and had 294% market cap/GDP ratio in 2007, while the lowest market cap to GDP level was observed in Kenya (around 50% in 2007). South Africa has also the highest Investor Protection index in this G5 (0.81). The average real GDP growth of Nigeria for the period was the highest in this group (7.8%). Number of listed domestic companies has decreased sharply in Egypt (from 967 in 2003 to 435 in 2007) due to delisting companies following an effort to increase standards.
Absolute and relative indicators of GDP and Market cap have also grown in Asia, while the absolute number of listed companies has decreased from 2003 to 2004 but later increased. This decrease in total number of companies from 2003 to 2004 listed reflects the more than 900 companies that were compulsorily delisted from Bombay Stock Exchange for not abiding by the listing rules. In Asia, China dominates the figures representing 70% of market cap and 63% of GDP in 2007. China has also presented the highest average GDP growth in the group (11%). The highest investor protection index is in Malaysia (0.95), which traditionally has also presented the highest market cap/GDP ratio (174.4% in 2007 and average of 150% in the period) until it was overtaken by China in (184.1% but average of 77%). The high growth in market cap to GDP in this region (164% in 2007) is mainly pushed by China and India.

10
Another interesting feature is that Indonesia has overtaken Thailand as the 4th largest market cap in this region in 2007.
In Central and Eastern Europe, it is particularly interesting to observe the case of Ukraine that has climbed the ranks of market cap in the region, coming from the 8th position in 2003 to 5th in 2006 and 4th in 2007. Hungary has been part of the top 5 until 2005, losing ground to Ukraine in that year. Czech Republic was 4th until 2006, losing the position to Ukraine in 2007. It can be observed in this region that absolute and relative indicators of GDP and Market cap have grown, as well as the absolute number of listed companies. Russia leads the figures representing 48% of GDP and 69% of Market cap in 2007 (both proportions have increased in relation to 2003). The highest average real GDP growth is observed in Ukraine (7.9%), and the only country with a market cap to GDP ratio above 100% in 2007 is Russia (116%) which also bears the most relevant evolution in this indicator during the period. Furthermore, Russia also presents the highest investor protection level in this region (0.48).
Regarding the Latin America and Caribbean region, a first important note is that Argentina was among the top 5 market caps in the region from 2003 to 2006, but lost its place to Colombia in 2007. In fact, Colombia, Peru and Argentina have close absolute levels of market cap, although Argentina has been losing ground in the latest years. This study has kept Argentina in the regional G5 due to its economic importance and the tight difference between itself and Colombia in terms of market cap as for 2007. Latin America and Caribbean absolute figures show growth in absolute and relative measures of GDP and market cap, and also growth in listed companies (although the relative measure listed companies/population has decreased). Brazil had the largest GDP (63%) and Market Cap (47%) of this regional G5 in 2007, and has seen this proportional figures grow in the period. The highest investor protection index is in Chile (0.63) and, not surprisingly, also the highest market cap to GDP ratio (129.9% in 2007). The country that has faced the highest average real GDP growth in the period was Argentina (8.8%), although this number is influenced by the recovery of the country’s debt default in early 2000s. Peruvian GDP came second growing 6.5% in average. The most impressive growths in market cap to GDP figures from 2003 to 2007 were observed in Brazil and Peru.
A first note for the Middle East region is that although Qatar figures among the top 5 market caps in the region in 2007, it was not included in this descriptive analysis as complete data is not available for this country in 2003 and 2004. This region also presents evolution in absolute and relative indicators of GDP, market cap and number of listed companies. Saudi Arabia is dominant representing 50% of the group’s market cap in 2007 and 40% of its GDP (closely followed by Iran in GDP), although these relative figures are decreasing as other countries emerge. This dominance has caused a negative impact in the region’s statistics with the collapse of Saudi stock markets in 2006 (market cap to GDP dropped from more than 200% in 2005 to 91% in 2006), but a strong recovery in 2007 (market cap to GDP at 135%) hides this fact in a pure 2003-2007 comparison. Except for Iran (15.9%), all countries in this G5 had more than 100% market cap to GDP ratio as for 2007, with Jordan leading with 250% and Jordan together with UAE showing the most impressive evolutions in this figure. UAE also presents the highest real GDP growth average in the period (9.1%). Investor protection index is only available for Jordan (0.16).
11
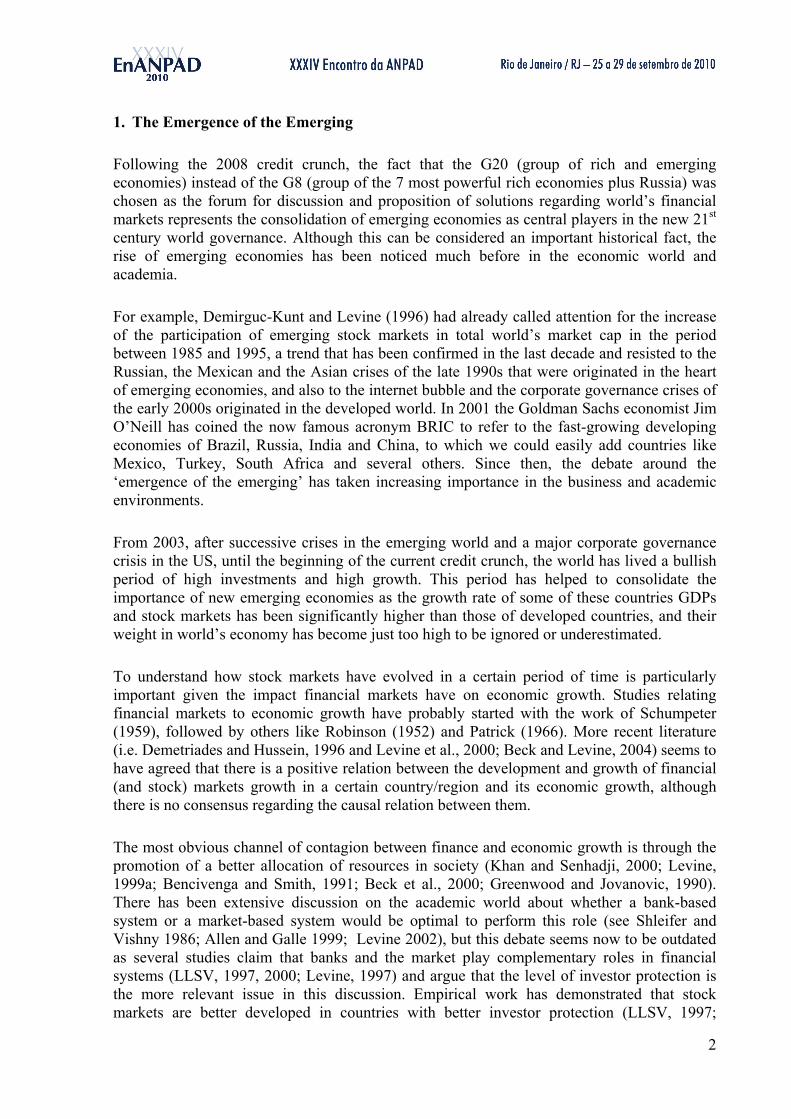
To initiate the comparison between these ‘regional G5s’, it is relevant to look at their importance to the world’s economy in terms of GDP and the evolution in the period of this study.
CHARTS 5 & 6 – EMERGING REGIONAL ‘G5s’ GDP (% WORLD) & AVERAGE COUNTRIES’ REAL GDP GROWTH
0,0%
5,0%
10,0%
15,0%
20,0%
25,0%
2003 2004 2005 2006 2007
GDP (% World)
AFRICA ASIA LCA MIDDLE EAST CEE
5,6%
7,4%
5,5%
7,3%6,6%
0,0%1,0%2,0%3,0%4,0%5,0%6,0%7,0%8,0%
AFRICA ASIA LAC ME CEE
Average Countries' GDP Real Growth
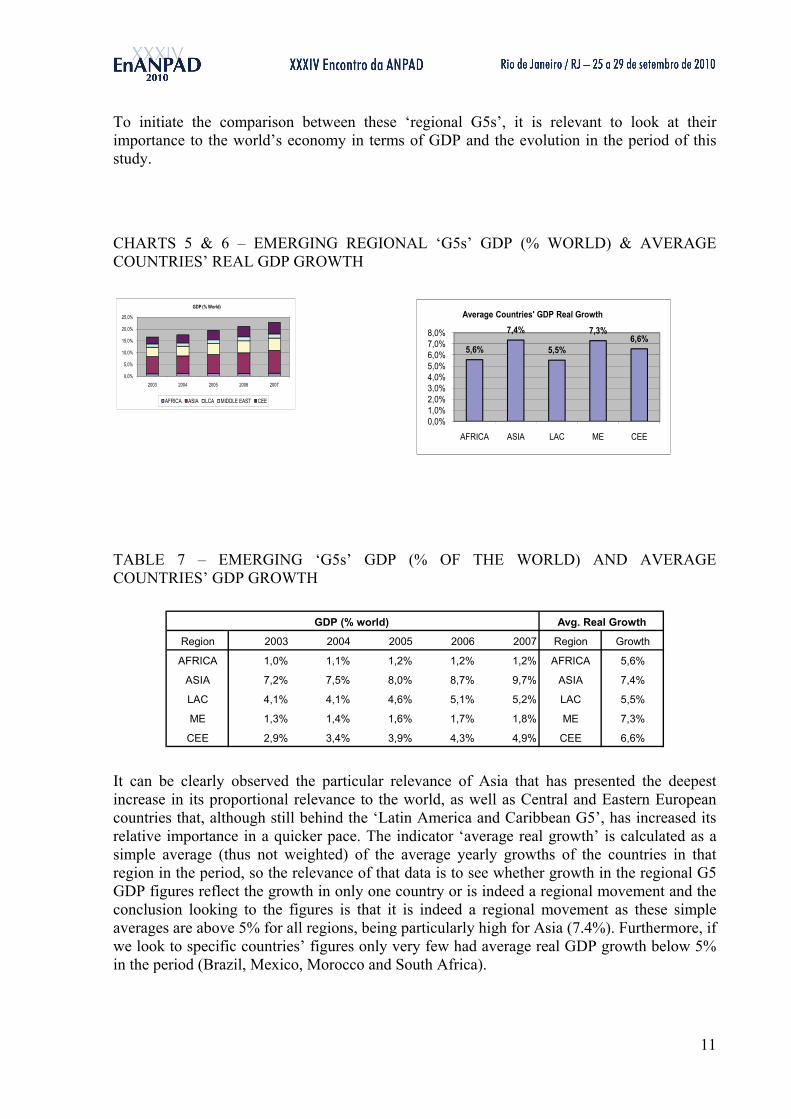
TABLE 7 – EMERGING ‘G5s’ GDP (% OF THE WORLD) AND AVERAGE COUNTRIES’ GDP GROWTH
Region 2003 2004 2005 2006 2007 Region Growth
AFRICA 1,0% 1,1% 1,2% 1,2% 1,2% AFRICA 5,6%
ASIA 7,2% 7,5% 8,0% 8,7% 9,7% ASIA 7,4%
LAC 4,1% 4,1% 4,6% 5,1% 5,2% LAC 5,5%
ME 1,3% 1,4% 1,6% 1,7% 1,8% ME 7,3%
CEE 2,9% 3,4% 3,9% 4,3% 4,9% CEE 6,6%
GDP (% world) Avg. Real Growth
It can be clearly observed the particular relevance of Asia that has presented the deepest increase in its proportional relevance to the world, as well as Central and Eastern European countries that, although still behind the ‘Latin America and Caribbean G5’, has increased its relative importance in a quicker pace. The indicator ‘average real growth’ is calculated as a simple average (thus not weighted) of the average yearly growths of the countries in that region in the period, so the relevance of that data is to see whether growth in the regional G5 GDP figures reflect the growth in only one country or is indeed a regional movement and the conclusion looking to the figures is that it is indeed a regional movement as these simple averages are above 5% for all regions, being particularly high for Asia (7.4%). Furthermore, if we look to specific countries’ figures only very few had average real GDP growth below 5% in the period (Brazil, Mexico, Morocco and South Africa).

12
CHART 7 – EMERGING REGIONAL ‘G5s’ MARKET CAP (% WORLD)
0,0%
5,0%
10,0%
15,0%
20,0%
25,0%
2003 2004 2005 2006 2007
Market Cap (% World)
AFRICA ASIA LAC MIDDLE EAST CEE
TABLE 8 – EMERGING ‘G5s’ MARKET CAP (% OF THE WORLD)
Region Inv. Prot 2003 2004 2005 2006 2007
AFRICA 0,52 1,0% 1,4% 1,6% 1,7% 1,8%
ASIA 0,76 4,0% 3,7% 4,0% 7,0% 13,6%
LAC 0,39 1,5% 1,8% 2,2% 2,6% 3,4%
MIDDLE EAST - 0,9% 1,4% 2,5% 1,2% 1,6%
CEE 0,33 1,1% 1,3% 2,0% 2,7% 3,4%
Mkt Cap (% World) - G5 Emerging Regions
The regional G5 comparison of market cap as a proportion of world’s market cap highlights some important facts. The first is the disproportional weight of G5 Asia in relation to other stock markets, and particularly its incredible boom in 2006 and 2007, representing now 13.6% of global market cap mainly due to Indian and Chinese contributions. It is worth to notice that G5 Asia has also the highest level of investor protection. In relative terms, G5 Central and Eastern Europe, as well as G5 Asia have tripled their proportion of global market cap while Latin America and Caribbean has more than doubled its proportion, leaving G5 Africa and G5 Middle East a bit behind as they less than doubled their proportional participation. These figures however have to be analyzed having in mind also the market cap to GDP ratio.
TABLE 9 – EMERGING REGIONAL ‘G5s’ MARKET CAP TO GDP

13
CHART 8 – EMERGING REGIONAL ‘G5s’ MARKET CAP TO GDP
0,0%20,0%40,0%60,0%80,0%
100,0%120,0%140,0%160,0%180,0%
2003 2004 2005 2006 2007
Market Cap to GDP
AFRICA ASIA LAC MIDDLE EAST CEE
Again, G5 Asia presents the most impressive evolution going from 48% in 2003 to 164% in 2007. Africa figures are hidden by the weight that South Africa has in these figures, as market cap to GDP 2007 excluding South Africa would be 77%, a figure only higher than G5 Latin America and Caribbean. The high correction in the Middle East figures in 2006 is due to the collapse of Saudi stock market (market cap to GDP for this country has dropped from more than 200% in 2005 to 91% in 2006).
CHARTS 9 & 10 – LISTED COMPANIES (% WORLD AND PER MILLION INHABITANTS)
0,0%
5,0%
10,0%
15,0%
20,0%
25,0%
30,0%
2003 2004 2005 2006 2007
Listed Companies (% World)
AFRICA ASIA LAC MIDDLE EAST CEE
0,0
2,0
4,0
6,0
8,0
10,0
2003 2004 2005 2006 2007
Listed Companies per million Inhabitants
AFRICA ASIA LCA MIDDLE EAST CEE
Looking now at the regional comparison of total listed companies as a % of world’s total listed companies, it is curious that although market capitalization has evolved sharply in the emerging regions during the period, the number of listed companies remained stable. This is explained by the high number of ‘delisting’ and also mergers & acquisitions in a phase of rise of stock markets standards and consolidation of industries in emerging economies, which has compensated the IPO movement. In terms of listed companies per million inhabitants, Middle East leads with 8.7 listed companies per million inhabitants and only the Middle East and Central and Eastern Europe presented a growing curve in this figure. The gap to the developed countries’ average of around 23 is astonishing although, as mentioned before, in all indicators calculated proportional to population emerging markets are very much left behind in terms of development and the gap to developed economies closes in a much slower pace than when we talk about absolute values or relative to GDP values.

14
TABLES 10 & 11 – LISTED COMPANIES (% WORLD AND PER MILLION INHABITANTS)
Region 2003 2004 2005 2006 2007 Region 2003 2004 2005 2006 2007
AFRICA 3,3% 3,0% 2,8% 2,6% 2,4% AFRICA 9,1 7,9 7,5 6,7 6,0
ASIA 16,9% 15,9% 15,7% 16,2% 16,7% ASIA 3,2 2,9 2,9 2,9 3,0
LAC 2,1% 2,1% 2,1% 2,1% 2,2% LAC 3,0 2,9 2,9 2,8 2,9
ME 1,4% 1,7% 1,8% 1,8% 1,9% ME 7,3 8,2 8,8 8,3 8,7
CEE 1,8% 1,9% 2,2% 2,3% 2,6% CEE 3,0 3,1 3,6 3,8 4,2
Listed Companies (% World) - G5 Emerging Regions Listed Companies/Million Inhabitant - G5 Emerging Regions
4. Conclusions
This paper sheds light on the development of emerging stock markets during the period between 2003 and 2007 in relation to developed economies, and also on the cross-regional comparison between emerging regions. It has been observed that during this period the world has seen a boom in emerging countries’ economies and stock markets, which is clearly represented by proportional and absolute indicators of GDP and stock market capitalization. In relation to developed economies, emerging economies have had a stronger GDP growth but an even more impressive stock markets growth, reaching levels of market capitalization to GDP very close to those of developed economies (or even higher when comparing only the biggest economies of both groups). In addition, this GDP and stock markets growth has been observed in all emerging regions in an impressive level however being stronger in Asian economies. Finally, the evolution in the number of listed companies shows that there was no significant increase in absolute or relative values related to this indicator, which was possibly caused by the strengthening of stock exchanges standards (leading to numerous delisting) and the consolidation in industries (through mergers and acquisitions).
5. Limitations and Future Research
Being a descriptive study, the first limitation that can be observed here is the lack of conclusive analyses. Although relevant data is shown and some interesting points are raised, no conclusive statements can be made in relation to the causes or the effects of the observed evolution of emerging equity markets in the period. However, it is nonetheless a relevant study as it confirms some of the lately common-sense statements about the importance of emerging regions in the new economic order and it shows that all emerging regions are involved in the process (although some more than others).
Another limitation here is the period of time of the study. This study shows quite relevant information for the period of time chosen and presents a good justification for the choice of this period of time (2003-2007) but it anyway leaves aside important information from earlier and later periods. For example, it would be certainly interesting to have data from the early or middle 1990s onwards (period when it can be said that the ´globalization´ movement has overcome the bipolar dispute between the US and the USSR) and also from the post-2008 crisis period.

15
Probably the most useful implication of this research is to raise questions and give ideas for further research on topics related to equity markets, investor protection and economic growth. Several academic and practical questions in these themes still need further research as for example the relation between stock markets and economic growth or characteristics and implications of the relation between investor protection and stock markets development. Further research could focus on those issues and the particularities of these relations in emerging and developed economies. In addition, some issues explicitly raised here can call the attention of the research community, as for instance Ukraine’s impressive stock market growth or India’s delisting movement. Furthermore, a future similar descriptive study using data from the financial crisis and post-crisis recovery could highlight interesting issues and further ‘emerging x developed’ differences.
6. References
Allen, F. and Gale, D. (1999) Comparing Financial Systems. Cambridge, MA: MIT Press.
Beck, T. Demirguç-Kunt, Asli., and R. Levine (2003). Law and Finance: Why Does Legal Origin Matter?. Journal of Comparative Economics, Vol. 31, 4, 653-675.
Beck, T. and R. Levine (2004) “Stock Markets, Banks and Growth: Panel Evidence”. Journal of Banking & Finance, 28, 3, 423-442
Bencivenga, V. R and B. D. Smith (1991). Financial Intermediation and Endogenous Growth. The Review of Economic Studies, Vol. 58, April, pp. 195-209
Demirguc-Kunt, A. and R. Levine (1996) ‘Stock Markets, Corporate Finance and Economic Growth: An Overview” World Economics Review, Vol 10, No. 2, May, 223-239.
Demetriades, P. and K. Hussein (1996) “Does financial development cause economic growth? Time-series evidence from 16 countries”. Journal of Development Economics, Vol. 51, Issue 2, December, 387-411.
Djankov, S., R. La Porta, F. Lopez-de-Silanes and A. Shleifer (2008). The Law and Economics of Self-Dealing. Journal of Financial Economics, Vol 88, 3, 430-465 Greenwood, J. and B. Jovanovic (1990). Financial Development, Growth and the Distribution of Income. Journal of Political Economy, Vol. 95, No. 2, pp. 1076-1107. Khan, Mohsin and Abdelhak S. Senhadji, (2000). Financial Development and Economic Growth: An Overview. IMF Working Paper. La Porta, R., Lopez-de-Silanes, F., Shleifer, A., Vishny, R., (1997). Legal determinants of external finance. Journal of Finance 52, 1131-1150. La Porta, Lopez-de-Silanes, Shleifer and Vishny (2000). Investor Protection and Corporate Governance. Journal of Financial Economics. 58, 3-27

16
Levine, Ross (1999a). Financial Development and Economic Growth: Where do We Stand?. Estudios de Economia, Vol. 26, No. 2, 113-36 Levine, R., N. Loayza and Thorsten Beck (2000). Financial Intermediation and Growth Causality and Causes. Journal of Monetary Economics 46, 31-77.
Levine, R. (2002). Bank-based or Market-based Financial Systems, Which is Better?. Journal of Financial Intermediation, Vol. 11, 4, 398-428.
Levine, Ross (1999b). Law, Finance and Economic Growth. Journal of Financial Intermediation, Vol. 8, No. 1-2, 8-35 Patrick, H. (1966) “Financial Development and Economic Growth in Underdeveloped Countries”. Economic Development and Cultural Change, 14,174-189. Robinson, Joan (1952) “The Generalization of the General Theory”. In her The Rate of Interest and Other Essays, London: Macmillan. Schumpeter, Joseph A. (1959) The Theory of Economic Development Cambridge, MA: Harvard University Press.