Embed Size (px)
Citation preview
The evolving political, economic and business landscape
12 March 2019
Citrus Growers Association
What we will be covering today…?
1. SA Political Outlook…
2. SA Economic Outlook…
3. How Global Business is evolving…
4. How Standard Bank is evolving…
What we will be covering today…?
2
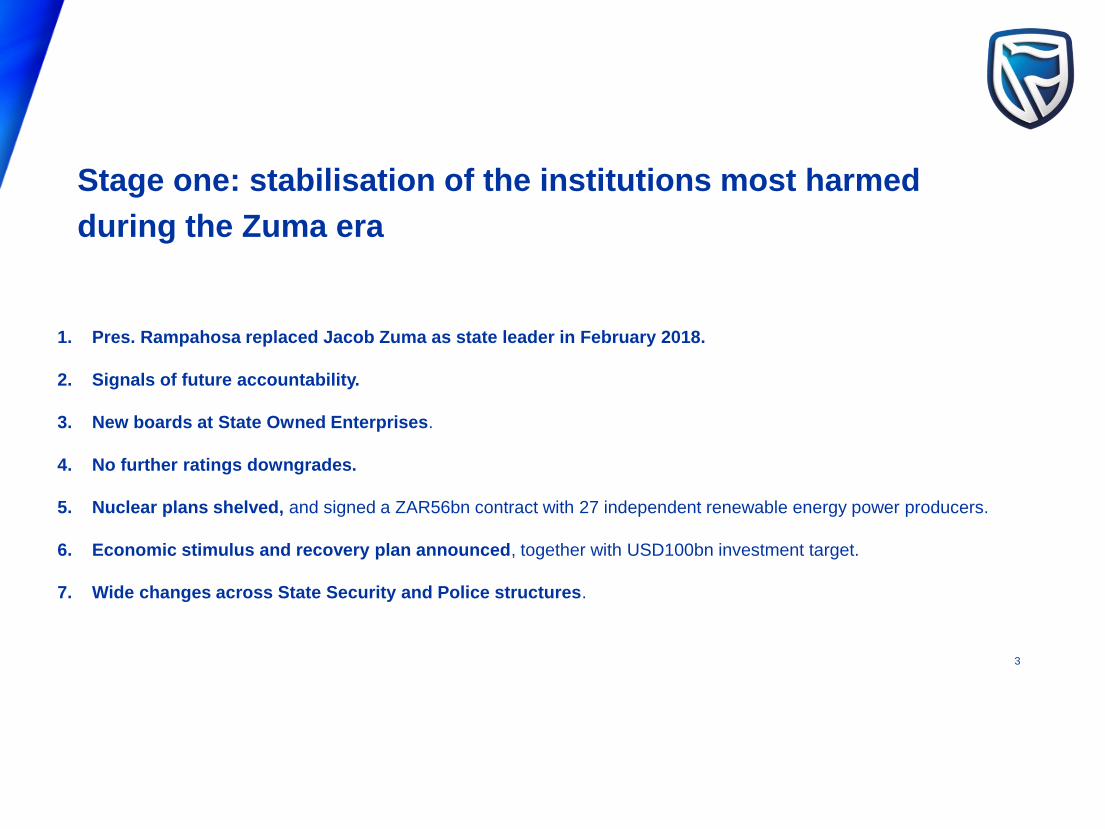
1. Pres. Rampahosa replaced Jacob Zuma as state leader in February 2018.
2. Signals of future accountability.
3. New boards at State Owned Enterprises.
4. No further ratings downgrades.
5. Nuclear plans shelved, and signed a ZAR56bn contract with 27 independent renewable energy power producers.
6. Economic stimulus and recovery plan announced, together with USD100bn investment target.
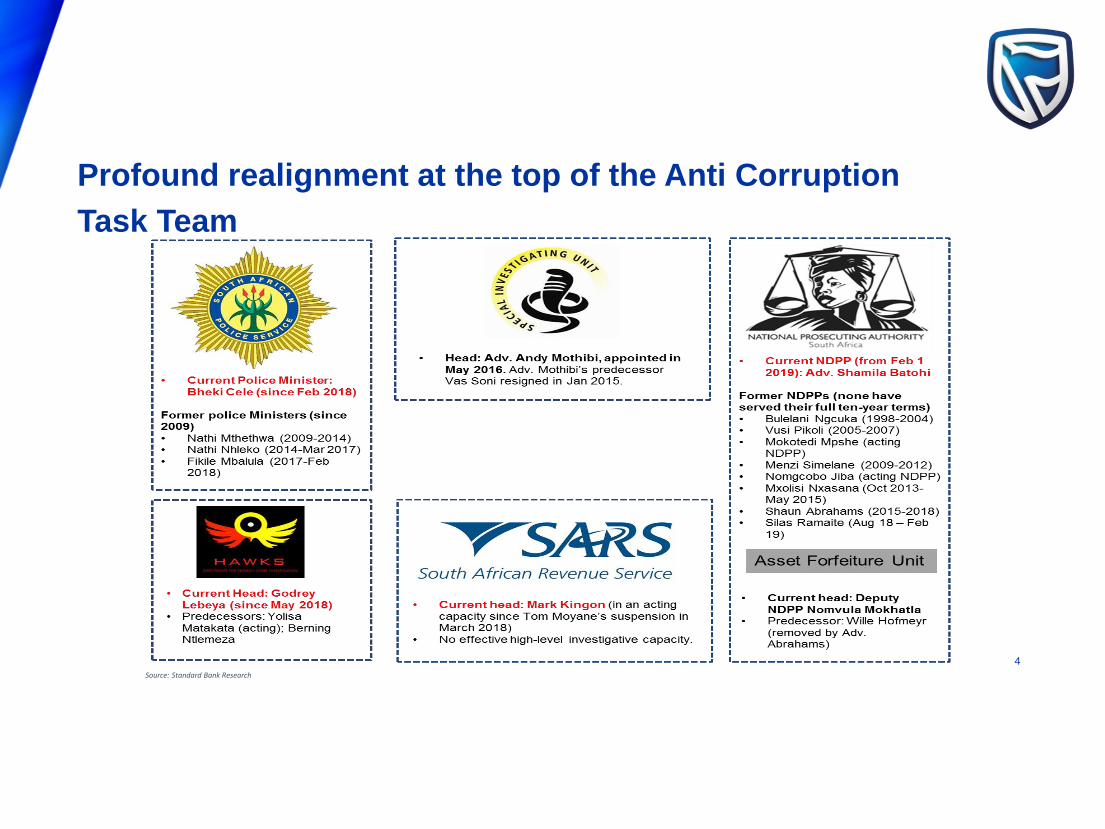
7. Wide changes across State Security and Police structures.
Stage one: stabilisation of the institutions most harmed
during the Zuma era
3
Source: Standard Bank Research
Profound realignment at the top of the Anti Corruption
Task Team
4
Percent
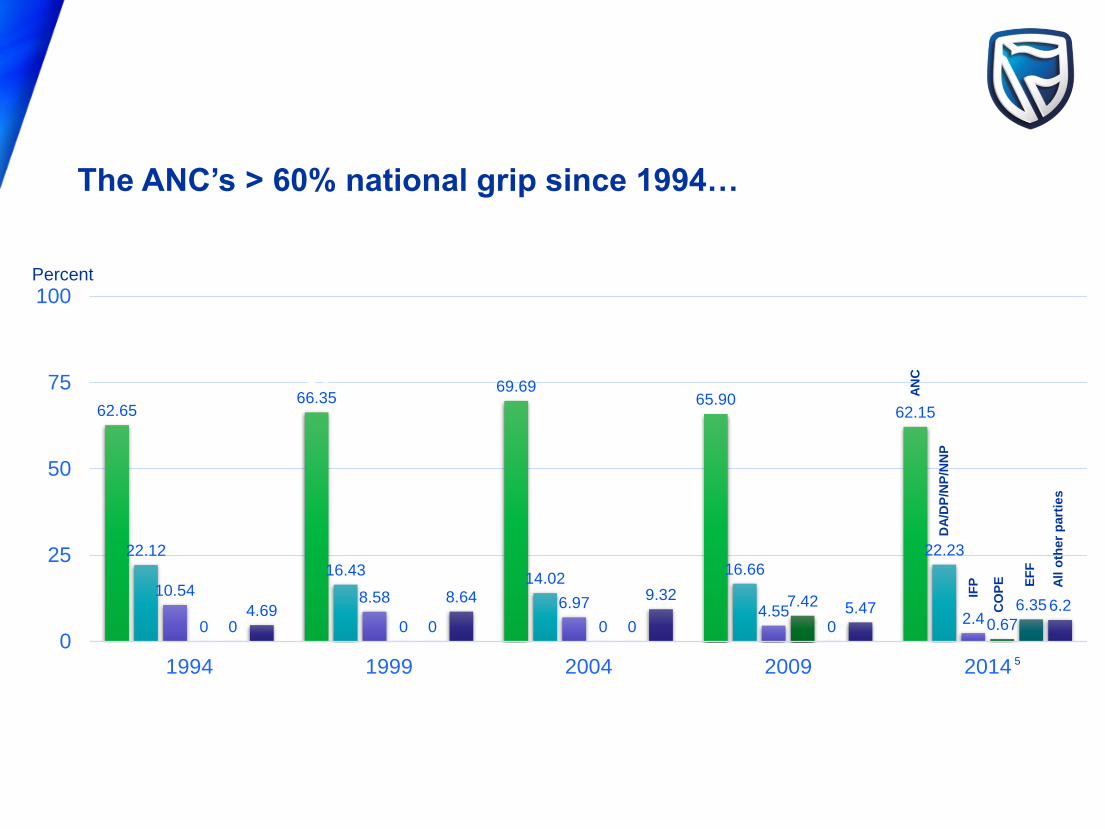
62.6566.35
69.6965.90
62.15
22.12
16.4314.02
16.66
22.23
10.54 8.58 6.974.55 2.4
0 0 0
7.42
0.670 0 0 0
6.354.698.64 9.32
5.47 6.2
0
25
50
75
100
1994 1999 2004 2009 2014
AN
C
DA
/DP
/NP
/NN
P
IFP
CO
PE EF
F
All o
ther
part
ies
The ANC’s > 60% national grip since 1994…
5
0
25
50
75
100
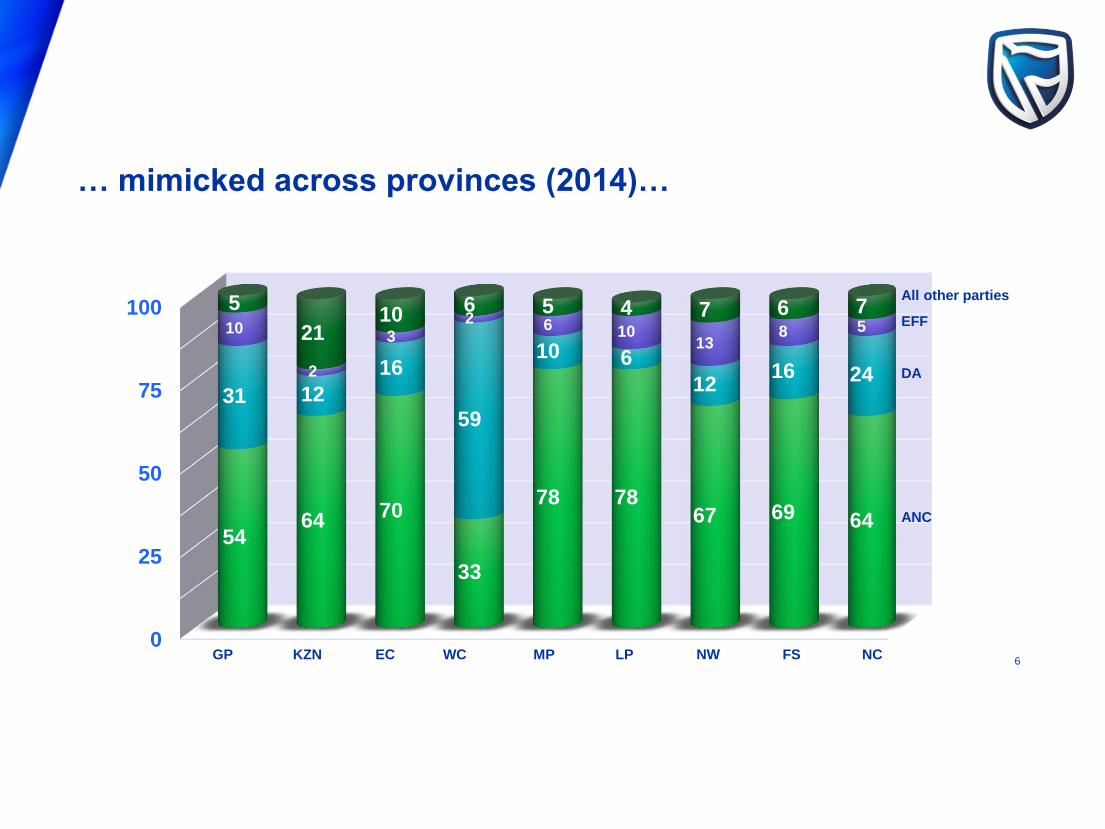
5464 70
33
78 7867 69 64
31 12
16
59
10 6
1216 24
10
2
32 6 10
138 5
5
2110 6 5 4 7 6 7
ANC
GP KZN EC
DA
EFF
All other parties
WC MP LP NW FS NC
… mimicked across provinces (2014)…
6
Percent
0
5
10
15
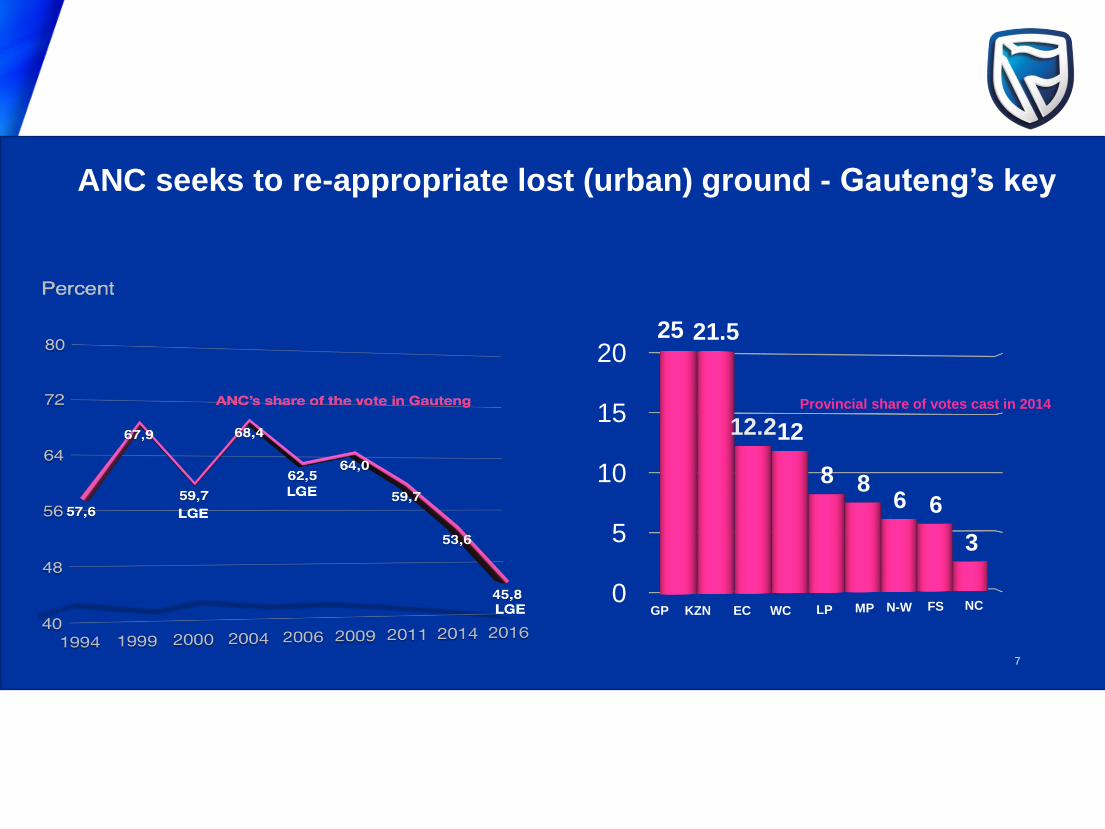
2025 21.5
12.212
8 86 6
3
GP KZN EC WC LP MP N-W FS NC
Provincial share of votes cast in 2014
ANC seeks to re-appropriate lost (urban) ground - Gauteng’s key
7
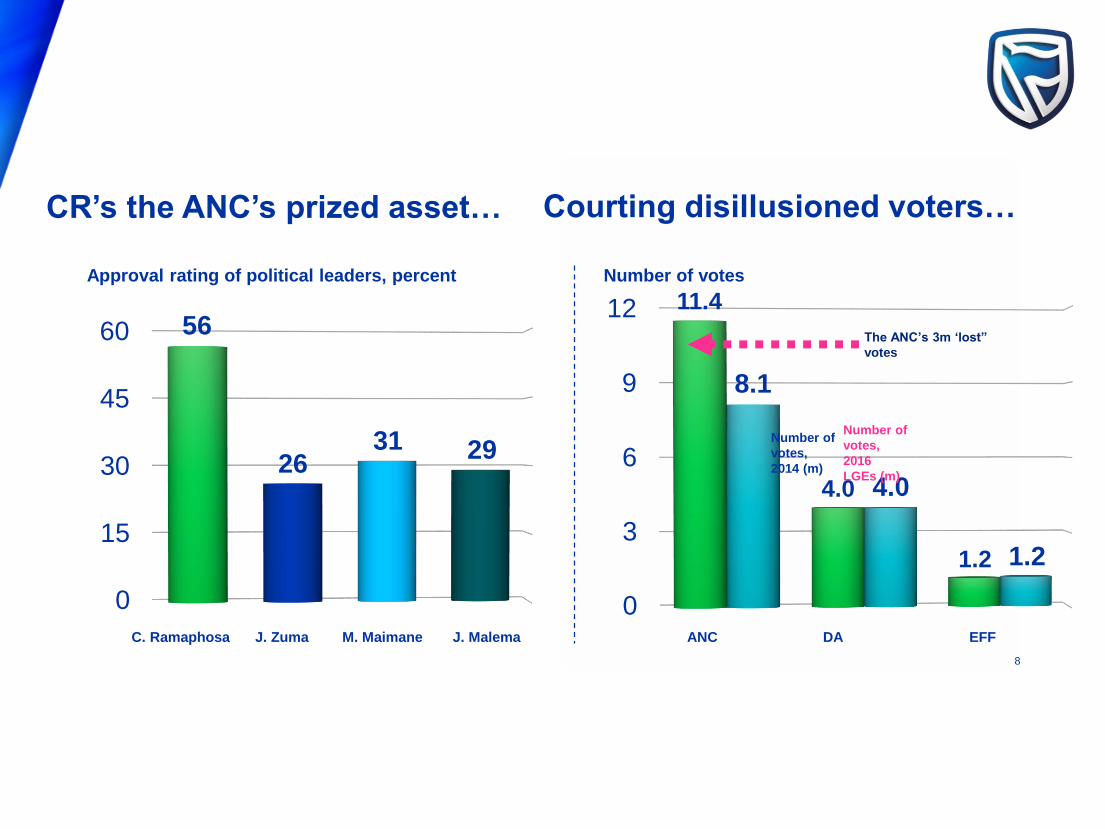
Approval rating of political leaders, percent Number of votes
0
15
30
45
60 56
2631 29
J. Zuma M. MaimaneC. Ramaphosa J. Malema
0
3
6
9
12 11.4
4.0
1.2
8.1
4.0
1.2
Number of
votes,
2016
LGEs (m)
Number of
votes,
2014 (m)
DA EFFANC
The ANC’s 3m ‘lost”
votes
CR’s the ANC’s prized asset… Courting disillusioned voters…
8
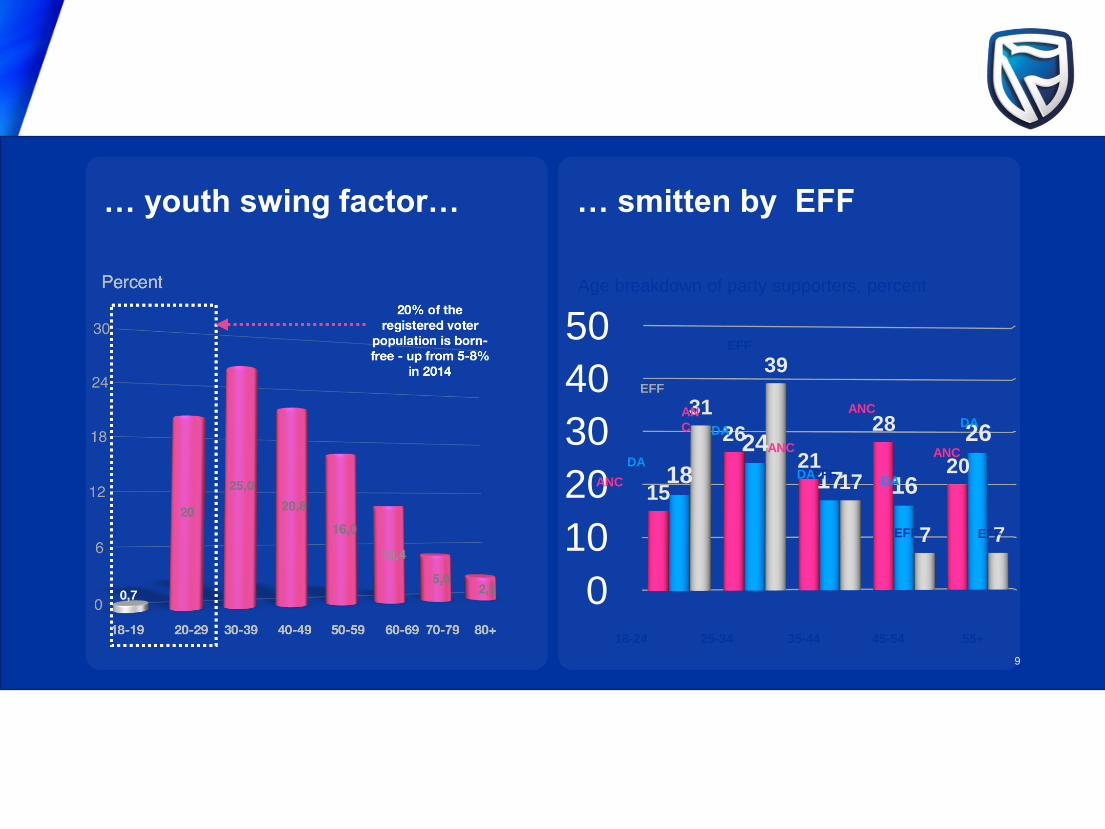
… youth swing factor… … smitten by EFF
Age breakdown of party supporters, percent
0
10
20
30
40
50
15
26
21
28
2018
24
17 16
2631
39
17
7 7
18-24 25-34 35-44 45-54 55+
EFF
DAANC
EFF
DA
ANC
EFFDA
AN
C
EFF
DAANC
EFF
DAANC
9
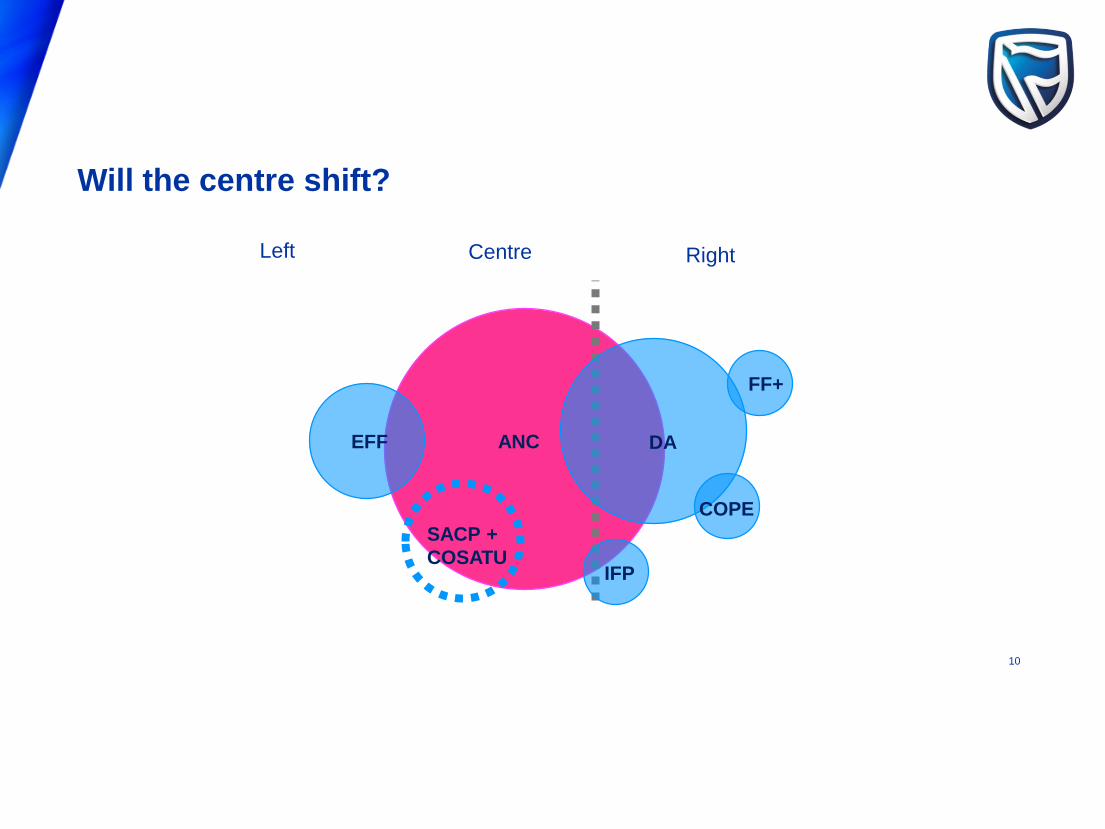
Left RightCentre
ANC
SACP +
COSATU
EFF
FF+
COPE
IFP
DA
Will the centre shift?
10
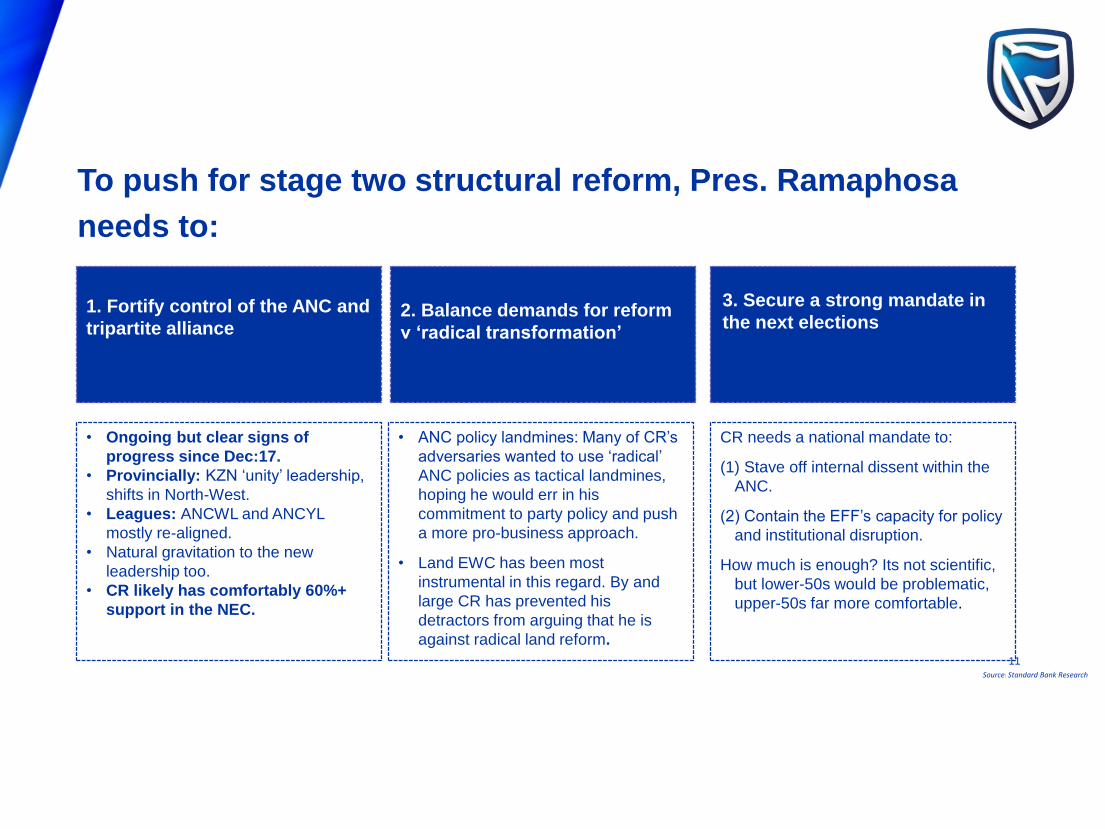
1. Fortify control of the ANC and
tripartite alliance 2. Balance demands for reform
v ‘radical transformation’
3. Secure a strong mandate in
the next elections
• Ongoing but clear signs of
progress since Dec:17.
• Provincially: KZN ‘unity’ leadership,
shifts in North-West.
• Leagues: ANCWL and ANCYL
mostly re-aligned.
• Natural gravitation to the new
leadership too.
• CR likely has comfortably 60%+
support in the NEC.
• ANC policy landmines: Many of CR’s
adversaries wanted to use ‘radical’
ANC policies as tactical landmines,
hoping he would err in his
commitment to party policy and push
a more pro-business approach.
• Land EWC has been most
instrumental in this regard. By and
large CR has prevented his
detractors from arguing that he is
against radical land reform.
CR needs a national mandate to:
(1) Stave off internal dissent within the
ANC.
(2) Contain the EFF’s capacity for policy
and institutional disruption.
How much is enough? Its not scientific,
but lower-50s would be problematic,
upper-50s far more comfortable.
Source: Standard Bank Research
To push for stage two structural reform, Pres. Ramaphosa
needs to:
11
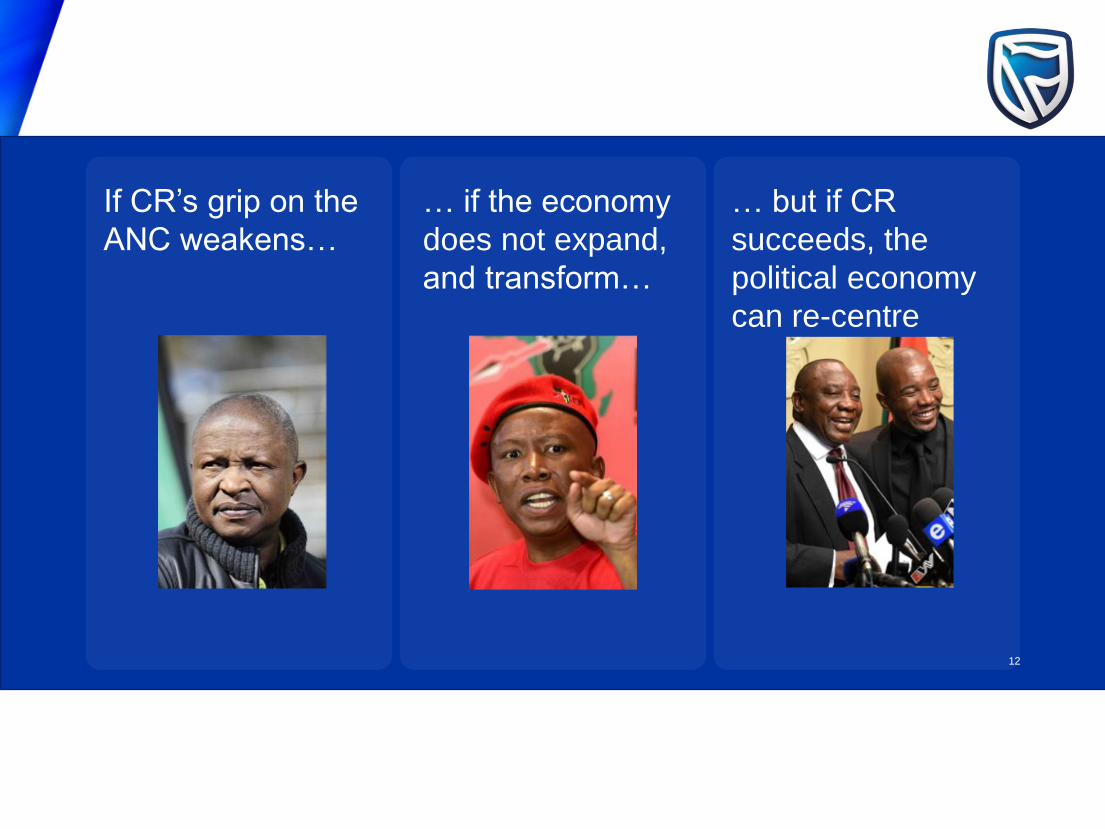
If CR’s grip on the
ANC weakens…
… if the economy
does not expand,
and transform…
… but if CR
succeeds, the
political economy
can re-centre
12
SA Economic Outlook
13
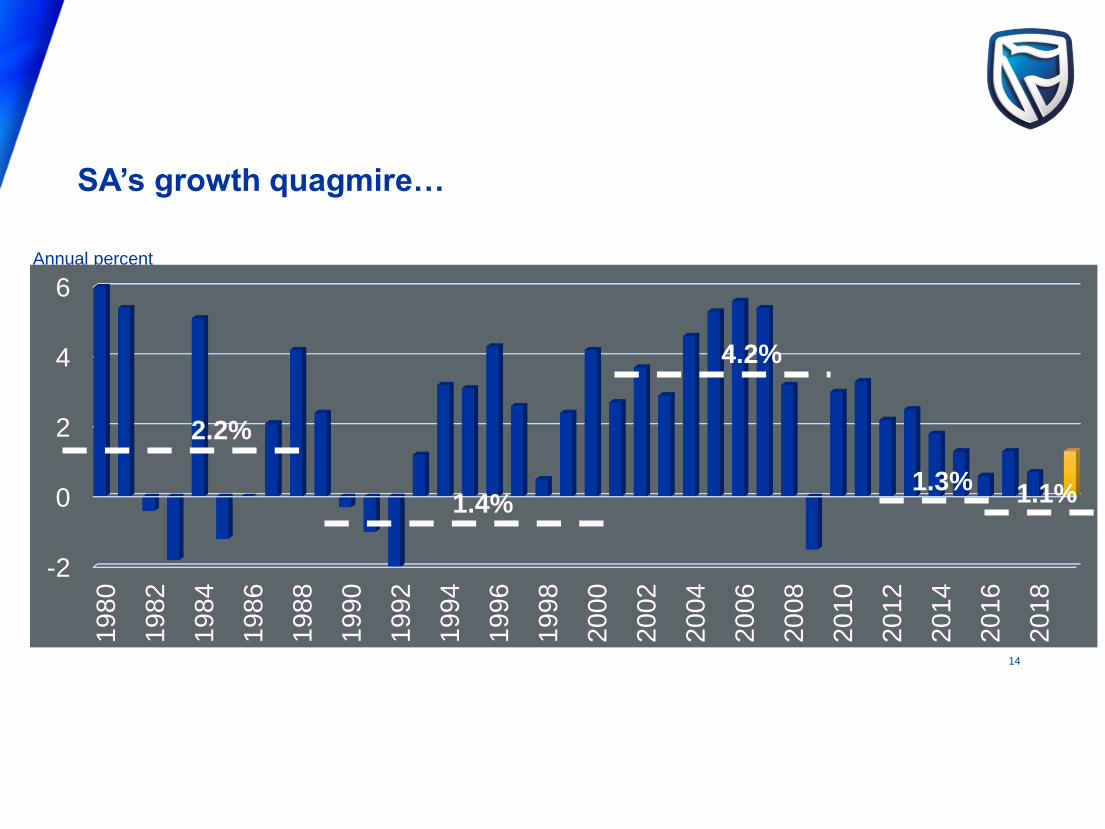
Annual percent
-2
0
2
4
6
19
80
19
82
19
84
1986
19
88
19
90
19
92
19
94
19
96
19
98
20
00
20
02
20
04
20
06
20
08
20
10
20
12
20
14
20
16
20
18
2.2%
1.4%
4.2%
1.3% 1.1%
SA’s growth quagmire…
14
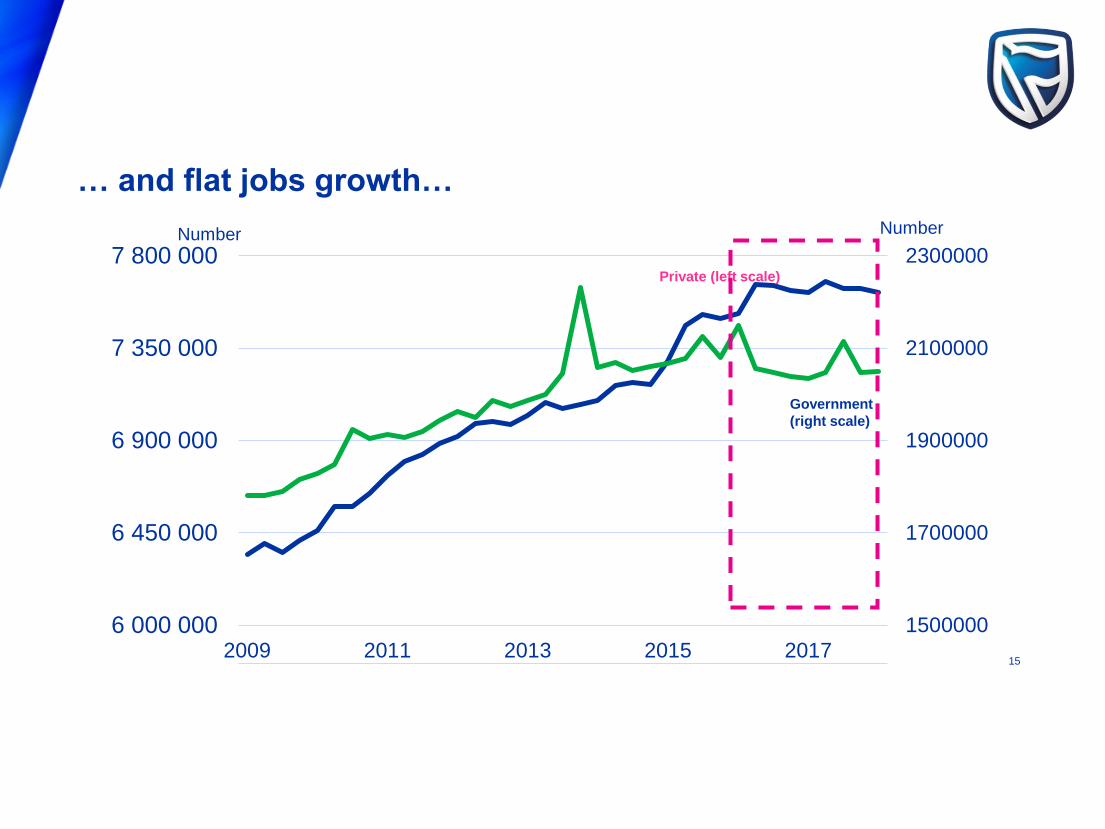
Number
1500000
1700000
1900000
2100000
2300000
6 000 000
6 450 000
6 900 000
7 350 000
7 800 000
2009 2011 2013 2015 2017
Government
(right scale)
Private (left scale)
Number
… and flat jobs growth…
15
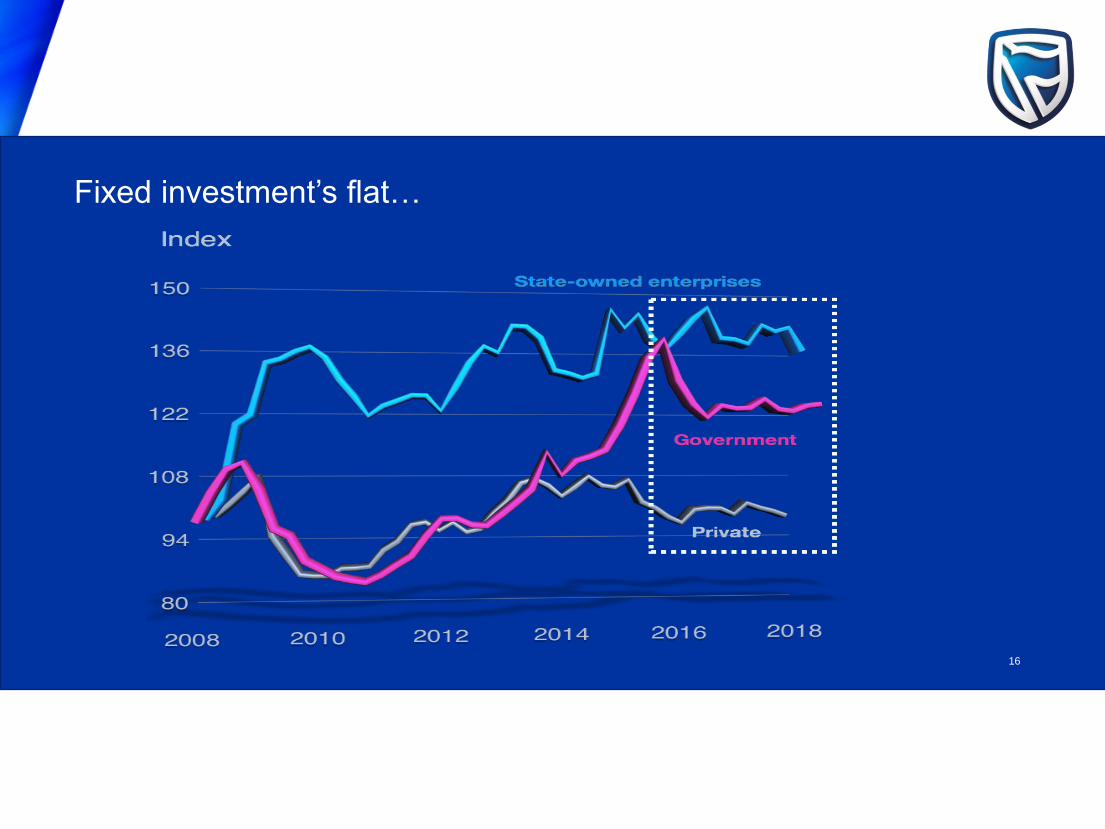
Fixed investment’s flat…
16
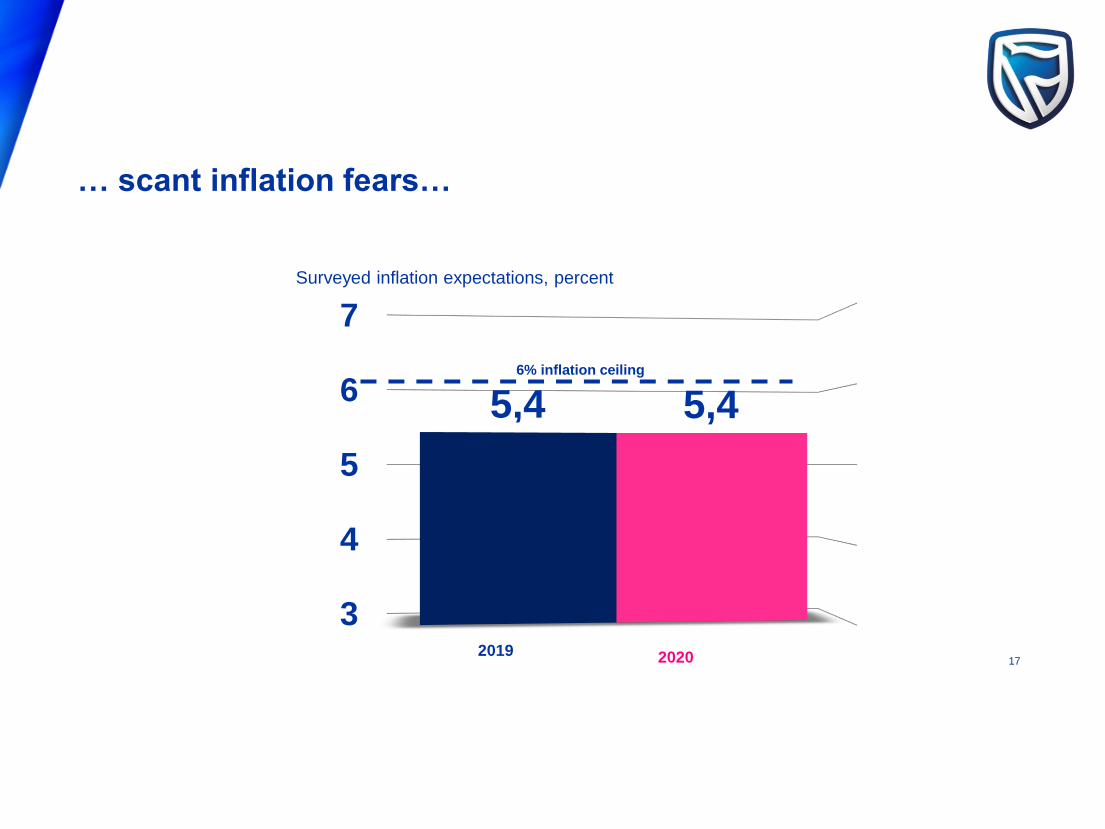
Surveyed inflation expectations, percent
3
4
5
6
7
5,4 5,4
20202019
6% inflation ceiling
… scant inflation fears…
17
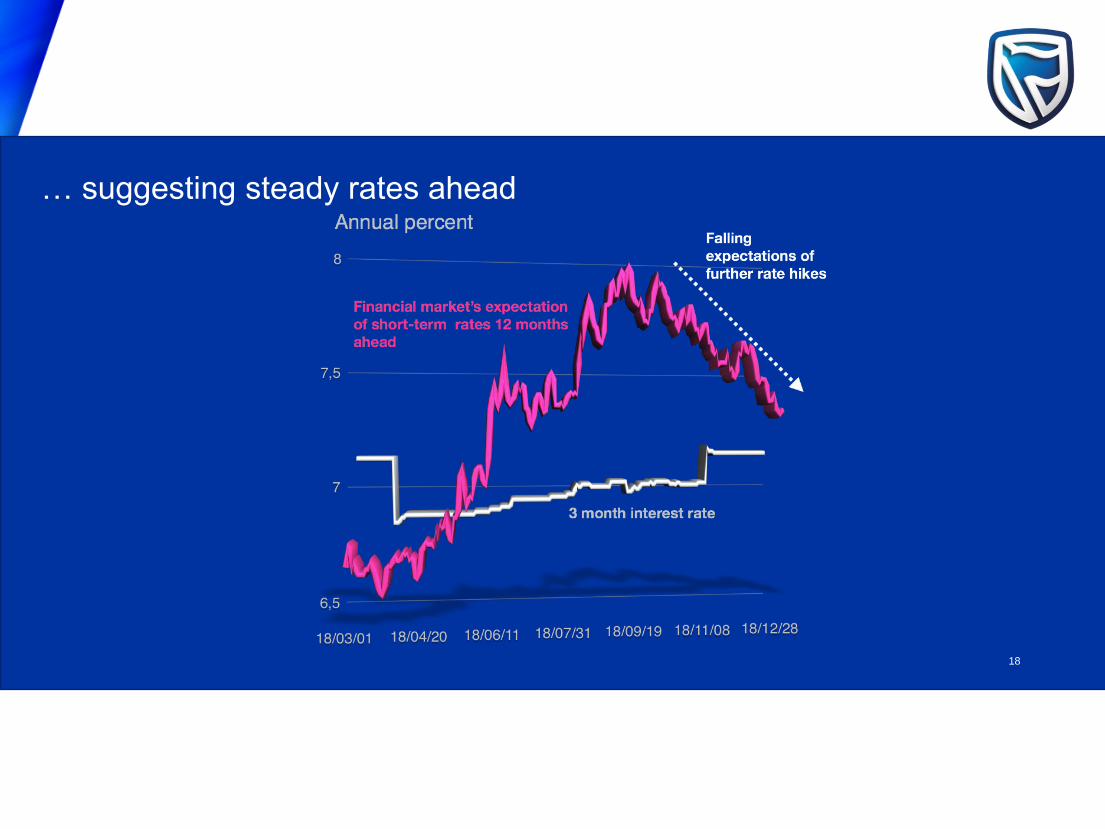
… suggesting steady rates ahead
18
0
14
28
42
56
70
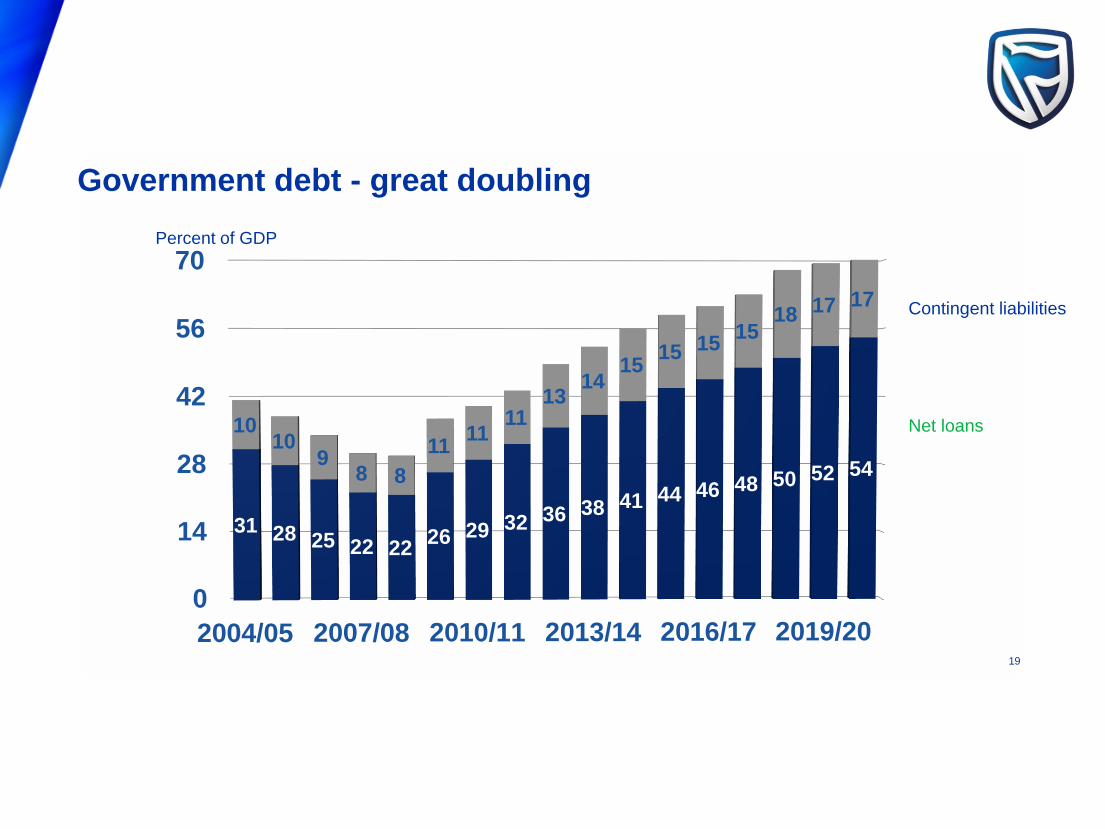
2004/05 2007/08 2010/11 2013/14 2016/17 2019/20
31 28 25 22 2226 29 32 36 38 41 44 46 48 50 52 54
1010
98 8
1111
1113
1415
15 1515
18 17 17
Percent of GDP
Contingent liabilities
Net loans
Government debt - great doubling
19
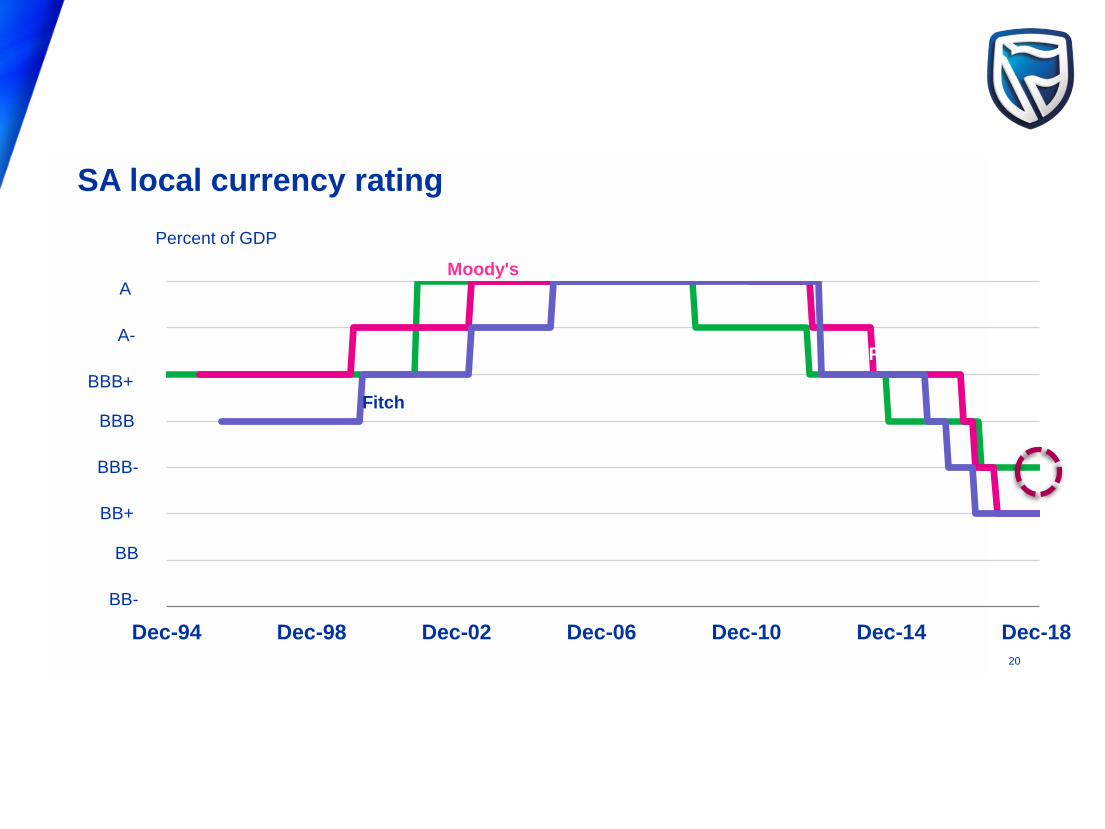
Dec-94 Dec-98 Dec-02 Dec-06 Dec-10 Dec-14 Dec-18
Percent of GDP
S&P
Moody's
Fitch
BB
BB+
BBB-
BBB
BBB+
A-
A
BB-
SA local currency rating
20
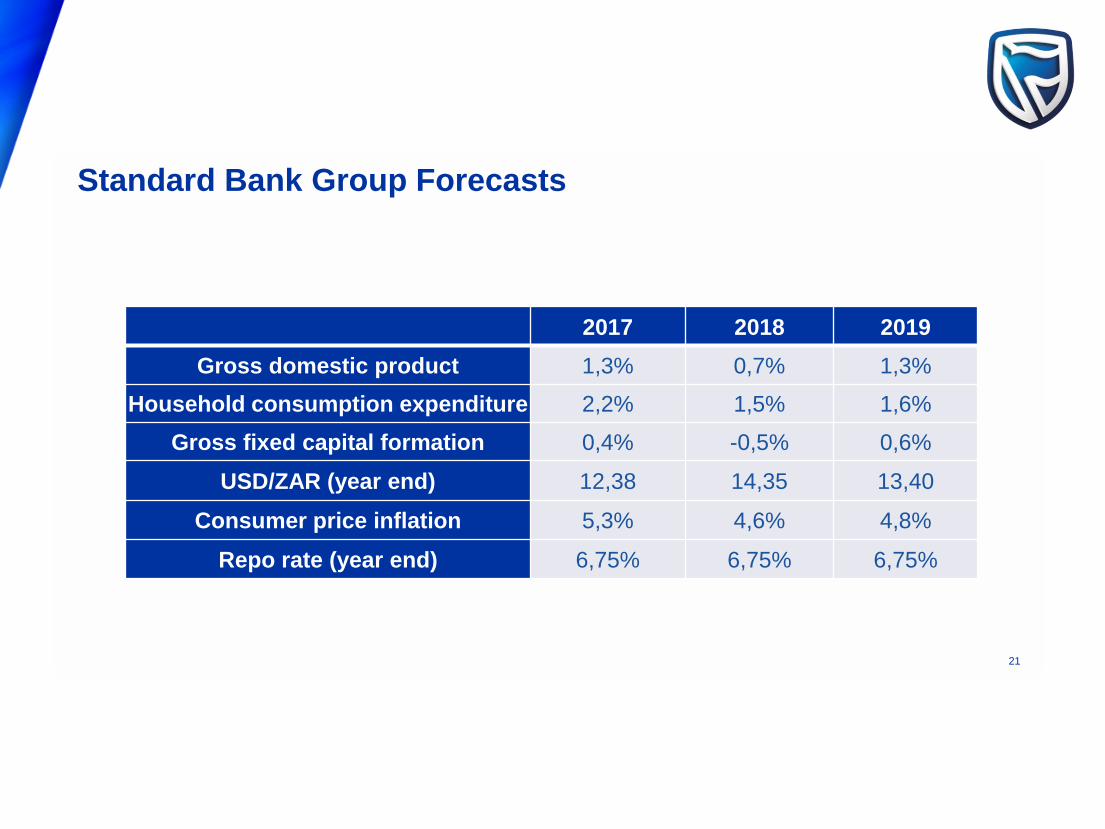
2017 2018 2019
Gross domestic product 1,3% 0,7% 1,3%
Household consumption expenditure 2,2% 1,5% 1,6%
Gross fixed capital formation 0,4% -0,5% 0,6%
USD/ZAR (year end) 12,38 14,35 13,40
Consumer price inflation 5,3% 4,6% 4,8%
Repo rate (year end) 6,75% 6,75% 6,75%
Standard Bank Group Forecasts
21
• IMF projects 2019 global growth slowing to 3,5% for 2019; from 3,7% in 2018.
• Slowing US economy off the back of reduced stimulus and delayed effect of tightening monetary
policy.
• Chinese economy slowing and impact of trade wars.
• Eurozone anticipating slower growth.
• Brexit remains a huge unknown…
• Overall growth economic backdrop remains worrying, with greater risk to global growth deceleration
– which would adversely impact SA as a commodity exporter…
Global growth concerns to add to SA uncertainty
22
HOW BUSINESS IS EVOLVING…
23
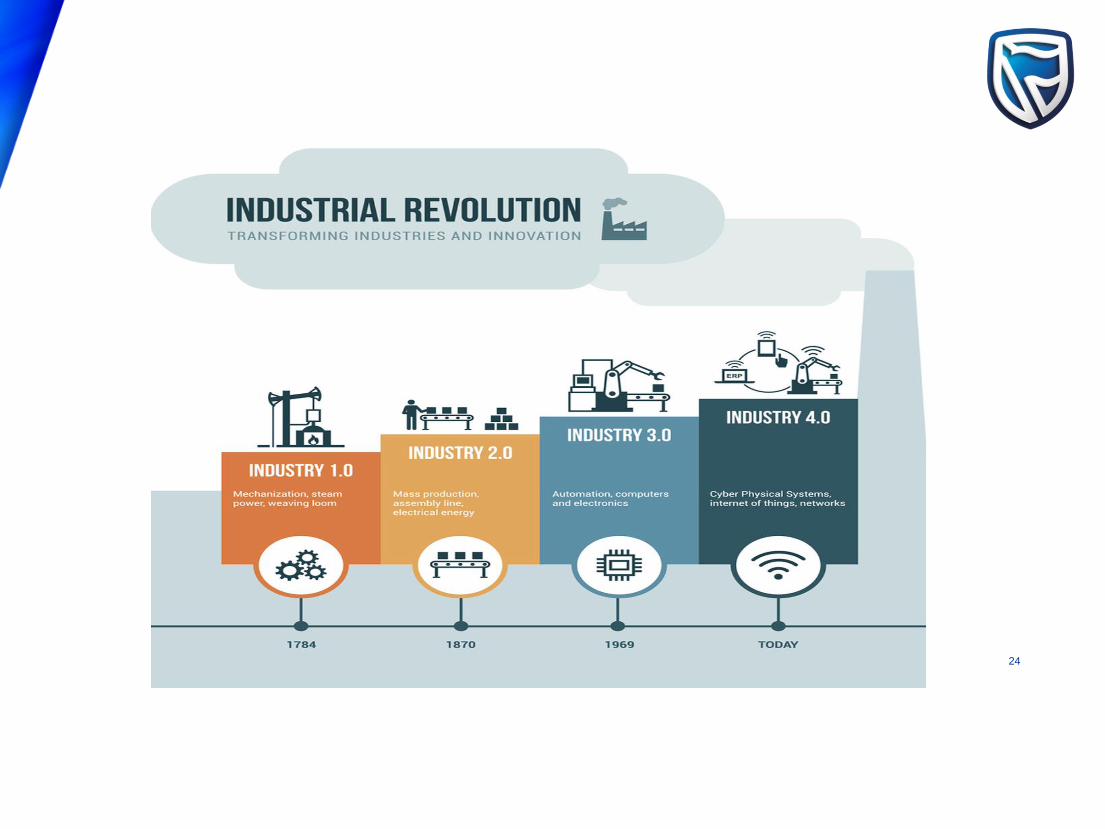
Image Place Holder
24
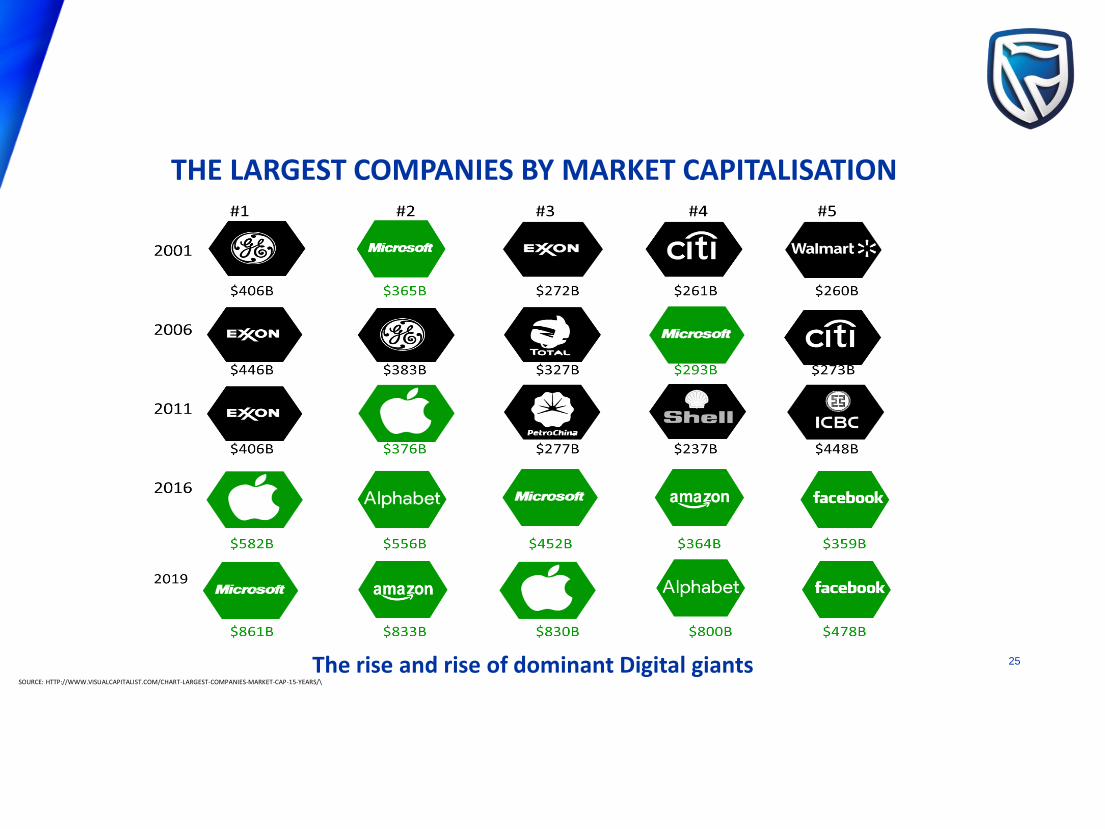
The rise and rise of dominant Digital giants
THE LARGEST COMPANIES BY MARKET CAPITALISATION
SOURCE: HTTP://WWW.VISUALCAPITALIST.COM/CHART-LARGEST-COMPANIES-MARKET-CAP-15-YEARS/\
25
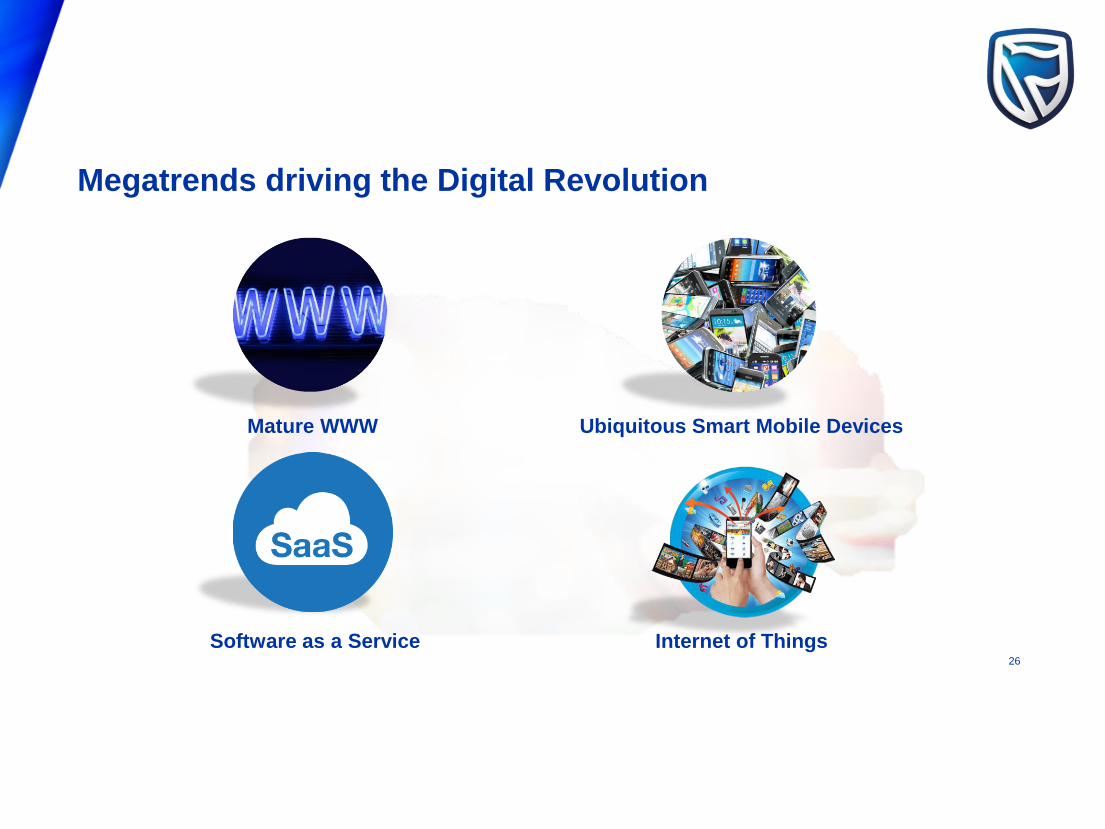
Megatrends driving the Digital Revolution
Mature WWW
Software as a Service
Ubiquitous Smart Mobile Devices
Internet of Things26
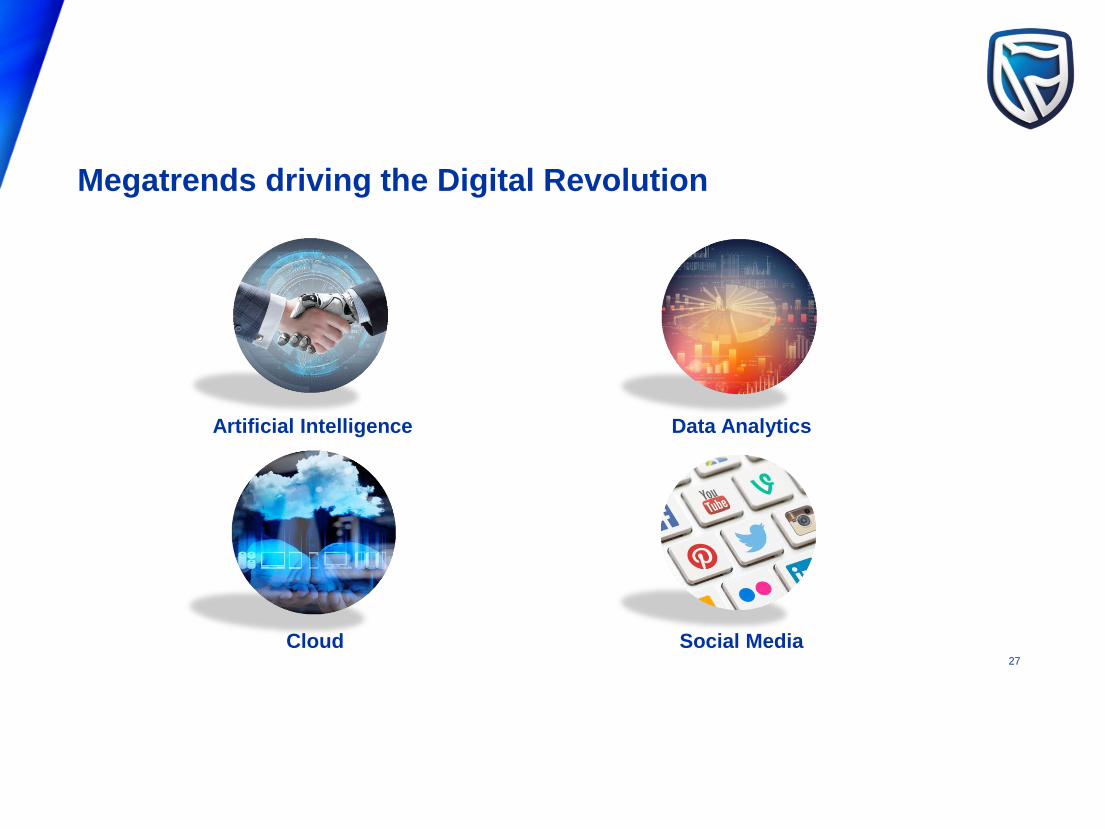
Megatrends driving the Digital Revolution
Artificial Intelligence
Cloud
Data Analytics
Social Media27
HOW STANDARD BANK IS EVOLVING…
28
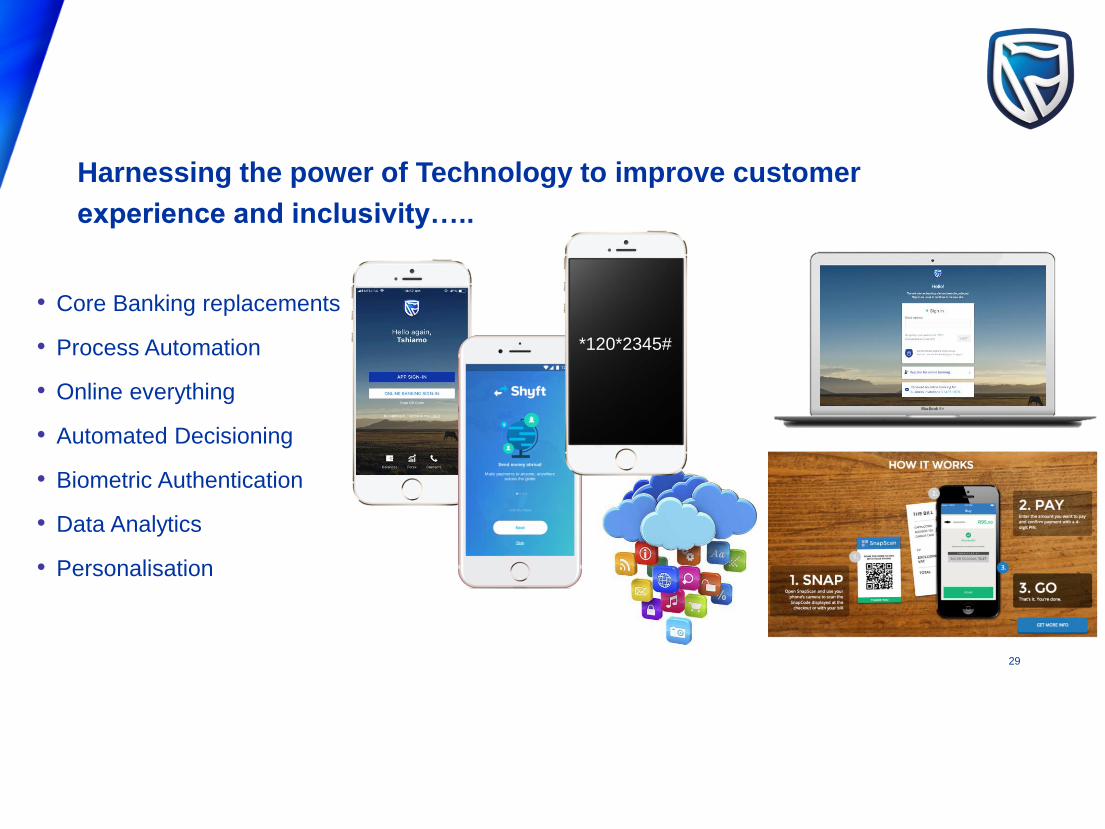
• Core Banking replacements
• Process Automation
• Online everything
• Automated Decisioning
• Biometric Authentication
• Data Analytics
• Personalisation
*120*2345#
Harnessing the power of Technology to improve customer
experience and inclusivity…..
29
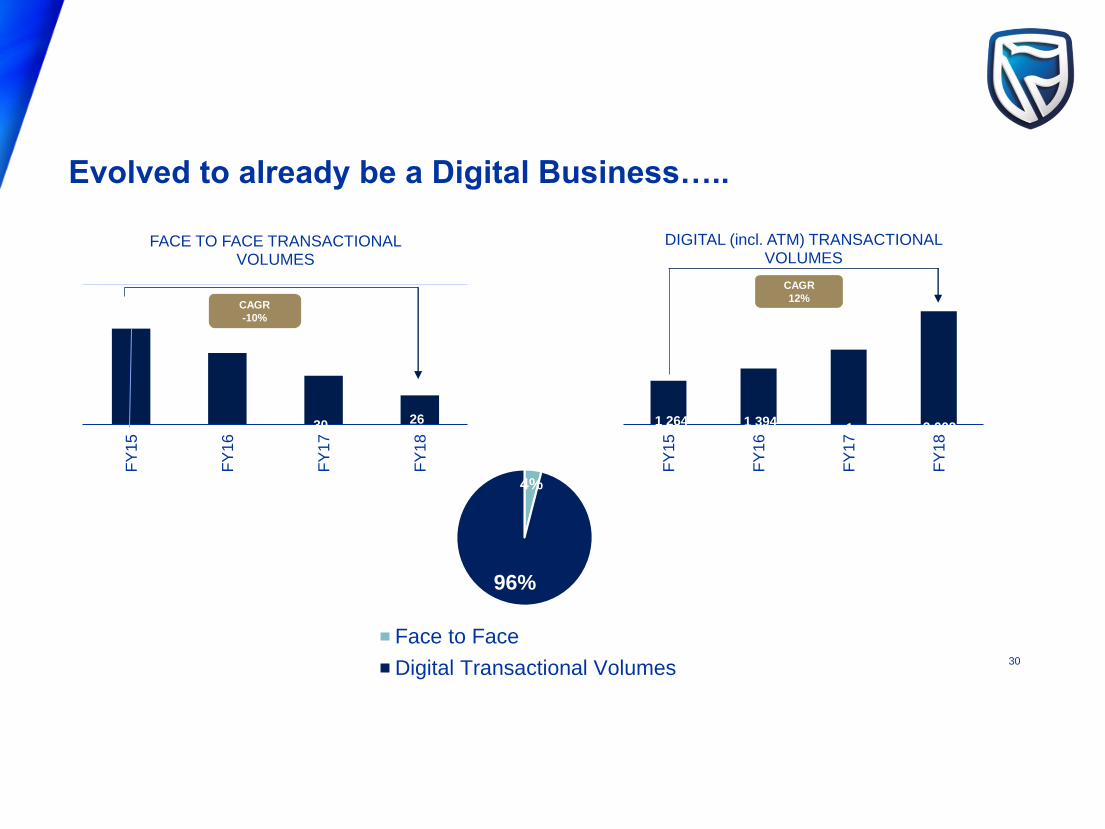
Evolved to already be a Digital Business…..
41 35 30 26
FY
15
FY
16
FY
17
FY
18
FACE TO FACE TRANSACTIONAL VOLUMES
CAGR
-10%
1 264 1 394 1 … 2 002
FY
15
FY
16
FY
17
FY
18
DIGITAL (incl. ATM) TRANSACTIONAL VOLUMES
CAGR
12%
4%
96%
Face to Face
Digital Transactional Volumes30
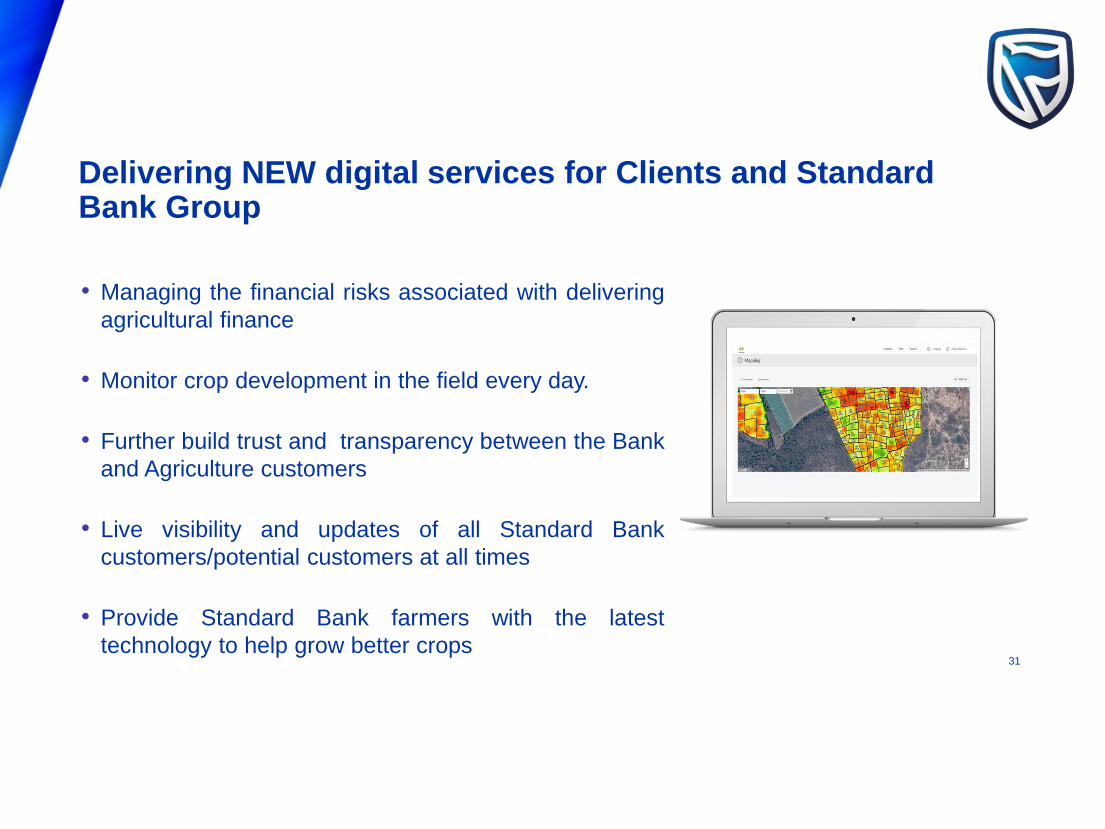
• Managing the financial risks associated with delivering
agricultural finance
• Monitor crop development in the field every day.
• Further build trust and transparency between the Bank
and Agriculture customers
• Live visibility and updates of all Standard Bank
customers/potential customers at all times
• Provide Standard Bank farmers with the latest
technology to help grow better crops
Delivering NEW digital services for Clients and Standard Bank Group
31
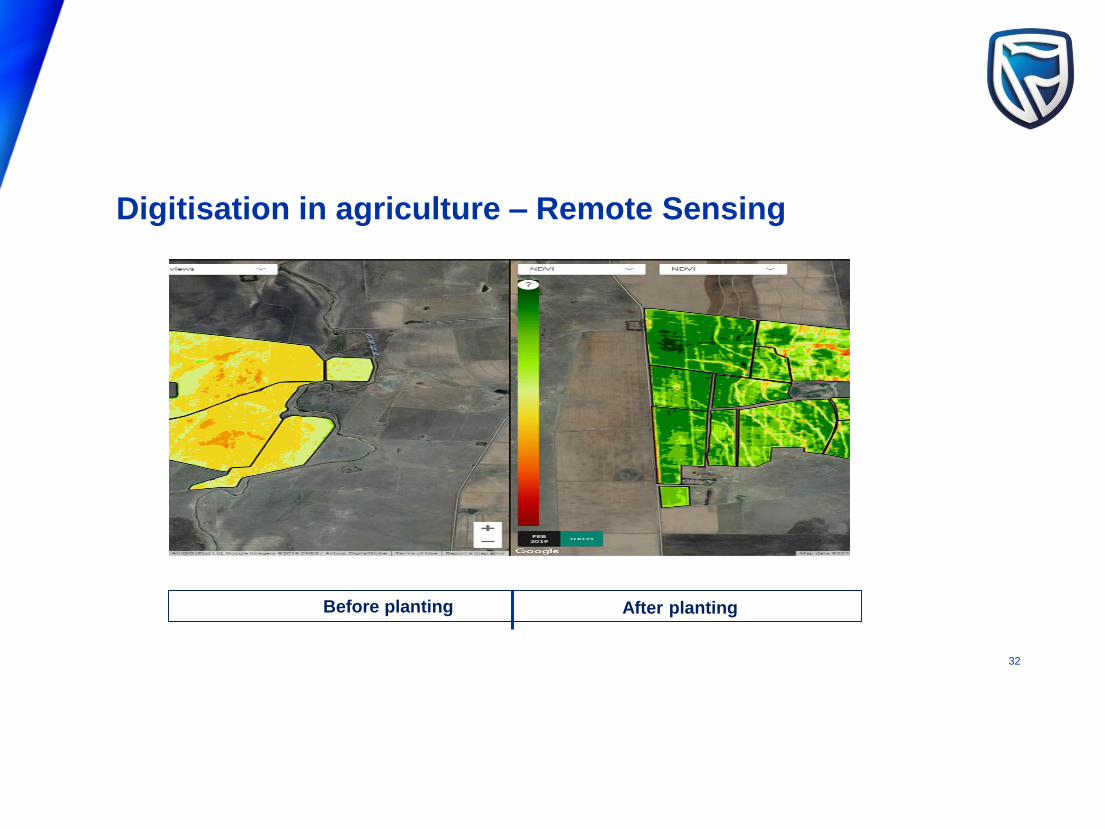
Digitisation in agriculture – Remote Sensing
After plantingBefore planting
32
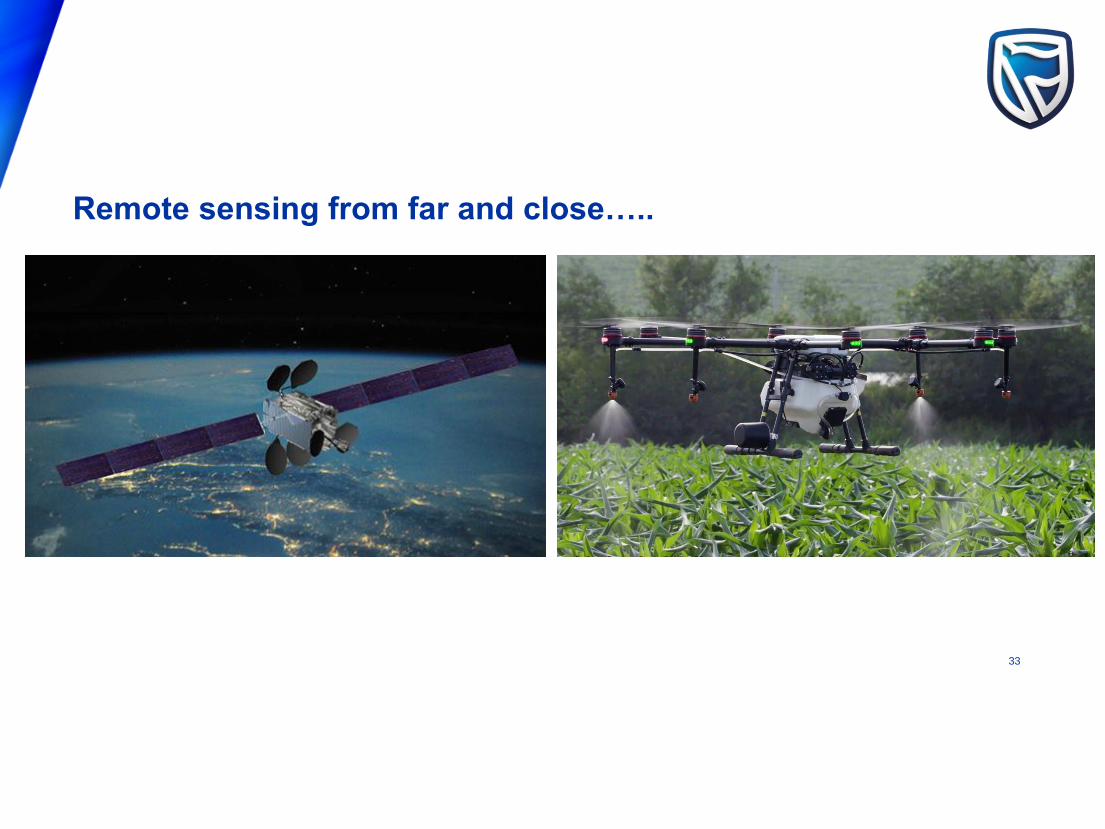
Remote sensing from far and close…..
33
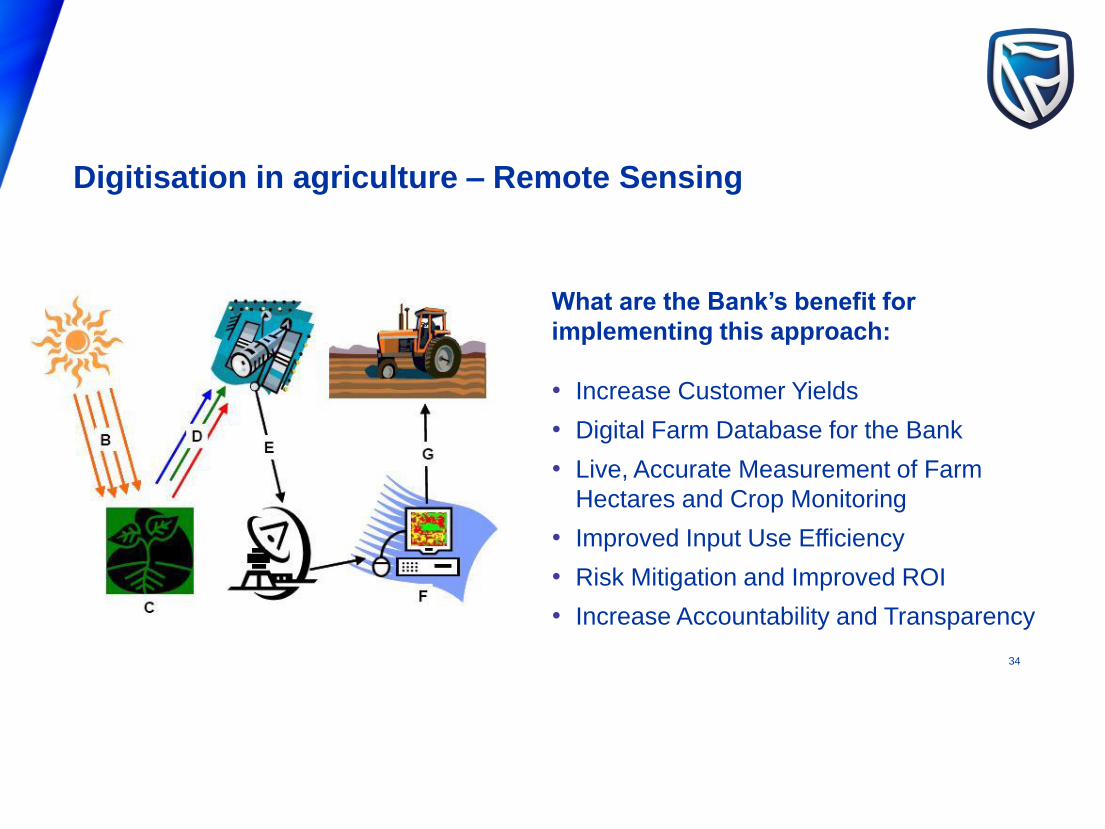
Digitisation in agriculture – Remote Sensing
What are the Bank’s benefit for
implementing this approach:
• Increase Customer Yields
• Digital Farm Database for the Bank
• Live, Accurate Measurement of Farm
Hectares and Crop Monitoring
• Improved Input Use Efficiency
• Risk Mitigation and Improved ROI
• Increase Accountability and Transparency
34
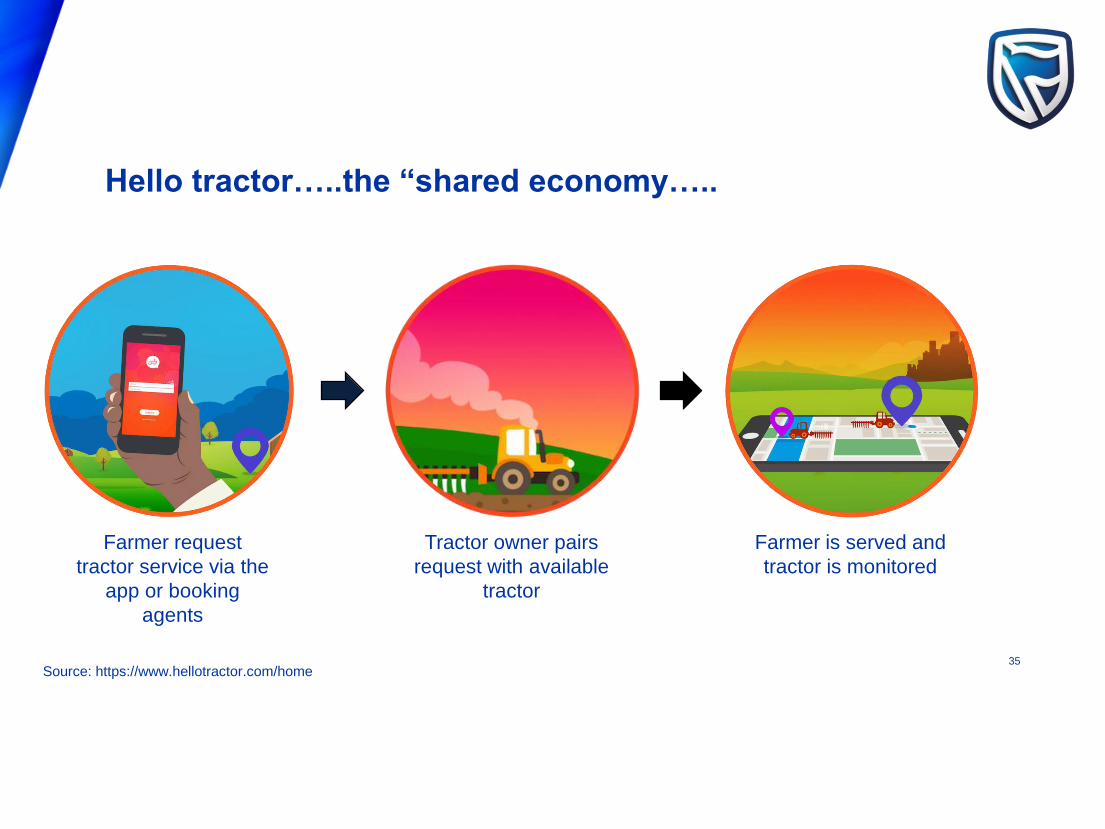
Hello tractor…..the “shared economy…..
Farmer request
tractor service via the
app or booking
agents
Tractor owner pairs
request with available
tractor
Farmer is served and
tractor is monitored
Source: https://www.hellotractor.com/home35
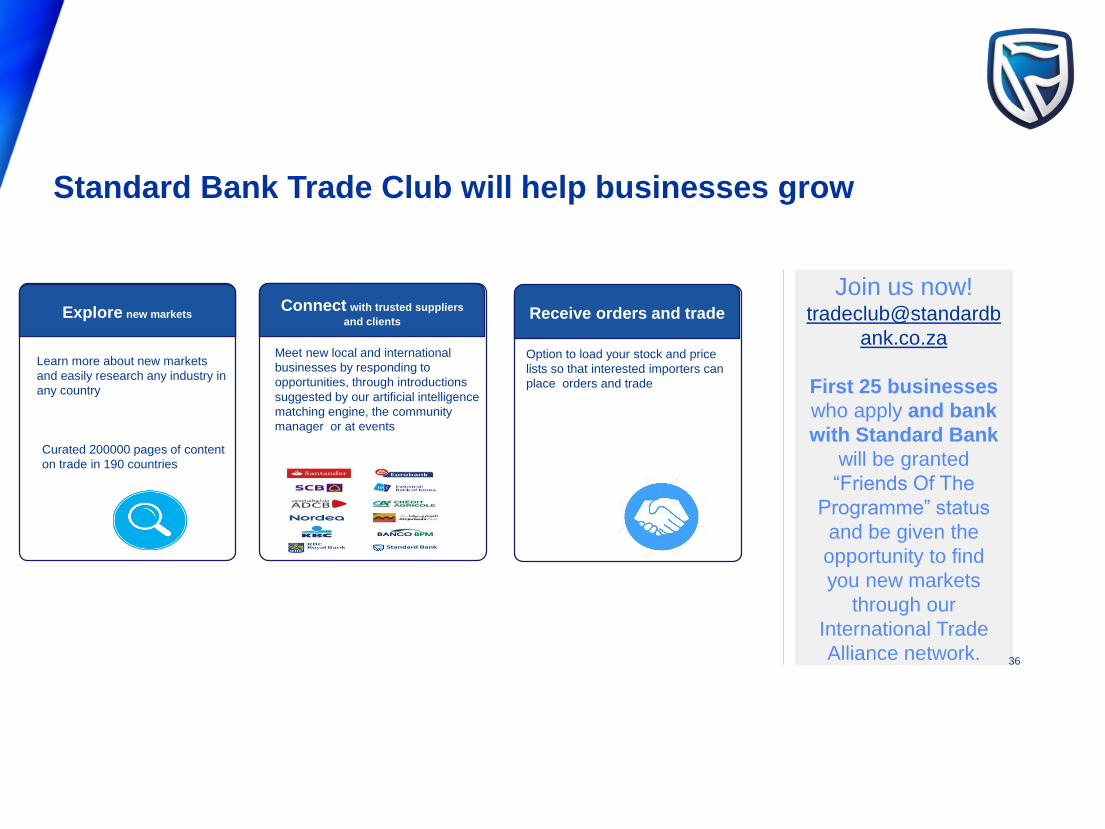
Learn more about new markets
and easily research any industry in
any country
Explore new markets
Curated 200000 pages of content
on trade in 190 countries
Standard Bank Trade Club will help businesses grow
Connect with trusted suppliers
and clients
Meet new local and international
businesses by responding to
opportunities, through introductions
suggested by our artificial intelligence
matching engine, the community
manager or at events
Join us now! tradeclub@standardb
ank.co.za
First 25 businesses
who apply and bank
with Standard Bank
will be granted
“Friends Of The
Programme” status
and be given the
opportunity to find
you new markets
through our
International Trade
Alliance network.
Receive orders and trade
Option to load your stock and price
lists so that interested importers can
place orders and trade
36
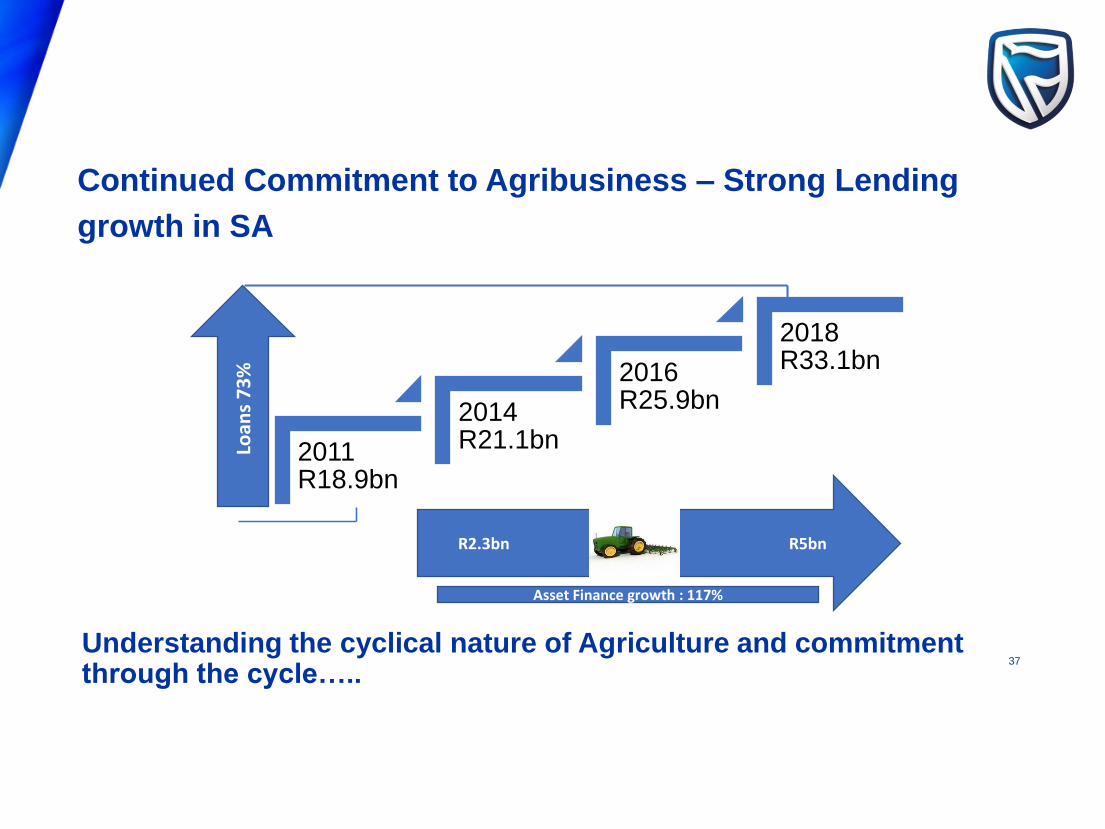
2011 R18.9bn
2014 R21.1bn
2016 R25.9bn
2018 R33.1bn
Loan
s 7
3%
R2.3bn R5bn
Asset Finance growth : 117%
Understanding the cyclical nature of Agriculture and commitment through the cycle…..
Continued Commitment to Agribusiness – Strong Lending
growth in SA
37
38
Building name Street number Street Name City 0000 / PO Box 00000 City Name 0000 Country Name
Tel +00 (0)00 000 0000 Fax +00 (0)00 000 0000 / [email protected]
standardbank.com