Embed Size (px)
Citation preview
The Fair Value of Insurance Liabilities McEllin, Edward Centre for Actuarial Studies The University of Melbourne Parkville, VIC 3010 Australia Phone: +61411809995 Email: [email protected] ABSTRACT The fair value of insurance liabilities is currently a highly disputed topic around the globe, particularly among US property and casualty insurers. Interest in the topic was sparked by the release of FAS115 [1993], a ruling which resulted in inconsistent accounting measurement of assets and liabilities in the USA. While assets are measured at market value, liabilities are recorded at historical cost under FAS115. This paper seeks to review the concept of fair valuation from a life insurance perspective. Two methods of fair valuation are considered: the embedded value methodology and the options pricing technique. Although algebraically reconcilable, the practical equivalence of the two methods is questioned. In considering the two methodologies, consideration is given to the treatment of risk, the choice of discount rate and the impact of an insurer’s credit rating in a fair valuation. KEYWORDS “Life Insurance Liability Valuation” “Fair Value Methods”
TABLE OF CONTENTS
Part 1 – Preliminaries 1
(i) Background of essay 1
(ii) Aims and approach 2
(iii) Parameters of essay 3
Part 2 - Exposing the fair value framework 4
(i) The embedded value methodology 5
(ii) The options pricing approach 7
(iii) Accounting for risk 9
(iv) Modelling the default risk premium 13
(v) The algebraic equivalence of the EVM and OPM 15
(vi) A practical reconciliation of the EVM and OPM 17
(vii) The relationship between the Required Profit Component 19
and the discount rate
(viii) Sensitivity of the cost of capital assumption under a fair valuation 20
Part 3 – Conclusions 22
References 23
Appendices
1) Modelling assumptions 25
2) The need for a default risk premium in fair valuation 26
1
Part 1- Preliminaries
1(i) Background of essay
Subsequent to the issue of statement Financial Accounting Standard 115 [1993] in the USA,
there was a discrepancy in the measurement of insurance assets and liabilities, with most of the
former category marked to market but the latter still wholly measured by traditional accounting
means. While there is unanimity among accounting and actuarial bodies that this standard has
introduced artificial volatility of equity into the balance sheet of US life insurers, there has been
no consensus resolution. International Accounting Standard 39 (IAS39) [1998], although
designed to move accounting for financial instruments toward a fair value system, has failed to
solve the problem since it explicitly excludes insurance liabilities from fair valuation
requirements. Measuring the fair value of liabilities is a non-trivial procedure, currently disputed
globally by accountants, actuaries and regulators.
The term “fair value” was initially coined for use in situations where no active or deep market
exists for the security or liability in question. IAS32 [1999] defines fair value as “The amount for
which an asset could be exchanged, or a liability settled, between knowledgeable, willing parties
in an arm‘s length transaction. “ Most importantly, the amount is that applicable in a current
transaction between ready buyers and sellers, not a forced sale. Perhaps the best market for
observing the fair value of life insurance liabilities is the reinsurance market.
In 1999, subsequent to the developments in the USA, The International Accounting Standards
Committee (IASC) published an issues paper, entitled “Insurance”, addressing the issue of fair
value in greater detail. Questions raised include (IASC reference notation is given in brackets):
(a) Whether insurance contracts should be included in a fair value standard (11B);
(b) The appropriate discount rate (11G);
(c) The need for a risk provision (11H);
(d) The impact of the insurer’s creditworthiness on the valuation (11I); and
(e) The appropriateness of the embedded value methodology for fair valuation (11K).
2
1(ii) Aims and approach
In accordance with the views espoused by the IASC’s Steering Committee, it is agreed that the
method used for insurance liability valuation should parallel the market valuation of assets. With
only one side of the balance sheet “marked to market”, the volatility of shareholders’ equity risks
being unrepresentative of a company’s exposure to interest rate risk. Moreover, given the
increasingly volatile economic environment, the need for a reporting system that ensures stable
and consistent valuations of equity and earnings is critical. Thus, in light of the perceived need
for such a liability valuation structure, the objective of this paper is this:
To examine the two main methods of fair valuation, these being the embedded
value and the direct valuation/option pricing approaches. In the process,
appropriate consideration will be given to issues (b) - (e), as detailed above. The
equivalence of the two methodologies will be demonstrated, both algebraically
and practically.
The fair valuation of several different insurance products was conducted in the development of
this paper. For illustration purposes, it was chosen to focus wholly on a participating whole of
life product with annual distributable policyholder dividends. Such a product is admittedly more
familiar to the American life insurance market than other insurance markets but has been
selected because it allows for a more complete exposition of the key fair value concepts in the
extant literature, with both market-linked (policyholder dividends) and market-independent
(benefits and expenses) charges. An attempt has been made to use realistic assumptions in the
modelling of this product, with the exception of certain simplifications necessary for ease of
presentation. A detailed description of the product and underlying assumptions is given in
Appendix 1.
3
1(iii) Parameters of essay
In exploring the aims listed in Part 1(ii), a benchmark fair valuation approach was required.
With fair valuation of insurance liabilities being a relatively recent and popular concept, there are
myriad views emerging on the topic but little consistency of approach. It was chosen to base the
model fair valuation specifications and calculations on Luc Girard’s paper “Market value of
insurance liabilities” published in January, 2000. This article also provided the conceptual
framework for the algebraic reconciliation of the two fair value methodologies in Part 2(v).
Finally, it should be noted that the aim of this essay is not to dwell on the algebra, but rather to
provide a balanced practical and theoretical overview of the key valuation concepts. As such,
much detail has been omitted from the final paper, both in the algebraic proofs and with regards
to the model calculations.
4
Part 2 - Exposing the fair value framework
Despite the IASC’s efforts to achieve market valuation of financial liabilities via the prescription
of IAS39 [1998], little progress has been made in the development of a consensus fair valuation
framework for life insurance liabilities. The main complications have been the long-term nature
of the life insurance contract, the high levels of uncertainty and the need for large initial
expenses to be recouped from subsequent revenue. Regulators have been unwilling to abandon
traditional conservative reporting methods and as such reported earnings and equity remain
artificially volatile in many jurisdictions.
In recognition of the need for a fair value framework to replace US GAAP legislation, the
American Academy of Actuaries’ Fair Valuation Taskforce held a dedicated conference in 1998.
Arnold Dicke presented a paper cataloguing ten different methods for the fair valuation of life
insurance liabilities. His two “type A” methods remain the most commonly embraced in the
actuarial field, these being the actuarial appraisal/embedded value approach and the options
pricing methodology.
5
2(i) Embedded value methodology
Appraisal and embedded value methodologies are traditionally used by UK and Australian
actuaries. Consequently there exist readily established parameters and procedures. While
appraisal values of future distributable earnings typically reflect both earnings from existing
liabilities and franchise value (a capitalisation of future expected business), fair valuations of
liabilities should, by definition, refer to existing policy liabilities only. Thus for this paper, the
title “Embedded Value” Methodology (EVM) is used to focus attention on the fact that fair
valuations refer to a closed block of business.
The method is a deductive approach, first evaluating enterprise value and then deducting this
from the known value of assets to determine the fair value of liabilities. Ignoring taxes, the net
fair value of liabilities (FVL) may be expressed as:
= + −FVL CapL MVA EV (1)
where
CapL = the market value of a portfolio of assets with book value to the required
risk based capital supporting the product liabilities.
MVA = the market value of a portfolio of assets with book value equal to the
policy liabilities.
(Note that CapL and MVA could be combined to equal the total assets held in
respect of the liabilities. They are separated here to facilitate later calculations.)
EV = embedded value of the business, equivalent to the discounted sum of future
free cashflows.
There is an obvious circularity in the above methodology. Derivation of FVL requires EV, which
is a function of the cash flows to the shareholder and in turn of FVL itself. This problem may be
eliminated using backwards recursion and the assumption that FVL = EV = 0 at t=T, the end of
the product period.
6
Defining the liabilities to include an outflow of profit to shareholders gives the implied recursive
EVM specification of FVL:
1 ; 0(1 )−+ += =+
t t ttt
t
FVL L RPFVL where FVLi
(2)
where
Lt = the net policyholder cash flows, including benefits, claims, premiums.
RPt = Required Profit, or the outflow to shareholders. This is the payment to
shareholders, that, when added to interest earned on invested capital, equals the
shareholders’ cost of capital;
)()()( 111 −−− −∗−+∗−= tttt FVLMVAikCapLjk
where
k = cost of capital
j = interest rate earned on risk based capital
it = vector of risk adjusted discount rates
In applying the EVM it should be stressed that CapL reflects the risk-based capital
requirements to support the liabilities. This will not necessarily concur with statutory
capital requirements, as used by most actuaries in calculating embedded values. In the
event that valuations are based on excessive statutory capital requirements, a
compensatory adjustment should be applied to the discount rate to ensure fair value.
7
2(ii) Options pricing methodology
Options pricing methodologies (OPM) for fair valuation might be more appropriately termed
direct value of risk methods, given that they are readily applied in both a static and uncertain
economic world. By calculating the present value of the future liability cash flows, such methods
provide a straightforward and direct means of liability fair valuation; hence their categorisation
as a “constructive” approach in fair valuation literature. Specifications of the OPM are varied but
typically reconcilable. Two examples follow.
Girard’s [2000] specification of the OPM in a static world and ignoring expenses is:
∑ ++= tL
tft
t
rL
FVL)1( θ
(3)
where
ftr = risk free interest rate
Ltθ = liability spread
While Girard favours a one-off risk adjustment to the discount rate, IAAust [2000] incorporates
an additional risk margin (FVR) into its OPM specification. FVR is defined as a stream of
additional cash flows equal to the fair value of liability risks:
FVRPVCFFVL += (4)
where
PVCF = anticipated value of liability cash flows
FVR = fair value of liability risks
Applying the notation used earlier and defining RMt to be the required risk margin at time t, one
may write:
∑∑∑ ∗∗∗ ++
=+∗
++
= tt
ttt
t
ttt
t
t
rRML
rRML
rL
FVL)1(
)1()1()1(
(5)
8
In view of the inclusion of FVR, one might expect the discount rate to be risk-free. However,
IAAust specifies a “risk-adjusted” discount rate, denoted here by ∗tr . The obvious implication is
that the risk provision, FVR, values the actuarial uncertainty in forecasting future liability cash
flows, while )( ftt rr −∗ embodies residual non-actuarial risk, such as the default option held by
the insurer. The reasoning for this interpretation will be examined more thoroughly in Part 2(iii).
In any case, the two OPM specifications may easily be reconciled by defining FVR as a “catch-
all” variable equal to the difference between liability cash flows discounted at ∗tr and L
tftr θ+ .
Note that were ∗tr defined to be the asset earning rate, the expression above would directly
reconcile with Girard’s specification of the EVM for fair liability valuation. The risk margin
would then be equivalent to the Required Profit charge.
9
2(iii) Accounting for risk
Debate is rampant among actuaries over the appropriate method to incorporate risk into the
liability valuation. Under the EVM, risk is incorporated by the required profit components or risk
capital charges that must be added to the liability cash flows. These are determined via
specification of a risk-adjusted cost of capital discount rate applicable to the distributable
earnings. When applying the OPM, as defined by Girard, risk is accounted for by the
specification of the liability spread, Lθ . Since, as will be shown in Part 2(v), the EVM and
OPM are essentially equivalent, debate over the appropriate method of incorporating risk will
result only in computational ease, not greater accuracy. The same factors will drive the Required
Profit margins in the EVM as the liability spread in the OPM.
Babbel and Merrill [1998] argue that liabilities are affected by three sources of uncertainty:
actuarial risks, market risks and non-market systematic risks. The obvious difficulty lies in
determining which of these factors are best modelled as impacting the cash flows and which as
affecting the discount rate or liability spread. Consistent with the literature, a hybrid OPM/EVM
approach is suggested whereby the actuarial risks (mortality, morbidity, lapse, surrender) are
incorporated into the cash flow using either a certainty equivalent approach or an explicit profit
charge, with residual risks accounted for by the liability spread. This approach is similar to
IAAust’s OPM specification (Equation 5) and avoids the confusing situation wherein a deduction
from the discount rate is required for actuarial risks and an addition is applied for market risks.
For simplification purposes, taxes and expenses have not been considered but these could be
readily incorporated in either the cash flows or the liability spread.
Proponents of asset-liability matching argue that the OPM discount rate for liabilities should be
fixed to the investment earnings rate, that is At
Lt θθ = , where A
tθ is the spread earned on product
assets. For liabilities directly dependent on asset performance, this argument appears validated.
To the extent, however, that a life insurer’s asset and liability portfolios are traditionally not
perfectly matched, it is argued that general correlation between the two portfolios is sufficiently
accounted for in the risk free rate. For asset-independent liabilities, additional risks should be
treated as liability specific. In Part 1(v), it will be shown that the liability spread may in fact
better be defined as an adjustment to the spread earned on product assets.
10
Indeed the common argument for asset-independent liabilities is to use a market discount rate for
a corporate fixed interest security with like duration. In assessing the validity of this choice of
discount rate, it is useful to consider a more detailed breakdown of market risks affecting the
valuation. The remainder of this subsection is dedicated to this task.
The Casualty Actuarial Society’s (CAS) Risk Premium Project [2000] suggests that there are two
major paradigms used to compute risk loads or liability spreads: these being the finance
perspective and the actuarial perspective. The fundamental difference in the two approaches lies
in the treatment of diversifiable and non-diversifiable risk. Under traditional economic asset
pricing theory, the appropriate discount rate for a given project is greater than the risk-free rate
of interest only when expected cash flows from the project bear systematic risk. Thus, given that
the cash flows associated with insurance liabilities are caused by events largely uncorrelated with
market factors, the systematic risk for an asset independent insurance liability should be
negligible; and the economist would advocate a risk-free discount rate. Furthermore, economists
assume that insurance company shares are held by diversified investors operating in perfect
markets, hence any diversifiable risk may be eliminated by portfolio choice.
While it remains a supported tenet of corporate finance that the market prices only systematic
risk, this concept may not be practically applied to the actuarial valuation of insurance liabilities.
Instead, it is advocated that insurance liability valuations incorporate various non-systematic
risks and market imperfections, namely credit risk and illiquidity. This step is justified by
recognising that spread components such as illiquidity and credit risk, unpriced in a pure CAPM
world, are typically unavoidable or at least not diversifiable in the life insurance liability
marketplace. The fundamental difficulty with life insurance liability valuations is that the
liabilities are not freely traded; perfect capital markets do not exist and thus each individual risk
should be priced on a standalone basis. Equivalently stated, uncertainties associated with
insurance cash flows are inherently costly for the firm to bear, thus the appropriate discount rate
should be set above the risk free rate. Gutterman’s [1999] general theorisation that the “less
efficient the market, the greater the weight that should be placed on entity-specific assessment”
is analogous to this reasoning. The concept of reinsurance provides further support for this
argument. If shareholders were diversified, as the corporate finance view purports, why would
11
insurance companies pay reinsurers to remove the non-systematic risk from their portfolio?
Appendix 2 provides a theoretical justification for inclusion of a positive default risk premium in
the discount rate.
Support for a liquidity premium is notably absent in current fair value literature. One might
assume this to be due to the fact that traditional insurance liabilities are not “at call.”
Nevertheless, given that no deep market exists for insurance liabilities, the bid-ask spread for
insurance portfolio sales is likely to be wide. Consequently there appears some grounds for
inclusion of such a premium when estimating fair value.
Given this discussion on the need for credit and liquidity spreads, it seems almost paradoxical
that the bulk of the extant literature on OPM discusses the concept and applicability of
“replicating portfolios”. It is suggested that if a market price does not exist for an insurance
contract in its entirety but markets exist for securities that duplicate component parts of the
insurance contract, fair value may be constructed as the sum of the aggregate components. That
is, certainty equivalent interest rate sensitive cash flows may be discounted at the rates applicable
to Arrow-Debreu benchmark securities to avoid naïve estimation of an aggregate liability spread
for the contract. However, such techniques would, by earlier arguments, provide erroneous
results, given that the hypothetical benchmark securities are required by definition to be freely
traded in liquid asset markets. More precisely, by failing to incorporate additional discount
spread components for liquidity and default risk, the estimated value of the replicating portfolio
will exceed the fair value of the liability contract. Furthermore, given recent suggestions by
IAAust [1999] that replicating portfolios typically overvalue corporate bonds, it is likely that
discount rates derived from replicating portfolios will be lower than true OPM fair value rates for
insurance liabilities.
Amongst those who support an adjustment for credit risk, there remains contention as to whether
the default risk premium should be calculated as an industry wide amount or on an insurer-
specific basis. In the mergers and acquisitions market, sale of a liability to a third party
represents an accounting transfer from the balance sheet of one insurer to that of another. To this
end, it seems incongruous that the liability valuation should depend on either party’s credit
12
rating, especially in jurisdictions such as the USA, where life insurance liabilities are effectively
guaranteed by State guaranty funds. Moreover, even while the liabilities remain on a life
insurer’s books, any discounting of liability estimates due to the insurer’s individual credit rating
may be misleading in third party or regulatory solvency assessments. Girard [2000], does not
support an industry wide premium, however, claiming that such methodology fails the “no-gain-
no-loss” test. His reasoning is that a highly rated company will recognise a gain upon reinsuring
business to a lower rated company and vice-versa in the event that individual credit ratings are
not considered. In passing judgement Girard fails to recognise the true goal of liability fair
valuation, that is to define a measure that may readily be implemented both in liability sales and
on the balance sheet. In the event that fair valuation of liabilities is compulsorily required on
insurer’s balance sheets, a standardised industry credit rating is then the only means of obtaining
true comparability of equity. Indeed the amount paid in a merger or acquisition may well differ
from fair value, in that the purchase price will include synergistic benefits to the acquirer.
13
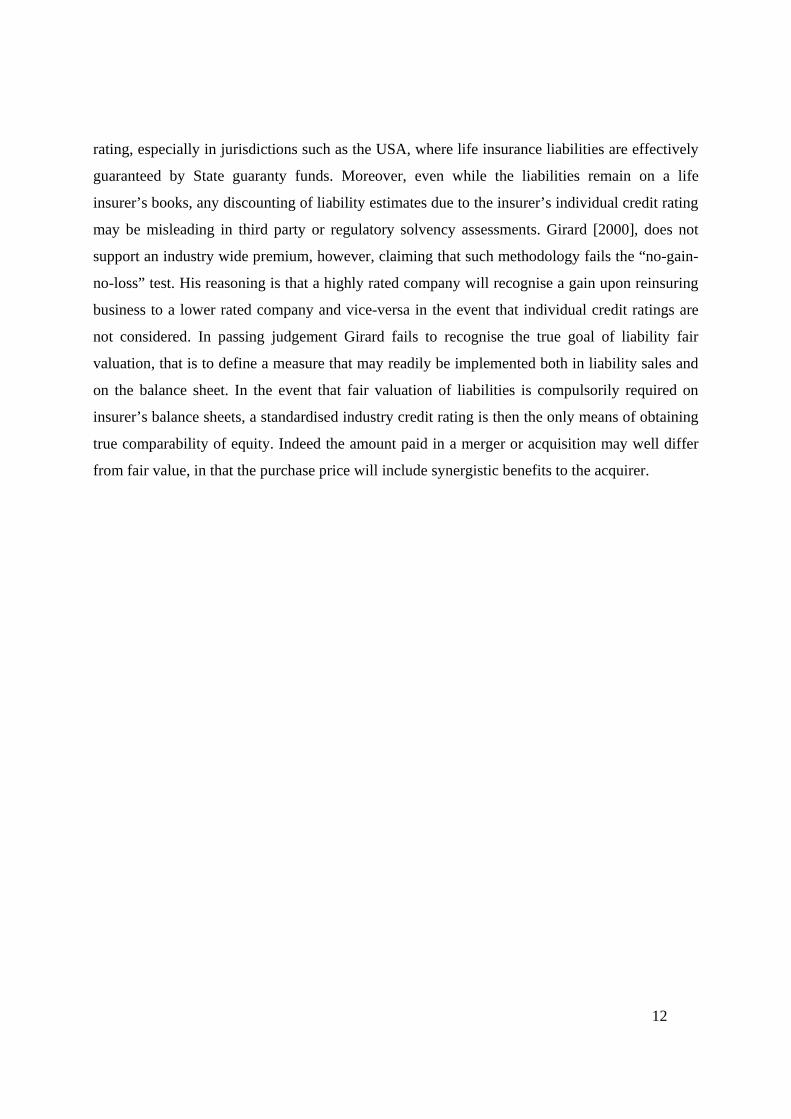
2(iv) Modelling the default risk premium; and the sensitivity of a fair valuation to changes in the
discount rate
To better understand the effect of accounting for individual credit risk in determining the fair
value of an insurer’s liabilities, sensitivity analysis was performed on the block of participating
whole of life policies described in Appendix 1. An EVM style valuation was employed, with the
liabilities and Required Profit margins estimated using Equation 2. Risk spreads, intended to
approximate those observed in the corporate bond market, were applied to the discount rate to
derive the fair value of liabilities for an AAA and BBB company. All other assumptions,
including risk profit components and market value of assets were held constant. The following
sensitivity table displays the results.
Table 2.4.1 Earned BBB AAA Risk-Free
Year 10 Discount Rate 7.5% 7.0% 6.3% 6.0%
FV Asset 6,453 6,453 6,453 6,453FV Liabilities 5,466 5,716 6,125 6,271
FV Equity 987 737 469 182
% of EVM Liabilities 100% 105% 112% 115%
% of EVM Equity 100% 75% 33% 18%
The incongruity discussed earlier bears out. The fair value of liabilities for a AAA company is
approximately 7% higher than that for a BBB company, holding the same block of business and
supporting assets. More disturbingly, the Fair Value of Equity for the company with the AAA
rating is over 50% lower than the equity of the BBB company. To the layman investor, simple
balance sheet investigation would imply the BBB company to be in the stronger financial
position.
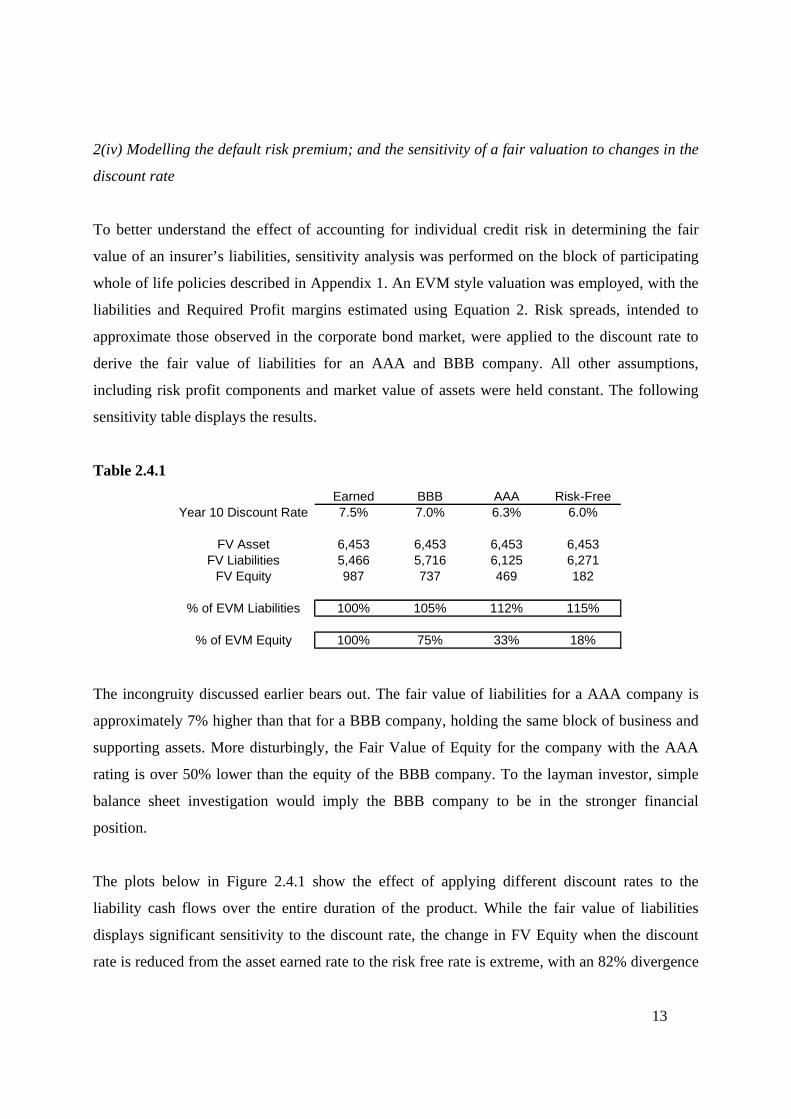
The plots below in Figure 2.4.1 show the effect of applying different discount rates to the
liability cash flows over the entire duration of the product. While the fair value of liabilities
displays significant sensitivity to the discount rate, the change in FV Equity when the discount
rate is reduced from the asset earned rate to the risk free rate is extreme, with an 82% divergence
14
in year 10. This high degree of sensitivity is attributable to the leveraging effect with FV Equity
calculated as a residual value, with an order of magnitude approximately one fifth of the FV
Liabilities.
15
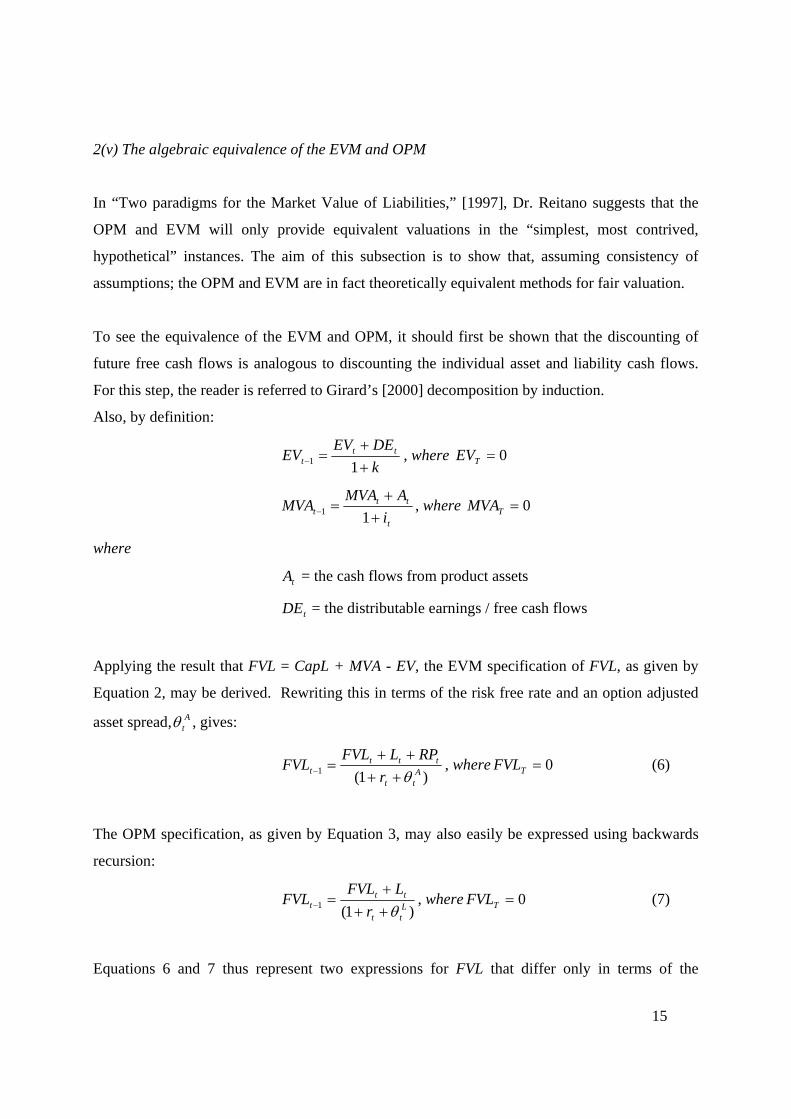
2(v) The algebraic equivalence of the EVM and OPM
In “Two paradigms for the Market Value of Liabilities,” [1997], Dr. Reitano suggests that the
OPM and EVM will only provide equivalent valuations in the “simplest, most contrived,
hypothetical” instances. The aim of this subsection is to show that, assuming consistency of
assumptions; the OPM and EVM are in fact theoretically equivalent methods for fair valuation.
To see the equivalence of the EVM and OPM, it should first be shown that the discounting of
future free cash flows is analogous to discounting the individual asset and liability cash flows.
For this step, the reader is referred to Girard’s [2000] decomposition by induction.
Also, by definition:
kDEEV
EV ttt +
+=− 11 , where 0=TEV
t
ttt i
AMVAMVA
++
=− 11 , where 0=TMVA
where
tA = the cash flows from product assets
tDE = the distributable earnings / free cash flows
Applying the result that FVL = CapL + MVA - EV, the EVM specification of FVL, as given by
Equation 2, may be derived. Rewriting this in terms of the risk free rate and an option adjusted
asset spread, Atθ , gives:
)1(1 A
tt
tttt r
RPLFVLFVL
θ++++
=− , where 0=TFVL (6)
The OPM specification, as given by Equation 3, may also easily be expressed using backwards
recursion:
)1(1 L
tt
ttt r
LFVLFVL
θ+++
=− , where 0=TFVL (7)
Equations 6 and 7 thus represent two expressions for FVL that differ only in terms of the
16
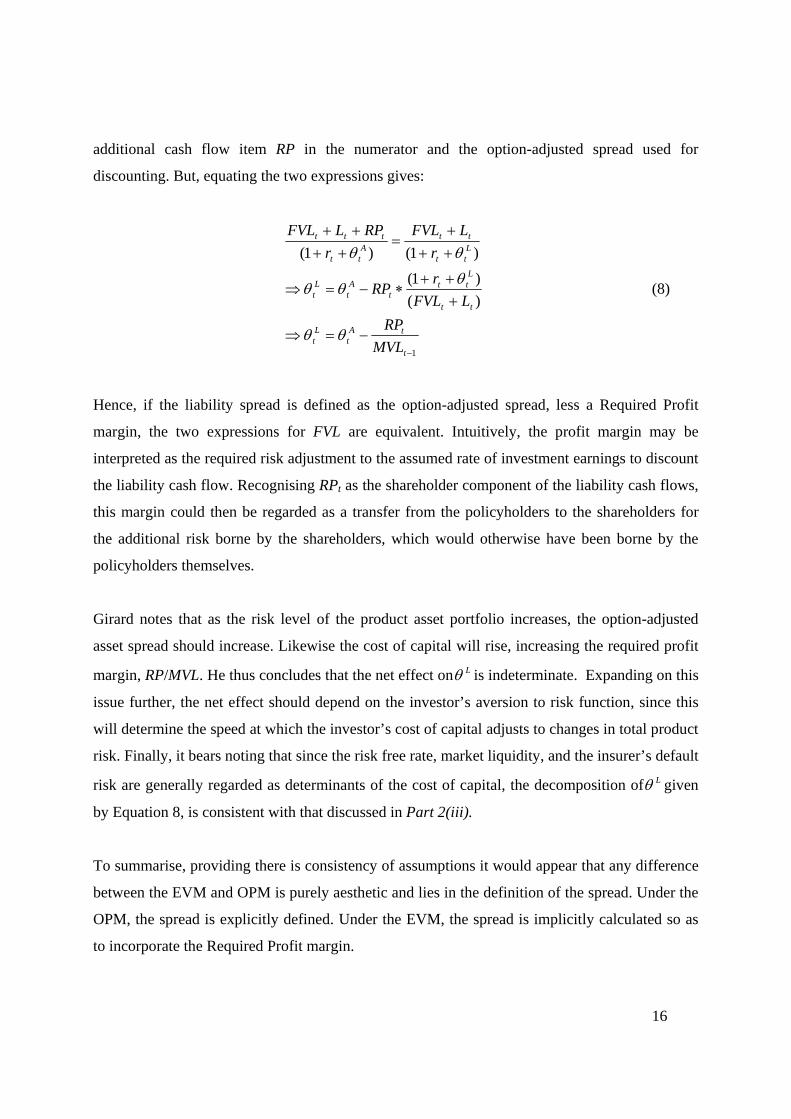
additional cash flow item RP in the numerator and the option-adjusted spread used for
discounting. But, equating the two expressions gives:
1
)()1(
)1()1(
−
−=⇒
+++
∗−=⇒
+++
=++++
t
tAt
Lt
tt
Ltt
tA
tLt
Ltt
ttA
tt
ttt
MVLRP
LFVLr
RP
rLFVL
rRPLFVL
θθ
θθθ
θθ
(8)
Hence, if the liability spread is defined as the option-adjusted spread, less a Required Profit
margin, the two expressions for FVL are equivalent. Intuitively, the profit margin may be
interpreted as the required risk adjustment to the assumed rate of investment earnings to discount
the liability cash flow. Recognising RPt as the shareholder component of the liability cash flows,
this margin could then be regarded as a transfer from the policyholders to the shareholders for
the additional risk borne by the shareholders, which would otherwise have been borne by the
policyholders themselves.
Girard notes that as the risk level of the product asset portfolio increases, the option-adjusted
asset spread should increase. Likewise the cost of capital will rise, increasing the required profit
margin, RP/MVL. He thus concludes that the net effect on Lθ is indeterminate. Expanding on this
issue further, the net effect should depend on the investor’s aversion to risk function, since this
will determine the speed at which the investor’s cost of capital adjusts to changes in total product
risk. Finally, it bears noting that since the risk free rate, market liquidity, and the insurer’s default
risk are generally regarded as determinants of the cost of capital, the decomposition of Lθ given
by Equation 8, is consistent with that discussed in Part 2(iii).
To summarise, providing there is consistency of assumptions it would appear that any difference
between the EVM and OPM is purely aesthetic and lies in the definition of the spread. Under the
OPM, the spread is explicitly defined. Under the EVM, the spread is implicitly calculated so as
to incorporate the Required Profit margin.
17
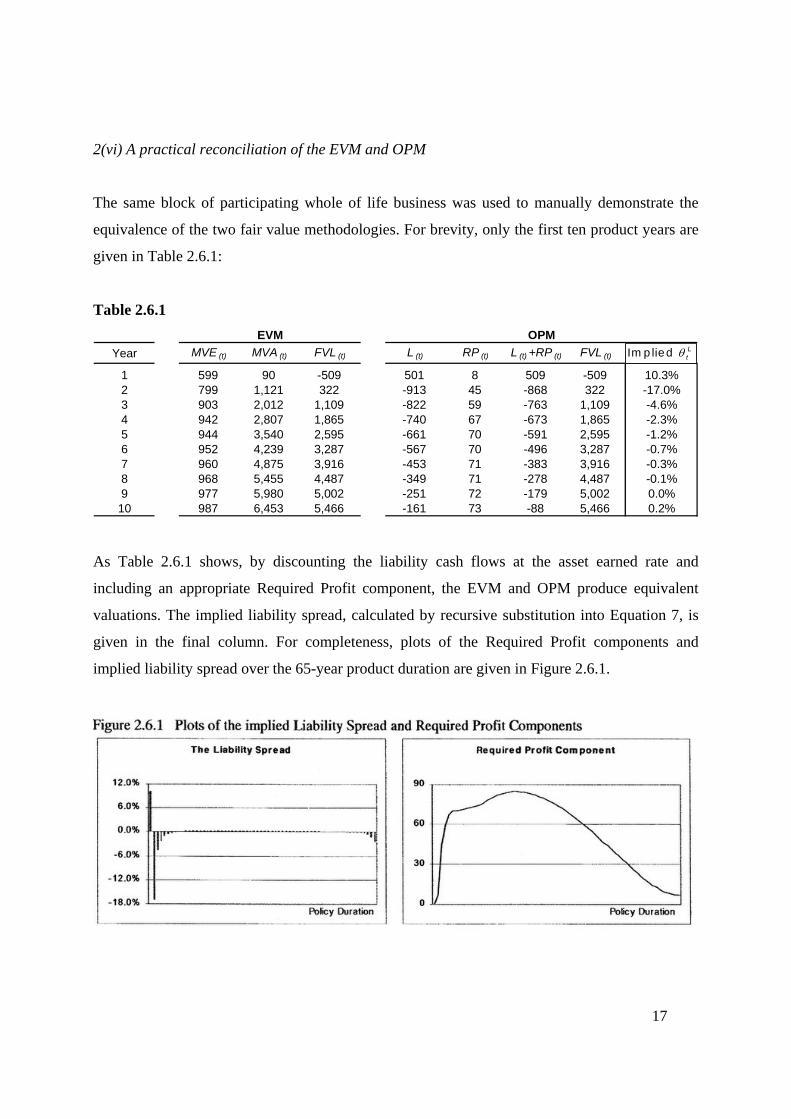
2(vi) A practical reconciliation of the EVM and OPM
The same block of participating whole of life business was used to manually demonstrate the
equivalence of the two fair value methodologies. For brevity, only the first ten product years are
given in Table 2.6.1:
Table 2.6.1
Year MVE (t) MVA (t) FVL (t) L (t) RP (t) L (t) +RP (t) FVL (t)
1 599 90 -509 501 8 509 -509 10.3%2 799 1,121 322 -913 45 -868 322 -17.0%3 903 2,012 1,109 -822 59 -763 1,109 -4.6%4 942 2,807 1,865 -740 67 -673 1,865 -2.3%5 944 3,540 2,595 -661 70 -591 2,595 -1.2%6 952 4,239 3,287 -567 70 -496 3,287 -0.7%7 960 4,875 3,916 -453 71 -383 3,916 -0.3%8 968 5,455 4,487 -349 71 -278 4,487 -0.1%9 977 5,980 5,002 -251 72 -179 5,002 0.0%10 987 6,453 5,466 -161 73 -88 5,466 0.2%
EVM OPMθIm p lied L
t
As Table 2.6.1 shows, by discounting the liability cash flows at the asset earned rate and
including an appropriate Required Profit component, the EVM and OPM produce equivalent
valuations. The implied liability spread, calculated by recursive substitution into Equation 7, is
given in the final column. For completeness, plots of the Required Profit components and
implied liability spread over the 65-year product duration are given in Figure 2.6.1.
18
Analysis of the liability spread is anything but enlightening with the spread following no obvious
pattern or time trend. The large positive spread in the first year is intuitively consistent with the
high risk of policy launch, but this is followed by five years of significant negative spreads.
Interestingly a period of stability is reached for the bulk of the product duration with an average
spread of circa 1%.
The obvious implication to be drawn from the liability spread plot is that, despite their algebraic
equivalence, the EVM and OPM are unlikely to be reconciled in practice under Girard’s
specifications. Reitano’s conclusion bears weight, at least in practice if not in theory. A priori the
pattern of liability spreads is unpredictable, which leads one to the conclusion that working with
explicit risk capital charges is preferable to incorporating all risk charges in the liability spread.
Consideration of the assumptions used in the model reveals two obvious deficiencies, which may
be creating the bizarre spread pattern. Firstly, the assumed constant asset spread of 1.5% might
better be set as time dependent. Secondly, the cost of capital could be modelled as leverage
adjusted and/or time and interest-rate dependent.
Further more detailed studies of fair value would do well to examine the impact of such
adjustments.
19
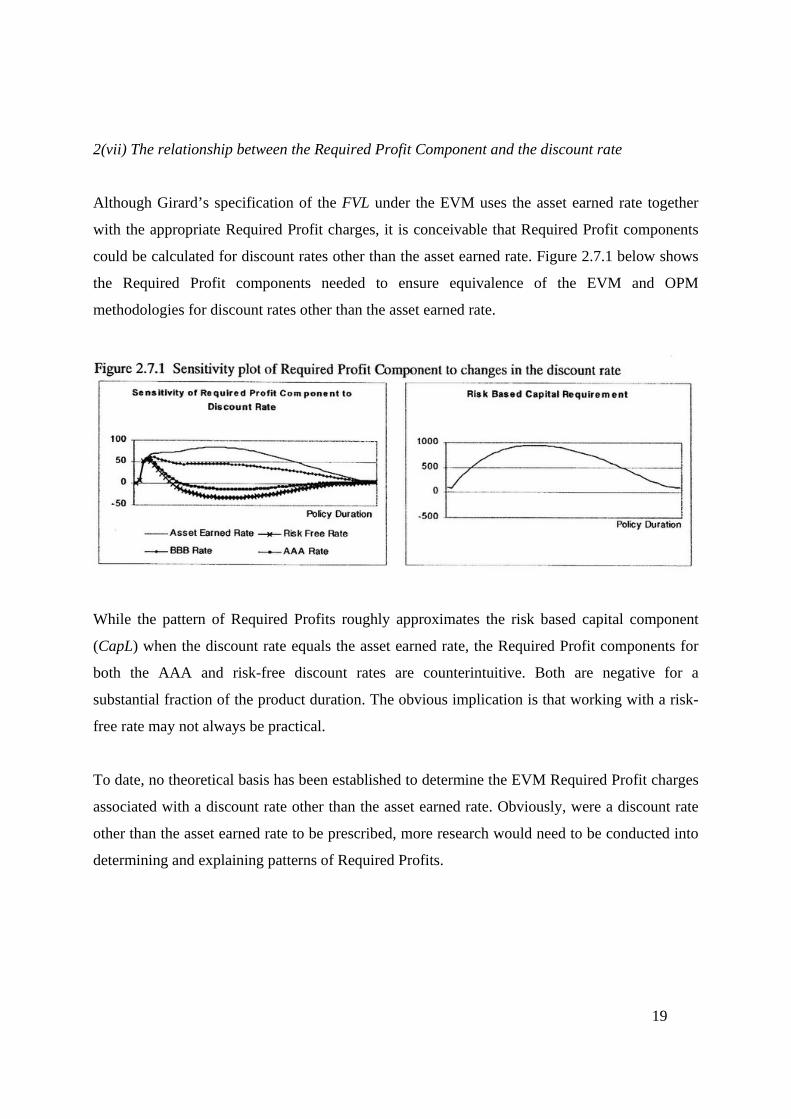
2(vii) The relationship between the Required Profit Component and the discount rate
Although Girard’s specification of the FVL under the EVM uses the asset earned rate together
with the appropriate Required Profit charges, it is conceivable that Required Profit components
could be calculated for discount rates other than the asset earned rate. Figure 2.7.1 below shows
the Required Profit components needed to ensure equivalence of the EVM and OPM
methodologies for discount rates other than the asset earned rate.
While the pattern of Required Profits roughly approximates the risk based capital component
(CapL) when the discount rate equals the asset earned rate, the Required Profit components for
both the AAA and risk-free discount rates are counterintuitive. Both are negative for a
substantial fraction of the product duration. The obvious implication is that working with a risk-
free rate may not always be practical.
To date, no theoretical basis has been established to determine the EVM Required Profit charges
associated with a discount rate other than the asset earned rate. Obviously, were a discount rate
other than the asset earned rate to be prescribed, more research would need to be conducted into
determining and explaining patterns of Required Profits.
20
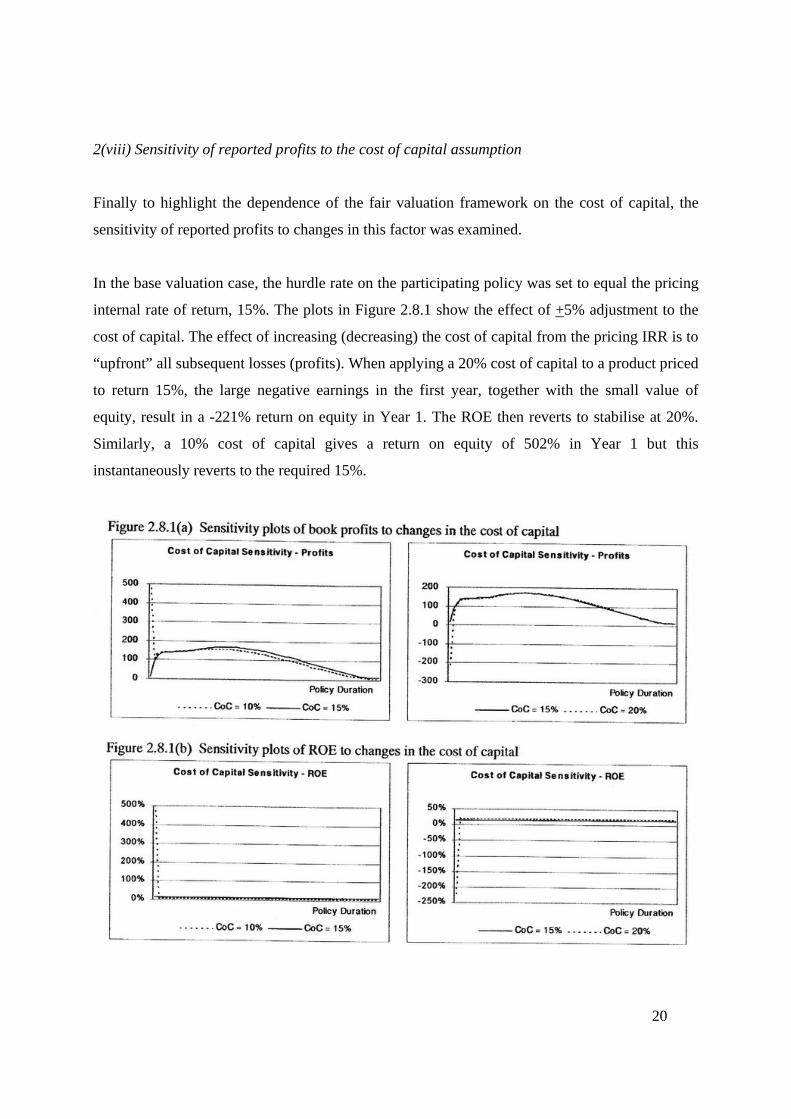
2(viii) Sensitivity of reported profits to the cost of capital assumption
Finally to highlight the dependence of the fair valuation framework on the cost of capital, the
sensitivity of reported profits to changes in this factor was examined.
In the base valuation case, the hurdle rate on the participating policy was set to equal the pricing
internal rate of return, 15%. The plots in Figure 2.8.1 show the effect of +5% adjustment to the
cost of capital. The effect of increasing (decreasing) the cost of capital from the pricing IRR is to
“upfront” all subsequent losses (profits). When applying a 20% cost of capital to a product priced
to return 15%, the large negative earnings in the first year, together with the small value of
equity, result in a -221% return on equity in Year 1. The ROE then reverts to stabilise at 20%.
Similarly, a 10% cost of capital gives a return on equity of 502% in Year 1 but this
instantaneously reverts to the required 15%.
21
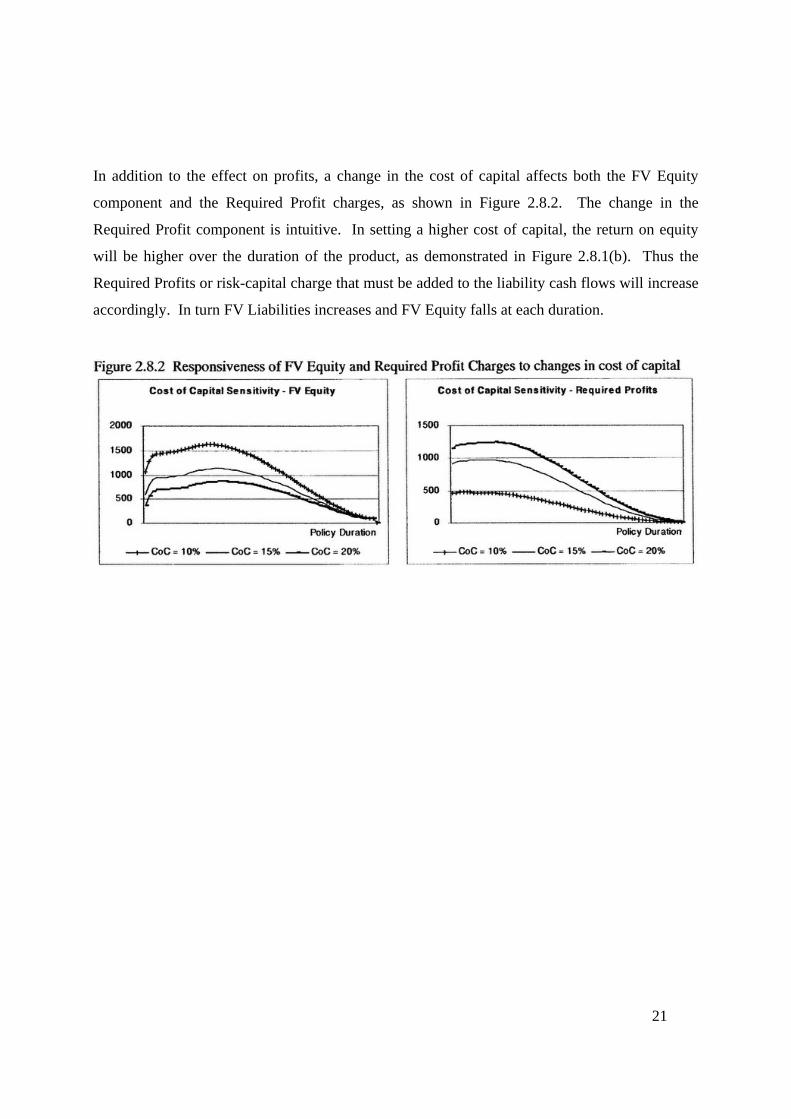
In addition to the effect on profits, a change in the cost of capital affects both the FV Equity
component and the Required Profit charges, as shown in Figure 2.8.2. The change in the
Required Profit component is intuitive. In setting a higher cost of capital, the return on equity
will be higher over the duration of the product, as demonstrated in Figure 2.8.1(b). Thus the
Required Profits or risk-capital charge that must be added to the liability cash flows will increase
accordingly. In turn FV Liabilities increases and FV Equity falls at each duration.
22
Part 3 - Conclusions
The IASC has received countless responses to its Issues Paper “Insurance”, the majority of
which recognise the need for a liability valuation framework that is consistent with market value
asset measurement. However, the IASC’s avocation of a “fair value” measurement basis remains
highly contentious.
This paper has examined two fair valuation techniques, the embedded value approach and the
options pricing methodology. Where the latter is a constructive approach to valuation, the former
uses a deductive methodology. The key difference between the two methodologies lies in the
treatment of risk. EVM valuations employ explicit required profit margins, while under a pure
OPM valuation, all risk is implicitly incorporated via the liability discount spread. In practice, a
hybrid OPM/EVM style valuation is usually preferred. Although reconcilable in theory, the
practical equivalence of the two fair valuation techniques remains in question given the
unforeseeable pattern of observed OPM liability spreads at policy issue.
In examining the fair value framework, the paper highlights the subjectivity of such valuation
methodologies. Analysis undertaken demonstrates the volatility of fair value equity and earnings
valuations in response to changes in the discount rate, cost of capital and default risk. While the
pricing of non-systematic risk is argued as desirable in estimating a life insurance liability’s fair
value, it is found that accounting for entity-specific credit risk produces incongruities in the
financial statements. An industry wide default risk factor is deemed necessary for financial
statement comparability.
Ultimately, in selecting a liability valuation basis it is important to consider the purpose and
users of the resultant financial statements. Although a market valuation basis for liabilities is
conceptually desirable, the illiquidity of the insurance market suggests such an objective is not
practicable, at least not in the foreseeable future. Until reinsurance or insurance merger and
acquisition markets develop sufficiently to determine appropriate valuation parameters, reporting
bases which limit the scope for judgement, will most likely be of greater use to regulators and
individual investors in assessing a life company’s worth.
23
References Standards and Regulatory Documents Australian Accounting Standard 1038, Life Insurance Business, Australian Accounting Standards Board, November 1998. Actuarial Standard 1.02, Valuation Standard, Life Insurance Actuarial Standards Board, September 1999. Financial Accounting Standards Board Statement No 115, Accounting for Certain Investments in Debt and Equity Securities, Financial Accounting Standards Board, May 1993. Guidance Note 252, Actuarial Appraisals of Life Insurance Business, Institute of Actuaries of Australia, November 1993. Guidance Note 253, Determination of Life insurance Policy Liabilities, Institute of Actuaries of Australia, September 1993. International Accounting Standard No 32, Financial Instruments: Disclosure and Presentation, International Accounting Standards Committee, (Rev) June 1999. International Accounting Standard No 39, Financial Instruments: Recognition and Measurement, International Accounting Standards Committee, December 1998. Journal Articles and Texts Atkins, G. et al. (1993) Convention Alice Springs 1993: Financial Reporting. Institute of Actuaries of Australia, 11-14. Babbel, D. and Merrill, C. (1998) Economic Valuation Models for Insurers. North American Actuarial Journa4 2:3, 1-17. Becker, D.N. The Value of the Firm: the Option Adjusted Value of Distributable Earnings. The Fair Value of Life Insurance Liabilities, New York, Kiuwer Academic Publishers, 215-287. Dicke, A. (1999) Comparison of Methods for Fair Value Life Insurance Liabilities. The Fair Value of Life Insurance Liabilities, New York, Kiuwer Academic Publishers, 7-113. Doll, D. et al. (1998) Fair Value of Life Insurance Liabilities. The Fair Value of Life Insurance Liabilities, New York, Kiuwer Academic Publishers, 21-113. Girard, L. (2000) Market Value of Insurance Liabilities: Reconciling the Actuarial Appraisal and Option Pricing Methods. North American Actuarial Journal, 4:1, 31-62.
24
Martin, G. and Tsui, D. (1999) Fair Value Liability Valuations. Australian Actuarial Journal, 5:3, 351-457. Merton, R. (1974) On the Pricing of Corporate Debt: The Risk Structure of Interest Rates. Journal of Finance, 29, 449-470. O’Brien, C.D. (1999) The Derivation and Application of Accounting Standards to the Market Value of Liabilities, The Fair Value of Life Insurance Liabilities, New York, Kluwer Academic Publishers, 303-330. Philbrick, S. (2000) Accounting for Risk Margins, Casualty Actuarial Society Research 2000, http://www.casact.org/library/reserves/94spf1.pdf. Reitano, R. (1997) Two Paradigms for the Market Value of Liabilities. North American Actuarial Journal, 1:4, 104-137. Thomson, A. (1994) Financial Reporting of Life Insurance Activities. Australian Accounting Research Foundation Discussion Paper No 19, Australia, Shannon Press. Wilkins, R. (1998) Background on fair value accounting of insurance company assets and liabilities. The Fair Value of Life Insurance Liabilities, New York, Kluwer Academic Publ, 1-6. Institute Publications Casualty Actuarial Society Task Force on Fair Value Liabilities (2000) White Paper on Fair Valuing Property/Casualty Insurance Liabilities, www.casact.org. Casualty Actuarial Society Committee on Theory of Risk (2000) The Risk Premium Project Phase I and II Report, www.casact.org. Institute of Actuaries of Australia (2000) Valuation of Risk Adjusted Cash Rows and the Setting of Discount Rates — Theory and Practice, www.actuaries.org. Institute of Actuaries of Australia (2000) Response to the IASC’s Steering Committee on Insurance. The Issues Paper on Insurance, www.actuaries.asn.au. Institute of Actuaries of Australia (2000) Discussion Note 1 : IASC Insurance Accounting Project - Fair Value Methods, www.actuaries.asn.au. Institute of Actuaries of Australia (2000) Discussion Note 2: IASC Insurance Accounting Project - Fair Value Assumptions, www.actuaries.asn.au. International Accounting Standards Committee (1999) Insurance: An Issues Paper Issued for Comment by the Steering Committee on Insurance, Vol 1-2.
25
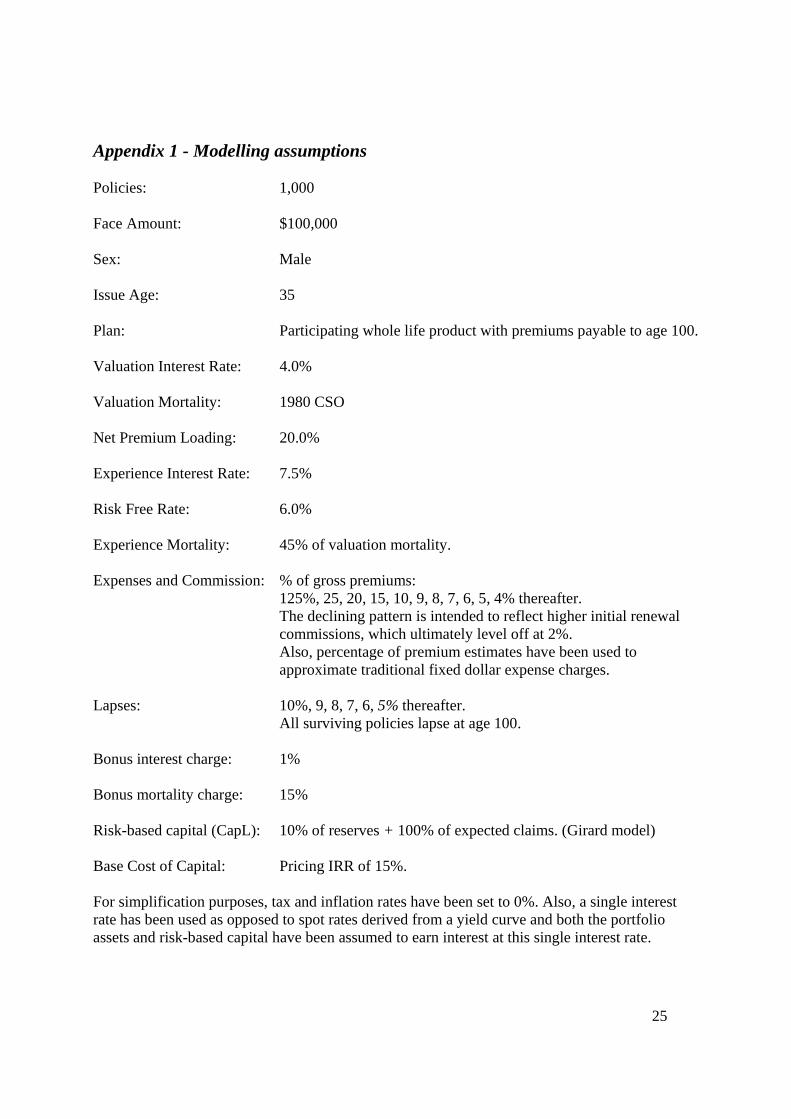
Appendix 1 - Modelling assumptions Policies: 1,000 Face Amount: $100,000 Sex: Male Issue Age: 35 Plan: Participating whole life product with premiums payable to age 100. Valuation Interest Rate: 4.0% Valuation Mortality: 1980 CSO Net Premium Loading: 20.0% Experience Interest Rate: 7.5% Risk Free Rate: 6.0% Experience Mortality: 45% of valuation mortality. Expenses and Commission: % of gross premiums:
125%, 25, 20, 15, 10, 9, 8, 7, 6, 5, 4% thereafter. The declining pattern is intended to reflect higher initial renewal commissions, which ultimately level off at 2%. Also, percentage of premium estimates have been used to approximate traditional fixed dollar expense charges.
Lapses: 10%, 9, 8, 7, 6, 5% thereafter. All surviving policies lapse at age 100.
Bonus interest charge: 1% Bonus mortality charge: 15% Risk-based capital (CapL): 10% of reserves + 100% of expected claims. (Girard model) Base Cost of Capital: Pricing IRR of 15%. For simplification purposes, tax and inflation rates have been set to 0%. Also, a single interest rate has been used as opposed to spot rates derived from a yield curve and both the portfolio assets and risk-based capital have been assumed to earn interest at this single interest rate.
26
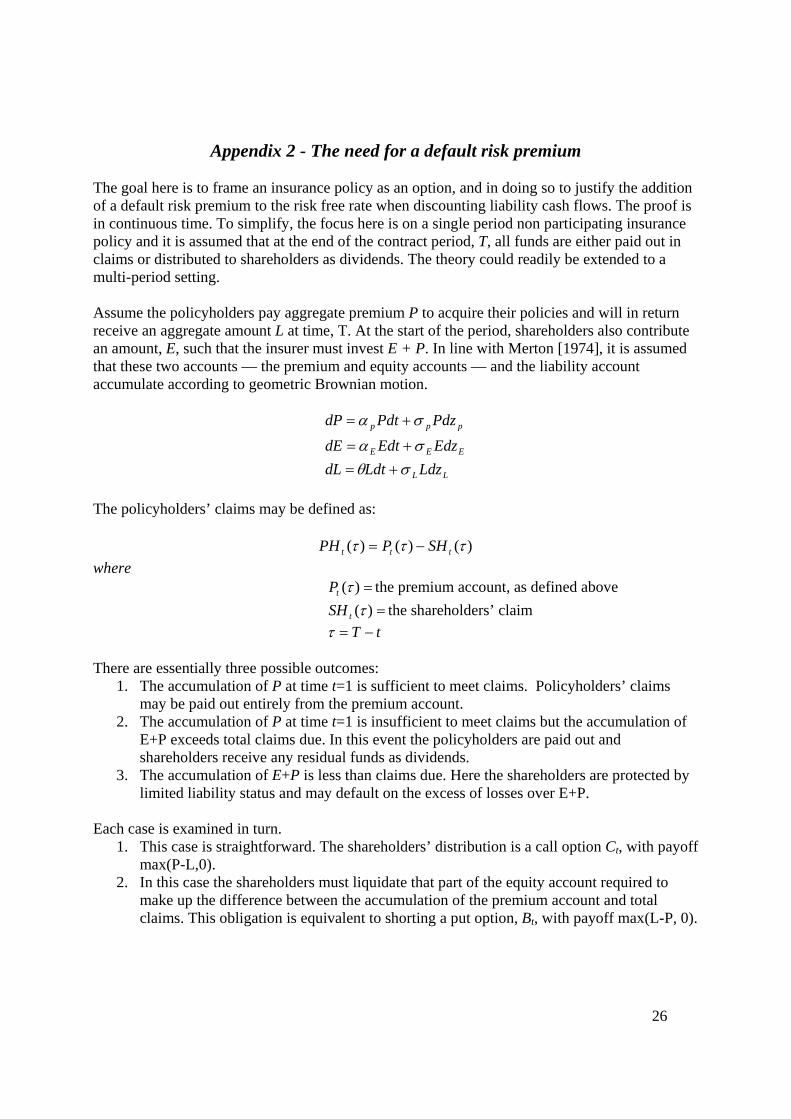
Appendix 2 - The need for a default risk premium The goal here is to frame an insurance policy as an option, and in doing so to justify the addition of a default risk premium to the risk free rate when discounting liability cash flows. The proof is in continuous time. To simplify, the focus here is on a single period non participating insurance policy and it is assumed that at the end of the contract period, T, all funds are either paid out in claims or distributed to shareholders as dividends. The theory could readily be extended to a multi-period setting. Assume the policyholders pay aggregate premium P to acquire their policies and will in return receive an aggregate amount L at time, T. At the start of the period, shareholders also contribute an amount, E, such that the insurer must invest E + P. In line with Merton [1974], it is assumed that these two accounts — the premium and equity accounts — and the liability account accumulate according to geometric Brownian motion.
LL
EEE
ppp
LdzLdtdLEdzEdtdE
PdzPdtdP
σθσα
σα
+=+=
+=
The policyholders’ claims may be defined as:
)()()( τττ ttt SHPPH −= where
=)(τtP the premium account, as defined above =)(τtSH the shareholders’ claim tT −=τ
There are essentially three possible outcomes: 1. The accumulation of P at time t=1 is sufficient to meet claims. Policyholders’ claims
may be paid out entirely from the premium account. 2. The accumulation of P at time t=1 is insufficient to meet claims but the accumulation of
E+P exceeds total claims due. In this event the policyholders are paid out and shareholders receive any residual funds as dividends.
3. The accumulation of E+P is less than claims due. Here the shareholders are protected by limited liability status and may default on the excess of losses over E+P.
Each case is examined in turn.
1. This case is straightforward. The shareholders’ distribution is a call option Ct, with payoff max(P-L,0).
2. In this case the shareholders must liquidate that part of the equity account required to make up the difference between the accumulation of the premium account and total claims. This obligation is equivalent to shorting a put option, Bt, with payoff max(L-P, 0).
27
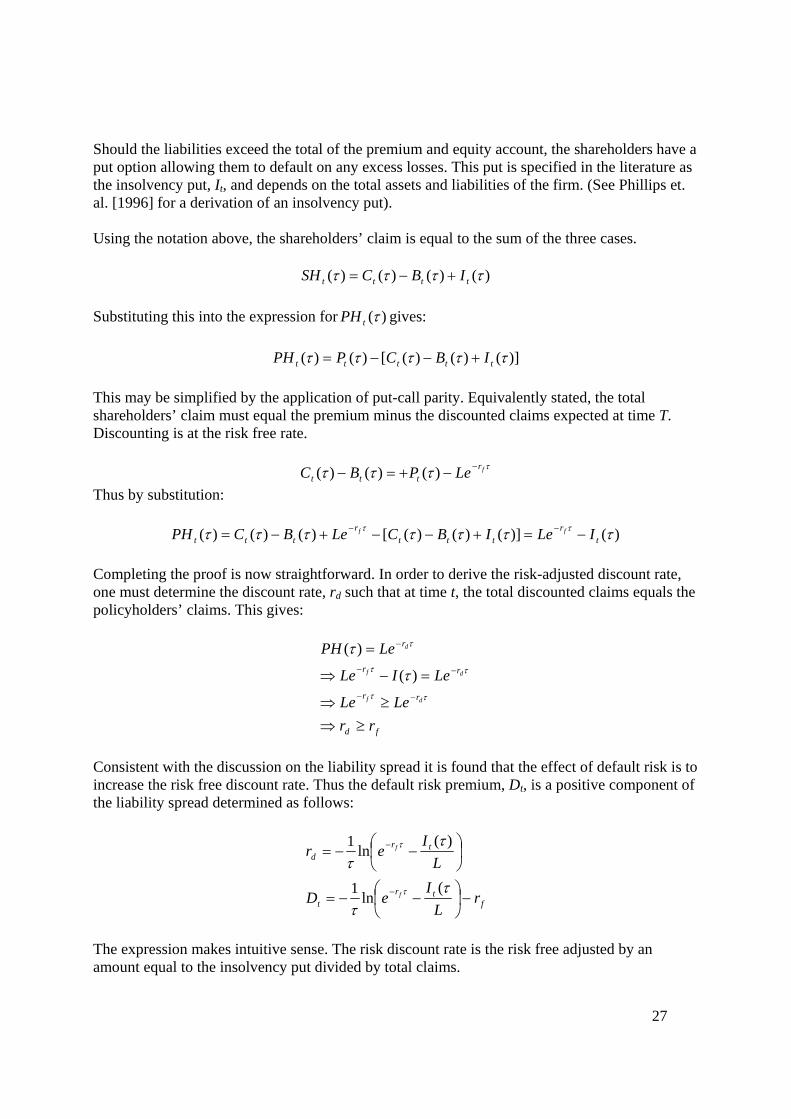
Should the liabilities exceed the total of the premium and equity account, the shareholders have a put option allowing them to default on any excess losses. This put is specified in the literature as the insolvency put, It, and depends on the total assets and liabilities of the firm. (See Phillips et. al. [1996] for a derivation of an insolvency put). Using the notation above, the shareholders’ claim is equal to the sum of the three cases.
)()()()( ττττ tttt IBCSH +−= Substituting this into the expression for )(τtPH gives:
)]()()([)()( τττττ ttttt IBCPPH +−−= This may be simplified by the application of put-call parity. Equivalently stated, the total shareholders’ claim must equal the premium minus the discounted claims expected at time T. Discounting is at the risk free rate.
ττττ frttt LePBC −−+=− )()()(
Thus by substitution:
)()]()()([)()()( τττττττ ττt
rttt
rttt ILeIBCLeBCPH ff −=+−−+−= −−
Completing the proof is now straightforward. In order to derive the risk-adjusted discount rate, one must determine the discount rate, rd such that at time t, the total discounted claims equals the policyholders’ claims. This gives:
fd
rr
rr
r
rrLeLe
LeILe
LePH
df
df
d
≥⇒≥⇒
=−⇒
=
−−
−−
−
ττ
ττ
τ
τ
τ
)(
)(
Consistent with the discussion on the liability spread it is found that the effect of default risk is to increase the risk free discount rate. Thus the default risk premium, Dt, is a positive component of the liability spread determined as follows:
ftr
t
trd
rL
IeD
LI
er
f
f
−⎟⎠⎞
⎜⎝⎛ −−=
⎟⎠⎞
⎜⎝⎛ −−=
−
−
ττ
ττ
τ
τ
(ln1
)(ln1
The expression makes intuitive sense. The risk discount rate is the risk free adjusted by an amount equal to the insolvency put divided by total claims.