Embed Size (px)
Citation preview

Journal of Forest Economics 18 (2012) 218–241
Contents lists available at SciVerse ScienceDirect
Journal of Forest Economics
journa l homepage: www.e lsev ier .de / j fe
The fall and the fragmentation of national clusters: Clusterevolution in the paper and pulp industry�
Joonas Järvinena,∗, Juha-Antti Lambergb, Lauri Pietinalhoa
a Department of Industrial Engineering and Management, School of Science, Aalto University, Finlandb Strategy and Economic History Program, University of Jyväskylä, Finland
a r t i c l e i n f o
Article history:Received 30 August 2011Received in revised form 22 April 2012Accepted 27 April 2012
Keywords:Cluster evolutionCluster vitalityGlobal competitionStrategyFuzzy set analysisPaper industryTechnology service business
a b s t r a c t
A common expectation in evolutionary cluster studies is thatnational clusters engage in competitive interactions that lead toa continuous stream of changes in global dominance. Our fuzzy-setanalysis on the evolution of the paper and pulp industry demon-strates that globalization has dramatically changed this situation.National clusters have largely faded away; the value chain dom-inance is now held by technology suppliers who are global hubsin majority of identifiable business activities in the focal industry.Our results imply that when industrial decline is accentuated byindustrial concentration in some part of the value chain the nationalclusters may lose their importance.
© 2012 Department of Forest Economics, Swedish University ofAgricultural Sciences, Umeå. Published by Elsevier GmbH.
All rights reserved.
Introduction
Starting with Porter’s (1990) pioneering works in cluster studies, broad understanding has emergedon the factors that are necessary for well-functioning clusters. In the relevant literature, such factorshave been listed as including the basic economy of the industry (factor conditions, demand conditions,related and supporting industries; Porter, 1990); the institutional and legislative environment (e.g.,Mowery and Nelson, 1999); entrepreneurial resources (e.g., St. John and Pouder, 2006); competitive
� We gratefully acknowledge the comments received at the 2009 Academy of Management, and 2010 ISA meetings. Also, weare thankful for Kimmo Alajoutsijärvi, Kalle Pajunen and Henrikki Tikkanen for their comments and suggestions.
∗ Corresponding author.E-mail address: [email protected] (J. Järvinen).
1104-6899/$ – see front matter © 2012 Department of Forest Economics, Swedish University of Agricultural Sciences, Umeå. Published by Elsevier GmbH.All rights reserved.
http://dx.doi.org/10.1016/j.jfe.2012.04.002

J. Järvinen et al. / Journal of Forest Economics 18 (2012) 218–241 219
dynamics and density in the focal population (e.g., Hannan and Freeman, 1989); technological andacademic knowhow (e.g., Pinch et al., 2003); government policies (e.g., Sölvell et al., 2003); geograph-ical position (e.g., Audia et al., 2006) and proximity to information; and complementary relationshipsamong industries and complete infrastructure (e.g., St. John and Pouder, 2006). Accordingly, we havea list of factors that explain the success of some specific clusters. However, far less is known of howand why these factors function in the periods of decline and dethronement of clusters (see Ketchenet al., 2004); and if all of these factors are necessary antecedents of success or only some specificconfigurations (Pajunen, 2008).
A helpful angle on the competitive dynamics of regional (and also national) clusters is to see the riseand the decline of clusters as evolutionary processes. A common expectation in evolutionary clusterstudies (e.g., Pouder and St. John, 1996) is that national clusters engage in competitive interactionsthat lead to a continuous stream of changes in global dominance. Starting from classic path depen-dence (Arthur, 1989) and dominant design studies (e.g., Tushman and Anderson, 1986), scholars havedemonstrated how previously dominant clusters come more inert and less able to adapt to changingcompetitive dynamics, whereas new entrants use their ability to innovate to challenge the status quo.Overall, the idea is that cluster X loses its vitality along with a number of factors (see above), is chal-lenged by cluster Y (and sometimes also Z) that would subsequently introduce some new model ofcompetition leading to a new dominant position.
Our longitudinal network analysis demonstrates that globalization has dramatically challengedthe explanatory power of both the (more static) cluster models and (more dynamic) evolutionarymodels. Building on our exploratory work, we argue that the main difference vis-à-vis earlier timeperiods is changing dynamics along the global value chain: actors do not ‘globalize’ at equal speedsand depth, which leads to dramatically altered network structure both regionally and globally. Ourresults imply that when industrial decline is accentuated by industrial concentration in some part ofthe value chain national clusters may lose their importance. At minimum, when the consequences ofvalue-chain globalization materialize, only those clusters which have the densest links between theiractors may prosper.
Our primary interest is in the global network structure and industry evolution in the paper andpulp industry. Historically, previously dominant clusters of paper industry companies together withpaper machine producers and the chemical industry in the UK, lost their position to German and USclusters (roughly in the 1920s), which then were replaced by Scandinavian clusters in the 1980s and1990s (see Järvinen et al., 2009). Keeping this historical background in mind, our interest is in thedramatic change in the 1990s and early 2000: national clusters have largely faded away; the valuechain dominance is now held by Finnish and German machine producers who are global hubs inthe majority of identifiable business activities in paper industry. Our analysis is based on a datasetcontaining over 900 inter-organizational collaboration deals and major transactions (including newpaper or pulp machine installations and paper or pulp machine modernization projects) among some230 industry participants.
Our main theoretical take-away is the understanding of how unequal geographic expansion (or“globalization”) along the value chain dramatically affects national clusters. We posit that instead ofendogenous growth dynamics, we may now see the competitiveness of clusters primarily determinedon a global scale. That said, a cluster’s level of vitality (i.e. its ability to survive and maintain a highlevel of activity) becomes a deciding factor in the survival of national clusters. Our theoretical andempirical work clearly indicates that the level of vitality is a result of emergent properties (number ofactors, technological competencies, etc.) rather than public policy interventions. These findings alsooffer lessons for business executives and policy makers (especially) in the era of industrial decline andfundamental change in business logic.
Theoretical background
Clusters have an important role in economic development both at the national and regional levels(Porter, 1998). Generally, the literature related to clusters has offered a large amount of evidence ofthe positive effects of clusters, particularly on the performance of the firms therein (Baptista, 2000;Klepper, 2007; Swann et al., 1998). A considerable number of studies have also investigated the factors

220 J. Järvinen et al. / Journal of Forest Economics 18 (2012) 218–241
leading to this difference between clustered and non-clustered firms, as well as the factors that are nec-essary to create cluster-level success or vitality. One of the earliest and most prominent contributionsof the latter type of research is that of Porter (1990), who suggested that factor conditions, demandconditions, related and supporting industries, and the strategies, structures, and rivalries of the firmsin the cluster were the most important factors of cluster-level vitality. Other related studies haveemphasized the importance of factors like institutional and legislative environment (e.g., Moweryand Nelson, 1999); cluster life cycle (e.g., Menzel and Fornahl, 2010; ter Wal and Boschma, 2007);competitive dynamics and density in the focal population (e.g., Hannan and Freeman, 1989); techno-logical and academic knowhow (e.g., Pinch et al., 2003); government policies (e.g., Sölvell et al., 2003);geographical position (e.g., Audia et al., 2006) and proximity to information; and complementaryrelationships among industries and complete infrastructure (e.g., St. John and Pouder, 2006).
Based on earlier research in cluster studies and the evolutionary field, we may identify five highlyinterrelated important factors which potentially affect cluster vitality. These are (1) production and(2) demand factors related to the industrial cluster in question, (3) density of firms in the cluster,(4) phase of the life-cycle of the industrial cluster, and (5) value chain architecture of the cluster. Inthe following sections we open up the factors and discuss the role of each with regard to the clustervitality.
Cluster vitality
Following Porter’s original definition, cluster vitality can be defined as a cluster’s ability to surviveand maintain a high level of activity (cf., Porter and Stern, 2002). Cluster vitality is as a twin conceptto competitive advantage, with the important exception that vitality means success in the form ofeconomic and social benefits serving the surrounding society, whereas competitive advantage meansrelative competitiveness compared to other clusters. The distinction is important, as competitionitself is an important mechanism in firm-level evolution yet competition between clusters is a farmore ambiguous phenomenon. Paul Krugman, in his provocative manner, sees competition betweeneconomic regions as a “dangerous obsession” (Krugman, 1994: 41), referring to the obscure natureof competition in economic geography. That is, economic development should not be seen as a “zerosum game” but as an endogenous property of a region (or cluster). The difference between vitality andcompetitiveness manifests in the ways they have been measured. Some of the suggested measuresfor competitive advantage include international trade performance (Porter, 1990); overall averagewage (Porter, 2003); employment growth (Clancy et al., 2001; Porter, 2003); patenting (Porter, 2003);and rate of growth of exports or change in balance of trade (Clancy et al., 2001). In contrast, clustervitality has been related to such measures as the total number of employees (Menzel and Fornahl,2010); number of network ties (Powell et al., 1996); or the level of academic knowledge (Murmann,2003).
A high level of activity has been found to be an important antecedent of innovativeness in a region orcluster (see e.g., Owen-Smith et al., 2002), but in general, both factors can be considered to positivelyaffect each other and result in a high level of cluster vitality. For example, a comparative study ofOwen-Smith et al. (2002) in the context of biotechnology clusters shows that one of the causes for thesuccess of the U.S. biotechnology industry in comparison to its European counterpart is the fact thatthe innovation upstream networks in the U.S. industry are considerable larger and more diverse thantheir counterparts in Europe. Thus, it is not only a high level of network activity that is important, butthe heterogeneity and diversity of the ties (i.e., different types of actors collaborate with each other indifferent types of ways).
Production and demand factors
Production and demand factors have a central role in Porter’s (1990) theory of cluster vitality. First,with regard to the production factors or factor conditions, Porter (1990) further divides them to ‘basicfactors’ (such as natural resources, climate, location, and demographics) and ‘advanced factors’ (suchas communications infrastructure, sophisticated skills, and research facilities). According to Porter(1990), advanced factors are the most significant for cluster vitality; unlike factors whose supply
J. Järvinen et al. / Journal of Forest Economics 18 (2012) 218–241 221
depends upon exogenous ‘endowment’, advanced factors are a product of investment by individuals,companies, and governments. However, the importance of many of the production factors variesaccording to the type of cluster in question (e.g., based on an industry).
Second, by definition, demand factors are essential for the vitality of any cluster because theycreate the market for the products or services of the firms in the cluster. Within the framework, Porterplaces particular emphasis on the role of home demand in providing the impetus for cluster vitality.Because firms are typically most sensitive to the needs of their closest customers, the characteristicsof home demand are particularly important in shaping the differentiation attributes of domesticallymade products and in creating pressures for innovation and quality.
Density and cluster life-cycle
Recent theoretical articles on cluster evolution (e.g., Menzel and Fornahl, 2010; Pouder and St.John, 1996; ter Wal and Boschma, 2007) suggest that both the cluster life-cycle and the industry life-cycle (measured by population density) may be closely related to the vitality of a cluster. First, withregard to the central arguments of the articles, Pouder and St. John (1996) develop a theoretical evo-lutionary life-cycle model that contrasts the same industry competitors operating in clusters (in theirlanguage hot-spots) to those operating outside. They divide the cluster evolution into three phases:(1) origination, (2) convergence of clustered firms, and (3) firm reorientation, which includes a declinein the performance of the cluster. During these phases, the model suggests, geographical clusteringmay lead to resource arrangements and costs, mental models, and patterns of competitive behaviorthat create a deep structure within the cluster. The result is two separate paths for clustered andnon-clustered competitors: initially, clustered firms experience resource cost and access advantages,heightened competitor awareness, and enhanced legitimacy, which allow the cluster to dominateindustry growth and innovation, leading to ‘hot spot’ identity. Over time, however, the clustered firmsbegin to experience resource diseconomies, insular competitive practices, less frequent innovation,and lost dominance in the industry.
Second, Menzel and Fornahl (2010) introduce their cluster life-cycle model, with the following fourphases: emergence, growth, sustainment, and decline. In particular, in the decline phase of the cluster,Menzel and Fornahl argue that the cluster has been negatively locked into its previously successfuldevelopment path. Further, they suggest that the reason for this type of lock-in lies not only in theexhausted regional trajectory, but also in the long-existing, closed, and homogenous networks, whichare unable to renew the cluster by integrating new and often external knowledge. A declining clusterhas therefore lost the ability to sustain its diversity, its ability to adjust to changing conditions, and itspotential for an independent renewal.
Third, ter Wal and Boschma (2007) identify four phases of industry evolution, along with whichclusters will also evolve: introductory stage, growth stage, maturity stage, and decline or start of newcycle. According to ter Wal and Boschma, the maturity phase marks the point of the start of indus-trial decline: the phase is usually characterized by a massive shake-out which is highly selective asto which firms exit the industry. Firms with a peripheral network position are more likely to exitthe industry than firms with more central network positions (cf. Uzzi, 1997). This results in a reduc-tion of the variety of firms in the industry, and a tendency towards cognitive lock-in due to fixedpatterns of interaction (ter Wal and Boschma, 2007). From the maturity phase, the industry and/orcluster ultimately ends up in the final phase of the life cycle: decline or the start of a new cycle.The decline phase, put simply, implies that the industry and the respective cluster disappear becausethe market demand for the industry’s products decreases and the firms in the industry are forcedto exit.
Based on these frameworks, a rather similar picture of the decline phase of clusters emerges: clus-tered firms usually lose their vitality in comparison to the same industry firms that are not located inclusters. More importantly, the decline of clusters seems to be caused by factors that were advantagesin the past: firms and clusters seem to become locked into their old successful trajectories and arenot able to adapt to new or changing environmental conditions. Thus, it seems that the life-cycle ofthe cluster or industry (i.e., population density) in question may have considerable effect on a clus-ter’s vitality: the cluster reaches its highest level of vitality somewhere towards the end of its growth

222 J. Järvinen et al. / Journal of Forest Economics 18 (2012) 218–241
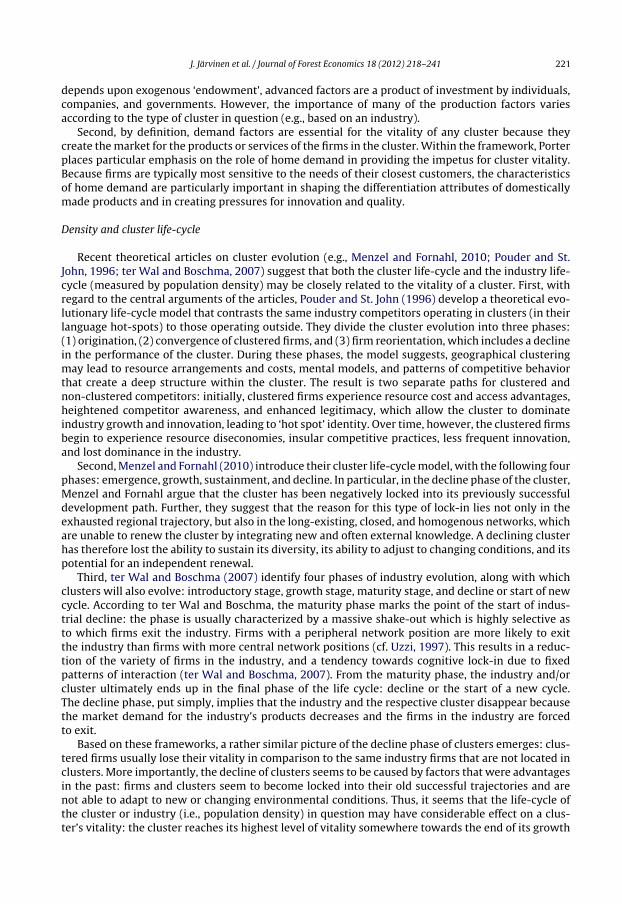
Fig. 1. Synthesis of cluster and evolutionary literatures: Factors and their interrelationships affecting cluster vitality.
phase, and the level of vitality starts to decline from the peak during the maturity and decline phases.Ultimately, the end result of the decline phase may then be the total disappearance of a cluster (assuggested particularly by Pouder and St. John, 1996), but a renewal or transformation is also possible,often based on an exogenous shock (e.g., the introduction of a new technology).
Value chain architecture
Value chain architecture is the construct that defines the terms of the division of labor within asector. It withholds behaviors of the different co-specialized actors as well as the interactions andinterdependencies between them (Jacobides et al., 2006). Architecture emerges at an early stage of anindustry’s or cluster’s life-cycle according to the capabilities of the actors and their environment (reg-ulatory, technological, resource, etc.), typically following the actors with the most developed technicalcapabilities (Jacobides and Winter, 2005). Industry architectures can vary from a simple one-step setupwhere the whole value chain is catered, from raw materials to end-users, by generalist companies, toa complex multistage setup with highly specialized firms holding small fragments of a value network.The emerged architectures might also differ greatly between different clusters within an industry (cf.the example from construction business in different parts of the EU in Jacobides et al., 2006).
The emerged architecture has a considerable effect on cluster vitality. Generalist structures wouldproduce little vertical cooperation across entity borders, while highly specialized structures need to bevery active in inter-organizational cooperation. Different environmental circumstances also generatevery different setups for the industry sectors’ relationship to universities and government subsidizedresearch institutions.
Synthesis
Fig. 1 summarizes the above discussion. Value chain architecture is identified as an integratingstructure that channels the impact of competition for markets and production factors to the level ofcluster evolution. In complex value chains the value generation and value capturing do not necessarilydistribute equally into different stages. For example, although value is generated in downstream busi-nesses (e.g., selling paper to printing houses or personal computers to individual customers) it may becaptured in a different part of the value chain; typically in that part that has an oligopolistic marketstructure (e.g., highly specialized technology firms providing necessary technology for paper-makingfirms or Microsoft selling its operating system to PC manufacturers). Although the factors representa rather widely spread consensus in literatures focusing on cluster evolution, they (a) operate at ahighly abstract level (inhibiting industry-specific modeling); and (b) do not naturally exhibit the com-binations of factors that cause clusters to prosper. From these vantage points, we next turn to analyzethe global paper industry in order to find industry-specific proxies for the identified factors. After theindustry analysis, we will use these proxies in the fuzzy-set analysis, which allows an exploratorycausal analysis of how the factors interact and combine to produce the outcome.

J. Järvinen et al. / Journal of Forest Economics 18 (2012) 218–241 223
0
20 000 000
40 000 000
60 000 000
80 000 000
100 000 000
120 000 000
1980
1981
1982
1983
1984
1985
1986
1987
1988
1989
1990
1991
1992
1993
1994
1995
1996
1997
1998
1999
2000
2001
2002
2003
2004
2005
2006
Pape
rand
boad
consum
p�on
(tonn
es)
NorthAmerica
Europe
China
Japan
Rest of Asia
SouthAmerica
Africa
Oceania
Fig. 2. Consumption of paper and board products 1980–2006 (tons). Source: FAO databases (faostat.fao.org). Consumptioncalculated from as follows: Consumption = Production Quantity + Import Quantity − Export Quantity. Thus, the figure does nottake possible accrual of stock into account and is a measure of quantity, not of monetary value.
Economics of the pulp and paper industry 1980–2008
After the identification of factors that potentially explain cluster vitality, we next focus on thepaper industry dynamics on a global scale using the stylized model above to guide our economic andnetwork analysis.
Historically, steady growth in consumption in the developed countries has been the major driverfor pulp and paper industry expansion. A stable pattern of growth facilitated new capacity investmentsand enhancement in process technology. Average growth rate since 1950 has been approximately 4%per annum, traditionally exceeding growth of GDP by a factor of 1–1.5 (Diesen, 2007). North Americahas hosted the most developed market both in absolute terms and as demand per capita. For example,in 1992 an average person in the United States consumed 50% more paper and board products (inquantity) than in Germany, and over 15 times more than in China (see Table 1). This sound growthcontinued during the 1980s. The economic downturn of the early 1990s decreased paper demand inEurope, but after a stagnation of ca. three years, the megatrend of growth returned.
Two significant turns in the regional consumption occurred around the turn of the millennium. First,North American consumption of paper and board reached its peak in 1999 and then began to decrease.This was a considerable departure from the trend of the past decades. By 2006, the consumption percapita in the U.S. had declined to the level of 1992. Second, China emerged as a major market forpaper and paperboard products. Chinese consumption of paper and board products turned to a rapidupslope in 2001. Indeed, the change related to the geographical center of gravity has been momentous:As Table 1 and Fig. 2 illustrate, in 2006 the growth of consumption had decelerated in Western Europe,and stopped in North America and Japan. While in the 1980s these regions consumed 75% of all thepaper and board products in the world, by 2006 their share had slumped to 61%.
With regard to the origins of the large pulp and paper companies, however, geographical bal-ance has remained essentially unchanged for the past twenty years. The group of one hundredlargest pulp and paper companies in terms of sales has consisted on average of 36 North Ameri-can, 21 Central European and 14 Scandinavian firms, without significant trends to either direction.

224J.Järvinen
etal./JournalofForest
Economics
18(2012)
218–241
Table 1Consumption of paper and board products (kg) per capita in selected countries.
1992 1993 1994 1995 1996 1997 1998 1999 2000 2001 2002 2003 2004 2005 2006
Brazil 26 28 30 34 35 40 39 38 38 41 41 38 39 40 40China 20 21 24 26 30 31 31 33 33 33 37 41 44 45 46Germany 198 193 201 194 188 197 208 216 232 225 221 228 234 239 246Japan 228 225 232 241 247 250 238 240 251 243 248 247 233 234 234United States 302 309 321 333 318 337 329 340 328 307 308 303 305 303 301
Source: FAO databases (faostat.fao.org) and UN databases (unstats.un.org).

J. Järvinen et al. / Journal of Forest Economics 18 (2012) 218–241 225
Conversely, noteworthy changes have occurred in the tail of the group. Steadily from the late 1980sJapanese have been replaced by South American pulp producers. Chinese companies made theirentrance to the top one hundred in 2002 (see Table 2).
The average profitability of the top one hundred pulp and paper companies has been considerablydifferent in terms of time and region. As an underlying determinant of the industry, the price of theend product has a cyclical nature which strongly affects the profitability of the companies. The reasonfor the oscillation has been widely discussed, and appears to result from alternating aggregate over-and under-capacity of supply, and analogous preparation for them from the customers’ part throughdeliberate accumulation or depletion of stock (Diesen, 2007; Lamberg, 2005). This fluctuation seemsto drive the profitability trends through the 1980s and 1990s in all regions. South American produc-ers are most affected by the fluctuating demand due to their concentration on pulp, but on average,South Americans have reached a 16% profit margin, topping the rest. Regarding the dominant regions,North Americans led in the 1980s and the Scandinavians in the 1990s, while the Japanese have alwaysenjoyed a more stable and moderate profit level. Until the late 1990s, all the regions somewhat fol-lowed the same fluctuation at their own level, but during the new millennium this trend seems to havechanged (see Table 3). Previously, players in the dominant regions of the industry were able to gener-ate healthy profits, but after 2000 the profits remained significantly lower, with many firms sufferinglosses. For North American producers, the trend turned already in 1998. Interestingly, towards the endof our examination period, Chinese and South American companies made an increasingly noteworthyexception to this pattern, creating strong yields.
Reviewing the productivity of the top 100 companies reveals major regional disparities. In principle,the way paper is manufactured has not changed from the 19th century. However, through incrementaldevelopment steps the speed, efficiency, environmental friendliness, and versatility of the productionprocess have all increased rapidly (Lamberg, 2005; Diesen, 2007). The technological advantage of thedominant regions in terms of paper production per employee was notable throughout our exami-nation period (see Table 4), with Japanese and Korean companies reaching the highest efficiencies.During the period, Scandinavians gained their lead in productivity in comparison to North Americanand Central European producers (the regions started from relatively equal figures in the early-1990s).Until the late 1990s, geographical balance remained relatively unchanged, yet toward the end of ourperiod of analysis, two major changes occurred: South American companies significantly acceleratedtheir technological capability and overtook the North Americans in productivity. Additionally, Chi-nese companies entered the top 100, while they had inferior productivity figures their productivity isincreasing with some 60% per annum.
Evolution of strategic networks
In this section, our principal focus is on the trends of structural evolution of strategic networks inthe pulp and paper industry. Strategic networks are composed of “inter-organizational ties that areenduring, are of strategic significance for the firms entering them, and include strategic alliances, jointventures, long-term buyer–supplier partnerships, and a host of similar ties” (Gulati et al., 2000). In themodern day pulp and paper industry, the actual producers are largely coupled in long-term partner-ships with firms which provide their production infrastructure; specialized consultants who designtheir factories; and research facilities that help them develop new products and techniques. The effi-ciency of the paper production process is largely determined by the quality of the paper machine, aswell as the chemical processes and automation systems the machine applies. The selection of ties withsupplier partners principally defines the level of technology a paper producer operates on. Respec-tively, suppliers learn from their clients in these long-term partnerships (Alajoutsijarvi et al., 2001). Inaddition to supplier–producer partnerships, the industry is relatively active in forming horizontal tiesvia, for example, joint ventures and research collaboration projects that utilize the know-how of bothparticipants. We therefore plotted the industry clusters’ members according to Porter’s (2000) defini-tion of “interconnected companies, specialized suppliers, service providers, firms in related industries,and associated institutions (for example, universities, standards agencies, and trade associations) inparticular fields that compete but also co-operate”.

226J.Järvinen
etal./JournalofForest
Economics
18(2012)
218–241
Table 2Headquarters locations of the top 100 pulp and paper firms.
1988 1989 1990 1991 1992 1993 1994 1995 1996 1997 1998 1999 2000 2001 2002 2003 2004 2005 2006
Africa 1 1 2 1 1 2 2 2 2 2 2 2 3 3 3 3 3 3 3Central Europe 26 24 24 26 24 25 20 18 18 17 21 19 19 19 22 20 21 20 20China 1 1 1 3 5Japan 15 14 15 15 16 17 16 16 15 12 11 12 12 10 11 11 9 8 9North America 37 38 33 35 33 34 34 39 40 40 40 39 37 38 34 33 33 37 36Ocenia 4 4 4 4 4 3 3 3 3 3 3 3 3 3 3 3 3 3 2Rest of Asia 1 2 2 3 5 5 6 6 4 8 7 6 6 7 7 7 6Scandinavia 15 16 18 17 17 13 14 11 11 14 13 12 12 14 13 14 14 12 12South America 2 2 2 2 3 3 6 6 5 5 6 5 6 6 6 7 8 7 7
Source: Pulp and Paper International magazine 1989–2007.

J.Järvinenet
al./JournalofForestEconom
ics18
(2012)218–241
227
Table 3Average profit margin of the global top 100 pulp and paper companies.a
1988 1989 1990 1991 1992 1993 1994 1995 1996 1997 1998 1999 2000 2001 2002 2003 2004 2005 2006
Africa .29 .27 .12 .13 .14 0.1 .14 .15 .11 .12 .07 .06 .08 .08 .07 .05 .03 .01 .02Central Europe .12 .11 .06 .07 0 .03 .05 .09 .09 0.1 .04 .04 0.1 .08 .03 .01 .02 .02 .05China .09 .11 .07 0.1 .12Japan .06 .06 .06 .05 .02 .04 .05 .07 .07 .06 .03 .02 .02 .01 .02 .02 .03 .03 .01North America .12 .13 .09 .06 .03 .04 .07 .13 0.1 .09 .02 .04 .05 .06 .04 −.02 .02 −.01 .01Ocenia .09 .09 0.1 .09 .08 .02 .01 .03 .06 .04 .04 .04 .03 .03 .02Rest of Asia .09 .08 .12 0.1 .19 .11 .09 .16 .06 .04 .04 .09 .11 .07 .07 .05 .01Scandinavia .11 .13 .09 .02 .03 0.1 .12 .18 .13 .12 .06 .06 .09 .08 .06 .06 .05 .02 .06South America .21 .25 .16 .13 .09 .14 .17 .27 .27 .22 0 .14 .23 .19 .12 .23 .22 .18 .18
Source: Pulp and Paper International magazine 1989–2007.a Only companies earning over 60% of their revenue from pulp and paper sales included.

228J.Järvinen
etal./JournalofForest
Economics
18(2012)
218–241
Table 4Three year moving average of paper productivity of the global top 100 paper companies (paper tons/employee).a
1992 1993 1994 1995 1996 1997 1998 1999 2000 2001 2002 2003 2004 2005 2006
Africa 79 95 104 113 121 137 139 186 220 250 226 205 224 248 273Central Europe 171 172 174 185 197 211 217 228 254 260 263 246 274 307 324China 90 87 160 215Japan 423 438 454 493 516 523 544 637 738 781 783 788 814 729 638North America 183 196 212 219 225 225 232 252 264 269 257 248 261 275 300Ocenia 87 85 84 83 83 78 74 95 120 154 179 201 215 206 naRest of Asia 301 333 312 279 246 242 238 282 305 373 466 590 580 615 627Scandinavia 203 229 265 265 269 262 263 264 287 321 360 387 412 440 475South America 51 72 81 91 80 89 102 120 138 150 170 193 244 287 386
Source of production and personnel data: Pulp and Paper International magazine 1990–2007.a In order to calculate paper productivity figures, we estimated from the production statistics of the top 100 pulp and paper companies in 1988–2006 (PPI) a ratio between the number
of employees required to produce a ton of pulp and a ton of paper and board (as most companies produce both). Only companies earning over 60% of their revenue from pulp and papersales were included to the moving average, with equal productivity for all other activities of the company being assumed.

J. Järvinen et al. / Journal of Forest Economics 18 (2012) 218–241 229
Fig. 3. Strategic network of the pulp and paper industry in 1993.
In the early 1990s (see Fig. 3), Central European, North American and Japanese actors dominatedthe global collaboration, alliance and strategic supplier networks. Regarding individual companies,the network was relatively decentralized with numerous central actors, while aggregately the great-est density was in ties within and to North America. In addition, cooperation patterns within regionalclusters seemed relatively active. Scandinavians, mainly the actors of the Finnish industry, formed acoherent cluster, which was on the sideline of the international cooperation scene. Despite interna-tional technical and resource collaboration, companies were still fairly closely concentrated on theirhome markets (Lamberg and Laurila, 2005; Ojala et al., 2006).
The economic turbulence of the early 1990s resulted in fortified economic integration and intro-duced international competition to the industry as a norm (Siitonen, 2003). Scandinavians, who stillwere in a challenger’s position in the early 1990s, took advantage of eased internationalization andmade a series of acquisitions in Central Europe (Diesen, 2007). This development manifests in thestrategic network as a larger share of ties. Towards the end of the decade, the overall density of theglobal strategic networks began to diminish. Regional density in the North American and Central Euro-pean clusters remained on the previous levels, while the Japanese became internally more scattered.Compared to the early nineties, in 1997 (see Fig. 4) the Scandinavian cluster had cut in between theprevious collaborators.
From 1997 toward the end of our examination period, the change in the global strategic networkswas dramatic. There are three major developments. Firstly, the picture opened up as a threefold struc-ture: the network was divided into the camps of the hub-like machine producers Metso and Voith,with the Scandinavian cluster and a few separate actors positioned in-between drawing resourcesfrom both suppliers. After the bankruptcy of the American machine producer Beloit in 2000, the twocompanies had formed a practical oligopoly in the global market. The Scandinavian cluster had tight-ened its composition via increasing public collaboration with universities and research institutions.Consequently, the picture can also be seen the other way around, as both machine suppliers also drewfrom the resources of the Scandinavian cluster and thus functioned as collection points for compa-nies around the world. Accordingly, the emerging Chinese paper firms created ties directly with themachine producers and only a few suppliers.

230 J. Järvinen et al. / Journal of Forest Economics 18 (2012) 218–241
Scandinavia
North America
eporuElartneCaciremAhtuoS Africa
Oceania
Japan
P&P company
Machine supplier
Other supplier/consultant
University/research institute/association
Tie between actors
Size of node marks betweenness centrality of the actor in the network
Fig. 4. Strategic network of the pulp and paper industry in 1997.
Secondly, while North Americans formed the largest group in the network in 1992, the numberof active actors turns to a steady path of ongoing decline in 1997. At the start of the decline therewere 54 North American actors in the active network, while in 2006 there were only 18 (see Fig. 5).Simultaneously local collaboration in North America faded to a minimum, and as a result, the regionalcluster practically disbanded. The remaining actors joined some of the prevailing camps.
Thirdly, from 2002 onwards, South American firms joined the central Scandinavian cluster throughpinpoint network actions. Noteworthy is that according to our study the only regional cluster at the
0%
5%
10%
15%
20%
25%
30%
35%
40%
45%
1992
1993
1994
1995
1996
1997
1998
1999
2000
2001
2002
2003
2004
2005
2006
Shareofac�v
ene
tworka
ctors NorthAmerica
Central Europe
Scandinavia
Japan
Ocenia
SouthAmerica
Rest of Asia
Africa
China
Fig. 5. Share of active network actors by region.

J. Järvinen et al. / Journal of Forest Economics 18 (2012) 218–241 231
Scandinavia
North America
South America
Central Europe
Africa
Japan
P&P company
Machine supplier
Other supplier/consultant
University/research institute/association
Tie between actors
Size of node marks betweenness centrality of the actor in the network
Fig. 6. Strategic network of the pulp and paper industry in 2006.
end of our examination period is in Scandinavia and the rest are gathered around the two machinesuppliers.
The last network illustrated in Fig. 6 already reflects the increasingly concentrated industry struc-ture along the value chain. On the one hand, it is obvious because of the declining number of firms(Lamberg and Ojala, 2006). On the other hand, however, we may ask to what extent does the con-centration of market power and the clearly less dynamic network have a causal relationship? Or arethey the two manifestations of some other factor not necessarily related to the basic economics ofthe industry? Finally, based on the theoretical background and the historical analysis, we decided tooperationalize the constructs in the model as follows (we elaborate these next in the ‘Method andData’ section):
(1) Cluster vitality: The total number of network ties within and from the respective paper and pulpindustry cluster.
(2) Production factors: The availability of key raw material for the pulp and paper industry, i.e., thesupply of wood in the area of the respective cluster.
(3) Demand factors: Market growth of paper and pulp product consumption in the area of the respec-tive cluster.
(4) Value chain architecture: The centrality of the related industries (i.e., machine suppliers, chem-icals suppliers, consultants, and universities) in the respective paper and pulp industry clusternetwork.
(5) Phase of life-cycle: The phase of life-cycle of the respective paper and pulp industry cluster.(6) Density: The number of top 100 paper and pulp firms with headquarters in the respective cluster.
Method and data
Network data
To plot the strategic networks we collected data on links between pulp and paper industry actorsfrom news reports. Our main source was a news abstract database called Paperbase/Pira. This database

232 J. Järvinen et al. / Journal of Forest Economics 18 (2012) 218–241
provides a broad literature coverage for the pulp and paper, packaging, printing, publishing, imagingand nonwovens industries, containing some 600,000 research, technical and business abstracts datingfrom 1975 to the present. It is compiled and updated monthly by industry experts from over 1000different journals, conference papers, newspapers, and books.
As we made the actual sourcing of tie data through queries to a news database, an identification ofrelevant actors in the industry, i.e. the search words to be employed, was carried out beforehand. Namelists were gathered individually for each year including entries, exits, mergers and acquisitions, andchanging trade names. The lists of the names of relevant actors for each year were assembled apply-ing industry rankings by (1) Pulp and Paper International magazine; (2) a dissertation by Toivanen(2005) examining changes in the paper and pulp machine industry from the 1970s to the 2000s; (3)the Pira/Paperback news database itself; (4) reports by Datamonitor; and (5) interviews of industryexperts.
We conducted the fetching of the news data from the Pira/Paperbase with specially prepared soft-ware. First it fetched abstracts from the database using a separate set of search words for each yearbetween 1988 and 2006 so that all abstracts where any of the actors was mentioned were down-loaded. Then we filtered the downloaded set by passing abstracts that contained mentions of twoor more actors, thus leaving out ones, which reported about disconnected actions of the actors. Wecontinued filtering by passing abstracts which had certain descriptors attached (“joint venture”, “coop-eration”, “collaboration”, “consortium”, “alliance”, “new installation”, or “modernization”). Finally,we read through the entire filtered set. We recorded a tie (based on a news report) if it implicateda reciprocal relationship where technology assets, knowledge, or other resources were transferredbetween organizations in one form or another. As a result, the collected data aggregately withheldnews announcements of 371 supply partnerships, 219 cooperation projects and 381 joint venturesin a group of 236 industry participants. The 236 industry participants comprised 125 pulp and papercompanies, 8 infrastructure consultants, 24 specialty chemicals providers, 17 machine builders, 20other technology providers, 17 research institutions, 5 technical associations and 20 universities.
In order to compile network matrices for each year, we assumed average durations for differenttypes of ties. As data on the endings of manifested alliance deals is regularly unavailable, imputationof alliance termination dates is common in this kind of study (Gay and Dousset, 2005). We codedties with varying strengths, based on the level of assumed interdependency rooting from the tie.Tie strength and duration were coded as alliances to a duration of five years (Kogut, 1988), with alinearly depreciating strength (analogously with Stuart, 2000). Accordingly, cooperation deals (e.g.,joint research projects) were coded to have a three year duration with a depreciating strength. Newinstallation supplier partnerships were recorded with a strength of two for the announcement yearand with a strength of one for the five subsequent years, and modernization deals with a strength ofone for three years.
We excluded multiple similar announcements between the same actors within the year to removeduplicate news for the same tie. If a similar tie was mentioned on a year when the previous wasfurthermore active, the duration and strength were returned to the level of a fresh tie. If an actordid not form an alliance, have its ongoing alliance mentioned in the news reports, or produce ordeliver, it appeared to be isolated or not mapped. Data within these frames depicts a current and livelyinterorganizational network. In order to obtain a balanced set of network matrices with a comparablenumber of preceding years (considering that the news announcements were drawn from 1988 to2006), the final set of network matrices comprises the years 1992–2006.
Factor condition data
To fetch yearly data on the top 100 pulp and paper companies we applied panels collected by Pulpand Paper International magazine in the September issues of all years between 1989 and 2007. Thisdata includes figures for pulp and paper sales, profit, paper and pulp tons produced and the numberof employees. Data on regional market size (i.e. paper and board consumption) and regional forestresources we fetched directly from the databases of the Food and Agriculture Organization of theUnited Nations (FAO).
J. Järvinen et al. / Journal of Forest Economics 18 (2012) 218–241 233
Fuzzy-set qualitative comparative analysis
To analyze the causal conditions resulting in cluster vitality, we employed a set-theoretical method-ology (cf. Fiss, 2007) in the form of fuzzy-set qualitative comparative analysis (fsQCA) (Ragin, 2000,2007). The method can be described as bridging the mainstream quantitative and qualitative researchtechniques by combining quantitative measures with qualitative inference based on substantive andtheoretical knowledge. Further, the method enables identifying different combinations (or config-urations) of causal conditions which lead to a certain outcome, not allowed by most conventionalstatistical research methods. Thus, it suits especially well to exploratory research efforts, like ours, inwhich the causality among the studied factors is not well known and specified. In the following, webriefly describe the method.
fsQCA builds on the diversity-oriented research approach that considers populations as being com-posed of many different types of cases, or more specifically as configurations of aspects and featurestermed causal conditions (Ragin, 2000). The central idea is set membership; thus, a set membershipscore is assigned for every studied case in every set, defined by the studied causal conditions (e.g., aregion’s membership score in the set of regions with a high level of forest resources). Further, fuzzysets defined in this way can be negated or combined by using the common logical operators and (i.e.,the intersection of two or more sets) and or (i.e., the union of two or more sets).
With fuzzy sets, set membership is not restricted to binary values, but may receive any valuebetween zero and one (e.g., from ordinal up to continuous values). However, as fuzzy-set analysis isnot interested in how cases differ from one another in quantifiable magnitude of open-ended variation,it becomes necessary to establish criteria for full membership, partial membership (especially a scoreof 0.5), and exclusion from the set. These qualitative anchors are essential to distinguish betweenrelevant and irrelevant variation. Thus, in contrast to interval scale variables, which only assess relativedifferences between cases (as in the context of statistical research methods), fuzzy-set scores must bebased on substantive and theoretical knowledge (Ragin, 2000).
As regards the nature of the causal inference in the fsQCA, this relies upon the set-theoretic defi-nitions of necessity and sufficiency (Ragin, 2000). For necessity, the outcome is a subset of the causalfactor. An outcome Y is considered a subset of the causal condition X if the following holds for thefuzzy-membership scores of conditions X and Y for all cases.
X ≥ Y
Necessity implies, then, that the membership degree of a case in a causal factor should be associatedwith a smaller membership value in the outcome. For sufficiency, the causal factor is a subset of theoutcome. In particular, X is a sufficient cause for Y, if the following holds for all cases.
X ≤ Y
Sufficiency implies, then, that the membership degree of a case in the causal factor is a subset ofthe outcome.
Necessary and sufficient causation can be assessed using a deterministic, veristic, or probabilis-tic approach. When using a probabilistic approach, while the data may not be fully consistent withnecessary or sufficient causation in deterministic terms, the research may conclude that the dataare consistent, for example, with usually necessary or usually sufficient causation (Katz et al., 2005;Pennings, 2003; Ragin, 2000).
Presently, there are two algorithms for performing fuzzy-set qualitative comparative analysis. Thefirst is the inclusion algorithm presented in Ragin (2000) and later applied in several studies (Katzet al., 2005; see Kogut et al., 2004; Pajunen, 2008). The second is the truth table algorithm introducedby Ragin (2005, 2007). As the new analytic strategy is, according to Ragin (2007), superior in severalaspects to the inclusion algorithm, we employ it as an analytical method. Consequently, we primarilystudy sufficient causation (indicated by subset relation between causal conditions, cf., Ragin, 2007).
The analysis based on the truth-table algorithm proceeds as follows (Ragin, 2007). Given that kcausal conditions are selected for analysis, a multidimensional vector space constructed from fuzzysets has 2k corners. These corners represent the causal arguments that can be constructed from a given

234 J. Järvinen et al. / Journal of Forest Economics 18 (2012) 218–241
set of causal conditions. A case is considered to be a member of a corner or configuration when it hasa fuzzy-membership score of more than 0.5 in the focal corner.
Given these premises, a truth table can be constructed. The truth table is constructed by listing allcorners of the vector space as rows of the table. The table is then supplemented with two key mea-sures that provide information for the researcher to assess whether a configuration can be consideredrelevant, and when a configuration is relevant, whether the configuration is a sufficient cause or notfor the focal outcome. First, to assess the first condition, a column of membership frequencies, i.e., thenumber of cases that are members of a corner, is constructed. According to Ragin (2007), the researchershould select a threshold that distinguishes between configurations that exhibit adequate empiricalevidence and those that do not. For quite a small number of cases, the appropriate threshold is one.The configurations that have membership frequencies below the threshold, called logical remainders,are considered to lack adequate empirical evidence and are removed from the table.
Second, to evaluate each combination’s consistency with the set theoretic relation in question, theconsistency measure is created. This is defined as follows (Ragin, 2006, 2007).
Consistency(Xi ≤ Yi) =∑N
i=1 min(Xi, Yi)∑N
i=1Xi
where Xi represent membership scores in a combination of conditions, and Yi represents membershipscores in the outcome. The value of the score ranges from zero to one. The value of one indicates fullconsistency, i.e., all cases are subsets of the outcome. The researcher should choose a consistencythreshold which is preferably at least 0.85 (Ragin, 2007). In general, consistency scores between 0and 0.75 indicate the existence of substantial inconsistency. A column, which is in the fsQCA software(Ragin et al., 2006) termed “outcome”, is then coded to note consistent and inconsistent cases.
Finally, the Quine–McCluskey algorithm of QCA (in the program) is employed in order to obtainthe final solution. In total, two solutions are obtained: in the language of Ragin and Sonnet (2004),these are called the “complex” (or detailed) and “parsimonious” solutions. The parsimonious solutionis generated by re-analyzing the truth table with the “remainder” rows (combinations lacking goodinstances) set to “don’t care” (Ragin, 2007).
The solutions can be described in terms of consistency and coverage (Ragin, 2006). Consistencymeasures the accuracy of a solution, and is analogous to the configuration consistency presented above.Coverage measures the generality (and importance) of the solution.1 Specifically, solution coveragedescribes the extent to which the solution covers the outcome and is calculated as follows.
Coverage(Xi ≤ Yi =∑N
i=1 min(Xi, Yi)∑N
i=1Yi
The value of the coverage varies between zero and one. Values close to one imply high coverage.
Outcome condition
We operationalized the concept of cluster vitality, defined as a cluster’s ability to survive andmaintain a high level of activity, based on each cluster’s relative activity in the global industry network.More specifically, we used the number of separate ties within and from the respective cluster asan indicator of the cluster’s viability, and thus as an indicator of its vitality in comparison to otherclusters. As the ties in the network present strategic relationships between paper and pulp firms and,for example, machine and chemicals suppliers and research institutes, which are essential for paperand pulp firms both in the short and long run, and without which it would be impossible for pulp andpaper firms to operate, we argue that this kind of network activity functions as an important indicatorof the vitality of the paper and pulp industry cluster in question: the more ties there are among theindustry actors, the higher the vitality of the industry cluster.
1 This is similar to R-squared in regression analysis.

J. Järvinen et al. / Journal of Forest Economics 18 (2012) 218–241 235
Table 5Fuzzy-set membership scores for outcome and causal conditions.
Outcome Causal conditions
Clustervitality
Marketgrowth
Forestresources
Value chainarchitecture
Density Phase oflifecycle
Averageprofitability
1993Africa 0.000 0.000 0.000 0.000 0.000 0.000 0.934Central Europe 0.808 0.623 0.250 0.882 1.000 0.750 0.003China 0.000 1.000 0.250 0.000 0.000 0.250Developed Asia 0.333 0.302 0.000 0.591 0.828 0.500 0.254North America 1.000 0.559 1.000 0.490 1.000 0.750 0.241Oceania 0.088 0.629 0.250 0.000 0.078 0.250 0.630Scandinavia 0.838 0.623 0.750 1.000 0.610 0.500 0.576South America 0.054 0.526 0.500 0.000 0.110 0.000 1.000
1999Africa 0.018 1.000 0.000 0.000 0.000 0.000 0.766Central Europe 0.636 0.450 0.250 0.606 0.981 1.000 0.611China 0.000 0.333 0.250 0.073 0.000 0.250Developed Asia 0.178 0.000 0.000 0.597 0.717 0.750 0.000North America 0.844 0.072 0.750 0.314 1.000 1.000 0.061Oceania 0.000 0.757 0.250 0.000 0.038 0.250 0.039Scandinavia 1.000 0.450 0.500 1.000 0.566 0.750 0.787South America 0.062 0.605 0.500 0.000 0.189 0.000 1.000
2005Africa 0.000 0.000 0.000 0.000 0.019 0.000 0.168Central Europe 0.815 0.442 0.250 0.847 1.000 1.000 0.321China 0.041 1.000 0.250 0.000 0.019 0.250 1.000Developed Asia 0.056 0.000 0.000 0.376 0.566 1.000 0.302North America 0.369 0.086 0.500 0.188 1.000 1.000 0.005Oceania 0.000 0.846 0.250 0.000 0.000 0.250 0.260Scandinavia 1.000 0.442 0.500 1.000 0.566 1.000 0.504South America 0.051 0.789 1.000 0.000 0.264 0.250 1.000
We derived the fuzzy-set membership scores for the outcome condition (VITALITY) from the valuesof the numbers of ties in the following way. First, for 1993, we assigned a fuzzy-set membership scoreof 1 for regions with a number of ties higher than 85. Then, we set all the regions with a number of tiesless than 5 fully out of the set (i.e., a set membership score of 0). Finally, for turning the values betweenthese anchor points into membership scores, we used linear interpolation. For the other two time-points, we followed similar procedures with the following exceptions. First, for 1999, we consideredregions with the number of ties higher than 80 fully-in the set of regions with a high level of networkviability, and thus, vitality, and second, for 2005, we set the point of full set membership to 70 ties.We argue that this operationalization allowed us to efficiently differentiate regions with a low levelof vitality from those with a high level, and also to eliminate irrelevant variation present in the valuesof the outcome.
We present the set membership scores for the outcome condition and also for all the studied causalconditions, discussed in next chapter, in Table 5. Taking into consideration that the region named as‘rest of Asia’ in the earlier parts of the paper is extremely fragmented and consists of several differenttypes of countries, we do not take it into analysis.
Causal conditions
This section presents how we operationalized the constructs presented in the earlier sections andhow the values of the variables were turned into respective fuzzy-set membership scores. Startingfrom the operationalization of production factors, we decided to measure these in terms of the avail-ability of key raw material for the pulp and paper industry, i.e., supply of wood. In particular, ourmeasure is based on an analysis of how usable the forest resources in the respective region are from

236 J. Järvinen et al. / Journal of Forest Economics 18 (2012) 218–241
the perspective of the industry. We considered price of wood, adequacy and amount of wood, usabil-ity of forest resources, and infrastructure of the region, as regards for example transportation of rawwood material, contributing to the total usability of forest resources. By consulting forest industryexperts and statistical data sources (for example, data related to wood prices and forest area, pro-vided by FAOStat), we then derived the fuzzy-set membership scores for the causal condition (FORESTRESOURCES), based on the aforementioned characteristics. We used the following five-point scalingfor the membership scores: 1.00: fully in the set; 0.75: more or less in; 0.5: neither in or out; 0.25:more or less out; and 0.00: fully out.2
Second, the construct ‘demand factors’ is operationalized as the growth of market for paper industryproducts. More specifically, we used a two-year average of annual growth in percents in the consump-tion of paper and board products in a focal region (for example, for the year 1993, the two-year averageof annual growth was based on annual growth in consumption between 1992 and 1993 and 1993 and1994) as the measure. The fuzzy-set membership scores for the causal condition (MARKET GROWTH)for 1993 were derived, first, by assigning regions with an average market growth higher than 10% fullyin the set. Second, the region with the lowest consumption figure was given a fuzzy-set membershipscore of 0. The scores for the regions with values between these two anchor points were based onlinear interpolation. For assigning the set membership scores for the years 1999 and 2005 the proce-dure was the same, except that for both time points the lower limit for full membership in the set waslowered to 7%.
Third, the construct of value chain architecture was operationalized as the relative centrality of theindustries related to the paper and pulp industry (e.g., machine suppliers, chemicals suppliers, consul-tants, and universities) in the paper and pulp industry networks of the studied regions. In particular,the measure was based on the Freeman Betweenness centrality score of the related industries in therespective regional network. The calibration of the values of the variable to fuzzy-set membershipscores (VC ARCHITECTURE) for every time point (i.e., 1993, 1999, and 2005) was accomplished bysetting regions with related industries’ centrality value higher than 3 fully in the set, and the regionwith the lowest centrality value (i.e., 0) fully out of the set. Scores for the values between these twoanchor points were then established by linear interpolation.
Fourth, we measured density at a region level by counting how many of the global 100 pulp andpaper firms had their headquarters in a focal region at a certain time point. The fuzzy-set membershipscores for the condition (DENSITY) for 1993, were derived, first, by setting the regions with more than23 top firms fully in the set (i.e., region with the second highest number of top 100 firms). Second,the region with the lowest number of firms was assigned a membership score of 0. Finally, scores forthe values between these two points were assigned based on linear interpolation. A similar procedurewas followed for the years 1999 and 2005, but the limit for the lowest variable value leading to a fullset membership (i.e., 1) was changed based on changes in the values of the variable: for both yearsthe limit was set to 20 firms.
Fifth, our measure for the phase of lifecycle of the paper and pulp industry cluster (LIFECYCLE) ina focal region was derived based on substantive and theoretical knowledge of the phenomenon. Inparticular, we considered the following characteristics in assigning the set membership scores for theregions in the set of matured/declining industry (i.e., regions with declining paper and pulp industryhave full membership in the set and regions with emerging industry are fully out of the set): rate offounding of new firms; rate of exit of firms; density of pulp and paper firms in the region; speed oftechnological development; and development of pulp and paper product prices in relation to efficiency.A five-point scaling of the membership scores was also employed for this condition.
Finally, as a control condition, we used the average profit margin of the global top 100 paper andpulp firms in a region in the forthcoming analyses. The fuzzy-set membership scores for the condition(PROFIT) were derived as follows. First, for 1993, the region with the highest average profitability(13.1%) was assigned a membership score of 1. Then, the region with the lowest profitability fig-ure was assigned a membership score of 0. Values between these two anchor points were turned to
2 Scales like this are commonly used in earlier research using fuzzy-set analysis (see e.g., Katz et al., 2005; Ragin, 2007;Pajunen, 2008).

J. Järvinen et al. / Journal of Forest Economics 18 (2012) 218–241 237
Table 6Complex solution for cluster vitality in 1993.
Complex solution Consistency Raw coverage Unique coverage
1. VC ARCHITECTURE·MARKETGROWTH·forestresources·profit·LIFECYCLE·DENSITY +
1.00 0.38 0.34
2. vc architecture·MARKETGROWTH·FORESTRESOURCES·profit·LIFECYCLE·DENSITY
1.00 0.23 0.19
Solution indicesN 8 Solution consistency 1Frequency cutoff 1 Solution coverage 0.56Consistency cutoff 1
membership scores by linear interpolation. For 1999 and 2005 we assigned regions with an averageprofitability higher than 8% fully in the set of regions with firms with a high level of profitability. Insetting the anchor value for the set membership score of 0, we used the lowest value of profitability.The values for the set membership scores between these two anchor points were based on linearinterpolation.
Results
We conducted three analyses with a focus on the years 1993, 1999, and 2005. The fuzzy-set anal-yses proceeded as follows. First, we constructed truth tables of the data as described.3 In total, weemployed 6 causal conditions in the models. Second, we selected a frequency threshold to distin-guish between configurations with adequate empirical instances and configurations treated as logicalremainders. Third, we selected the consistency threshold to distinguish between consistent and incon-sistent configurations. Both thresholds were chosen based on the recommendations by Ragin (2007).Fourth, the Quine–McCluskey algorithm of QCA was employed in order to obtain the final solution. Inthe following, we only present and interpret the complex results; this is because many of the parsi-monious solutions can be considered as “too parsimonious” (cf., Ragin and Sonnett, 2004) because thesimplifying assumptions that are incorporated via counterfactual analysis are untenable (i.e., the rowsin the truth table that have no empirical evidence). For every solution and configuration, we reportthe respective consistency score, and the coverage of the solution or the configuration.
Results for 1993
Table 64 presents the results of cluster vitality for the studied regions in 1993. Because of theconsiderably small size of the sample, the frequency threshold value is set to one, as is also the valuefor the consistency cut-off. The consistency of the complex result is 1 and the coverage 0.56.
The results of the analysis (complex solution) indicate two different combinations of causal condi-tions to cluster vitality. The first combines a central role of related industries in the cluster network,a high level of market growth, a low usability and level of forest resources, a low level of aver-age firm profitability, a matured or declining phase of industry lifecycle, and a large firm density(based on the coverage score, this is the most important configuration). The second configurationalso combines a high level of market growth, a low level of firm profitability, a matured or declin-ing phase of industry life cycle, and a large number of firms, but in contrast to configuration one,it now contains a non-central role of related industries and a high level and usability of forestresources. As both paths combine the same four conditions, we can write the solution in the following
3 We conducted our analyses with fsQCA 2.2 software (Ragin et al., 2006). The program can be downloaded from the websitewww.fsqca.com.
4 The notations used are as follows: (1) capital letters refer to causal conditions, (2) small letters to negations of causalconditions, (3) “·” to logical and (intersection), and (4) “+” to logical or (union).

238 J. Järvinen et al. / Journal of Forest Economics 18 (2012) 218–241
Table 7Complex solution for cluster vitality in 1999.
Complex solution Consistency Raw coverage Unique coverage
1. vc architecture·market growth·FORESTRESOURCES·profit·LIFECYCLE·DENSITY +
0.96 0.41 0.29
2. VC ARCHITECTURE·market growth·forestresources·PROFIT·LIFECYCLE·DENSITY
1.00 0.34 0.23
Solution indicesN 8 Solution consistency 0.98Frequency cutoff 1 Solution coverage 0.63Consistency cutoff 0.96
simplified form: VITALITY ≥ MARKET GROWTH·profit·LIFECYCLE·DENSITY·(VC ARCHITECTURE·forestresources + vc architecture·FOREST RESOURCES). Thus, in order to be viable, a pulp and paper indus-try cluster must experience at least a relatively high level of market growth, be in a late phase of itsindustry life cycle and have a large number of large-sized firms.
Considering our data, the first path is represented in many ways by Central Europe. The role ofrelated industries in the pulp and paper industry network in Central Europe is relatively high, it hasa low level of forest resources, it starts to be in the late phase of the industry life cycle, and it has alarge number of firms. North America, with related industries having a relatively non-central role inits industry network, with a high level of forest resources, a large number of firms, and being in thelater phase of its industry life cycle, may then be considered to represent the second path.
Results for 1999
Table 7 presents the results for the year 1999. As can be noticed, we again set both the frequencycut-off and consistency cut-off to 1. The complex results in Table 7 indicate two paths to the outcome.The first combines a non-central role of related industries in the pulp and paper industry cluster, a lowlevel of market growth, a high level and usability of forest resources, a low average profitability, a latephase of industry lifecycle, and a large number of firms. The second, in contrast, combines a centralrole of related industries in the cluster, a low level of market growth, a low level of forest resources,a high average profitability, a late phase of industry lifecycle, and a large number of large-sized pulpand paper firms. The two configurations are again rather similar and imply the following final solu-tion: VITALITY ≥ market growth·LIFECYCLE·DENSITY·(vc architecture·FOREST RESOURCES·profit + VCARCHITECTURE·forest resources·PROFIT). The configurations also resemble those in 1993; for exam-ple, in both years the viable regions are in their late phase of industry life cycle and a have largenumber of firms. Additionally, the role of related industries and forest resources appear in the samecombinations in both years. The largest difference is related to the market growth condition: in 1999the market growth in regions with the highest level of vitality seems to be low.
Finally, we note that configuration one is considerably well represented by North America, althoughthe level of vitality of the cluster clearly starts to decrease at this time point. Scandinavia, in contrast,has many characteristics related to configuration path two.
Results for 2005
Table 8 presents the results for the last analysis. The frequency cut-off is set to 1 and consistencycut-off to 0.8. The consistency of the result (complex) is 0.8 and coverage 0.56. The results now implyonly one solution to cluster vitality. The configuration combines a central role of related industries, alow level of market growth, a low level and usability of forest resources, a low average profitability,a late phase of industry lifecycle, and a large number of firms. The configuration is relatively wellrepresented by the two regions with the highest level of vitality in the sample: Central Europe andScandinavia. For example, related industries have central roles in both networks, the regions have a lowlevel of market growth, a relatively low level membership in the set of high level of forest resources,

J. Järvinen et al. / Journal of Forest Economics 18 (2012) 218–241 239
Table 8Complex solution for cluster vitality in 2005.
Complex solution Consistency Raw coverage Unique coverage
1. VC ARCHITECTURE·market growth·forestresources·profit·LIFECYCLE·DENSITY
0.80 0.56 0.56
Solution indicesN 8 Solution consistency 0.80Frequency cutoff 1 Solution coverage 0.56Consistency cutoff 0.80
they are both in the late phase of their industry lifecycle, and both have relatively high membershipin the set of regions with a large number of large-sized firms.
Finally, in comparison to the results in earlier periods, we note that although some of the compo-nents of the solutions are different, it seems that especially the late phase of the industry lifecycle andthe large number of pulp and paper industry firms appears in every configuration leading to clustervitality in every year studied.
Discussion
Our investigation and analysis reveals both predictable and surprising evolutionary patterns. First,according to our initial expectations and in line with ideas of extant evolutionary cluster studies (e.g.,Pouder and St. John, 1996) we demonstrate how the previously dominant North American clustersteadily deteriorates as it was not able to adapt to changing conditions of the operating environmentand how Scandinavians consequently take the lead in global strategic alliance networks. Consumptionof paper and board turned in the late 1990s after decades of constantly growing domestic markets.Whereas the biggest pulp and paper companies are furthermore North American, towards 2006 nearlyall identifiable inter-organizational cooperation activities faded within the cluster.
Secondly, building on Porter’s framework, our analysis illustrates how the role of related industriesin a region’s position is accentuated as the industry matures. In the early 1990s, all key paper industryregions had an uneven but considerable presence of actors in related industries. Most importantlyall regions incorporated a major paper machine manufacturer. During the following fifteen years therole of related industries in the strategic networks in Japan and North America declined along withthe regions’ overall position in global hierarchy, while Scandinavia and Central Europe demonstratedconverse development. Overall, our analysis displays how circumstances evolve comparatively sim-ilarly for all leading clusters as their relative factor and demand conditions incrementally aggravate.An exception from the start is in the relative role of related industries.
Thirdly, as a more unexpected discovery we show how the nature and structure of the industry’sstrategic network changes completely towards the end of our examination period. The event of ageographical cluster losing dominance and another one inheriting it is not exceptional. For example,before the US cluster became dominant in the 1920s (together with the German cluster), the Britishhad the leading position in the paper industry. However, the rise of the Scandinavian cluster towards2006 is different. It is accompanied by the soaring of two separate actors as global hubs in the strategicnetwork: the Finnish and German paper machine producers Metso and Voith. The extremely centralroles of these suppliers seem to have completely changed the dynamics of the network, as the twocompanies hold a majority of identifiable inter-regional business activities in the paper industry. Thisdevelopment is anteceded by two factors: (1) the global concentration of the paper machine indus-try has been quicker than what has been realized among actual paper producers; and (2) while bothcompanies traditionally were integral parts of their regional clusters, the speed and depth of theirglobalization has respectively exceeded that of their adjacent paper companies. The resulting struc-ture has intriguing consequences. A mature industry with years of concentration on the incrementaldevelopment of process technology combined with value chain concentration, which is in part respon-sible for most of the process development, seems to have made strong regional technology clusterslose their importance. While the Scandinavian cluster is furthermore dense, superior-performing Chi-nese and South American actors have no manifested regional clusters, but are instead able to derive

240 J. Järvinen et al. / Journal of Forest Economics 18 (2012) 218–241
their required resources through contracts with the machine producers and a few paper company col-laboration deals with Scandinavia. Whereas these emerging regions have their competitive advantagein factor conditions or demand conditions respectively, decades of technological development andnational investments in Scandinavia and Central Europe can be transferred with a single transaction.
References
Alajoutsijarvi, K., Klint, M.B., Tikkanen, H., 2001. Customer relationship strategies and the smoothing of industry specific businesscycles—the case of the global fine papers industry. Industrial Marketing Management 30 (6), 487–497.
Arthur, W.B., 1989. Competing technologies, increasing returns, and lock-in by historical events. The Economic Journal 99 (394),116–131.
Audia, P.G., Freeman, J.H., Davidson Reynolds, P., 2006. Organizational foundings in community context: instruments manufac-turers and their interrelationship with other organizations. Administrative Science Quarterly 51 (3), 381–419.
Baptista, R., 2000. Do innovations diffuse faster within geographical clusters? International Journal of Industrial Organization18, 515–535.
Clancy, P., O’Malley, E., O’Connel, L., Van Egeraat, C., 2001. Industry clusters in Ireland: an application of Porter’s model ofnational competitive advantage to three sectors. European Planning Studies 9 (1), 7–28.
Diesen, M., 2007. Papermaking Science and Technology. 1: Economics of the Pulp and Paper Industry. Finnish Paper Engineers’Association: Paperi ja puu Oy, Helsinki.
Fiss, P.C., 2007. A set-theoretic approach to organizational configurations. Academy of Management Review 32 (4), 1180–1198.Gay, B., Dousset, B., 2005. Innovation and network structural dynamics: Study of the alliance network of a major sector of the
biotechnology industry. Research Policy 34 (10), 1457–1475.Gulati, R., Nohria, N., Zaheer, A., 2000. Strategic networks. Strategic Management Journal 21, 203–215.Hannan, M.T., Freeman, J., 1989. Organizational Ecology. Cambridge University Press, Cambridge.Jacobides, M., Winter, S., 2005. The co-evolution of capabilities and transaction costs: explaining the institutional structure of
production. Strategic Management Journal 26 (5), 395–413.Jacobides, M., Knudsen, T., Augier, M., 2006. Benefiting from innovation: value creation, value appropriation and the role of
industry architecture. Research Policy 35 (8), 1200–1221.Järvinen, J., Lamberg, J.A., Murmann, J.P., Ojala, J., 2009. Alternative paths to competitive advantage: a fuzzy-set analysis of the
origins of large firms. Industry and Innovation 16 (6), 545–574.Katz, A., Vom Hau, M., Mahoney, J., 2005. Explaining the great reversal in Spanish America: fuzzy-set analysis versus regression
analysis. Sociological Methods & Research 33 (4), 539–573.Ketchen, D.J., Snow, C.C., Hoover, V.L., 2004. Research on competitive dynamics: Recent accomplishments and future challenges.
Journal of Management 30 (6), 779–804.Klepper, S., 2007. The evolution of geographic structures in new industries. In: Frenken, K. (Ed.), Applied Evolutionary Economics
and Economic Geography. Edward Elgar, Cheltenhamn.Kogut, B., 1988. Joint ventures: theoretical and empirical perspectives. Strategic Management Journal 9 (4), 319–332.Kogut, B., MacDuffie, J.P., Ragin, C.C., 2004. Prototypes and strategy: assigning causal credit using fuzzy sets. European Manage-
ment Review 1 (2), 114–131.Krugman, P., 1994. Competitiveness: a dangerous obsession. Foreign Affairs 73 (2), 28–44.Lamberg, J.-A., 2005. Strategic Action and Path Dependence: Profiles and Architypes of Competitive Behaviour in a Global
Industry. Monikko, Espoo.Lamberg, J.A., Laurila, J., 2005. Materializing the societal effect: organizational forms and changing patterns of dominance in the
paper industry. Organization Studies 26 (12), 1809–1830.Lamberg, J.-A., Ojala, J., 2006. Evolution of competitive strategies in global forestry industries: introduction. In: Lamberg, J.-
A., Näsi, J., Ojala, J., Sajasalo, P. (Eds.), The Evolution of Competitive Strategies in Global Forestry Industries: ComparativePerspective. Springer, Dordrecht, pp. 1–29.
Menzel, M.-P., Fornahl, D., 2010. Cluster life-cycles—dimensions and rationales of cluster evolution. Industrial and CorporateChange 19 (1), 205–238.
Mowery, D.C., Nelson, R.R., 1999. Sources of Industrial Leadership: Studies of Seven Industries. Cambridge University Press.Murmann, J.P., 2003. Knowledge and Competitive Advantage The Coevolution of Firms, Technology, and National Institutions.
Cambridge University Press, Cambridge.Ojala, J., Lamberg, J.-A., Ahola, A., Melander, A., 2006. The ephmera of success: strategy, structure and performance in the forestry
industries. In: Lamberg, J.-A., Näsi, J., Ojala, J., Sajasalo, P. (Eds.), The Evolution of Competitive Strategies in Global ForestryIndustries: Comparative Perspectives. Springer, Netherlands, pp. 257–286.
Owen-Smith, J., Riccaboni, F., Pammolli, F., Powell, W.W., 2002. A comparison of U.S. and European university-industry relationsin the life sciences. Management Science 48 (1), 24–43.
Pajunen, K., 2008. Institutions and inflows of foreign direct investment: a fuzzy-set analysis. Journal of International BusinessStudies 39 (4), 652–669.
Pennings, P., 2003. Beyond dichotomous explanations: explaining constitutional control of the executive with fuzzy-sets.European Journal of Political Research 42 (4), 541–568.
Pinch, S., Henry, N., Jenkins, M., Tallmann, S., 2003. From ‘industrial districts’ to ‘knowledge clusters’: a model of knowledgedissemination and competitive advantage in industrial agglomerations. Journal of Economic Geography 3 (4), 373–388.
Porter, M.E., 1990. The Competitive Advantage of Nations. Macmillan, London.Porter, M.E., 1998. Clusters and the new economics of competition. Harvard Business Review:, 77–90.Porter, M.E., 2000. Location, competition, and economic development: local clusters in a global economy. Economic Develop-
ment Quarterly 14 (1), 15–34.

J. Järvinen et al. / Journal of Forest Economics 18 (2012) 218–241 241
Porter, M.E., Stern, S., 2002. The Impact of Location of Global Innovation: Findings from the National Innovative Capacity Index.Harvard University.
Porter, M.E., 2003. The economic performance of regions. Regional studies 37 (6&7), 549–578.Pouder, R., St. John, C.H., 1996. Hot spots and blind spots: geographical clusters of firms and innovation. Academy of Management
Review 21 (4), 1192–1225.Powell, W.W., Koput, K.W., SmithDoerr, L., 1996. Interorganizational collaboration and the locus of innovation: networks of
learning in biotechnology. Administrative Science Quarterly 41 (1), 116–145.Ragin, C.C., 2000. Fuzzy-set Social Science. University of Chicago Press, Chicago and London.Ragin, C.C., 2005. From fuzzy sets to crisp truth tables. University of Arizona, Working paper.Ragin, C.C., 2006. Set relations in social research: evaluating their consistency and coverage. Political Analysis 14 (3), 291–310.Ragin, C.C., Sonnett, J., 2004. Between complexity and parsimony: limited diversity, counterfactual cases and comparative
analysis. In: Kropp, S., Minkenberg, M. (Eds.), Vergleichen in der Politikwissenschaft. VS Verlag für Sozialwissenschaften,Wiesbaden.
Ragin, C.C., Drass, K.A., Davey, S., 2006. Fuzzy-set/Qualitative Comparative Analysis 2.2. Department of Sociology, University ofArizona, Tucson, Arizona.
Ragin, C.C., 2007. Qualitative comparative analysis using fuzzy sets (fsQCA). In: Rihoux, B., Ragin, C.C. (Eds.), ConfigurationalComparative Analysis. Sage Publications, Thousand Oaks, CA, pp. 87–121.
Siitonen, S., 2003. Impact of globalisation and regionalisation strategies on the performance of the world’s pulp and paperindustry. Dissertation. Helsinki School of Economics, Helsinki.
St. John, C.H., Pouder, R., 2006. Technology clusters versus industry clusters: resources, networks, and regional advantages.Growth and Change 37 (2), 141–171.
Stuart, T.E., 2000. Interorganizational alliances and the performance of firms: a study of growth and innovation rates in ahigh-technology industry. Strategic Management Journal 21 (8), 791–811.
Swann, G.M.P., Prevezer, M., Stout, D., 1998. The Dynamics of Industrial Clustering—International Comparisons in Computingand Biotechnology. Oxford University Press, New York.
Sölvell, Ö., Lindqvist, G., Ketels, C., 2003. The Cluster Initiative Greenbook. Bromma Tryck AB, Stockholm.ter Wal, A.L.J., Boschma, R.A., 2007. Co-evolution of firms, industries and networks in space. Papers in Evolutionary Economic
Geography.Toivanen, H., 2005. Sorvareista palvelijoiksi: Maailman paperi- ja sellukonetoimialan strateginen peli ja logiikka 1970-luvulta
2000-luvulle. Dissertation, Tampere University of Technology, Tampere.Tushman, M.L., Anderson, P., 1986. Technological discontinuities and organizational environments. Administrative Science
Quarterly 31 (3), 439–465.Uzzi, B., 1997. Towards a network perspective on organizational decline. The International Journal of Sociology and Social Policy
17 (7/8), 111–155.