Embed Size (px)
Citation preview

Institute of Biological, Environmental and Rural Sciences
THE FARM BUSINESS SURVEY
IN WALES
Wales Farm Income Booklet
2013/14 Results
Sponsored by
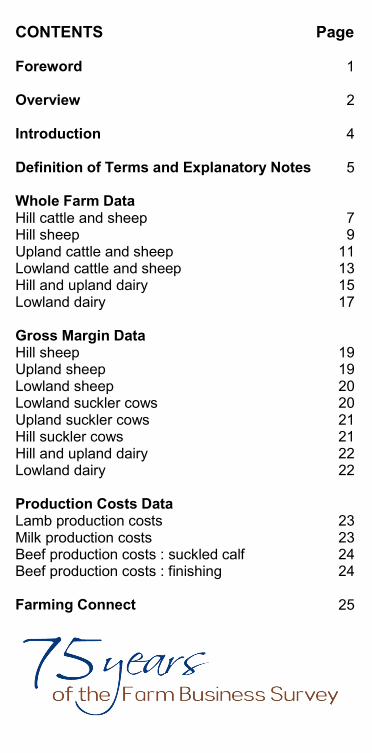
CONTENTS Page Foreword Overview Introduction Definition of Terms and Explanatory Notes Whole Farm Data Hill cattle and sheep Hill sheep Upland cattle and sheep Lowland cattle and sheep Hill and upland dairy Lowland dairy Gross Margin Data Hill sheep Upland sheep Lowland sheep Lowland suckler cows Upland suckler cows Hill suckler cows Hill and upland dairy Lowland dairy Production Costs Data Lamb production costs Milk production costs Beef production costs : suckled calf Beef production costs : finishing Farming Connect
1
2
4
5
7 9
11 13 15 17
1919 20 20 21 21 22 22
23 23 24 24
25
Prifysgol
Aberystwyth University
Wales Farm Income Booklet 2013/14 Results
Farm Business Survey
Institute of Biological, Environmental and Rural Sciences Aberystwyth University
Gogerddan Aberystwyth
Ceredigion SY23 3EE
Director
Tony O’Regan
Unit Staff
Nigel Chapman Rowland Davies Eileen Edwards Brenda Jones Dylan Jones Eric Jones
Nick Reeves Tegid Roberts Huw Williams Ian Williams
Tel: 01970 622253 E-mail: [email protected]
http://www.aber.ac.uk/en/ibers/enterprise-kt/fbs/
1
Foreword Aberystwyth University has been researching Welsh farm incomes since before the Second World War and 2011/12 was the 75th Anniversary of the Survey. The Survey, recognised as the most authoritative of the financial position and performance of farm incomes, provides policy-makers with information on the economic state of the industry and provides valuable comparative data for assessing individual farm performance. This booklet is based on the full Farm Business Survey (FBS) which collects information from over 550 randomly selected Welsh farms. The booklet is aimed at providing farmers with a user friendly benchmarking tool and incorporates the latest financial and physical information for the main farm types in Wales. The results shown are contrary to some aspects of FBS methodology and presentation of results, for example notional inputs such as rental value for owner occupied farms and unpaid labour have been taken out, whereas finance charges have been included, so that the figures represent actual costs incurred. This booklet only shows unpaid labour for reference purposes and also, only includes selected farm types. For undertaking detailed, comprehensive analysis and for year on year analysis on income trends please refer to the full results published as the annual report ‘Farm Business Survey in Wales: Statistical Results’ (available online). Aberystwyth University has been associated with land-based studies since 1878 and the FBS is its oldest research contract. It is therefore appropriate that I gratefully acknowledge the many farmers throughout Wales who have made detailed information available; the Welsh Government who finance the present Survey; Farming Connect for the sponsorship of this booklet and the past and present staff of the Survey. Tony O’Regan Director of Farm Business Survey
2
Overview The results in this booklet consist of accounting years ending between 31st December 2013 and 31st March 2014 and therefore reflect farming conditions between January 2013 and March 2014. This overview is intended to provide context and insight into the period that the results represent. The 2012 harvest period was a difficult time with the overall impact being poor fodder stocks and crop establishment heading into the 2012/13 winter. The long cold dry spring of 2013 resulted in farmers buying in large quantities of feed and forage and paying high prices for sometimes mixed quality. These weather-related difficulties cumulated during the spring with many areas experiencing record and prolonged snow falls at the worst possible time over lambing and crop establishment. Significant numbers of ewes and lambs, and in some cases even buildings, were lost and many hectares of winter sown crops had to be re-drilled with spring varieties. Snow on the ground only exacerbated the need for feed and forage. Eventually the weather and growing conditions improved resulting in better than anticipated 2013 harvests, both in terms of quality and quantity. On the sheep front, the year had mixed fortunes. Heavy lamb losses coupled with significantly higher feed costs, weather-related health issues and poor early grass growth increased costs significantly. Whilst income benefited from early supply and demand fears, the higher lamb prices soon fell during mid-summer and never recovered resulting in poor performance at the gross margin level. Beef producers suffered from similar cost increases, but benefited from a very strong trade for most of 2013 although the dramatic reduction in prices paid at the start of 2014 inflicted damage on margins and resulted in a loss of confidence that remains today.

3
Dairy producers benefited from a significant, welcomed and sustained increase in milk prices and with 2013/14 silage pits full of quality forage margins consequently improved, although TB continually caused difficulties for many producers. On the back of improving margins dairy investment increased as existing, new and returning producers had confidence in the future. Other aspects of note during the farming period included a favourable Euro exchange rate, significant investment in and returns from Feed in Tariff assets, and a drift away from organic production as agreements came to an end. The prolonged CAP reform initially added more uncertainty to a difficult trading and farming year. These results highlight significant differences between ‘average’ and ‘top-third’ performing farms, across a range of efficiency measures. For example, the top third performing hill sheep farms £ per effective hectare profit was over double that of the average farm in the sample. On dairy farms top third producers made a net margin over four times that of the bottom third. Meat producers showed similar variability with lamb producers ranging from 32p/kg to losing 123p/kg, and beef producers ranging from 72p/kg to minus 62p/kg. However, all these results take no account of the cost of the farmer’s labour, the absence of which may, if misused, present a false picture of the economics of production. The dairy sector best illustrates this since labour and pension costs alone can add around 6-7p/l, pushing the top producers’ cost of production to over 27p/l and the bottom closer to 37p/l. Particular attention also needs to be given to the contribution of the Single Farm Payment (SFP), other subsidies and diversified income so that the reader can examine the contribution of the ‘farming’ enterprises to the bottom line. For example, these three sources contributed around 40% of outputs and 250% of profits, on average, for hill sheep farms.
4
Introduction
Farm profitability is central to any farm business, although farmers will have many other business and personal objectives. With changes to the CAP all farmers should be aware of their production costs and how these compare with those of other producers. The variation in performance and return demonstrated in this booklet shows the scope for improvement and by comparing or ‘benchmarking’ farm performance, potential strengths and weaknesses within the farming operation can be identified and acted upon. The results in this booklet are laid out as follows with data shown for the average and top third performers: 1. Whole Farm Data (Pages 7 – 18) A profit and loss account and summarised balance sheet for six different types of farm are presented, showing the average profit or loss for these farms and its equivalent per hectare. Also shown is the size and stocking of these farms and relevant key performance indicators. 2. Gross Margin Data (Pages 19 – 22) This booklet presents data for eight different farm enterprises. Gross margins compare income with the direct costs incurred for production. Care is needed when using gross margins since no account is taken of indirect production costs (overheads). 3. Production Costs Data (Pages 23 – 24) Production costs are presented for four farm outputs. These examine the total unit cost of production and, by allocating both direct and indirect costs (the latter being allocated on a livestock unit basis), the producer is better able to determine both the competitiveness and efficiency of the enterprise.
5
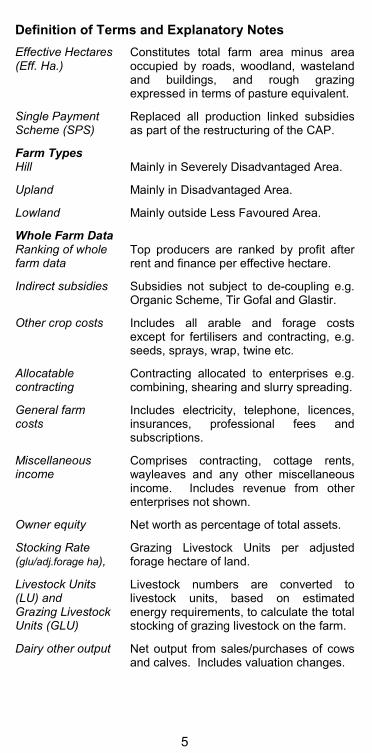
Definition of Terms and Explanatory Notes
Effective Hectares (Eff. Ha.)
Constitutes total farm area minus area occupied by roads, woodland, wasteland and buildings, and rough grazing expressed in terms of pasture equivalent.
Single Payment Scheme (SPS)
Replaced all production linked subsidies as part of the restructuring of the CAP.
Farm Types Hill Mainly in Severely Disadvantaged Area.
Upland Mainly in Disadvantaged Area.
Lowland Mainly outside Less Favoured Area.
Whole Farm Data Ranking of whole farm data
Top producers are ranked by profit after rent and finance per effective hectare.
Indirect subsidies Subsidies not subject to de-coupling e.g. Organic Scheme, Tir Gofal and Glastir.
Other crop costs Includes all arable and forage costs except for fertilisers and contracting, e.g. seeds, sprays, wrap, twine etc.
Allocatable contracting
Contracting allocated to enterprises e.g. combining, shearing and slurry spreading.
General farm costs
Includes electricity, telephone, licences, insurances, professional fees and subscriptions.
Miscellaneous income
Comprises contracting, cottage rents, wayleaves and any other miscellaneous income. Includes revenue from other enterprises not shown.
Owner equity Net worth as percentage of total assets.
Stocking Rate (glu/adj.forage ha),
Grazing Livestock Units per adjusted forage hectare of land.
Livestock Units (LU) and Grazing Livestock Units (GLU)
Livestock numbers are converted to livestock units, based on estimated energy requirements, to calculate the total stocking of grazing livestock on the farm.
Dairy other output Net output from sales/purchases of cows and calves. Includes valuation changes.
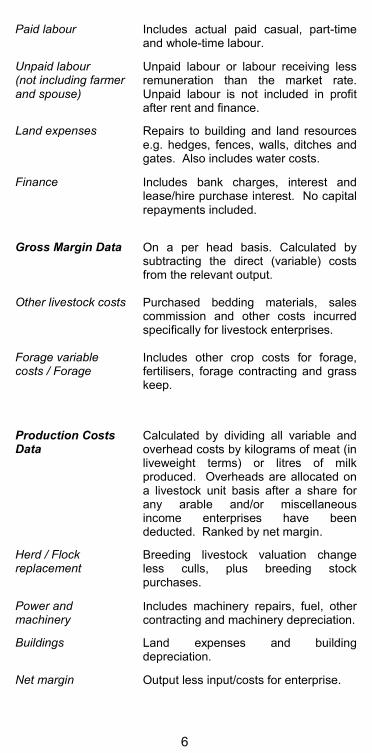
6
Paid labour Includes actual paid casual, part-time and whole-time labour.
Unpaid labour (not including farmer and spouse)
Unpaid labour or labour receiving less remuneration than the market rate. Unpaid labour is not included in profit after rent and finance.
Land expenses Repairs to building and land resources e.g. hedges, fences, walls, ditches and gates. Also includes water costs.
Finance Includes bank charges, interest and lease/hire purchase interest. No capital repayments included.
Gross Margin Data Other livestock costs Forage variable costs / Forage
On a per head basis. Calculated by subtracting the direct (variable) costs from the relevant output. Purchased bedding materials, sales commission and other costs incurred specifically for livestock enterprises. Includes other crop costs for forage, fertilisers, forage contracting and grass keep.
Production Costs Data
Calculated by dividing all variable and overhead costs by kilograms of meat (in liveweight terms) or litres of milk produced. Overheads are allocated on a livestock unit basis after a share for any arable and/or miscellaneous income enterprises have been deducted. Ranked by net margin.
Herd / Flock replacement
Breeding livestock valuation change less culls, plus breeding stock purchases.
Power and machinery
Includes machinery repairs, fuel, other contracting and machinery depreciation.
Buildings Land expenses and building depreciation.
Net margin Output less input/costs for enterprise.
7
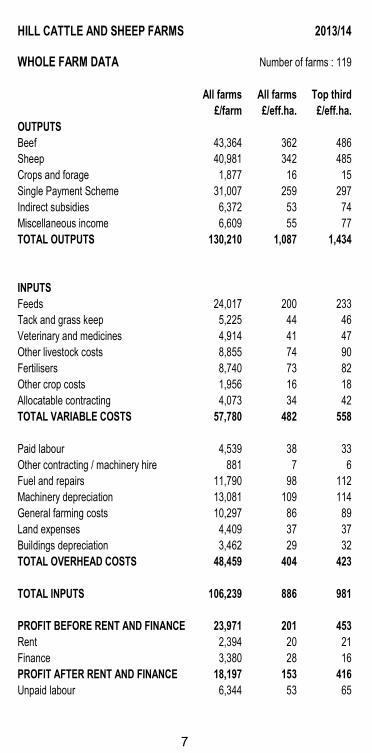
HILL CATTLE AND SHEEP FARMS 2013/14
WHOLE FARM DATA Number of farms : 119
All farms All farms Top third
£/farm £/eff.ha. £/eff.ha.
OUTPUTS
Beef 43,364 362 486
Sheep 40,981 342 485
Crops and forage 1,877 16 15
Single Payment Scheme 31,007 259 297
Indirect subsidies 6,372 53 74
Miscellaneous income 6,609 55 77
TOTAL OUTPUTS 130,210 1,087 1,434
INPUTS
Feeds 24,017 200 233
Tack and grass keep 5,225 44 46
Veterinary and medicines 4,914 41 47
Other livestock costs 8,855 74 90
Fertilisers 8,740 73 82
Other crop costs 1,956 16 18
Allocatable contracting 4,073 34 42
TOTAL VARIABLE COSTS 57,780 482 558
Paid labour 4,539 38 33
Other contracting / machinery hire 881 7 6
Fuel and repairs 11,790 98 112
Machinery depreciation 13,081 109 114
General farming costs 10,297 86 89
Land expenses 4,409 37 37
Buildings depreciation 3,462 29 32
TOTAL OVERHEAD COSTS 48,459 404 423
TOTAL INPUTS 106,239 886 981
PROFIT BEFORE RENT AND FINANCE 23,971 201 453
Rent 2,394 20 21
Finance 3,380 28 16
PROFIT AFTER RENT AND FINANCE 18,197 153 416
Unpaid labour 6,344 53 65

8
HILL CATTLE AND SHEEP FARMS 2013/14
Owned Tenant Mixed
BALANCE SHEET £/farm £/farm £/farm
Number of farms by tenure type 65 6 48
TOTAL ASSETS 1,030,522 285,677 1,050,034
TOTAL EXTERNAL LIABILITIES 86,395 52,402 80,029
NET WORTH 944,127 233,275 970,005
Owner equity (%) 92 82 92
PHYSICAL DATA All farms Top third
LAND AREA Hectares Hectares
Grassland and forage crops 105.84 92.73
Cereals and other crops 0.99 0.84
Rough grazing, fallow, woods etc. 42.28 46.95
TOTAL AREA (actual) 149.11 140.52
TOTAL AREA (effective) 119.86 103.92
All farms Top third
LIVESTOCK Numbers Numbers
Suckler cows 42 41
Other cattle 87 92
Breeding sheep 598 546
Other sheep 392 382
PERFORMANCE INDICATORS All farms Top third
Lambs reared (numbers per ewe) 1.12 1.28
Finished lamb sales (numbers per ewe) 0.83 0.91
Finished lamb sales (£ per lamb) 72.26 78.63
Calves reared (numbers per cow) 0.89 0.94
Finished cattle sales (£ per head) 1,205 1,370
Store cattle sales (£ per head) 876 945
Stocking rate (glu/adj. forage ha.) 1.05 1.17
9
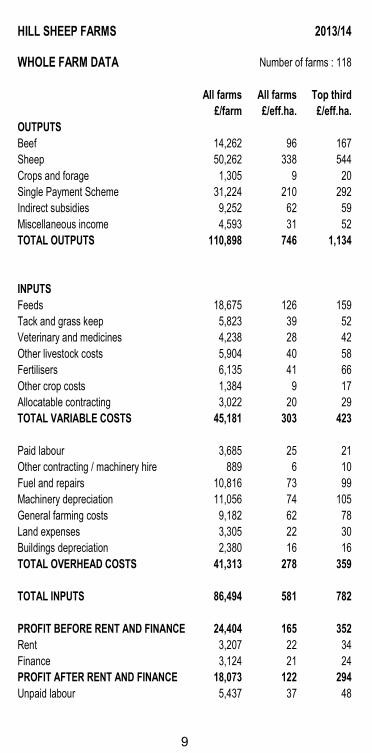
HILL SHEEP FARMS 2013/14
WHOLE FARM DATA Number of farms : 118
All farms All farms Top third
£/farm £/eff.ha. £/eff.ha.
OUTPUTS
Beef 14,262 96 167
Sheep 50,262 338 544
Crops and forage 1,305 9 20
Single Payment Scheme 31,224 210 292
Indirect subsidies 9,252 62 59
Miscellaneous income 4,593 31 52
TOTAL OUTPUTS 110,898 746 1,134
INPUTS
Feeds 18,675 126 159
Tack and grass keep 5,823 39 52
Veterinary and medicines 4,238 28 42
Other livestock costs 5,904 40 58
Fertilisers 6,135 41 66
Other crop costs 1,384 9 17
Allocatable contracting 3,022 20 29
TOTAL VARIABLE COSTS 45,181 303 423
Paid labour 3,685 25 21
Other contracting / machinery hire 889 6 10
Fuel and repairs 10,816 73 99
Machinery depreciation 11,056 74 105
General farming costs 9,182 62 78
Land expenses 3,305 22 30
Buildings depreciation 2,380 16 16
TOTAL OVERHEAD COSTS 41,313 278 359
TOTAL INPUTS 86,494 581 782
PROFIT BEFORE RENT AND FINANCE 24,404 165 352
Rent 3,207 22 34
Finance 3,124 21 24
PROFIT AFTER RENT AND FINANCE 18,073 122 294
Unpaid labour 5,437 37 48
10
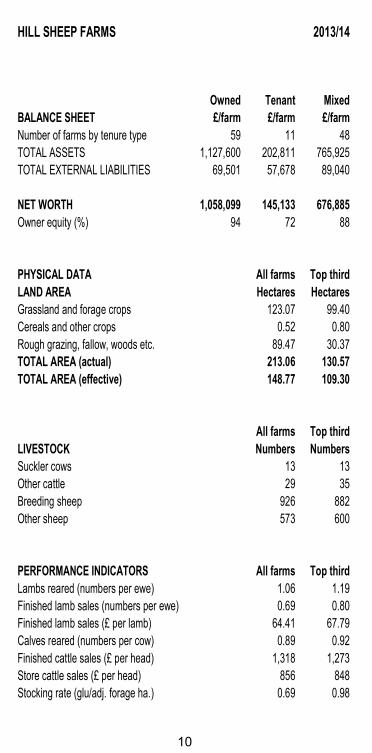
HILL SHEEP FARMS 2013/14
Owned Tenant Mixed
BALANCE SHEET £/farm £/farm £/farm
Number of farms by tenure type 59 11 48
TOTAL ASSETS 1,127,600 202,811 765,925
TOTAL EXTERNAL LIABILITIES 69,501 57,678 89,040
NET WORTH 1,058,099 145,133 676,885
Owner equity (%) 94 72 88
PHYSICAL DATA All farms Top third
LAND AREA Hectares Hectares
Grassland and forage crops 123.07 99.40
Cereals and other crops 0.52 0.80
Rough grazing, fallow, woods etc. 89.47 30.37
TOTAL AREA (actual) 213.06 130.57
TOTAL AREA (effective) 148.77 109.30
All farms Top third
LIVESTOCK Numbers Numbers
Suckler cows 13 13
Other cattle 29 35
Breeding sheep 926 882
Other sheep 573 600
PERFORMANCE INDICATORS All farms Top third
Lambs reared (numbers per ewe) 1.06 1.19
Finished lamb sales (numbers per ewe) 0.69 0.80
Finished lamb sales (£ per lamb) 64.41 67.79
Calves reared (numbers per cow) 0.89 0.92
Finished cattle sales (£ per head) 1,318 1,273
Store cattle sales (£ per head) 856 848
Stocking rate (glu/adj. forage ha.) 0.69 0.98
11
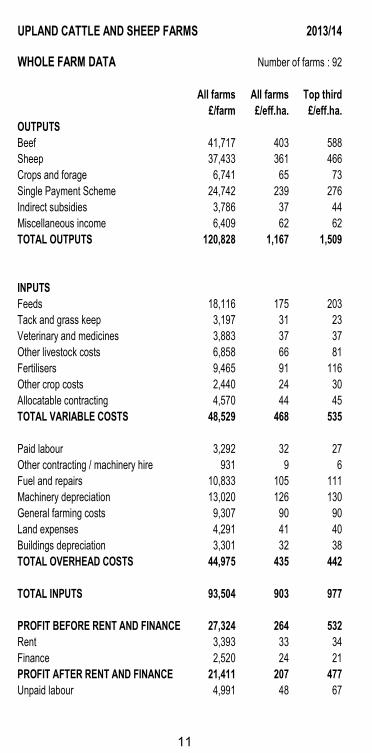
UPLAND CATTLE AND SHEEP FARMS 2013/14
WHOLE FARM DATA Number of farms : 92
All farms All farms Top third
£/farm £/eff.ha. £/eff.ha.
OUTPUTS
Beef 41,717 403 588
Sheep 37,433 361 466
Crops and forage 6,741 65 73
Single Payment Scheme 24,742 239 276
Indirect subsidies 3,786 37 44
Miscellaneous income 6,409 62 62
TOTAL OUTPUTS 120,828 1,167 1,509
INPUTS
Feeds 18,116 175 203
Tack and grass keep 3,197 31 23
Veterinary and medicines 3,883 37 37
Other livestock costs 6,858 66 81
Fertilisers 9,465 91 116
Other crop costs 2,440 24 30
Allocatable contracting 4,570 44 45
TOTAL VARIABLE COSTS 48,529 468 535
Paid labour 3,292 32 27
Other contracting / machinery hire 931 9 6
Fuel and repairs 10,833 105 111
Machinery depreciation 13,020 126 130
General farming costs 9,307 90 90
Land expenses 4,291 41 40
Buildings depreciation 3,301 32 38
TOTAL OVERHEAD COSTS 44,975 435 442
TOTAL INPUTS 93,504 903 977
PROFIT BEFORE RENT AND FINANCE 27,324 264 532
Rent 3,393 33 34
Finance 2,520 24 21
PROFIT AFTER RENT AND FINANCE 21,411 207 477
Unpaid labour 4,991 48 67
12
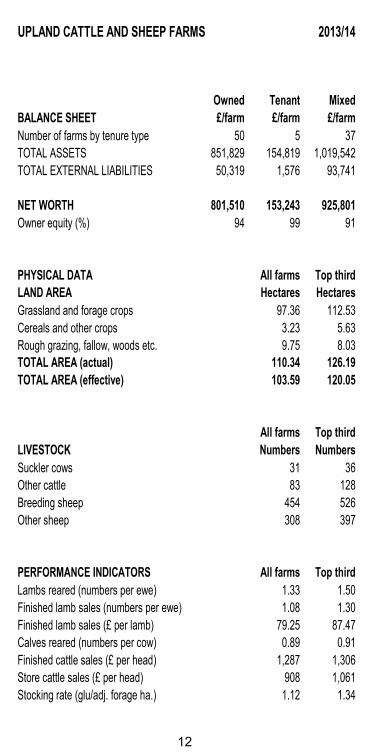
UPLAND CATTLE AND SHEEP FARMS 2013/14
Owned Tenant Mixed
BALANCE SHEET £/farm £/farm £/farm
Number of farms by tenure type 50 5 37
TOTAL ASSETS 851,829 154,819 1,019,542
TOTAL EXTERNAL LIABILITIES 50,319 1,576 93,741
NET WORTH 801,510 153,243 925,801
Owner equity (%) 94 99 91
PHYSICAL DATA All farms Top third
LAND AREA Hectares Hectares
Grassland and forage crops 97.36 112.53
Cereals and other crops 3.23 5.63
Rough grazing, fallow, woods etc. 9.75 8.03
TOTAL AREA (actual) 110.34 126.19
TOTAL AREA (effective) 103.59 120.05
All farms Top third
LIVESTOCK Numbers Numbers
Suckler cows 31 36
Other cattle 83 128
Breeding sheep 454 526
Other sheep 308 397
PERFORMANCE INDICATORS All farms Top third
Lambs reared (numbers per ewe) 1.33 1.50
Finished lamb sales (numbers per ewe) 1.08 1.30
Finished lamb sales (£ per lamb) 79.25 87.47
Calves reared (numbers per cow) 0.89 0.91
Finished cattle sales (£ per head) 1,287 1,306
Store cattle sales (£ per head) 908 1,061
Stocking rate (glu/adj. forage ha.) 1.12 1.34
13
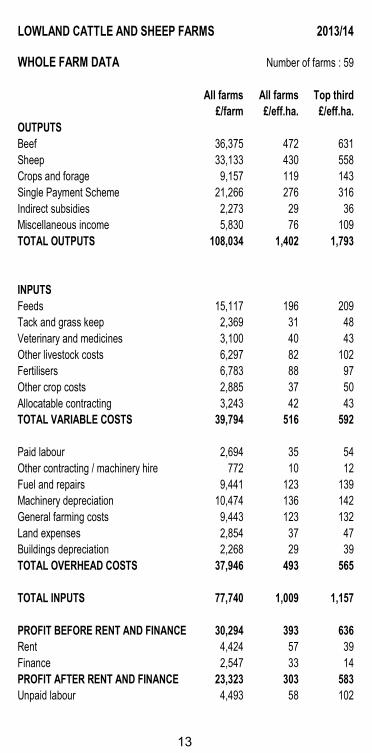
LOWLAND CATTLE AND SHEEP FARMS 2013/14
WHOLE FARM DATA Number of farms : 59
All farms All farms Top third
£/farm £/eff.ha. £/eff.ha.
OUTPUTS
Beef 36,375 472 631
Sheep 33,133 430 558
Crops and forage 9,157 119 143
Single Payment Scheme 21,266 276 316
Indirect subsidies 2,273 29 36
Miscellaneous income 5,830 76 109
TOTAL OUTPUTS 108,034 1,402 1,793
INPUTS
Feeds 15,117 196 209
Tack and grass keep 2,369 31 48
Veterinary and medicines 3,100 40 43
Other livestock costs 6,297 82 102
Fertilisers 6,783 88 97
Other crop costs 2,885 37 50
Allocatable contracting 3,243 42 43
TOTAL VARIABLE COSTS 39,794 516 592
Paid labour 2,694 35 54
Other contracting / machinery hire 772 10 12
Fuel and repairs 9,441 123 139
Machinery depreciation 10,474 136 142
General farming costs 9,443 123 132
Land expenses 2,854 37 47
Buildings depreciation 2,268 29 39
TOTAL OVERHEAD COSTS 37,946 493 565
TOTAL INPUTS 77,740 1,009 1,157
PROFIT BEFORE RENT AND FINANCE 30,294 393 636
Rent 4,424 57 39
Finance 2,547 33 14
PROFIT AFTER RENT AND FINANCE 23,323 303 583
Unpaid labour 4,493 58 102

14
LOWLAND CATTLE AND SHEEP FARMS 2013/14
Owned Tenant Mixed
BALANCE SHEET £/farm £/farm £/farm
Number of farms by tenure type 26 9 24
TOTAL ASSETS 809,048 172,245 934,487
TOTAL EXTERNAL LIABILITIES 46,080 13,468 94,086
NET WORTH 762,968 158,777 840,401
Owner equity (%) 94 92 90
PHYSICAL DATA All farms Top third
LAND AREA Hectares Hectares
Grassland and forage crops 68.85 68.13
Cereals and other crops 4.99 5.77
Rough grazing, fallow, woods etc. 7.91 9.41
TOTAL AREA (actual) 81.75 83.31
TOTAL AREA (effective) 77.06 77.71
All farms Top third
LIVESTOCK Numbers Numbers
Suckler cows 19 14
Other cattle 79 100
Breeding sheep 351 345
Other sheep 278 331
PERFORMANCE INDICATORS All farms Top third
Lambs reared (numbers per ewe) 1.36 1.48
Finished lamb sales (numbers per ewe) 1.26 1.36
Finished lamb sales (£ per lamb) 81.44 87.12
Calves reared (numbers per cow) 0.92 1.04
Finished cattle sales (£ per head) 1,344 1,488
Store cattle sales (£ per head) 881 1,094
Stocking rate (glu/adj. forage ha.) 1.32 1.43
15
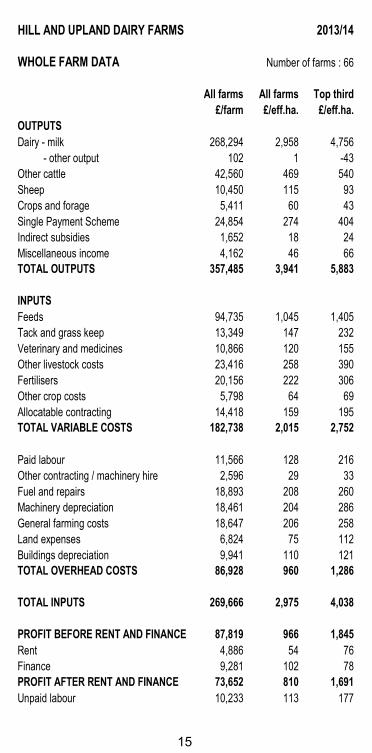
HILL AND UPLAND DAIRY FARMS 2013/14
WHOLE FARM DATA Number of farms : 66
All farms All farms Top third
£/farm £/eff.ha. £/eff.ha.
OUTPUTS
Dairy - milk 268,294 2,958 4,756
- other output 102 1 -43
Other cattle 42,560 469 540
Sheep 10,450 115 93
Crops and forage 5,411 60 43
Single Payment Scheme 24,854 274 404
Indirect subsidies 1,652 18 24
Miscellaneous income 4,162 46 66
TOTAL OUTPUTS 357,485 3,941 5,883
INPUTS
Feeds 94,735 1,045 1,405
Tack and grass keep 13,349 147 232
Veterinary and medicines 10,866 120 155
Other livestock costs 23,416 258 390
Fertilisers 20,156 222 306
Other crop costs 5,798 64 69
Allocatable contracting 14,418 159 195
TOTAL VARIABLE COSTS 182,738 2,015 2,752
Paid labour 11,566 128 216
Other contracting / machinery hire 2,596 29 33
Fuel and repairs 18,893 208 260
Machinery depreciation 18,461 204 286
General farming costs 18,647 206 258
Land expenses 6,824 75 112
Buildings depreciation 9,941 110 121
TOTAL OVERHEAD COSTS 86,928 960 1,286
TOTAL INPUTS 269,666 2,975 4,038
PROFIT BEFORE RENT AND FINANCE 87,819 966 1,845
Rent 4,886 54 76
Finance 9,281 102 78
PROFIT AFTER RENT AND FINANCE 73,652 810 1,691
Unpaid labour 10,233 113 177
16
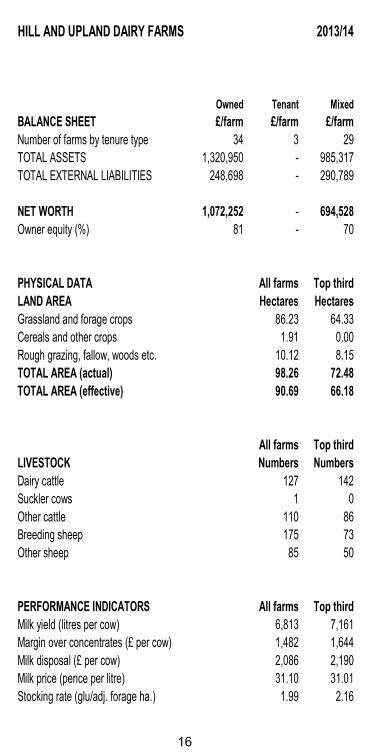
HILL AND UPLAND DAIRY FARMS 2013/14
Owned Tenant Mixed
BALANCE SHEET £/farm £/farm £/farm
Number of farms by tenure type 34 3 29
TOTAL ASSETS 1,320,950 - 985,317
TOTAL EXTERNAL LIABILITIES 248,698 - 290,789
NET WORTH 1,072,252 - 694,528
Owner equity (%) 81 - 70
PHYSICAL DATA All farms Top third
LAND AREA Hectares Hectares
Grassland and forage crops 86.23 64.33
Cereals and other crops 1.91 0.00
Rough grazing, fallow, woods etc. 10.12 8.15
TOTAL AREA (actual) 98.26 72.48
TOTAL AREA (effective) 90.69 66.18
All farms Top third
LIVESTOCK Numbers Numbers
Dairy cattle 127 142
Suckler cows 1 0
Other cattle 110 86
Breeding sheep 175 73
Other sheep 85 50
PERFORMANCE INDICATORS All farms Top third
Milk yield (litres per cow) 6,813 7,161
Margin over concentrates (£ per cow) 1,482 1,644
Milk disposal (£ per cow) 2,086 2,190
Milk price (pence per litre) 31.10 31.01
Stocking rate (glu/adj. forage ha.) 1.99 2.16
17
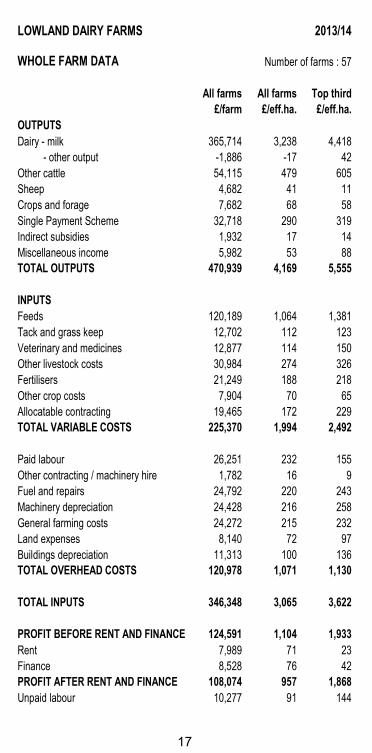
LOWLAND DAIRY FARMS 2013/14
WHOLE FARM DATA Number of farms : 57
All farms All farms Top third
£/farm £/eff.ha. £/eff.ha.
OUTPUTS
Dairy - milk 365,714 3,238 4,418
- other output -1,886 -17 42
Other cattle 54,115 479 605
Sheep 4,682 41 11
Crops and forage 7,682 68 58
Single Payment Scheme 32,718 290 319
Indirect subsidies 1,932 17 14
Miscellaneous income 5,982 53 88
TOTAL OUTPUTS 470,939 4,169 5,555
INPUTS
Feeds 120,189 1,064 1,381
Tack and grass keep 12,702 112 123
Veterinary and medicines 12,877 114 150
Other livestock costs 30,984 274 326
Fertilisers 21,249 188 218
Other crop costs 7,904 70 65
Allocatable contracting 19,465 172 229
TOTAL VARIABLE COSTS 225,370 1,994 2,492
Paid labour 26,251 232 155
Other contracting / machinery hire 1,782 16 9
Fuel and repairs 24,792 220 243
Machinery depreciation 24,428 216 258
General farming costs 24,272 215 232
Land expenses 8,140 72 97
Buildings depreciation 11,313 100 136
TOTAL OVERHEAD COSTS 120,978 1,071 1,130
TOTAL INPUTS 346,348 3,065 3,622
PROFIT BEFORE RENT AND FINANCE 124,591 1,104 1,933
Rent 7,989 71 23
Finance 8,528 76 42
PROFIT AFTER RENT AND FINANCE 108,074 957 1,868
Unpaid labour 10,277 91 144
18
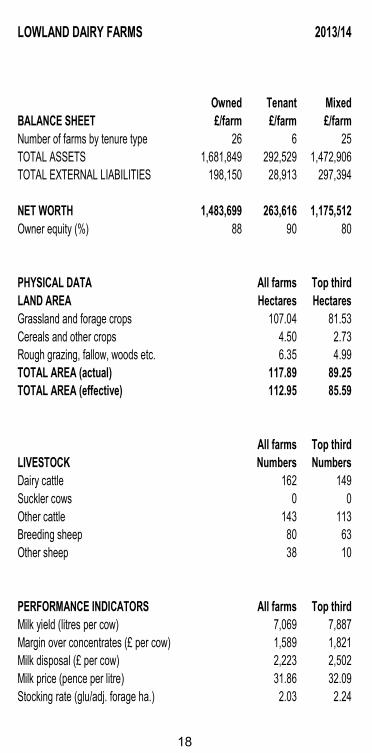
LOWLAND DAIRY FARMS 2013/14
Owned Tenant Mixed
BALANCE SHEET £/farm £/farm £/farm
Number of farms by tenure type 26 6 25
TOTAL ASSETS 1,681,849 292,529 1,472,906
TOTAL EXTERNAL LIABILITIES 198,150 28,913 297,394
NET WORTH 1,483,699 263,616 1,175,512
Owner equity (%) 88 90 80
PHYSICAL DATA All farms Top third
LAND AREA Hectares Hectares
Grassland and forage crops 107.04 81.53
Cereals and other crops 4.50 2.73
Rough grazing, fallow, woods etc. 6.35 4.99
TOTAL AREA (actual) 117.89 89.25
TOTAL AREA (effective) 112.95 85.59
All farms Top third
LIVESTOCK Numbers Numbers
Dairy cattle 162 149
Suckler cows 0 0
Other cattle 143 113
Breeding sheep 80 63
Other sheep 38 10
PERFORMANCE INDICATORS All farms Top third
Milk yield (litres per cow) 7,069 7,887
Margin over concentrates (£ per cow) 1,589 1,821
Milk disposal (£ per cow) 2,223 2,502
Milk price (pence per litre) 31.86 32.09
Stocking rate (glu/adj. forage ha.) 2.03 2.24

19
GROSS MARGINS : HILL SHEEP 2013/14All flocks Top third
Number of flocks in sample 212 71Flock size (ewes and ewe lambs put to ram) 665 550
Lambs reared (numbers per ewe) 1.07 1.30
ENTERPRISE OUTPUT £ per ewe £ per ewe
Lamb sales - store 3.58 3.32
- finished 50.25 72.47
Other sheep sales 13.61 18.58
Wool sales 1.76 1.97
Miscellaneous 0.03 0.01
Valuation change 0.39 2.96
Sheep purchases -5.92 -8.03
TOTAL ENTERPRISE OUTPUT 63.70 91.28
VARIABLE COSTS
Concentrates and bulk feed 18.77 20.43
Stock keep 3.06 2.58
Veterinary and medicines 4.47 5.04
Other livestock costs 5.49 6.67
Allocatable contracting 1.08 1.14
Forage variable costs 11.46 12.31
TOTAL VARIABLE COSTS 44.33 48.17
GROSS MARGIN 19.37 43.11
GROSS MARGINS : UPLAND SHEEP 2013/14
All flocks Top third
Number of flocks in sample 71 24Flock size (ewes and ewe lambs put to ram) 485 527
Lambs reared (numbers per ewe) 1.36 1.55
ENTERPRISE OUTPUT £ per ewe £ per ewe
Lamb sales - store 3.08 4.69
- finished 91.52 113.20
Other sheep sales 14.28 19.38
Wool sales 2.27 2.13
Miscellaneous 0.04 0.01
Valuation change 0.02 4.57
Sheep purchases -15.35 -21.33
TOTAL ENTERPRISE OUTPUT 95.86 122.65
VARIABLE COSTS
Concentrates and bulk feed 23.85 21.89
Stock keep 1.19 0.74
Veterinary and medicines 5.49 5.11
Other livestock costs 7.18 8.05
Allocatable contracting 1.23 1.28
Forage variable costs 16.60 13.91
TOTAL VARIABLE COSTS 55.54 50.98
GROSS MARGIN 40.32 71.67
20
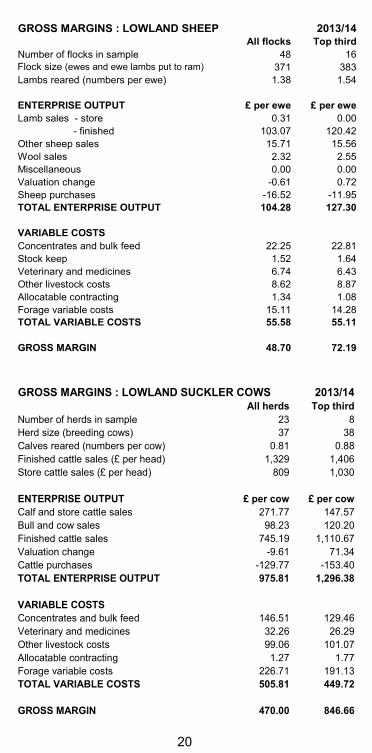
GROSS MARGINS : LOWLAND SHEEP 2013/14All flocks Top third
Number of flocks in sample 48 16Flock size (ewes and ewe lambs put to ram) 371 383
Lambs reared (numbers per ewe) 1.38 1.54
ENTERPRISE OUTPUT £ per ewe £ per ewe
Lamb sales - store 0.31 0.00
- finished 103.07 120.42
Other sheep sales 15.71 15.56
Wool sales 2.32 2.55
Miscellaneous 0.00 0.00
Valuation change -0.61 0.72
Sheep purchases -16.52 -11.95
TOTAL ENTERPRISE OUTPUT 104.28 127.30
VARIABLE COSTS
Concentrates and bulk feed 22.25 22.81
Stock keep 1.52 1.64
Veterinary and medicines 6.74 6.43
Other livestock costs 8.62 8.87
Allocatable contracting 1.34 1.08
Forage variable costs 15.11 14.28
TOTAL VARIABLE COSTS 55.58 55.11
GROSS MARGIN 48.70 72.19
GROSS MARGINS : LOWLAND SUCKLER COWS 2013/14
All herds Top third
Number of herds in sample 23 8
Herd size (breeding cows) 37 38
Calves reared (numbers per cow) 0.81 0.88
Finished cattle sales (£ per head) 1,329 1,406
Store cattle sales (£ per head) 809 1,030
ENTERPRISE OUTPUT £ per cow £ per cow
Calf and store cattle sales 271.77 147.57
Bull and cow sales 98.23 120.20
Finished cattle sales 745.19 1,110.67
Valuation change -9.61 71.34
Cattle purchases -129.77 -153.40
TOTAL ENTERPRISE OUTPUT 975.81 1,296.38
VARIABLE COSTS
Concentrates and bulk feed 146.51 129.46
Veterinary and medicines 32.26 26.29
Other livestock costs 99.06 101.07
Allocatable contracting 1.27 1.77
Forage variable costs 226.71 191.13
TOTAL VARIABLE COSTS 505.81 449.72
GROSS MARGIN 470.00 846.66
21
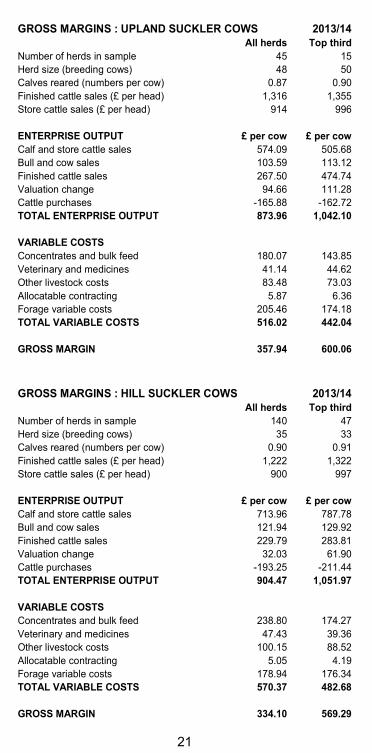
GROSS MARGINS : UPLAND SUCKLER COWS 2013/14All herds Top third
Number of herds in sample 45 15
Herd size (breeding cows) 48 50
Calves reared (numbers per cow) 0.87 0.90
Finished cattle sales (£ per head) 1,316 1,355
Store cattle sales (£ per head) 914 996
ENTERPRISE OUTPUT £ per cow £ per cow
Calf and store cattle sales 574.09 505.68
Bull and cow sales 103.59 113.12
Finished cattle sales 267.50 474.74
Valuation change 94.66 111.28
Cattle purchases -165.88 -162.72
TOTAL ENTERPRISE OUTPUT 873.96 1,042.10
VARIABLE COSTS
Concentrates and bulk feed 180.07 143.85
Veterinary and medicines 41.14 44.62
Other livestock costs 83.48 73.03
Allocatable contracting 5.87 6.36
Forage variable costs 205.46 174.18
TOTAL VARIABLE COSTS 516.02 442.04
GROSS MARGIN 357.94 600.06 GROSS MARGINS : HILL SUCKLER COWS 2013/14
All herds Top third
Number of herds in sample 140 47
Herd size (breeding cows) 35 33
Calves reared (numbers per cow) 0.90 0.91
Finished cattle sales (£ per head) 1,222 1,322
Store cattle sales (£ per head) 900 997
ENTERPRISE OUTPUT £ per cow £ per cow
Calf and store cattle sales 713.96 787.78
Bull and cow sales 121.94 129.92
Finished cattle sales 229.79 283.81
Valuation change 32.03 61.90
Cattle purchases -193.25 -211.44
TOTAL ENTERPRISE OUTPUT 904.47 1,051.97
VARIABLE COSTS
Concentrates and bulk feed 238.80 174.27
Veterinary and medicines 47.43 39.36
Other livestock costs 100.15 88.52
Allocatable contracting 5.05 4.19
Forage variable costs 178.94 176.34
TOTAL VARIABLE COSTS 570.37 482.68
GROSS MARGIN 334.10 569.29

22
GROSS MARGINS : HILL AND UPLAND DAIRY 2013/14All herds Top third
Number of herds in sample 72 24
Herd size (dairy cows) 122 114
Milk yield (litres per cow) 6,791 8,006
Milk price (pence per litre) 31.05 31.61
ENTERPRISE OUTPUT £ per cow £ per cow
Milk 2,109.37 2,530.53
Calves 124.36 143.72
Bull and cow sales 155.75 202.00
Valuation change 103.36 62.38
Cattle purchases -377.13 -347.31
TOTAL ENTERPRISE OUTPUT 2,115.71 2,591.32
VARIABLE COSTS
Concentrates and bulk feed 614.78 637.19
Veterinary and medicines 68.59 78.27
Other livestock costs 142.97 136.77
Allocatable contracting 19.86 10.58
Forage variable costs 207.58 231.05
TOTAL VARIABLE COSTS 1,053.78 1,093.86
GROSS MARGIN 1,061.93 1,497.46 GROSS MARGINS : LOWLAND DAIRY 2013/14
All herds Top third
Number of herds in sample 57 19
Herd size (dairy cows) 162 132
Milk yield (litres per cow) 7,069 8,369
Milk price (pence per litre) 31.86 31.87
ENTERPRISE OUTPUT £ per cow £ per cow
Milk 2,251.96 2,666.69
Calves 101.08 118.14
Bull and cow sales 150.26 183.50
Valuation change 52.30 30.68
Cattle purchases -315.25 -263.78
TOTAL ENTERPRISE OUTPUT 2,240.35 2,735.23
VARIABLE COSTS
Concentrates and bulk feed 672.49 693.49
Veterinary and medicines 70.46 74.33
Other livestock costs 160.57 172.36
Allocatable contracting 30.66 26.68
Forage variable costs 192.52 247.03
TOTAL VARIABLE COSTS 1,126.70 1,213.89
GROSS MARGIN 1,113.65 1,521.34

23
LAMB PRODUCTION COSTS 2013/14
Pence per kg liveweight Top Bottom
All farms third third
Number of farms 136 45 45
Feed 50.97 41.13 62.64
Veterinary and medicines 11.22 9.43 13.30
Other livestock costs 16.98 15.79 18.96
Forage 28.37 21.16 36.12
TOTAL VARIABLE COSTS 107.54 87.51 131.02
FLOCK REPLACEMENT 20.58 14.46 27.79
Paid labour 6.13 4.21 8.26
Power and machinery 48.22 32.49 68.81
Buildings 12.71 8.14 17.18
General farm costs 20.23 14.58 28.79
Rent 7.40 4.42 12.02
Finance 6.11 1.58 10.46
TOTAL OVERHEAD COSTS 100.80 65.42 145.52
TOTAL COSTS 228.92 167.39 304.33
NET MARGIN -39.45 31.88 -122.74
Lambs reared (nos. per ewe) 1.29 1.47 1.09
Flock size 641 530 675
Average lamb liveweight (kg) 38.79 40.74 36.16
MILK PRODUCTION COSTS 2013/14
Pence per litre Top Bottom
All farms third third
Number of farms 119 40 40
Feed 8.68 7.35 9.86
Veterinary and medicines 0.98 0.83 1.10
Other livestock costs 2.59 2.08 3.10
Forage 2.86 2.60 3.28
TOTAL VARIABLE COSTS 15.11 12.86 17.34
HERD REPLACEMENT 1.86 1.32 2.63
Paid labour 0.91 0.51 1.55
Power and machinery 3.03 2.80 3.31
Buildings 1.16 1.06 1.40
General farm costs 1.51 1.34 1.80
Rent 0.38 0.29 0.43
Finance 0.56 0.22 1.08
TOTAL OVERHEAD COSTS 7.55 6.22 9.57
TOTAL COSTS 24.52 20.40 29.54
NET MARGIN 8.36 13.20 3.19
Margin over concentrates 22.65 24.47 21.24
Milk price 31.06 31.59 30.78

24
BEEF PRODUCTION COSTS : SUCKLED CALF 2013/14
Pence per kg liveweight Top Bottom
All farms third third
Number of farms 74 25 25
Feed 25.21 15.18 42.27
Veterinary and medicines 12.55 8.58 15.81
Other livestock costs 19.16 13.42 30.69
Forage 49.46 41.29 59.54
TOTAL VARIABLE COSTS 106.38 78.47 148.31
HERD REPLACEMENT 10.75 1.85 17.70
Paid labour 10.53 4.02 16.61
Power and machinery 82.18 59.80 114.19
Buildings 24.00 15.86 34.66
General farm costs 32.97 26.68 43.79
Rent 5.54 3.62 6.36
Finance 9.97 4.15 19.17
TOTAL OVERHEAD COSTS 165.19 114.13 234.78
TOTAL COSTS 282.32 194.45 400.79
NET MARGIN -111.40 -6.96 -241.52
Suckled calf production covers suckler cow and calf costs up to weaning.
BEEF PRODUCTION COSTS : FINISHING 2013/14
Pence per kg liveweight Top Bottom
All farms third third
Number of farms 25 8 8
Feed 63.35 47.46 79.96
Veterinary and medicines 4.32 4.04 4.19
Other livestock costs 31.23 33.08 32.20
Forage 41.34 45.71 40.93
TOTAL VARIABLE COSTS 140.24 130.29 157.28
Paid labour 7.37 2.22 9.45
Power and machinery 58.51 60.62 65.85
Buildings 15.42 13.15 21.53
General farm costs 21.60 22.38 23.75
Rent 7.85 13.25 4.32
Finance 7.64 4.44 14.57
TOTAL OVERHEAD COSTS 118.39 116.06 139.47
TOTAL COSTS 258.63 246.35 296.75
NET MARGIN 3.81 72.35 -62.05
Finishing enterprises include those purchasing young and forward store cattle, as well as those finishing weaned home-bred calves.
25
Farming Connect – providing support, advice and guidance to help your farm or forestry business reach its potential
Our regionally based delivery staff can help you access a package of support, tailored to supporting and developing your business. Our wide range of fully funded Farming Connect events, meetings, discussion groups and workshops, will keep you up to date with the latest technical information and guidance, while also enabling you to:
Consider new ideas and more efficient ways of working
Benefit from technical and business support
Reduce inputs and increase efficiency
Identify areas for improvement and find solutions to problems
Keep up to date with industry developments and benchmark your performance
Share best practice and benefit from the knowledge and expertise of other farmers and industry experts
For more information on the current Farming Connect programme visit www.farmingconnect.co.uk or keep up to date by visiting www.wales.gov.uk/gwlad Farming Connect is funded through the Rural Development Plan for Wales 2007-2013 which is financed by the European Agricultural Fund for Rural Development and the Welsh Government. The current Farming Connect Programme will continue until 31 March 2015. A new programme of support may be made available through the Welsh Government’s proposed Knowledge Transfer and Advisory services within the Rural Development Programme for Wales 2014-2020. The Wales Rural Development Programme 2014-2020 schemes are subject to change until the full programme has been agreed by the European Commission