Embed Size (px)
Citation preview

The Features of World-Class
Universities
Hsiou-Hsia Tai
Professor, Institute of Education
Associate Dean, College of Humanities and Social Sciences
National Chiao Tung University
Hsin-chu, Taiwan
Introduction
Research Method
Top 10 Private American Universities
Top 10 Public American Universities
Top 10 British Universities
10 European Continent Universities
Top 7 Asian-Pacific Universities
A Summary of Institutional Characteristics
The article aims to address the question of “What is a world-class university?” by analyzing the features
shared by most of the top-ranking universities in various areas of the world.
Introduction
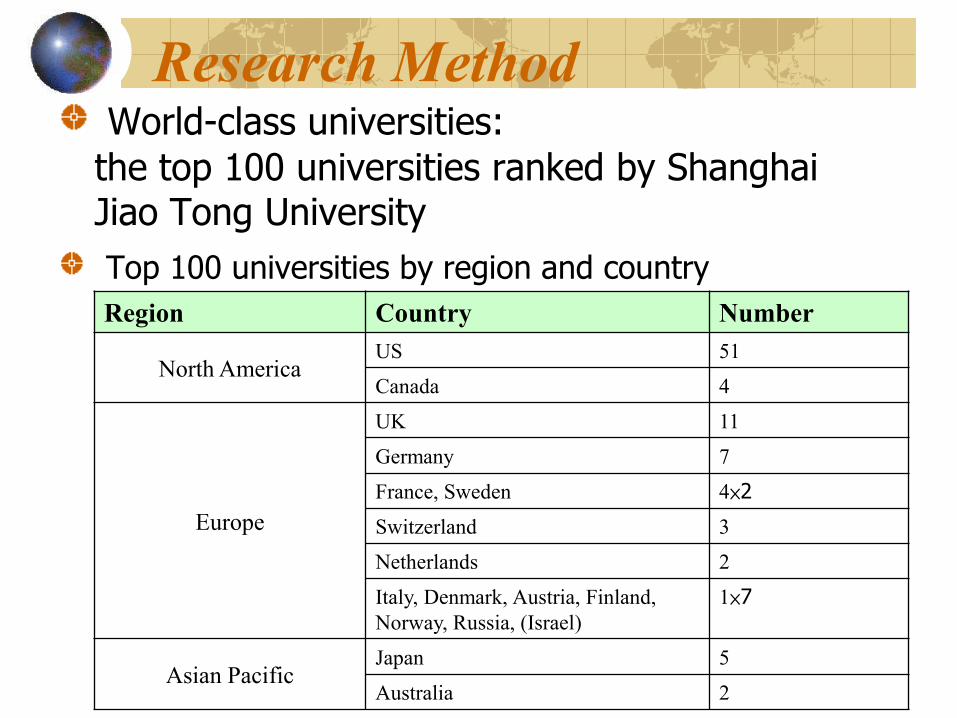
Research MethodWorld-class universities:
the top 100 universities ranked by Shanghai Jiao Tong University
Top 100 universities by region and country
Region Country Number
North AmericaUS 51
Canada 4
Europe
UK 11
Germany 7
France, Sweden 4 × 2
Switzerland 3
Netherlands 2
Italy, Denmark, Austria, Finland,
Norway, Russia, (Israel)
1 × 7
Asian PacificJapan 5
Australia 2
The Shanghai ranking has a rather complete set of data about the research performance of the high-quality universities.
This study pays attention to other aspects of those universities including: total enrollment, undergraduate graduate ratio, number and percentage of international students, number of faculty, student faculty ratio, number of administrative and technical staff, faculty staff ratio, annual revenue and annual expenditures and annual revenue/expenditures per student.
Due to the inadequacy of institutional data collected by national bodies, the study gathers data mainly from the websites of individual universities.
To make comparison of top-ranking universities in various countries/regions more feasible, out of the top 100 universities, the study focuses on the top 10 private and top 10 public universities in the US, top 10 in the UK and 10 in European continent and the top 7 in the Asian-Pacific region.
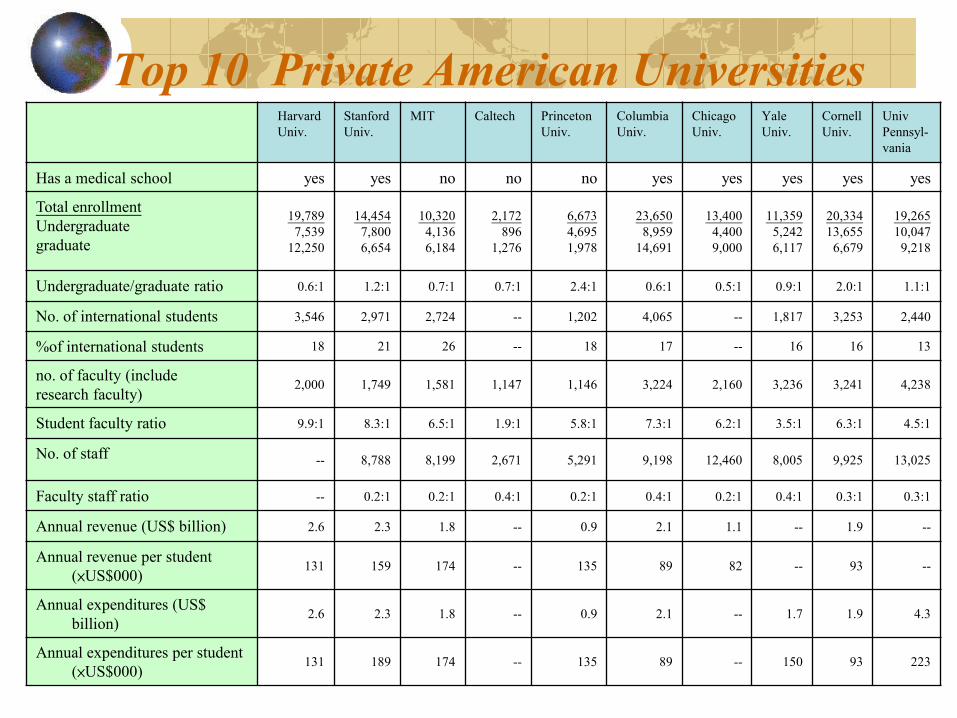
Top 10 Private American UniversitiesHarvard
Univ.
Stanford
Univ.
MIT Caltech Princeton
Univ.
Columbia
Univ.
Chicago
Univ.
Yale
Univ.
Cornell
Univ.
Univ
Pennsyl-
vania
Has a medical school yes yes no no no yes yes yes yes yes
Total enrollment
Undergraduate
graduate
19,789
7,539
12,250
14,454
7,800
6,654
10,320
4,136
6,184
2,172
896
1,276
6,673
4,695
1,978
23,650
8,959
14,691
13,400
4,400
9,000
11,359
5,242
6,117
20,334
13,655
6,679
19,265
10,047
9,218
Undergraduate/graduate ratio 0.6:1 1.2:1 0.7:1 0.7:1 2.4:1 0.6:1 0.5:1 0.9:1 2.0:1 1.1:1
No. of international students 3,546 2,971 2,724 -- 1,202 4,065 -- 1,817 3,253 2,440
%of international students 18 21 26 -- 18 17 -- 16 16 13
no. of faculty (include
research faculty)2,000 1,749 1,581 1,147 1,146 3,224 2,160 3,236 3,241 4,238
Student faculty ratio 9.9:1 8.3:1 6.5:1 1.9:1 5.8:1 7.3:1 6.2:1 3.5:1 6.3:1 4.5:1
No. of staff -- 8,788 8,199 2,671 5,291 9,198 12,460 8,005 9,925 13,025
Faculty staff ratio -- 0.2:1 0.2:1 0.4:1 0.2:1 0.4:1 0.2:1 0.4:1 0.3:1 0.3:1
Annual revenue (US$ billion) 2.6 2.3 1.8 -- 0.9 2.1 1.1 -- 1.9 --
Annual revenue per student
(×US$000)131 159 174 -- 135 89 82 -- 93 --
Annual expenditures (US$
billion)2.6 2.3 1.8 -- 0.9 2.1 -- 1.7 1.9 4.3
Annual expenditures per student
(×US$000)131 189 174 -- 135 89 -- 150 93 223
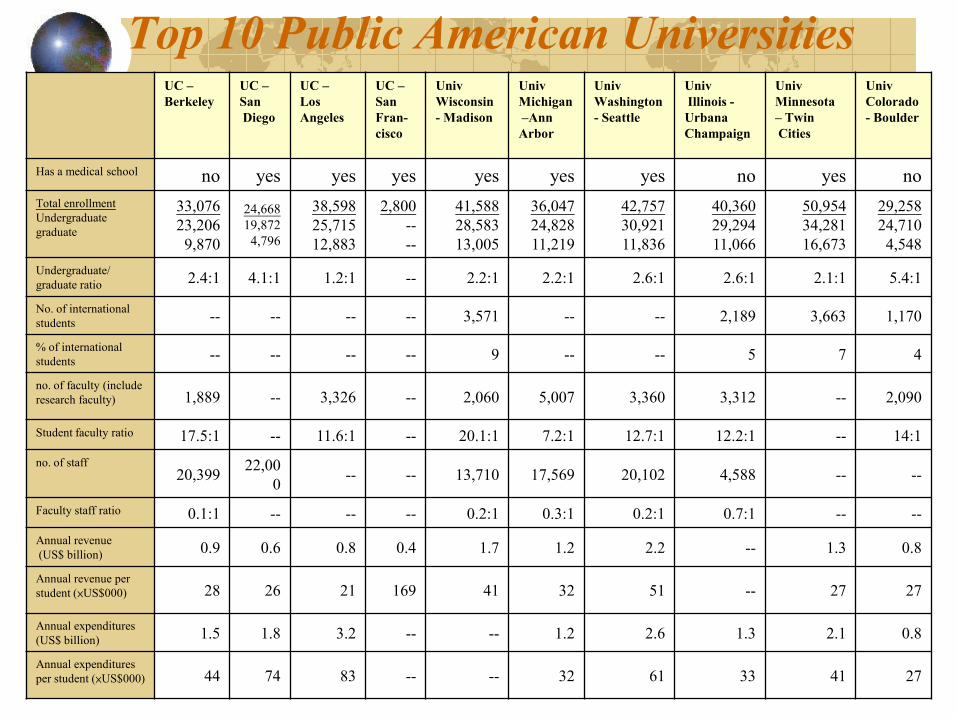
Top 10 Public American UniversitiesUC –
Berkeley
UC –
San
Diego
UC –
Los
Angeles
UC –
San
Fran-
cisco
Univ
Wisconsin
- Madison
Univ
Michigan
–Ann
Arbor
Univ
Washington
- Seattle
Univ
Illinois -
Urbana
Champaign
Univ
Minnesota
– Twin
Cities
Univ
Colorado
- Boulder
Has a medical school no yes yes yes yes yes yes no yes no
Total enrollment
Undergraduate
graduate
33,076
23,206
9,870
24,668
19,872
4,796
38,598
25,715
12,883
2,800
--
--
41,588
28,583
13,005
36,047
24,828
11,219
42,757
30,921
11,836
40,360
29,294
11,066
50,954
34,281
16,673
29,258
24,710
4,548
Undergraduate/
graduate ratio2.4:1 4.1:1 1.2:1 -- 2.2:1 2.2:1 2.6:1 2.6:1 2.1:1 5.4:1
No. of international
students-- -- -- -- 3,571 -- -- 2,189 3,663 1,170
% of international
students-- -- -- -- 9 -- -- 5 7 4
no. of faculty (include
research faculty) 1,889 -- 3,326 -- 2,060 5,007 3,360 3,312 -- 2,090
Student faculty ratio 17.5:1 -- 11.6:1 -- 20.1:1 7.2:1 12.7:1 12.2:1 -- 14:1
no. of staff20,399
22,00
0-- -- 13,710 17,569 20,102 4,588 -- --
Faculty staff ratio 0.1:1 -- -- -- 0.2:1 0.3:1 0.2:1 0.7:1 -- --
Annual revenue
(US$ billion)0.9 0.6 0.8 0.4 1.7 1.2 2.2 -- 1.3 0.8
Annual revenue per
student (×US$000) 28 26 21 169 41 32 51 -- 27 27
Annual expenditures
(US$ billion)1.5 1.8 3.2 -- -- 1.2 2.6 1.3 2.1 0.8
Annual expenditures
per student (×US$000) 44 74 83 -- -- 32 61 33 41 27
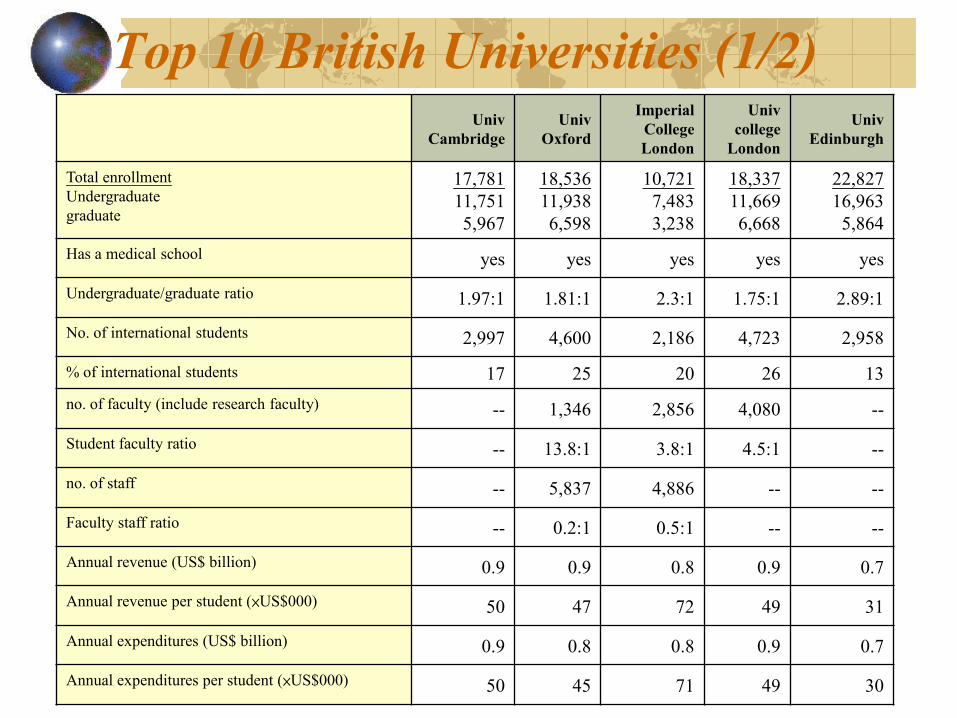
Top 10 British Universities (1/2)Univ
Cambridge
Univ
Oxford
Imperial
College
London
Univ
college
London
Univ
Edinburgh
Total enrollment
Undergraduate
graduate
17,781
11,751
5,967
18,536
11,938
6,598
10,721
7,483
3,238
18,337
11,669
6,668
22,827
16,963
5,864
Has a medical school yes yes yes yes yes
Undergraduate/graduate ratio 1.97:1 1.81:1 2.3:1 1.75:1 2.89:1
No. of international students 2,997 4,600 2,186 4,723 2,958
% of international students 17 25 20 26 13
no. of faculty (include research faculty) -- 1,346 2,856 4,080 --
Student faculty ratio -- 13.8:1 3.8:1 4.5:1 --
no. of staff -- 5,837 4,886 -- --
Faculty staff ratio -- 0.2:1 0.5:1 -- --
Annual revenue (US$ billion) 0.9 0.9 0.8 0.9 0.7
Annual revenue per student (×US$000) 50 47 72 49 31
Annual expenditures (US$ billion) 0.9 0.8 0.8 0.9 0.7
Annual expenditures per student (×US$000) 50 45 71 49 30
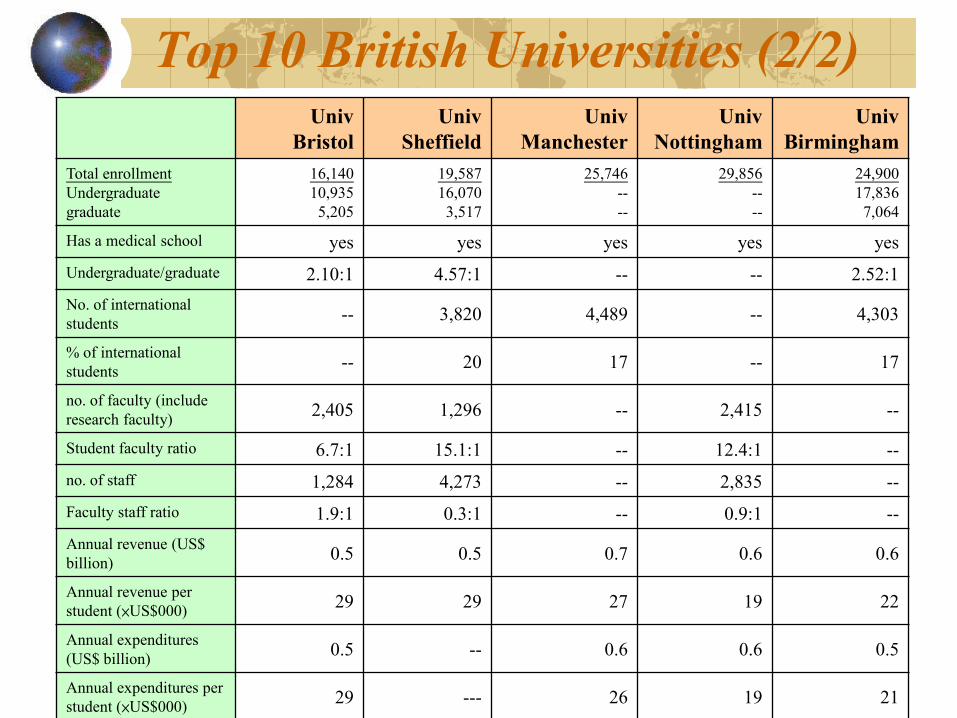
Top 10 British Universities (2/2)Univ
Bristol
Univ
Sheffield
Univ
Manchester
Univ
Nottingham
Univ
Birmingham
Total enrollment
Undergraduate
graduate
16,140
10,935
5,205
19,587
16,070
3,517
25,746
--
--
29,856
--
--
24,900
17,836
7,064
Has a medical school yes yes yes yes yes
Undergraduate/graduate 2.10:1 4.57:1 -- -- 2.52:1
No. of international
students-- 3,820 4,489 -- 4,303
% of international
students-- 20 17 -- 17
no. of faculty (include
research faculty)2,405 1,296 -- 2,415 --
Student faculty ratio 6.7:1 15.1:1 -- 12.4:1 --
no. of staff 1,284 4,273 -- 2,835 --
Faculty staff ratio 1.9:1 0.3:1 -- 0.9:1 --
Annual revenue (US$
billion) 0.5 0.5 0.7 0.6 0.6
Annual revenue per
student (×US$000)29 29 27 19 22
Annual expenditures
(US$ billion)0.5 -- 0.6 0.6 0.5
Annual expenditures per
student (×US$000)29 --- 26 19 21
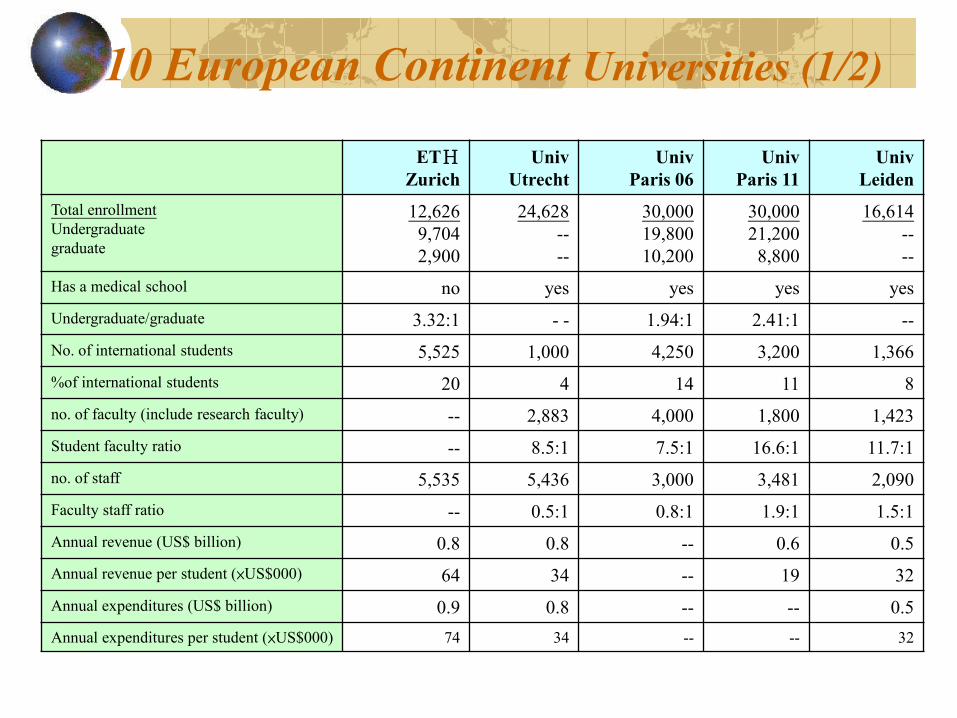
10 European Continent Universities (1/2)
ETHZurich
Univ
Utrecht
Univ
Paris 06
Univ
Paris 11
Univ
Leiden
Total enrollment
Undergraduate
graduate
12,626
9,704
2,900
24,628
--
--
30,000
19,800
10,200
30,000
21,200
8,800
16,614
--
--
Has a medical school no yes yes yes yes
Undergraduate/graduate 3.32:1 - - 1.94:1 2.41:1 --
No. of international students 5,525 1,000 4,250 3,200 1,366
%of international students 20 4 14 11 8
no. of faculty (include research faculty) -- 2,883 4,000 1,800 1,423
Student faculty ratio -- 8.5:1 7.5:1 16.6:1 11.7:1
no. of staff 5,535 5,436 3,000 3,481 2,090
Faculty staff ratio -- 0.5:1 0.8:1 1.9:1 1.5:1
Annual revenue (US$ billion) 0.8 0.8 -- 0.6 0.5
Annual revenue per student (×US$000) 64 34 -- 19 32
Annual expenditures (US$ billion) 0.9 0.8 -- -- 0.5
Annual expenditures per student (×US$000) 74 34 -- -- 32
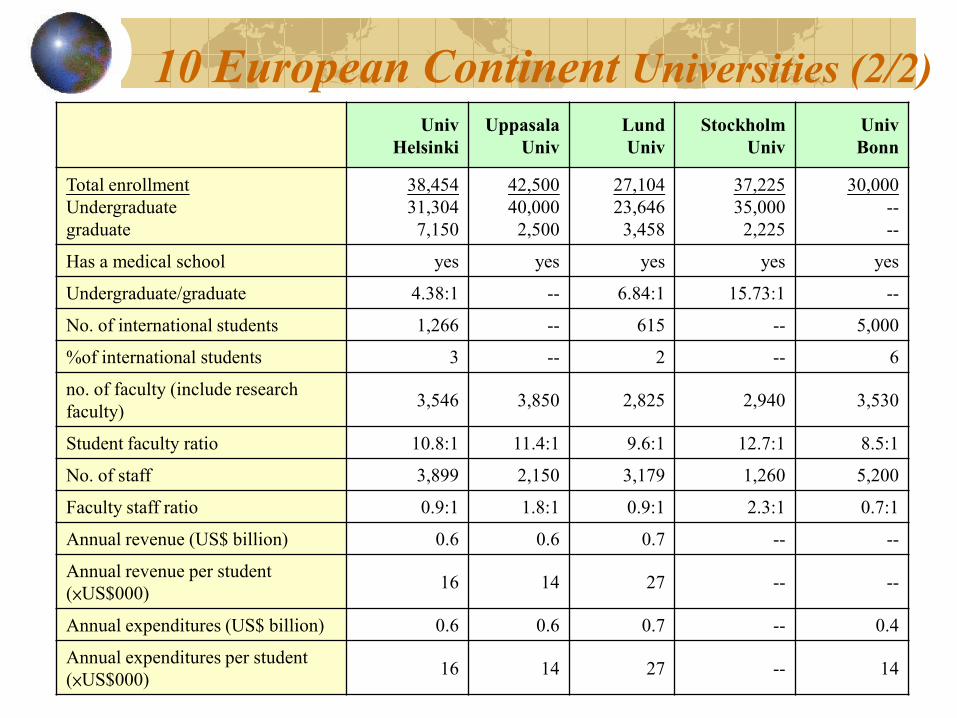
10 European Continent Universities (2/2)
Univ
Helsinki
Uppasala
Univ
Lund
Univ
Stockholm
Univ
Univ
Bonn
Total enrollment
Undergraduate
graduate
38,454
31,304
7,150
42,500
40,000
2,500
27,104
23,646
3,458
37,225
35,000
2,225
30,000
--
--
Has a medical school yes yes yes yes yes
Undergraduate/graduate 4.38:1 -- 6.84:1 15.73:1 --
No. of international students 1,266 -- 615 -- 5,000
%of international students 3 -- 2 -- 6
no. of faculty (include research
faculty)3,546 3,850 2,825 2,940 3,530
Student faculty ratio 10.8:1 11.4:1 9.6:1 12.7:1 8.5:1
No. of staff 3,899 2,150 3,179 1,260 5,200
Faculty staff ratio 0.9:1 1.8:1 0.9:1 2.3:1 0.7:1
Annual revenue (US$ billion) 0.6 0.6 0.7 -- --
Annual revenue per student
(×US$000)16 14 27 -- --
Annual expenditures (US$ billion) 0.6 0.6 0.7 -- 0.4
Annual expenditures per student
(×US$000)16 14 27 -- 14
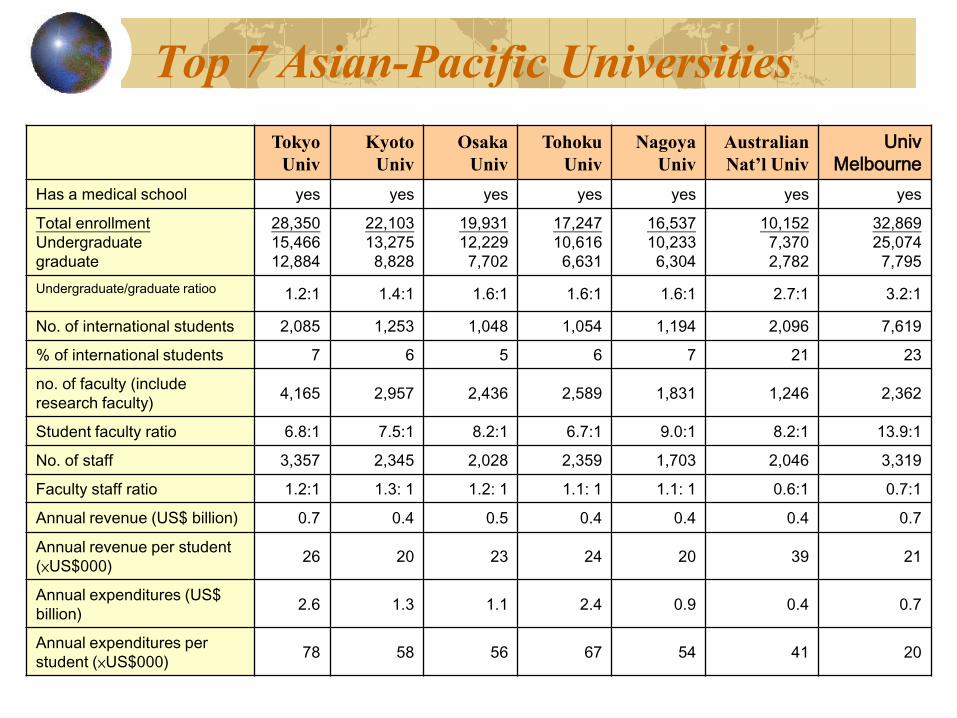
Top 7 Asian-Pacific Universities
Tokyo
Univ
Kyoto
Univ
Osaka
Univ
Tohoku
Univ
Nagoya
Univ
Australian
Nat’l Univ
Univ
Melbourne
Has a medical school yes yes yes yes yes yes yes
Total enrollment
Undergraduate
graduate
28,350
15,466
12,884
22,103
13,275
8,828
19,931
12,229
7,702
17,247
10,616
6,631
16,537
10,233
6,304
10,152
7,370
2,782
32,869
25,074
7,795
Undergraduate/graduate ratioo 1.2:1 1.4:1 1.6:1 1.6:1 1.6:1 2.7:1 3.2:1
No. of international students 2,085 1,253 1,048 1,054 1,194 2,096 7,619
% of international students 7 6 5 6 7 21 23
no. of faculty (include
research faculty)4,165 2,957 2,436 2,589 1,831 1,246 2,362
Student faculty ratio 6.8:1 7.5:1 8.2:1 6.7:1 9.0:1 8.2:1 13.9:1
No. of staff 3,357 2,345 2,028 2,359 1,703 2,046 3,319
Faculty staff ratio 1.2:1 1.3: 1 1.2: 1 1.1: 1 1.1: 1 0.6:1 0.7:1
Annual revenue (US$ billion) 0.7 0.4 0.5 0.4 0.4 0.4 0.7
Annual revenue per student
(×US$000)26 20 23 24 20 39 21
Annual expenditures (US$
billion)2.6 1.3 1.1 2.4 0.9 0.4 0.7
Annual expenditures per
student (×US$000)78 58 56 67 54 41 20
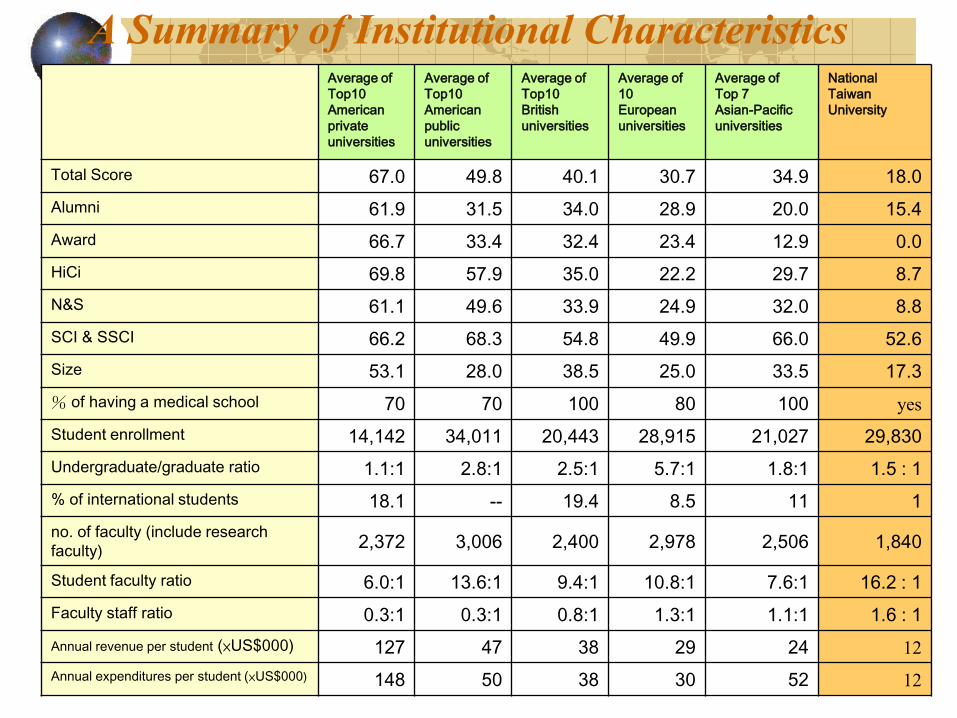
A Summary of Institutional CharacteristicsAverage of
Top10
American
private
universities
Average of
Top10
American
public
universities
Average of
Top10
British
universities
Average of
10
European
universities
Average of
Top 7
Asian-Pacific
universities
National
Taiwan
University
Total Score 67.0 49.8 40.1 30.7 34.9 18.0
Alumni 61.9 31.5 34.0 28.9 20.0 15.4
Award 66.7 33.4 32.4 23.4 12.9 0.0
HiCi 69.8 57.9 35.0 22.2 29.7 8.7
N&S 61.1 49.6 33.9 24.9 32.0 8.8
SCI & SSCI 66.2 68.3 54.8 49.9 66.0 52.6
Size 53.1 28.0 38.5 25.0 33.5 17.3
% of having a medical school 70 70 100 80 100 yes
Student enrollment 14,142 34,011 20,443 28,915 21,027 29,830
Undergraduate/graduate ratio 1.1:1 2.8:1 2.5:1 5.7:1 1.8:1 1.5 : 1
% of international students 18.1 -- 19.4 8.5 11 1
no. of faculty (include research
faculty)2,372 3,006 2,400 2,978 2,506 1,840
Student faculty ratio 6.0:1 13.6:1 9.4:1 10.8:1 7.6:1 16.2 : 1
Faculty staff ratio 0.3:1 0.3:1 0.8:1 1.3:1 1.1:1 1.6 : 1
Annual revenue per student (×US$000) 127 47 38 29 24 12
Annual expenditures per student (×US$000) 148 50 38 30 52 12
A Summary of Institutional Characteristics
1. The world-class universities are public universities except those in the US, which cover both public and private universities. Most of these universities are highly internationalized comprehensive universities with a wide range of subject coverage.
2. Although research quantity of the top-ranking universities is important, the crucial factor which makes the institutions prominent internationally is the quality and significance of academic research.
3. Most of the world-class universities have medical schools. Institutions that have a significant commitment to biomedical science tend to have a competitive advantage than institutions that are more committed to other subject areas.
4. Except the private American universities, most of the world-class universities are relatively large, with average student number ranging from 20,000 to 34,000 and average faculty number ranging from 2,400 to 3,000.
5. Except the private American universities, the number of undergraduate students is much larger than that of graduate students, with the undergraduate graduate ratio ranging from 1.8:1 to 5.7:1.
6. Except the public American universities, the student faculty ratio is relatively low in most universities, ranging from 6.0:1 to 10.8:1.
7. Most universities have sufficient administrative and technical personnel to support teaching and research. The faculty staff ratio ranges from 0.3:1 to 1.1:1.
8. What really distinguishes the top 10 private American universities, which are ranked best in the world, from the rest of top-ranking institutions is the enormous funds available. The average annual expenditures per student of those institution reach a hard-to-challenge US$148,000, while the others range from US$30,000 to US$52,000 .