Embed Size (px)
DESCRIPTION
The Federal Reserve’s Balance Sheet. The conduct of monetary policy by the Federal Reserve involves actions that affect its balance sheet. This is a simplified version of its balance sheet, which we will use to illustrate the effects of Fed actions. - PowerPoint PPT Presentation
Citation preview
© 2012 Pearson Prentice Hall. All rights reserved. 10-1
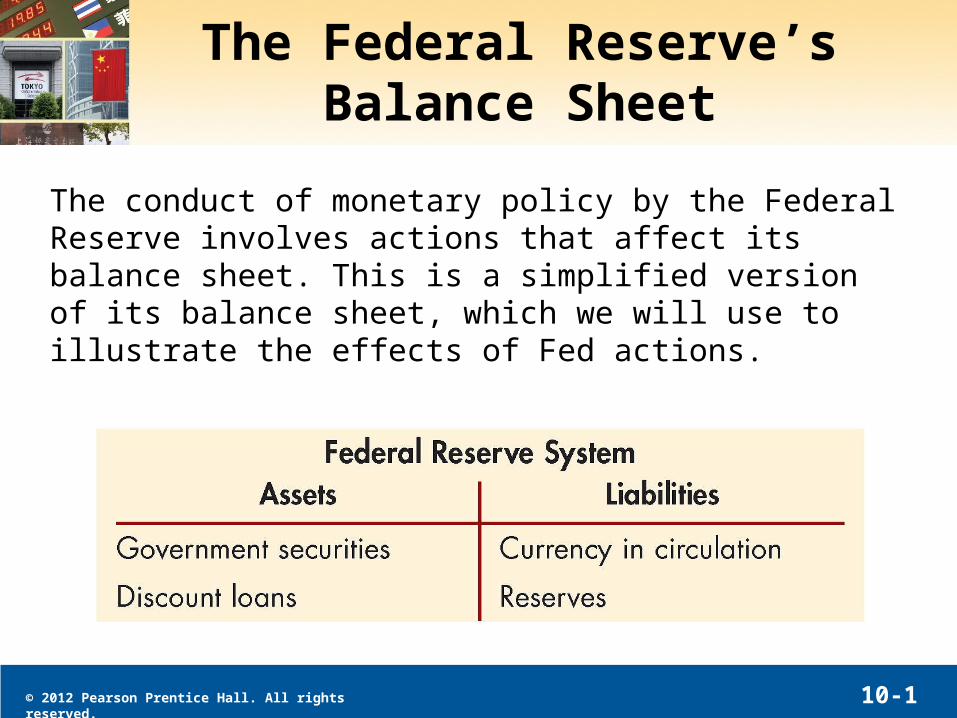
The Federal Reserve’s Balance Sheet
The conduct of monetary policy by the Federal Reserve involves actions that affect its balance sheet. This is a simplified version of its balance sheet, which we will use to illustrate the effects of Fed actions.
© 2012 Pearson Prentice Hall. All rights reserved. 10-2
The Federal Reserve’s Balance Sheet: Liabilities
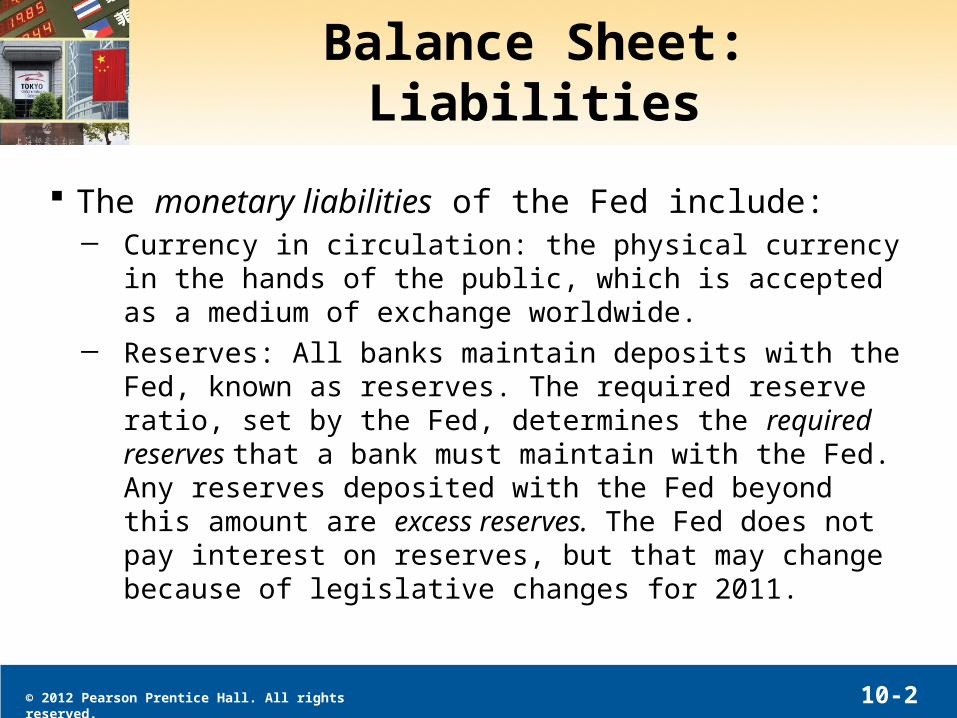
The monetary liabilities of the Fed include:─ Currency in circulation: the physical currency in the
hands of the public, which is accepted as a medium of exchange worldwide.
─ Reserves: All banks maintain deposits with the Fed, known as reserves. The required reserve ratio, set by the Fed, determines the required reserves that a bank must maintain with the Fed. Any reserves deposited with the Fed beyond this amount are excess reserves. The Fed does not pay interest on reserves, but that may change because of legislative changes for 2011.
© 2012 Pearson Prentice Hall. All rights reserved. 10-3
The Federal Reserve’s Balance Sheet: Assets
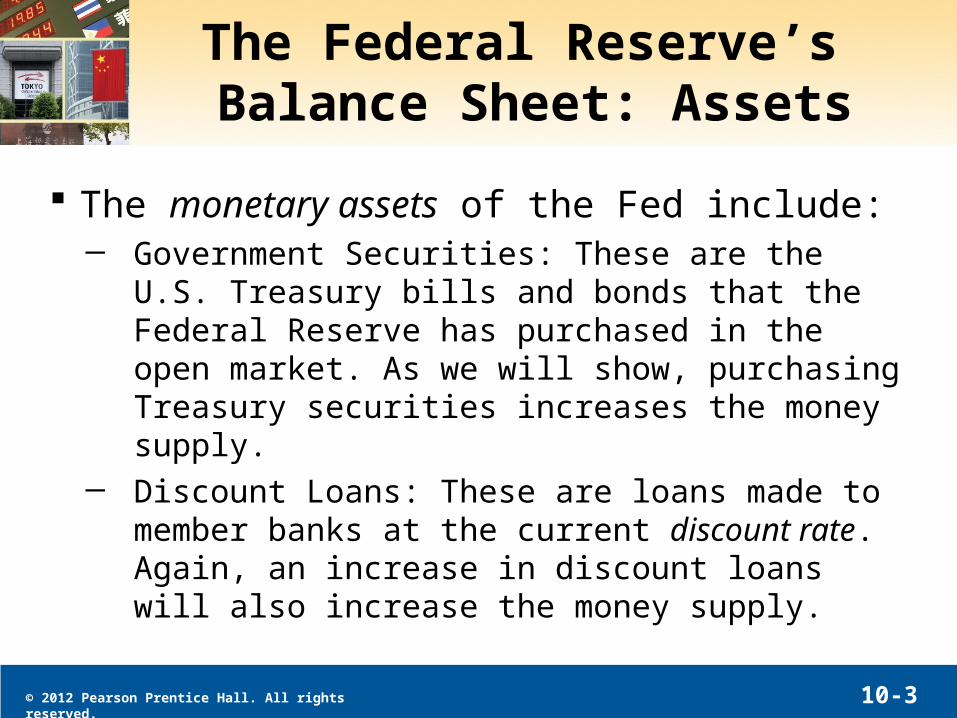
The monetary assets of the Fed include:─ Government Securities: These are the U.S. Treasury
bills and bonds that the Federal Reserve has purchased in the open market. As we will show, purchasing Treasury securities increases the money supply.
─ Discount Loans: These are loans made to member banks at the current discount rate. Again, an increase in discount loans will also increase the money supply.
© 2012 Pearson Prentice Hall. All rights reserved. 10-4
Open Market Operations
In the next two slides, we will examine the impact of open market operation on the Fed’s balance sheet and on the money supply. As suggested in the last slide, we will show the following:─ Purchase of bonds increases the money supply─ Making discount loans increases the money supply
Naturally, the Fed can decrease the money supply by reversing these transactions.
© 2012 Pearson Prentice Hall. All rights reserved. 10-5
The Federal Reserve Balance Sheet
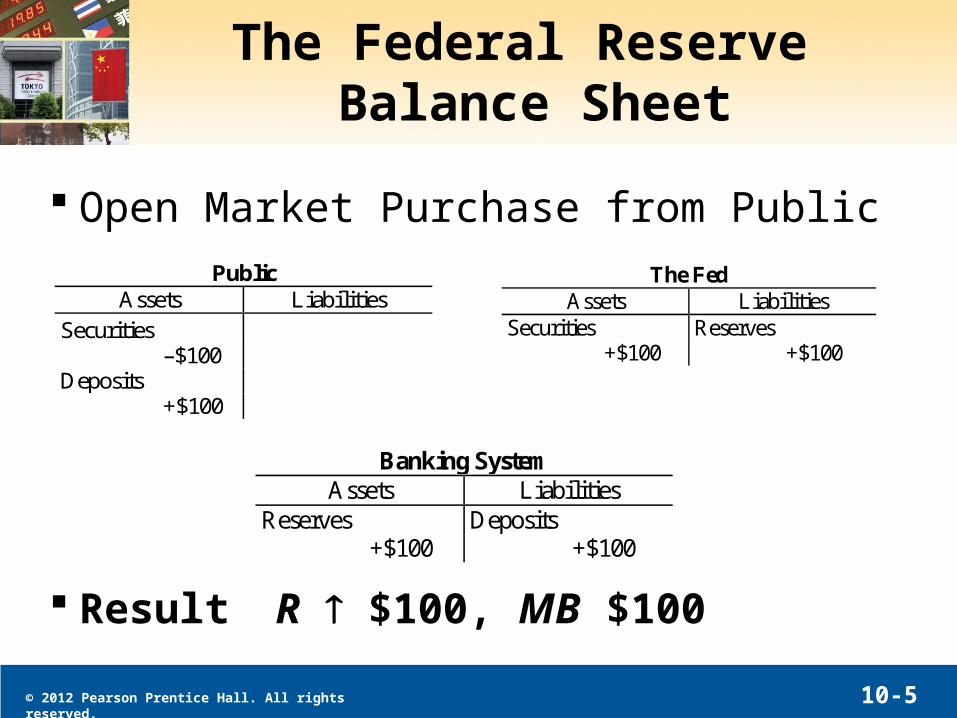
Open Market Purchase from Public
Result R $100, MB $100
Banking System Assets Liabilities
Reserves Deposits +$100 +$100
Public Assets Liabilities
Securities –$100 Deposits +$100
The Fed Assets Liabilities
Securities Reserves +$100 +$100
© 2012 Pearson Prentice Hall. All rights reserved. 10-6
The Federal Reserve Balance Sheet
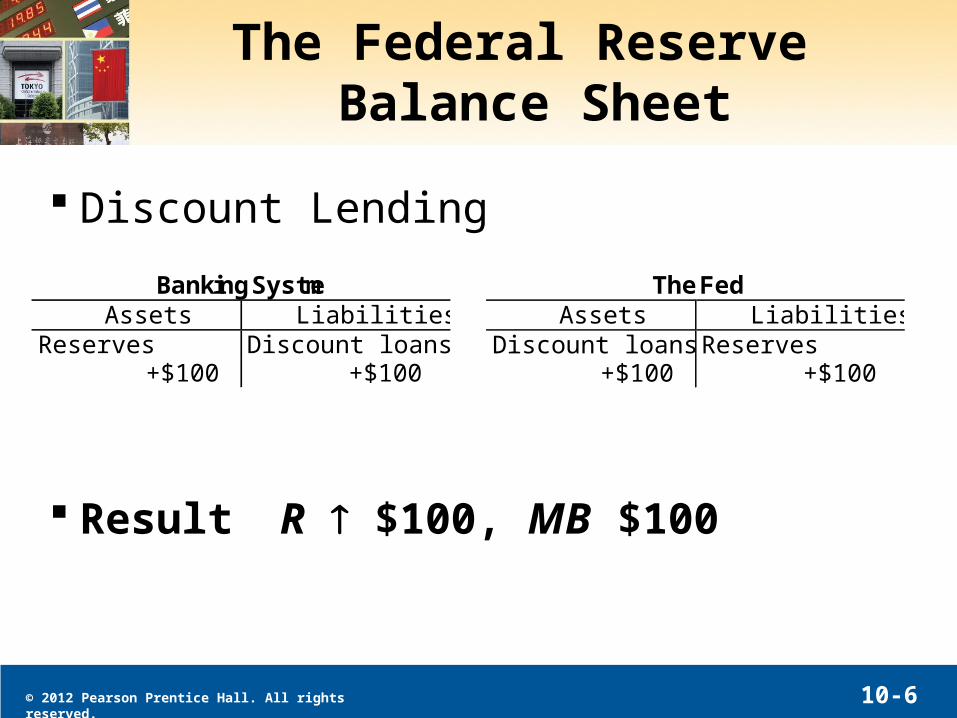
Discount Lending
Result R $100, MB $100
Banking System Assets Liabilities
Reserves Discount loans +$100 +$100
The Fed Assets Liabilities
Discount loans Reserves +$100 +$100
© 2012 Pearson Prentice Hall. All rights reserved. 10-7
Supply and Demand in theMarket for Reserves
We now have some understanding of the effect of open market operations and discount lending on the Fed’s balance sheet and available reserves. Next, we will examine how this change in reserves affects the federal funds rate, the rate banks charge each other for overnight loans. Further, we will examine a third tool available to the Fed—the ability to set the required reserve ratio for deposits held by banks.
© 2012 Pearson Prentice Hall. All rights reserved. 10-8
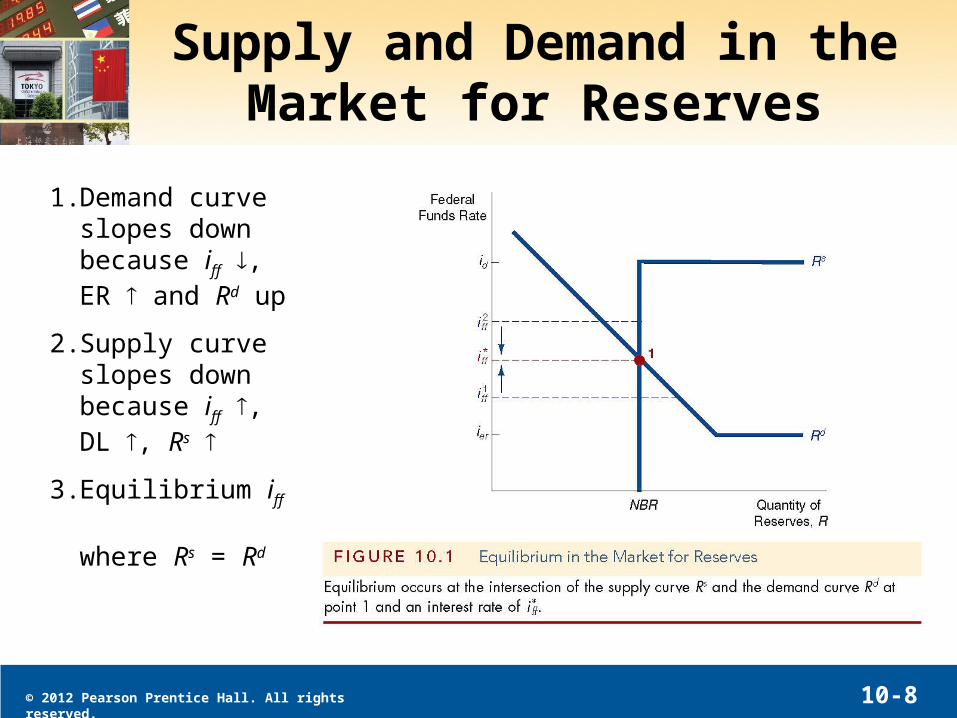
Supply and Demand in theMarket for Reserves
1. Demand curve slopes down because iff , ER and Rd up
2. Supply curve slopes down because iff , DL , Rs
3. Equilibrium iff where Rs = Rd
© 2012 Pearson Prentice Hall. All rights reserved. 10-9
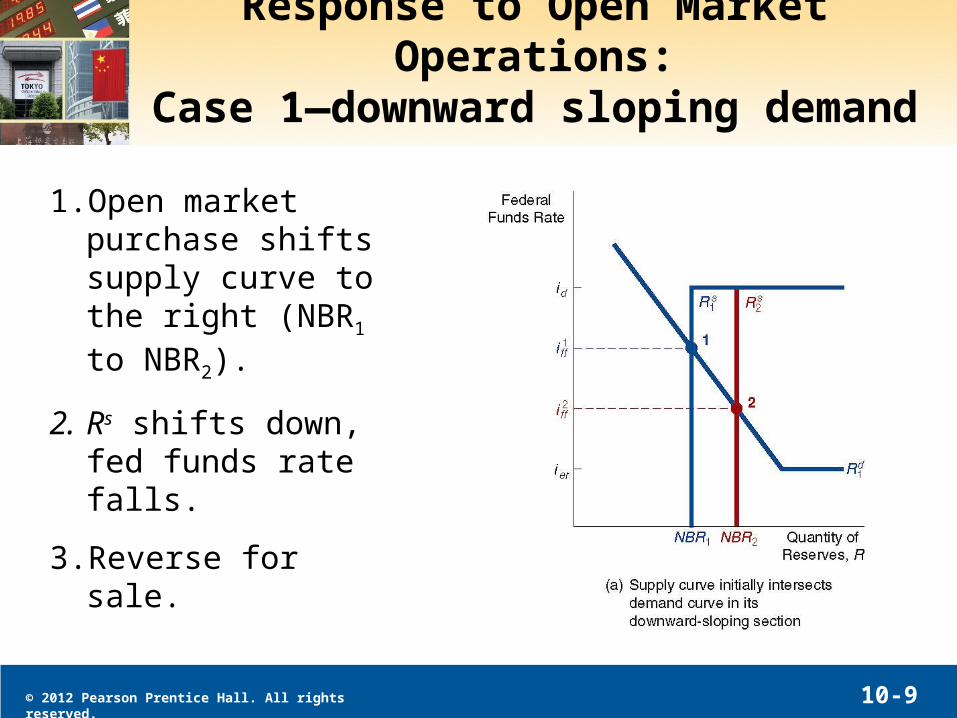
Response to Open Market Operations:Case 1—downward sloping demand
1. Open market purchase shifts supply curve to the right (NBR1 to NBR2).
2. Rs shifts down, fed funds rate falls.
3. Reverse for sale.
© 2012 Pearson Prentice Hall. All rights reserved. 10-10
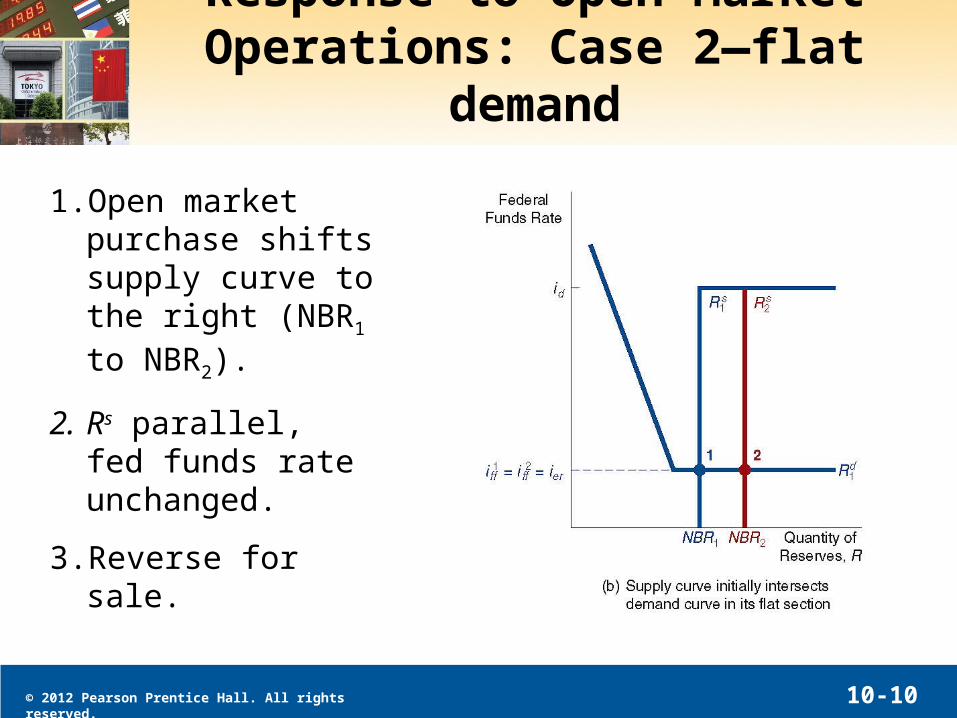
Response to Open Market Operations: Case 2—flat demand
1. Open market purchase shifts supply curve to the right (NBR1 to NBR2).
2. Rs parallel, fed funds rate unchanged.
3. Reverse for sale.
© 2012 Pearson Prentice Hall. All rights reserved. 10-11
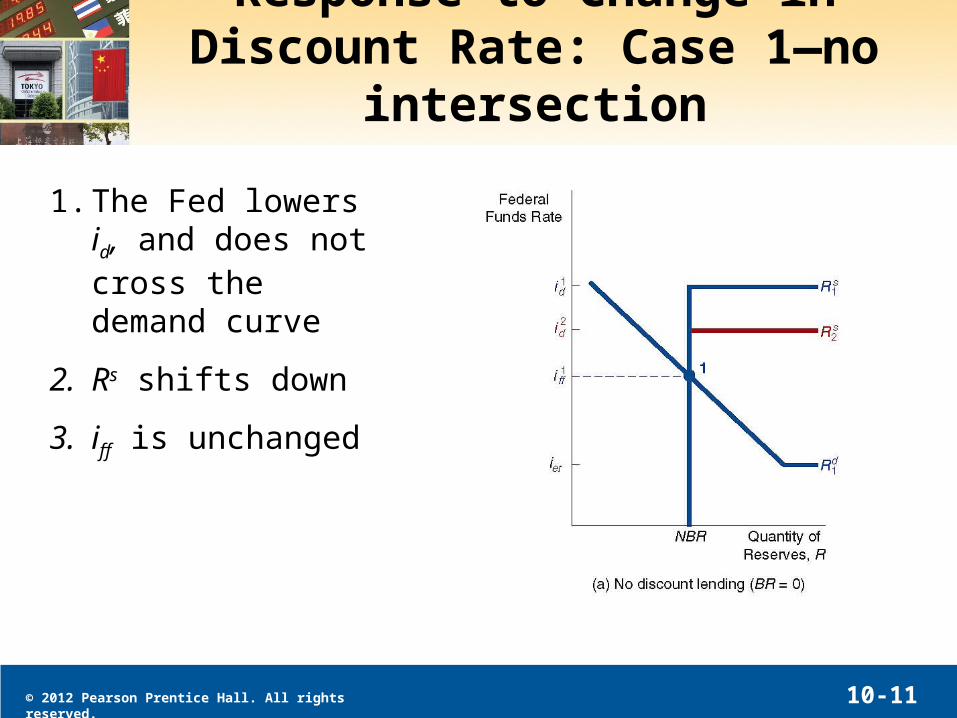
Response to Change in Discount Rate: Case 1—no intersection
1. The Fed lowers id, and does not cross the demand curve
2. Rs shifts down
3. iff is unchanged
© 2012 Pearson Prentice Hall. All rights reserved. 10-12
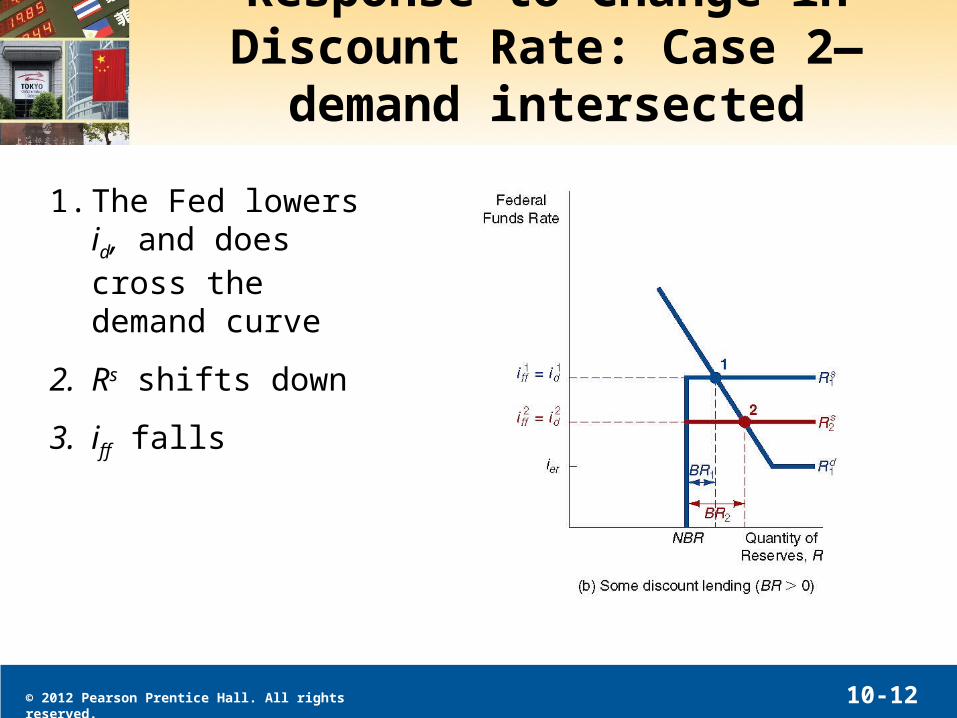
Response to Change in Discount Rate: Case 2—demand intersected
1. The Fed lowers id, and does cross the demand curve
2. Rs shifts down
3. iff falls
© 2012 Pearson Prentice Hall. All rights reserved. 10-13
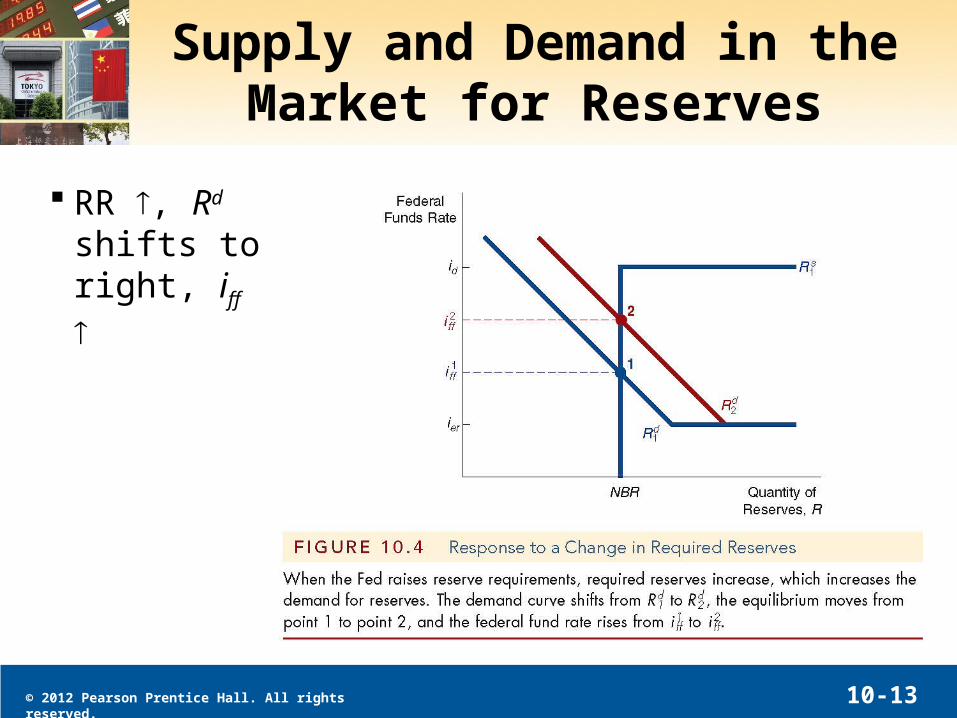
Supply and Demand in theMarket for Reserves
RR , Rd shifts to right, iff
© 2012 Pearson Prentice Hall. All rights reserved. 10-14
CASE: How Operating Procedures Limit Fluctuations in Fed Funds Rate
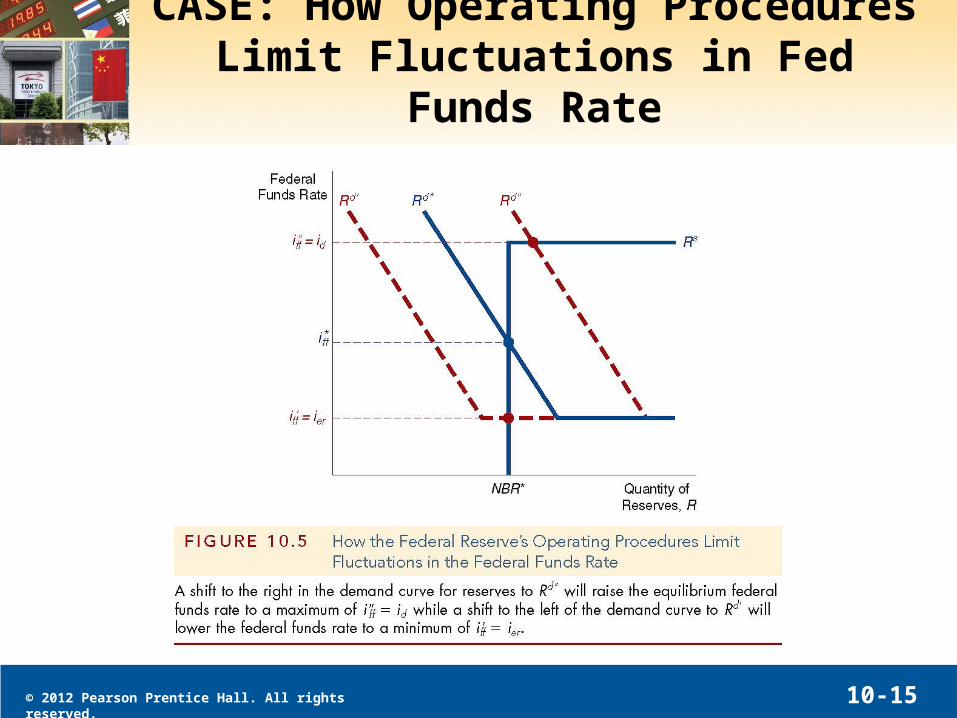
An advantage of current operating procedures. Any changes in the demand for reserves will not affect the fend funds rate because borrowed reserves will increase to match the demand increase. This is true whether the demand increases, or decreased, as seen in Figure 10.5 (next slide).
© 2012 Pearson Prentice Hall. All rights reserved. 10-15
CASE: How Operating Procedures Limit Fluctuations in Fed Funds Rate