Embed Size (px)
Citation preview

Australian Pipeline Ltd ACN 091 344 704 | Australian Pipeline Trust ARSN 091 678 778 APT Investment Trust ARSN 115 585 441 | APT Pipelines Ltd ACN 009 666 700
Level 19, 580 George Street Sydney NSW 2000 | PO Box R41 Royal Exchange NSW 1225 Phone +61 2 9693 0000 | Fax +61 2 9693 0093
APA Group | apa.com.au
24 August 2016
ASX ANNOUNCEMENT
APT Pipelines Limited (ASX: AQH)
Annual Report
The following announcement is attached for release to the market:
• APT Pipelines Limited Annual Financial Report
Nevenka Codevelle Company Secretary APT Pipelines Limited
For further information please contact:
Investor enquiries: Media enquiries: Yoko Kosugi Louise Watson Telephone: +61 2 9693 0049 Telephone: +61 2 8079 2970 Mob: +61 438 010 332 Mob: +61 419 185 674 Email: [email protected] Email: [email protected]
About APA Group (APA) APA is Australia’s largest natural gas infrastructure business, owning and/or operating around $19 billion of energy infrastructure assets. Its gas transmission pipelines span every state and territory on mainland Australia, delivering approximately half of the nation’s gas usage. APA has direct management and operational control over its assets and the majority of its investments. APA also holds minority interests in a number of energy infrastructure enterprises including SEA Gas Pipeline, SEA Gas (Mortlake) Partnership, Energy Infrastructure Investments, GDI Allgas Gas Networks and Diamantina and Leichhardt Power Stations.
APT Pipelines Limited is a wholly owned subsidiary of Australian Pipeline Trust and is the borrowing entity of APA Group.
For more information visit APA’s website, apa.com.au

APT Pipelines Limited
Annual Report. For the financial year ended
30 June 2016
ABN 89 009 666 700
APT Pipelines Limited and its Controlled Entities (ABN 89 009 666 700)
Annual Report for the year ended 30 June 2016
APT PIPELINES LIMITED DIRECTORS’ REPORT 1
1 Directors 1
2 Principal Activities 1
3 State of Affairs 1
4 Subsequent Events 2
5 Review of Operations 2
6 Auditor’s independence declaration 4
7 Rounding of amounts 4
8 Authorisation 4
AUSTRALIAN PIPELINE TRUST REMUNERATION REPORT 5
1 What This Report Covers 6
2 Remuneration Outcomes and APA Performance 7
3 Executive Remuneration Arrangements 13
4 Executive Contracts 16
5 Remuneration Governance 17
6 Non-executive Director Arrangements 18
7 Additional Key Management Personnel Disclosures 19
APT PIPELINES LIMITED
CONSOLIDATED FINANCIAL STATEMENTS 26

1
APT Pipelines Limited and its Controlled Entities (ABN 89 009 666 700)
Directors’ Report for the year ended 30 June 2016
APT PIPELINES LIMITED DIRECTORS’ REPORT
The Directors of APT Pipelines Limited (“APTPL”) submit their report and the annual financial
report of APTPL and its controlled entities (together “Consolidated Entity”) for the financial
year ended 30 June 2016.
1 Directors
The names of the Directors of APTPL during the year and since the year end are:
Leonard Bleasel AM Chairman
Michael (Mick) McCormack Chief Executive Officer and Managing Director
Steven (Steve) Crane
John Fletcher
Michael Fraser Appointed effective 1 September 2015
Debra (Debbie) Goodin Appointed effective 1 September 2015
Russell Higgins AO
Patricia McKenzie
Robert Wright Retired 22 October 2015
The Company Secretary of the Responsible Entity during and since the current period is as
follows:
Nevenka Codevelle Appointed 22 October 2015
Mark Knapman Retired 22 October 2015
2 Principal Activities
The principal activities of the Consolidated Entity during the course of the year were
investment in controlled entities and acting as the borrowing entity for APA Group, that
comprises Australian Pipeline Trust and APT Investment Trust and their controlled entities
(“APA”). The principal activities of APA during the course of the year were the ownership
and operation of energy infrastructure assets and businesses, including:
energy infrastructure, primarily gas transmission businesses located across Australia;
asset management and operations services for the majority of APA’s energy
investments and for third parties; and
energy investments in listed and unlisted entities.
3 State of Affairs
No significant change in the state of affairs of the Consolidated Entity occurred during the
financial year.
2
APT Pipelines Limited and its Controlled Entities (ABN 89 009 666 700)
Directors’ Report for the year ended 30 June 2016
4 Subsequent Events
Except as disclosed elsewhere in this report, the Directors are unaware of any matter or
circumstance that has occurred since the end of the year that has significantly affected or
may significantly affect the operations of the Consolidated Entity, the results of those
operations or the state of affairs of the Consolidated Entity in future years.
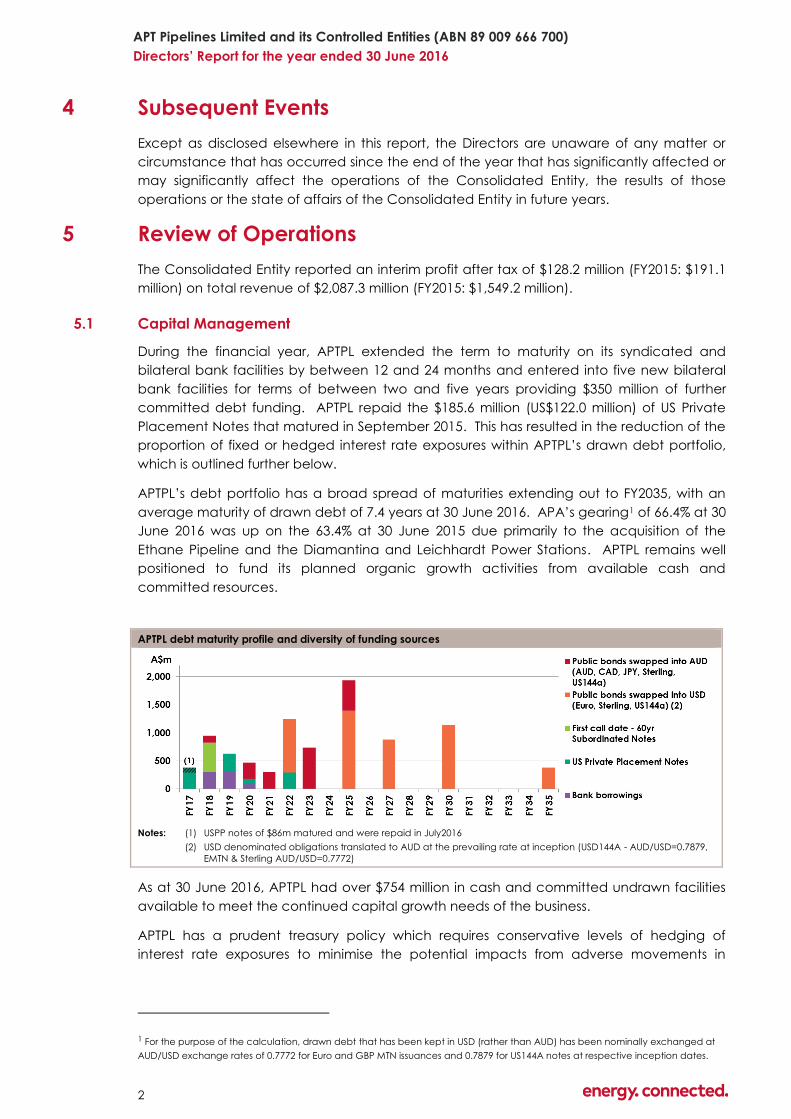
5 Review of Operations
The Consolidated Entity reported an interim profit after tax of $128.2 million (FY2015: $191.1
million) on total revenue of $2,087.3 million (FY2015: $1,549.2 million).
5.1 Capital Management
During the financial year, APTPL extended the term to maturity on its syndicated and
bilateral bank facilities by between 12 and 24 months and entered into five new bilateral
bank facilities for terms of between two and five years providing $350 million of further
committed debt funding. APTPL repaid the $185.6 million (US$122.0 million) of US Private
Placement Notes that matured in September 2015. This has resulted in the reduction of the
proportion of fixed or hedged interest rate exposures within APTPL’s drawn debt portfolio,
which is outlined further below.
APTPL’s debt portfolio has a broad spread of maturities extending out to FY2035, with an
average maturity of drawn debt of 7.4 years at 30 June 2016. APA’s gearing1 of 66.4% at 30
June 2016 was up on the 63.4% at 30 June 2015 due primarily to the acquisition of the
Ethane Pipeline and the Diamantina and Leichhardt Power Stations. APTPL remains well
positioned to fund its planned organic growth activities from available cash and
committed resources.
APTPL debt maturity profile and diversity of funding sources
Notes: (1) USPP notes of $86m matured and were repaid in July2016
(2) USD denominated obligations translated to AUD at the prevailing rate at inception (USD144A - AUD/USD=0.7879,
EMTN & Sterling AUD/USD=0.7772)
As at 30 June 2016, APTPL had over $754 million in cash and committed undrawn facilities
available to meet the continued capital growth needs of the business.
APTPL has a prudent treasury policy which requires conservative levels of hedging of
interest rate exposures to minimise the potential impacts from adverse movements in
1 For the purpose of the calculation, drawn debt that has been kept in USD (rather than AUD) has been nominally exchanged at
AUD/USD exchange rates of 0.7772 for Euro and GBP MTN issuances and 0.7879 for US144A notes at respective inception dates.

3
APT Pipelines Limited and its Controlled Entities (ABN 89 009 666 700)
Directors’ Report for the year ended 30 June 2016
interest rates. Other than noted below, all interest rate and foreign currency exposures on
debt raised in foreign currencies have been hedged.
The majority of the revenues to be received over the next 20 years from the foundation
contracts on the Wallumbilla Gladstone Pipeline will be received in USD. The US$3.7 billion
of debt raised in March 2015 is being managed as a “designated hedge” for these
revenues and therefore has been retained in USD. Net USD cash flow after servicing the
USD interest costs that is not part of that “designated relationship” will continue to be
hedged into AUD on a rolling basis for an appropriate period of time, in line with APTPL’s
treasury policy. To date, the following net USD cash flow hedging has been undertaken:
Period Average forward USD/AUD exchange rate
FY2017 0.7381
FY2018 0.7282
1H FY2019 (to Dec 2018) 0.6716
APTPL also enters into interest rate hedges for a proportion of the interest rate exposure on
its floating rate borrowings. As at 30 June 2016, 86.5% (30 June 2015: 94.0%) of interest
obligations on gross borrowings was either hedged into or issued at fixed interest rates for
varying periods extending out to 2035.
5.2 Borrowings and finance costs
As at 30 June 2016, APTPL had borrowings of $9,037.3 million ($8,642.8 million at 30 June
2015) from a mix of syndicated and bilateral bank debt facilities, US Private Placement
Notes, Medium Term Notes in several currencies, Australian Medium Term Notes, United
States 144A Notes and APA Group Subordinated Notes.
Net finance costs increased by $183.5 million, or 56.6%, to $507.7 million (FY2015: $324.2
million). The increase is primarily due to having the additional US$3.7 billion of debt issued in
March 2015 to support the acquisition of the Wallumbilla Gladstone Pipeline for the full 2016
financial year. The average interest rate (including credit margins)2 applying to drawn
debt was 5.64% for the current period (FY2015: 6.76%).
APA’s interest cover ratio for the current period was 2.60 times3 (June 2015: 2.59 times). This
remains well in excess of its debt covenant default ratio of 1.1 times and distribution lock up
ratio of 1.3 times.
5.3 Credit ratings
APTPL maintained the following two investment grade credit ratings during this financial
year:
BBB long-term corporate credit rating (outlook Stable) assigned by Standard & Poor’s
(S&P) in June 2009, and last confirmed on 18 March 2016; and
Baa2 long-term corporate credit rating (outlook Stable) assigned by Moody’s
Investors Service (Moody’s) in April 2010, and last confirmed on 15 April 2016.
2 For the purpose of the calculation, drawn debt that has been kept in USD (rather than AUD) has been nominally exchanged at
AUD/USD exchange rates of 0.7772 for Euro and GBP MTN issuances and 0.7879 for US144A notes at respective inception dates.
3 For the calculation of interest cover, significant items are excluded from the EBITDA used.

4
APT Pipelines Limited and its Controlled Entities (ABN 89 009 666 700)
Directors’ Report for the year ended 30 June 2016
5.4 Dividends
Unfranked dividends of $182.4 million were paid to the sole shareholder, Australian Pipeline
Trust, during the financial year (FY2015: $123.3 million).
On 24 August 2016, the Directors declared and paid a final dividend of $173.0 million to the
sole shareholder.
6 Auditor’s independence declaration
A copy of the independence declaration of the auditor, Deloitte Touche Tohmatsu
(“Auditor”) as required under section 307C of the Corporations Act 2001 is included at
page 83.
7 Rounding of amounts
APTPL is an entity of the kind referred to in ASIC Corporation’s Instrument 2016/191 and, in
accordance with that Class Order, amounts in the Directors’ report and the financial report
are rounded to the nearest thousand dollars, unless otherwise indicated.
8 Authorisation
The Directors’ report is signed in accordance with a resolution of the Directors of APTPL
made pursuant to section 298(2) of the Corporations Act 2001.
On behalf of the Directors
Leonard Bleasel AM Steven Crane
Chairman Director
SYDNEY, 24 August 2016

5
APT Pipelines Limited and its Controlled Entities
Remuneration Report for the year ended 30 June 2016
REMUNERATION REPORT Letter from the Chairman of the People and Remuneration Committee
Dear Securityholders,
On behalf of the Board and the People and Remuneration Committee, I am pleased to
present APA's Remuneration Report for the financial year ended 30 June 2016.
FY2016 was another year of strong performance for securityholders, with APA continuing to
deliver superior market returns. FY2016 has been marked by continued expansion in assets
through major capital works and investments brought in-house, the completion of key
business and technology projects, development of innovative and flexible services for our
customers, especially on the East Coast Grid, and excellent financial returns.
People and Remuneration Committee
During the reporting period the Committee’s name was changed to the People and
Remuneration Committee to reflect the increasing emphasis of the work of the Committee
beyond remuneration into key areas such as diversity, succession planning, talent
development and organisational culture.
Executive remuneration framework
Total Fixed Remuneration (“TFR”) for the Chief Executive Officer and Managing Director
(“CEO/MD”) and Senior Executives has increased this year as a function of consolidating
APA’s position relative to other Australian Stock Exchange (ASX) listed companies. As part
of our conservative management of TFR and to maintain a market competitive
remuneration package, APA’s positioning policy is for the TFR quantum to be at least the
median against comparable ASX listed companies.
The Board has concluded that the executive remuneration framework continues to be
aligned with our business strategy and model. As mentioned in last year’s report a minimum
securityholding policy for the CEO/MD, Senior Executives and all the other participants in
the Long Term Incentive (“LTI”) plan has been implemented. In addition the extension of
the performance measurement period for normalised Earnings Before Interest, Tax,
Depreciation and Amortisation divided by Funds Employed (“EBITDA/FE”) for the LTI plan to
three years has been implemented, effective from FY2016. This will strengthen the
alignment of management and securityholder interests.
This year's remuneration report
The Board is committed to transparency and strong governance. We recognise and
welcome securityholders’ interest in APA, including understanding our remuneration
strategy and outcomes and have continued with the expanded format adopted last year.
While, as a registered managed investment scheme listed on the ASX, APA is not covered
by the remuneration reporting requirements of the Corporations Act, we have followed a
similar format, as we recognise this will be familiar and understandable to many of our
securityholders. We also present remuneration information on an accrual basis rather than
a paid basis, to better allow securityholders to reconcile amounts awarded for the period
with APA’s performance in the period.
We welcome your feedback on the report and its contents, and look forward to your
attendance at our FY2016 Annual General Meeting.
John Fletcher
Chairman of the People and Remuneration Committee

6
APT Pipelines Limited and its Controlled Entities
Remuneration Report for the year ended 30 June 2016
1 What This Report Covers
This report details the remuneration arrangements for non-executive directors, the
Executive Director and Senior Executives, the key management personnel (“KMP”) listed
below. These are the people with authority and responsibility for planning, directing and
controlling the major activities of APA, directly or indirectly.
Name Role Duration of
appointment
(I) Non-executive directors
Leonard Bleasel AM Chairman of APA Group Full year
Steven Crane Chairman of Audit and Risk Management Committee
Member of People and Remuneration Committee
From 23 October 2015
Full year
John Fletcher Chairman of People and Remuneration Committee and
member of Audit and Risk Management Committee
Full year
Russell Higgins AO Chairman of Health Safety and Environment Committee and
member of Audit and Risk Management Committee
Full year
Patricia McKenzie Member of Health Safety and Environment Committee and
member of People and Remuneration Committee
Full year
Debra (Debbie) Goodin Member of Audit and Risk Management Committee and
member of Health Safety and Environment Committee
Commenced
01 September 2015
Michael Fraser Member of Health Safety and Environment Committee and
member of People and Remuneration Committee
Commenced
01 September 2015
Robert Wright Chairman of Audit and Risk Management Committee and
member of Health Safety and Environment Committee
Retired
22 October 2015
(II) Executive director
Michael McCormack Chief Executive Officer and Managing Director ("CEO/MD") Full year
(III) Senior executives
Peter Fredricson Chief Financial Officer (“CFO”) Full year
Ross Gersbach Chief Executive Strategy and Development Full year
Robert Wheals Group Executive Transmission Full year
John Ferguson Group Executive Networks Full year
Kevin Lester Group Executive Infrastructure Development Full year
Nevenka Codevelle Company Secretary & General Counsel(1) From 31 October 2015
Elise Manns Group Executive Human Resources(2) From 01 October 2015
(1) Mark Knapman, Company Secretary, retired 30 October 2015.
(2) Peter Wallace, Group Executive Human Resources, retired 02 October 2015.
The named persons held their current positions during the financial year for the periods
indicated. There have been no changes to KMP between the end of the financial year
and the date this report was authorised for issue.

7
APT Pipelines Limited and its Controlled Entities
Remuneration Report for the year ended 30 June 2016
2 Remuneration Outcomes and APA Performance
One of the key factors in determining the remuneration position of APA executives is
market relativity, and within Australia, ranking on the ASX100 on market capitalisation is the
most commonly used benchmark. The APA Group has delivered strong securityholding
returns, sound financial performance and significant organisational growth year on year.
This, together with the Boards desire to attract and retain a first class management team,
has driven commensurate growth in remuneration levels in APA.
APA market capitalisation rank against ASX100
2.1 Executive remuneration awarded FY2016
As part of our commitment to greater transparency and to better reflect the pay for
performance relationship, the table below sets out remuneration earned by APA
Executives in FY2016 and FY2015 on an accrual basis for the period rather than
remuneration received during the period. For instance, short term incentive (“STI”) values in
the table below reflect STI earned in FY2016 but are due to be paid in the next financial
year. This is identical to APA’s approach in the FY2015 remuneration report.

8
APT Pipelines Limited and its Controlled Entities
Remuneration Report for the year ended 30 June 2016
Executive
Director and
Senior
Executives
Awarded in FY2016 Awarded in
FY2015
Total Fixed
Remuneration
(“TFR”)
$
Awarded
STI(1)
$ Allocated LTI(2)
$
Other
$
Total
$
Total(3)(4)
$
Michael
McCormack
CEO/MD
1,765,000 1,814,861 1,471,679 - 5,051,540 4,792,174
Peter Fredricson
CFO 835,000 604,331 464,156 - 1,903,487 2,103,250
Ross Gersbach
Chief Executive
Strategy and
Development
852,000 584,685 473,606 - 1,910,291 2,232,013
Robert Wheals
Group Executive
Transmission
678,000 469,854 376,883 - 1,524,737 1,421,487
John Ferguson
Group Executive
Networks
587,000 411,194 326,299 - 1,324,493 1,261,530
Kevin Lester
Group Executive
Infrastructure
Development
551,000 360,767 306,287 - 1,218,054 1,134,440
Nevenka
Codevelle
Company
Secretary &
General Counsel
413,075 270,489 205,618 - 889,182 (3)-
Elise Manns
Group Executive
Human Resources
387,640 247,427 199,114 - 834,181 (4)-
Total 6,068,715 4,763,608 3,823,642 - 14,655,965 15,254,364(5)-
(1) Awarded STI represents the amounts earned by the executives during the reporting period and are due to
be paid in September 2016 as they are dependent on the approval by the Board and having the signed
audited annual accounts.
(2) Allocated LTI represents the value of reference units that were earned by the executives during the reporting
period. Reference units will be allocated in August 2016 as they are dependent on the approval by the
Board and the release of APA Group’s annual results to the ASX.
(3) Nevenka Codevelle not KMP FY2015.
(4) Elise Manns not KMP FY2015.
(5) FY2015 Total Includes Mark Knapman & Peter Wallace and $430,666 final Retention Payments instalments.
Notes
Mark Knapman, Company Secretary, retired 30 October 2015.
Peter Wallace, Group Executive Human Resources, retired 02 October 2015.
2.2 APA performance and incentive plan outcomes FY2016
Strong performance against all major metrics has been achieved again in FY2016. The
Group’s superior performance led to strong at-risk remuneration outcomes. More detail on
the link between APA performance and executive remuneration outcomes is provided
below.
9
APT Pipelines Limited and its Controlled Entities
Remuneration Report for the year ended 30 June 2016
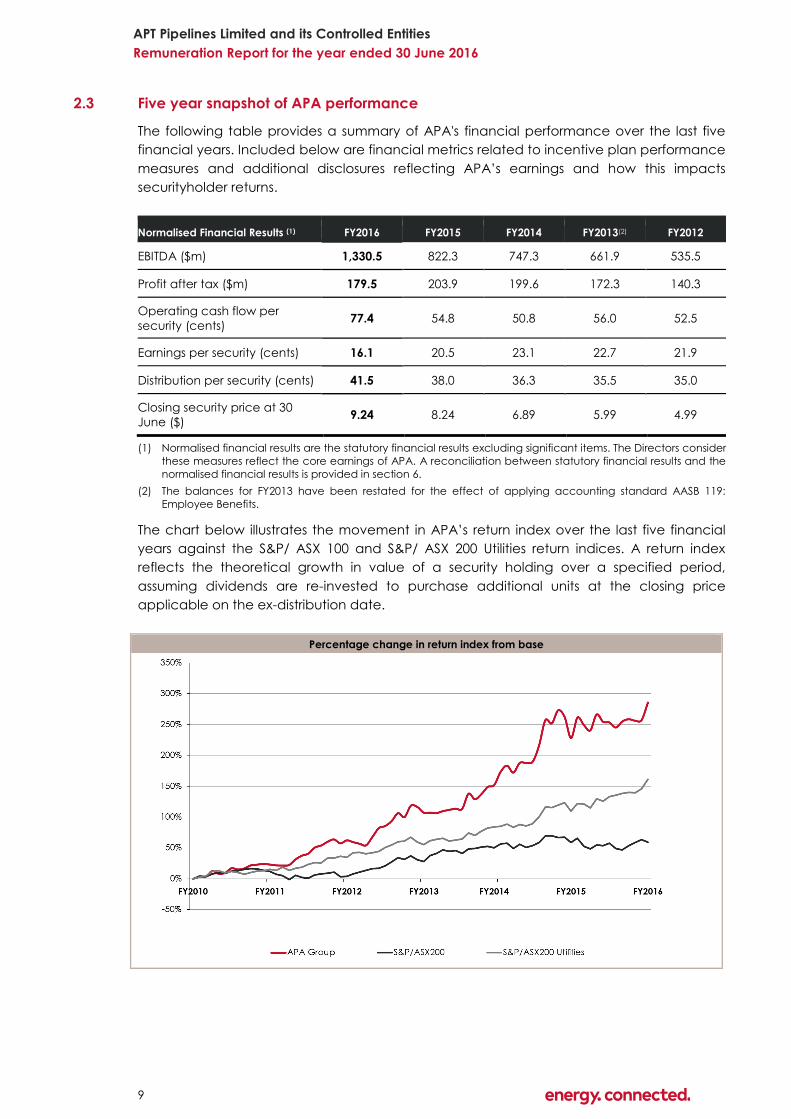
2.3 Five year snapshot of APA performance
The following table provides a summary of APA's financial performance over the last five
financial years. Included below are financial metrics related to incentive plan performance
measures and additional disclosures reflecting APA’s earnings and how this impacts
securityholder returns.
Normalised Financial Results (1) FY2016 FY2015 FY2014 FY2013(2) FY2012
EBITDA ($m) 1,330.5 822.3 747.3 661.9 535.5
Profit after tax ($m) 179.5 203.9 199.6 172.3 140.3
Operating cash flow per
security (cents) 77.4 54.8 50.8 56.0 52.5
Earnings per security (cents) 16.1 20.5 23.1 22.7 21.9
Distribution per security (cents) 41.5 38.0 36.3 35.5 35.0
Closing security price at 30
June ($) 9.24 8.24 6.89 5.99 4.99
(1) Normalised financial results are the statutory financial results excluding significant items. The Directors consider
these measures reflect the core earnings of APA. A reconciliation between statutory financial results and the
normalised financial results is provided in section 6.
(2) The balances for FY2013 have been restated for the effect of applying accounting standard AASB 119:
Employee Benefits.
The chart below illustrates the movement in APA’s return index over the last five financial
years against the S&P/ ASX 100 and S&P/ ASX 200 Utilities return indices. A return index
reflects the theoretical growth in value of a security holding over a specified period,
assuming dividends are re-invested to purchase additional units at the closing price
applicable on the ex-distribution date.
Percentage change in return index from base

10
APT Pipelines Limited and its Controlled Entities
Remuneration Report for the year ended 30 June 2016
2.4 Link between APA performance and awarded STI
STI is an annual cash-settled incentive subject to 12 month financial and non-financial
performance. STI funding is dependent on normalised OCFPS, a measure of the average
cash amount generated by the business for each stapled security issued (typically
excluding such things as significant items). This measure is directly linked to APA’s strategic
goal of increasing cash flows over the medium term.
Executives are awarded an STI only if OCFPS is above the threshold level of performance
set by the Board. OCFPS therefore acts as a gateway for awards under the STI plan. OCFPS
is also the mechanism through which the aggregate amount available for STI payments is
limited, ensuring strong alignment between individual performance and APA’s ability to
pay.
STI awarded is subject to Executives satisfying their performance against a balanced
scorecard of pre-determined APA business unit and personal objectives.
Executive STI Awarded FY2016 FY2015 FY2014 FY2013 FY2012
Executive Award - Maximum 97.5% 96.0% 95.0% 95.0% 96.5%
Executive Award - Average 92.8% 92.6% 89.2% 87.2% 90.8%
Executive Award - Minimum 87.3% 86.8% 85.3% 77.0% 77.5%
OCFPS Performance as % of OCFPS target 112.8% 118.9% 113.1% 117.2% 105.6%
2.5 STI Performance and Executive Awards
The chart below illustrates how Executive STI outcomes align with performance against the
key business metric of OCFPS.
50%
80%
110%
140%
FY2012 FY2013 FY2014 FY2015 FY2016
Executive Award - Maximum
Executive Award - Average
Executive Award - Minimum
OCFPS Performance
Executive performance Vs. KPI performance measures
OCFPS Achieved as a % of OCFPS Target

11
APT Pipelines Limited and its Controlled Entities
Remuneration Report for the year ended 30 June 2016
2.6 STI outcomes during FY2016
For FY2016, the STI outcomes for Executives, as a percentage of maximum opportunity, are
set out in the table below.
Executives
STI earned STI forfeited
% $ % $
Michael McCormack 91.4 1,814,861 8.6 170,764
Peter Fredricson 96.5 604,331 3.5 21,918
Ross Gersbach 91.5 584,685 8.5 54,315
Robert Wheals 92.4 469,854 7.6 38,645
John Ferguson 93.4 411,194 6.6 29,056
Kevin Lester 87.3 360,767 12.7 52,483
Nevenka Codevelle 97.5 270,489 (1) 2.5 6,936
Elise Manns 92.1 247,427 (1) 7.9 21,223
(1) STI payments for Nevenka Codevelle and Elise Manns are pro-rated for period of time as KMP in FY2016
2.7 Link between APA performance and awarded LTI
LTI is a cash-settled incentive subject to two APA measures - Relative Total Securityholder
Returns (“TSR”) (three year rolling average performance against S&P/ASX 100 companies)
and growth in EBITDA/FE.
Both measures are weighted equally and are linked to building securityholder value.
Relative TSR provides the most direct measure of securityholder return and reflects an
investor’s choice to invest in APA or competitors. Security price growth is underpinned by
earnings growth and EBITDA/FE is based on the integrity of earnings performance against
funds employed which provides a measure of how efficiently the assets are being
deployed.
The chart below presents APA’s TSR performance relative to S&P/ASX 100 companies (for
FY2013 and FY2014 based on TSR end of year rank and for FY2015 and FY2016 based on 3
year rolling average) and EBITDA/FE as a function of improvements to historical actual.
LTI awards as a percentage of maximum opportunity.
Year EBITDA/FE TSR LTI Allocated
FY2013 100.0% 55.4% 77.7%
FY2014 66.7% 53.2% 59.9%
FY2015 90.8% 100.0% 95.4%
FY2016 62.9% 85.3% 74.1%

12
APT Pipelines Limited and its Controlled Entities
Remuneration Report for the year ended 30 June 2016
2.8 LTI Performance and Executive Awards
2.9 LTI outcomes during FY2016
For FY2016, the LTI outcomes for Executives are set out in the table below:
Executives
LTI allocated LTI forfeited
$ $
Michael McCormack 1,471,679 513,946
Peter Fredricson 464,156 162,094
Ross Gersbach 473,606 165,394
Robert Wheals 376,883 131,617
John Ferguson 326,299 113,951
Kevin Lester 306,287 106,963
Nevenka Codevelle 205,618 71,807
Elise Manns 199,114 69,536
0%
20%
40%
60%
80%
100%
120%
FY2013 FY2014 FY2015 FY2016
EBITDA/FE
TSR
LTI Allocated

13
APT Pipelines Limited and its Controlled Entities
Remuneration Report for the year ended 30 June 2016
3 Executive Remuneration Arrangements
3.1 Alignment of remuneration strategy with business strategy
VISION
Maintain our ranking as Australia’s number one energy infrastructure business
KEY MEASURES OF SUCCESS
Enhance our portfolio of energy infrastructure
assets
Capture revenue and operational synergies
Facilitate the development of
energy related projects
Pursue opportunities which leverage our knowledge and skills base
Strengthen our financial capability
REMUNERATION OBJECTIVES
Attract and retain key talent
Market competitive remuneration (Position TFR/ TPO at market
median)
Align with APA business model &
organisational imperatives
Motivate and reward Executives for superior performance
Align with securityholder interests
Comply with legal requirements and appropriate governance standards
TOTAL PACKAGE OPPORTUNITY (“TPO”)
TFR STI LTI
— Reflect market value, individual’s skills, and experience. — Consists of base salary, and
superannuation and other salary
sacrificed benefits. — Reference market median against a comparable set of companies.
— Reward performance against specific business and personal
objectives (linked to key measures of success). — Cash-based incentive, subject to annual financial and non-financial performance. — Only payable if target OCFPS is achieved. — Clawback applies for three years.
— Reward Executives for creating securityholder value. — Allocations of reference units (settled in cash). — TSR against S&P / ASX 100 companies and EBITDA / FE performance measures. — Tranche vesting over a four year period. — Clawback applies for three years. — Clawback applies to unvested LTI awards.
REMUNERATION GOVERNANCE
EXECUTIVE REMUNERATION CLAWBACK POLICY
— Designed to further align the interests of the Executives with the long-term interests of the securityholders and to ensure
excessive risk-taking is not rewarded. — The Board at its discretion may require Executives to repay some or all of any STI or LTI awarded, forfeit unvested LTI and/or
forgo future STI or LTI awards if APA’s financial results have been misstated during the preceding three financial years and
the misstatement may have impacted incentive plan outcomes.
MINIMUM SECURITYHOLDING POLICY
— Aligning Executives to securityholders through an equity-based incentive program is not practicable for APA due to our
stapled trust structure and Constitution. APA recognises the benefit of its Executives holding securities in APA. As a result, to
further align Executive interests with those of securityholders, in FY16, the Board has introduced a minimum securityholding
requirement. — The policy requires the CEO/MD to have a direct securityholding in APA equal to at least 100% of TFR. Senior Executives
are required to have a direct securityholding in APA equal to at least 50% of TFR. — Current Executives have five years (from 1 January 2016) to meet the requirement and new Executives (appointed to
office after 1 January 2016) will have three years following appointment to meet the requirement.
Comply with legal requirements and
appropriate governance standards

14
APT Pipelines Limited and its Controlled Entities
Remuneration Report for the year ended 30 June 2016
3.2 Changes to the executive remuneration framework during FY2016
The three changes highlighted in previous reports have now been fully implemented. Firstly,
TSR in the long term incentive plan was extended to the three previous years to more
closely reflect the long-term performance of APA. Secondly, EBITDA/FE was also extended
to the three previous years to strengthen the alignment of management and securityholder
interests. Thirdly, a minimum securityholding policy has been applied.
3.3 Approach to setting remuneration
Each executive’s Total Package Opportunity (“TPO”) consists of TFR plus STI plus LTI and is
dependent on their role in the organisation and their capacity to influence outcomes.
APA’s executive remuneration is structured as a mix of fixed remuneration and ‘at risk’
components (STI and LTI). The equal emphasis on short and long-term performance (i.e.,
through STI and LTI awards) ensures executives are appropriately rewarded for delivering
sustained APA performance. The proportion of fixed versus ‘at risk’ remuneration varies
between roles within APA, reflecting the different capacity of executives to influence APA’s
operational performance and returns to securityholders.
3.4 Remuneration components
TFR
TFR is reviewed annually and is determined by reference to independent external
remuneration benchmarking information, taking into account an individual’s
responsibilities, performance, qualifications and experience. APA’s policy is to position TFR
at least at the median against comparable ASX listed companies.
STI
The table below sets out the key elements of the executive STI plan.
STI plan element Description
STI opportunity STI opportunity is expressed as a percentage of TPO and varies by role.
Target STI opportunities are set out in the table below. Maximum STI is 150% of target STI
opportunity.
Participant Target STI as a % of TPO
CEO/MD 30%
Senior executives 25%
Performance
gateway
OCFPS acts as a gateway for awards under the STI plan. STI opportunity is only realisable if
the OCFPS threshold level of performance set by the Board is met (i.e., the “gate opens”).
Plan funding Provided the OCFPS threshold is met, the STI opportunity available may be modified based
on the level of OCFPS performance achieved.
Performance
measures
Once the “gate opens” and the STI is funded, STI awards are subject to performance
against individual KPIs based on a balanced scorecard of APA-wide, business unit and
personal objectives covering:
40% 30% 30%
50% 25% 25%
CEO/MD
Senior Executives
TFR as a % of TPO Target STI as a % of TPO Target LTI as a % of TPO

15
APT Pipelines Limited and its Controlled Entities
Remuneration Report for the year ended 30 June 2016
STI plan element Description
Financial measures: cost control, revenue and cash generation and capital
expenditure management, credit ratings.
Health, Safety & Environment measures: targets against key lead and lag indicators
Non-financial measures: strategy delivery, customer and stakeholder management,
project delivery, efficiency/improvement initiatives, leadership/talent development
and reinforcement of our ethical and values-based culture.
Timing and
delivery
All STI awards are paid in cash, usually in September of the new financial year, following
the completion of the audit of the annual accounts.
Clawback The Board in its discretion may determine that some, or all, of an executive's STI award is
forfeited in the event of misconduct or of a material misstatement in the year end financial
statements in the preceding three years.
Cessation of
employment
If a participant resigns or is dismissed (with or without notice), all unvested STI awards are
forfeited. If an employee leaves for any other reason, an STI award will be paid out based
on the proportion of the period that has passed and performance at the time of cessation
(subject to Board discretion).
Change of control Subject to Board discretion, and in line with market practice, if a change of control occurs,
an STI award will be paid out based on the proportion of the period that has passed at the
time of change of control
LTI
The table below sets out the key elements of the executive LTI plan.
LTI plan element Description
Award vehicle As a stapled security and under our Constitution, the use of actual securities in the LTI plan
would not be practicable. Instead, APA operates a reference unit incentive plan to create
alignment with securityholders.
Reference units exactly mirror the performance of APA securities and are settled in cash. To
further align executives and securityholders, APA has introduced a mandatory
securityholding policy, effective from FY2016, requiring executives to hold a substantial
number of securities in APA (see Section 3.2 for further detail).
Reference Units are valued at allocation based on the 30 trading day volume weighted
average market price (“VWAP”) of an APA security up to two days immediately preceding
the announcement of APA’s annual financial results to the ASX and as published in this
Report.
LTI opportunity LTI opportunities for each participant are set as a percentage of TPO, vary by role and are
shown in Section 3.3. Maximum LTI is 150% of target opportunity.
Participant Target LTI as a % of TPO
CEO/MD 30%
Senior executives 25%
LTI allocation The actual individual LTI allocation is determined at the completion of the financial year
based on TSR performance against the S&P/ASX100 comparator group and EBITDA/FE
performance.
Performance
measures and
targets
Awards are subject to two equally weighted measures: Relative TSR and EBITDA / FE.
Relative TSR
TSR measures the percentage change in security price, plus the value of dividends or
distributions received during the period, assuming all dividends and distributions are re-
invested into new securities.
APA Group's TSR is measured relative to a peer group comprising of S&P/ASX 100
constituents and is measured over three financial years.
Relative TSR has been selected as a LTI performance measure as it provides the most
direct measure of securityholder return and reflects an investor’s choice to invest in APA or
direct competitors. Executives only derive value from the TSR component of the LTI plan if
APA’s performance is at least at the median of S&P/ASX 100 companies over a three year
period.
EBITDA /FE
EBITDA/FE reflects Earnings Before Interest, Tax, Depreciation and Amortisation divided by

16
APT Pipelines Limited and its Controlled Entities
Remuneration Report for the year ended 30 June 2016
LTI plan element Description
Funds Employed. EBITDA/FE hurdle is set as a percentage growth compared to budget
and is measured over three financial years. The Board determines the EBITDA/FE target
each year through the rigorous budget setting process to improve the capital efficiency
of the organisation.
EBITDA/FE has been selected as an LTI performance measure as it helps determine the
operating cash flow leverage being achieved based on the operating assets available to
the business. It is a longer term performance measure based on the integrity of earnings
performance against funds employed.
Retesting There is no retesting of the allocation. However each vesting tranche is subject to the
relevant price at vesting reflecting the movement in value of APA’s securities each year.
Timing and
delivery
An LTI allocation vests in three equal instalments over the three financial years following the
allocation, with the initial one-third vesting at the end of the first financial year following the
first award, one-third at the end of the second financial year, and one-third at the end of
the third financial year.
Upon vesting, the LTI is delivered in cash. The cash payment is equal to the number of units
vesting on the vesting date multiplied by the VWAP published in the Annual Report.
From FY2016, APA will require Executives to hold a number of APA securities. Executives may
apply vested LTI amounts to the purchase of securities to fulfil the securityholding
requirement. Executives are currently required to purchase APA Securities ‘on market’ and in
accordance with APA Securities Trading Policy and within authorised trading windows.
Restrictions LTI allocations of reference units do not entitle participants to vote at securityholders
meetings nor to be paid distributions. No options or other equity instruments are issued to
APA employees or non-executive directors under the LTI plan.
Clawback The Board in its discretion may determine that some, or all, of an executive's current year LTI
allocation is forfeited in the event of misconduct or of a material misstatement in the year
end financial statements in the preceding three years.
Cessation of
employment
If a participant resigns or is dismissed (with or without notice), all unvested reference units are
forfeited. If an employee leaves for any other reason the Board determines the number of
reference units which will lapse or are retained, subject to vesting on the original schedule.
Change of
control
Subject to Board discretion, and in line with market practice, if a change of control occurs,
all previously allocated units will vest. A further number of units will be allocated based on
the proportion of the period that has passed in the current financial year at the time of
change of control and will also vest on change of control.
4 Executive Contracts
4.1 Contractual arrangements
Remuneration arrangements for Executives are formalised in individual employment
agreements. The terms of the contractual arrangements for Executives are set out in the
table below:
Executive Contract type Notice period Termination entitlement
(without cause)
CEO/MD Permanent 12 months 52 weeks TFR
Senior Executives Permanent 6 months 13 weeks TFR
4.2 Sign-on / termination payments provided to executives
APA did not pay any sign-on payments during FY2016. APA made the following termination
payments during FY2016.

17
APT Pipelines Limited and its Controlled Entities
Remuneration Report for the year ended 30 June 2016
Termination Payments
Executive Position Held Terminated Payments at time of Termination On-going Payments
Mark
Knapman
Company
Secretary
Retired
30 October
2015
Statutory Entitlements plus 3 months
TFR in lieu of notice plus pro-rata STI
plus pro-rata LTI Allocation
Unvested reference units will
vest in accordance with the
original vesting schedule
Peter
Wallace
Group
Executive
Human
Resources
Retired
02 October
2015
Statutory Entitlements plus 6 months
TFR in lieu of notice plus pro-rata STI
plus pro-rata LTI Allocation
Unvested reference units will
vest in accordance with the
original vesting schedule
5 Remuneration Governance
5.1 Role of People and Remuneration Committee
The People and Remuneration Committee has been established by the Board to oversee
Executive and non-executive director remuneration. The role of the People and
Remuneration Committee is to ensure the provision of a robust remuneration and reward
system that aligns employee and investor interests and facilitates effective attraction,
retention and development of employees. The People and Remuneration Committee's
activities are governed by its Charter (a copy of the Charter is available on APA's website).
In addition to making recommendations regarding APA's broad remuneration strategy and
policy (including diversity matters), the People and Remuneration Committee is responsible
for:
recommending the CEO/MD's performance objectives, remuneration and
appointment, retention and termination policy to the Board;
reviewing and approving Executives’ remuneration (based on recommendations
from the CEO/MD);
reviewing and recommending the Remuneration Report to the Board; and
reviewing senior succession plans and talent.
5.2 Composition of People and Remuneration Committee
The members of the People and Remuneration Committee, all of whom are independent
non-executive directors, are:
John Fletcher (Chairman);
Steven Crane;
Patricia McKenzie;
Michael Fraser.
The Chairman of the Board attends all meetings of the People and Remuneration
Committee and the CEO/MD attends by invitation, where management input is required.
The People and Remuneration Committee met three times during the year.
5.3 Use of external advisors
The People and Remuneration Committee seeks external professional advice from time to
time on any matter within its terms of reference. Remuneration advisors are engaged by
the People and Remuneration Committee and report directly to the Committee.

18
APT Pipelines Limited and its Controlled Entities
Remuneration Report for the year ended 30 June 2016
During FY2016, the following remuneration information was obtained and considered by
the People and Remuneration Committee:
Ernst & Young provided remuneration benchmarking information, undertook a review
of APA's executive remuneration framework and assisted with remuneration
governance;
Egan & Associates provided fee and remuneration benchmarking information for non-
executive director fees and certain members of the executive team, respectively; and
Orient Capital (Link Group) provided TSR benchmarking analysis.
.
6 Non-executive Director Arrangements
6.1 Determination of non-executive director fees
The Board seeks to attract and retain high calibre non-executive directors who are
equipped with diverse skills to oversee all functions of APA in an increasingly complex
environment.
Selection and appointment of new Directors, Board succession and related matters were
handled by the Board until December 2015 when a Nomination Committee was
established comprising of APA Group’s non-executive Directors.
The Board determines Board fees and Committee fees annually. It acts on advice from the
People and Remuneration Committee which obtains external benchmark information from
independent remuneration specialists. Such information includes market comparisons paid
by comparable S&P/ASX 100 organisations.
Non-executive director fees comprise:
a Board fee;
an additional fee for serving on a committee of the Board; and
statutory superannuation contributions.
Non-executive directors do not receive incentive payments nor participate in incentive
plans of any type.
One off ‘per diems’ may be paid in exceptional circumstances. No payments have been
made under this arrangement in this reporting period or the prior reporting period.
The Board members are subject to a minimum securityholding requirement of 100% of
annual base fees in line with the changes introduced for the CEO/MD and Executives.
Superannuation is provided in accordance with the statutory requirements under with the
Superannuation Guarantee Act.
Following external benchmarking and a review of APA’s performance relative to other
companies, Board fees and committee fees were increased effective 1 January 2016 (see
table below).
Board and Committee fees per annum (excluding statutory superannuation) are outlined
below. The Board Chairman does not receive additional fees for attending committee
meetings.
19
APT Pipelines Limited and its Controlled Entities
Remuneration Report for the year ended 30 June 2016
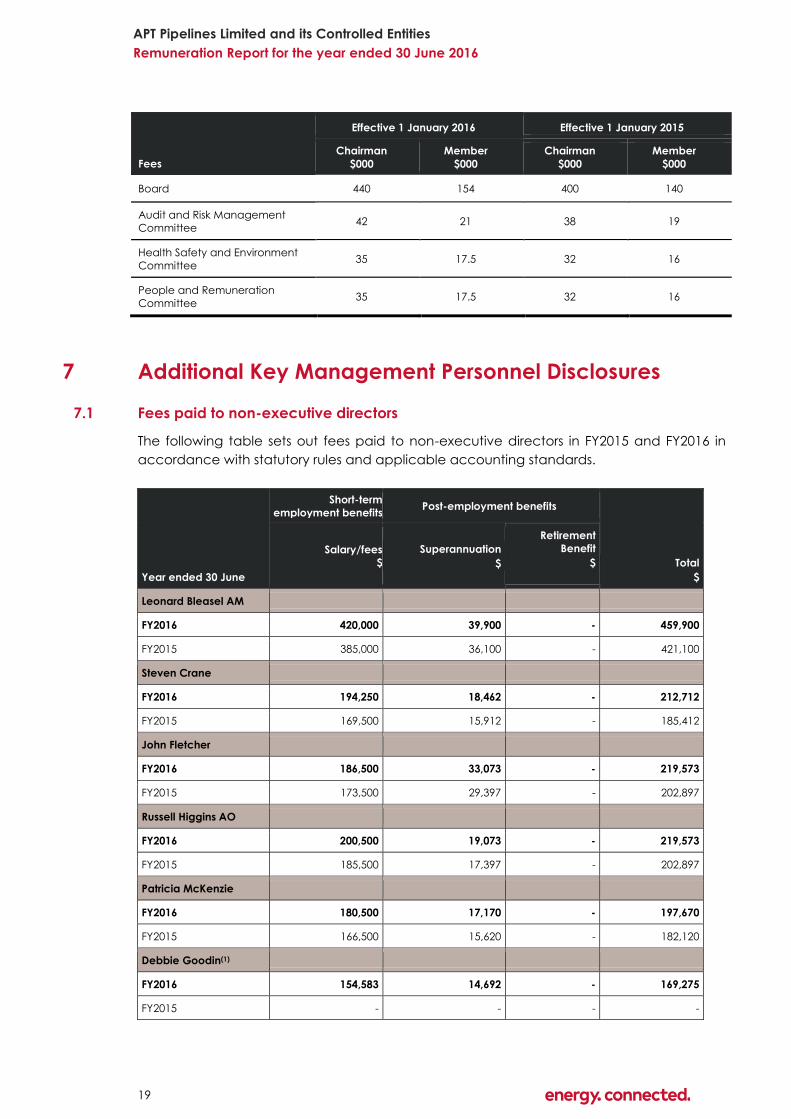
Fees
Effective 1 January 2016 Effective 1 January 2015
Chairman
$000
Member
$000
Chairman
$000
Member
$000
Board 440 154 400 140
Audit and Risk Management
Committee 42 21 38 19
Health Safety and Environment
Committee 35 17.5 32 16
People and Remuneration
Committee 35 17.5 32 16
7 Additional Key Management Personnel Disclosures
7.1 Fees paid to non-executive directors
The following table sets out fees paid to non-executive directors in FY2015 and FY2016 in
accordance with statutory rules and applicable accounting standards.
Year ended 30 June
Short-term
employment benefits Post-employment benefits
Total
$
Salary/fees
$
Superannuation
$
Retirement
Benefit
$
Leonard Bleasel AM
FY2016 420,000 39,900 - 459,900
FY2015 385,000 36,100 - 421,100
Steven Crane
FY2016 194,250 18,462 - 212,712
FY2015 169,500 15,912 - 185,412
John Fletcher
FY2016 186,500 33,073 - 219,573
FY2015 173,500 29,397 - 202,897
Russell Higgins AO
FY2016 200,500 19,073 - 219,573
FY2015 185,500 17,397 - 202,897
Patricia McKenzie
FY2016 180,500 17,170 - 197,670
FY2015 166,500 15,620 - 182,120
Debbie Goodin(1)
FY2016 154,583 14,692 - 169,275
FY2015 - - - -

20
APT Pipelines Limited and its Controlled Entities
Remuneration Report for the year ended 30 June 2016
Year ended 30 June
Short-term
employment benefits Post-employment benefits
Total
$
Salary/fees
$
Superannuation
$
Retirement
Benefit
$
Michael Fraser(2)
FY2016 151,833 14,447 - 166,280
FY2015 - - - -
Robert Wright
FY2016 60,258 5,724 54,500(3) 120,482
FY2015 188,500 17,679 - 206,179
Total
FY2016 1,548,424 162,541 54,500 1,765,465
FY2015 1,268,500 132,105 - 1,400,605
(1) Debbie Goodin commenced 01 September 2015.
(2) Michael Fraser commenced 01 September 2015.
(3) Robert Wright retired 22 October 2015. Following changes in superannuation regulations in 2003, the Board
terminated the Non-executive directors' retirement benefit plan. Benefits to participating non-executive
directors accruing up to the termination date were quantified and preserved for payment on retirement of
those non-executive directors. Robert Wright was the only non-executive director entitled to a preserved
benefit under the plan and this was paid on his retirement from the Board on 22 October 2015.
7.2 Total remuneration earned and received by Executives
The following table outlines the total remuneration earned by Executives during FY2015 and
FY2016, calculated in accordance with applicable accounting standard AASB 2: Share-
based Payment. This requires the three equal instalments to be accounted for over a four
year period, that is, the year of service to which the allocation is awarded plus the
following three year period during which vesting rights are satisfied.
Year
ended 30
June
Short-Term Employment Benefits
Post-
Employment LTI Plans
Other
Payments (2)
$
Total
$
Salary/Fees
$
STI
$
Non-
Monetary
$
Superannuation
$
Security-
Based
Payments (1)
$
Michael McCormack
FY2016 1,730,000 1,814,861 - 35,000 1,581,283 - 5,161,144
FY2015 1,500,000 1,609,447 - 35,000 1,564,212 - 4,708,659
Peter Fredricson
FY2016 800,000 604,331 - 35,000 543,124 - 1,982,455
FY2015 745,000 561,600 - 35,000 570,885 202,000 2,114,485
Ross Gersbach
FY2016 805,078 584,685 11,922 35,000 576,019 - 2,012,704
FY2015 792,295 589,844 11,922 18,783 622,328 228,666 2,263,838

21
APT Pipelines Limited and its Controlled Entities
Remuneration Report for the year ended 30 June 2016
Year
ended 30
June
Short-Term Employment Benefits
Post-
Employment LTI Plans
Other
Payments (2)
$
Total
$
Salary/Fees
$
STI
$
Non-
Monetary
$
Superannuation
$
Security-
Based
Payments (1)
$
Robert Wheals
FY2016 648,000 469,854 - 30,000 384,858 - 1,532,712
FY2015 560,000 408,162 - 30,000 344,570 - 1,342,732
John Ferguson
FY2016 552,000 411,194 - 35,000 345,605 - 1,343,799
FY2015 489,000 361,560 - 35,000 318,204 - 1,203,764
Kevin Lester
FY2016 516,000 360,767 - 35,000 309,242 - 1,221,009
FY2015 444,000 311,757 - 35,000 215,410 - 1,006,167
Nevenka Codevelle (3)
FY2016 388,367 270,489 - 24,708 262,163 - 945,727
FY2015 - - - - - - -
Elise Manns (4)
FY2016 357,640 247,427 - 30,000 331,385 - 966,452
FY2015 - - - - - - -
Mark Knapman
FY2016 157,699 61,600 - 34,999 262,163 236,224 (5) 752,685
FY2015 474,005 260,406 - 34,995 272,908 - 1,042,314
Peter Wallace
FY2016 132,057 68,504 - 20,427 331,385 305,278 (5) 857,651
FY2015 497,000 361,893 - 35,000 334,123 - 1,228,016
Total Remuneration
FY2016 6,086,841 4,893,712 11,922 315,134 4,927,227 541,502 16,776,338
FY2015 5,501,300 4,464,669 11,922 258,778 4,242,640 430,666 14,909,975
(1) Cash settled security-based payments. Reference units subject to Board allocation in August 2016 based on an
estimated VWAP of $9.4614.
(2) Other payments include Loyalty Payment instalments. Refer to “Executive contracts” section for more information.
(3) Nevenka Codevelle, Company Secretary and General Counsel from 31 October 2015.
(4) Elise Manns, Group Executive Human Resources from 02 October 2015.
(5) Termination payment.
Note: Volume Weighted Average Price (“VWAP”) is calculated over 30 trading days and 2 days prior to the release of
APA results on 24 August 2016.
7.3 Outstanding LTI awards
The following table sets out the movements in the number of LTI reference units and the
number of LTI reference units that have been allocated to executives but have not yet
vested or been paid, and the years in which they will vest.

22
APT Pipelines Limited and its Controlled Entities
Remuneration Report for the year ended 30 June 2016
Executives
Grant Date
(financial
year)
Opening
balance at
1 July 2015 Allocated Paid
Closing
balance at
30 June
2016
Units
subject to
allocation
by the
Board in
August
2016 (1)
Reference units allocated that
have not yet vested or been
paid and the financial years in
which they will vest(2)
FY2017 FY2018 FY2019 FY2020
Michael
McCormack
FY2012 66,077 (66,077) - - - - -
FY2013 123,278 (61,639) 61,639 61,639 - - -
FY2014 135,141 (45,047) 90,094 45,047 45,047 - -
FY2015 188,295 188,295 62,765 62,765 62,765 -
FY2016 155,544 - 51,848 51,848 51,848
Total 169,451 159,660 114,613 51,848
Peter
Fredricson
FY2012 26,300 (26,300) - - - - -
FY2013 45,134 (22,567) 22,567 22,567 - - -
FY2014 47,250 (15,750) 31,500 15,750 15,750 - -
FY2015 63,954 63,954 21,318 21,318 21,318 -
FY2016 49,056 - 16,352 16,352 16,352
Total 59,635 53,420 37,670 16,352
Ross
Gersbach
FY2012 29,772 (29,772) - - - - -
FY2013 49,580 (24,790) 24,790 24,790 - - -
FY2014 49,833 (16,611) 33,222 16,611 16,611 - -
FY2015 67,479 67,479 22,493 22,493 22,493 -
FY2016 50,055 - 16,685 16,685 16,685
Total 63,894 55,789 39,178 16,685
Robert
Wheals
FY2012 11,320 (11,320) - - - - -
FY2013 27,954 (13,977) 13,977 13,977 - - -
FY2014 31,500 (10,500) 21,000 10,500 10,500 - -
FY2015 48,375 48,375 16,125 16,125 16,125 -
FY2016 39,831 - 13,277 13,277 13,277
Total 40,602 39,902 24,402 13,277

23
APT Pipelines Limited and its Controlled Entities
Remuneration Report for the year ended 30 June 2016
Executives
Grant Date
(financial
year)
Opening
balance at
1 July 2015 Allocated Paid
Closing
balance at
30 June
2016
Units
subject to
allocation
by the
Board in
August
2016 (1)
Reference units allocated that
have not yet vested or been
paid and the financial years in
which they will vest(2)
FY2017 FY2018 FY2019 FY2020
John
Ferguson
FY2012 11,057 (11,057) - - - - -
FY2013 25,800 (12,900) 12,900 12,900 - - -
FY2014 28,980 (9,660) 19,320 9,660 9,660 - -
FY2015 42,963 42,963 14,321 14,321 14,321 -
FY2016 34,485 - 11,495 11,495 11,495
Total 36,881 35,476 25,816 11,495
Kevin
Lester
FY2013 21,190 (10,595) 10,595 10,595 - - -
FY2014 26,460 (8,820) 17,640 8,820 8,820 - -
FY2015 39,273 39,273 13,091 13,091 13,091 -
FY2016 32,370 - 10,790 10,790 10,790
Total 32,506 32,701 23,881 10,790
Nevenka
Codevelle (3)
FY2016 21,732 - 7,244 7,244 7,244
Total - 7,244 7,244 7,244
Elise
Manns (4)
FY2016 21,042 - 7,014 7,014 7,014
Total - 7,014 7,014 7,014
Mark
Knapman (5)
FY2012 13,073 (13,073) - - - -
FY2013 21,268 (10,634) 10,634 10,634 - - -
FY2014 21,897 (7,299) 14,598 7,299 7,299 - -
FY2015 30,219 30,219 10,073 10,073 10,073 -
FY2016 - - - - -
Total 28,006 17,372 10,073 -
Peter
Wallace (6)
FY2012 13,606 (13,606) - - - - -
FY2013 24,924 (12,462) 12,462 12,462 - - -
FY2014 29,166 (9,722) 19,444 9,722 9,722 - -
FY2015 43,620 43,620 14,540 14,540 14,540 -
FY2016 - - - - -
Total 36,724 24,262 14,540 -
(1) Reference units subject to Board allocation in August 2016 based on an estimated VWAP of $9.4614.
(2) Reference units multiplied by 30 trading days VWAP to be paid in cash in September 2016.
(3) Nevenka Codevelle, Company Secretary and General Counsel from 30 October 2015.
(4) Elise Manns, Group Executive Human Resources from 2 October 2015.
(5) Mark Knapman retired 30 October 2015. (6) Peter Wallace, retired 02 October 2015.
24
APT Pipelines Limited and its Controlled Entities
Remuneration Report for the year ended 30 June 2016
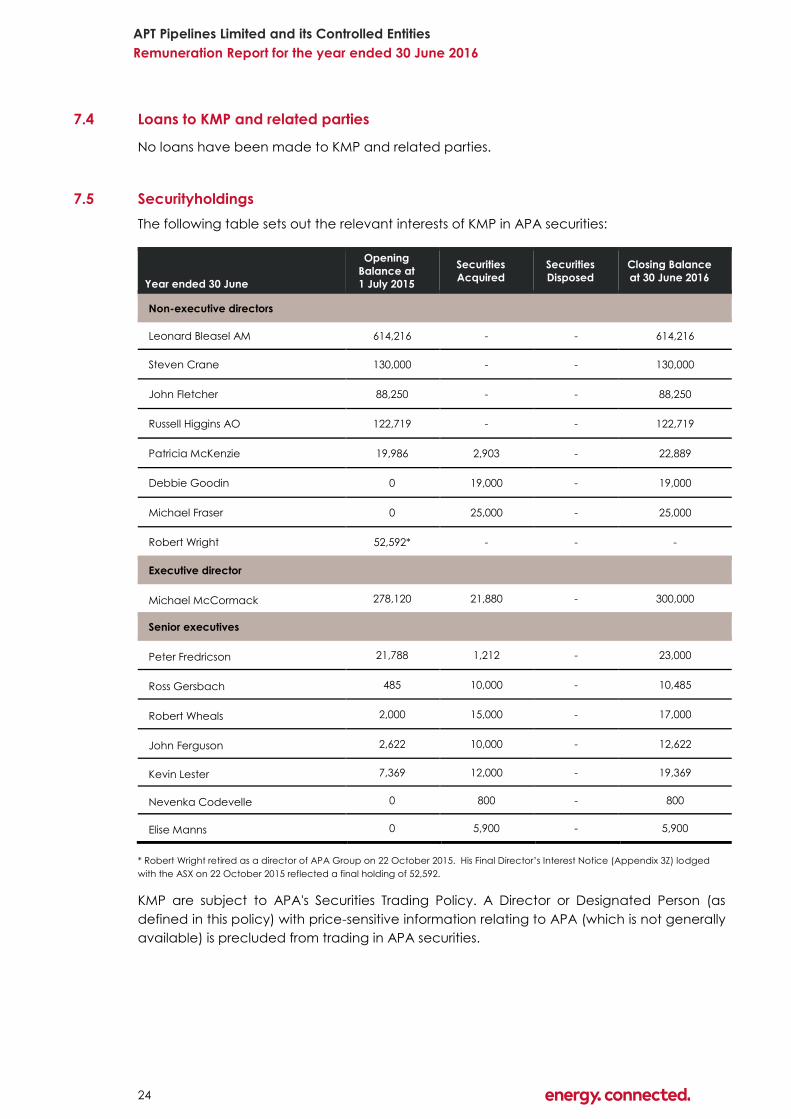
7.4 Loans to KMP and related parties
No loans have been made to KMP and related parties.
7.5 Securityholdings
The following table sets out the relevant interests of KMP in APA securities:
Year ended 30 June
Opening
Balance at
1 July 2015
Securities
Acquired
Securities
Disposed
Closing Balance
at 30 June 2016
Non-executive directors
Leonard Bleasel AM 614,216 - - 614,216
Steven Crane 130,000 - - 130,000
John Fletcher 88,250 - - 88,250
Russell Higgins AO 122,719 - - 122,719
Patricia McKenzie 19,986 2,903 - 22,889
Debbie Goodin 0 19,000 - 19,000
Michael Fraser 0 25,000 - 25,000
Robert Wright 52,592* - - -
Executive director
Michael McCormack 278,120 21,880 - 300,000
Senior executives
Peter Fredricson 21,788 1,212 - 23,000
Ross Gersbach 485 10,000 - 10,485
Robert Wheals 2,000 15,000 - 17,000
John Ferguson 2,622 10,000 - 12,622
Kevin Lester 7,369 12,000 - 19,369
Nevenka Codevelle 0 800 - 800
Elise Manns 0 5,900 - 5,900
* Robert Wright retired as a director of APA Group on 22 October 2015. His Final Director’s Interest Notice (Appendix 3Z) lodged
with the ASX on 22 October 2015 reflected a final holding of 52,592.
KMP are subject to APA's Securities Trading Policy. A Director or Designated Person (as
defined in this policy) with price-sensitive information relating to APA (which is not generally
available) is precluded from trading in APA securities.

25
APT Pipelines Limited and its Controlled Entities
Remuneration Report for the year ended 30 June 2016
7.6 Other transactions with KMP of APA and the Responsible Entity and related parties
Leonard Bleasel AM holds 10,000 subordinated notes that were issued by APT Pipelines
Limited, a subsidiary of APT.
Other than non-executive director fees, executive compensation and equity and debt
holdings disclosed in this report, there are no other transactions with the KMP of APA and
the Responsible Entity.

APT Pipelines Limited and its Controlled Entities
Consolidated Statement of Profit or Loss and Other Comprehensive IncomeFor the financial year ended 30 June 2016
2016 2015
Note $000 $000
Continuing operationsRevenue 5 2,071,262 1,536,642
Share of net profits of associates and joint ventures using the equity method 5 16,021 12,557
2,087,283 1,549,199
Asset operation and management expenses (128,359) (65,508)
Depreciation and amortisation expense 6 (520,066) (208,200)
Other operating costs - pass-through 6 (438,330) (434,382)
Finance costs 6 (561,265) (367,648)
Employee benefit expense 6 (180,057) (176,174)
Other expenses (6,584) (24,233)
Profit before tax 252,622 273,054
Income tax expense 7 (124,423) (81,944)
Profit for the year 128,199 191,110
Other comprehensive income, net of income tax
Items that will not be reclassified subsequently to profit or loss:
Actuarial (loss)/gain on defined benefit plan (8,148) 18,354
Income tax relating to items that will not be reclassified subsequently 2,444 (5,506)
(5,704) 12,848
Items that may be reclassified subsequently to profit or loss:
Transfer of loss on cash flow hedges to profit or loss 121,922 68,960
Loss on cash flow hedges taken to equity (249,150) (316,555)
Loss on associate hedges taken to equity (8,086) (9,247)
Recycling of reserves on disposal of associate 15,099 -
Income tax relating to items that may be reclassified subsequently 36,096 77,052
(84,119) (179,790)
Other comprehensive income for the year (net of tax) (89,823) (166,942)
Total comprehensive income for the year 38,376 24,168
Profit attributable to:
Equityholders of the parent 96,451 167,925
Non-controlling - other 31,748 23,185
128,199 191,110
Total comprehensive income attributable to:
Equityholders of the parent 6,628 983
Non-controlling - other 31,748 23,185
38,376 24,168
The above consolidated statement of profit or loss and other comprehensive income should be read in conjunction with
the accompanying notes.
26

APT Pipelines Limited and its Controlled Entities
Consolidated Statement of Financial PositionAs at 30 June 2016
2016 2015
Note $000 $000
Current assetsCash and cash equivalents 18 77,937 411,839
Trade and other receivables 9 263,800 254,800
Receivables from related parties 9 139,625 135,942
Other financial assets 21 35,140 24,789
Inventories 24,891 21,290
Other 12,715 8,314
Current assets 554,108 856,974
Non-current assetsTrade and other receivables 9 17,283 92,470
Other financial assets 21 431,371 472,223
Investments accounted for using the equity method 24 197,185 257,425
Property, plant and equipment 11 9,048,052 8,355,193
Goodwill 12 1,184,588 1,140,500
Other intangible assets 12 3,364,334 3,556,246
Other 15 28,622 33,069
Non-current assets 14,271,435 13,907,126
Total assets 14,825,543 14,764,100
Current liabilitiesTrade and other payables 10 238,528 398,300
Payables to related parties 10 2,613,186 2,907,055
Borrowings 19 410,532 165,023
Other financial liabilities 21 114,674 145,815
Provisions 14 91,672 85,452
Unearned revenue 13,735 7,477
Current liabilities 3,482,327 3,709,122
Non-current liabilitiesTrade and other payables 10 3,007 3,261
Payables to related parties 10 895,102 876,911
Borrowings 19 9,323,621 9,151,448
Other financial liabilities 21 194,591 44,793
Deferred tax liabilities 7 540,905 451,522
Provisions 14 69,991 60,410
Unearned revenue 41,895 16,801
Non-current liabilities 11,069,112 10,605,146
Total liabilities 14,551,439 14,314,268
Net assets 274,104 449,832
The above consolidated statement of financial position should be read in conjunction with the accompanying notes.
27

APT Pipelines Limited and its Controlled Entities
Consolidated Statement of Financial Position (continued)As at 30 June 2016
2016 2015
Note $000 $000
EquityAPT Pipelines Limited equity:
Issued capital 22 117,330 117,330
Reserves (390,174) (306,055)
Retained earnings 427,642 519,252
Equity attributable to equityholders of the parent 154,798 330,527
Non-controlling interest 23 119,306 119,305
Total equity 274,104 449,832
The above consolidated statement of financial position should be read in conjunction with the accompanying notes.
28

APT Pipelines Limited and its Controlled Entities
Consolidated Statement of Changes in EquityFor the financial year ended 30 June 2016
Attributable
Asset to owner Non-
Issued Revaluation Hedging Retained of the Issued Other Retained Controlling
Capital Reserve Reserve earnings parent Capital Reserves earnings Interest Total
$000 $000 $000 $000 $000 $000 $000 $000 $000 $000
Balance at 1 July 2014 117,330 8,669 (134,934) 461,805 452,870 119,257 1 46 119,304 572,174
Profit for the year - - - 167,925 167,925 - - 23,185 23,185 191,110
Other comprehensive income - - (256,842) 18,354 (238,488) - - - - (238,488)
Income tax relating to components of other
comprehensive income - - 77,052 (5,506) 71,546 - - - - 71,546
Total comprehensive income for the year - - (179,790) 180,773 983 - - 23,185 23,185 24,168 -
Payment of dividends (Note 8) - - - (123,326) (123,326) - - (23,184) (23,184) (146,510)
Balance at 30 June 2015 117,330 8,669 (314,724) 519,252 330,527 119,257 1 47 119,305 449,832
Balance at 1 July 2015 117,330 8,669 (314,724) 519,252 330,527 119,257 1 47 119,305 449,832
Profit for the year - - - 96,451 96,451 - - 31,748 31,748 128,199
Other comprehensive income - - (120,215) (8,148) (128,363) - - - - (128,363)
Income tax relating to components of other
comprehensive income - - 36,096 2,444 38,540 - - - - 38,540
Total comprehensive income for the year - - (84,119) 90,747 6,628 - - 31,748 31,748 38,376 -
Payment of dividends (Note 8) - - - (182,357) (182,357) - - (31,747) (31,747) (214,104)
Balance at 30 June 2016 117,330 8,669 (398,843) 427,642 154,798 119,257 1 48 119,306 274,104
The above consolidated statement of changes in equity should be read in conjunction with the accompanying notes.
Non-controlling interestAPT Pipelines Limited and its Controlled Entities
29

APT Pipelines Limited and its Controlled Entities
Consolidated Statement of Cash FlowsFor the financial year ended 30 June 2016
2016 2015
Note $000 $000
Cash flows from operating activitiesReceipts from customers 2,281,549 1,584,738
Payments to suppliers and employees (961,275) (828,349)
Receipts of Hastings Funds Management fees 3 - 17,201
Dividends received from associates and joint ventures 17,727 21,748
Proceeds from repayment of finance leases 3,399 4,621
Interest received 9,582 30,229
Interest and other costs of finance paid (543,502) (312,559)
Net cash provided by operating activities 807,480 517,629
Cash flows from investing activitiesPayments for property, plant and equipment (456,219) (2,814,559)
Proceeds from sale of property, plant and equipment 386 876
Payments for equity accounted investments - (17,383)
Payments for other assets - (18,612)
Payments for controlled entities net of cash acquired 25 (98,271) -
Payments for intangible assets (705) (3,429,281)
Loans advanced to related parties - (3,490)
Proceeds from sale of finance lease asset - 8,683
Net cash used in investing activities (554,809) (6,273,766)
Cash flows from financing activitiesProceeds from borrowings 1,110,153 5,279,188
Repayments of borrowings (1,176,899) (1,429,500)
Payment of debt issue costs (9,623) (32,398)
Proceeds from early settlement of derivatives - 19,515
Dividends paid to:
Equityholders of APT Pipelines Limited 8 (182,357) (123,326)
Equityholders of the non-controlling interest (31,747) (23,184)
Advances (to)/from related parties (296,462) 2,470,909
Net cash (used in)/provided by financing activities (586,935) 6,161,204
Net (decrease)/increase in cash and cash equivalents (334,264) 405,067
Cash and cash equivalents at beginning of financial year 411,839 6,793
Unrealised exchange gains/(losses) on cash held 362 (21)
Cash and cash equivalents at end of financial year 77,937 411,839
The above consolidated statement of cash flows should be read in conjunction with the accompanying notes.
30

APT Pipelines Limited and its Controlled Entities
Consolidated Statement of Cash Flows (continued)For the financial year ended 30 June 2016
Reconciliation of profit for the year to net cash provided by operating activities
2016 2015
Note $000 $000
Profit for the year 128,199 191,110
Gain on previously held interest on obtaining control (5,036) -
Acquisition costs from business combinations 353 -
Loss on disposal of property, plant and equipment 447 3,337
Loss on write-off of inventories 127 -
Profit on sale of finance lease asset - (1,764)
Impairment of goodwill 3 - 10,000
Share of net profits of joint ventures and associates using the equity method (16,021) (12,557)
Dividends/distributions received from equity accounted investments 17,727 21,748
Depreciation and amortisation expense 520,066 208,200
Finance costs 12,219 21,221
Unrealised foreign exchange (gain)/loss (938) 35
Realised hedging loss/(gain) 7,540 (19,258)
Changes in assets and liabilities:
Trade and other receivables (17,575) (49,872)
Inventories (3,605) (3,936)
Other assets 6,248 (22,287)
Trade and other payables (5,081) 64,988
Provisions 2,949 14,725
Other liabilities 35,438 9,995
Income tax balances 124,423 81,944
Net cash provided by operating activities 807,480 517,629
Cash flows are included in the statement of cash flows on a gross basis. The GST component of cash flows arising from
investing and financing activities which is recoverable from, or payable to, the taxation authority is classified within
operating cash flows.
31

APT Pipelines Limited and its Controlled Entities
Notes to the consolidated financial statements For the financial year ended 30 June 2016
Basis of Preparation
1. About this report
Basis of Preparation Financial Performance Operating Assets and Liabilities
1. About this report 4. Segment information 9. Receivables
2. General information 5. Revenue 10. Payables
3. Significant items and events 6. Expenses 11. Property, plant and equipment
7. Income tax 12. Goodwill and intangibles
8. Dividends 13.
14. Provisions
15. Other non-current assets
16. Employee superannuation plans
17. Leases
Capital Management Group Structure Other
18. Cash and cash equivalents 23. Non-controlling interests 27. Commitments and contingencies
19. Borrowings 24. 28.
20. Financial risk management 25. Business combinations 29.
21. Other financial Instruments 30. Related party transactions
22. Issued capital 31. Parent entity information
32.
33.
Adoption of new and
revised Accounting
Events occurring after
reporting date
Joint arrangements and
associates
Director and senior
executive remuneration
Remuneration of external
auditor
26. Subsidiaries
The content and format of the financial statements is streamlined to present the financial information in a meaningful
manner. Note disclosures are grouped into six sections being Basis of Preparation, Financial Performance, Operating Assets
and Liabilities, Capital Management, Group Structure and Other. Each note sets out the accounting policies applied in
producing the results along with any key judgements and estimates used. The purpose of the format is to provide readers
with a clearer understanding of what are the key drivers of financial performance for the Consolidated Entity.
Impairment of non-financial
assets
32

APT Pipelines Limited and its Controlled Entities
Notes to the consolidated financial statements (continued)For the financial year ended 30 June 2016
Basis of Preparation
2. General information
APTPL's registered office and principal place of business are as follows:
Level 19
HSBC Building
580 George Street
SYDNEY NSW 2000
Tel: (02) 9693 0000
Working capital position
Foreign currency transactions
The financial report has been prepared on the basis of historical cost, except for the revaluation of financial instruments.
The financial report is presented in Australian dollars and all values are rounded to the nearest thousand dollars ($000) in
accordance with ASIC Corporations Instrument 2016/191, unless otherwise stated.
All intragroup transactions and balances have been eliminated on consolidation. Where necessary, adjustments are
made to the assets, liabilities, and results of subsidiaries, joint arrangements and associates to bring their accounting
policies into line with those used by the Consolidated Entity.
Both the functional and presentation currency of the Consolidated Entity is Australian dollars (A$). All foreign currency
transactions during the financial year are brought to account using the exchange rate in effect at the date of the
transaction. Foreign currency monetary items at reporting date are translated at the exchange rate existing at that date
and resulting exchange differences are recognised in profit or loss in the period in which they arise, unless they qualify for
hedge accounting.
The Directors continually monitor the Consolidated Entity's working capital position, including forecast working capital
requirements and have ensured that there are appropriate refinancing strategies and adequate committed funding
facilities in place to accommodate debt repayments as and when they fall due.
The working capital position as at 30 June 2016 for the Consolidated Entity is that current liabilities exceed current assets
by $2,928.2 million (2015: $2,852.1 million). Excluding current related party loan balances held with Australian Pipeline Trust,
the Consolidated Entity's current liabilities exceed current assets by $454.7 million (2015: $81.0 million) primarily as a result
of $114.7 million (AUD equivalent) of cash flow hedge liabilities and current borrowings of $410.5 million.
The consolidated general purpose financial report for the year ended 30 June 2016 was authorised for issue in
accordance with a resolution of the directors on 24 August 2016.
The Consolidated Entity has access to available committed, un-drawn bank facilities of $672.5 million as at 30 June 2016
(2015: $1,175.0 million).
APT Pipelines Limited ("APTPL") is a subsidiary of Australian Pipeline Trust ("APT"). APT is one of two stapled trusts of APA
Group, the other being APT Investment Trust ("APTIT"). APA Group is listed on the Australian Securities Exchange (trading
under the code "APA"), registered in Australia and operating in Australia.
The financial report represents the consolidated financial statements of APTPL, its respective subsidiaries and their share of
joint arrangements, associates and joint ventures (together the "Consolidated Entity"). For the purposes of preparing the
consolidated financial report, the Consolidated Entity is a for-profit entity.
This general purpose financial report has been prepared in accordance with the requirements of the Corporations Act
2001, Australian Accounting Standards and other authoritative pronouncements of the Australian Accounting Standards
Board (AIFRS) and also comply with International Financial Reporting Standards (IFRS) as issued by the International
Accounting Standards Board.
33

APT Pipelines Limited and its Controlled Entities
Notes to the consolidated financial statements (continued)For the financial year ended 30 June 2016
Basis of Preparation
3. Significant items and events
Individually significant items included in profit after income tax expense are as follows:
2016 2015
$000 $000
Significant items impacting EBITDA
Recovery of fees paid by HDF to Hastings Funds Management Limited (a)
- 17,201
Reassessment of goodwill (b)
- (10,000)
Total significant items impacting EBITDA - 7,201
Income tax related to significant items above - (1,417)
Profit from significant items after income tax - 5,784
(b)
(a) In November 2014, the Consolidated Entity successfully appealed the NSW Supreme Court decision in a matter regarding performance fees
previously paid by Hastings Diversified Utilities Fund (HDF) to Hastings Funds Management Limited (HFML).
Reassessment of the goodwill carrying value in the asset management business to reflect future growth opportunities.
34

APT Pipelines Limited and its Controlled Entities
Notes to the consolidated financial statements (continued)For the financial year ended 30 June 2016
Financial Performance
4. Segment information
The Consolidated Entity comprises the following reportable segments:
●
●
●
Reportable segments
Energy Asset Energy
infrastructure management investments Other Consolidated
2016 $000 $000 $000 $000 $000
Segment revenue (a)
External sales revenue 1,522,568 96,793 - - 1,619,361
Equity accounted net profits - - 16,021 - 16,021
Pass-through revenue 29,586 408,744 - - 438,330
Finance lease and investment interest income 1,917 - 8,038 - 9,955
Total segment revenue 1,554,071 505,537 24,059 - 2,083,667
Other interest income 3,616
Consolidated revenue 2,087,283
Segment result
Earnings before interest, tax, depreciation and
amortisation ("EBITDA") 1,330,570 55,220 5,036 - 1,390,826
Share of net profits of joint ventures and associates - - 16,021 - 16,021
Finance lease and investment interest income 1,917 - 8,038 - 9,955
Corporate costs - - - (86,465) (86,465)
Total EBITDA 1,332,487 55,220 29,095 (86,465) 1,330,337
Depreciation and amortisation (507,631) (12,435) - - (520,066)
Earnings before interest and tax ("EBIT") 824,856 42,785 29,095 (86,465) 810,271
Net finance costs (b)
(557,649)
Profit before tax 252,622
Income tax expense (124,423)
Profit for the year 128,199
(a)
(b)
The Consolidated Entity operates in one geographical segment, being Australia and the revenue from major products and
services is shown by the reportable segments.
Asset management, which provides commercial, operating services and/or asset maintenance services to the
Consolidated Entity's energy investments and Australian Gas Networks Limited for appropriate fees; and
Energy investments, which includes the Consolidated Entity's strategic stakes in a number of investment entities that
house energy infrastructure assets, generally characterised by long term secure cashflows, with low capital expenditure
requirements.
Energy infrastructure, which includes all wholly or majority owned pipelines, gas storage assets, the Emu Downs Wind
Farm and Diamantina Power Station;
The revenue reported above represents revenue generated from external customers. Any intersegment sales were immaterial.
Excluding finance lease and investment interest income, and any gains or losses on revaluation of derivatives included as part of EBIT for segment
reporting purposes, but including other interest income.
35

APT Pipelines Limited and its Controlled Entities
Notes to the consolidated financial statements (continued)For the financial year ended 30 June 2016
Financial Performance
4. Segment information (continued)
Reportable segments (continued)
Energy Asset Energy
infrastructure management investments Consolidated
2016 $000 $000 $000 $000
Segment assets and liabilities
Segment assets 13,594,788 214,292 10,685 13,819,765
Carrying value of investments using the equity method - - 197,185 197,185
Unallocated assets (a)
808,593
Total assets 14,825,543
Segment liabilities 142,512 63,574 - 206,086
Unallocated liabilities (b) 14,345,353
Total liabilities 14,551,439
(a)
(b)
Energy Asset Energy
infrastructure management investments Other Consolidated
2015 $000 $000 $000 $000 $000
Segment revenue (a)
External sales revenue 984,184 85,056 - - 1,069,240
Equity accounted net profits - - 12,557 - 12,557
Pass-through revenue 13,514 420,868 - - 434,382
Finance lease and investment interest income 2,896 - 5,869 - 8,765
Total segment revenue 1,000,594 505,924 18,426 - 1,524,944
Other interest income 24,255
Consolidated revenue 1,549,199
Unallocated liabilities consist of current and non-current borrowings, deferred tax liabilities, fair value of interest rate swaps, foreign exchange
contracts and inter-company balances.
Unallocated assets consist of cash and cash equivalents, fair value of interest rate swaps, foreign exchange contracts, equity forwards and inter-
company balances.
36

APT Pipelines Limited and its Controlled Entities
Notes to the consolidated financial statements (continued)For the financial year ended 30 June 2016
Financial Performance
4. Segment information (continued)
Reportable segments (continued)
Energy Asset Energy
infrastructure management investments Other Consolidated
2015 $000 $000 $000 $000 $000
Segment result
Earnings before interest, tax, depreciation and
amortisation ("EBITDA") 838,004 39,448 - - 877,452
Share of net profits of joint ventures and associates - - 12,557 - 12,557
Finance lease and investment interest income 2,896 - 5,869 - 8,765
Corporate costs - - - (74,129) (74,129)
Total EBITDA 840,900 39,448 18,426 (74,129) 824,645
Depreciation and amortisation (195,635) (12,565) - - (208,200)
Earnings before interest and tax ("EBIT") 645,265 26,883 18,426 (74,129) 616,445
Net finance costs (b)
(343,391)
Profit before tax 273,054
Income tax benefit (81,944)
Profit for the year 191,110
(a)
(b)
Energy Asset Energy
infrastructure management investments Consolidated
2015 $000 $000 $000 $000
Segment assets and liabilities
Segment assets 13,146,345 239,798 86,138 13,472,281
Carrying value of investments using the equity method - - 257,425 257,425
Unallocated assets (a)
1,034,394
Total assets 14,764,100
Segment liabilities 500,180 71,521 - 571,701
Unallocated liabilities (b)
13,742,567
Total liabilities 14,314,268
(a)
(b)
Information about major customers
Included in revenues arising from energy infrastructure of $1,522.6 million (2015: $984.2 million) are revenues of
approximately $652.0 million (2015: $437.4 million) which arose from sales to the Consolidated Entity's top three customers.
Unallocated assets consist of cash and cash equivalents, current tax assets, fair value of interest rate swaps, foreign exchange contracts and inter-
company balances.
Unallocated liabilities consist of current and non-current borrowings, deferred tax liabilities, fair value of interest rate swaps, foreign exchange
contracts and inter-company balances.
Excluding finance lease and investment interest income, and any gains or losses on revaluation of derivatives included as part of EBIT for segment
reporting purposes, but including other interest income.
The revenue reported above represents revenue generated from external customers. Any intersegment sales were immaterial.
37

APT Pipelines Limited and its Controlled Entities
Notes to the consolidated financial statements (continued)For the financial year ended 30 June 2016
Financial Performance
5. Revenue
An analysis of the Consolidated Entity's revenue for the year is as follows:
2016 2015
$000 $000
Energy infrastructure revenue 1,521,960 983,587
Pass-through revenue 29,586 13,514
Energy infrastructure revenue 1,551,546 997,101
Asset management revenue 96,793 85,056
Pass-through revenue 408,744 420,868
Asset management revenue 505,537 505,924
Operating revenue 2,057,083 1,503,025
Interest 3,616 24,255
Redeemable preference shares (GDI) interest income 8,038 5,869
Finance lease income 1,917 2,896
Finance income 13,571 33,020
Rental income 608 597
Total revenue 2,071,262 1,536,642
Share of net profits of joint ventures and associates using the equity method 16,021 12,557
2,087,283 1,549,199
●
●
●
●
● Finance lease income, which is allocated to accounting periods so as to reflect a constant periodic rate of return on
the Consolidated Entity's net investment outstanding in respect of the leases.
Revenue is recognised to the extent that it is probable that the economic benefits will flow to the Consolidated Entity and
the revenue can be reliably measured. Amounts disclosed as revenue are net of duties and taxes paid. Revenue is
recognised for the major business activities as follows:
Operating revenue, which is earned from the transportation of gas, generation of electricity and other related services
and is recognised when the services are provided net of goods and services tax (“GST”), except where the amount of
GST incurred is not recoverable from the taxation authority;
Pass-through revenue, for which no margin is earned, is recognised when the services are provided and offset by
corresponding pass-through costs;
Interest revenue, which is recognised as it accrues and is determined using the effective interest method;
Dividend revenue, which is recognised when the right to receive the payment has been established; and
38

APT Pipelines Limited and its Controlled Entities
Notes to the consolidated financial statements (continued)For the financial year ended 30 June 2016
Financial Performance
6. Expenses
2016 2015
$000 $000
Depreciation of non-current assets 336,346 182,084
Amortisation of non-current assets 183,720 26,116
Depreciation and amortisation expense 520,066 208,200
Gas pipeline costs 29,586 13,514
Management, operating and maintenance costs 408,744 420,868
Other operating costs - pass-through 438,330 434,382
Interest on bank overdrafts and borrowings (a)
500,588 357,255
Interest on related party loans 49,419 18,635
Amortisation of deferred borrowing costs 9,227 14,978
Finance lease charges - related party 497 529
Other finance costs 5,084 14,641
564,815 406,038
Less: amounts included in the cost of qualifying assets (6,157) (20,002)
558,658 386,036
Gain on derivatives (698) (19,643)
Unwinding of discount on non-current liabilities 3,305 1,255
Finance costs 561,265 367,648
Defined contribution plans 11,402 10,116
Defined benefit plans (Note 16) 2,741 4,146
Post-employment benefits 14,143 14,262
Termination benefits 2,995 2,172
Cash settled security-based payments (b)
27,585 23,629
Other employee benefits 135,334 136,111
Employee benefit expense 180,057 176,174
(a)
(b) The Consolidated Entity provides benefits to certain employees in the form of cash settled security-based payments. For cash settled security-based
payments, a liability equal to the portion of services received is recognised at the current fair value determined at each reporting date.
The average interest rate on funds borrowed is 5.80% p.a. (2015: 7.12% p.a.) including amortisation of borrowing costs and other finance costs.
39

APT Pipelines Limited and its Controlled Entities
Notes to the consolidated financial statements (continued)For the financial year ended 30 June 2016
Financial Performance
7. Income tax
The major components of tax expense are:
2016 2015
$000 $000
Income statement (continuing operations)
Current tax (expense)/benefit in respect of the current year (14,584) 6,537
Adjustments recognised in the current year in relation to current tax of prior years (43) 913
Deferred tax expense relating to the origination and reversal of temporary differences (109,796) (89,394)
Total tax expense (124,423) (81,944)
Tax reconciliation (continuing operations)
Profit before tax 252,622 273,054
Income tax expense calculated at 30% (75,787) (81,916)
Non deductible expenses (62,164) (13,167)
Non assessable income 11,478 10,698
Unfranked dividends from associates 1,731 1,528
(124,742) (82,857)
Previously unbooked losses now recognised 229 -
Adjustment recognised in the current year in relation to the current tax of prior years 90 913
(124,423) (81,944)
Income tax expense comprises of current and deferred tax. Income tax is recognised in profit or loss except to the extent
that it relates to items recognised directly in other comprehensive income, in which case it is recognised in equity. Current
tax represents the expected taxable income at the applicable tax rate for the financial year, and any adjustment to tax
payable in respect of previous financial years.
40

APT Pipelines Limited and its Controlled Entities
Notes to the consolidated financial statements (continued)For the financial year ended 30 June 2016
Financial Performance
7. Income tax (continued)
Deferred tax balances
Deferred tax (liabilities)/assets arise from the following:
Opening Charged to Charged to Acquisitions Transfer to Closing
balance income equity head entity balance
2016 $000 $000 $000 $000 $000 $000
Gross deferred tax liabilities
Intangible assets (2,668) 2,668 - - - -
Property, plant and equipment (586,107) (102,732) - (18,767) - (707,606)
Deferred expenses (51,671) (3,400) - 26 - (55,045)
Other 3,708 (4,438) - - - (730)
(636,738) (107,902) - (18,741) - (763,381)
Gross deferred tax assets
Provisions 45,051 (1,109) - 983 - 44,925
Cash flow hedges 127,473 (712) 38,268 - - 165,029
Deferred revenue 6,795 (984) - - - 5,811
Investments equity accounted 6,904 595 (2,172) - - 5,327
Defined benefit obligation (1,007) (53) 2,444 - - 1,384
Tax losses - 369 - - (369) -
185,217 (1,894) 38,540 983 (369) 222,477
Net deferred tax liability (451,522) (109,796) 38,540 (17,758) (369) (540,905)
2015
Gross deferred tax liabilities
Intangible assets (3,437) 769 - - - (2,668)
Property, plant and equipment (486,632) (99,475) - - - (586,107)
Defined benefit obligation 4,328 171 (5,506) - - (1,007)
Deferred expenses (49,680) (1,991) - - - (51,671)
(535,421) (100,526) (5,506) - - (641,453)
Gross deferred tax assets
Provisions 37,430 7,621 - - - 45,051
Cash flow hedges 52,515 193 74,765 - - 127,473
Deferred revenue 2,500 4,295 - - - 6,795
Investments equity accounted 3,909 2,995 - - - 6,904
Other 39 1,382 2,287 - - 3,708
Tax losses - (5,354) - - 5,354 -
96,393 11,132 77,052 - 5,354 189,931
Net deferred tax liability (439,028) (89,394) 71,546 - 5,354 (451,522)
41

APT Pipelines Limited and its Controlled Entities
Notes to the consolidated financial statements (continued)For the financial year ended 30 June 2016
Financial Performance
7. Income tax (continued)
Deferred tax
Tax consolidation
Nature of tax funding arrangement and tax sharing agreement
ii) initial recognition of assets or liabilities that affect neither accounting nor taxable profit; and
i) initial recognition of goodwill;
Deferred tax is provided using the balance sheet liability method, providing for temporary differences between the
carrying amounts of assets and liabilities for financial reporting purposes and the amounts used for taxation purposes. The
following temporary differences are not provided for:
iii) differences relating to investments in wholly-owned entities to the extent that they will probably not reverse in the
foreseeable future.
The parent of APT Pipelines Limited, Australian Pipeline Trust and its wholly-owned Australian resident entities formed a tax-
consolidated group with effect from 1 July 2003 and are therefore taxed as a single entity from that date. The head entity
within the tax-consolidated group is Australian Pipeline Trust. Members of the tax-consolidated group are identified at Note
26.
Entities within the tax-consolidated group have entered into a tax funding arrangement and a tax sharing agreement with
the head entity. Under the terms of the tax funding arrangement, APT Pipelines Limited and each of the entities in the tax-
consolidated group have agreed to pay a tax equivalent payment to or from the head entity, based on the current tax
liability or current tax asset of the entity. Such amounts are reflected in amounts receivable from, or payable to, other
entities in the tax-consolidated group.
The tax sharing agreement entered into between members of the tax-consolidated group provides for the determination
of the allocation of income tax liabilities between the entities should the head entity default on its tax payment obligations
or if an entity should leave the tax-consolidated group. The effect of the tax sharing agreement is that each member's
liability for the tax payable by the tax-consolidated group is limited to the amount payable to the head entity under the
tax funding arrangement.
Deferred tax is based on the expected manner of realisation or settlement of the carrying amount of assets and liabilities,
using the appropriate tax rates at the end of the reporting period.
A deferred tax asset is recognised only to the extent that it is probable that future taxable profits will be available against
which the asset can be utilised and are reduced to the extent that it is no longer probable that the related tax benefit will
be realised.
Tax expense/income, deferred tax liabilities and deferred tax assets arising from temporary differences of the members of
the tax-consolidated group are recognised in the separate financial reports of the members of the tax-consolidated group
using the 'separate taxpayer within group' approach, by reference to the carrying amounts in the separate financial
reports of each entity and the tax values applying under tax consolidation.
Any current tax liabilities (or assets) and deferred tax assets arising from unused tax losses of the wholly-owned entities are
assumed by the head entity in the tax-consolidated group and are recognised as amounts payable (receivable) to (from)
other entities in the tax-consolidated group in conjunction with any tax funding arrangement amounts.
The head entity recognises deferred tax assets arising from unused tax losses of the tax-consolidated group to the extent
that it is probable that future taxable profits of the tax-consolidated group will be available against which the assets can
be utilised.
42

APT Pipelines Limited and its Controlled Entities
Notes to the consolidated financial statements (continued)For the financial year ended 30 June 2016
Financial Performance
8. Dividends
2016 2016 2015 2015
cents per Total cents per Total
share $000 share $000
Recognised amounts
Final dividend paid on 26 August 2015
(2015: 20 August 2014)
Dividend (a)
3.8 2,357 198.5 123,326
Interim dividend paid on 16 March 2016
(2015: 25 February 2015)
Dividend (a)
289.7 180,000 - -
Unrecognised amounts
Final dividend payable on 24 August 2016
(2015: 26 August 2015)
Dividend (a)
278.5 173,000 3.8 2,357
(a) Profit dividends were unfranked (2015: unfranked).
APT Pipelines Limited
The final dividend in respect of the financial year has not been recognised in this financial report because the final
dividend was not declared, determined or publicly confirmed prior to the end of the financial year.
43

APT Pipelines Limited and its Controlled Entities
Notes to the consolidated financial statements (continued)For the financial year ended 30 June 2016
Operating Assets and Liabilities
9. Receivables
2016 2015
$000 $000
Trade receivables 250,875 223,668
Allowance for doubtful debts (2,658) (4,411)
Trade receivables 248,217 219,257
Receivables from associates and other related parties 13,021 15,630
Finance lease receivables (Note 17) 2,290 4,005
Interest receivable 85 686
Other debtors 187 15,222
Trade and other receivables 263,800 254,800
Receivables from related parties 139,625 135,942
Current 403,425 390,742
Finance lease receivables (Note 17) 17,283 18,968
Loan receivable - related party - 73,502
Non-current 17,283 92,470
Trade receivables are non-interest bearing and are generally on 30 day terms.
There are no material trade receivables past due and not provided for.
10. Payables
Trade payables (a) 27,310 29,754
Other payables (b) 211,218 368,546
Trade and other payables 238,528 398,300
Payables to related parties (c) 2,613,186 2,907,055
Current 2,851,714 3,305,355
Trade and other payables 3,007 3,261
Payables to related parties 895,102 876,911
Non-current 898,109 880,172
(a) Trade payables are non-interest bearing and are normally settled on 15 - 30 day terms.
(b)
(c)
Trade receivables, loans, and other receivables that have fixed or determinable payments that are not quoted in an
active market are classified as loans and receivables. Trade and other receivables are initially recognised at fair value
plus any directly attributable transaction costs. Subsequent to initial recognition, they are stated at amortised cost less
impairment.
Trade and other payables are recognised when the Consolidated Entity becomes obliged to make future payments
resulting from the purchase of goods and services. Trade and other payables are initially recognised at fair value plus
any directly attributable transaction costs. Subsequent to initial recognition, they are stated at amortised cost.
The net amount of GST recoverable from, or payable to, the taxation authority is included as part of receivables or
payables. GST receivable or GST payable is only recognised once a tax invoice has been issued or received.
Other payables at 30 June 2015 include $137.2 million of stamp duty on the acquisition of Wallumbilla Gladstone Pipeline (formerly QCLNG
Pipeline), other expenditure accruals and external interest payable accruals.
Payables to related parties mainly consists of the loan from APT.
Payables are recognised inclusive of GST, except for accrued revenue and accrued expense at balance dates which
exclude GST.
44

APT Pipelines Limited and its Controlled Entities
Notes to the consolidated financial statements (continued)For the financial year ended 30 June 2016
Operating Assets and Liabilities
11. Property, plant and equipment
Freehold land Leasehold Plant and Work in
and buildings improvements equipment progress
- at cost - at cost - at cost - at cost Total
$000 $000 $000 $000 $000
Gross carrying amount
Balance at 1 July 2014 139,434 5,015 5,766,626 478,861 6,389,937
Additions 78,679 - 2,501,924 386,406 2,967,009
Disposals (165) (571) (17,367) (52) (18,155)
Transfers 11,103 - 686,038 (697,141) -
Balance at 30 June 2015 229,051 4,444 8,937,221 168,074 9,338,791
Additions - - 22,105 282,842 304,947
Acquisitions through business
combinations (note 25) 740 - 713,101 11,250 725,091
Disposals (651) (285) (15,323) - (16,259)
Transfers 3,204 913 262,989 (267,106) -
Balance at 30 June 2016 232,344 5,072 9,920,093 195,060 10,352,570
Accumulated depreciationBalance at 1 July 2014 (21,854) (2,288) (791,313) - (815,455)
Disposals 75 571 13,296 - 13,942
Depreciation expense (3,257) (486) (178,341) - (182,084)
Balance at 30 June 2015 (25,036) (2,203) (956,358) - (983,598)
Disposals 434 285 14,707 - 15,426
Depreciation expense (7,274) (358) (328,714) - (336,346)
Transfers (89) (4) 93 - -
Balance at 30 June 2016 (31,965) (2,280) (1,270,272) - (1,304,518)
Net book value
As at 30 June 2015 204,014 2,241 7,980,863 168,074 8,355,193
As at 30 June 2016 200,378 2,792 8,649,821 195,060 9,048,052
All other borrowing costs are recognised in profit or loss in the period in which they are incurred.
Critical accounting judgements and key sources of estimation uncertainty - useful lives of non-current assets
The following estimated useful lives are used in the calculation of depreciation:
● buildings 30 - 50 years;
● compressors 10 - 50 years;
● gas transportation systems 10 - 80 years;
● meters 20 - 30 years; and
● other plant and equipment 3 - 20 years.
Property, plant and equipment is stated at cost, less accumulated depreciation and impairment losses. Work in progress
is stated at cost. Cost includes expenditure that is directly attributable to the acquisition or construction of the item.
Depreciation is provided on property, plant and equipment excluding land. Depreciation is calculated on either a
straight-line or throughput basis depending on the nature of the asset so as to write off the net cost of each asset over its
estimated useful life.
Leasehold improvements are depreciated over the period of the lease or estimated useful life, whichever is the shorter,
using the straight-line method. The estimated useful lives and depreciation methods are reviewed at the end of each
reporting period, with the effect of any changes recognised on a prospective basis.
The Consolidated Entity reviews the estimated useful lives of property, plant and equipment at the end of each annual
reporting period. Any reassessment of useful lives in a particular year will affect the depreciation expense.
Borrowing costs directly attributable to the acquisition, construction or production of qualifying assets (i.e. assets that take
a substantial period of time to get ready for their intended use or sale) are added to the cost of those assets until such
time as the assets are substantially ready for their intended use or sale.
45

APT Pipelines Limited and its Controlled Entities
Notes to the consolidated financial statements (continued)For the financial year ended 30 June 2016
Operating Assets and Liabilities
12. Goodwill and Intangibles
2016 2015
$000 $000
Goodwill
Balance at beginning of financial year 1,140,500 1,150,500
Acquisitions (note 25) 44,088 -
Goodwill impairment - (10,000)
Balance at end of financial year 1,184,588 1,140,500
Allocation of goodwill to cash-generating units
Goodwill has been allocated for impairment testing purposes to individual cash-generating units.
Asset management business 21,456 21,456
Energy infrastructure
East Coast Grid 1,060,681 1,060,681
Diamantina Power Station 44,088 -
Other energy infrastructure (a)
58,363 58,363
1,184,588 1,140,500
(a) Primarily represents goodwill relating to the Pilbara Pipeline System ($32.6 million) and Goldfields Gas Pipeline ($18.5 million).
Contract and other intangibles
Gross carrying amount
Balance at beginning of financial year 3,623,011 209,286
Acquisitions / additions 705 3,414,122
Disposals - (397)
Balance at end of financial year 3,623,716 3,623,011
Accumulated amortisation and impairment
Balance at beginning of financial year (66,765) (38,482)
Amortisation expense (183,720) (26,116)
Impairment (8,897) (2,564)
Disposals - 397
Balance at end of financial year (259,382) (66,765)
Net book value 3,364,334 3,556,246
The East Coast Grid is an interconnected pipeline network that includes, inter alia, the Wallumbilla Gladstone, Moomba
Sydney, Roma Brisbane, Carpentaria Gas and South West Queensland pipelines and the Victorian Transmission System.
Since the acquisition of the South West Queensland Pipeline to complete the formation of APA’s East Coast Grid in
December 2012, APA has installed facilities to enable bi-directional transportation of gas to meet the demand of our
major customers who now operate portfolios of gas supply and demand. Through the provision of multi-asset services, bi-
directional transportation, capacity trading and gas storage and parking facilities, APA’s East Coast Grid delivers options
for customers to choose from, and move gas between, more than 40 receipt points and over 100 delivery points on the
east coast of Australia. During the year, to reflect this change in business, APA Group reassessed its cash-generating units
and determined that the East Coast Grid is henceforth an individual cash-generating unit.
The carrying amount of goodwill allocated to cash-generating units that are significant individually or in aggregate is as
follows:
Goodwill acquired in a business combination is initially measured at cost and subsequently at cost less accumulated
impairment.
46

APT Pipelines Limited and its Controlled Entities
Notes to the consolidated financial statements (continued)For the financial year ended 30 June 2016
Operating Assets and Liabilities
12. Goodwill and Intangibles (continued)
13. Impairment of non-financial assets
Critical accounting judgements and key sources of estimation uncertainty - impairment of assets
The Consolidated Entity holds various third party operating and maintenance contracts. The combined gross carrying
amount of $3,623.7 million amortises over terms ranging from one to 20 years. Useful life is determined based on the
underlying contractual terms plus estimations of renewal of up to two terms where considered probable by
management. Amortisation expense is not a cash item, and is included in the line item of depreciation and amortisation
expense in the statement of profit or loss and other comprehensive income.
Asset Management cash flow projections reflect long term agreements with assumptions of renewal on similar terms and
conditions based on management's expectations.
Cash flow projections are estimated for a period of up to 20 years, with a terminal value, recognising the long term nature
of the assets. The pre-tax discount rates used are 8.25% p.a. (2015: 8.25% p.a.) for Energy Infrastructure assets and 8.25%
p.a. (2015: 8.25% p.a.) for Asset Management.
These assumptions have been determined with reference to historic information, current performance and expected
changes taking into account external information.
The recoverable amounts of cash-generating units are determined based on value-in-use calculations. These calculations
use cash flow projections based on a five year financial business plan and thereafter a further 15 year financial model.
This is the basis of the Consolidated Entity's forecasting and planning processes which represents the underlying long term
nature of associated customer contracts on these assets.
For fully regulated assets, cash flows have been extrapolated on the basis of existing transportation contracts and
government policy settings, and expected contract renewals with a resulting average annual growth rate of 1.7% p.a.
These expected cash flows are factored into the regulated asset base and do not exceed management's expectations
of the long-term average growth rate for the market in which the cash-generating unit operates.
For non-regulated assets, the Consolidated Entity has assumed no capacity expansion beyond installed and committed
levels; utilisation of capacity is based on existing contracts, government policy settings and expected market outcomes.
The Consolidated Entity tests property, plant and equipment, intangibles and goodwill for impairment at least annually or
whenever there is an indication that the asset may be impaired. Assets other than goodwill that have previously reported
an impairment are reviewed for possible reversal of the impairment at each reporting period.
If the asset does not generate independent cash inflows and its value in use cannot be estimated to be close to its fair
value, the asset is tested for impairment as part of the cash-generating unit (CGU) to which it belongs.
Assets are impaired if their carrying value exceeds their recoverable amount. The recoverable amount of an asset or
CGU is determined as the higher of its fair value less costs of disposal or value-in-use.
Determining whether identifiable intangible assets and goodwill are impaired requires an estimation of the value-in-use or
fair value of the cash-generating units. The calculations require the Consolidated Entity to estimate the future cash flows
expected to arise from cash-generating units and suitable discount rates in order to calculate the present value of cash-
generating units. These estimates and assumptions are reviewed on an ongoing basis.
Intangible assets acquired separately are carried at cost less accumulated amortisation and accumulated impairment
losses. Intangible assets acquired in a business combination are identified and recognised separately from goodwill and
are initially recognised at their fair value at the acquisition date and subsequently at cost less accumulated amortisation
and accumulated impairment losses.
Amortisation is recognised on a straight-line basis over their estimated useful lives. The estimated useful life and
amortisation method are reviewed at the end of each annual reporting period, with the effects of any changes in
estimate being accounted for on a prospective basis.
In accordance with the requirements of AASB 136 Impairment of Assets, the Consolidated Entity reviewed its CGUs for
indicators of impairment at the end of the reporting period. No such indicators were identified and no impairment
recognised.
As contracts mature, given ongoing demand for capacity, it is assumed that the majority of the capacity is resold on
similar pricing.
47

APT Pipelines Limited and its Controlled Entities
Notes to the consolidated financial statements (continued)For the financial year ended 30 June 2016
Operating Assets and Liabilities
14. Provisions
2016 2015
$000 $000
Employee benefits 83,240 76,953
Other 8,432 8,499
Current 91,672 85,452
Employee benefits 36,903 30,484
Other 33,088 29,926
Non-current 69,991 60,410
Employee benefits
Incentives 28,401 25,556
Cash settled security-based payments 9,477 10,009
Leave balances 39,587 39,608
Termination benefits 5,775 1,780
Current 83,240 76,953
Cash settled security-based payments 19,467 17,215
Retirement benefit liability (Note 16) 7,017 4,425
Leave balances 10,419 8,844
Non-current 36,903 30,484
15. Other non-current assets
Line pack gas 20,208 20,200
Gas held in storage 6,010 5,085
Defined benefit asset (Note 16) 2,404 7,784
28,622 33,069
When some or all of the economic benefits required to settle a provision are expected to be recovered from a third party,
the receivable is recognised as an asset if it is probable that recovery will be received and the amount of the receivable
can be measured reliably.
A provision is recognised when there is a legal or constructive obligation as a result of a past event, it is probable that
future economic benefits will be required to settle the obligation and the amount of the provision can be measured
reliably.
The amount recognised as a provision is the best estimate of the consideration required to settle the present obligation at
the end of the financial year, taking into account the risks and uncertainties surrounding the obligation. Where a
provision is measured using the cash flows estimated to settle the present obligation, its carrying amount is the present
value of those cash flows.
Provision is made for benefits accruing to employees in respect of wages and salaries, incentives, annual leave, long
service leave and sick leave when it is probable that settlement will be required and they are capable of being
measured reliably. Provisions made in respect of employee benefits expected to be settled within 12 months are
measured at their nominal values using the remuneration rates expected to apply at the time of settlement. Provisions
made in respect of employee benefits which are not expected to be wholly settled within 12 months are measured as
the present value of the estimated future cash outflows to be made by the Consolidated Entity in respect of services
provided by employees up to reporting date.
48

APT Pipelines Limited and its Controlled Entities
Notes to the consolidated financial statements (continued)For the financial year ended 30 June 2016
Operating Assets and Liabilities
16. Employee superannuation plans
The following sets out details in respect of the defined benefit plans only:
2016 2015
$000 $000
Amounts recognised in the statement of profit or loss and other comprehensive income
Current service cost 2,783 3,730
Net interest expense (42) 416
Components of defined benefit costs recognised in profit or loss (Note 6) 2,741 4,146
Amounts recognised in the statement of financial position
Fair value of plan assets 138,488 140,500
Present value of benefit obligation (143,101) (137,141)
Defined benefit asset - non-current (Note 15) 2,404 7,784
Defined benefit liability - non-current (Note 14) (7,017) (4,425)
Opening defined benefit obligation 137,141 144,621
Current service cost 2,783 3,730
Interest cost 5,807 4,909
Contributions from plan participants 1,332 1,388
Actuarial gains and losses arising from changes in financial assumptions 625 (9,747)
Actuarial gains and losses arising from experience adjustments 3,268 (1,181)
Benefits paid (7,855) (6,579)
Closing defined benefit obligation 143,101 137,141
Movements in the present value of the plan assets in the current period were as follows:
Opening fair value of plan assets 140,500 130,195
Interest income 5,849 4,493
Actual return on plan assets excluding interest income (4,255) 7,426
Contributions from employer 2,917 3,577
Contributions from plan participants 1,332 1,388
Benefits paid (7,855) (6,579)
Closing fair value of plan assets 138,488 140,500
All employees of the Consolidated Entity are entitled to benefits on retirement, disability or death from an industry
sponsored fund, or an alternative fund of their choice. The Consolidated Entity has three plans with defined benefit
sections (due to the acquisition of businesses) and a number of other plans with defined contribution sections. The
defined benefit sections provide lump sum benefits upon retirement based on years of service. The defined contribution
sections receive fixed contributions from the Consolidated Entity and the Consolidated Entity's legal and constructive
obligations are limited to these amounts.
The most recent actuarial valuations of plan assets and the present value of the defined benefit obligations were
determined at 30 June 2016. The present value of the defined benefit obligations, and the related current service cost
and past service cost, were measured using the projected unit credit method.
49

APT Pipelines Limited and its Controlled Entities
Notes to the consolidated financial statements (continued)For the financial year ended 30 June 2016
Operating Assets and Liabilities
16. Employee superannuation plans (continued)
Defined contribution plans
Contributions to defined contribution plans are expensed when incurred.
Defined benefit plans
Past service cost is recognised in profit or loss in the period of a plan amendment.
-
-
Furthermore, in presenting the above sensitivity analysis, the present value of the defined benefit obligation has been
calculated using the projected unit credit method at the end of the reporting period, which is the same as that applied in
calculating the defined benefit obligation liability recognised in the statement of financial position.
If the expected salary growth increases (decreases) by 0.5%, the defined benefit obligation would increase by
$6,136,000 (decrease by $5,525,000).
The defined benefit obligation recognised in the consolidated statement of financial position represents the actual deficit
or surplus in the Consolidated Entity's defined benefit plans. Any asset resulting from this calculation is limited to the
present value of economic benefits available in the form of refunds and reductions in future contributions to the plan.
Actuarial gains and losses and the return on plan assets (excluding interest) are recognised immediately in the statement
of financial position with a charge or credit recognised in other comprehensive income in the period in which they occur.
Remeasurement, comprising of actuarial gains and losses and the return on plan assets (excluding interest), is recognised
in other comprehensive income and immediately reflected in retained earnings and will not be reclassified to profit or
loss.
If the discount rate is 50 basis points higher (lower), the defined benefit obligation would decrease by $5,680,000
(increase by $6,373,000); and
Key actuarial assumptions used in the determination of the defined benefit obligation is a discount rate of 3.3%, based on
the corporate bond yield curve published by Milliman, and an expected salary increase rate of 3.0%. The sensitivity
analysis below has been determined based on reasonable possible changes of the respective assumptions occurring at
the end of the reporting period, while holding all other assumptions constant:
The sensitivity analysis presented above may not be representative of the actual change in the defined benefit obligation
as it is unlikely that the change in assumptions would occur in isolation of one another as some of the assumptions may be
correlated.
The Consolidated Entity expects $3.0 million in contributions to be paid to the defined benefit plans during the year
ending 30 June 2017.
50

APT Pipelines Limited and its Controlled Entities
Notes to the consolidated financial statements (continued)For the financial year ended 30 June 2016
Operating Assets and Liabilities
17. Leases
2016 2015
$000 $000
Finance lease receivables
Not longer than 1 year 3,933 5,317
Longer than 1 year and not longer than 5 years 10,646 12,347
Longer than 5 years 16,951 19,183
Minimum future lease payments receivable (a) (b)
31,530 36,847
Gross finance lease receivables 31,530 36,847
Less: unearned finance lease receivables (11,957) (13,874)
Present value of lease receivables 19,573 22,973
Included in the financial statements as part of:
Current trade and other receivables (Note 9) 2,290 4,005
Non-current receivables (Note 9) 17,283 18,968
19,573 22,973
(a) Minimum future lease payments receivable include the aggregate of all lease payments receivable and any guaranteed residual.
(b) X41 power station expansion was disposed of during the 2015 financial year.
Finance lease payables - related party
Not longer than 1 year 1,167 1,167
Longer than 1 year and not longer than 5 years 4,669 4,669
Longer than 5 years 7,004 8,171
Minimum future lease payments payable(a) 12,840 14,007
Gross finance lease payables 12,840 14,007
Less: unearned finance lease payables (2,889) (3,386)
Present value of lease payables 9,951 10,621
Included in the financial statements as part of:
Current borrowings (Note 19) 703 670
Non-current borrowings (Note 19) 9,248 9,951
9,951 10,621
(a)
Finance lease receivables relate to the lease of a metering station, natural gas vehicle refuelling facilities and two
pipeline laterals.
Minimum future lease payments payable include the aggregate of all lease payments payable and any guaranteed residual.
Leases are classified as finance leases when the terms of the lease transfer substantially all the risks and rewards
incidental to the ownership of the leased asset to the lessee. All other leases are classified as operating leases.
51
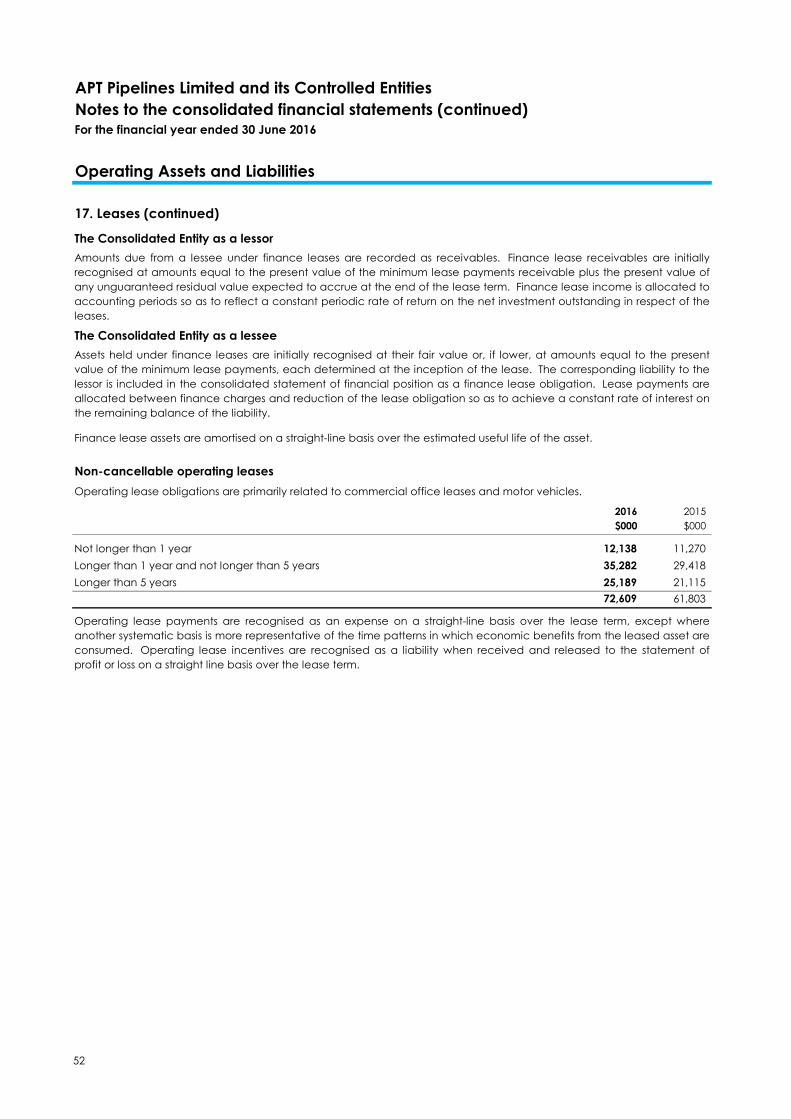
APT Pipelines Limited and its Controlled Entities
Notes to the consolidated financial statements (continued)For the financial year ended 30 June 2016
Operating Assets and Liabilities
17. Leases (continued)
The Consolidated Entity as a lessor
The Consolidated Entity as a lessee
Finance lease assets are amortised on a straight-line basis over the estimated useful life of the asset.
Non-cancellable operating leases
Operating lease obligations are primarily related to commercial office leases and motor vehicles.
2016 2015
$000 $000
Not longer than 1 year 12,138 11,270
Longer than 1 year and not longer than 5 years 35,282 29,418
Longer than 5 years 25,189 21,115
72,609 61,803
Operating lease payments are recognised as an expense on a straight-line basis over the lease term, except where
another systematic basis is more representative of the time patterns in which economic benefits from the leased asset are
consumed. Operating lease incentives are recognised as a liability when received and released to the statement of
profit or loss on a straight line basis over the lease term.
Amounts due from a lessee under finance leases are recorded as receivables. Finance lease receivables are initially
recognised at amounts equal to the present value of the minimum lease payments receivable plus the present value of
any unguaranteed residual value expected to accrue at the end of the lease term. Finance lease income is allocated to
accounting periods so as to reflect a constant periodic rate of return on the net investment outstanding in respect of the
leases.
Assets held under finance leases are initially recognised at their fair value or, if lower, at amounts equal to the present
value of the minimum lease payments, each determined at the inception of the lease. The corresponding liability to the
lessor is included in the consolidated statement of financial position as a finance lease obligation. Lease payments are
allocated between finance charges and reduction of the lease obligation so as to achieve a constant rate of interest on
the remaining balance of the liability.
52

APT Pipelines Limited and its Controlled Entities
Notes to the consolidated financial statements (continued)For the financial year ended 30 June 2016
Capital Management
18. Cash and cash equivalents
2016 2015
$000 $000
Cash at bank and on hand 76,820 190,752
Short-term deposits 1,117 221,087
77,937 411,839
The Consolidated Entity had no restricted cash as at 30 June 2016 and 30 June 2015.
The Consolidated Entity's objectives when managing capital are to safeguard its ability to continue as a going concern
while maximising the return to equityholders through the optimisation of the debt to equity structure.
The Consolidated Entity's overall capital management strategy is to continue to target strong BBB/Baa2 investment grade
ratings through maintaining sufficient flexibility to fund organic growth and investment from internally generated and
retained cash flows, equity and, where appropriate, additional debt funding.
The capital structure of the Consolidated Entity consists of cash and cash equivalents, borrowings and equity attributable
to equityholders of the parent. The Consolidated Entity's policy is to maintain balanced and diverse funding sources
through borrowing locally and from overseas, using a variety of capital markets and bank loan facilities, to meet
anticipated funding requirements.
Controlled entities are subject to externally imposed capital requirements. These relate to the Australian Financial Services
Licence held by Australian Pipeline Limited, the Responsible Entity of the APA Group and were adhered to for the entirety
of the 2016 and 2015 periods.
The Consolidated Entity's Board of Directors reviews the capital structure on a regular basis. As part of the review, the
Board considers the cost of capital and the state of the markets. The Consolidated Entity targets gearing in a range of
65% to 68%. Gearing is determined as the proportion of net debt to net debt plus equity. Based on recommendations of
the Board, the Consolidated Entity balances its overall capital structure through equity issuances, new debt or the
redemption of existing debt and through a disciplined distribution payment policy.
Cash and cash equivalents comprise of cash on hand, at call bank deposits and investments in money market
instruments that are readily convertible to known amounts for cash. Cash and cash equivalents at the end of the financial
year as shown in the statement of cash flows are reconciled to the related items in the statement of financial position as
follows:
Operating cash flows are used to maintain and expand the Consolidated Entity's assets, make distributions to
equityholders and to repay maturing debt.
The Consolidated Entity's capital risk management strategy remains unchanged from the previous period.
53

APT Pipelines Limited and its Controlled Entities
Notes to the consolidated financial statements (continued)For the financial year ended 30 June 2016
Capital Management
19. Borrowings
2016 2015
$000 $000
Unsecured - at amortised cost
Guaranteed senior notes (a)
398,058 158,134
Other financial liabilities 11,771 6,219
Finance lease liabilities (Note 17) 703 670
Current 410,532 165,023
Guaranteed senior notes (a) 8,043,377 8,481,768
Bank borrowings (b) 707,501 125,000
Subordinated notes (c) 515,000 515,000
Other financial liabilities 95,155 70,630
Less: unamortised borrowing costs (46,660) (50,901)
Finance lease liabilities (Note 17) 9,248 9,951
Non-current 9,323,621 9,151,448
Financing facilities available
Total facilities
Guaranteed senior notes (a)
8,441,435 8,639,902
Bank borrowings (b)
1,380,000 1,300,000
Subordinated notes (c)
515,000 515,000
10,336,435 10,454,902
Facilities used at balance date
Guaranteed senior notes (a)
8,441,435 8,639,902
Bank borrowings (b)
707,501 125,000
Subordinated notes (c)
515,000 515,000
9,663,936 9,279,902
Facilities unused at balance date
Guaranteed senior notes (a) - -
Bank borrowings (b) 672,499 1,175,000
Subordinated notes (c) - -
672,499 1,175,000
(a)
(b)
(c)
Borrowings are recorded initially at fair value, net of transaction costs. Subsequent to initial recognition, borrowings are
measured at amortised cost with any difference between the initial recognised amount and the redemption value being
recognised in the statement of profit or loss and other comprehensive income over the period of the borrowing using the
effective interest method.
Represents USD denominated private placement notes of US$725 million, CAD medium term notes (MTN) of C$300 million, JPY MTN of ¥10,000
million, GBP MTNs of £950 million, EUR MTN of €1,350 million and USD denominated 144A notes of US$2,150 million measured at the exchange rate at
reporting date, and A$315 million of AUD denominated Private Placement Notes and AUD Medium Term Notes (MTN) of A$300 million. Refer to Note
20 for details of interest rates and maturity profiles. Relates to the non-current portion of long-term borrowings. Refer to Note 20 for interest rates and maturity profiles.
Represents AUD denominated subordinated notes. Refer to Note 20 for details of interest rates and maturity profiles.
54

APT Pipelines Limited and its Controlled Entities
Notes to the consolidated financial statements (continued)For the financial year ended 30 June 2016
Capital Management
20. Financial risk management
(a) Market risk including currency risk, interest rate risk and price risk;
(b) Credit risk; and
(c) Liquidity risk.
(a) Market risk
●
●
●
● interest rate swaps to mitigate the risk of rising interest rates.
Foreign currency risk
foreign currency denominated borrowings to manage the currency risk associated with foreign currency denominated
revenue and receivables; and
The Treasury department within Finance is responsible for the overall management of the Consolidated Entity’s capital
raising activities, liquidity, lender relationships and engagement, debt portfolio management, interest rate and foreign
exchange hedging, credit rating maintenance and third party indemnities (bank guarantees) within risk management
parameters reviewed by the Board. The Audit and Risk Management Committee approves written principles for overall
risk management, as well as policies covering specific areas such as liquidity and funding risk, foreign currency risk, interest
rate risk, credit risk, contract and legal risk and operational risk. The Consolidated Entity's Board of Directors ensures there is
an appropriate Risk Management Policy for the management of treasury risk and compliance with the policy through
monthly reporting from the Treasury department.
The Consolidated Entity's activities generate financial instruments comprising of cash, receivables, payables and interest
bearing liabilities which expose it to various risks as summarised below:
Treasury as a centralised function provides the Consolidated Entity with the benefits of efficient cash utilisation, control of
funding and its associated costs, efficient and effective management of aggregated financial risk and concentration of
financial expertise, at an acceptable cost, and manages risks through the use of natural hedges and derivative
instruments. The Consolidated Entity does not engage in speculative trading. All derivatives have been traded to hedge
underlying or existing exposures and have adhered to the Board approved Treasury Risk Management Policy.
The Consolidated Entity's market risk exposure is primarily due to changes in market prices such as interest and foreign
exchange rates. The Consolidated Entity enters into a variety of financial instruments to manage its exposure to interest
rate and foreign currency risk, including:
forward exchange contracts to hedge the exchange rate risk arising from foreign currency cash flows, mainly US
dollars, derived from revenues, interest payments and capital equipment purchases;
cross currency interest rate swaps to manage the currency risk associated with foreign currency denominated
borrowings;
The Consolidated Entity's foreign exchange risk arises from future commercial transactions (including revenue, interest
payments and principal debt repayments on long-term borrowings and the purchases of capital equipment), and the
recognition of assets and liabilities (including foreign receivables and borrowings). Exchange rate exposures are
managed within approved policy parameters utilising forward exchange contracts, cross currency swap contracts and
foreign currency denominated borrowings. All foreign currency exposure was managed in accordance with the Treasury
Risk Management Policy in both 2016 and 2015.
55

APT Pipelines Limited and its Controlled Entities
Notes to the consolidated financial statements (continued)For the financial year ended 30 June 2016
Capital Management
20. Financial risk management (continued)
(a) Market risk (continued)
Foreign currency risk (continued)
Cross Foreign Net foreign
Cash & cash Total currency exchange currency
equivalents Receivables borrowings swaps contract position
$000 $000 $000 $000 $000 $000
US dollar (a)
1,068 30,691 (3,694,558) (1,277,253) 703,317 (4,236,735)
Japanese yen - - (129,964) 129,964 - -
Canadian dollar - - (310,555) 310,555 - -
British pound - - (1,688,747) 1,688,747 - -
Euro - - (2,008,378) 2,008,378 (1,392) (1,392)
Swedish Krona - - - - (29,606) (29,606)
1,068 30,691 (7,832,202) 2,860,391 672,319 (4,267,733)
US dollar (a)
1,723 38,639 (3,726,507) (1,075,496) 2,216 (4,759,425)
Japanese yen - - (106,005) 106,005 - -
Canadian dollar - - (311,394) 311,394 - -
British pound - - (1,937,372) 1,937,372 - -
Euro - - (1,950,107) 1,950,107 - -
1,723 38,639 (8,031,385) 3,229,382 2,216 (4,759,425)
(a)
Forward foreign exchange contracts
To manage foreign exchange risk arising from future commercial transactions such as forecast capital purchases, revenue
and interest payments, the Consolidated Entity uses forward foreign exchange contracts. Gains and losses recognised in
the cash flow hedge reserve (statement of comprehensive income) on these derivatives will be released to profit or loss
when the underlying anticipated transaction affects the statement of profit or loss or will be included in the carrying value
of the asset or liability acquired.
It is the policy of the Consolidated Entity to hedge 100% of all foreign exchange capital purchases in excess of US$1 million
that are certain. Forecast foreign currency denominated revenues and interest payments will be hedged by forward
exchange contracts on a rolling basis for a minimum of one year with the objective being to lock in the AUD gross cash
flows and manage liquidity.
Net US$ foreign currency position of $4,236.1 million is predominantly hedging part of the committed US$ revenue arising from the Wallumbilla
Gladstone Pipeline (2015: $4,759.4 million).
2015
The carrying amount of the Consolidated Entity's foreign currency denominated monetary assets, monetary liabilities and
derivative notional amounts at the reporting date is as follows:
2016
56

APT Pipelines Limited and its Controlled Entities
Notes to the consolidated financial statements (continued)For the financial year ended 30 June 2016
Capital Management
20. Financial risk management (continued)
(a) Market risk (continued)
Foreign currency risk (continued)
Forward foreign exchange contracts (continued)
The following table details the forward foreign exchange currency contracts outstanding at reporting date:
Cash flow hedges Average Foreign
exchange rate currency < 1 year 1 - 2 years 2 - 5 years Fair value
$ US$000 $000 $000 $000 $000
Pay USD / receive AUD
0.7666 (507,689) 292,569 265,907 146,605 12,849
Pay AUD / receive USD
Forecast capital purchases 0.7666 1,353 (995) (313) (457) 71
(506,336) 291,574 265,594 146,148 12,920
Cash flow hedges Average Foreign
exchange rate currency < 1 year 1 - 2 years 2 - 5 years Fair value
$ EUR$000 $000 $000 $000 $000
Pay AUD / receive EUR
Forecast capital purchases 0.6703 933 (334) (910) (148) 48
933 (334) (910) (148) 48
Cash flow hedges Average Foreign
exchange rate currency < 1 year 1 - 2 years 2 - 5 years Fair value
$ SEK$000 $000 $000 $000 $000
Pay AUD / receive SEK
Forecast capital purchases 6.0727 179,795 (16,309) (8,009) (5,289) (164)
179,795 (16,309) (8,009) (5,289) (164)
Cash flow hedges Average Foreign
exchange rate currency < 1 year 1 - 2 years 2 - 5 years Fair value
$ US$000 $000 $000 $000 $000
Pay USD / receive AUD
0.7574 (193,837) 255,913 - - 1,845
Pay AUD / receive USD
Forecast capital purchases 0.9011 1,969 (2,185) - - 371
(191,868) 253,728 - - 2,216
2016
Contract Value
Forecast revenue and associated
receivable
2015
Forecast revenue and associated
receivable
Contract Value
Contract Value
Contract Value
2016
2016
As at reporting date, the Consolidated Entity has entered into forward contracts to hedge US exchange rate risk arising
from anticipated future transactions with an aggregate notional principal amount of $705.1 million (2015: $253.7 million)
which are designated in cash flow hedge relationships. The hedged anticipated transactions denominated in US dollars
are expected to occur at various dates between one month to three years from reporting date.
57

APT Pipelines Limited and its Controlled Entities
Notes to the consolidated financial statements (continued)For the financial year ended 30 June 2016
Capital Management
20. Financial risk management (continued)
(a) Market risk (continued)
Foreign currency risk (continued)
Cross currency swap contracts
Cash flow hedges Exchange Less than More than
Foreign rate 1 year 1 - 2 years 2 - 5 years 5 years
currency $ $000 $000 $000 $000
Pay AUD / receive foreign currency
2003 USPP Notes AUD/USD 0.6573 - - (95,847) -
2007 USPP Notes AUD/USD 0.8068 (190,878) - (151,215) (153,694)
2009 USPP Notes AUD/USD 0.7576 (85,787) - (98,997) -
2012 JPY Medium Term Notes AUD/JPY 79.4502 - (125,865) - -
2012 CAD Medium Term Notes AUD/CAD 1.0363 - - (289,494) -
2012 US114A AUD/USD 1.0198 - - - (735,438)
2012 GBP Medium Term Notes AUD/GBP 0.6530 - - - (535,988)
Pay USD / receive foreign currency
2015 EUR Medium Term Notes USD/EUR 0.9514 - - - (1,904,107)
2015 GBP Medium Term Notes USD/GBP 0.6773 - - - (1,188,888)
(276,665) (125,865) (635,553) (4,518,115)
Cash flow hedges Exchange Less than More than
Foreign rate 1 year 1 - 2 years 2 - 5 years 5 years
currency $ $000 $000 $000 $000
Pay AUD / receive foreign currency
2003 USPP Notes USD 0.6573 (185,608) - (95,847) -
2007 USPP Notes USD 0.8068 - (190,878) (151,215) (153,694)
2009 USPP Notes USD 0.7576 - (85,787) (98,997) -
2012 JPY Medium Term Notes JPY 79.4502 - - (125,865) -
2012 CAD Medium Term Notes CAD 1.0363 - - (289,494) -
2012 US144A USD 1.0198 - - - (735,438)
2012 GBP Medium Term Notes GBP 0.6530 - - - (535,988)
Pay USD / receive foreign currency
2015 EUR Medium Term Notes USD/EUR 0.9514 - - - (1,839,073)
2015 GBP Medium Term Notes USD/GBP 0.6773 - - - (1,148,283)
(185,608) (276,665) (761,418) (4,412,476)
Foreign currency denominated borrowings
The Consolidated Entity maintains a level of borrowings in foreign currency, or swapped from one foreign currency to
another to match payments of interest and principal against expected future business cash flows in that foreign currency.
This mitigates the risk of adverse movements in foreign exchange rates in relation to principal and interest payments
arising from these foreign currency borrowings as well as future revenues.
2015
The following table details the cross currency swap contract principal payments due as at the reporting date:
2016
The Consolidated Entity enters into cross currency swap contracts to mitigate the risk of adverse movements in foreign
exchange rates in relation to principal and interest payments arising from foreign currency borrowings. The Consolidated
Entity receives fixed amounts in the various foreign currencies and pays both variable interest rates (based on Australian
BBSW) and fixed interest rates based on agreed swap rates for the full term of the underlying borrowings. In certain
circumstances borrowings are left in the foreign currency, or hedged from one foreign currency to another to match
payments of interest and principal against expected future business cash flows in that foreign currency.
58

APT Pipelines Limited and its Controlled Entities
Notes to the consolidated financial statements (continued)For the financial year ended 30 June 2016
Capital Management
20. Financial risk management (continued)
(a) Market risk (continued)
Foreign currency risk (continued)
Foreign currency sensitivity analysis
●
●
Interest rate risk
Cross currency swap and interest rate swap contracts
There would be no impact on net profit as all foreign currency exposures are fully hedged (2015: nil); and
Equity reserves would decrease by $1,410.2 million with a 20 percent depreciation of the A$ or increase by $940.5
million with a 20 percent increase in foreign exchange rates (2015: decrease by $1,268.4 million or increase by $845.1
million respectively). The increase in sensitivity is due to the increase in the notional value of forward exchange
contracts that are in a hedging relationship with highly probable forecast transactions.
The Consolidated Entity's interest rate risk is derived predominately from borrowings subject to fixed and floating interest
rates. This risk is managed by the Consolidated Entity by maintaining an appropriate mix between fixed and floating rate
borrowings, through the use of interest rate swap contracts. Hedging activities are evaluated regularly to align with
interest rate views and defined policy, ensuring appropriate hedging strategies are applied.
The Consolidated Entity's exposures to interest rate risk on financial liabilities are detailed in the liquidity risk management
section of this note. Exposure to financial assets is limited to cash and cash equivalents amounting to $77.9 million as at 30
June 2016 (2015: $411.9 million).
The analysis below shows the effect on profit and total equity of retranslating cash, receivables, payables and interest-
bearing liabilities denominated in USD, JPY, CAD, GBP and EUR into AUD, had the rates been 20 percent higher or lower
than the relevant year end rate, with all other variables held constant, and taking into account all underlying exposures
and related hedges. A sensitivity of 20 percent has been selected and represents management's assessment of the
possible change in rates taking into account the current level of exchange rates and the volatility observed both on a
historical basis and on market expectations for future movements.
Cross currency swap and interest rate swap contracts have the economic effect of converting borrowings from floating to
fixed rates on agreed notional principal amounts enabling the Consolidated Entity to mitigate the risk of cash flow
exposures on variable rate debt held. The fair value of interest rate swaps at the reporting date is determined by
discounting the future cash flows using the yield curves at reporting date. The average interest rate is based on the
outstanding balances at the end of the financial year.
59

APT Pipelines Limited and its Controlled Entities
Notes to the consolidated financial statements (continued)For the financial year ended 30 June 2016
Capital Management
20. Financial risk management (continued)
(a) Market risk (continued)
Foreign currency risk (continued)
2016 2015 2016 2015 2016 2015
% p.a. % p.a. $000 $000 $000 $000
Cash flow hedges - Pay fixed AUD interest - receive floating AUD or fixed
Less than 1 year 8.58 7.10 276,665 185,608 17,700 (32,637)
1 year to 2 years 6.80 8.58 125,865 276,665 (2,403) 7,520
2 years to 5 years 7.76 7.60 635,553 761,418 10,284 (31,028)
5 years and more (a)
5.08 5.10 4,518,115 4,412,476 116,089 352,208
5,556,198 5,636,167 141,670 296,063
(a) This amount includes a notional amount of USD 3 billion which is subject to USD interest rate risk.
Interest rate sensitivity analysis
●
●
The following table details the notional principal amounts and remaining terms of the interest rate swap and cross
currency swap contracts outstanding as at the end of the financial year:
Weighted average Notional
Fair value interest rate principal amount
net profit would decrease by $12,225,000 or increase by $12,225,000 (2015: decrease by $5,150,000 or increase by
$5,150,000). This is mainly attributable to the Consolidated Entity's exposure to interest rates on its variable rate
borrowings, including its Australian Dollar subordinated notes; and
The cross currency swaps and interest rate swaps settle on a quarterly or semi-annual basis. The floating rate benchmark
on the interest rate swaps is Australian BBSW. The Consolidated Entity will settle the difference between the fixed and
floating interest rate on a net basis.
All cross currency swaps and interest rate swap contracts exchanging floating rate interest amounts for fixed rate interest
amounts are designated as cash flow hedges in order to reduce the Consolidated Entity's cash flow exposure resulting
from variable rates on borrowings.
The sensitivity analysis below has been determined based on the exposure to interest rates for both derivative and non-
derivative instruments held. A 100 basis point increase or decrease is used and represents management's assessment of
the greatest possible change in interest rates. At reporting date, if interest rates had been 100 basis points higher or lower
and all other variables were held constant, the Consolidated Entity's:
equity reserves would decrease by $143,644,000 with a 100 basis point decrease in interest rates or increase by
$129,922,000 with a 100 basis point increase in interest rates (2015 : increase by $14,483,000 or increase by $38,594,000
respectively). This is due to the changes in the fair value of derivative interest instruments.
The Consolidated Entity's profit sensitivity to interest rates has increased during the current period due to the overall
increase in the level of the Consolidated Entity's unhedged floating rate borrowings. The valuation of the
increase/decrease in equity reserves is based on 1.00% p.a. increase/decrease in the yield curve at the reporting date.
The increase in sensitivity in equity is due to the increase in the notional value of interest rate and cross currency swaps.
60

APT Pipelines Limited and its Controlled Entities
Notes to the consolidated financial statements (continued)For the financial year ended 30 June 2016
Capital Management
20. Financial risk management (continued)
(a) Market risk (continued)
Price risk
Price risk sensitivity
●
●
(b) Credit risk
Cross guarantee
(c) Liquidity risk
The Consolidated Entity is exposed to price risk arising from forward purchase contracts over listed equities. The forward
purchase contracts are held to meet strategic or hedging objectives rather than for trading purposes. The Consolidated
Entity does not actively trade any of these holdings.
The sensitivity analysis below has been determined based on the exposure to equity price risks at the reporting date. At
the reporting date, if the prices of the Consolidated Entity's equity investments had been 5 percent p.a. higher or lower:
there is no effect from the forwards as the corresponding exposure will offset in full (2015: $nil); and
In accordance with a deed of cross guarantee, APT Pipelines Limited has agreed to provide financial support, when and
as required, to all wholly-owned controlled entities with either a deficit in shareholders’ funds or an excess of current
liabilities over current assets. The fair value of the financial guarantee as at 30 June 2016 has been determined to be
immaterial and no liability has been recorded (2015: $nil).
The Consolidated Entity has a policy dealing with liquidity risk which requires an appropriate liquidity risk management
framework for the management of the Consolidated Entity's short, medium and long-term funding and liquidity
management requirements. Liquidity risk is managed by maintaining adequate cash reserves and banking facilities, by
monitoring and forecasting cash flows and where possible arranging liabilities with longer maturities to more closely
match the underlying assets of the Consolidated Entity.
The carrying amount of financial assets recorded in the financial statements, net of any allowances, represents the
Consolidated Entity’s maximum exposure to credit risk in relation to those assets.
there is no effect on equity reserves as the Consolidated Entity holds no available-for-sale investments (2015: $nil)
Credit risk refers to the risk that a counterparty will default on its contractual obligations resulting in financial loss to the
Consolidated Entity. The Consolidated Entity has adopted the policy of only dealing with creditworthy counterparties and
obtaining sufficient collateral or bank guarantees where appropriate as a means of mitigating any risk of loss. For financial
investments or market risk hedging, the Consolidated Entity's policy is to only transact with counter parties that have a
credit rating of A- (Standard & Poor's)/A3 (Moody's) or higher unless specifically approved by the Board. Where a
counterparty's rating falls below this threshold following a transaction, no other transactions can be executed with that
counterparty until the exposure is sufficiently reduced or their credit rating is upgraded above the Consolidated Entity's
minimum threshold. The Consolidated Entity's exposure to financial instrument and deposit credit risk is closely monitored
against counterparty credit limits imposed by the Treasury Risk Management Policy approved by the Audit and Risk
Management Committee. These limits are regularly reviewed by the Board.
Trade receivables consist of mainly corporate customers which are diverse and geographically spread. Most significant
customers have an investment grade rating from either Standard & Poor's or Moody's. Ongoing credit monitoring of the
financial position of customers is maintained.
61

APT Pipelines Limited and its Controlled Entities
Notes to the consolidated financial statements (continued)For the financial year ended 30 June 2016
Capital Management
20. Financial risk management (continued)
(c) Liquidity risk (continued)
Average Less than More than
interest rate 1 year 1 - 5 years 5 years
Maturity % p.a. $000 $000 $000
Unsecured financial liabilities:
Trade and other payables - 238,528 - -
Unsecured bank borrowings(a)
2.82 19,610 726,228 -
2012 Subordinated Notes 1-Oct-72 6.78 33,267 130,200 2,381,395
Denominated in US$
Other financial liabilities (b)
7,841 31,367 42,806
Guaranteed Senior Notes(c)
Denominated in A$
2007 Series A 15-May-17 7.33 5,367 - -
2007 Series C 15-May-17 7.38 106,475 - -
2007 Series E 15-May-19 7.40 5,045 78,259 -
2007 Series G 15-May-22 7.45 6,002 24,008 86,584
2007 Series H 15-May-22 7.45 4,617 18,468 66,603
2010 AUD Medium Term Notes 22-Jul-20 7.75 23,250 381,375 -
Denominated in US$
2003 Series C 9-Sep-15 5.77 - - -
2003 Series D 9-Sep-18 6.02 6,930 106,290 -
2007 Series B 15-May-17 5.89 204,864 - -
2007 Series D 15-May-19 5.99 11,111 173,435 -
2007 Series F 15-May-22 6.14 11,354 45,416 165,079
2009 Series A 1-Jul-16 8.35 90,569 - -
2009 Series B 1-Jul-19 8.86 11,761 128,286 -
2012 US 144A 11-Oct-22 3.88 49,123 196,762 809,056
2015 US 144A (b)
23-Mar-25 4.20 62,001 248,004 1,724,389
2015 US 144A (b)
23-Mar-35 5.00 20,130 80,521 684,650
Denominated in stated foreign currency
2012 JPY Medium Term Notes 22-Jun-18 1.23 8,559 134,424 -
2012 CAD Medium Term Notes 24-Jul-19 4.25 19,529 338,237 -
2012 GBP Medium Term Notes 26-Nov-24 4.25 39,459 157,943 674,364
2015 GBP Medium Term Notes (b)
22-Mar-30 3.50 53,312 213,349 1,668,898
2015 EUR Medium Term Notes (b)
22-Mar-22 1.38 36,060 144,240 1,023,284
2015 EUR Medium Term Notes (b) 22-Mar-27 2.00 40,301 161,205 1,158,689
1,115,065 3,518,017 10,485,797
(a)
(b)
(c)
2016
Detailed below are the Consolidated Entity's remaining contractual maturities for its non-derivative financial liabilities. The
table is presented based on the undiscounted cash flows of financial liabilities taking account of the earliest date on
which the Consolidated Entity can be required to pay. The table includes both interest and principal cash flows.
The table below shows the undiscounted Australian dollar cash flows associated with the foreign currency notes, cross
currency interest rate swaps and fixed interest rate swaps in aggregate.
Facilities are denominated or fully swapped by way of CCIRSs into US$. Cashflows represent the US$ cashflow translated at the USD/AUD spot rate
as at 30 June 2016. These amounts are fully hedged by FECs or future US$ revenues.
Rates shown are the coupon rate.
Facilities mature on 19 September 2017 ($311.25 million limit), 18 May 2018 ($100 million limit), 19 September 2018 ($311.25 million limit), 18 May 2019
($50 million limit), 19 December 2019 ($100 million limit), 18 May 2020 ($50 million limit), 19 September 2020 ($207.5 million limit), 19 December 2020
($100 million limit) and 18 May 2021 ($150 million limit).
62

APT Pipelines Limited and its Controlled Entities
Notes to the consolidated financial statements (continued)For the financial year ended 30 June 2016
Capital Management
20. Financial risk management (continued)
(c) Liquidity risk
Average Less than More than
interest rate 1 year 1 - 5 years 5 years
Maturity % p.a. $000 $000 $000
Unsecured financial liabilities:
Trade and other payables - 398,300 - -
Unsecured bank borrowings(a)
3.09 2,935 125,975 -
2012 Subordinated Notes 1-Oct-72 7.20 34,203 148,917 2,795,775
Interest rate swaps (net settled) 6.28 3,844 1,302 -
Denominated in US$
Other financial liabilities (b)
7,574 30,296 48,918
Guaranteed Senior Notes(c)
Denominated in A$
2007 Series A 15-May-17 7.33 367 5,367 -
2007 Series C 15-May-17 7.38 7,318 106,475 -
2007 Series E 15-May-19 7.40 5,045 83,304 -
2007 Series G 15-May-22 7.45 6,002 24,008 92,586
2007 Series H 15-May-22 7.45 4,617 18,468 71,220
2010 AUD Medium Term Notes 22-Jul-20 7.75 23,250 93,000 311,625
Denominated in US$
2003 Series C 9-Sep-15 5.77 192,773 - -
2003 Series D 9-Sep-18 6.02 6,949 113,220 -
2007 Series B 15-May-17 5.89 13,986 204,864 -
2007 Series D 15-May-19 5.99 11,111 184,546 -
2007 Series F 15-May-22 6.14 11,354 45,416 176,433
2009 Series A 1-Jul-16 8.35 9,805 90,569 -
2009 Series B 1-Jul-19 8.86 11,825 140,047 -
2012 US 144A 11-Oct-22 3.88 48,989 197,031 857,910
2015 US 144A (b)
23-Mar-25 4.20 59,883 239,533 1,725,377
2015 US 144A (b)
23-Mar-35 5.00 19,443 77,771 680,709
Denominated in stated foreign currency
2012 JPY Medium Term Notes 22-Jun-18 1.23 4,291 147,274 -
2012 CAD Medium Term Notes 24-Jul-19 4.25 19,422 357,766 -
2012 GBP Medium Term Notes 26-Nov-24 4.25 39,567 157,943 713,823
2015 GBP Medium Term Notes (b)
22-Mar-30 3.50 51,894 206,081 1,663,426
2015 EUR Medium Term Notes (b)
22-Mar-22 1.38 35,023 139,314 1,023,163
2015 EUR Medium Term Notes (b)
22-Mar-27 2.00 39,142 155,699 1,158,040
1,068,912 3,094,186 11,319,005
(a)
(b)
(c)
Facilities are denominated or fully swapped by way of CCIRS into US$. Cashflows represent the US$ cashflow translated at the USD/AUD spot rate as
at 30 June 2016. These amounts are fully hedged by forward exchange contracts or future US$ revenues.
Rates shown are the coupon rate.
2015
Facilities mature on 19 September 2016 ($400 million limit), 19 September 2017 ($425 million limit), 19 December 2018 ($200 million limit), and 19
September 2019 ($275 million limit).
63

APT Pipelines Limited and its Controlled Entities
Notes to the consolidated financial statements (continued)For the financial year ended 30 June 2016
Capital Management
20. Financial risk management (continued)
Fair value measurements recognised in the statement of financial position
●
●
●
Fair value of the Consolidated Entity's financial assets and liabilities that are measured at fair value on a recurring basis
●
●
●
●
●
●
The Consolidated Entity has financial instruments that are carried at fair value in the statement of financial position. The
best evidence of fair value is quoted prices in an active market. If the market for a financial instrument is not active, the
Consolidated Entity determines fair value by using various valuation models. The objective of using a valuation technique
is to establish the price that would be received to sell an asset or paid to transfer a liability between market participants.
The chosen valuation models make maximum use of market inputs and rely as little as possible on entity specific inputs.
The fair values of all positions include assumptions made as to recoverability based on the counterparty’s and the
Consolidated Entity’s credit risk.
The following table provides an analysis of financial instruments that are measured subsequent to initial recognition at fair
value, grouped into Levels 1 to 3 based on the degree to which the fair value is observable.
Level 2 fair value measurements are those derived from inputs other than quoted prices included within Level 1 that
are observable for the asset or liability, either directly (i.e. as prices) or indirectly (i.e. derived from prices).
Level 3 fair value measurements are those derived from valuation techniques that include inputs for the asset or liability
that are not based on observable market data (unobservable inputs).
There have been no transfers between the levels during 2016 (2015: none). Transfers between levels of the fair value
hierarchy occur at the end of the reporting period. Transfers between level 1 and level 2 are triggered when there are
changes to the availability of quoted prices in active markets. Transfers into level 3 are triggered when the observable
inputs become no longer observable, or vice versa for transfer out of level 3.
the fair value of financial guarantee contracts is determined based upon the probability of default by the specified
counterparty extrapolated from market-based credit information and the amount of loss, given the default. These
instruments are classified in the fair value hierarchy at level 2; and
Critical accounting judgements and key sources of estimation uncertainty - fair value of financial instruments
The fair values of financial assets and financial liabilities are measured at the end of each reporting period and
determined as follows:
the carrying value of financial assets and liabilities recorded at amortised cost in the financial statements approximate
their fair value having regard to the specific terms of the agreements underlying those assets and liabilities.
the fair values of forward foreign exchange contracts included in hedging assets and liabilities are calculated using
discounted cash flow analysis based on observable forward exchange rates at the end of the reporting period and
contract forward rates discounted at a rate that reflects the credit risk of the various counterparties. These instruments
are classified in the fair value hierarchy at level 2;
the fair values of interest rates swaps, cross currency swaps, equity forwards and other derivative instruments included
in hedging assets and liabilities are calculated using discounted cash flow analysis using observable yield curves at the
end of the reporting period and contract rates discounted at a rate that reflects the credit risk of the various
counterparties. These instruments are classified in the fair value hierarchy at level 2;
Level 1 fair value measurements are those derived from quoted prices (unadjusted) in active markets for identical
assets or liabilities.
the fair values of available-for-sale financial assets and financial liabilities with standard terms and conditions and
traded on active liquid markets are determined with reference to quoted market prices. These instruments are
classified in the fair value hierarchy at level 1;
64

APT Pipelines Limited and its Controlled Entities
Notes to the consolidated financial statements (continued)For the financial year ended 30 June 2016
Capital Management
20. Financial risk management (continued)
Fair value of financial instruments (continued)
Fair value hierarchy
Level 1 Level 2 Level 3 Total
$000 $000 $000 $000
Financial assets measured at fair value
Equity forwards designated as fair value through profit and loss - 2,566 - 2,566
Interest rate swaps used for hedging - - - -
Cross currency interest rate swaps used for hedging - 417,949 - 417,949
Forward foreign exchange contracts used for hedging - 22,941 - 22,941
- 443,456 - 443,456
Financial liabilities measured at fair value
Interest rate swaps used for hedging - 8,993 - 8,993
Cross currency interest rate swaps used for hedging - 267,287 - 267,287
Forward foreign exchange contracts used for hedging - 10,137 - 10,137
- 286,417 - 286,417
Financial assets measured at fair value
Equity forwards designated as fair value through profit or loss - 5,199 - 5,199
Interest rate swaps used for hedging - - - -
Cross currency interest rate swaps used for hedging - 461,484 - 461,484
Forward foreign exchange contracts used for hedging - 4,016 - 4,016
- 470,699 - 470,699
Financial liabilities measured at fair value
Interest rate swaps used for hedging - 17,885 - 17,885
Cross currency interest rate swaps used for hedging - 147,537 - 147,537
Forward foreign exchange contracts used for hedging - 1,800 - 1,800
- 167,222 - 167,222
Fair value measurements of financial instruments measured at amortised cost
2016 2015 2016 2015
$000 $000 $000 $000
Financial liabilities
Unsecured long term Private Placement Notes 1,124,099 1,254,594 1,246,720 1,388,789
Unsecured Australian Dollar Medium Term Notes 300,000 300,000 346,153 351,024
Unsecured Japanese Yen Medium Term Notes 129,964 106,005 132,575 108,594
Unsecured Canadian Dollar Medium Term Notes 310,555 311,394 317,912 323,954
Unsecured Australian Dollar Subordinated Notes 515,000 515,000 656,141 646,661
Unsecured US Dollar 144A Medium Term Notes 2,885,325 2,786,779 3,015,771 3,000,016
Unsecured British Pound Medium Term Notes 1,688,747 1,937,372 1,822,352 1,864,624
Unsecured Euro Medium Term Notes 2,008,378 1,950,107 1,958,596 1,872,050
8,962,068 9,161,251 9,496,220 9,555,712
(a) The fair values have been determined in accordance with generally accepted pricing models based on discounted cash flow analysis using prices
from observable current markets, discounted at a rate that reflects the credit risk of the various counterparties. The instruments are classified in the
fair value hierarchy at level 2.
2015
Carrying amount Fair value (level 2) (a)
The financial liabilities included in the following table are fixed rate borrowings. Other debts held by the Consolidated
Entity are floating rate borrowings and amortised cost as recorded in the financial statements approximate their fair
values.
2016
65

APT Pipelines Limited and its Controlled Entities
Notes to the consolidated financial statements (continued)For the financial year ended 30 June 2016
Capital Management
21. Other financial instruments
2016 2015 2016 2015
$000 $000 $000 $000
Derivatives at fair value:
Equity forward contracts 1,864 3,527 - -
Derivatives at fair value designated as hedging instruments:
Foreign exchange contracts - cash flow hedges 1,389 4,016 1,421 1,800
Interest rate swaps - cash flow hedges - - 3,925 13,003
Cross currency interest rate swaps - cash flow hedges 31,602 16,961 109,328 131,012
Financial assets carried at amortised cost:
Redeemable preference share interest 285 285 - -
Current 35,140 24,789 114,674 145,815
Financial items carried at amortised cost:
Redeemable preference shares 10,400 10,400 - -
Derivatives - at fair value:
Equity forward contracts 702 1,672 - -
Derivatives at fair value designated as hedging instruments:
Foreign exchange contracts - cash flow hedges 21,552 - 8,716 -
Interest rate swaps - cash flow hedges - - 6,246 8,728
Cross currency interest rate swaps - cash flow hedges 398,717 460,151 179,629 36,065
Non-current 431,371 472,223 194,591 44,793
Recognition and measurement
Hedge accounting
Redeemable preference shares relate to the Consolidated Entity's 20% interest in GDI (EII) Pty Ltd. In December 2011, APA
sold 80% of its gas distribution network in South East Queensland (Allgas) into an unlisted investment entity, GDI (EII) Pty Ltd.
At that date GDI issued 52 million Redeemable Preference Shares (RPS) to its owners. The shares attract periodic interest
payments and have a redemption date 10 years from issue.
Assets Liabilities
The fair value of hedging derivatives is classified as either current or non-current based on the timing of the underlying
cash flows of the instrument. Cash flows due within 12 months of the reporting date are classified as current and cash
flows due after 12 months of the reporting date are classified as non-current.
The Consolidated Entity designates certain hedging instruments, which include derivatives, embedded derivatives and
non-derivatives in respect of foreign currency risk, as either fair value hedges or cash flow hedges. There are no fair value
hedges in the current or prior year. Hedges of foreign exchange and interest rate risk are accounted for as cash flow
hedges.
At the inception of the hedge relationship, the Consolidated Entity formally designates and documents the hedge
relationship, including the risk management strategy for undertaking the hedge. This includes identification of the
hedging instrument, hedged item or transaction, the nature of there risk being hedged and how the entity will assess the
hedging instrument's effectiveness. Hedges are expected to be highly effective in achieving offsetting changes in fair
value or cash flows and their effectiveness is regularly assessed to ensure they continue to be so.
Note 20 contains details of the fair values of the derivative instruments used for hedging purposes. Movements in the
hedging reserve in equity are also detailed in the Consolidated Statement of Changes in Equity.
Derivatives are initially recognised at fair value at the date a derivatives contract is entered into and subsequently
remeasured to fair value at each reporting period. The resulting gain or loss is recognised in profit or loss immediately
unless the derivative is designated and effective as a hedging instrument, in which event the timing of the recognition in
profit or loss depends on the nature of the hedge relationship. A derivative with a positive fair value is recognised as a
financial asset, a derivative with a negative fair value is recognised as a financial liability.
66

APT Pipelines Limited and its Controlled Entities
Notes to the consolidated financial statements (continued)For the financial year ended 30 June 2016
Capital Management
21. Other financial instruments (continued)
Recognition and measurement (continued)
Cash flow hedges
Impairment of financial assets
22. Issued capital
2016 2015
$000 $000
Shares
62,127,252 shares, fully paid (2015: 62,127,252 shares, fully paid) (a)
117,330 117,330
2016 2015
No. of No. of
shares 2016 shares 2015
000 $000 000 $000
Movements
Balance at beginning of financial year 62,127 117,330 62,127 117,330
Balance at end of financial year 62,127 117,330 62,127 117,330
(a) Fully paid shares carry one vote per share and carry the right to distributions.
Financial assets, other than those at fair value through profit or loss, are assessed for indicators of impairment at the end of
each reporting period. Financial assets are impaired where, as a result of one or more events that occurred after the
initial recognition of the financial asset, there is objective evidence that the estimated future cash flows of the
investments have been unfavourably impacted.
If the forecast transaction is no longer expected to occur, amounts previously recognised in equity are transferred to the
profit or loss. If the hedging instrument expires or is sold, terminated or exercised, or if its designation as a hedge is
revoked, amounts previously recognised in equity remain in equity until the forecast transaction occurs.
Changes to the then Corporations Law abolished the authorised capital and par value concept in relation to issued
capital from 1 July 1998. Therefore, the Company does not have a limited amount of authorised capital and issued
shares do not have a par value.
With the exception of available-for-sale equity instruments, if, in a subsequent period, the amount of the impairment loss
decreases and the decrease can be related objectively to an event occurring after the impairment was recognised, the
previously recognised impairment loss is reversed through profit or loss to the extent the carrying amount of the investment
at the date the impairment is reversed, does not exceed what the amortised cost would have been had the impairment
not been recognised. In respect of available-for-sale equity instruments, any subsequent increase in fair value after an
impairment loss is recognised in other comprehensive income.
Amounts recognised in equity are transferred to the profit or loss when the hedged transaction affects profit or loss, such
as when the hedged income or expenses are recognised or when a forecast sale occurs. When the hedged item is the
cost of a non-financial asset or liability, the amounts taken to equity are transferred to the initial carrying amount of the
non-financial asset or liability.
For cash flow hedges, the portion of the gain or loss on the hedging instrument that is effective is recognised directly in
equity, while the ineffective portion is recognised in profit or loss.
For financial assets carried at amortised cost, the amount of the impairment is the difference between the asset’s carrying
amount and the present value of estimated future cash flows, discounted at the original effective interest rate. The
carrying amount of the asset is reduced through the use of an allowance account and the loss is recognised in the
statement of profit or loss.
67

APT Pipelines Limited and its Controlled Entities
Notes to the consolidated financial statements (continued)For the financial year ended 30 June 2016
Group Structure
23. Non-controlling interests
2016 2015
$000 $000
Issued capital
Balance at beginning of financial year 119,257 119,257
119,257 119,257
Reserves
Balance at beginning of financial year 1 1
1 1
Retained earnings
Balance at beginning of financial year 47 46
Profit for the year 31,748 23,185
Distributions paid (31,747) (23,184)
Balance at end of financial year 48 47
119,306 119,305
24. Joint arrangements and associates
Name of entity Principal activity Country of incorporation 2016 2015
Joint ventures:
SEA Gas Gas transmission Australia 50.00 50.00
Diamantina Power Station Power generation (gas) Australia - 50.00
EII 2 Power generation (wind) Australia 20.20 20.20
Associate:
GDI (EII) Gas distribution Australia 20.00 20.00
2016 2,015
$000 $000
Investment in joint ventures and associate using the equity method 197,185 257,425
The table below lists the Consolidated Entity's interest in joint ventures and associates. The Consolidated Entity provides
asset management, operation and maintenance services and corporate services, in varying combinations, to the
majority of energy infrastructure assets housed within these entities.
Ownership interest %
68

APT Pipelines Limited and its Controlled Entities
Notes to the consolidated financial statements (continued)For the financial year ended 30 June 2016
Group Structure
24. Joint arrangements and associates (continued)
Aggregated information in respect of the joint ventures and associate is set out below:
2016 2015
$000 $000
Joint Ventures
Aggregate carrying amount of investment 170,408 228,556
The Consolidated Entity's aggregated share of:
Profit from continuing operations 13,640 10,287
Other comprehensive income (8,103) (9,786)
Total comprehensive income 5,537 501
Associate
Aggregate carrying amount of investment 26,777 28,869
The Consolidated Entity's aggregated share of:
Profit from continuing operations 3,337 2,642
Other comprehensive income (1,327) 126
Total comprehensive income 2,010 2,768
Investment in associates
Contingent liabilities and capital commitments
The Consolidated Entity is a venturer in the following joint operations and assets:
2016 2015
Name of venture Principal activity % %
Goldfields Gas Transmission Gas pipeline operation - Western Australia 88.2 (a)
88.2 (a)
Mid West Pipeline Gas pipeline operation - Western Australia 50.0 (b)
50.0 (b)
(a)
(b) Pursuant to the joint venture agreement, the Consolidated Entity receives a 70.8% share of operating income and expenses.
Interest in joint arrangements
On 17 August 2004, the Consolidated Entity acquired a direct interest in the Goldfields Gas Transmission joint operations as part of the SCP Gas
Business acquisition.
The Consolidated Entity's share of the contingent liabilities, capital commitments and other expenditure commitments of
jointly controlled operations is disclosed in Note 27.
An associate is an entity over which the Consolidated Entity has significant influence and that is neither a subsidiary nor a
joint arrangement. Investments in associates are accounted for using the equity accounting method.
Under the equity accounting method the investment is recorded initially at cost to the Consolidated Entity, including any
goodwill on acquisition. In subsequent periods the carrying amount of the investment is adjusted to reflect the
Consolidated Entity’s share of the retained post-acquisition profit or loss and other comprehensive income, less any
impairment.
Losses of an associate or joint venture in excess of the Consolidated Entity’s interests (which includes any long-term
interests, that in substance, form part of the net investment) are recognised only to the extent that there is a legal or
constructive obligation or the Consolidated Entity has made payments on behalf of the associate or joint venture.
Output interest
A joint arrangement is an arrangement of which two or more parties have joint control. Joint control is the contractually
agreed sharing of control such that decisions about the relevant activities of the arrangement (those that significantly
affect the returns) require the unanimous consent of the parties sharing control. The Consolidated Entity has two types of
joint arrangements:
Joint ventures: A joint arrangement in which the parties that share joint control have rights to the net assets of the
arrangement. Joint Ventures are accounted for using the equity accounting method; and
69

APT Pipelines Limited and its Controlled Entities
Notes to the consolidated financial statements (continued)For the financial year ended 30 June 2016
Group Structure
24. Joint arrangements and associates (continued)
25. Business Combinations
Subsidiaries acquired Proportion of Cost of
Date of shares acquired acquisition
Name of entity Principal activity Acquisition % $000
Diamantina Power Station Power generation (gas) 31 March 2016 50.00 151,000
APA Ethane Limited Trustee 15 June 2016 50.50 -
Diamantina Power Station
APA Ethane Limited
Joint operations: A joint arrangement in which the parties that share joint control have rights to the assets, and obligations
for the liabilities, relating to the arrangement. In relation to its interest in a joint operation, the Consolidated Entity
recognises its share of assets and liabilities, revenue from the sale of its share of the output and its share of revenue
generated from the sale of the output by the joint operation and its share of expenses. These are incorporated into the
Consolidated Entity's financial statements under the appropriate headings.
Acquisitions of businesses are accounted for using the acquisition method. Under the acquisition method of accounting,
the purchase consideration is allocated to the identifiable assets acquired and liabilities and contingent liabilities assumed
(the identifiable net assets) on the basis of their fair value at the date of acquisition which is the date on which control is
obtained.
Provisional fair values allocated at a reporting date are finalised within 12 months of the acquisition date. The excess of the
consideration transferred, the amount of any non-controlling interest in the acquiree and the acquisition-date fair value of
any previous equity interest in the acquiree over the fair value of the identifiable net assets acquired is recorded as
goodwill. Any shortfall is immediately recognised in the statement of profit or loss.
Costs related to the acquisition of a subsidiary are expensed as incurred.
On an acquisition-by-acquisition basis, the Consolidated Entity recognises any non-controlling interest in the acquiree
either at the non-controlling interest’s proportionate share of the acquiree’s identifiable net assets or at fair value.
Goodwill and amounts attributable to non-controlling interests will differ depending on the basis used.
Where the Consolidated Entity has a previously held non-controlling interest in the acquiree, this is remeasured to fair value
at the date control is gained with any gain or loss recognised in the statement of profit or loss. Amounts recognised in other
comprehensive income prior to the acquisition are reclassified to profit or loss.
On 15 June 2016, the Consolidated Entity acquired the remaining 50 shares that it did not already own in APA Ethane
Limited, the Responsible Entity of Ethane Pipeline Income Fund.
2016
On 31 March 2016, the Consolidated Entity acquired the remaining 50 per cent of the Diamantina Power Station (DPS) that
it did not already own from AGL Energy Limited for a cash payment of $151.0 million.
The acquisition includes two power stations with shared infrastructure, the 242MW Diamantina Power Station with
combined cycle gas turbines and the 60MW Leichhardt Power Station with an open cycle gas turbine. These energy
assets are connected to our East Coast Grid and are underwritten by two highly credit worthy counterparties.
Included in the consolidated net profit for the year is revenue of $56.3 million and earnings before interest, tax,
depreciation and amortisation of $23.3 million attributable to DPS.
Had the business combination been effected at 1 July 2015, DPS would have contributed revenue of $245.5 million and
earnings before interest, tax, depreciation and amortisation of $89.3 million.
70

APT Pipelines Limited and its Controlled Entities
Notes to the consolidated financial statements (continued)For the financial year ended 30 June 2016
Group Structure
25. Business Combinations (continued)
Assets acquired and liabilities assumed at the date of acquisition
APA Ethane DPS Total
Net assets acquired $000 $000 $000
Current assets
Cash and cash equivalents 20 53,062 53,082
Trade and other receivables - 5,508 5,508
Other financial assets - 347 347
Inventories - 5,937 5,937
Other 17 6,066 6,083
Non-current assets
Other financial assets - 597 597
Property, plant & equipment - 725,091 725,091
Goodwill - 44,088 44,088
Current liabilities -
Trade and other payables (19) (26,292) (26,311)
Income tax payable - - -
Current borrowings - (447,051) (447,051)
Other financial liabilities - (16,134) (16,134)
Provisions - (549) (549)
Other (18) - (18)
Non-current liabilities -
Deferred tax liabilities - (17,758) (17,758)
Other financial liabilities - (28,208) (28,208)
Provisions - (2,728) (2,728)
Fair value of net assets acquired - 301,976 301,976
Previously held interest - (150,976) (150,976)
Cost of acquisition - 151,000 151,000
Cash balances acquired (20) (53,062) (53,082)
Transaction costs paid - 353 353
Net cash (inflow)/ outflow on acquisition (20) 98,291 98,271
The accounting for the acquisition of APA Ethane and DPS has been provisionally determined at the reporting date.
71
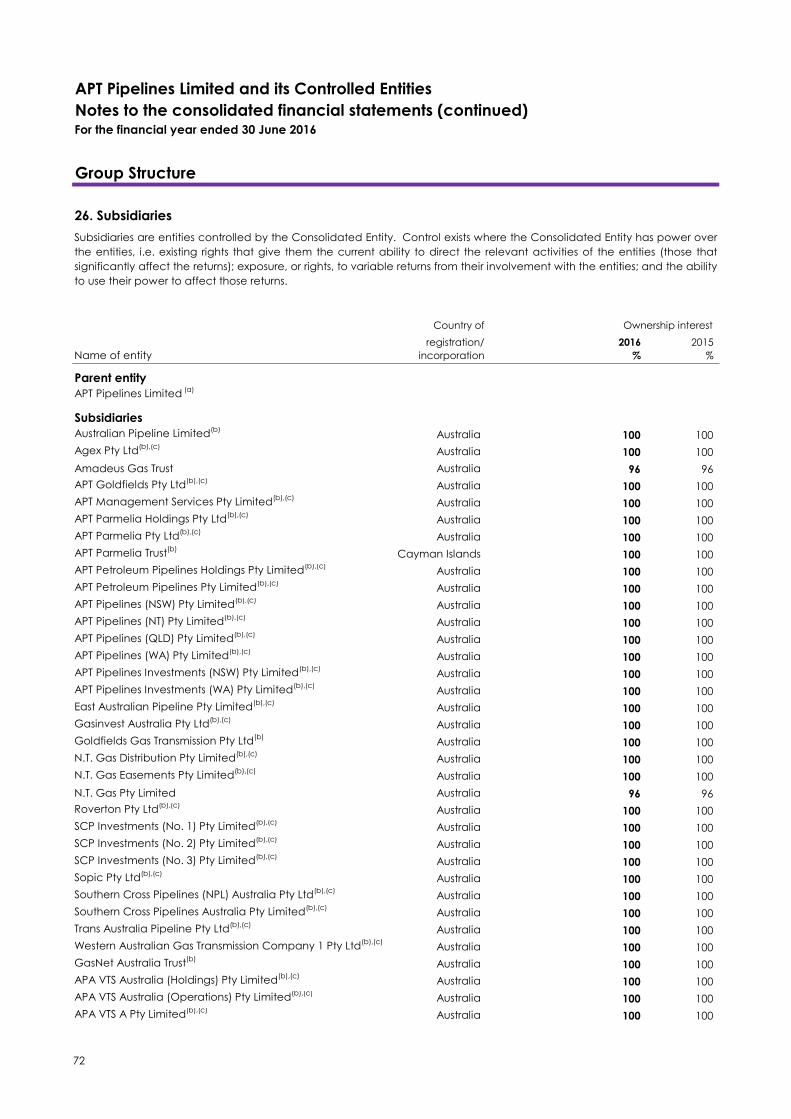
APT Pipelines Limited and its Controlled Entities
Notes to the consolidated financial statements (continued)For the financial year ended 30 June 2016
Group Structure
26. Subsidiaries
Country of
registration/ 2016 2015
Name of entity incorporation % %
Parent entity
APT Pipelines Limited (a)
Subsidiaries
Australian Pipeline Limited(b)
Australia 100 100
Agex Pty Ltd(b),(c)
Australia 100 100
Amadeus Gas Trust Australia 96 96
APT Goldfields Pty Ltd(b),(c)
Australia 100 100
APT Management Services Pty Limited(b),(c)
Australia 100 100
APT Parmelia Holdings Pty Ltd(b),(c)
Australia 100 100
APT Parmelia Pty Ltd(b),(c)
Australia 100 100
APT Parmelia Trust(b)
Cayman Islands 100 100
APT Petroleum Pipelines Holdings Pty Limited(b),(c)
Australia 100 100
APT Petroleum Pipelines Pty Limited(b),(c)
Australia 100 100
APT Pipelines (NSW) Pty Limited(b),(c)
Australia 100 100
APT Pipelines (NT) Pty Limited(b),(c)
Australia 100 100
APT Pipelines (QLD) Pty Limited(b),(c)
Australia 100 100
APT Pipelines (WA) Pty Limited(b),(c)
Australia 100 100
APT Pipelines Investments (NSW) Pty Limited(b),(c)
Australia 100 100
APT Pipelines Investments (WA) Pty Limited(b),(c)
Australia 100 100
East Australian Pipeline Pty Limited(b),(c)
Australia 100 100
Gasinvest Australia Pty Ltd(b),(c)
Australia 100 100
Goldfields Gas Transmission Pty Ltd(b)
Australia 100 100
N.T. Gas Distribution Pty Limited(b),(c)
Australia 100 100
N.T. Gas Easements Pty Limited(b),(c)
Australia 100 100
N.T. Gas Pty Limited Australia 96 96
Roverton Pty Ltd(b),(c)
Australia 100 100
SCP Investments (No. 1) Pty Limited(b),(c)
Australia 100 100
SCP Investments (No. 2) Pty Limited(b),(c)
Australia 100 100
SCP Investments (No. 3) Pty Limited(b),(c)
Australia 100 100
Sopic Pty Ltd(b),(c)
Australia 100 100
Southern Cross Pipelines (NPL) Australia Pty Ltd(b),(c)
Australia 100 100
Southern Cross Pipelines Australia Pty Limited(b),(c)
Australia 100 100
Trans Australia Pipeline Pty Ltd(b),(c)
Australia 100 100
Western Australian Gas Transmission Company 1 Pty Ltd(b),(c)
Australia 100 100
GasNet Australia Trust(b)
Australia 100 100
APA VTS Australia (Holdings) Pty Limited(b),(c)
Australia 100 100
APA VTS Australia (Operations) Pty Limited(b),(c)
Australia 100 100
APA VTS A Pty Limited(b),(c)
Australia 100 100
Subsidiaries are entities controlled by the Consolidated Entity. Control exists where the Consolidated Entity has power over
the entities, i.e. existing rights that give them the current ability to direct the relevant activities of the entities (those that
significantly affect the returns); exposure, or rights, to variable returns from their involvement with the entities; and the ability
to use their power to affect those returns.
Ownership interest
72

APT Pipelines Limited and its Controlled Entities
Notes to the consolidated financial statements (continued)For the financial year ended 30 June 2016
Group Structure
26. Subsidiaries (continued)
Country of
registration/ 2016 2015
Name of entity incorporation % %
GasNet A Trust Australia 100 100
APA VTS Australia (NSW) Pty Limited(b),(c)
Australia 100 100
APA VTS B Pty Limited(b),(c)
Australia 100 100
APA VTS Australia Pty Limited(b),(c)
Australia 100 100
GasNet B Trust(b)
Australia 100 100
APA Operations Pty Limited(b),(c)
Australia 100 100
APT AM Holdings Pty Limited(b),(c)
Australia 100 100
APT O&M Holdings Pty Ltd(b),(c)
Australia 100 100
APT O&M Services Pty Ltd(b),(c)
Australia 100 100
APT O&M Services (QLD) Pty Ltd(b),(c)
Australia 100 100
APT AM (Stratus) Pty Limited(b),(c)
Australia 100 100
APT Facility Management Pty Limited(b),(c)
Australia 100 100
APT AM Employment Pty Limited(b),(c)
Australia 100 100
APT Sea Gas Holdings Pty Limited(b),(c)
Australia 100 100
APT SPV2 Pty Ltd(b)
Australia 100 100
APT SPV3 Pty Ltd(b)
Australia 100 100
APT Pipelines (SA) Pty Limited(b),(c)
Australia 100 100
APT (MIT) Services Pty Limited(b),(c)
Australia 100 100
APA Operations (EII) Pty Limited(b),(c)
Australia 100 100
Central Ranges Pipeline Pty Ltd(b),(c)
Australia 100 100
APA Country Pipelines Pty Limited(b),(c)
Australia 100 100
APA Facilities Management Pty Limited(b),(c)
Australia 100 100
APA (NBH) Pty Limited(b),(c)
Australia 100 100
APA Pipelines Investments (BWP) Pty Limited(b),(c)
Australia 100 100
APA Power Holdings Pty Limited(b),(c)
Australia 100 100
APA (EDWF Holdco) Pty Ltd (b),(c)
Australia 100 100
APA (BWF Holdco) Pty Ltd (b),(c)
Australia 100 100
EDWF Holdings 1 Pty Ltd(b),(c)
Australia 100 100
EDWF Holdings 2 Pty Ltd(b),(c)
Australia 100 100
EDWF Manager Pty Ltd(b),(c)
Australia 100 100
Wind Portfolio Pty Ltd(b),(c)
Australia 100 100
Griffin Windfarm 2 Pty Ltd(b)
Australia 100 100
APA AM (Allgas) Pty Limited(b),(c)
Australia 100 100
APA DPS Holdings Pty Limited(b),(c)
Australia 100 100
APA Power PF Pty Limited(b),(c)
Australia 100 100
APA Sub Trust No 1(b)
Australia 100 100
APA Sub Trust No 2(b)
Australia 100 100
APA Sub Trust No 3 (b)
Australia 100 100
APA (Pilbara Pipeline) Pty Ltd(b),(c)
Australia 100 100
APA (Sub No 3) International Holdings 1 Pty Ltd(b),(e),(f)
Australia - 100
APA (Sub No 3) International Holdings 2 Pty Ltd(b),(e),(f)
Australia - 100
APA (Sub No 3) International Nominees Pty Ltd(b),(e),(f)
Australia - 100
Ownership interest
73

APT Pipelines Limited and its Controlled Entities
Notes to the consolidated financial statements (continued)For the financial year ended 30 June 2016
Group Structure
26. Subsidiaries (continued)
Country of
registration/ 2016 2015
Name of entity incorporation % %
APA (SWQP) Pty Limited(b),(c)
Australia 100 100
APA (WA) One Pty Limited(b),(c)
Australia 100 100
APA AIS 1 Pty Limited(b),(c)
Australia 100 100
APA AIS 2 Pty Ltd(b),(c)
Australia 100 100
APA AIS Pty Limited(b),(c)
Australia 100 100
APA Biobond Pty Limited(b),(c)
Australia 100 100
APA East One Pty Limited(b),(e),(f)
Australia - 100
APA East Pipelines Pty Limited(b),(c)
Australia 100 100
APA EE Pty Limited(b),(c)
Australia 100 100
APA EE Australia Pty Limited(b),(c)
Australia 100 100
APA EE Corporate Shared Services Pty Limited(b),(c)
Australia 100 100
APA EE Holdings Pty Limited(b),(c)
Australia 100 100
Epic Energy East Pipelines Trust(b)
Australia 100 100
APA (NT) Pty Limited(b),(e),(f)
Australia - 100
APA Bid Co Pty Limited(b),(c)
Australia 100 100
APA Transmission Pty Limited(b),(c),(g)
Australia 100 100
APA WGP Pty Limited(b),(c)
Australia 100 100
APA Newco Pty Limited(b),(d)
Australia 100 -
APA SEA Gas (Mortlake) Holdings Pty Ltd(b),(d)
Australia 100 -
APA SEA Gas (Mortlake) Pty Ltd(b),(d)
Australia 100 -
APA DPS2 Pty Limited(b),(d)
Australia 100 -
Diamantina Holding Company Pty Limited(b),(h)
Australia 100 -
Diamantina Power Station Pty Limited(b),(h)
Australia 100 -
APA Ethane Limited(b),(h)
Australia 100 -
Votraint No 1613 Pty Limited(b),(h)
Australia 100 -
EPX Hold Co Pty Limited(b),(d)
Australia 100 -
APA (EPX) Pty Limited(b),(d)
Australia 100 -
EPX Trust(b),(d)
Australia 100 -
EPX Member Pty Limited(b),(d)
Australia 100 -
(a)
(b)
(c)
(d)
(e)
(f)
(g)
(h)
Entity party to a revocation deed, in relation to the APT Pipelines Limited deed of cross guarantee, lodged with ASIC on 1 August 2014 which has
taken effect in the 2015 year and therefore is no longer a party to the deed.
Ownership interest
The parent of APT Pipelines Limited, Australian Pipeline Trust and its wholly-owned Australian resident entities formed a tax-consolidated group with
effect from 1 July 2003 and are therefore taxed as a single entity from that date. The head entity within the tax-consolidated group is Australian
Pipeline Trust.
These entities are members of the tax-consolidated group.
These wholly-owned subsidiaries have entered into a deed of cross guarantee with APT Pipelines Limited pursuant to ASIC Class Order 98/1418 and
are relieved from the requirement to prepare and lodge an audited financial report.
Entity was acquired or registered during the 2016 year.
Entity was deregistered during the 2016 year.
Entity previously known as "APA Holdco Pty Limited" during the 2015 year.
Remaining shares/units acquired during the 2016 year, entity now classified as a subsidiary (refer to Note 25)
74

APT Pipelines Limited and its Controlled Entities
Notes to the consolidated financial statements (continued)For the financial year ended 30 June 2016
Group Structure
26. Subsidiaries (continued)
The consolidated income statement of the entities party to the deed of cross guarantee are:
2016 2015
$000 $000
Continuing operations
Revenue 2,007,596 1,534,642
Share of net profits of associates and joint ventures using the equity method 7,647 4,659
2,015,243 1,539,301
Asset operation and management expenses (83,096) (73,407)
Depreciation and amortisation expense (508,509) (208,200)
Other operating costs - pass-through (431,080) (434,382)
Finance costs (630,460) (439,409)
Employee benefit expense (192,796) (186,260)
Other expenses (5,943) (24,233)
Profit before tax 163,359 173,410
Income tax expense (106,479) (61,329)
Profit for the year 56,880 112,081
Other comprehensive income, net of income tax
Items that will not be reclassified subsequently to profit or loss:
Actuarial (loss)/gain on defined benefit plan (8,148) 18,354
Income tax relating to (loss)/gain on defined benefit plan 2,444 (5,506)
(5,704) 12,848
Items that may be reclassified subsequently to profit or loss:
Transfer of gain on cash flow hedges to profit or loss 121,922 68,960
Loss on cash flow hedges taken to equity (249,150) (316,556)
Loss on associate hedges taken to equity (7,857) (5,053)
Recycling of reserves on disposal of associate 15,099 -
Income tax relating to other comprehensive income components 36,028 77,066
(83,958) (175,583)
Other comprehensive expense in the year (net of tax) (89,662) (162,735)
Total comprehensive income for the year (32,782) (50,654)
Cross Guarantee Group
75

APT Pipelines Limited and its Controlled Entities
Notes to the consolidated financial statements (continued)For the financial year ended 30 June 2016
Group Structure
26. Subsidiaries (continued)
The consolidated statement of financial position of the entities party to the deed of cross guarantee are:
2016 2015
$000 $000
Current assets
Cash and cash equivalents 76,591 410,595
Trade and other receivables 1,821,958 944,587
Other financial assets 35,139 24,789
Inventories 18,909 21,286
Other 6,625 8,314
Current assets 1,959,222 1,409,571
Non-current assets
Receivables 17,283 107,321
Other financial assets 1,524,939 1,024,747
Investments accounted for using the equity method 87,635 150,831
Property, plant and equipment 8,331,356 8,352,104
Goodwill 1,133,150 1,140,131
Other intangible assets 3,371,317 3,556,244
Other 28,622 33,069
Non-current assets 14,494,302 14,364,447
Total assets 16,453,524 15,774,018
Current liabilities
Trade and other payables 4,891,155 4,945,205
Borrowings 410,532 165,023
Other financial liabilities 114,674 145,815
Provisions 91,027 85,452
Unearned revenue 13,735 7,477
Current liabilities 5,521,123 5,348,972
Non-current liabilities
Trade and other payables 640,357 654,165
Borrowings 9,323,621 9,151,448
Other financial liabilities 194,591 44,793
Deferred tax liabilities 513,501 448,804
Unearned revenue 67,224 60,349
Other 41,895 16,801
Non-current liabilities 10,781,189 10,376,360
Total liabilities 16,302,312 15,725,332
Net assets 151,212 48,686
Equity
Issued capital 117,330 117,330
Reserves (386,106) (300,346)
Retained earnings 419,988 231,702
Equity attributable to equityholders of the parent 151,212 48,686
Cross Guarantee Group
76

APT Pipelines Limited and its Controlled Entities
Notes to the consolidated financial statements (continued)For the financial year ended 30 June 2016
Other
27. Commitments and contingencies
2016 2015
$000 $000
Capital expenditure commitments
The Consolidated Entity - plant and equipment 151,710 94,169
The Consolidated Entity's share of jointly controlled operations - plant and equipment 4,402 5,987
156,112 100,156
Contingent liabilities
Bank guarantees 42,027 49,049
The Consolidated Entity had no contingent assets as at 30 June 2016 and 30 June 2015.
28. Director and senior executive remuneration
Remuneration of Directors
The aggregate remuneration of Directors of the Consolidated Entity is set out below:
2016 2015
$ $
Short-term employment benefits 1,548,424 1,268,500
Post-employment benefits 217,041 132,105
Total remuneration: Non-Executive Directors 1,765,465 1,400,605
Short-term employment benefits 3,544,861 3,109,447
Post-employment benefits 35,000 35,000
Cash settled security-based payments 1,579,531 1,564,212
Total remuneration: Executive Director(a)
5,159,392 4,708,659
Total remuneration: Directors 6,924,857 6,109,264
Remuneration of senior executives(a)
The aggregate remuneration of senior executives of the Consolidated Entity is set out below:
Short-term employment benefits 10,992,475 9,977,891
Post-employment benefits 856,636 258,778
Cash settled security-based payments 4,429,999 4,242,640
Retention award - 430,666
Total remuneration: senior executives 16,279,110 14,909,975
(a) The remuneration for the Chief Executive Officer and Managing Director, Michael McCormack, is also included in the remuneration disclosure for
senior executives.
77

APT Pipelines Limited and its Controlled Entities
Notes to the consolidated financial statements (continued)For the financial year ended 30 June 2016
Other
29. Remuneration of external auditor
2016 2015
$ $
Amounts received or due and receivable by Deloitte Touche Tohmatsu for:
Auditing the financial report 643,000 659,500
Other assurance services (a)
60,000 211,500
703,000 871,000
(a)
30. Related party transactions
(a) Equity interest in related parties
(b) Responsible Entity – Australian Pipeline Limited
The Responsible Entity is wholly owned by APT Pipelines Limited.
(c) Transactions with related parties within the Consolidated Entity
Transactions between the entities that comprise the Consolidated Entity during the financial year consisted of:
● dividends;
● asset lease rentals;
● loans advanced and payments received on long-term inter-entity loans;
● management fees;
● operational services provided between entities;
● payments of distributions; and
● equity issues.
Australian Pipeline Limited
Details of the percentage of ordinary securities held in subsidiaries are disclosed in Note 26 and the details of the
percentage held in joint operations, joint ventures and associates are disclosed in Note 24.
The above transactions were made on normal commercial terms and conditions. The Consolidated Entity charges
interest on inter-entity loans from time to time.
All transactions between the entities that comprise the Consolidated Entity have been eliminated on consolidation.
Management fees of $3,999,694 (2015: $3,451,167) were paid to the Responsible Entity as reimbursement of costs incurred
on behalf of the Consolidated Entity. No amounts were paid directly by the Consolidated Entity to the Directors of the
Responsible Entity.
Australian Pipeline Limited, in its capacity as trustee and Responsible Entity of APT and APTIT, has guaranteed the
payment of principal, interest and other amounts as provided in the senior debt facilities of APT Pipelines Limited, the
principal borrowing entity of APA Group.
Services provided were in accordance with the external auditor independence policy. Other assurance services mainly comprise assurance
services in relation to Diamantina Holding Company Pty Limited and Diamantina Power Station Pty Limited.
Refer to Note 26 for details of the entities that comprise the consolidated group.
78

APT Pipelines Limited and its Controlled Entities
Notes to the consolidated financial statements (continued)For the financial year ended 30 June 2016
Other
30. Related party transactions (continued)
(d) Transactions with associates and joint ventures
Dividends Purchases Amount Amount
from Sales to from owed by owed to
related related related related related
parties parties parties parties parties
2016 $000 $000 $000 $000 $000
SEA Gas 10,523 3,371 - 10 -
Energy Infrastructure Investments 3,810 35,114 157 4,344 -
EII 2 3,102 725 - 45 -
APA Ethane Ltd - 192 - - -
Diamantina Power Station(a) - 950 - - -
GDI (EII) 4,102 55,775 54 7,830 -
Ethane Pipeline Income Fund(b) - 1,231 - - -
21,537 97,358 211 12,229 -
2015
SEA Gas 14,164 3,733 - 181 -
Energy Infrastructure Investments 3,460 27,021 139 3,074 139
EII 2 3,105 661 - - -
APA Ethane Ltd - 200 - - -
Diamantina Power Station(a)
- 1,608 - - -
GDI (EII) 4,479 51,190 - 5,749 -
25,208 84,413 139 9,004 139
(a)
(b) During the 2016 year, APA Group acquired the remaining outstanding share capital of Ethane Pipeline Income Fund. Ethane Pipeline Income Fund
becomes a related party to the Consolidated Entity following the acquisition.
The following transactions occurred with the Consolidated Entity's associates and joint ventures on normal market terms
At 30 June 2015, the Consolidated Entity had a shareholder loan receivable from Diamantina Power Station of $75.7 million. Following the
Consolidated Entity's acquisition of the remaining 50% of Diamantina Power Station on 31 March 2016, the shareholder loan receivable from
Diamantina Power Station now forms part of the inter-entity balances and is eliminated on consolidation.
79
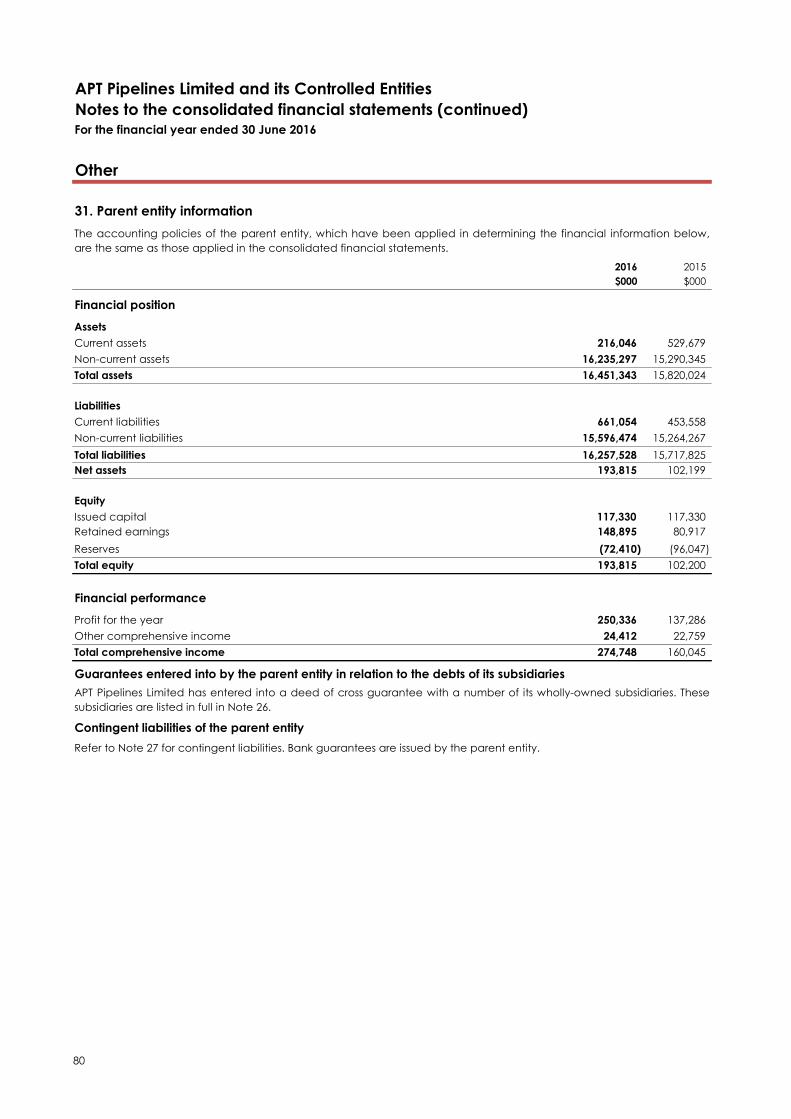
APT Pipelines Limited and its Controlled Entities
Notes to the consolidated financial statements (continued)For the financial year ended 30 June 2016
Other
31. Parent entity information
2016 2015
$000 $000
Financial position
Assets
Current assets 216,046 529,679
Non-current assets 16,235,297 15,290,345
Total assets 16,451,343 15,820,024
Liabilities
Current liabilities 661,054 453,558
Non-current liabilities 15,596,474 15,264,267
Total liabilities 16,257,528 15,717,825
Net assets 193,815 102,199
Equity
Issued capital 117,330 117,330
Retained earnings 148,895 80,917
Reserves (72,410) (96,047)
Total equity 193,815 102,200
Financial performance
Profit for the year 250,336 137,286
Other comprehensive income 24,412 22,759
Total comprehensive income 274,748 160,045
Guarantees entered into by the parent entity in relation to the debts of its subsidiaries
Contingent liabilities of the parent entity
Refer to Note 27 for contingent liabilities. Bank guarantees are issued by the parent entity.
The accounting policies of the parent entity, which have been applied in determining the financial information below,
are the same as those applied in the consolidated financial statements.
APT Pipelines Limited has entered into a deed of cross guarantee with a number of its wholly-owned subsidiaries. These
subsidiaries are listed in full in Note 26.
80

APT Pipelines Limited and its Controlled Entities
Notes to the consolidated financial statements (continued)For the financial year ended 30 June 2016
Other
32. Adoption of new and revised Accounting Standards
Standards and Interpretations affecting amounts reported in the current period (and/or prior periods)
Standards and Interpretations issued not yet adopted
Effective for annual Expected to be
reporting periods initially applied in the
Standard/Interpretation beginning on or after financial year ending
● AASB 9 ‘Financial Instruments’, and the relevant amending 1 January 2018 30 June 2019
standards
● AASB 15 'Revenue from Contracts with Customers' and AASB 2014-5 1 January 2018 30 June 2019
'Amendments to Australian Accounting Standards arising from AASB 15'
● AASB 16 "Leases" 1 January 2019 30 June 2020
The potential impacts of the initial application of the Standards above are yet to be determined.
33. Events occurring after reporting date
There have not been any new or revised Standards and Interpretations issued by the AASB that are relevant to the
consolidated entity's operations that would be effective for the current reporting period.
On 23 August 2016, the Directors declared a final dividend of 278.5 cents per share ($173.0 million). The dividend will be
paid on 23 August 2016 to sole equityholder, Australian Pipeline Limited as Responsible Entity and Trustee of Australian
Pipeline Trust.
At the date of authorisation of the financial statements, the Standards and Interpretations listed below were on issue but
not yet effective.
Other than the events disclosed above, there have not been any events or transactions that have occurred subsequent to
year end that would require adjustment to or disclosure in the accounts.
81

APT Pipelines Limited and its Controlled Entities
Declaration by the Directors of APT Pipelines LimitedFor the financial year ended 30 June 2016
The Directors declare that:
(a)
(b)
(c)
(d)
(e)
Signed in accordance with a resolution of the Directors made pursuant to section 295(5) of the Corporations Act 2001.
On behalf of the Directors
Leonard Bleasel AM
Chairman
Steven Crane
Director
SYDNEY, 24 August 2016
in the Directors’ opinion, there are reasonable grounds to believe that APT Pipelines Limited will be able to pay its
debts as and when they become due and payable;
in the Directors' opinion, the financial statements and notes thereto are in accordance with International Financial
Reporting Standards issued by the International Accounting Standard Board; and
the Directors have been given the declarations by the Managing Director and Chief Financial Officer required by
section 295A of the Corporations Act 2001.
At the date of this declaration, APT Pipelines Limited is within the class of companies affected by ASIC Class Order
98/1418. The nature of the deed of cross guarantee is such that each company, which is party to the deed,
guarantees to each creditor, payment in full of any debt in accordance with the deed of cross guarantee. In the
Directors’ opinion, there are reasonable grounds to believe that APT Pipelines Limited and the companies to which the
ASIC Class Order applies, as detailed in Note 26 to the financial statements will, as a group, be able to meet any
obligations or liabilities to which they are, or may become, subject by virtue of the deed of cross guarantee.
in the Directors’ opinion, the attached financial statements and notes thereto are in accordance with the
Corporations Act 2001, including compliance with Accounting Standards and giving a true and fair view of the
financial position and performance of the Consolidated Entity;
82

Liability limited by a scheme approved under Professional Standards Legislation
Member of Deloitte Touche Tohmatsu Limited
83
24 August 2016
The Directors APT Pipelines Limited HSBC Building
Level 19, 580 George Street Sydney NSW 2000 Dear Directors
Auditors Independence Declaration to APT Pipelines Limited In accordance with section 307C of the Corporations Act 2001, I am pleased to provide the following declaration of independence to the directors of APT Pipelines Limited. As lead audit partner for the audit of the financial statements of APT Pipelines Limited for the financial year ended 30 June 2016, I declare that to the best of my knowledge and belief, there have been no contraventions of:
(i) the auditor independence requirements of the Corporations Act 2001 in relation to the audit; and
(ii) any applicable code of professional conduct in relation to the audit. Yours sincerely
DELOITTE TOUCHE TOHMATSU
A V Griffiths Partner Chartered Accountants Sydney, 24 August 2016
Deloitte Touche Tohmatsu
ABN 74 490 121 060
Grosvenor Place
225 George Street
Sydney NSW 2000
PO Box N250 Grosvenor Place
Sydney NSW 1220 Australia
DX: 10307SSE
Tel: +61 (0) 2 9322 7000
Fax: +61 (0) 2 9322 7001
www.deloitte.com.au

Liability limited by a scheme approved under Professional Standards Legislation Member of Deloitte Touche Tohmatsu Limited
84
Independent Auditor’s Report
to the Members of APT Pipelines Limited
Report on the Financial Report We have audited the accompanying financial report of APT Pipelines Limited, which comprises the statement of financial position as at 30 June 2016, the statement of profit or loss and other comprehensive income, the statement of cash flows and the statement of changes in equity for the year ended on that date, notes comprising a summary of significant accounting policies and other explanatory information, and the directors’ declaration of the consolidated entity comprising the company and the entities it controlled at the year’s end or from time to time during the financial year as set out on pages 26 to 82.
Directors’ Responsibility for the Financial Report The directors of APT Pipelines Limited are responsible for the preparation of the financial report that gives a true and fair view in accordance with Australian Accounting Standards and the Corporations Act 2001 and for such internal control as the directors determine is necessary to enable the preparation of the financial report that is free from material misstatement, whether due to fraud or error. In Note 2, the directors also state, in accordance with Accounting Standard AASB 101 Presentation of Financial Statements, that the financial statements comply with International Financial Reporting Standards. Auditor’s Responsibility Our responsibility is to express an opinion on the financial report based on our audit. We conducted our audit in accordance with Australian Auditing Standards. Those standards require that we comply with relevant ethical requirements relating to audit engagements and plan and perform the audit to obtain reasonable assurance whether the financial report is free from material misstatement. An audit involves performing procedures to obtain audit evidence about the amounts and
disclosures in the financial report. The procedures selected depend on the auditor’s judgement, including the assessment of the risks of material misstatement of the financial report, whether due to fraud or error. In making those risk assessments, the auditor considers internal control, relevant to the entity’s preparation of the financial report that gives a true and fair view, in order to design audit procedures that are appropriate in the circumstances, but not for the purpose of expressing an opinion on the effectiveness of the entity’s internal control. An audit also includes evaluating the appropriateness of accounting policies used and the reasonableness of accounting estimates made by the directors, as well as evaluating the overall presentation of the financial report.
Deloitte Touche Tohmatsu
ABN 74 490 121 060
Grosvenor Place
225 George Street
Sydney NSW 2000
PO Box N250 Grosvenor Place
Sydney NSW 1220 Australia
DX: 10307SSE
Tel: +61 (0) 2 9322 7000
Fax: +61 (0) 2 9322 7001
www.deloitte.com.au

85
We believe that the audit evidence we have obtained is sufficient and appropriate to provide a basis for our audit opinion.
Auditor’s Independence Declaration In conducting our audit, we have complied with the independence requirements of the Corporations Act 2001. We confirm that the independence declaration required by the Corporations Act 2001, which has been given to the directors of APT Pipelines Limited, would be in the same terms if given to the directors as at the time of this auditor’s
report. Opinion In our opinion:
(a) the financial report of APT Pipelines Limited is in accordance with the Corporations Act 2001, including:
(i) giving a true and fair view of the consolidated entity’s financial position as at 30
June 2016 and of its performance for the year ended on that date; and (ii) complying with Australian Accounting Standards and the Corporations Regulations
2001; and (b) the financial statements also comply with International Financial Reporting Standards
as disclosed in Note 2.
Report on the Remuneration Report
We have audited the Remuneration Report included in pages 5 to 25 of the directors’ report for the year ended 30 June 2016. The directors of the company are responsible for the preparation and presentation of the Remuneration Report in accordance with section 300A of the Corporations Act 2001. Our responsibility is to express an opinion on the Remuneration Report, based on our audit conducted in accordance with Australian Auditing Standards.
Opinion In our opinion the Remuneration Report of APT Pipelines Limited for the year ended 30 June 2016, complies with section 300A of the Corporations Act 2001.
DELOITTE TOUCHE TOHMATSU
A V Griffiths Partner Chartered Accountants Sydney, 24 August 2016