Embed Size (px)
Citation preview

©2016 EAB • All Rights Reserved • eab.com • 34253A
The Future of the Arts & SciencesA Briefing for Research Universities
Academic Affairs Forum

©2016 EAB • All Rights Reserved • eab.com • 34253A
2
The “Ivory Tower” Depends on a Specific Set of Social Supports
A Weakening Foundation
The Traditional Academic Model
Student Population
• Residential education
• 18-24 year old students who attend full time
• Selective admission of academically prepared students
Instruction
• Daytime face-to-face instruction during academic terms
• Comprehensive academic program offerings
• Broad general education requirements taught by faculty
• Most instructors tenure track faculty promoted based on scholarship
Student Population
Family Finances
Career Outcomes
CompetitionPublic
Support

©2016 EAB • All Rights Reserved • eab.com • 34253A
3
Growth Populations Look Very Different from Traditional Students
Student Populations
• Volatile working adult enrollments
• International enrollments strong overall but national sources subject to rapid swings
Implications
No longer possible for all institutions to grow at historic rates
Increasing access to underserved groups essential to maintaining enrollments
Growth will require managing more volatile changes in enrollment
Demographic Growth Ends
‘Post-Traditional’ Students Now the Majority
Growth Markets Less Predictable
• Dramatic slowdown in the growth of HS graduates with significant variation by state/ region
• Vast majority of projected growth from Hispanic students
• Little progress on engaging underrepresented groups
• Full time, residential students a minority
• Majority of students combining credits from multiple institutions

©2017 EAB • All Rights Reserved • eab.com • 35049A
4
Source: Selingo J, The Future of Enrollment, The Chronicle of Higher Education, 2017; Source: Western Interstate Commission for Higher Education, Knocking at the College Door: Projections of High School Graduates, 2016, www.wiche.edu/knocking; EAB research and analysis.
Traditional Demographics Declining
WA
OR
CA
NV
ID
MT
WY
UTCO
AZ NM
TX
OK
ND
KS
NE
SD
AR
MO
IA
MN
GA
TN
MS AL
LA
MI
OHINIL
WI
FL
PA
VA
ME
NY
WV
NC
KY
SC
AK
NHVT
NJDE
MD
HI
CT
MA
RI
Legend
Less than -10% growth
Between -10% and 0% growth
Between 0% and 10% growth
Greater than 10% growth
10States produce a majority of high school graduates
36States will see slower growth or declines in the high school graduation rate
22%Estimated decline in private high school graduation rates by the early 2020s

©2017 EAB • All Rights Reserved • eab.com • 35049A
5
More Detailed Demographic Projections Show Growth in Elite Students
Source: Nathan D. Grawe, Demographics and the Demand for Higher Education’ http://www.people.carleton.edu/~ngrawe/HEDI.htm
Not As Dire As We Thought
Forecasted growth in students who will attend a REGIONAL four-year institution, 2012 to 2029
Forecasted growth in students who will attend an ELITE NATIONAL institution, 2012 to 2029

©2016 EAB • All Rights Reserved • eab.com • 33711A
6
Many Ways to Be a Student
Sources: “America as 100 College Students,” Bill and Melinda Gates Foundation; EAB interviews and analysis.
The Post-Traditional Student

©2016 EAB • All Rights Reserved • eab.com • 34253A
7
Economics, Politics, and Prejudice Impact International Enrollments
An Increasingly Critical, But Volatile, Market
Sources: IIE, Open Doors 2015; EAB interviews and analysis.
-20%
-10%
0%
10%
20%
30%
40%
50%
60%
70%
80%
India South Korea Saudi Arabia Brazil Kuwait
Annual Change in Enrollment in U.S. Institutions, 2005-2015
• Strong growth returns after three years of declines
• Australia saw 71% decline 2007-11
• Accelerating declines since 2011
• Economic challenges depressing enrollments
• Growth moderates after govt funded expansion
• Saudi govt now cutting spending, limiting support to top 100 universities
• Massive growth fueled by government program
• Funding at risk given economic and political issues
• Kuwait suspends Idaho State after reports of racism on and off campus
• International students at ISU were generating $40M annually for the local economy

©2016 EAB • All Rights Reserved • eab.com • 34253A
8
An Increasing Financial Burden on Already Struggling Families
Family Finances
• Net price rising as share of family income for middle class
• Decline in home equity and lack of savings
• Net price down for low income families but many remain debt averse
The Economic Growth Engine Stalls
The Hollowing of the Middle Class
Struggling to Pay for College
• Longest post-war economic boom ended in 2007
• Slow growth projected for foreseeable future
• Nearly all gains in income and wealth going to the top 5%
• Middle class families have less income and wealth than before the recession
Implications
Investments in institutional student aid will continue to grow, further straining tight university budgets
Price competition will increase driving down net tuition revenue growth
Public pressure to moderate tuition increases/ reduce debt burden will grow making it harder for institutions to grow revenue

©2017 EAB Global, Inc. • All Rights Reserved. • eab.com
9
Net Tuition Revenue Not Keeping Pace With Sticker Price Increases
How Will We Fund the Future?
Source: College Board, “Trends In College Pricing,” 2016; NACUBO, “2016 NACUBO Tuition Discounting Study,” 2017.
$24,580$24,040
$23,620$23,980 $24,320
$26,080
$36,060$36,980 $40,250
$41,430 $42,870$45,370
2006-2007 2008-2009 2010-2011 2012-2013 2014-2015 2016-2017
Published vs. Net Tuition, Fees, Room, And Board at Private Universities
Four-Year, Not-For-Profit Institutions, Selected Years
List Price
Net Price
0.6% CAGR
38.6%NACUBO-reported discount rate for FTFT freshmen in 2006-2007
49.1%NACUBO-reported discount rate for FTFT freshmen in 2016-2017
3%annual growth rate required to keep up with costs, according to Moody’s
Missed Target

©2017 EAB • All Rights Reserved • eab.com • 35049A
10
Sources: Richard A. Hesel and Ryan C. Williams, “Students and Parents Making Judgments about College Costs without Complete Information,” Student Poll, vol. 8, 1, 2010; Kevin Eagan et. al., “The American freshman: National Norms Fall 2016,” Higher Education Research Institute, 2017; Peace Bransberger and Demarée K. Michelau, “Knocking at the College Door,” WICHE, December, 2016; Student Loan Hero fast facts; Royall and Company, “Access and Higher Education: The Case of High-Ability Low-Income Students,” Fall, 2014.
The Affordability Issue
59% of students consider only list
price when evaluating schools early in the process
17% of students ruled out a school
they will apply to because of cost
>50% of students from families
earning less than $120,000 per year say they cannot afford to attend a private college or university
Students Ruling Schools Out on List Price Alone
69% of students have some (or
major) concern about financing college
9%
25%
White Latino
Attitudes Shifting with Demographics
Percentage of students reporting “major” concern about financing college

©2016 EAB • All Rights Reserved • eab.com • 34253A
11
Getting a Job Becoming the Primary Reason Most Students Attend University
Career Outcomes
• Automation and global trade reshaping occupations with strong growth, good wages
‘Lost Generation’ Threatens Belief in Value of College Degree
‘New Learning Economy’ Emphasizes Shorter, Just-in-Time Credentials
Skill-Biased Technical Change Driving Growth in High and Low Skill Jobs
• Graduates during the recession continue to face poor employment and salary outcomes
• BA no longer seen as guarantee of middle class income
• Enrollments in liberal arts decline rapidly while engineering, computer science, health professions oversubscribed
• Rise of bachelors degrees in workforce require students to look to post-bacc training as differentiator
• Rapid changes in hot jobs/ skill requirements
• Experience more valuable than formal education alone
Implications
Rapid shifts in enrollment as students seek career-aligned programs/ institutions
Students and employers favoring experience over formal education
Proliferation of post-baccalaureate credentials for job seekers

©2017 EAB Global, Inc. • All Rights Reserved. • eab.com
12
Source: http://www.collegemeasures.org/4-year_colleges/college-performance-rank/.
A New Kind of Ranking
Proliferation of Rankings and Search Tools Based on Career Outcomes
New Resources to Measure ROI Emerge Post-Recession
2010
College salary and ROI reports
Survey asks which schools best prepare for postgrad success
2012
State-level salary data for VA, AR; later expanded to CO, FL, TN, TX
2013
Alumni giving as indicator of outcomes, ROI
20% of ranking based on earnings
2014
Placement rate at top companies in hot industries
One-third of rankings by career outcomes
2015
Value added vs. predicted salary
Colleges’ value added based on Scorecard data
Increased weight for outcomes in rankings formula
Median earnings 10 years out; Percent students earning >$25K
College Scorecard
College Scorecard Now Front and Center in Online Search

©2017 EAB • All Rights Reserved • eab.com • 35324C
13
The Economic Value of a Bachelor’s Degree
Source: Carnevale A, Cheah B, Hanson A, “The Economic Value of College Majors,” Georgetown University Center on Education and the Workforce, 2015.
Putting a Price on Every Discipline
Not All Bachelor’s Degrees Are Created Equal
Median annual wage of college-educated workers
Architecture andEngineering
Computers, Math, andStatistics
Health Business Social Sciences All Majors Humanities andLiberal Arts
Early-Career (21-24) Mid-Career (25-59)
$1M $3.4 MDifference in lifetime wages of college and high school grads
Difference in lifetime wages of highest- and lowest-paying majors
$50,000
$83,000
$43,000
$76,000
$41,000
$65,000
$37,000
$65,000
$33,000
$60,000
$33,000
$61,000
$30,000
$52,000

©2017 EAB • All Rights Reserved • eab.com • 35324C
14
Students Move to Health & Engineering, Away from Education & Humanities
Source: EAB analysis of IPEDS data.
Winners and Losers
-19,388
-11,337
6,528
7,434
8,369
8,940
12,294
14,568
18,031
23,631
24,746
25,249
30,344
33,014
89,926
Education
Humanities and liberal arts
Arts
Social sciences
Physical sciences
Business
Agriculture and natural resources
Communications and journalism
Computers, statistics, and mathematics
Industrial arts, consumer services, and recreation
Psychology and social work
Law and public policy
Architecture and engineering
Biology and life sciences
Health
Change in Number of BA Degree Completions by Major Group, 2007-2015, All Institutions
©2017 EAB • All Rights Reserved • eab.com • 35324C
15
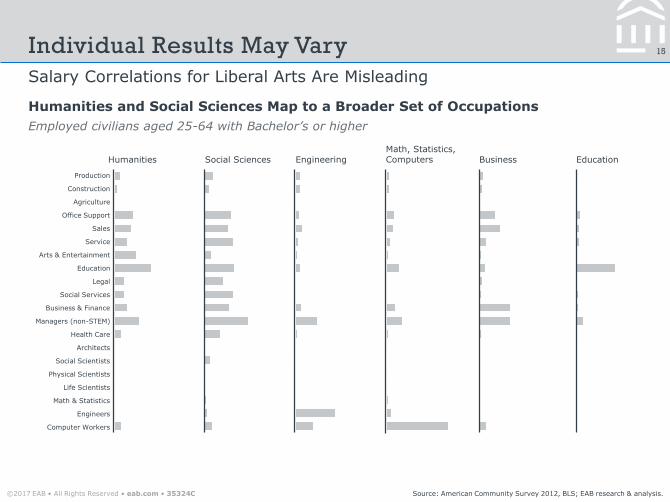
Salary Correlations for Liberal Arts Are Misleading
Source: American Community Survey 2012, BLS; EAB research & analysis.
Individual Results May Vary
Humanities and Social Sciences Map to a Broader Set of Occupations
Employed civilians aged 25-64 with Bachelor’s or higher
Humanities Social Sciences Engineering Business EducationMath, Statistics, Computers
Production
Construction
Agriculture
Office Support
Sales
Service
Arts & Entertainment
Education
Legal
Social Services
Business & Finance
Managers (non-STEM)
Health Care
Architects
Social Scientists
Physical Scientists
Life Scientists
Math & Statistics
Engineers
Computer Workers

©2017 EAB • All Rights Reserved • eab.com • 35324C
16
30%
40%
50%
60%
70%
80%
90%
100%
$32,000 $37,000 $42,000 $47,000 $52,000 $57,000 $62,000 $67,000 $72,000 $77,000
Meaningfulness of Work Versus Median Early Career Pay
Source: “Highest Paying Bachelor’s Degrees by Salary Potential,” PayScale 2017-2018 College Salary Report; National Center for Education Statistics IPEDS; EAB interviews and analysis.
1) Circle size represents 2015-2016 national conferrals by field
The Protestant Ethic and the Purposeful Life
Chemical Engineering
Sociology
Math
Biology
Social Work
Theological & Ministerial Studies
Physical Therapy
Public Health
Statistics
Physics
MarketingAccounting
Visual and Performing Arts
Religion
Philosophy
Women’s Studies
ArchitectureCriminology
Teacher Education
Geography
Median Early-Career Salary
Meanin
gfu
lness
Business Administration
Psychology
Political Science
History
Communication & Journalism
Economics
Computer ScienceEnglish
Median % Meaningfulness
Median Early-Career Salary
Shrinking
Maintaining
Growing
Key
Nursing
Civil Engineering
Nuclear Engineering
Mechanical Engineering
Electrical Engineering
Petroleum Engineering
$94,600

©2016 EAB • All Rights Reserved • eab.com • 34253A
17
Revenue Imperative Forcing Universities into New Markets
Competition
• Swirling students create course-by-course competition
• Students comparing wider range of institutions with different cost/quality tradeoffs
• Alternative providers entering most profitable markets
The Post-Baccalaureate Explosion
Multi-Local Strategies
• Professional master’s now a significant revenue generator for many universities
• Many programs struggling as more institutions enter an already overheated market
Cross-Sector Competitors
• Constrained by local demographics, more institutions seeking secondary markets in other cities or regions
• Urban locations attracting more students as rural institutions struggle
• Intensifying national competition for highly qualified mobile students willing to relocate
Implications
Revenue from new professional master’s programs no longer sufficient to subsidize struggling undergraduate programs
No market is protected–other institutions with very different cost structures and value propositions will come for your students
©2016 The Advisory Board Company • eab.com • 30516A
18
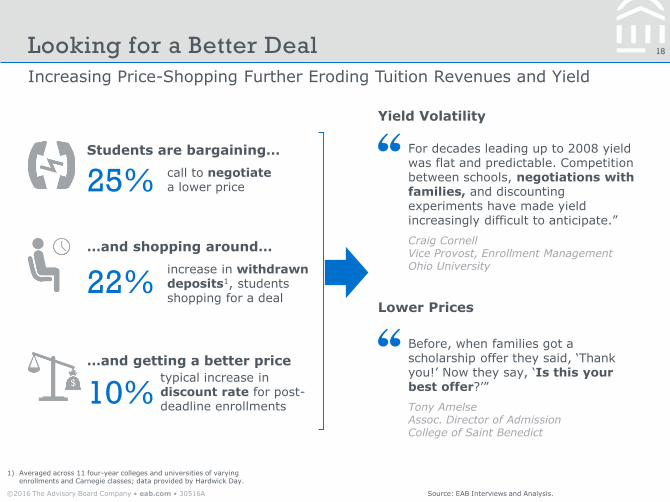
Increasing Price-Shopping Further Eroding Tuition Revenues and Yield
Looking for a Better Deal
Source: EAB Interviews and Analysis.
1) Averaged across 11 four-year colleges and universities of varying enrollments and Carnegie classes; data provided by Hardwick Day.
call to negotiate a lower price25%
increase in withdrawn deposits1, students shopping for a deal
22%
typical increase in discount rate for post-deadline enrollments
10%
Students are bargaining…
…and shopping around…
…and getting a better price
Lower Prices
Yield Volatility
For decades leading up to 2008 yield was flat and predictable. Competition between schools, negotiations with families, and discounting experiments have made yield increasingly difficult to anticipate.”
Craig CornellVice Provost, Enrollment ManagementOhio University
Before, when families got a scholarship offer they said, ‘Thank you!’ Now they say, ‘Is this your best offer?’”
Tony AmelseAssoc. Director of AdmissionCollege of Saint Benedict

©2016 EAB • All Rights Reserved • eab.com • 34253A
19
Growth Ambitions Drive Competition from New Segments
Sources: Royall & Company, “DepositIQ Survey 2016;” EAB interviews and analysis.
A Crowded Marketplace
8.3%
17.4%
26.6%
47.7%
TopCompetitor
Competitors#2 - #5
Competitors#6 - #20
Outside Top20
Where Admitted Students Who Did Not Deposit Went (n = 81,827)
A Long Tail of Competitors Competing in Many Markets
Different Student Segments Considering Different Clusters of Institutions
Regional Private Master’s (Illustrative)
Student Segment
Competing Options
High Ability
Private Research, PublicFlagship, Selective Liberal Arts
Engineer Regional Public, Public Research
Athlete Large University
URM HBCU or Hispanic-Serving Institution
Low income
Community College, Regional Public

©2017 EAB • All Rights Reserved • eab.com • 35049A
20
Source: U.S. Department of Education, National Center for Education Statistics, Higher Education General Information Survey (HEGIS), "Degrees and Other Formal Awards Conferred" surveys, 1970-71 through 1985-86; Integrated Postsecondary Education Data System (IPEDS), "Completions Survey" (IPEDS-C:91-99); and IPEDS Fall 2000 through Fall 2015, Completions component.
Master’s Market Crowding
But No Master’s Is a Guaranteed Success
0
100000
200000
300000
400000
500000
600000
700000
800000
Number of Master's Degrees Conferred by Year
Growth is in Specific Fields—Macro Data Obscures (Local) Opportunities
Students Focusing Elsewhere Post-Recession
1 3
2 Impact of Short-Format Credentials Still Uncertain
New Master’s Launches Remain an Attractive Strategy
Enrollment growth while space-constrained
Completion rates higher than other new offerings
Often taught by practitioners, not tenured faculty—easier to launch/sunset
New fields emerging for meeting student needs, expanding industry connections
Enrollments Can Be Up, But Credit Hours Down
4
Why the Flat Growth Data?

©2017 EAB • All Rights Reserved • eab.com • 35049A
21
Source: “Online College Students 2017,” Learning House, 2017, https://www.learninghouse.com/ocs2017/; Corey Seemiller and Meghan Grace, Generation Z goes to College (Jossey-Bass, 2016).
Online Won’t Overcome Local Demographics
Online Students Still Local
Online Student Distance from Institution1
54% 18% 20%
0-50 Miles 51-100 Miles 101+ Miles
Access to In-Person Services Valued
75%Proportion of Students Who Visited Campus or a Campus Center at Least Once During Program
To see an instructor1
To meet a study group3
To make a payment or resolve administrative issue
2
To use library, lab, computer, etc.
4
Modality is Not the Deciding Factor
Proportion of online students who, if their chosen program was not available in an online format, probably or definitely would have enrolled in a classroom program
56%
Sudden Generational Shift Unlikely
83%Percentage of Gen Z preferring face-to-face connection—despite sending 3000 text messages per day.

©2017 EAB • All Rights Reserved • eab.com • 35319C
22
University Economics Built on Subsidies from Lower Division Courses
Source: EAB interviews and analysis.
A Crumbling Foundation
Doctoral
Graduate/ Professional
Upper Division Undergraduate
Lower Division Undergraduate
Research
Student Services
Marginal Contribution
per Student Credit Hour
Public Research University
$95
$25
$5
-$250

©2017 EAB • All Rights Reserved • eab.com
23
The Hidden Implications of the Research Climb
Source: EAB interviews and analysis.
Subsidizing the High Cost of Research
Have You Calculated the Costs?
Faculty Costs
• Globally Competitive Faculty Salaries
• Faculty Startup Packages
• Increased Facilities and Equipment Costs
• Seed funds
PhD Program Costs
• Generous PhD Stipends
• Doctoral Program Subsidies
Overhead Costs
• Increased Research Administration Costs
• Unrecovered F&A Costs
Instructional Costs
• Lighter Teaching Loads
• Smaller Upper Division and Graduate Classes
Dispelling Myths About
Costs
“We’ve done a lot of work over
the past decade on understanding
what things really cost and
dispelling common
misconceptions. The biggest myth
was that research pays for itself.”
Director of Research Accounting
Large, Private Research University

©2017 EAB • All Rights Reserved • eab.com • 35319C
24
Less Vulnerable to Sharp Funding Cuts, R1s Grow Enrollment
Source: Council of Graduate Schools, “Graduate Enrollment and Degrees: 2002 to 2012”; Robin Wilson, “Cutbacks in Enrollment Redefine Graduation Education and Faculty Jobs,” Chronicle of Higher Education, March 11, 2012
Those Who Can Afford It Continue to Grow
-1.3%
1.6%
1.8%
Doctoral/Research High Research Very High Research
Most Research-Intensive Institutions
Driving Enrollment Increases
Avg. Annual Increase in Total
Graduate Enrollment, 2005-2015
Even As Overall Enrollments Rise, AAU
Institutions Quietly Prune Programs
Once-renowned English program
shrinks to 20 graduate students in
2012 from 60 in the early 1990s
Announces closure of three
departments and suspension of
four graduate programs in 2012
History department cuts
admissions in half (~20 students)
in 2012 alone
Cuts size of a number of doctoral
programs while increasing stipends
for students in 2016

©2017 EAB • All Rights Reserved • eab.com
25
Long-Term Threats to Doctoral Education
Cracks in the Foundation
Who will pay the high cost of doctoral programs?
• Federal Funding: Cuts to R&D impact doctoral opportunities
• State Funding: Increased prioritization of undergraduate education
• Competing on Support: Competitive graduate student support packages more important than ever
• Perverse Labor Market Incentives: Less expensive to hire postdocs/ adjuncts than RAs or TAs
• Less Tolerance for Subsidies: Critics charge that research increases cost of education
Why are doctoral outcomes still so poor?
• Completion Still Problematic: Limited improvement to completion and time-to-degree from large-scale outcomes initiatives
• Employment Prospects Worsening: Placement rates fall to 20-year lows, esp. for tenure-track jobs
• Endless “Apprenticeships”: Postdocs stints become standard across multiple disciplines
• Difficult to Establish Research: Funding competition hardest for early career researchers
• Weak Support Services: Lack of career preparation and advising for PhDs

©2016 The Advisory Board Company • eab.com
26
Data-Informed Decision Making
• Common data definitions
• Easy access to critical data
• Evidence-based decision process
• New metrics for tracking and demonstrating the impact of the university
• Individually, regionally, nationally, and globally
• Large, targeted investments
• Selective disinvestment
• Activity-based budget models
• New research areas
• New academic programs
• New technologies
• New ventures
• Among students and faculty
• Across universities
• With corporations and foundations
• With governments at home and abroad
Adapting to a Rapidly Changing Environment
Source: EAB interviews and analysis
Five Core Competencies for the Next Decade
Collaboration Opportunity Identification
Value Communication
Resource Allocation