Embed Size (px)
Citation preview

The Future of the Electric & Gas Industry
Bob Bellemare, P.E.
CEO
Energy Insurance Mutual’s
Risk Managers Information MeetingFebruary 24, 2004
2
© Copyright 2004 UtiliPoint International, Inc.. All rights reserved.
Rate of Change is Accelerating
3
© Copyright 2004 UtiliPoint International, Inc.. All rights reserved.
Agenda
The Basics Generation/Fuels Wires Corporate & Regulatory New Technologies
Industry Basics
Unique Characteristics

5
© Copyright 2004 UtiliPoint International, Inc.. All rights reserved.
Characteristics
Real-time product Lack of substitute products Long construction times - over 2 years The laws of physics can not be changed –
electrons are no respecters of political, state, or regulatory boundaries
6
© Copyright 2004 UtiliPoint International, Inc.. All rights reserved.
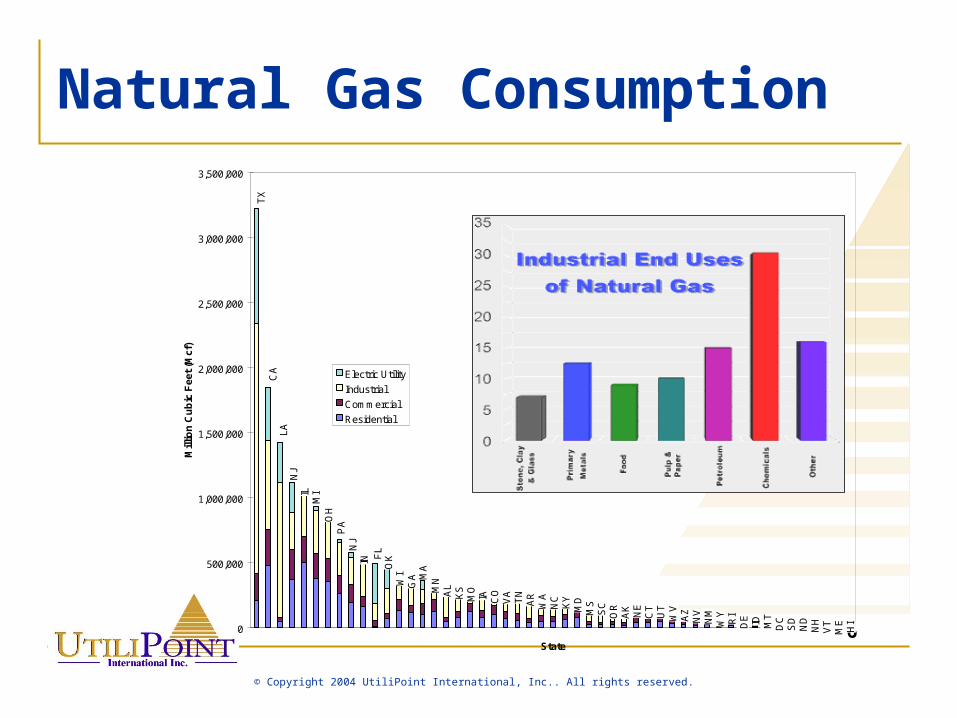
Natural Gas Consumption
IL
OH
IN
WI
GA
MN
AL
KS
MO
IA CO
VA
TN
AR
WA
NC
KY
MD
MS
SC
OR
AK
NE
CT
UT
WV
AZ
NV
NM
WY
RI
DE ID MT
DC
SD
ND
NH
VT
ME
HI
FL
OK
MA
NJ
LA
CA
TX
PA
NJ
MI
0
500,000
1,000,000
1,500,000
2,000,000
2,500,000
3,000,000
3,500,000
State
Mill
ion
Cu
bic
Fee
t (M
cf)
Electric Utility
Industrial
Commercial
Residential
7
© Copyright 2004 UtiliPoint International, Inc.. All rights reserved.
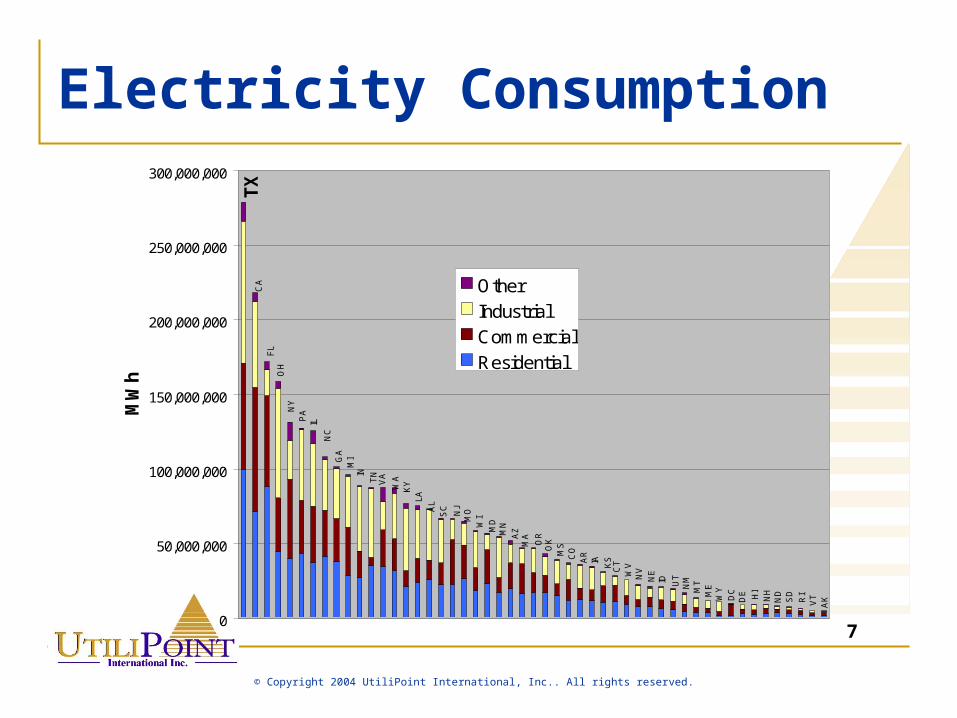
Electricity Consumption
AKVTRI
SD
ND
NHHI
DEDC
WYMEMTNMUTIDNENVW
VCTKSIAA
RCOMSOKO
R
MAA
ZMNMDW
IMONJ
SCA
LLA
WA
KYV
ATNIN
MIG
AN
C
PAN
YO
HF
L
TX
IL
CA
0
50,000,000
100,000,000
150,000,000
200,000,000
250,000,000
300,000,000
MW
h
Other
Industrial
Commercial
Residential
8
© Copyright 2004 UtiliPoint International, Inc.. All rights reserved.
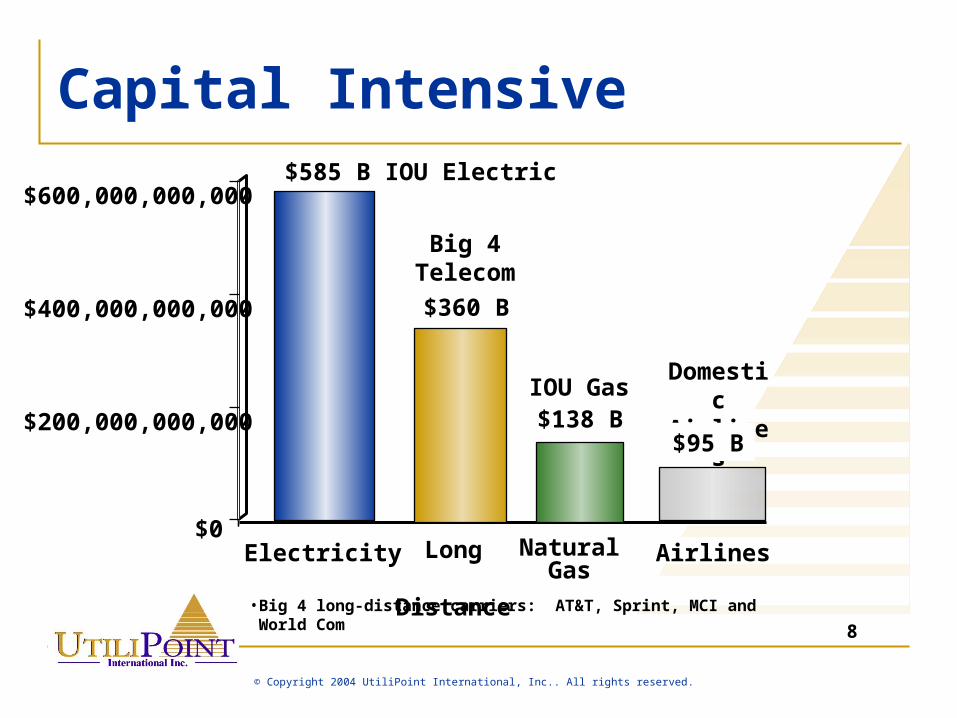
Capital Intensive
•Big 4 long-distance carriers: AT&T, Sprint, MCI and World Com
$200,000,000,000
$400,000,000,000
$600,000,000,000
Electricity Airlines$0
IOU Electric
Domestic
Airlines
$585 B
Long
Distance
Big 4Telecom
$360 B
NaturalGas
IOU Gas$138
B $95 B
9
© Copyright 2004 UtiliPoint International, Inc.. All rights reserved.
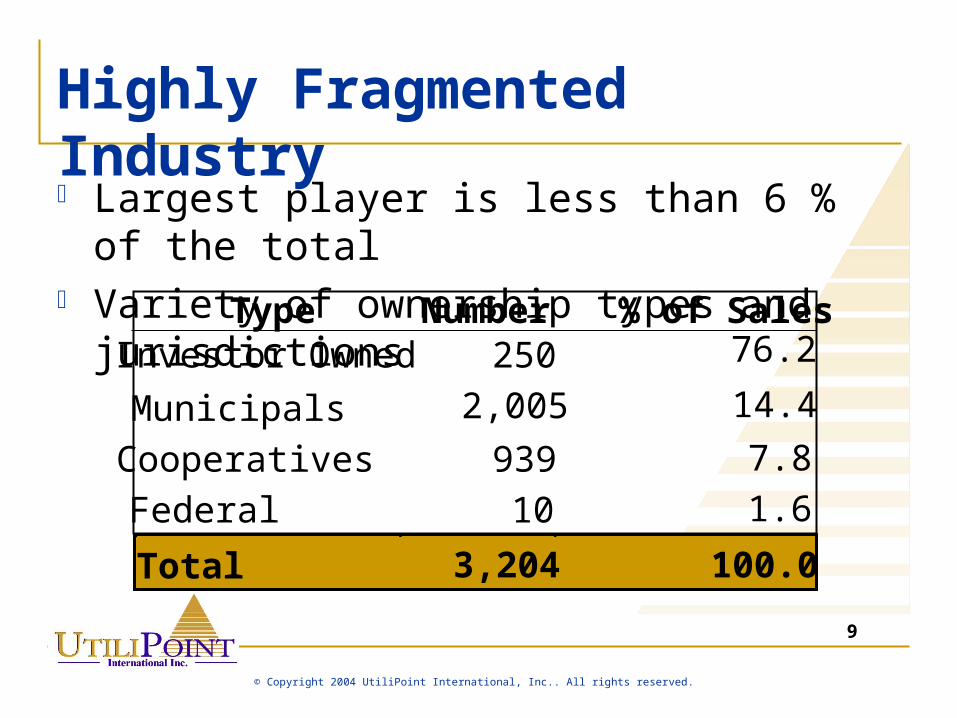
Highly Fragmented Industry Largest player is less than 6 % of the total Variety of ownership types and jurisdictions
Type Number % of SalesInvestor Owned 250
Municipals 2,005
Cooperatives 939
Federal 10
Total 3,204
76.2
14.4
7.8
1.6
100.0
10
© Copyright 2004 UtiliPoint International, Inc.. All rights reserved.
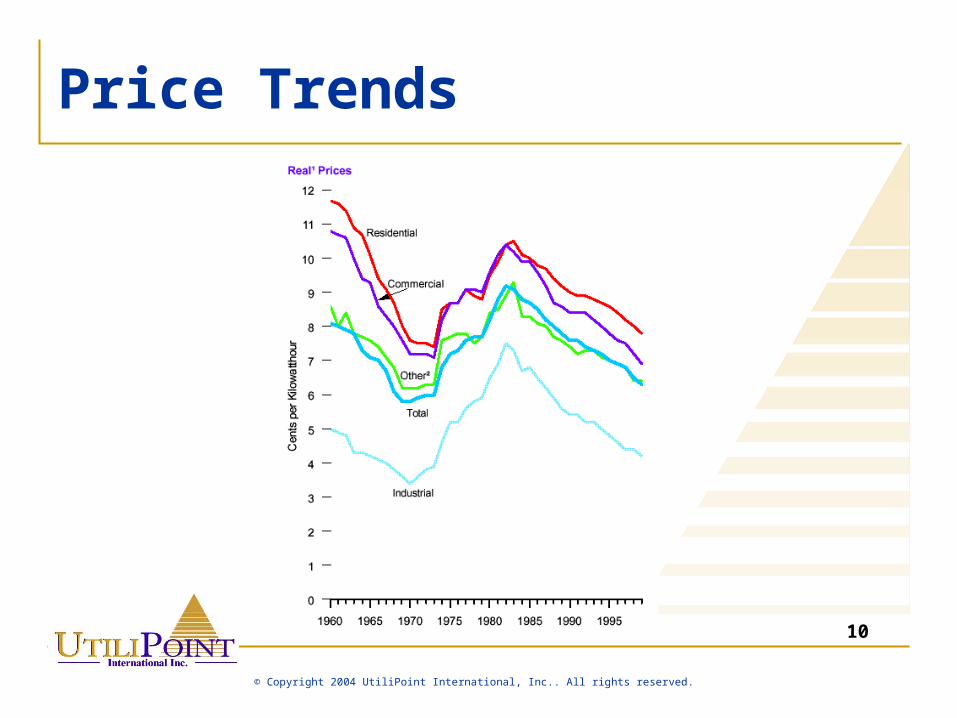
Price Trends
11
© Copyright 2004 UtiliPoint International, Inc.. All rights reserved.
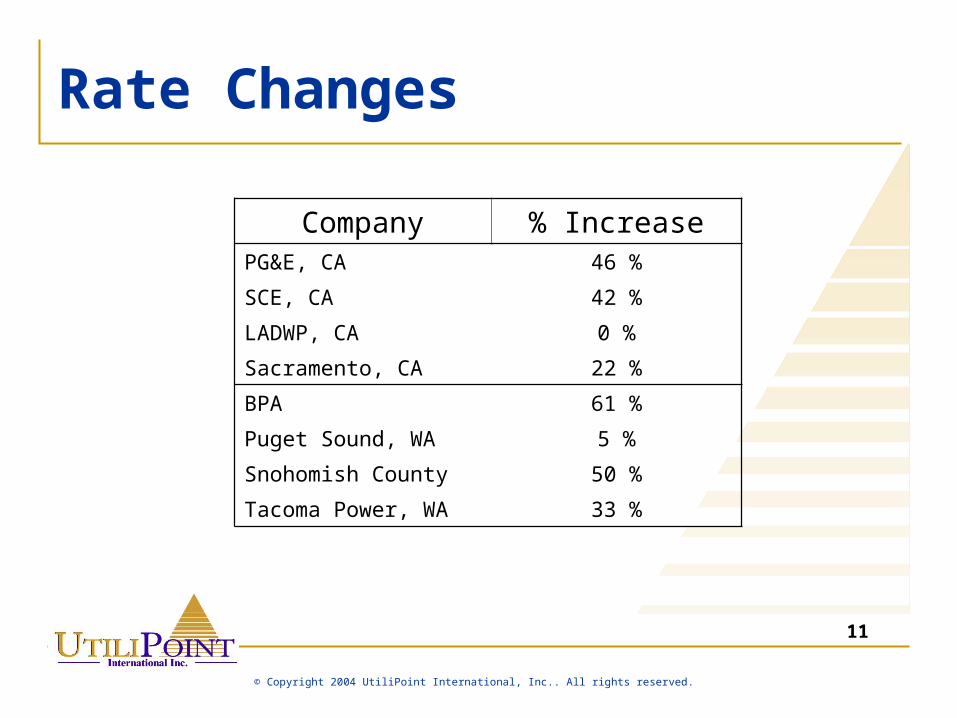
Rate Changes
Company % IncreasePG&E, CA 46 %
SCE, CA 42 %
LADWP, CA 0 %
Sacramento, CA 22 %
BPA 61 %
Puget Sound, WA 5 %
Snohomish County 50 %
Tacoma Power, WA 33 %
12
© Copyright 2004 UtiliPoint International, Inc.. All rights reserved.
Risk Myth
“This is not a risky business”
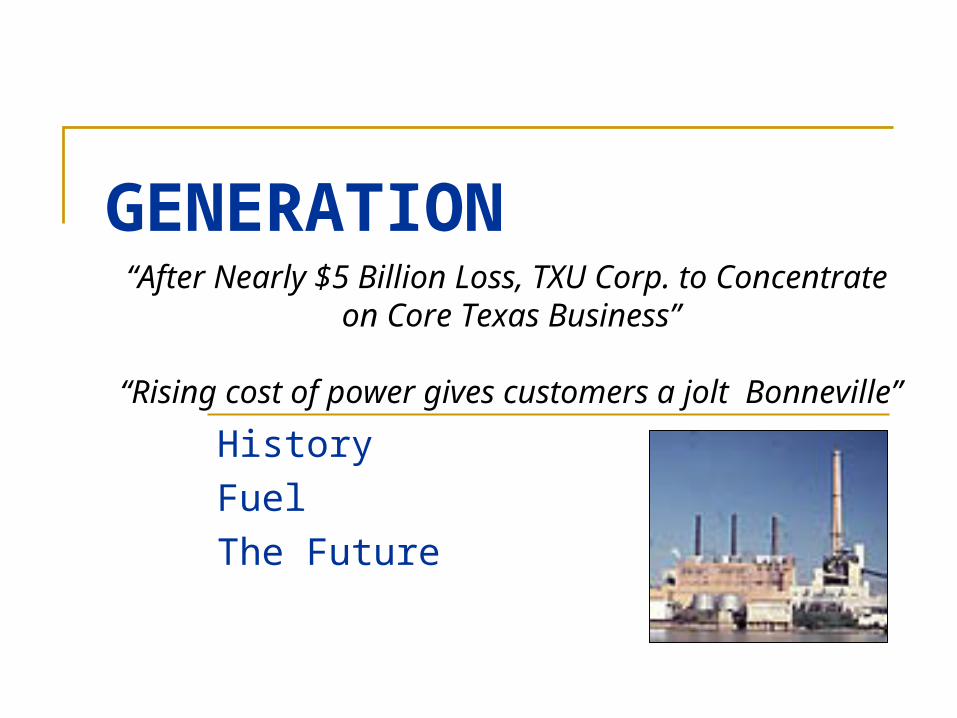
GENERATION
History
Fuel
The Future
“After Nearly $5 Billion Loss, TXU Corp. to Concentrate
on Core Texas Business”
“Rising cost of power gives customers a jolt Bonneville”
14
© Copyright 2004 UtiliPoint International, Inc.. All rights reserved.
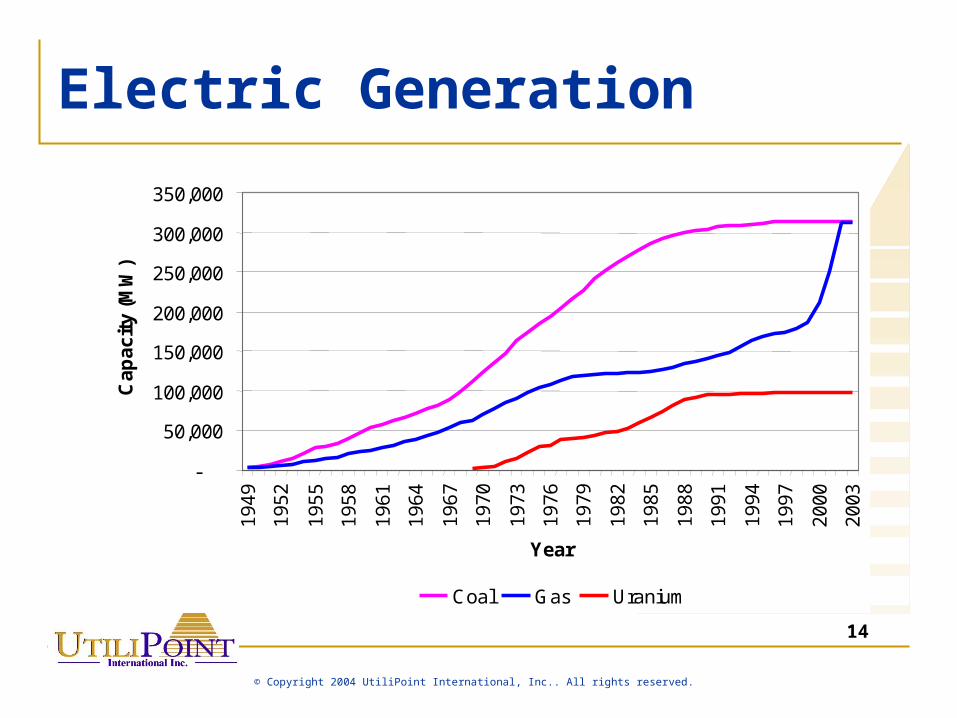
-
50,000
100,000
150,000
200,000
250,000
300,000
350,000
19
49
19
52
19
55
19
58
19
61
19
64
19
67
19
70
19
73
19
76
19
79
19
82
19
85
19
88
19
91
19
94
19
97
20
00
20
03
Year
Ca
pa
cit
y (M
W)
Coal Gas Uranium
-
50,000
100,000
150,000
200,000
250,000
300,000
350,000
19
49
19
52
19
55
19
58
19
61
19
64
19
67
19
70
19
73
19
76
19
79
19
82
19
85
19
88
19
91
19
94
19
97
20
00
20
03
Year
Ca
pa
cit
y (M
W)
Coal Gas Uranium
Electric Generation
15
© Copyright 2004 UtiliPoint International, Inc.. All rights reserved.
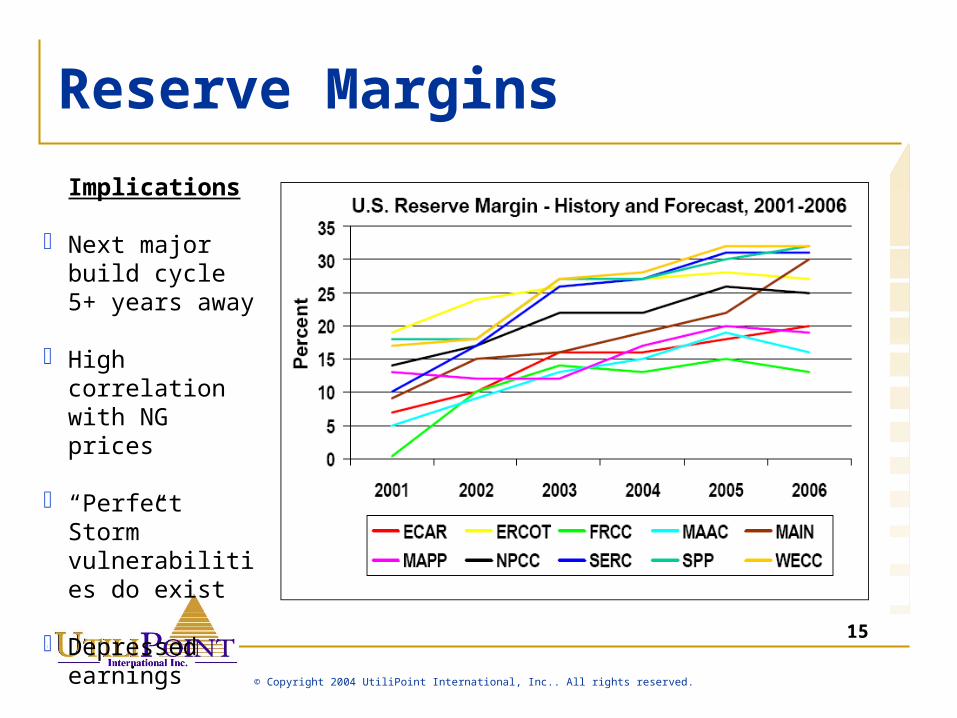
Reserve Margins
Implications
Next major build cycle 5+ years away
High correlation with NG prices
“Perfect Storm” vulnerabilities do exist
Depressed earnings
16
© Copyright 2004 UtiliPoint International, Inc.. All rights reserved.
The Debt Problem
Sector has lost $100 B in market capitalization in the past 2 years
Energy merchants face nearly $65 billion of loans coming due by the end of 2010, says S&P. That’s out of a total debt burden of $125 billion
Divestitures and write-downs likely to continue
17
© Copyright 2004 UtiliPoint International, Inc.. All rights reserved.
The Challenge
U.S. peak demand exceeds 760,000 MW
Could increase more than 370,000 MW in next 20 years (2 percent per year increase)
Natural gas has been the fuel of choice, but….
18
© Copyright 2004 UtiliPoint International, Inc.. All rights reserved.
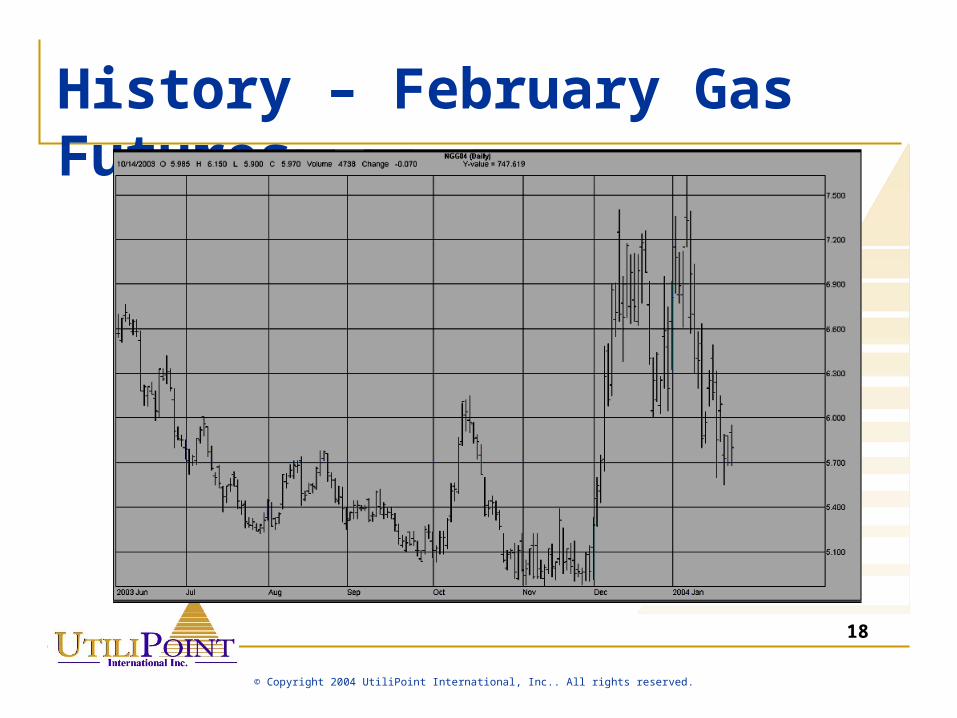
History – February Gas Futures
19
© Copyright 2004 UtiliPoint International, Inc.. All rights reserved.
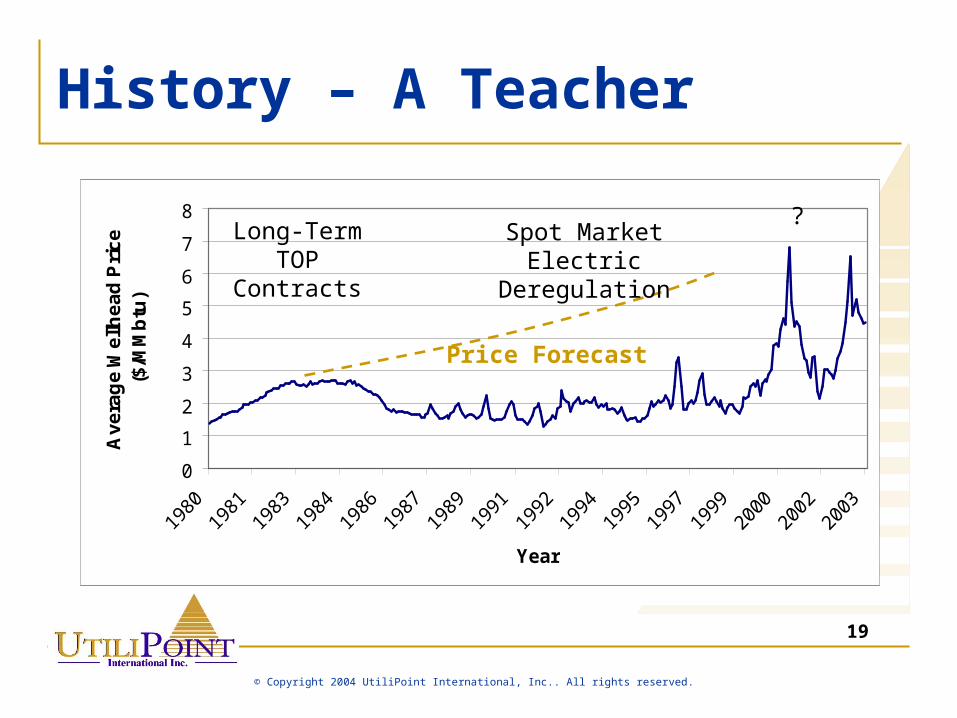
History – A Teacher
0
1
2
3
4
5
6
7
8
Year
Av
era
ge
We
llhe
ad
Pri
ce
($
/MM
btu
)
Long-TermTOP
Contracts
Spot MarketElectric
Deregulation
?
Price Forecast
20
© Copyright 2004 UtiliPoint International, Inc.. All rights reserved.
Causes of Volatility
Weather Storage Little incentive to hedge Production boom/bust New supplies more costly Market manipulation
21
© Copyright 2004 UtiliPoint International, Inc.. All rights reserved.
Market Manipulation
Round-Trip Trades Withholding Production Serious Financial Impacts
BPA, Sierra-Pacific, Seattle, PG&E
Regardless: High prices will occur during
times of constraints
22
© Copyright 2004 UtiliPoint International, Inc.. All rights reserved.
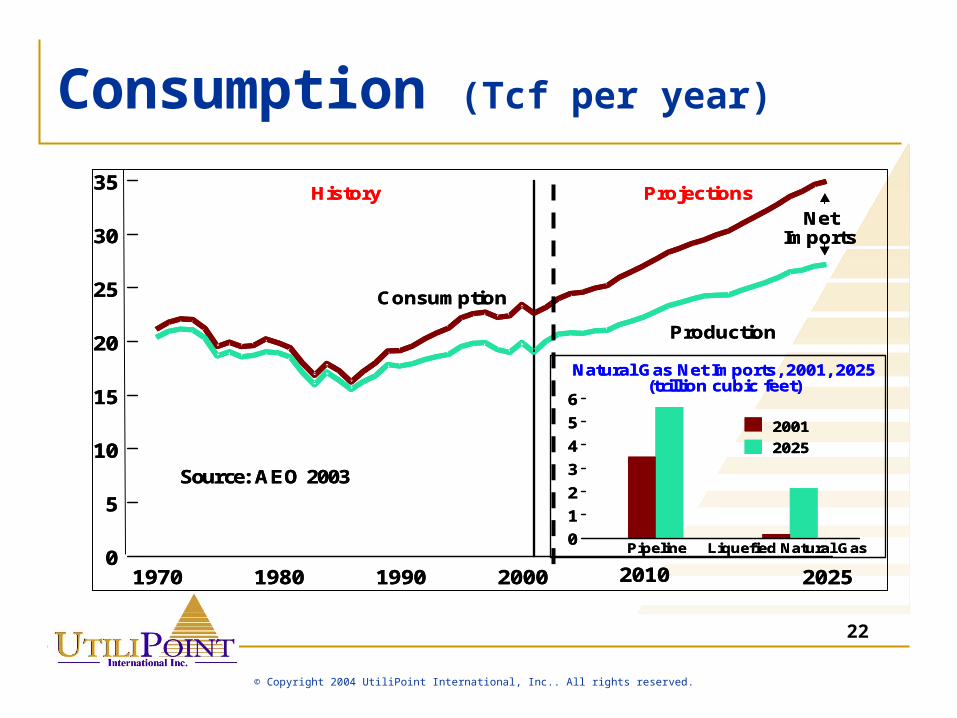
1970 1980 1990 2000 2010 20250
5
10
15
20
25
30
35 History Projections
Production
NetImports
Consumption
Pipeline Liquefied Natural Gas0
1
2
3
4
5
6
2001
2025
Natural Gas Net Imports, 2001, 2025(trillion cubic feet)
Source: AEO 2003
1970 1980 1990 2000 2010 20250
5
10
15
20
25
30
35 History Projections
Production
NetImports
Consumption
Pipeline Liquefied Natural Gas0
1
2
3
4
5
6
2001
2025
Natural Gas Net Imports, 2001, 2025(trillion cubic feet)
Source: AEO 2003
Consumption (Tcf per year)
23
© Copyright 2004 UtiliPoint International, Inc.. All rights reserved.
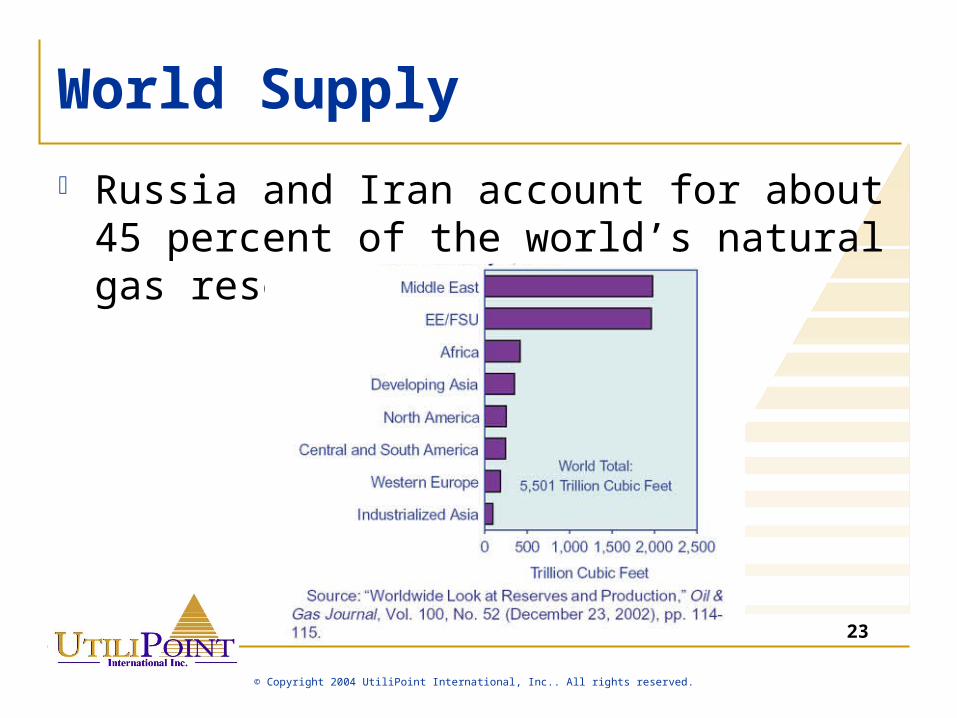
World Supply
Russia and Iran account for about 45 percent of the world’s natural gas reserves
24
© Copyright 2004 UtiliPoint International, Inc.. All rights reserved.
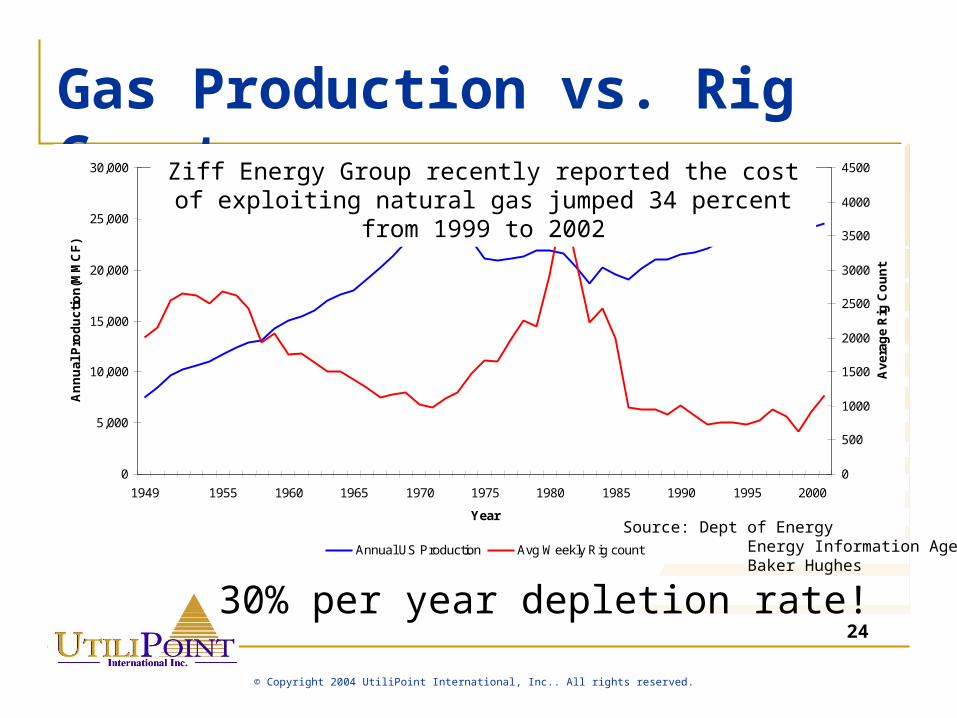
Gas Production vs. Rig Count
0
5,000
10,000
15,000
20,000
25,000
30,000
1949 1955 1960 1965 1970 1975 1980 1985 1990 1995 2000
Year
An
nu
al P
rod
uct
ion
(MM
CF
)
0
500
1000
1500
2000
2500
3000
3500
4000
4500
Av
erag
e R
ig C
ou
nt
Annual US Production Avg Weekly Rig count
0
5,000
10,000
15,000
20,000
25,000
30,000
1949 1955 1960 1965 1970 1975 1980
0
5,000
10,000
15,000
20,000
25,000
30,000
1949 1955 1960 1965 1970 1975 1980 1985 1990 1995 2000
Year
An
nu
al P
rod
uct
ion
(MM
CF
)
0
500
1000
1500
2000
2500
3000
3500
4000
4500
Av
erag
e R
ig C
ou
nt
Annual US Production Avg Weekly Rig count
Source: Dept of Energy Energy Information Agency Baker Hughes
Ziff Energy Group recently reported the cost of exploiting natural gas jumped 34 percent from 1999 to 2002
30% per year depletion rate!
25
© Copyright 2004 UtiliPoint International, Inc.. All rights reserved.
Forecast
“An Unsustainable Trend is Exactly That”
26
© Copyright 2004 UtiliPoint International, Inc.. All rights reserved.
The Coming “Train Wreck”
27
© Copyright 2004 UtiliPoint International, Inc.. All rights reserved.
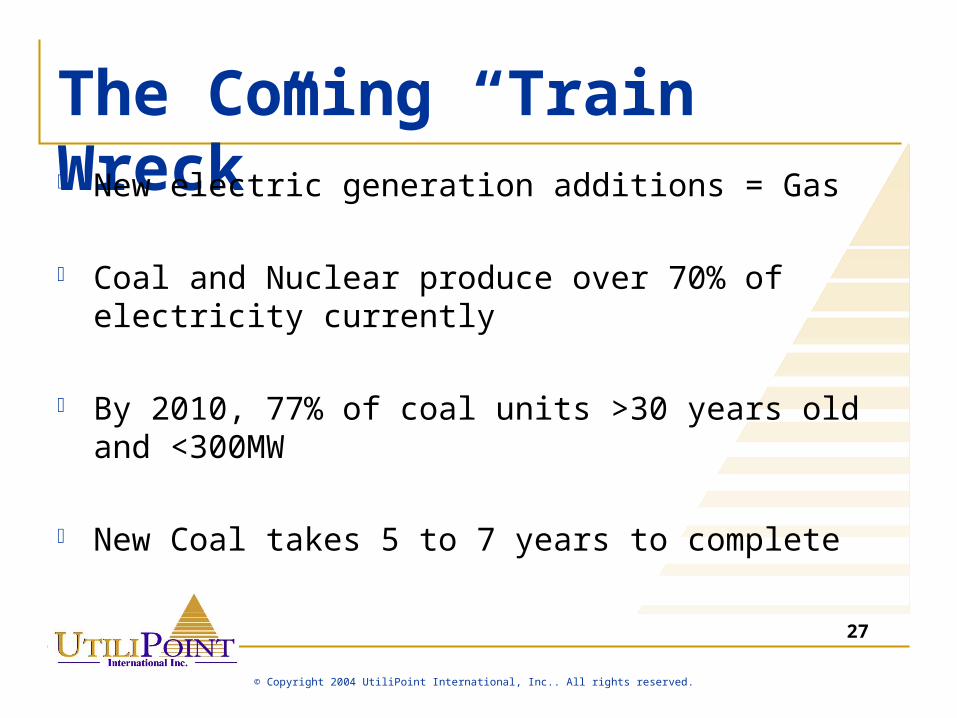
The Coming “Train Wreck” New electric generation additions = Gas
Coal and Nuclear produce over 70% of electricity currently
By 2010, 77% of coal units >30 years old and <300MW
New Coal takes 5 to 7 years to complete
28
© Copyright 2004 UtiliPoint International, Inc.. All rights reserved.
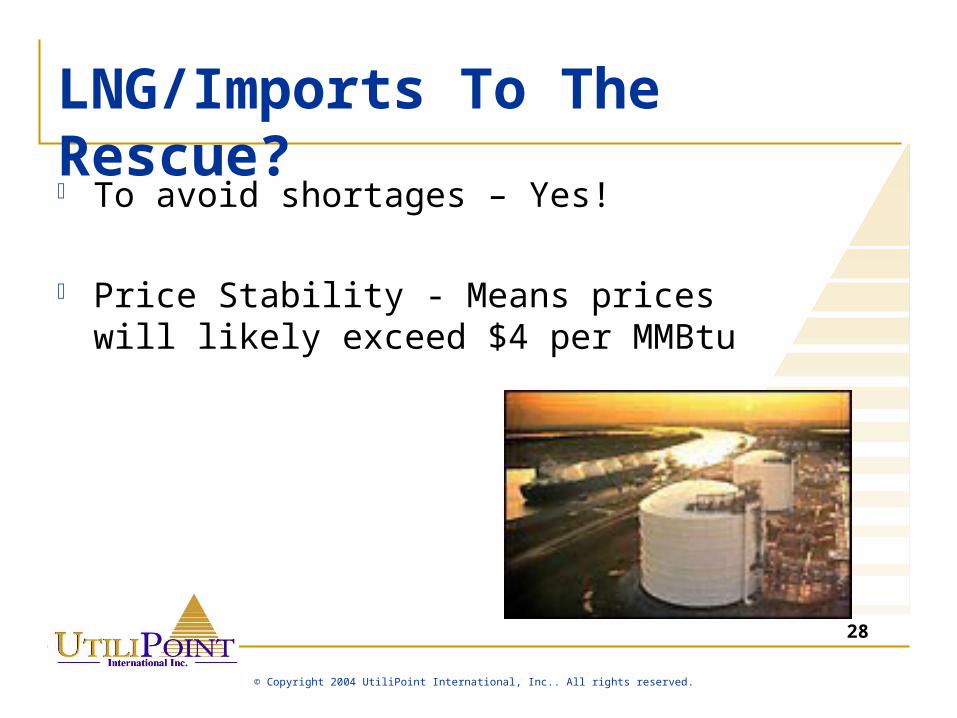
LNG/Imports To The Rescue? To avoid shortages – Yes!
Price Stability - Means prices will likely exceed $4 per MMBtu
29
© Copyright 2004 UtiliPoint International, Inc.. All rights reserved.
Renewables
Renewable programs on the increase Many utilities have implemented green
pricing programs States with portfolio requirements
AZ, CA, CT, HI, IL, IA, ME, MA, MN, NV, NJ, NM, PA, TX, WI
CA: September 12, 2002. Established the most aggressive renewable portfolio standard in the country by requiring utilities to purchase 20 percent of their electricity from renewable sources by 2017.
30
© Copyright 2004 UtiliPoint International, Inc.. All rights reserved.
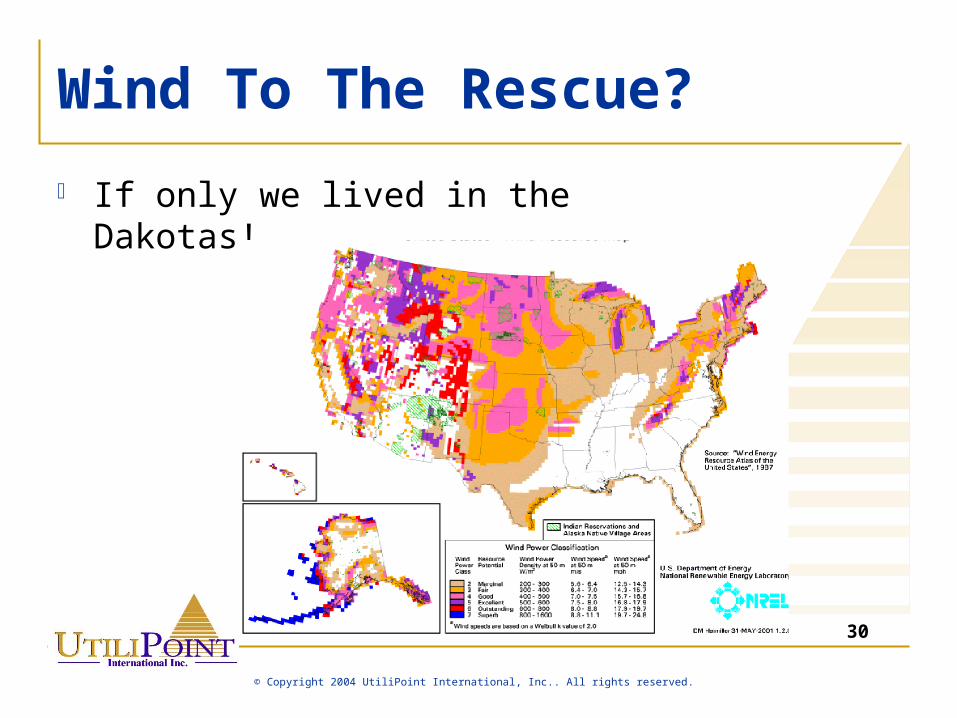
Wind To The Rescue?
If only we lived in the Dakotas!
31
© Copyright 2004 UtiliPoint International, Inc.. All rights reserved.
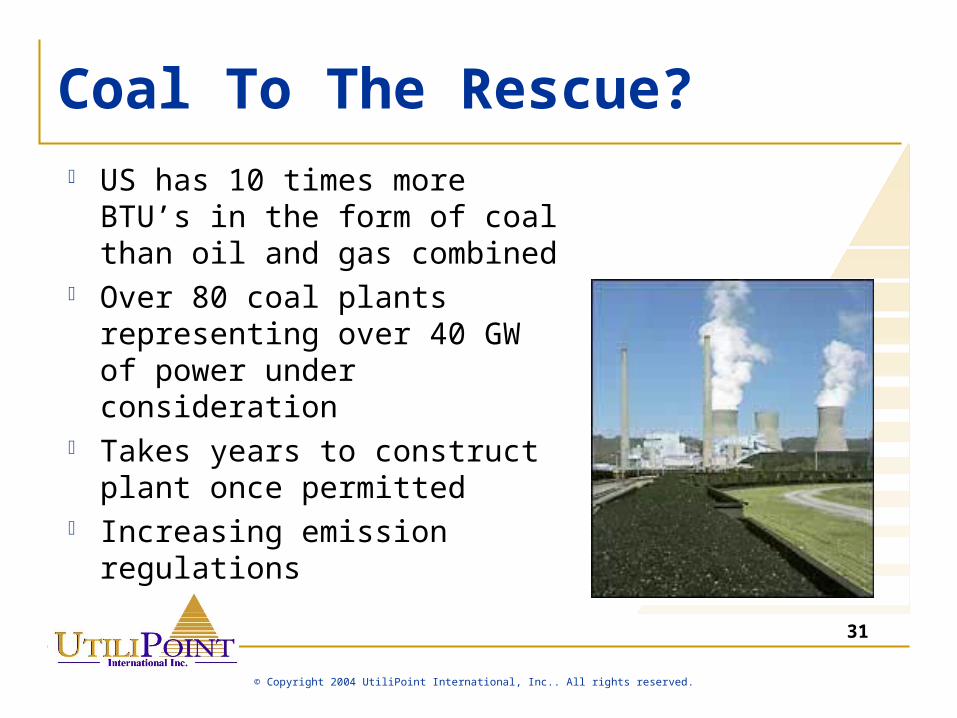
Coal To The Rescue? US has 10 times more BTU’s
in the form of coal than oil and gas combined
Over 80 coal plants representing over 40 GW of power under consideration
Takes years to construct plant once permitted
Increasing emission regulations
32
© Copyright 2004 UtiliPoint International, Inc.. All rights reserved.
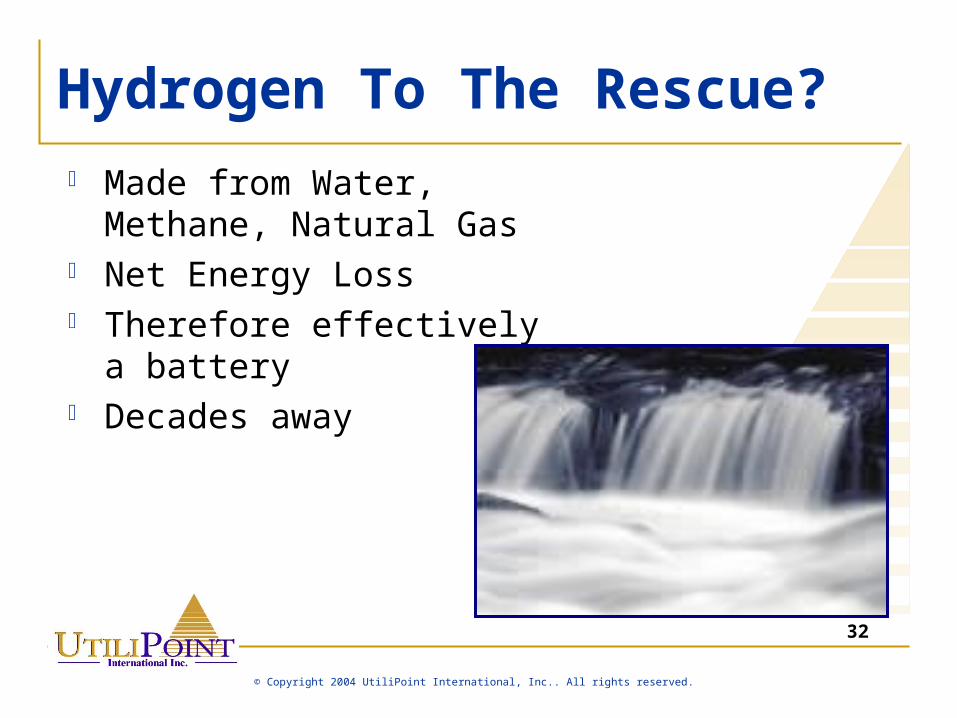
Hydrogen To The Rescue? Made from Water, Methane,
Natural Gas Net Energy Loss Therefore effectively a
battery Decades away
33
© Copyright 2004 UtiliPoint International, Inc.. All rights reserved.
Risk Myth
“We are not trading.”
Wires
Siting & Investment
Standard Market Design
“AEP receives final approval for Wyoming-Jacksons Ferry 765-kV project”
“Senate energy panel head criticizes FERC rules”
35
© Copyright 2004 UtiliPoint International, Inc.. All rights reserved.
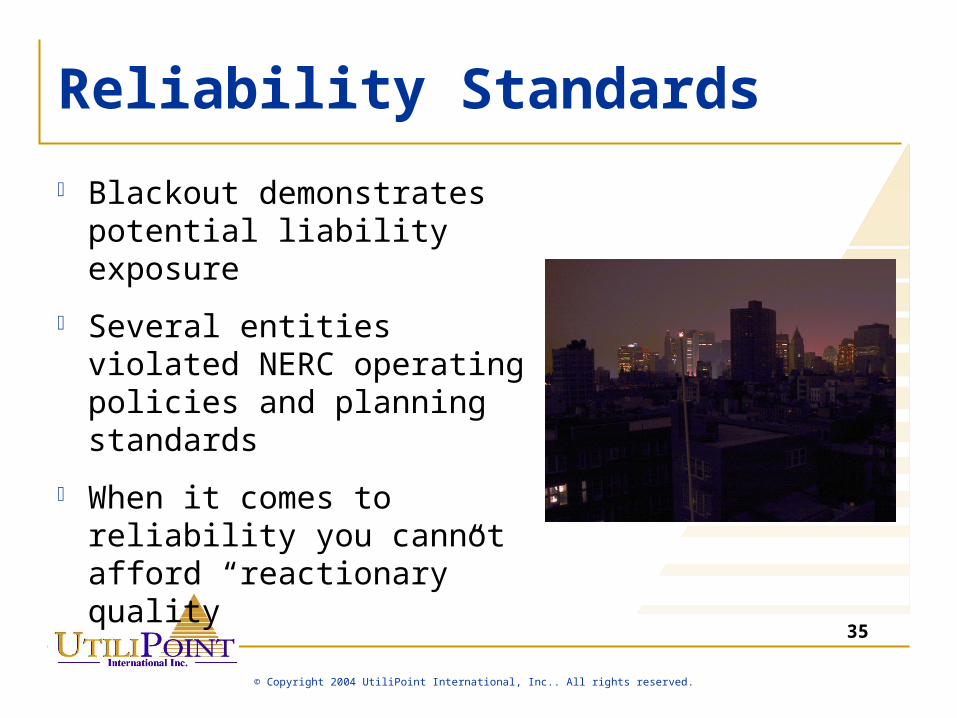
Reliability Standards
Blackout demonstrates potential liability exposure
Several entities violated NERC operating policies and planning standards
When it comes to reliability you cannot afford “reactionary” quality
36
© Copyright 2004 UtiliPoint International, Inc.. All rights reserved.
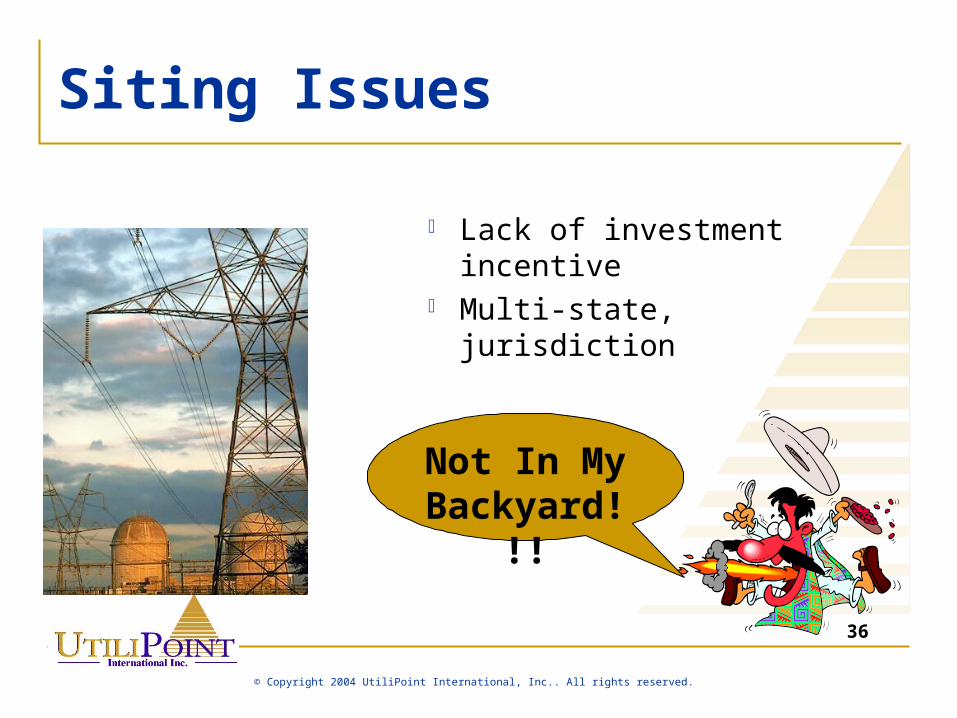
Siting Issues
Lack of investment incentive
Multi-state, jurisdiction
Not In My Backyard!!
!
37
© Copyright 2004 UtiliPoint International, Inc.. All rights reserved.
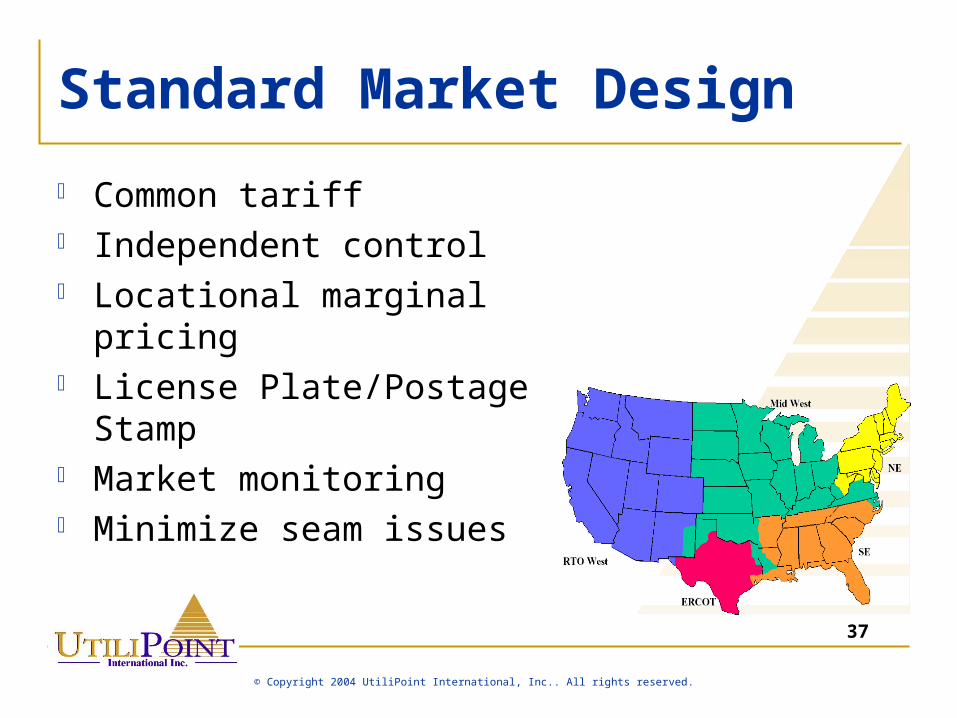
Standard Market Design
Common tariff Independent control Locational marginal pricing License Plate/Postage Stamp Market monitoring Minimize seam issues
38
© Copyright 2004 UtiliPoint International, Inc.. All rights reserved.
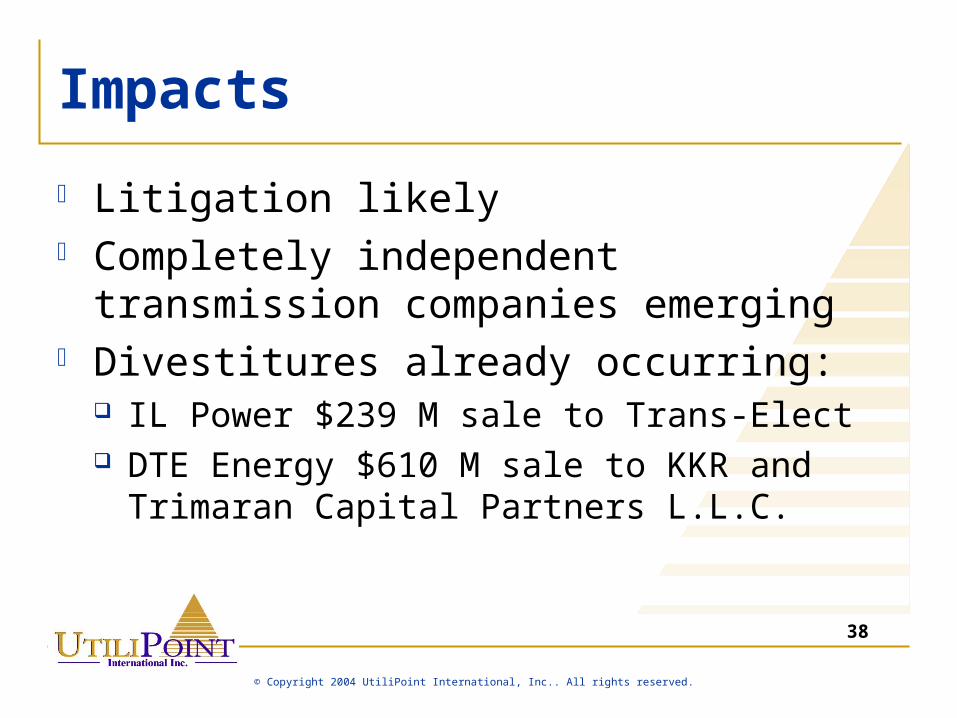
Impacts
Litigation likely Completely independent transmission
companies emerging Divestitures already occurring:
IL Power $239 M sale to Trans-Elect DTE Energy $610 M sale to KKR and Trimaran
Capital Partners L.L.C.
39
© Copyright 2004 UtiliPoint International, Inc.. All rights reserved.
Risk Myth
“We can milk the wires business.”
Corporate and Regulatory
M&A
Energy Policy
41
© Copyright 2004 UtiliPoint International, Inc.. All rights reserved.
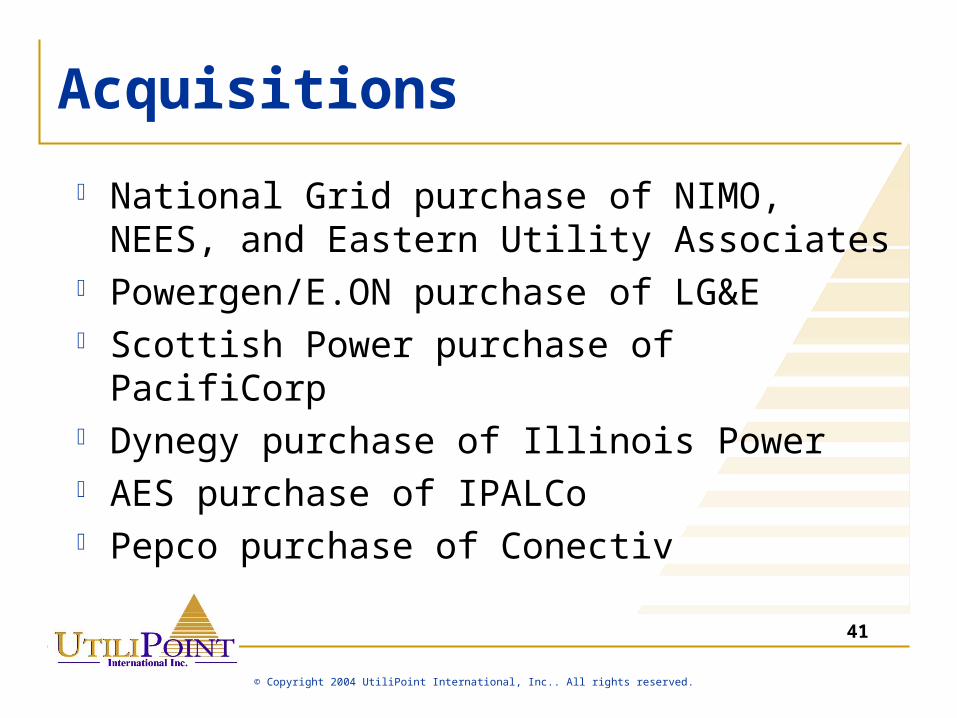
Acquisitions
National Grid purchase of NIMO, NEES, and Eastern Utility Associates
Powergen/E.ON purchase of LG&E Scottish Power purchase of PacifiCorp Dynegy purchase of Illinois Power AES purchase of IPALCo Pepco purchase of Conectiv
42
© Copyright 2004 UtiliPoint International, Inc.. All rights reserved.
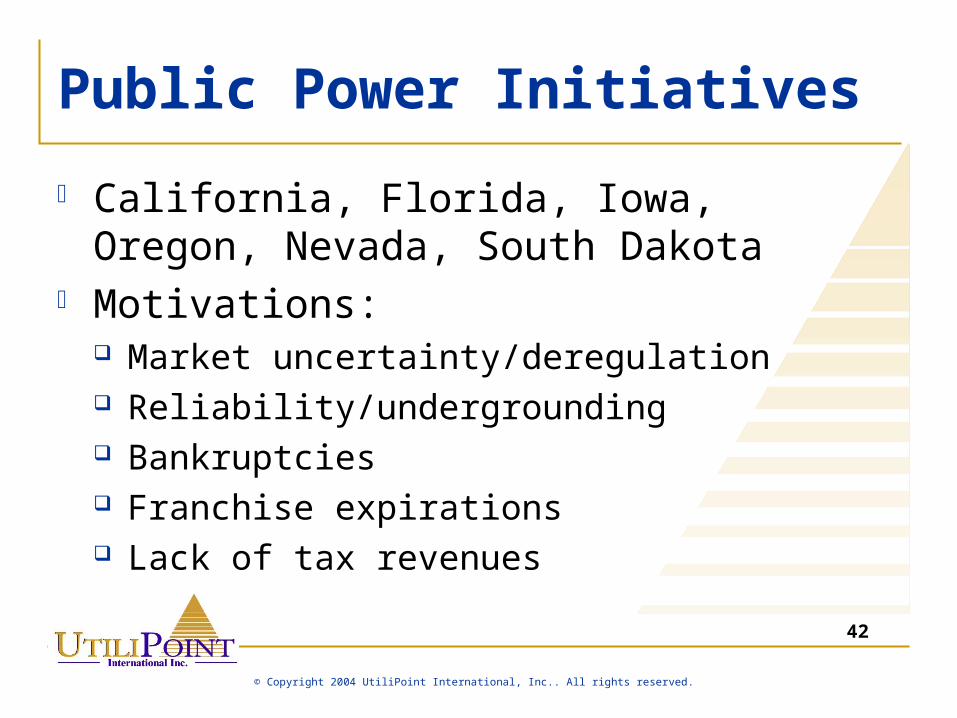
Public Power Initiatives
California, Florida, Iowa, Oregon, Nevada, South Dakota
Motivations: Market uncertainty/deregulation Reliability/undergrounding Bankruptcies Franchise expirations Lack of tax revenues
43
© Copyright 2004 UtiliPoint International, Inc.. All rights reserved.
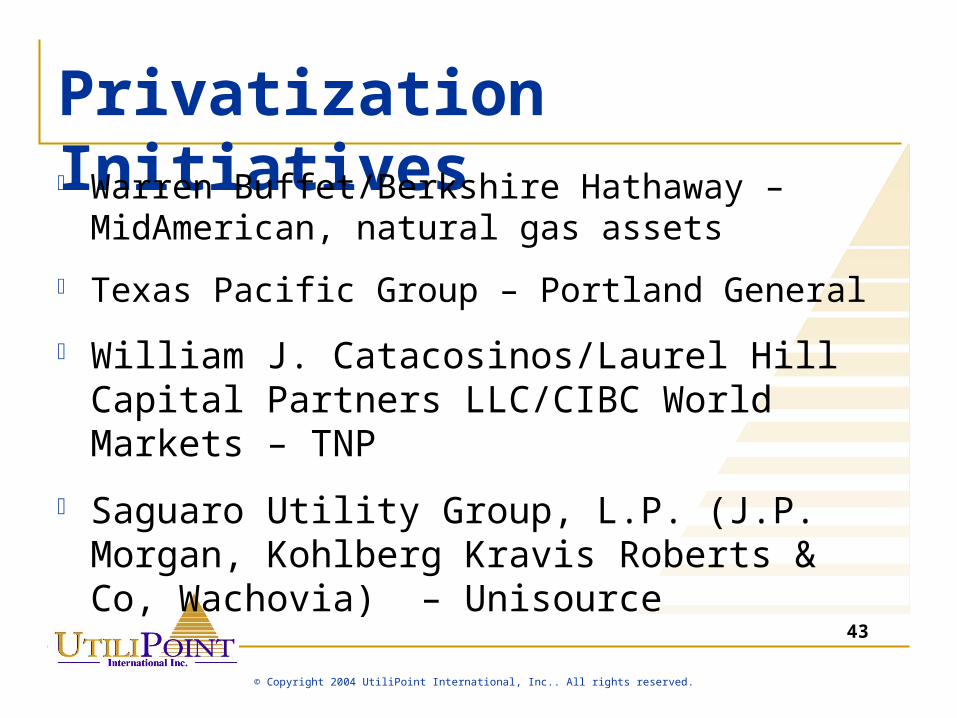
Privatization Initiatives Warren Buffet/Berkshire Hathaway –
MidAmerican, natural gas assets
Texas Pacific Group – Portland General
William J. Catacosinos/Laurel Hill Capital Partners LLC/CIBC World Markets – TNP
Saguaro Utility Group, L.P. (J.P. Morgan, Kohlberg Kravis Roberts & Co, Wachovia) – Unisource
44
© Copyright 2004 UtiliPoint International, Inc.. All rights reserved.
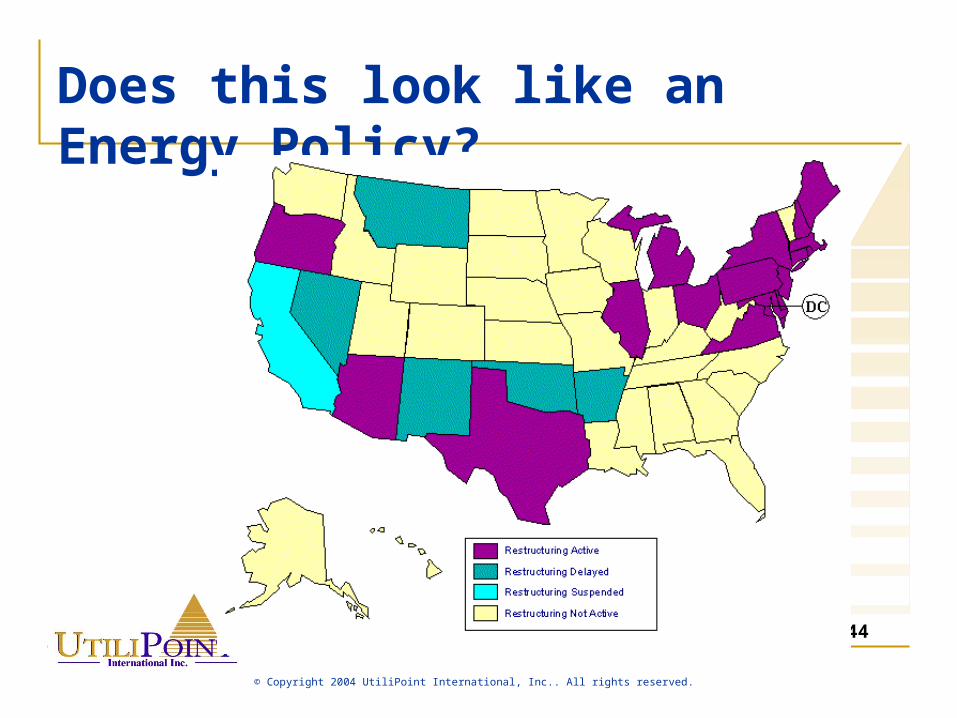
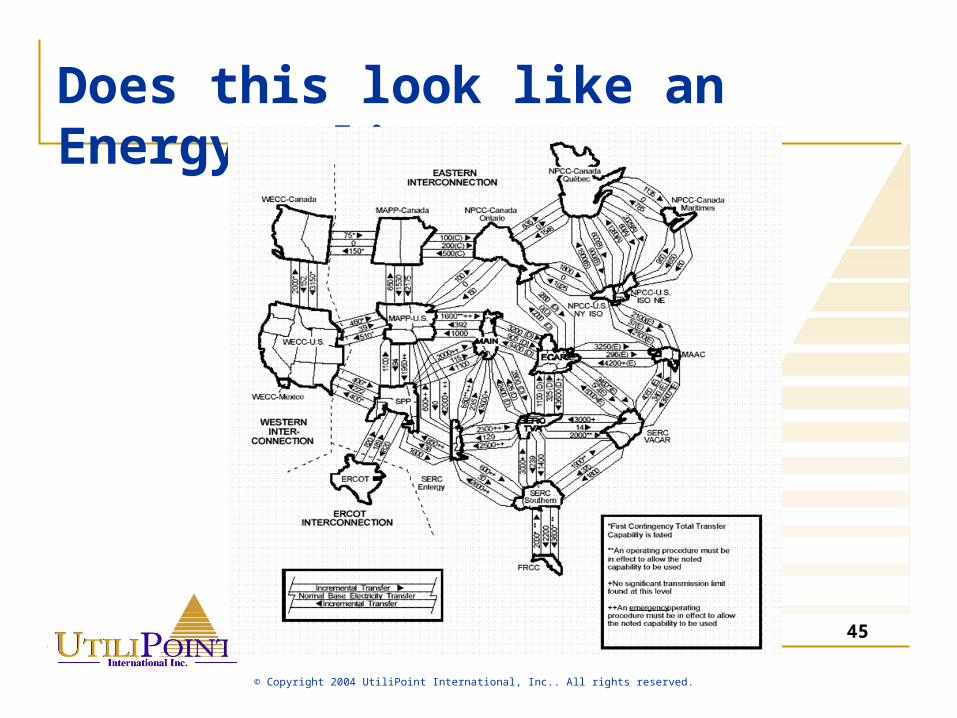
Does this look like an Energy Policy?
45
© Copyright 2004 UtiliPoint International, Inc.. All rights reserved.
Does this look like an Energy Policy?
New Technologies
Energy Storage
Fuel Cells
Other
47
© Copyright 2004 UtiliPoint International, Inc.. All rights reserved.
Venture Capital
R&D expenditures for 20 leading utilities have decreased by 62% from 1995 to 2000
Same utilities increased their subsidiary investments from $4.5 B (1995) to $15 B (2000)
Venture capital in the industry increased from near zero 6 years ago to over $1 billion in 2001
Venture capitalists in 2002 curtailed their fund raising for future investments to a 21-year low. While 108 venture capital funds raised a total of $6.9 billion during 2002, another 26 funds refunded $5 billion to investors.
48
© Copyright 2004 UtiliPoint International, Inc.. All rights reserved.
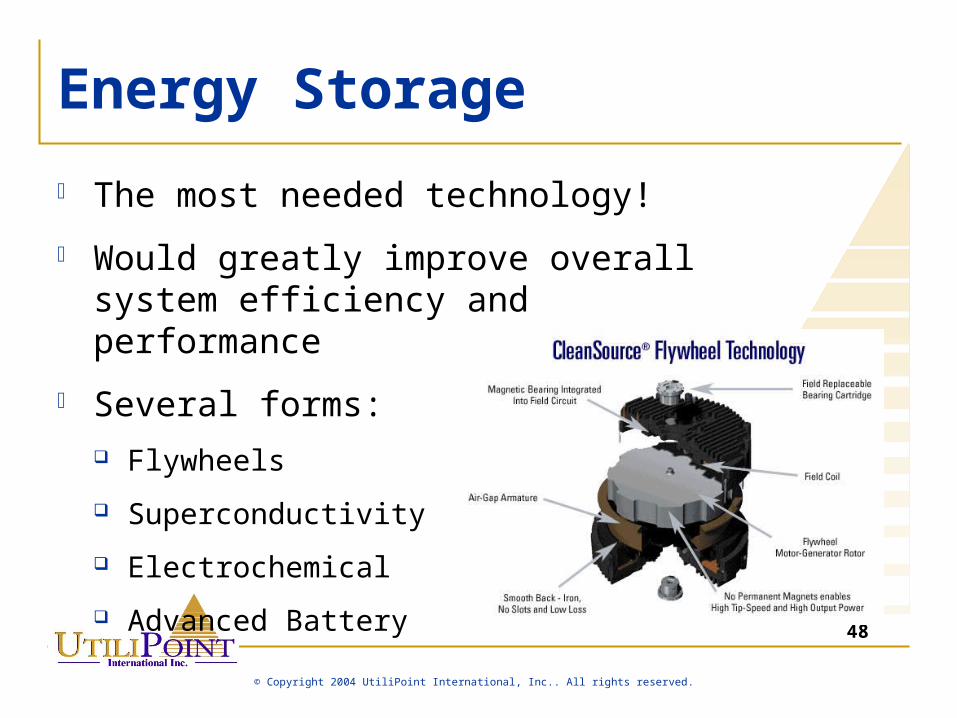
Energy Storage
The most needed technology!
Would greatly improve overall system efficiency and performance
Several forms: Flywheels
Superconductivity
Electrochemical
Advanced Battery
49
© Copyright 2004 UtiliPoint International, Inc.. All rights reserved.
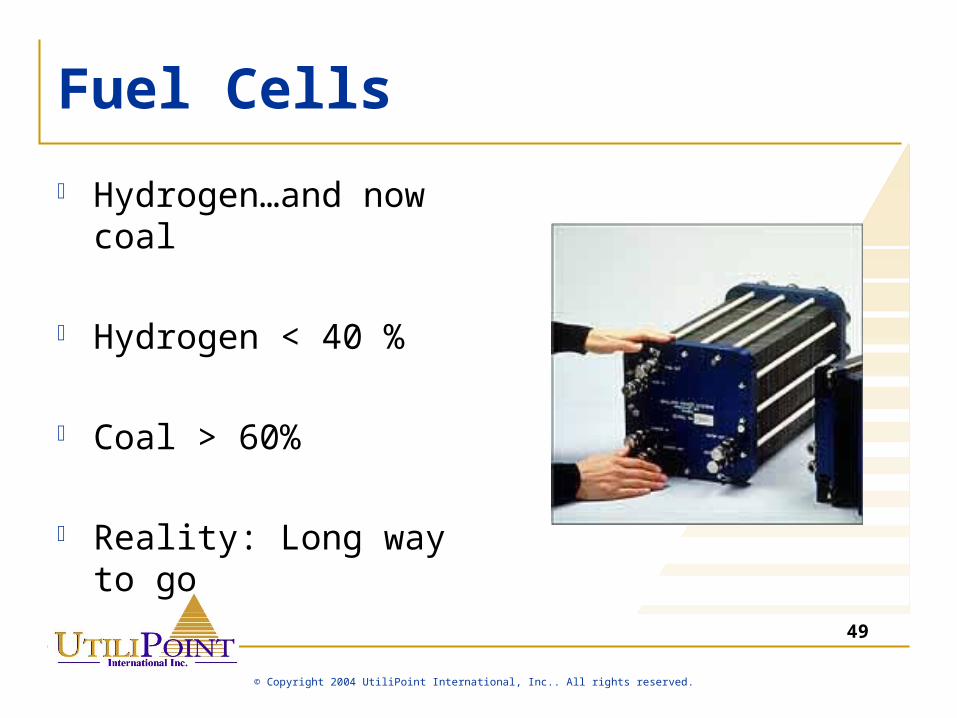
Fuel Cells
Hydrogen…and now coal
Hydrogen < 40 %
Coal > 60%
Reality: Long way to go
50
© Copyright 2004 UtiliPoint International, Inc.. All rights reserved.
Makes Industry Better
Coal Gasification Clean Coal Pebble Bed Nuclear Reactor FACTS devices Advance metering and data
acquisition/management Power line carrier
51
© Copyright 2004 UtiliPoint International, Inc.. All rights reserved.
Risk Myth
“This technology will revolutionize the business in 2 years”
52
© Copyright 2004 UtiliPoint International, Inc.. All rights reserved.
Things we now know not to be true… $50+ billion in total assets, 5 million or
more customers to survive Deregulation means lower rates Asset-lite in trading Diversification is required We rely primarily on the spot market
53
© Copyright 2004 UtiliPoint International, Inc.. All rights reserved.
Things we must commit to: Reliability is job one Doing what’s in the public and customer
interest is ultimately in the best interest of the company
Avoid speculation and diversifying into non-core areas

54
© Copyright 2004 UtiliPoint International, Inc.. All rights reserved.
55
© Copyright 2004 UtiliPoint International, Inc.. All rights reserved.
Contact Information
Bob Bellemare
505.244.7612