Embed Size (px)
Citation preview
2017 Annual Report Summary
THE GB LONGER SEMI-TRAILER TRIAL
Summer 2018
2
THE
GB
LS
T TR
IAL
– 20
17 A
NN
UA
L R
EP
OR
T S
UM
MA
RY “Making substantial inroads to the
decarbonisation of road freight requires innovation in both vehicle performance and logistics…The single most effective change in the short term is use of higher capacity vehicles.”
Professor David Cebon, University of Cambridge, Director for Sustainable Road Freight in Logistics Report 2017, Freight Transport Association (p79)
CH. 1
© Risk Solutions 2018
This document summarises the latest findings from the trial of a new type of heavy goods vehicle trailer – the longer semi-trailer. The full results can be found in the 2017 Annual Report produced by the independent trial evaluators (Risk Solutions) for the Department for Transport (DfT). The full version is available on the GOV.UK website, search 'Longer semi-trailer trial 2017'.
References to the relevant section of the main report are provided in the blue boxes throughout this summary report.
3
RIS
K S
OLU
TIO
NS
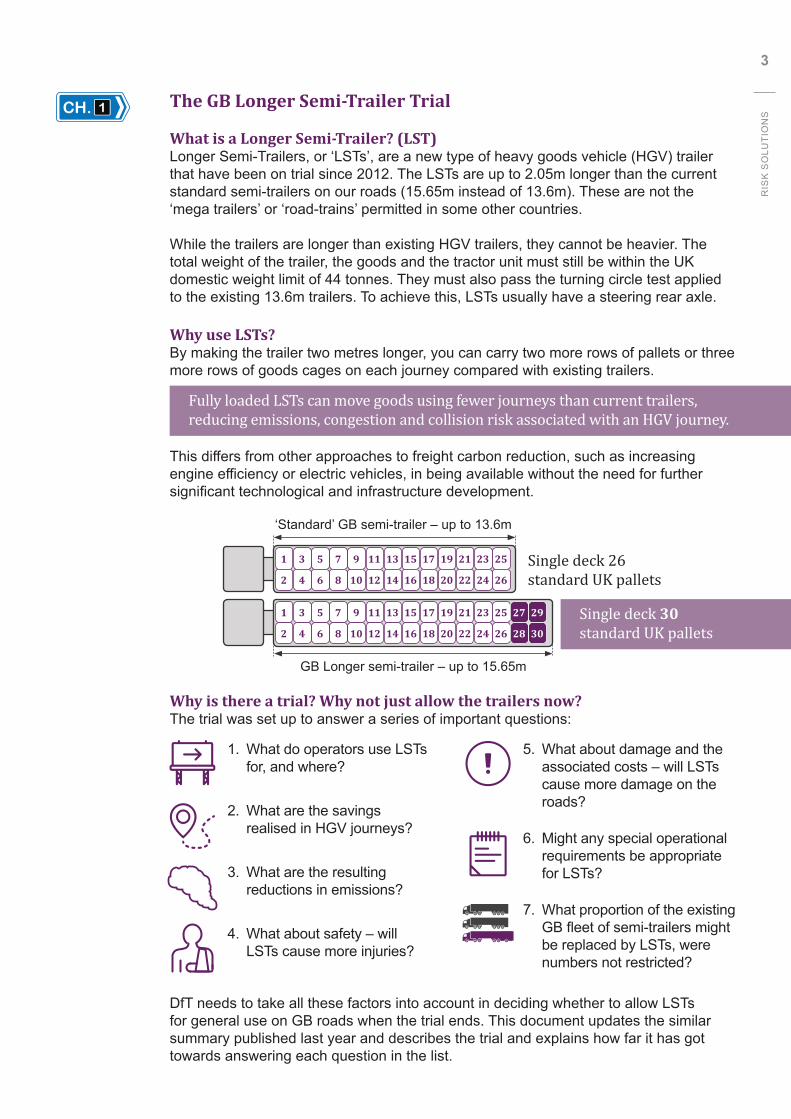
1. What do operators use LSTs for, and where?
2. What are the savings realised in HGV journeys?
3. What are the resulting reductions in emissions?
4. What about safety – will LSTs cause more injuries?
5. What about damage and the associated costs – will LSTs cause more damage on the roads?
6. Might any special operational requirements be appropriate for LSTs?
7. What proportion of the existing GB fleet of semi-trailers might be replaced by LSTs, were numbers not restricted?
CH. 1 The GB Longer Semi-Trailer Trial
What is a Longer Semi-Trailer? (LST) Longer Semi-Trailers, or ‘LSTs’, are a new type of heavy goods vehicle (HGV) trailer that have been on trial since 2012. The LSTs are up to 2.05m longer than the current standard semi-trailers on our roads (15.65m instead of 13.6m). These are not the ‘mega trailers’ or ‘road-trains’ permitted in some other countries.
While the trailers are longer than existing HGV trailers, they cannot be heavier. The total weight of the trailer, the goods and the tractor unit must still be within the UK domestic weight limit of 44 tonnes. They must also pass the turning circle test applied to the existing 13.6m trailers. To achieve this, LSTs usually have a steering rear axle.
Why use LSTs?By making the trailer two metres longer, you can carry two more rows of pallets or three more rows of goods cages on each journey compared with existing trailers.
Fully loaded LSTs can move goods using fewer journeys than current trailers, reducing emissions, congestion and collision risk associated with an HGV journey.
This differs from other approaches to freight carbon reduction, such as increasing engine efficiency or electric vehicles, in being available without the need for further significant technological and infrastructure development.
DfT needs to take all these factors into account in deciding whether to allow LSTs for general use on GB roads when the trial ends. This document updates the similar summary published last year and describes the trial and explains how far it has got towards answering each question in the list.
Why is there a trial? Why not just allow the trailers now?The trial was set up to answer a series of important questions:
1 3 5 7 9 11 13 15 17 19 21 23 25
2 4 6 8 10 12 14 16 18 20 22 24 26
1 3 5 7 9 11 13 15 17 19 21 23 25
2 4 6 8 10 12 14 16 18 20 22 24 26
27 29
28 30
Single deck 26 standard UK pallets
Single deck 30 standard UK pallets
‘Standard’ GB semi-trailer – up to 13.6m
GB Longer semi-trailer – up to 15.65m
4
THE
GB
LS
T TR
IAL
– 20
17 A
NN
UA
L R
EP
OR
T S
UM
MA
RY CH. 1&2 What does the trial involve?
DfT began the trial in January 2012, when it established an initial allocation of 1,800 trailers for operators wishing to take part, with an initial trial period of ten years.
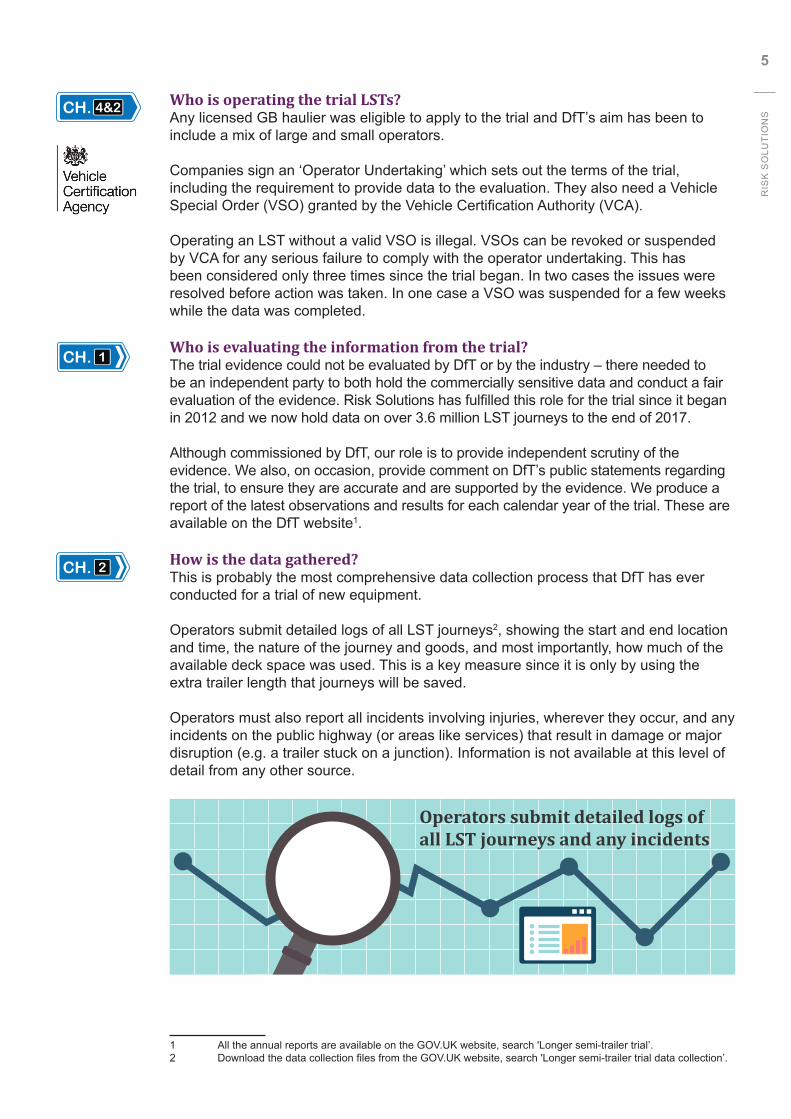
In April 2017, the government increased the number of LSTs by an additional 1,000 and agreed to extend the trial by five years. At the time of writing, around 2,600 LST allocations had been granted.
All participants must submit a detailed set of data on every journey their LSTs make and on all incidents (not just those resulting in injury) they are involved in on the public road or in public areas (such as services).
Operators participate voluntarily, at their own cost and risk. As this is a trial, there is no guarantee that LSTs will be permitted on the road beyond the end of the trial period. The trial was set to run for a long period to ensure it generated enough data to answer the questions above and to allow participants to recover the costs of investing in LSTs.
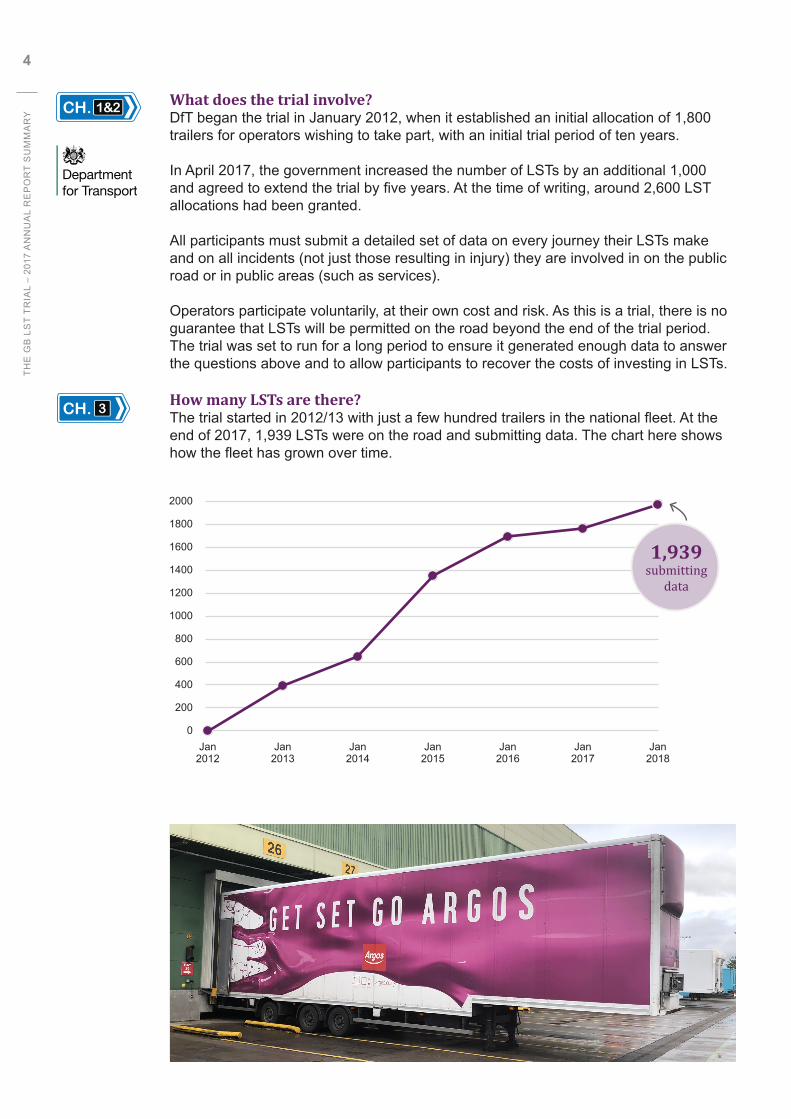
How many LSTs are there?The trial started in 2012/13 with just a few hundred trailers in the national fleet. At the end of 2017, 1,939 LSTs were on the road and submitting data. The chart here shows how the fleet has grown over time.
CH. 3
2000
1800
1600
1400
1200
1000
800
600
400
200
0Jan
2012Jan
2013Jan
2014Jan
2015Jan
2016Jan
2017
1,939submitting
data
Jan2018
5
RIS
K S
OLU
TIO
NS
Who is operating the trial LSTs?Any licensed GB haulier was eligible to apply to the trial and DfT’s aim has been to include a mix of large and small operators.
Companies sign an ‘Operator Undertaking’ which sets out the terms of the trial, including the requirement to provide data to the evaluation. They also need a Vehicle Special Order (VSO) granted by the Vehicle Certification Authority (VCA).
Operating an LST without a valid VSO is illegal. VSOs can be revoked or suspended by VCA for any serious failure to comply with the operator undertaking. This has been considered only three times since the trial began. In two cases the issues were resolved before action was taken. In one case a VSO was suspended for a few weeks while the data was completed.
Who is evaluating the information from the trial?The trial evidence could not be evaluated by DfT or by the industry – there needed to be an independent party to both hold the commercially sensitive data and conduct a fair evaluation of the evidence. Risk Solutions has fulfilled this role for the trial since it began in 2012 and we now hold data on over 3.6 million LST journeys to the end of 2017.
Although commissioned by DfT, our role is to provide independent scrutiny of the evidence. We also, on occasion, provide comment on DfT’s public statements regarding the trial, to ensure they are accurate and are supported by the evidence. We produce a report of the latest observations and results for each calendar year of the trial. These are available on the DfT website1.
How is the data gathered?This is probably the most comprehensive data collection process that DfT has ever conducted for a trial of new equipment.
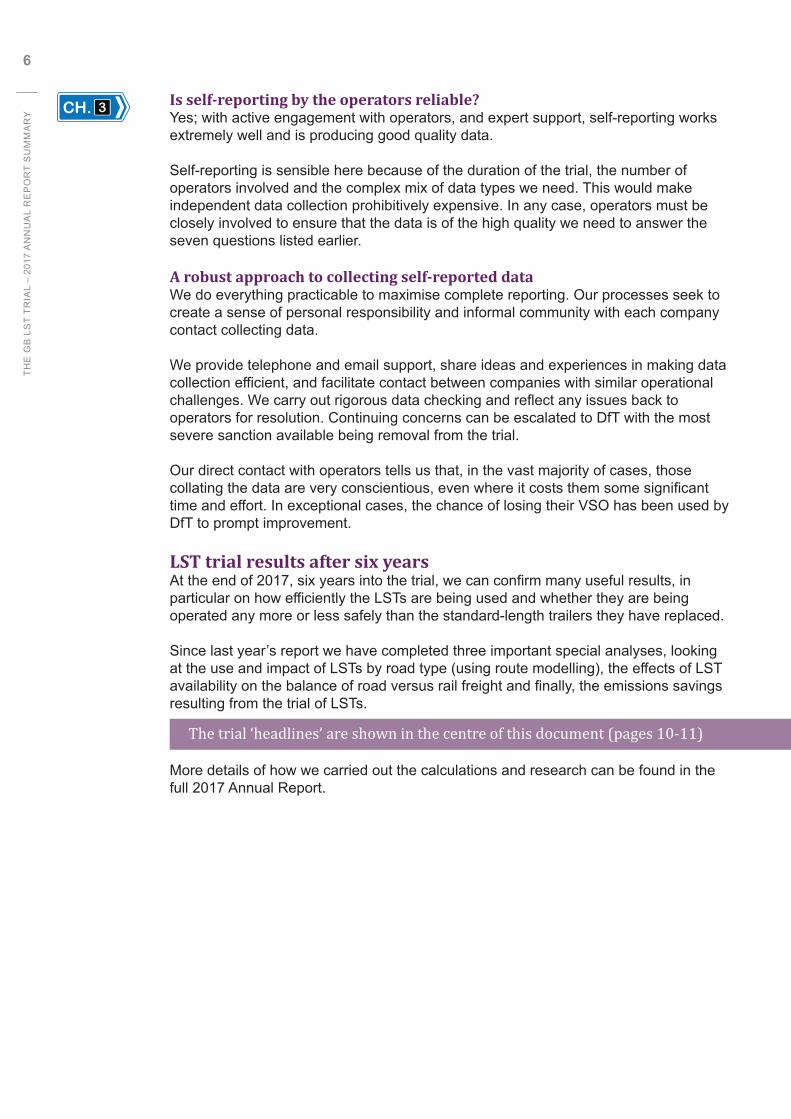
Operators submit detailed logs of all LST journeys2, showing the start and end location and time, the nature of the journey and goods, and most importantly, how much of the available deck space was used. This is a key measure since it is only by using the extra trailer length that journeys will be saved.
Operators must also report all incidents involving injuries, wherever they occur, and any incidents on the public highway (or areas like services) that result in damage or major disruption (e.g. a trailer stuck on a junction). Information is not available at this level of detail from any other source.
1 All the annual reports are available on the GOV.UK website, search 'Longer semi-trailer trial’.2 Download the data collection files from the GOV.UK website, search 'Longer semi-trailer trial data collection’.
CH. 2
CH. 1
Operators submit detailed logs of all LST journeys and any incidents
CH. 4&2
6
THE
GB
LS
T TR
IAL
– 20
17 A
NN
UA
L R
EP
OR
T S
UM
MA
RY
Is self-reporting by the operators reliable?Yes; with active engagement with operators, and expert support, self-reporting works extremely well and is producing good quality data.
Self-reporting is sensible here because of the duration of the trial, the number of operators involved and the complex mix of data types we need. This would make independent data collection prohibitively expensive. In any case, operators must be closely involved to ensure that the data is of the high quality we need to answer the seven questions listed earlier.
A robust approach to collecting self-reported dataWe do everything practicable to maximise complete reporting. Our processes seek to create a sense of personal responsibility and informal community with each company contact collecting data.
We provide telephone and email support, share ideas and experiences in making data collection efficient, and facilitate contact between companies with similar operational challenges. We carry out rigorous data checking and reflect any issues back to operators for resolution. Continuing concerns can be escalated to DfT with the most severe sanction available being removal from the trial.
Our direct contact with operators tells us that, in the vast majority of cases, those collating the data are very conscientious, even where it costs them some significant time and effort. In exceptional cases, the chance of losing their VSO has been used by DfT to prompt improvement.
LST trial results after six yearsAt the end of 2017, six years into the trial, we can confirm many useful results, in particular on how efficiently the LSTs are being used and whether they are being operated any more or less safely than the standard-length trailers they have replaced.
Since last year’s report we have completed three important special analyses, looking at the use and impact of LSTs by road type (using route modelling), the effects of LST availability on the balance of road versus rail freight and finally, the emissions savings resulting from the trial of LSTs.
The trial ‘headlines’ are shown in the centre of this document (pages 10-11)
More details of how we carried out the calculations and research can be found in the full 2017 Annual Report.
CH. 3
7
RIS
K S
OLU
TIO
NS
1. What do operators use LSTs for and where?
Nature of journeysOur trial data provides us with a lot of information about LST journeys: where they start and end, distances covered, what they are carrying and how full the trailers are.
By the end of 2017, LSTs had travelled 443 million km:• Goods carried are dominated by fast-moving consumer goods (low cost products,
sold quickly) and other cage or pallet loads• Sixty seven percent of the distance travelled was between industrial locations
(depots, distribution centres, supplier sites etc.); around 30% is to, or from, retail sites
• Trailers ran empty for 18% of the total distance travelled, much lower than the figure of around 29% for all articulated trailers3
• The trailers made maximum use of the additional length for at least 37%, and made some use for 55%, of the distance travelled.
Many operators restrict LSTs to operations where they can run heavily loaded on both outbound and return legs to make the most of what is a significant investment. In many cases, this is between major distribution centres, which will mainly be on trunk roads.
Last year we noted that we now had a good dataset on LST operational patterns and recommended that this aspect of data collection should be simplified to allow a greater focus on damage incidents.
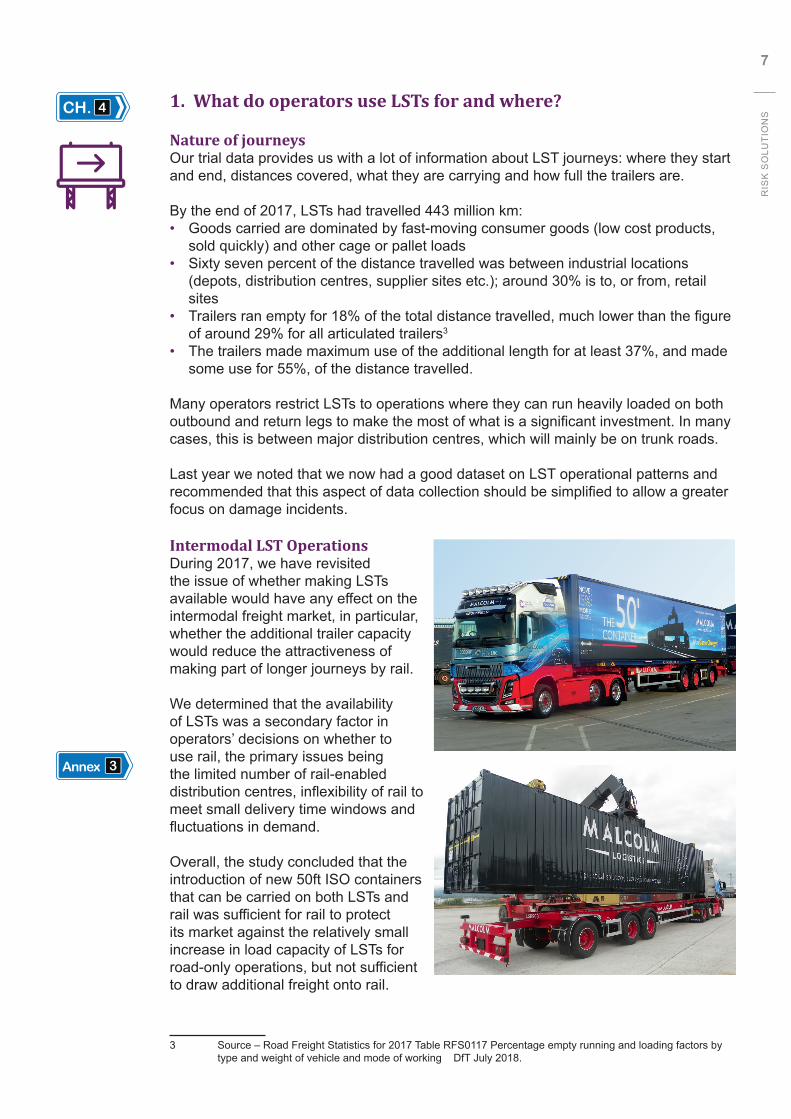
Intermodal LST OperationsDuring 2017, we have revisited the issue of whether making LSTs available would have any effect on the intermodal freight market, in particular, whether the additional trailer capacity would reduce the attractiveness of making part of longer journeys by rail.
We determined that the availability of LSTs was a secondary factor in operators’ decisions on whether to use rail, the primary issues being the limited number of rail-enabled distribution centres, inflexibility of rail to meet small delivery time windows and fluctuations in demand.
Overall, the study concluded that the introduction of new 50ft ISO containers that can be carried on both LSTs and rail was sufficient for rail to protect its market against the relatively small increase in load capacity of LSTs for road-only operations, but not sufficient to draw additional freight onto rail.
3 Source – Road Freight Statistics for 2017 Table RFS0117 Percentage empty running and loading factors by type and weight of vehicle and mode of working DfT July 2018.
CH. 4
Annex 3
8
THE
GB
LS
T TR
IAL
– 20
17 A
NN
UA
L R
EP
OR
T S
UM
MA
RY
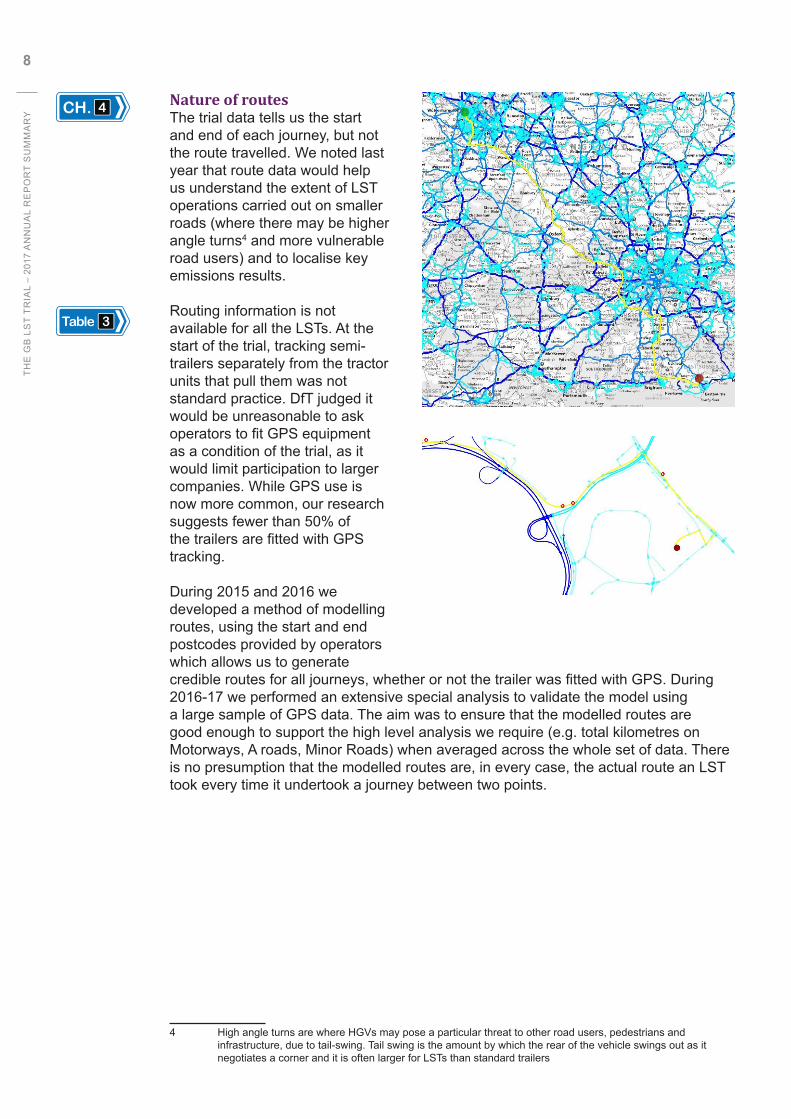
Nature of routesThe trial data tells us the start and end of each journey, but not the route travelled. We noted last year that route data would help us understand the extent of LST operations carried out on smaller roads (where there may be higher angle turns4 and more vulnerable road users) and to localise key emissions results.
Routing information is not available for all the LSTs. At the start of the trial, tracking semi-trailers separately from the tractor units that pull them was not standard practice. DfT judged it would be unreasonable to ask operators to fit GPS equipment as a condition of the trial, as it would limit participation to larger companies. While GPS use is now more common, our research suggests fewer than 50% of the trailers are fitted with GPS tracking.
During 2015 and 2016 we developed a method of modelling routes, using the start and end postcodes provided by operators which allows us to generate credible routes for all journeys, whether or not the trailer was fitted with GPS. During 2016-17 we performed an extensive special analysis to validate the model using a large sample of GPS data. The aim was to ensure that the modelled routes are good enough to support the high level analysis we require (e.g. total kilometres on Motorways, A roads, Minor Roads) when averaged across the whole set of data. There is no presumption that the modelled routes are, in every case, the actual route an LST took every time it undertook a journey between two points.
4 High angle turns are where HGVs may pose a particular threat to other road users, pedestrians and infrastructure, due to tail-swing. Tail swing is the amount by which the rear of the vehicle swings out as it negotiates a corner and it is often larger for LSTs than standard trailers
Table 3
CH. 4

9
RIS
K S
OLU
TIO
NS
This route modelling has been used to estimate the proportions of the LST distance covered on different road types. The figure shows the distance travelled by LST split by:• Urban (based on the ONS urban areas
excluding motorways5) and non-urban • Motorway, A road and Minor roads, and• The Primary Route Network (PRN)6, and
Other roads that are not part of the PRN7.
As a proportion of all LST distance covered:• 13% is Urban• 2% is on Minor Roads• 5% is on Other (not-PRN) Roads.
The operations on Minor or Other roads are usually smaller roads at the start or end of a trip. However, the figure shows the Urban / Non-urban split is a fairly ‘blunt’ division; it includes many large A roads that are clearly suitable for HGVs as they go around the edge of towns.
National freight statistics for all HGVs are not available using the Other (not-PRN) classification; they use the Motorway / A Road / Minor breakdown and Urban / Rural. Therefore, the results comparing LSTs to national averages in the ‘Headlines’ table at the centre of this document are for these categories.
The figure below shows the breakdown by distance travelled on Motorways, A roads and Minor roads for the whole GB fleet of large articulated HGVs and the LST trial HGVs. It can be seen that the split is very similar.
5 Motorways in ONS urban areas are included in non-urban6 The PRN is the recommended (signed) route for traffic between a nationally agreed set of major towns and important destinations across the UK. Local Authorities would normally expect HGVs and through traffic to follow the PRN.7 ‘Other’ includes some A roads and minor roads
Urban
Non-urban
Motorway
PRN
A Road
Minor road Other
GB
LST Trial
59% 39%
62% 36%
2%
2%
Motorways A Roads Minor Roads
10
THE
GB
LS
T TR
IAL
– 20
17 A
NN
UA
L R
EP
OR
T S
UM
MA
RY
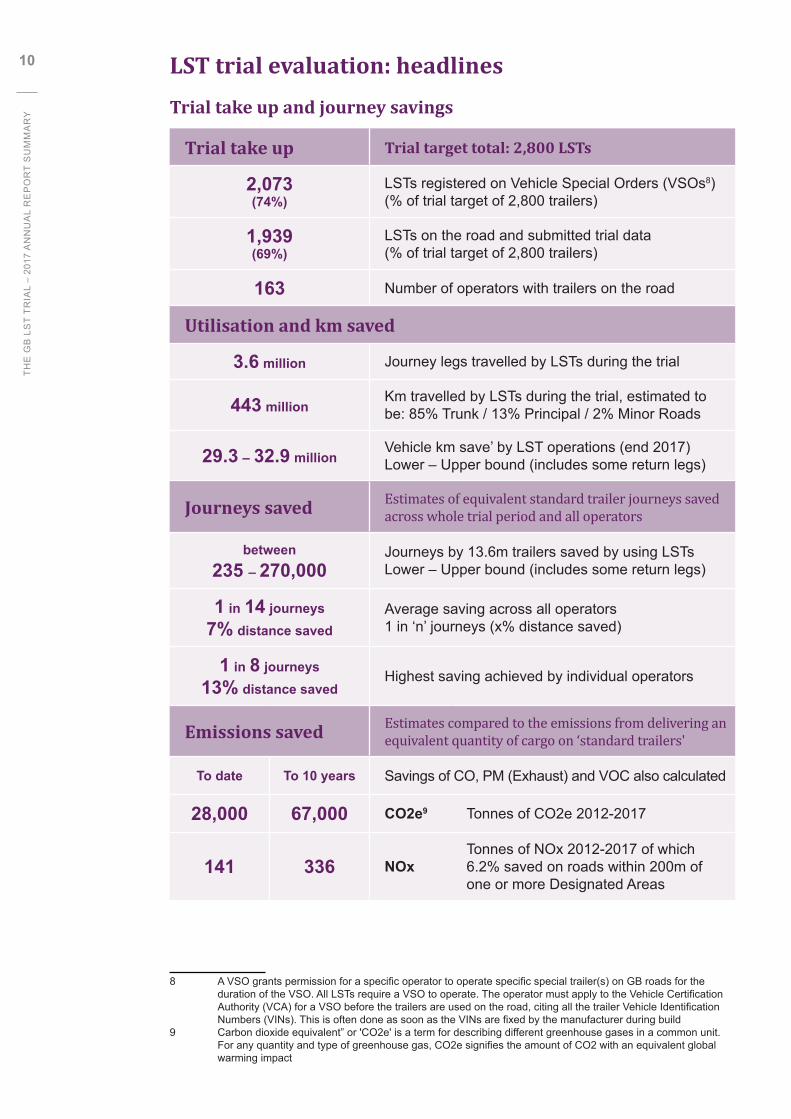
LST trial evaluation: headlinesTrial take up and journey savings
Trial take up Trial target total: 2,800 LSTs
2,073 (74%)
LSTs registered on Vehicle Special Orders (VSOs8) (% of trial target of 2,800 trailers)
1,939(69%)
LSTs on the road and submitted trial data(% of trial target of 2,800 trailers)
163 Number of operators with trailers on the road
Utilisation and km saved
3.6 million Journey legs travelled by LSTs during the trial
443 millionKm travelled by LSTs during the trial, estimated to be: 85% Trunk / 13% Principal / 2% Minor Roads
29.3 – 32.9 millionVehicle km save’ by LST operations (end 2017)Lower – Upper bound (includes some return legs)
Journeys saved Estimates of equivalent standard trailer journeys saved across whole trial period and all operators
between235 – 270,000
Journeys by 13.6m trailers saved by using LSTsLower – Upper bound (includes some return legs)
1 in 14 journeys7% distance saved
Average saving across all operators1 in ‘n’ journeys (x% distance saved)
1 in 8 journeys13% distance saved
Highest saving achieved by individual operators
Emissions saved Estimates compared to the emissions from delivering an equivalent quantity of cargo on ‘standard trailers'
To date To 10 years Savings of CO, PM (Exhaust) and VOC also calculated
28,000 67,000 CO2e9 Tonnes of CO2e 2012-2017
141 336 NOxTonnes of NOx 2012-2017 of which 6.2% saved on roads within 200m of one or more Designated Areas
8 A VSO grants permission for a specific operator to operate specific special trailer(s) on GB roads for the duration of the VSO. All LSTs require a VSO to operate. The operator must apply to the Vehicle Certification Authority (VCA) for a VSO before the trailers are used on the road, citing all the trailer Vehicle Identification Numbers (VINs). This is often done as soon as the VINs are fixed by the manufacturer during build9 Carbon dioxide equivalent” or 'CO2e' is a term for describing different greenhouse gases in a common unit. For any quantity and type of greenhouse gas, CO2e signifies the amount of CO2 with an equivalent global warming impact
11
RIS
K S
OLU
TIO
NS
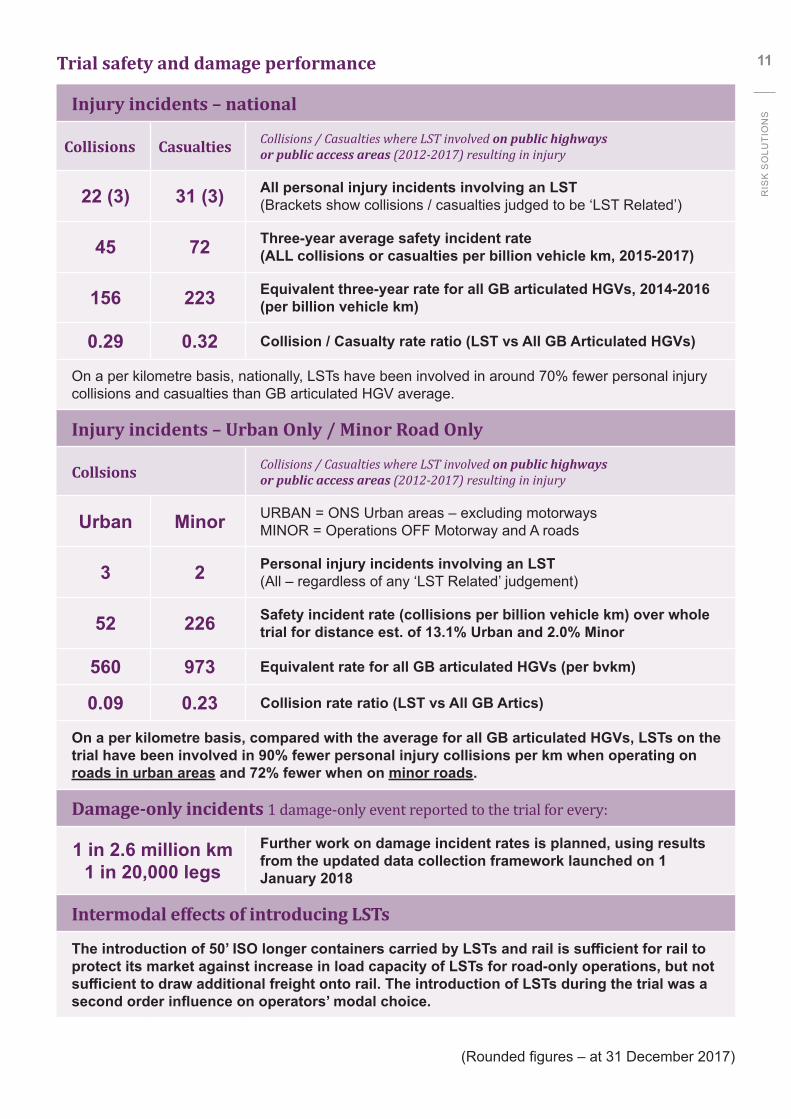
Trial safety and damage performance
Injury incidents – national
Collisions Casualties Collisions / Casualties where LST involved on public highways or public access areas (2012-2017) resulting in injury
22 (3) 31 (3) All personal injury incidents involving an LST(Brackets show collisions / casualties judged to be ‘LST Related’)
45 72 Three-year average safety incident rate (ALL collisions or casualties per billion vehicle km, 2015-2017)
156 223 Equivalent three-year rate for all GB articulated HGVs, 2014-2016 (per billion vehicle km)
0.29 0.32 Collision / Casualty rate ratio (LST vs All GB Articulated HGVs)
On a per kilometre basis, nationally, LSTs have been involved in around 70% fewer personal injury collisions and casualties than GB articulated HGV average.
Injury incidents – Urban Only / Minor Road Only
Collsions Collisions / Casualties where LST involved on public highways or public access areas (2012-2017) resulting in injury
Urban Minor URBAN = ONS Urban areas – excluding motorwaysMINOR = Operations OFF Motorway and A roads
3 2 Personal injury incidents involving an LST(All – regardless of any ‘LST Related’ judgement)
52 226 Safety incident rate (collisions per billion vehicle km) over whole trial for distance est. of 13.1% Urban and 2.0% Minor
560 973 Equivalent rate for all GB articulated HGVs (per bvkm)
0.09 0.23 Collision rate ratio (LST vs All GB Artics)
On a per kilometre basis, compared with the average for all GB articulated HGVs, LSTs on the trial have been involved in 90% fewer personal injury collisions per km when operating on roads in urban areas and 72% fewer when on minor roads.
Damage-only incidents 1 damage-only event reported to the trial for every:
1 in 2.6 million km 1 in 20,000 legs
Further work on damage incident rates is planned, using results from the updated data collection framework launched on 1 January 2018
Intermodal effects of introducing LSTs
The introduction of 50’ ISO longer containers carried by LSTs and rail is sufficient for rail to protect its market against increase in load capacity of LSTs for road-only operations, but not sufficient to draw additional freight onto rail. The introduction of LSTs during the trial was a second order influence on operators’ modal choice.
(Rounded figures – at 31 December 2017)

12
THE
GB
LS
T TR
IAL
– 20
17 A
NN
UA
L R
EP
OR
T S
UM
MA
RY
2. What are the savings realised in HGV journeys?
We estimate that the average percentage distance saving to the end of December 2017 is around 7%, which equates to 1 in every 14 journeys. The most efficient LST operations are saving up to 1 in every 8 journeys10.
The chart shows the range of savings achieved by different operators
In calculating savings, we take into account some of the empty legs saved (where an entire round trip was saved), but only where our analysis of the journey logs detects a pattern of journeys that are ‘Full out/Empty back’.
While the best performing operators are achieving more than 10% journey saving, there are a small number of cases (on the left of the chart) where little or no saving is being reported. Some of these are cases where the trailer has been purchased for use on a specific contract, which has then ended and new work has not been found. In other cases, the trailer has simply not been usable on as wide a range of work, or at the loading levels, the operator hoped.
3. What are the resulting reductions in emissions?
The pre-trial estimate was of a saving of 3,000 tonnes of CO2, from the operation of LSTs during the 10-year trial. Since the trial was launched in 2012, the environmental impact discussion has moved on from a focus primarily on carbon, to both carbon and air quality.
Since last year, we have added an emissions model which has then been integrated with the route modelling system discussed earlier. The emissions model models emissions on a leg by leg basis, taking into account not only route information (using average speeds for different road types) but also the estimated vehicle weight, based on the trailer features (length, axle design, number of decks) and the actual load weight given in the leg data by the operator.
CH. 5
1
FOR SUMMARY REPORT
LOW FAIR GOOD EXCELLENT
4
810
6
17
7
12
19
30
108
11
14
9
0
5
10
15
20
25
30
35
0% to 1% 1% to 2% 2% to 3% 3% to 4% 4% to 5% 5% to 6% 6% to 7% 7% to 8% 8% to 9% 9% to 10% 10% to 11% 11% to 12% 12% to 13% 13% to 14%
No. o
f ope
rato
rs
% Saving - average for operator since joining the trial
CH. 6
10 In previous annual reports we modified the distance savings calculated from the journey logs and loading data by a fuel consumption factor (1.8%) reducing the distance savings but the same amount since in earlier years of the trial, the journey savings were also being used as a proxy measure for likely emissions savings. In 2017 we have added a full emissions analysis and hence this proxy factor has been removed from the journey and distance saving results. The figures presented here now represent a direct estimate of the actual % saving in distance by operators.

13
RIS
K S
OLU
TIO
NS
LST Trial Emissions Savings Summary
(All figures in tonnes, rounded) Trial to Date
10 yrTrial
Extended Trial
Savings 2012-17 2012-21 2012-26
Carbon Dioxide (equivalent) CO2e11 28,180 67,030 120,066
Oxides of Nitrogen NOx 141 336 602
The model is run twice, once using the actual LST leg data and then again for a hypothetical set of equivalent legs transporting the same goods on standard (13.6m) trailers. The difference between these two values gives a measure of the emissions saving from using the LSTs.
The emissions model provides results not just for carbon dioxide, but for six separate emissions, with spatial analysis by road type and a selection of areas for which emissions are of particular interest (like SSSIs). This is possible because of the integration of the routing and emissions models.
Finally, emissions savings are estimated both for the trial to date (based on the modelling of the 2017 results) and projected forward to the nominal trial end point(s). Results for the two key emissions in the main scenario discussed in the Annual Report, are shown below.
• The key results for CO2e (as an emission that disperse widely) and NOx (as a localised emission) are:
The net emissions reduction from TRIAL TO DATE is around 28,000 tonnes of CO2e and 141 tonnes NOx, as well as other emissions.
The PROJECTED net reduction if the trial were to run to the original 10 year end point is around 67,000 tonnes of CO2e and 336 tonnes NOx, as well as other emissions.
• In terms of impact on geographic areas of particular interest:
6.2% of the emissions savings are being made within 200m of one or more Designated Areas (SAC, Ramsar, SSSI, SPA) – these are areas that have cited features that are sensitive to changes in ambient NOx, nitrogen deposition and acid deposition that can be brought about by changes in traffic emissions of NOx – particularly from roads within 200m.
15% of the emissions savings are being made in Air Quality Monitoring Areas (AQMAs) – these are areas where air pollutant concentrations already exceed or are likely to exceed relevant air quality objectives defined by Defra.
11 Carbon dioxide equivalent” or 'CO2e' is a term for describing different greenhouse gases in a common unit. For any quantity and type of greenhouse gas, CO2e signifies the amount of CO2 with an equivalent global warming impact
14
THE
GB
LS
T TR
IAL
– 20
17 A
NN
UA
L R
EP
OR
T S
UM
MA
RY
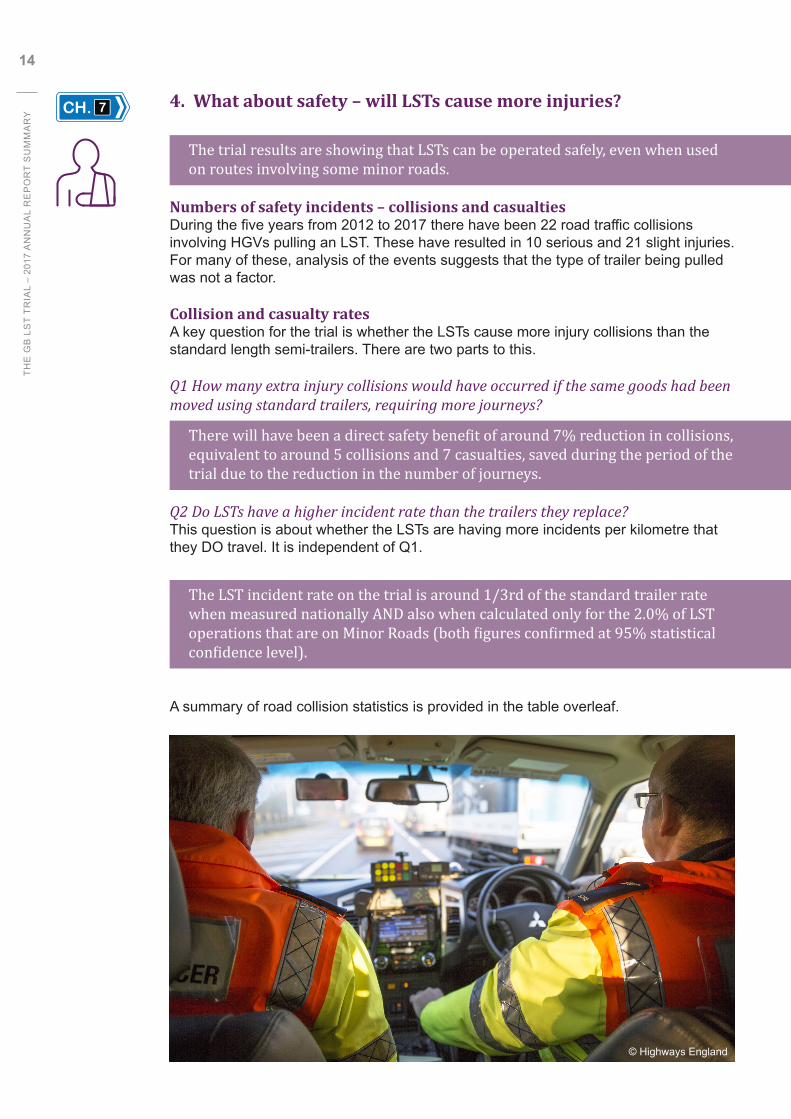
4. What about safety – will LSTs cause more injuries?
The trial results are showing that LSTs can be operated safely, even when used on routes involving some minor roads.
Numbers of safety incidents – collisions and casualtiesDuring the five years from 2012 to 2017 there have been 22 road traffic collisions involving HGVs pulling an LST. These have resulted in 10 serious and 21 slight injuries. For many of these, analysis of the events suggests that the type of trailer being pulled was not a factor.
Collision and casualty ratesA key question for the trial is whether the LSTs cause more injury collisions than the standard length semi-trailers. There are two parts to this.
Q1 How many extra injury collisions would have occurred if the same goods had been moved using standard trailers, requiring more journeys?
There will have been a direct safety benefit of around 7% reduction in collisions, equivalent to around 5 collisions and 7 casualties, saved during the period of the trial due to the reduction in the number of journeys.
Q2 Do LSTs have a higher incident rate than the trailers they replace?This question is about whether the LSTs are having more incidents per kilometre that they DO travel. It is independent of Q1.
The LST incident rate on the trial is around 1/3rd of the standard trailer rate when measured nationally AND also when calculated only for the 2.0% of LST operations that are on Minor Roads (both figures confirmed at 95% statistical confidence level).
A summary of road collision statistics is provided in the table overleaf.
CH. 7
© Highways England

15
RIS
K S
OLU
TIO
NS
Summary of LST-related injury incidents and outcomes after 443 million km travelled, compared with those for all GB Articulated HGVs (>7.5T)Collisions in all public locations and resulting casualties
GB Artic HGVs
1 in every…
LST involved
1 in every…
Judged LST Related
1 in every…
All Incidents All locations 6.2 million km 20.1 million km 147.7 million km
Urban only 1.8 million km 19.3 million km 58.0 million km
Minor roads only 1.0 million km 4.5 million km 8.9 million km
By incident severity (the worst injury recorded for each collision – as per STAT19)
Fatal accident All locations 125.0 million km No incidents No incidents
Serious All locations 41.7 million km 44.3 million km No incidents
Slight All locations 7.8 million km 36.9 million km 147.7 million km
Notes:• ‘All public locations’ covers all public roads and also private land where there is public access.• ‘Urban’ here defined as all roads, excluding motorways, in ONS defined urban areas • ‘Minor’ Roads are all roads that are classified ‘below’ the level of A-Road• GB Articulated HGVs: Based on DfT National data for all articulated HGVs > 7.5T. 2012-2016 (TRA3105) = 68.6bn
km of which 4.0bn urban non-motorway and 1.4bn minor roads. Injury incidents from STATS19 2012-16: Total collisions = 10,997 (2,238 urban and 1,362 minor roads).
• LST Involved: 22 events (3 urban and 2 minor roads). Any injury event in which an LST was involved, even if the trailer being an LST was not relevant – data from latest annual report table – Table 22. Non-injury (damage only) incidents are covered separately.
• LST Related: 3 events. Events involving an LST where the fact that the trailer was an LST rather than a standard length was considered to be at least part of the cause. Not used in headline figures for trial injury rates.
• These figures are mean values. The latest annual report includes analysis that concludes that the comparisons between LST incident rates shown here are all statistically robust at a 95% confidence level
So LSTs are safe?There is no reason why LSTs should be inherently safer than standard trailers, but on the trial, their incident rate is lower than for other trailers. There are a number of reasons why this might be the case: • The conditions of participating in the trial require that operators provide special
driver training for any staff using LSTs• Operators often report paying additional attention to route selection, route
assessment, driver selection and driver familiarity with both the LST and the routes• The focus brought by having to submit data on every LST journey probably
reinforces their ‘special’ nature, even when, for some operators, they have now been in service for 6 years
• The LSTs represent a significant investment that operators do not want to see damaged.
Separately to the statistical analysis, we study each injury event in detail to look for any lessons that can be learnt regarding safe operation of LSTs. As we noted last year, this has identified important principles in driver training and route planning and most recently resulted in a recommendation to DfT to explore whether an LST might behave differently from a standard trailer when sudden course corrections are required at speed. That issue is still being looked into by the Department.

16
THE
GB
LS
T TR
IAL
– 20
17 A
NN
UA
L R
EP
OR
T S
UM
MA
RY
5. What about damage and the associated costs – will LSTs cause more damage on the roads?
In last year’s annual report we noted the challenges of comparing damage incident rates of LSTs to other trailers, since there is no national dataset for the non-LSTs. A small scale comparison of damage incident rates across their LST and non-LST fleets for 7 operators showed that in a small number of cases, the LSTs might be experiencing a higher incident rate than the fleet as a whole.
As a result of our recommendations last year, the incident log template used to gather data was replaced as from 1 January 2018 and now incorporates more narrative evidence of the severity of damage to the trailer and any objects hit in the collision and, crucially, a requirement to report summary figures for incidents and total distance for the non-LST trailers in the fleet where the LSTs are being used.
As a result a new data collection system was launched from 1 January 2018. Operators are now asked to submit a summary of the journeys carried out by each trailer. At the same time, the incident log has been made more detailed, with an increased focus on the description of how the event took place and the extent of any damage caused. We also now collect summary data for incidents involving the operator’s non-LST fleet. This should enable us to study the relative rates of damage only events between the LSTs and the non-LST fleets they operate.
Results from this new-format incident data will not be available until we have gathered and analysed the 2018 data.
In last year’s report we looked to see if there is any correlation of damage events with specific trailer design elements, in particular the kick-out, which is itself related to the choice of steering design (self or command steer).
Although only very weak statistical correlations to any design feature were found in work undertaken in 2016, we still believe this is an important area that DfT will need to take into account when considering any wider roll-out of LSTs. This is because they will need to decide whether the same range of design features permitted on the trial should continue to be allowed, or perhaps, whether operational restrictions would be applied to certain designs.
We anticipate the rationale for adopting certain designs of trailers to be one of the topics discussed in the industry and stakeholder engagement in Autumn 2018.
6. Might any special operational requirements be appropriate for LSTs?
From our periodic surveys of operators we know that:• Many operators restrict LST operations to set routes, where:
• they can maximise utilisation of the extra length• they have assessed the route to be suitable for LSTs• the delivery points have been assessed as suitable for LSTs
• Operators have adopted a range of different approaches to drivers’ specific LST training
• Many operators seek to ensure that LSTs are operated by drivers who do so regularly, and in some cases, on repeated routes.
CH. 8
CH. 9

17
RIS
K S
OLU
TIO
NS
The significant question now is whether such good practices can be replicated outside of the trial conditions, including the close monitoring through the data collection and scrutiny. Without at this stage determining the outcome of the trial, it is appropriate thatthe evaluation now starts to ask what the big lessons are from the trial around theseoperational factors and what might be done to ensure those lessons are not lost.
To this end, we have started discussions with members of an existing trial stakeholder group that includes DfT, the Freight Transport Association (FTA), the Road Haulage Association (RHA), the Local Government Association (LGA), The Campaign for Better Transport (CBT) and technical specialists, including from the Local Authorities Technical Advisors Group (TAG), operators and the trailer manufacturers (through SMMT, the Society of Motor Manufacturers & Traders). We are also consulting with the Vehicle Certification Authority (VCA) and have plans to add VOSA and possibly the Traffic Commissioners to this list.
Starting from the publication of the 2017 Annual Report, we are preparing to hold a wide range of discussions at existing or specially arranged events (through the stakeholders noted above), working from a set of common questions, generated by the group. By doing this in a coordinated manner, rather than individually in each stakeholder group, we are hoping to be able to generate an active, shared conversation, that will provide a foundation for options that DfT can then consider.
Our initial question structure is shown in the chart below.
LST Trial – Autumn 2018 Stakeholder Conversation Areas (Preliminary)
1. LST Designsa. What key factors affected the choice of different design features by operators?b. What are the marginal costs and weights of LSTs vs their 13.6m equivalent?
2. LST Take Upa. What is the view of future take-up among trial participants?b. What is the view of likely take up among operators who have NOT participated?c. What are the key commercial and infrastructure constraints on take up?
3. LST Operational / Regulatory Issuesa. What operational constraints in place during the trial need to be reproduced
outside of the trial environment? Why? How could this be done?b. What training should be expected in relation to LSTs, for drivers, loaders, job
planners, route planners, fleet managers, directors etc? How might this be embedded into a requirement and from which regulatory or industry body?
4. LST Data beyond the triala. What is the value and feasibility of ongoing identification of LST information as
part of national data collection including possibly, CSRGT, STATS19 and traffic flow?
b. What, if any, opportunity is there to monitor LST usage through other means, such as licence conditions?
18
THE
GB
LS
T TR
IAL
– 20
17 A
NN
UA
L R
EP
OR
T S
UM
MA
RY
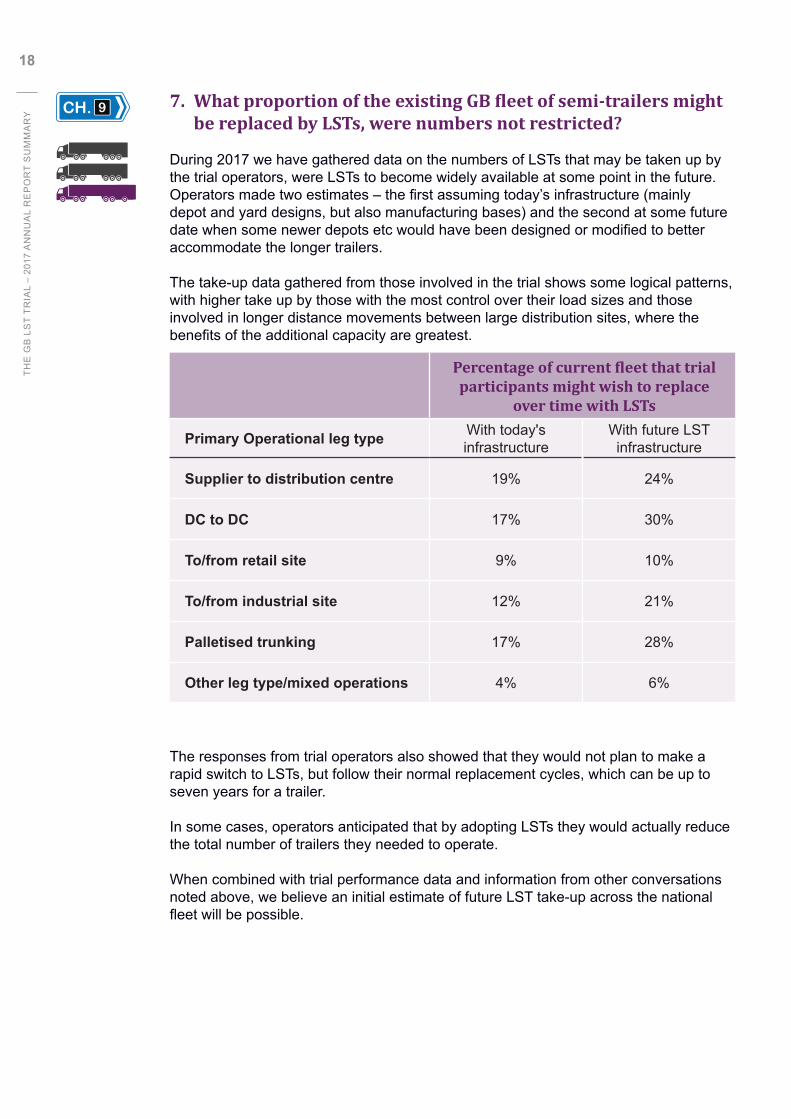
7. WhatproportionoftheexistingGBfleetofsemi-trailersmightbe replaced by LSTs, were numbers not restricted?
During 2017 we have gathered data on the numbers of LSTs that may be taken up by the trial operators, were LSTs to become widely available at some point in the future. Operators made two estimates – the first assuming today’s infrastructure (mainly depot and yard designs, but also manufacturing bases) and the second at some future date when some newer depots etc would have been designed or modified to better accommodate the longer trailers.
The take-up data gathered from those involved in the trial shows some logical patterns, with higher take up by those with the most control over their load sizes and those involved in longer distance movements between large distribution sites, where the benefits of the additional capacity are greatest.
The responses from trial operators also showed that they would not plan to make a rapid switch to LSTs, but follow their normal replacement cycles, which can be up to seven years for a trailer.
In some cases, operators anticipated that by adopting LSTs they would actually reduce the total number of trailers they needed to operate.
When combined with trial performance data and information from other conversations noted above, we believe an initial estimate of future LST take-up across the national fleet will be possible.
CH. 9
Percentageofcurrentfleetthattrialparticipants might wish to replace
over time with LSTs
Primary Operational leg type With today's infrastructure
With future LST infrastructure
Supplier to distribution centre 19% 24%
DC to DC 17% 30%
To/from retail site 9% 10%
To/from industrial site 12% 21%
Palletised trunking 17% 28%
Other leg type/mixed operations 4% 6%
19
RIS
K S
OLU
TIO
NS
What next for the trial?
During the coming year, the focus of the trial will be:
1. Induction of new Trailers: Ongoing induction of the extra 1,000 trailers into the trial, which may involve 70 or more new operators.
2. Data Collection with incident focus: Continued data collection using the revised (2018) format, with a particular focus on the incident logs, including damage-only events.
3. Industry and stakeholder conversations: Starting Autumn 2018, these are expected to have a particular focus on potential take up and suitable mechanisms to replicate the best operational practices seen on the trial, outside of trial conditions.
4. DFT Course Correction at Speed / Axle Choice research: This is work being planned by DfT to look in more detail at the performance of the various axle steering choices being used on the trial and in particular at how they behave during a course correction at speed.
5. Preliminary scaling up analysis: This will involve segmenting the trial results into groups of similar operational types and applying them to the existing national freight statistics and forecasts (fleet size, traffic, safety, emissions and intermodal) to show the potential outcomes of the wider use of LSTs outside of trial conditions. This preliminary analysis will be used to identify any gaps in the information gathered on the trial so far and to inform the further discussion of the future of LSTs.
2017 Annual Report Summary
© Risk Solutions 2018
Department for TransportThe Department for Transport (DfT) is the government department responsible for the English transport network and a limited number of transport matters in Scotland, Wales and Northern Ireland that have not been devolved. DfT began the GB trial of longer semi-trailers for articulated goods vehicles in January 2012 and is responsible for the trial as a whole, including the allocation trial places to companies applying to participate. The evaluation of the trial is funded by DfT under the Specialist Professional and Technical Services (SPaTS) framework, but is carried out by independent consultants.
For further details on the trial, view the DfT website or contact the DfT trial project manager:
Philip Martin, Head of Freight Policy, 07500 573547 [email protected]
Freight Operator Licensing and Roadworthiness, Department for Transport Great Minster House, 33 Horseferry Road, London, SW1P 4DR
www.gov.uk
Risk SolutionsRisk Solutions is a specialist management consultancy working in the areas of risk, evaluation and decision support, with specialist expertise in industry engagement and working with complexity and high degrees of uncertainty. Risk Solutions has been involved in policy evidence development, preparation of impact assessments and evaluations for DfT, Defra, BEIS and other government departments and private companies. Risk Solutions was commissioned by DfT in 2012 to help design and implement the LST Trial evaluation process and has since been reappointed twice in the role of independent evaluator. For further details of Risk Solutions’ services, including the evaluation of the trial, follow the link below or contact:
Dr V Paul Brand LST Trial Evaluation Manager07968 107141 [email protected]
Dallam Court, Dallam Lane, Warrington WA2 7LT
www.risksol.co.uk
WSP WSP is one of the world’s leading engineering and professional services consulting firms. With over 43,000 talented people in more than 500 offices across 40 countries, 7,800 of which are based in the UK. WSP supplies services to DfT and Highways England under the SPaTS Framework Contract, using a consortium of in-house skills and carefully selected partners, including Risk Solutions. WSP has a dedicated logistics team that combines technical skills in modelling and analysis with a depth of knowledge based on real life operational experience in the logistics and supply chain sector.
For further details of WSP’s services in the Freight and Logistics, follow the link below or contact:
Ian Brooker WSP Director, Logistics07720 883703 [email protected]
WSP House, 70 Chancery Lane, London WC2A 1AF
www.wsp.com
Please noteCommunication from trial participants regarding data collection issues should be directed to the trial email address, [email protected].
THE GB LONGER SEMI-TRAILER TRIAL
Photographs of trailers are reproduced with kind permission of the operators.