Embed Size (px)
Citation preview

The Gender Gap in U.S. PresidentialElections: When? Why? Implications?1
Jeff ManzaPennsylvania State University
Clem BrooksIndiana University
Social scientists and political commentators have frequently pointedto differences between men and women in voting and policy atti-tudes as evidence of an emerging “gender gap” in U.S. politics. Usingsurvey data for 11 elections since 1952, this study develops a system-atic analysis of the gender gap in presidential elections. The authorsfind evidence that women’s changing rates of labor force participa-tion explain the origins of the gender gap. Additional analyses showthat attitudes toward social service spending mediate the interre-lationship of women’s labor force participation and vote choice. Inthe 1992 election, feminist consciousness also emerged as a signifi-cant factor shaping women’s voting behavior.
INTRODUCTION
When the right to vote was finally extended to women in the United Stateswith the adoption of the 19th Amendment to the Constitution in 1920,there was considerable speculation about the possibility that a distinctwomen’s vote would emerge. Many feminists hoped—and some male pol-iticians feared—that newly enfranchised women voters would back can-didates supporting a wide range of “maternalist” social policies such asprotective wage and hours laws, expansive health and housing policies,and other types of social provision for indigent women and families. Butsuch a vote failed to materialize in the period after enfranchisement (Lem-ons 1973, pp. 157–58; Baxter and Lansing 1983, pp. 17–22; Klein 1984,pp. 13–21, 142–43; Alpern and Baum 1985; Skocpol 1992, pp. 505–6).
1 Authors’ names are listed in reverse alphabetical order; both contributed equally tothe article. We thank Eric Plutzer for incisive comments on an earlier draft. Datafrom the American National Election Studies were provided by the Inter-UniversityConsortium for Political and Social Research; the usual disclaimers apply. Direct cor-respondence to Jeff Manza, Department of Sociology, Pennsylvania State University,University Park, Pennsylvania 16802-6207. Email: [email protected]
1998 by The University of Chicago. All rights reserved.0002-9602/98/10305-0003$02.50
AJS Volume 103 Number 5 (March 1998): 1235–66 1235

American Journal of Sociology
More recently, however, a gender cleavage has developed in U.S. elec-toral politics. When voting in presidential and in many congressional elec-tions, women have disproportionately supported Democratic candidatesin comparison with men. The size of this “gender gap” has often beenlarger than the margin of victory for Democratic candidates in congres-sional races as well as in the 1992 and 1996 presidential elections. Appealsdesigned to attract the women’s vote have become widespread, as havestrategies aimed at maximizing or minimizing the size of the gender gapfor Democratic and Republican candidates respectively.2
Other gender gaps in U.S. politics have also been observed (Conover1988, pp. 985–86): for example, in turnout rates, partisan identification,policy attitudes, rates of office holding, and evaluations of political office-holders. In the case of voter turnout, researchers have found that menwere significantly more likely to vote than women for decades after en-franchisement, although this gap had become reversed in the 1980s (Mer-riam and Gosnell 1924; Welch 1977; Baxter and Lansing 1983; Beckwith1986; Firebaugh and Chen 1995). Women and men have been shown tohold different views on a range of domestic and foreign policy issues (e.g.,Smith 1984; Shapiro and Mahajan 1986; Conover 1988), and those differ-ences appear to influence their evaluations of elected officials (e.g., Gilens1988). Women also continue to be significantly less likely to run for, orhold, elected political office, although the number of female elected offi-cials at all levels has risen sharply in recent years (Darcy, Welch, andClark 1994; Witt, Paget, and Mathews 1994).
Our focus in this article is on gender differences in the voting behaviorof men and women in presidential elections. While discussions of the gen-
2 Some feminists have viewed the gender gap as a means of securing a new DemocraticParty majority; see, e.g., Abzug (1984) and Smeal (1984). A couple of recent exampleshighlight the importance of gender-centered electoral strategies in the 1996 election,as reported by the New York Times. (1) “Republican governors . . . were given asobering presentation of their party’s troubles with female voters, and asserted thata more compassionate tone and a focus on education were the cure. The presentation,at the closing session of a three-day meeting of the Republican Governors’ Association,came from Haley Barbour, the Republican national chairman, who said that ac-cording to the party’s own research, Bob Dole and Republican congressional candi-dates fared even worse among women on Election Day than had been suggested byexit polls taken by the news media” (“Gender Gap Wider Yet, GOP Session Is Told,”New York Times, November 27, 1996, p. A22 [National Edition]). (2) “Seeking to insurea strong turnout from a crucial voting bloc, President Clinton made a special appealto women today by highlighting Government efforts to fight breast cancer and tellinga rally audience in Virginia that the election is ‘not about party, it’s about you.’ . . .Clinton stressed the health care, education and child-based themes that have beencentral to his campaign and that have a particular resonance with women” (“ClintonCampaign Puts an Emphasis on Female Voters,” New York Times, October 28, 1996,p. A1 [National Edition]).
1236

The Gender Gap
der gap in electoral politics have become commonplace in election re-porting and commentary (a veritable “national pastime,” according to Jen-nings [1988, p. 12]), there have been very few systematic analyses of itshistorical origins. We have identified at least 23 analyses that date theorigins of the gap to the 1980 election.3 In that election, Republican candi-date Ronald Reagan ran a campaign emphasizing his opposition to theEqual Rights Amendment (ERA) and abortion and his support for “tradi-tional” family values and for an aggressive policy of military containmentof Soviet-style communism. These themes, many of which have character-ized the Republican Party’s policy agenda since Reagan, are presumed tohave alienated a large number of women voters who have never returnedto the Republican fold.
Is the gender gap indeed as recent a development as assumed by mostscholars? To anticipate one of the key findings of our analysis, we presentin figure 1 two sets of estimates of the gender gap in presidential electionsfor the period between 1952 and 1992. The figure’s left-hand panel showsthe changing size of the gender gap using raw data from the NationalElection Studies (NES) data (and the Voter News Service [VNS] data forthe 1996 presidential election).4 Even without model fitting, the observedestimates suggest that the gender gap has grown over much of the NESseries. Figure 1’s right-hand panel offers further corroboration, showingthat, when competing models of change in the magnitude of the gendergap have been fitted to the data (details discussed below), the estimatesfrom the preferred model reveal a growing trend since 1952, which peakedbut did not begin in 1980.
In this article, we seek to explain the causes of this evolving gender gapin vote choice. Our analysis is in four sections. In the first part of the
3 See Baxter and Lansing (1983, p. 179), Miller (1983, pp. 7–8), Abzug (1984, p. 1),Klein (1984, pp. 2, 163; 1985, p. 35), Bolce (1985, p. 373), Mansbridge (1985, pp.165–66), Norris (1985, p. 192), Wirls (1986, p. 316; 1991, pp. 117–19), Heideprien andLake (1987, p. 1), Klatch (1987, p. 3), Mueller (1988, pp. 16–17), Kenski (1988, pp.38–39), Erie and Rein (1988, p. 174), Carroll (1988, p. 242), Miller, Hildreth, andSimmons (1988, p. 106), Hartmann (1989, p. 153), Faludi (1991, p. xx), Tolleson Rine-hart (1992, p. 146), Delli Carpini and Fuchs (1993, p. 34), Bendyna and Lake (1994,pp. 238–39), Chaney, Alvarez, and Nagler (1996, pp. 1, 20). Writing in the mid-1980s,Bolce (1985, p. 376) noted that “all commentators seem agreed that [Reagan] and hispolicies are at the center of the gender gap controversy.” Viewing the gender gap asreflecting the unique historical circumstances of the Republican presidential victoriesbeginning in 1980, a handful of analysts argued that the gender gap per se has nolong-term significance for American politics; see, e.g., Poole and Ziegler (1985); Wirls(1986, 1991).4 We discuss in detail the NES data and our quantitative measure of the gender gap(the standard deviation of the probability of Democratic vote choice among men andwomen) in the data and measures section below.
1237

American Journal of Sociology
Fig. 1.—The emergence of the gender gap in presidential elections, 1952–92.(Index scores are calculated by taking the SD of the observed or fitted probabilitiesof Democratic vote choice among women and men voting for a major party candi-date.)
article, we summarize the main causal arguments that have been devel-oped to explain political differences between men and women. In the sec-ond part, we discuss the data and statistical models we use to adjudicatethe competing claims about voting behavior implied by these arguments.In the third part, we present the results of our analyses, first establishingthe trends and magnitude of the gender gap from 1952 to 1992 and thendeveloping an analysis of the factors responsible for this trend. The arti-cle’s conclusion discusses the implications our research has for theoriesabout the origins and development of gender divisions in American politi-cal life.
THEORIZING THE GENDER GAP
The classics of postwar political behavior research—such as Berelson,Lazarsfeld, and McPhee (1954), Stouffer (1955), Lane (1959), Lipset ([1960]1981), Campbell et al. (1960), and Almond and Verba (1963)—did not
1238
The Gender Gap
view gender as a central factor (cf. Bourque and Grossholtz 1974; Carrolland Zerilli 1993, pp. 57–58). When gender differences were mentioned atall, women were often portrayed as lacking interest in politics and a senseof political efficacy (e.g., Berelson et al. 1954, p. 25; Campbell et al. 1960,pp. 489–92). If they did take an interest in politics, women were said tobe more likely to “personalize” politics than men, who focused more onsubstantive issues (Greenstein 1965, p. 108) or to “focus . . . political atten-tion upon persons and peripheral ‘reform’ issues” (Lane 1959, p. 216).These early studies asserted that women were more apathetic and lesswell informed than men, who had the benefit of greater exposure to publiclife (e.g., Almond and Verba 1963, p. 325; Lipset 1981, pp. 216–17), andwere less politically tolerant than men (Stouffer 1955, pp. 131–49). Whenwomen did participate in elections, they were also viewed as likely tosimply follow the lead of their husbands (Campbell et al. 1960, pp. 485–86, 492–93).
The resurgence of women’s liberation and second wave feminist move-ments beginning in the late 1960s and early 1970s, coupled with the accu-mulation of evidence that women were now turning out to vote at levelscomparable to men, had by the early 1980s led to critical reassessmentsof the classical treatments of women and politics (Tolleson Rinehart 1992,pp. 13–14). Although there are multiple ways of carving up the recentliterature on women and politics (cf. Clark and Clark 1986; Bennett andBennett 1993), we propose that, for the purposes of understanding votingdifferences, four distinct theories can be identified. One theoretical per-spective emphasizes differences in the political socialization of men andwomen, which are seen as shaping their public activities (including vot-ing). A second set of theories links the growing autonomy of women votersto changing marital patterns and rising divorce rates. A third perspectivegives primacy to rising levels of feminist consciousness among womensince the 1960s. A final theory points to the importance of the increasingparticipation of women in the labor force as a factor influencing women’spolitical orientations. We discuss each of these approaches in turn.5
5 Not all of the scholarship we discuss below as exemplars of each theoretical approachseeks to explain gender differences in voting behavior per se. These arguments do,however, identify causal mechanisms that have substantive relevance to the phenome-non under investigation. We thus use the four distinct theories as a source of hypothe-ses about the causal mechanisms of differences in vote choice among women and men.It is also important to note that there is often some overlap in the causal factorsemphasized in individual studies purusing multicausal explanations of the gender gap.The four causal arguments we identify should thus be viewed as ideal-types ratherthan literal descriptions of all the accounts offered by scholars who have written aboutthe gender gap.
1239
American Journal of Sociology
Gender Socialization
The first set of theories we consider emphasizes the importance of thedifferent patterns of socialization experienced by women and men in shap-ing core values, political orientations, and behavior.6 Two distinct strandsof gender-centered social psychological research can be identified. Thefirst emphasizes the importance of childhood socialization (e.g., Chodorow1978; Gilligan 1982; for applications to politics, see, e.g., Feltner and Gol-die [1974], Hess and Torney [1978], and Kelly and Boutilier [1978]). Theseinterpretations view gender differences in political behavior as stemmingfrom the sex role conditioning experienced by girls and boys. These differ-ences are assumed to endure over the life course, insofar as they are theproduct of a contrasting set of moral values imparted during childhood.7
Adult socialization approaches, by contrast, hypothesize that the effectsof childhood socialization are mediated by adult roles, especially women’sexperience of motherhood (Sapiro 1983; Ruddick 1989). Traditional famil-ial arrangements are viewed as especially consequential, given that theyresult in a much higher likelihood that women will be connected to theirroles as mothers, leading to the development of “separate spheres” ofmoral and political activity among men and women (Sapiro 1983, chap.2). Since the New Deal, the Democratic Party has stood for a greater gov-ernmental role in insuring the welfare of individuals and families. Con-versely, the Republican Party has—over much of this period—beenviewed by many voters as the party more likely to use military force (andhence threaten the lives of young men and women in the armed forces)in the pursuit of geopolitical aims. The socialization approach predictsthat women who have been socialized to value nurturing activities mayreact to these policy differences by viewing the Democratic Party morefavorably.
Despite focusing on different aspects of the life course, both types of
6 We caution that the socialization literatures reviewed in this section are heteroge-neous in many of their assumptions; they nevertheless share common assumptionsabout the causal importance of socialization experiences in producing gender differ-ences.7 As Gilligan (1982, p. 100) puts it, “The moral imperative that emerges repeatedlyin interviews with women is an injunction to care, a responsibility to discern andalleviate the ‘real and recognizable trouble’ of this world. For men, the moral impera-tive appears rather as an injunction to respect the rights of others and thus to protectfrom interference the right to life and self-fulfillment.” Some evidence suggests thatwhen it comes to economic voting, women are more likely to be motivated by “socio-tropic” concerns (i.e., concerns about the economic health of the nation as a whole)while men are more likely to be concerned with “egocentric” issues relating to theirown (or their family’s) economic well-being (Welch and Hibbing 1992; Chaney et al.1996).
1240

The Gender Gap
socialization approaches view political differences between men andwomen as stemming from general patterns of sex-role differentiation, not“interests” (Sears and Huddy 1990). As a consequence, no particular socio-demographic group of women is expected to hold political views differentfrom those of men. As Elshtain (1984, p. 24) puts it, “The gender gap isreal and it concerns what political scientists like to call ‘moral issues,’which traditionally have been the purview of women and, for that reason,often in the past labeled ‘social questions,’ not properly political ones.. . . On questions of conscriptions, militarization, nuclear weapons, capitalpunishment, and environmental safeguards, statistically significant differ-ences show up between the categories ‘all men’ and ‘all women.’ Thesedifferences cut across class and education and hold whether the womanin question is employed or not.” Similarly, Sears and Huddie (1990, pp.274–75) argue that political divisions among women “go back in largepart, if not completely, to political socialization in earlier life” and thattheir empirical work suggests that “interest-related differences weredwarfed by differences based on predispositions, as in much earlier work.”The socialization approach to the gender gap would therefore be chal-lenged, albeit indirectly, by evidence that differences among women andbetween women and men are related to economic interests.
Family Transformation and the Rising Autonomy of Women
A second causal mechanism that may explain the growth of the gendergap is the hypothesized increase in women’s autonomy, resulting fromchanges in family structures that have significantly reduced the impor-tance of marriage (and the percentage of adult women in intact marriages).Many of the classical works of political behavior assumed that marriedwomen tend to follow the political lead of their husbands. Some feministscholars have reached similar conclusions but for different reasons, ar-guing that women’s interests are subordinated to those of men in marriagebecause of the routine functioning of the sexual division of labor (e.g.,Hartmann 1981). The interdependence of men and women in traditionalmarriages may thus give them common material interests. As Carroll(1988, p. 241) puts it, “The wife and husband . . . have a common interestin the rate of inflation, the condition of the stock market, the husband’sveteran benefits, and the availability of public transportation.” Such com-mon interests may thus override other sources of division between menand women to produce electoral convergence.
Rising divorce rates since the 1960s, however, coupled with the increas-ing average age of first marriage, contribute to growing numbers ofwomen who are independent of husbands and the institutional constraints
1241

American Journal of Sociology
of marriage (e.g., Spain and Bianchi 1996).8 Divorced, widowed, or singlewomen may have very different material interests (and ultimately votingpreferences) than those of married women.9 Some analysts have indeedfound evidence to support this hypothesis. Frankovic (1982, p. 444) reportsthat “sex differences in support for Ronald Reagan in 1980 were smallestin two adult, one male, one female households. Consensus within a house-hold in the course of living together does appear to minimize sex differ-ences.” Carroll (1988) likewise suggests that the gender gap in the 1980 and1982 national elections can be largely attributed to the growing number ofautonomous women who are economically and/or psychologically inde-pendent from a husband (see also Rossi 1983, pp. 726–27).
Feminist Consciousness
A third causal thesis we consider in this article relates to the rise of femi-nist consciousness as a possible source of voting preferences (Gurin 1985;Conover 1988; Cook 1989, 1993; Cook and Wilcox 1991; Tolleson Rine-hart 1992; Plutzer and Zipp 1996). While gender identification appearsby itself to have a limited influence on policy attitudes (Miller et al. 1988,pp. 111–12), feminist identities may be of much greater consequence forpolicy attitudes and ultimately political behavior (Gurin 1985; Conover1988; Cook 1993). Identification with feminism is typically measured interms of the strength of women’s identification with other women, thewomen’s liberation movement or feminists, or (less commonly) by egali-tarian attitudes toward gender roles. Conover (1988) argues that genderdifferences in policy attitudes between men and women can be traced tothe greater prevalence of feminist identities among women. Cook’s (1993)recent work finds that net of partisanship, political ideology, and sociode-mographic factors, feminists were significantly more supportive of Demo-cratic presidential candidates in 1972, 1984, and 1988.10 Such findings sug-gest that political cleavages among women (and between women and men)
8 Approximately one-half of all marriages are predicted to end in divorce or separation(Cherlin 1992, pp. 23–25), and the percentage of adult women not currently marriedrose from 36.6% in 1960 to 47.2% in 1992 (Bianchi and Spain 1986; Spain and Bianchi1996).9 For example, consider the financial consequences of divorce: estimates of women’seconomic decline after divorce range from 13% to 35% (Peterson 1996, p. 529); foroverviews of the extensive research documenting the diverging material interests ofmen and women after divorce, see, e.g., Holden and Smock (1991); Sørensen (1992).10 Plutzer and Zipp (1996) find evidence that in 1992 the appeals of women candidatesrunning for statewide office among women voters were amplified by Democratic fe-male candidates who were seen as “feminist.”
1242
The Gender Gap
may be a product of growing identification with the feminist goals of thewomen’s movement.
Women’s Rising Labor Force Participation
The final mechanism that we consider for explaining the gender gap comesfrom interpretations that stress the political significance of the increasingproportion of women in the paid labor force. Labor force participationrates for women have risen steadily throughout the 20th century (risingfrom 33.9% in 1950 to 58.8% in 1994; see Spain and Bianchi 1976, p.81), but women’s wages have remained significantly below those of menoverall, despite recent improvements for some women (Marini 1989; Bern-hardt, Morris, and Handcock 1995; Petersen and Morgan 1995). Thereare a number of distinct processes through which labor force participationmay shape women’s political behavior. First, some analysts have hypothe-sized that work exposes voters to discussions about candidates, policy de-bates, and other information about political campaigns (e.g., Lipset 1981,p. 217). The disappearance of the turnout gap between men and womenis frequently viewed as a function of the increasing proportion of womenin the workforce, along with increases in women’s level of education (An-dersen 1975; Welch 1977; McDonough 1982; Baxter and Lansing 1983;Andersen and Cook 1985; Beckwith 1986; but see Wolfinger and Rosen-stone 1980, p. 43; Clark and Clark 1986).
Other analysts suggest that employment increases women’s support forfeminist political goals and political activism by providing women withlife experiences that call into question traditional gender roles (Rossi 1983;Klein 1984; Luker 1984, chap. 5; Gerson 1985, 1987). Further, paid em-ployment directly exposes women to gender inequalities that they are lesslikely to experience as homemakers, while also providing them with ameans of economic independence that may shape their political behavior.Finally, women are more dependent on the public sector (and the expan-sion of the welfare state) for employment than men (Erie and Rein 1988),and they also tend to depend more on social programs to support andsubsidize their families (Piven 1985; Deitch 1988).
The political significance of employment for women’s political attitudesand behavior remains controversial, however. Andersen and Cook (1985)report that employment influences attitudes toward work-related issues(such as whether women should be the first to be laid off ) but not broaderpolitical values. Similarly, using General Social Survey data, Plutzer(1988) and Deitch (1988) both found that labor force participation hasvery modest effects on support for feminist political goals; each reportsthat other sociodemographic variables have a much larger effect. Our
1243

American Journal of Sociology
evaluation of the work-centered approach reconsiders these debates in thecontext of the emergence of the gender gap in voting behavior.
Evaluating the Theories
The gender socialization thesis cannot be tested directly using the cross-sectional NES data that we analyze.11 If, however, this thesis is relevantto explaining the gender gap in presidential elections, we would expectthat variables representing sociodemographic cleavages should not ex-plain the gender gap, given that political differences between men andwomen are assumed not to be a function of interests. The women’s auton-omy thesis predicts that the women who are economically and psychologi-cally independent of men are the most likely to diverge from men in theirpolitical behavior. We test this claim by examining the effects of beingmarried over the 40-year period covered by our analyses. The feministconsciousness thesis predicts that women who identify with the women’smovement are the most likely to vote Democratic. To the extent to whichfeminist consciousness is growing, we can expect it to help explain theemergence of the gender gap (as discussed earlier, this thesis makes noclaims about whether feminist consciousness is concentrated among cer-tain social groups, but we explore this possibility as well in the course ofour analyses). The labor force participation thesis predicts that women inthe workforce are the most likely to be Democratic and that the growthof the gender gap in electoral politics reflects the increasing proportion ofworking women.
11 Perhaps the most decisive test of the socialization hypothesis, as one of the AJSreviewers pointed out, would be to examine the differences between men and womenon the use of force to attain foreign or domestic political goals. The disproportionatesupport for the use of force or military intervention in foreign policy among men iswell established (e.g., Smith 1984; Ruddick 1989; Wilcox, Ferrara, and Alsop 1993),though generally fairly small. Shapiro and Mahajan (1986) reviewed public opinionpolls from the 1960s to the 1980s and found an average of 6%–8% difference in opinionbetween men and women on the use of force. Such differences may lead to greatersupport for presidential candidates who advocate more moderate military postures—generally the Democrat—among women, and some analysts have suggested just suchan interpretation for the Reagan period (e.g., Frankovic 1982; Poole and Ziegler 1985;Sears and Huddy 1990; see also Gilens [1988] on the gender gap in presidential evalua-tions). Other analysts have found little evidence that attitudes toward the use of forceaffect gender differences in voting (e.g., Chaney et al. 1996). Given the considerablechanges over time in the foreign policies pursued by the parties (and their frequentconvergence in the pursuit of a “bipartisan” foreign and defense policy), as well asthe measurement problems associated with the variability of the specific “force” issuesin a given election, we do not analyze them here.
1244

The Gender Gap
TABLE 1
Variables from the NES
Variable Coding
1952–92 analyses:Partisan vote choice ......................... GOP voter 5 0; Democratic voter 5 1Gender ............................................... Men 5 0; women 5 1Linear year covariate* ..................... 1952 5 1, 1956 5 2, . . . , 1992 5 11Class location .................................... Dummy variables for professionals, managers,
routine white-collar workers, self-employed,skilled workers, and un- and semiskilledworkers; reference 5 non-labor-force partici-pant
Class identification ........................... Working class 5 1; all else 5 0Labor force participation ................. Nonparticipant 5 0; participant 5 1Years of education* ......................... 1 year 5 1, 2 years 5 2, . . . , 171 years 5 17Marital status* .................................. Not married 5 0; married 5 1Household income* .......................... Scaled to constant 1992 dollarsRace .................................................... African-American 5 1; all else 5 0Region ................................................ Dummy variables for residence in South, Mid-
west, or West; reference 5 NortheastCohort ................................................ Dummy variables for 1950s, 1960s, and 1970s
generations; reference 5 all else1980–92 analyses:
Gender role attitudes* ..................... Likert item: women should stay at home 5 1,. . . , should have an equal role 5 7
Views of social services* ................. Likert item: cut spending/services 5 1, . . . , in-crease spending/services 5 7
Views of women’s movement* ........ Feeling thermometer score: 0°–100°
* Continuous variable.
DATA AND MEASURES
We analyze data from the NES for presidential elections from 1952through 1992 (Center for Political Studies 1995). The NES is the premiersource of voting data for the United States and contains the items neces-sary to measure gender-based political cleavage in presidential electionsover an extended time period. The dependent variable in our analyses oftrends in the gender gap is major party vote choice (coded “1” for theDemocratic and “0” for the Republican candidate).
Table 1 summarizes the variables in our analyses. Gender is coded asa dichotomy (women 5 1). A number of analysts have found a relationshipbetween the class cleavage and the gender gap (Goertzel 1983; Burris1984; Wirls 1986, 1991), and in our multivariate analyses, we utilize threemeasures of class: objective class location, subjective class identification,
1245

American Journal of Sociology
and household income. Building upon recent work on class voting (Heath,Jowell, and Curtice 1985; Hout, Brooks, and Manza 1995; Manza, Hout,and Brooks 1995), our objective class location variables distinguish sixclass categories (professionals, managers, the self-employed, routinewhite-collar workers, foremen and skilled workers, and semi- and un-skilled workers), as well non-full-time labor force participants who areemployed less than 20 hours per week (this seventh category is treated asthe reference in the regression models). We have recoded the NES occupa-tional data for each election to conform to this class map.12 Our subjectiveclass identification measure is a dichotomy (working-class identifica-tion 5 1). Household income is a continuous variable, scaled to 1992dollars. In the models that do not include the six objective class dummyvariables, we use a separate dichotomous variable to analyze the effectsof labor force participation (employed more than 20 hours a week 5 1).The class and labor force participation variables enable us to test hypoth-eses about the role of work as a factor shaping women’s political attitudesand behavior.
To assess the possibility that generational shifts in socialization patterns(Inglehart 1990; cf. Miller and Shanks 1996) may be related to the emer-gence of the gender gap, we include in our regression models three dummyvariables for 1950s, 1960s, and 1970s cohorts. Cohort membership in the1950s is defined as respondents born between 1933 and 1944; the 1960scohort is defined as respondents born between 1945 and 1962; and the1970s cohort is defined as respondents born since 1963. We evaluate thewomen’s autonomy thesis with a marital status variable, coded as a di-chotomy (married 5 1). We also include a series of controls for years ofeducation, race (African-Americans 5 1), and region (three dummy vari-ables for South, Midwest, and West residence).
Gender differences in policy attitudes may mediate the relationship be-tween the various sociodemographic variables in our models and votechoice. A number of scholars have pointed to differences in attitudes to-ward domestic policy, especially the comparatively greater support ofwomen for social provision than men (Piven 1985; Deitch 1988; Erie andRein 1988) or a combination of issues (Chaney et al. 1996). Divergentviews of social provision are a potentially important source of voting dif-ferences, given the long-standing differences in the major parties’ domes-tic policy platforms. Other analysts have located the gender gap in grow-ing support for gender equality, including the ERA, among women (Klein1984, pp. 157–64; Burris 1984, p. 338; Smeal 1984).
Finally, some proponents of the feminist consciousness thesis assert that
12 Additional details about our occupational coding scheme can be found in Brooksand Manza (1997a).
1246

The Gender Gap
it is attitudes toward the women’s movement that lead to gender differ-ences in electoral politics. We use three scales to measure policy attitudesand feminist consciousness. These variables are only available for ouranalyses of recent presidential elections (1980–92). However, as will be-come clearer in the course of our analyses, the results have implicationsfor the earlier years in which we cannot measure these variables. The firstitem is a seven-point scale measuring support for social services in whichrespondents indicate their preference for increasing social service spend-ing versus cutting spending by decreasing social services. The other twoitems measure attitudes that relate to the feminist consciousness thesis.Both are seven-point Likert items, which we treat as continuous variables.The first of these tests attitudes toward gender role equality by askingwhether women and men should have equal roles in the family and theworkplace. In this item, response category “1” indicates the greatest sup-port for the view that “women’s place is in the home” and “7” indicatesthe greatest support for the view that “women should have an equal rolewith men in running business, industry, and government.” The seconditem is a 100-degree feeling thermometer that asks respondents to ratehow warmly they feel toward the women’s movement, with higher ther-mometer scores indicating more favorable views of the women’s move-ment.13
Measuring the Gender Gap
We conceptualize the gender gap in presidential elections as the averagedifference between men’s and women’s major party vote choice. Whenwomen’s and men’s votes are similar (i.e., both support the Democraticor Republican candidate at the same rate), the gap disappears, but whentheir votes diverge, the gap emerges. The gender gap varies from electionto election, and the task at hand is to determine whether there is evidencethat variation in its magnitude over time represents an emerging trend.
As presented in equation (1), our measure of the gender gap (κ) is calcu-lated as the standard deviation of the probability of Democratic votechoice ( j 5 1) among women and men (g 5 1 for women; 2 for men).This measure can be calculated using either the raw NES data (see fig.1’s first panel), or using the fitted probabilities according to a particular
13 The wording of this item has changed during the four surveys we analyze. In the1980 and 1984 surveys, the referent of this item is the “women’s liberation movement”;in 1988, the referent is “feminists”; and in 1992, the referent is the “women’s move-ment.” Given this change in question wording, we analyze each of these four surveysseparately rather than analyze them jointly, using election year as a covariate in ourmodels.
1247
American Journal of Sociology
statistical model (see fig. 1’s second panel). Either way, this index mea-sures the average difference in voting behavior among men and womenat a given year (t 5 1 for 1952, 2 for 1956, . . . , 11 for 1992), and bycomparing index scores over time, we can thus infer the strength anddirection of change in the gender gap over time:14
κt 5 √^G
g51
(Ptgj 2 Ptj)2
G.
(1)
Models
We derive the fitted probabilities of men’s and women’s vote choice fromthe coefficients of the logistic regression model that we select as the bestdescription of the data. The models we consider predict the log odds ofchoosing the Democratic over the Republican presidential candidate,which we designate by yij for vote choice j for person i in sample size N(i 5 1, . . . , N ). Because we are analyzing time trends, we have pooledthe 11 NES studies for 1952–92 into a single data set, in which time isitself a covariate. The base model (model 1 in table 2) includes terms onlyfor the main effect of election year (βtj).15 Insofar as this model does notinclude any gender-by-year interactions (or the main effect of gender), itserves as a useful comparison with models that parameterize trends in thegender gap:
yij 5 βj 1 ^T
t51
βtjCit. (2)
Our preferred model (model 6 in table 2) of change in the gender gaphas a single additional parameter (βgj) for the (changing) effect of being
14 Our measure of the gender gap follows our other recent work on the measurementof social cleavages (see, e.g., Brooks and Manza 1997a, 1997b, 1997c; Manza andBrooks 1997). These measures have several desirable properties and avoid the seriousbiases that often affect cleavage variables that have more than two categories (suchas religion and class). Note that because gender is measured as a dichotomy, the indexwe use in the current study is related to simpler, percentage difference measures (e.g.,gender gap 5 percentage of female Democratic voters 2 percentage of male Demo-cratic voters). For cleavage variables having only two categories, this percentage dif-ference measure is simply twice that of our standard deviation measure.15 In eq. (2), Cit represents dummy variables for election year. To identify the model,we set the lowest βtj (for the 1952 election) equal to zero.
1248

The Gender Gap
female (g 5 1) during the 1952 through 1992 elections.16 In equation (3),Di1 is a dummy variable for gender. The final term, Z2
i0, is a constantwith fixed scores for year (0 5 1952, 1 5 1956, . . . , 6 5 1976, and 7 5years $ 1980). The superscript indicates that the constant is squared, andthe constraint on time produced by this exponential function results inthe distinctive trend line observed in the graphed estimates of figure 1’sright-hand panel. In the course of our analyses, we compare this modelto competing specifications of change in the gender gap:
yij 5 βj 1 ^T
t51
βtjCit 1 ^1
g51
βgjDigZ2i0. (3)
Once we have chosen a preferred model, we add a series of explanatoryvariables to the model to determine whether they can explain away themagnitude of, and change in, the gender gap. Our explanatory analysesof the entire 1952–92 series provide evidence that a single causal process(increases in women’s labor force participation) is responsible for thechanging voting behavior of women (and thus the emergence of the gendergap). Taking advantage of the more detailed information available in re-cent NES surveys, we then conduct a finer-grained analysis, examiningthe attitudinal mechanisms that mediate the effect of labor force participa-tion. Taken together, these analyses provide us with a portrait of thecauses of gender differences and trends in the voting behavior of womenand men.
ANALYSES
The Evolution of the Gender Gap, 1952–92
In tables 2 and 3, we present fit statistics for competing models of thegender gap.17 Our first task is to compare models that include competingspecifications of trends in the gender gap. Once we have chosen a pre-ferred model, we then attempt, using the models in table 3, to explainaway the coefficient representing trends in the gender gap. If the coeffi-cient shrinks to statistical insignificance when explanatory variables areadded to the model, it indicates that the trend has been explained away.By estimating the trend coefficient when different combinations of theexplanatory variables have been added to the model, we test which of thelatter are responsible for the emergence of the gender gap.
16 Given that the preferred model does not include a term for the main effect of gender,it represents a highly parsimonious model of (change in) the gender gap.17 Models are discretely numbered within each table.
1249

TABLE 2
Logistic Regression Models of Change in the Gender Gap, 1952–92
22 Log Likelihood βgender*(year′)2
Model (df ) (SE)
1. Election year ......................................................................... 17,683.97 ⋅ ⋅ ⋅(13,070)
2. Model 1 1 gender 3 year1980/84/88 ........................................ 17,665.95 ⋅ ⋅ ⋅(13,069)
3. Model 1 1 gender 3 year1980/84/88/92 ..................................... 17,660.73 ⋅ ⋅ ⋅(13,069)
4. Model 1 1 gender ∗ year .................................................... 17,658.73 ⋅ ⋅ ⋅(13,069)
5. Model 1 1 gender ∗ (year)2 ................................................ 17,659.16 ⋅ ⋅ ⋅(13,069)
6. Model 1 1 gender ∗ (year′)2 ............................................... 17,656.82 .006†(13,069) (.0001)
7. Model 6 1 gender 3 year .................................................. 17,642.82 ⋅ ⋅ ⋅(13,060)
Note.—Linearly constrained interaction effects are designated by an asterisk, unconstrained interac-tion effects by a multiplication cross. Dependent variable is coded “0” for the choice of the Republicanand “1” for the choice of the Democratic presidential candidate; N 5 13,081.
† P 5 .05 (two-tailed test).
TABLE 3
Logistic Regression Models Explaining Change in the Gender Gap, 1952–92
22 Log Likelihood βgender*(year′)2
Model (df ) (SE)
1. Base model: election year, gender ∗ (year′)2 ..................... 15,370.90 .005†(11,398) (.001)
2. Model 1 1 class location, class identification, householdincome, cohort, marital status, education, race, and re-gion ........................................................................................ 14,286.17 .005†
(11,381) (.001)3. Model 2 1 significant two-way interactions: gender 3
marital status, women 3 1950s cohort ............................. 14,275.20 .005†(11,379) (.001)
4. Model 1 1 gender 3 labor force participation ................ 15,356.23 ,.002(11,397) (.001)
5. Model 4 1 labor force participation ................................. 15,356.22 .003(11,396) (.002)
6. Model 4 2 gender ∗ (year′)2 ............................................... 15,359.48 ⋅ ⋅ ⋅(11,398)
Note.—Linearly constrained interaction effects are designated by an asterisk, unconstrained interac-tion effects by a multiplication cross. Dependent variable is coded “0” for the choice of the Republicanand “1” for the choice of the Democratic presidential candidate; N 5 11,410.
† P 5 .05 (two-tailed test).
The Gender Gap
In table 2, model 2 parameterizes the gender gap as a product of onlythe 1980, 1984, and 1988 elections. This model improves the fit of model1 in table 2 (which includes only the main effects of election year). Model3 in table 2 measures the gender gap as also including the 1992 election,hypothesizing that the gender gap emerged as a single step by womentoward Democratic candidates beginning with the 1980 election. Model3 has the same degrees of freedom as model 2 but yields a considerablysmaller 22 log-likelihood statistic, indicating its superiority to model 2.
The trend parameter of model 4 (table 2) implies a very different hy-pothesis, that the gender gap emerged over the course of the entire 1952–92 period. This model also has the same number of parameters as model3, although its 22 log-likelihood statistic is smaller by 2.00. Using Raf-tery’s (1995) BIC index for comparing nonnested models, the BIC testprovides positive evidence (BIC improvement 5 22) favoring model 4.Model 5 (table 2) tests the hypothesis that the growth of the gender gapduring the 1952–92 period is best captured by an exponential function.Its fit is virtually identical to the fit of model 4, making comparisons usingthe BIC test inconclusive.
The specification of the gender gap in model 6 (table 2) uses a modifica-tion of the year2 term in model 5. In this model, the constant for the yearvariable is coded the same except for the past four elections (which receivethe same score of “7”). This constraint in the year scores has the effectof flattening out the voting trend among women in recent (i.e., 1980–92)elections, while still allowing for a curvilinear increase in their likelihoodof Democratic vote choice from 1952 through 1976. Model 6 results in asmaller 22 log-likelihood statistic than either model 5 (by 2.34), model 4(by 1.91), or model 3 (by 3.91) in table 2; the BIC test thus provides positiveevidence favoring model 6 over models 1–5.18 The comparison betweenmodels 6 and 7 (table 2) examines the evidence for any residual changein the gender gap (as captured by the unconstrained interaction of genderby time). The 22 log-likelihood test (as well as BIC) easily favors model6, making it our preferred model.19
18 We evaluated the fit of a model that adds to model 6 an additional term for themain effect of gender. The resultant reduction (3.36) in 22 log likelihood (for 1 df )favors model 6, implying that all gender differences in vote choice are already ac-counted for in model 6.19 We caution that the positive but not decisive evidence for our preferred model leavesthe testing of hypotheses about the gender gap partially open in the face of futureevidence (which would be available when our current analyses are supplemented withthe NES data from the 1996 election). However, the observed estimates of the gendergap using the VNS data (see fig. 1’s left-hand panel) are consistent with our preferredmodel’s specification of the trends and perhaps even more so with the alternativelinear specification used by model 4 (given that the VNS data for 1996 suggests thelargest gender gap to date). In the absence of these data, the main point to be appreci-
1251

American Journal of Sociology
The .006 coefficient from table 2 for the gender gap indicates that, be-tween 1952 and 1980, women’s log-odds of Democratic vote choice hasincreased by .29. This growth is not large in absolute terms, but its signifi-cance should be gauged relative to changes experienced by all voters (ascaptured by the election year coefficients in the model).20 As shown infigure 1’s second panel, this small but steady shift among women has thusresulted in the emergence of the gender gap in presidential elections. Theconstraint in our preferred model’s specification of change in the gendergap implies that the magnitude of this gap was stable between 1980 and1992. Taken together, these results direct our attention to the causal fac-tors that can explain these cumulative changes in the voting behavior ofwomen relative to men.
Explaining the Gender Gap
We evaluate competing explanations of change in the gender gap in table3. The models in table 3 add to the preferred model (model 6 in table 2)various subsets of our independent variables.21 Model 2 (table 3) adds themain effects of class-related factors, birth cohort, marital status, educa-tion, race, and region. While its improvement in fit is significant, the coef-ficient for the trend in the gender gap is not affected by the addition ofthese variables (i.e., it is .005 [SE 5 .001] in both models 1 and 2 of table3). This means that the additional sociodemographic factors introducedin model 2 do not explain the emergence of the gender gap. Model 3 (table3) adds two significant interaction effects, for gender by marital statusand gender by 1950s cohort. While this model improves over the fit ofboth the base model and model 2, the coefficient for the gender gap isagain unchanged.
In model 4 of table 3, we test a different causal hypothesis, that it iswomen’s greater entrance into the paid labor force that explains the gen-der gap. Model 4 adds to the base model the interaction of gender andlabor force status. Not only does model 4 improve the fit of the base model,it results in the coefficient for the gender gap shrinking to statistical insig-nificance (, .002; SE 5 .001), providing strong evidence that the changing
ated in the current study is that the evidence supports the inference that the gendergap stretches back to the 1950s. More specifically, model 4 and especially model 6are both preferred over model 3 using the BIC index for comparing nonnested models.20 In 1952, the probabilities of Democratic vote choice among women and men arepredicted as both being equal to .42. In 1972, these probabilities are .37 and .34, andin 1980 .47 and .4.21 The sample size for the analyses of table 3’s models is somewhat smaller than intable 2, reflecting the presence of missing values for the independent variables in table3’s models.
1252

The Gender Gap
rate of labor force participation among women explains the growth of thegender gap. In model 5 of table 3, we test an additional feature of laborforce participation by adding to model 4 an additional parameter for themain effect of labor force participation (i.e., the effect of labor force partic-ipation among men). Model 5 does not improve over the fit of model 4.Taken in tandem with the comparison of the base model and model 4,this result implies that labor force participation has an effect on votechoice only among women.
As a final test, we compare models 4 and 6 in table 3. We derive model6 from model 4 by constraining the coefficient for the gender gap to beequal to zero. The comparison of their respective fits favors model 6 (atP 5 .05), showing that the inclusion of the interaction between women andlabor force participation appears to be sufficient to explain away women’schanging voting behavior over the 1952–92 period. As a result, the inclu-sion of a trend parameter for the gender gap is now unnecessary in model6. This result suggests the importance of work-related factors to the emer-gence of the gender gap.
Mediating Role of Policy Attitudes
To this point, our analyses provide evidence that changing rates of laborforce participation among women explain the emergence of the gendergap. We now examine the impact of attitudes toward gender roles andsocial services to evaluate whether and how these attitudes may mediatethe effects of labor force participation. For these analyses, we take advan-tage of data from recent NES surveys that have asked questions aboutgender roles, social service spending, and feminist consciousness.
We consider the possible roles of attitudes toward gender roles and so-cial service spending using the models and coefficients presented in table4. While the data is for the 1984 through 1992 elections, our strategy issimilar to the analyses of the longer 1952–92 series: we compare modelswith explanatory factors (relating here to attitudes toward gender rolesand social service spending), presenting for each model the coefficient forthe main effect of gender during the 1984–92 period.22 If the coefficientfor gender becomes insignificant, it indicates that the independent vari-ables for the model in question have explained away the gender gap inthese three elections. (Note that labor force participation is not consideredin table 4’s models but is analyzed separately in table 5.)
22 Given the stability of the gender gap since 1980 according to our preferred model(see fig. 1), it is sufficient to measure the gender gap during the 1984–92 period asthe main effect of gender (rather than a gender-by-time interaction, as would be appro-priate when elections prior to 1980 are analyzed).
1253
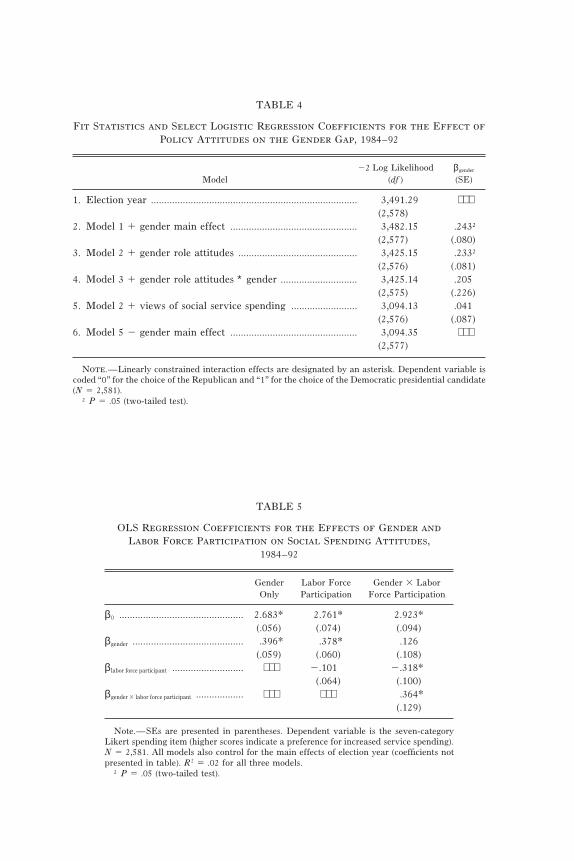
TABLE 4
Fit Statistics and Select Logistic Regression Coefficients for the Effect ofPolicy Attitudes on the Gender Gap, 1984–92
22 Log Likelihood βgender
Model (df ) (SE)
1. Election year .............................................................................. 3,491.29 ⋅ ⋅ ⋅(2,578)
2. Model 1 1 gender main effect ................................................ 3,482.15 .243†(2,577) (.080)
3. Model 2 1 gender role attitudes ............................................. 3,425.15 .233†(2,576) (.081)
4. Model 3 1 gender role attitudes ∗ gender ............................. 3,425.14 .205(2,575) (.226)
5. Model 2 1 views of social service spending ......................... 3,094.13 .041(2,576) (.087)
6. Model 5 2 gender main effect ................................................ 3,094.35 ⋅ ⋅ ⋅(2,577)
Note.—Linearly constrained interaction effects are designated by an asterisk. Dependent variable iscoded “0” for the choice of the Republican and “1” for the choice of the Democratic presidential candidate(N 5 2,581).
† P 5 .05 (two-tailed test).
TABLE 5
OLS Regression Coefficients for the Effects of Gender andLabor Force Participation on Social Spending Attitudes,
1984–92
Gender Labor Force Gender 3 LaborOnly Participation Force Participation
β0 ............................................... 2.683* 2.761* 2.923*(.056) (.074) (.094)
βgender .......................................... .396* .378* .126(.059) (.060) (.108)
β labor force participant ........................... ⋅ ⋅ ⋅ 2.101 2.318*(.064) (.100)
βgender 3 labor force participant .................. ⋅ ⋅ ⋅ ⋅ ⋅ ⋅ .364*(.129)
Note.—SEs are presented in parentheses. Dependent variable is the seven-categoryLikert spending item (higher scores indicate a preference for increased service spending).N 5 2,581. All models also control for the main effects of election year (coefficients notpresented in table). R2 5 .02 for all three models.
† P 5 .05 (two-tailed test).
The Gender Gap
In table 4, model 2 readily improves the fit of model 1, corroboratingour earlier result that women’s and men’s vote choices have differed sig-nificantly during the 1984, 1988, and 1992 elections.23 Using model 3 (table4), we test the hypothesis that the proximate source of the gender gap iswomen’s and men’s attitudes toward gender roles. While model 3’s fit issuperior to model 2, the coefficient is largely unchanged across models.We also find no support for an interaction between gender role attitudesand gender (model 3 is preferred to model 4). Gender role attitudes, whilean important source of voting preferences in their own right, do not appearto explain the gender gap in vote choice between men and women.24
The key lies with men’s and women’s contrasting preferences for socialservices spending. Model 5 (table 4) adds to model 2 the main effect of atti-tudes toward social service spending. Not only does it readily improve thefit of the model, the coefficient has now shrunk to a nonsignificant .041 (SE5 .087). In turn, the improvement of model 6 (table 4) over model 5 showsthat the gender main effect can be deleted from the model once male-female differences in spending preferences have been taken into account.
In table 5, we develop a more comprehensive portrait of the respectiveroles of our two explanatory factors (labor force participation and socialservices spending preferences). The most plausible causal interpretationis that labor force participation shapes working women’s (more favorable)views of social service spending, which then serves as the proximate causeof their voting differences with men. To consider the evidence for thisinterpretation, we adopt a simplified path-analytic strategy, treating thespending item as our new dependent variable (we choose an ordinary leastsquares [OLS] specification for our analyses of this Likert item). By com-paring the coefficients for three models presented in table 5, we testwhether the source of gender differences in views of social service spend-ing is to be found in the distinctive preferences of working women.
The results presented in table 5 support this interpretation. The firstcolumn’s coefficient shows that women as a whole favor increased socialservice spending (relative to men’s preferences). The second columnshows the results of adding the main effect of labor force participation tothe model, and this coefficient is not significant, corroborating our earlierresults. The third column’s model uses the correct “gendered” specification
23 The .243 (SE 5 .080) coefficient for gender represents the phenomenon to be ex-plained in subsequent models.24 The explanation for this is that men’s and women’s gender role attitudes are, onaverage, quite similar; their respective means on the gender role item during the threeelections in question are 4.44 and 4.49. Differences between men and women are thusconsiderably less pronounced than differences among men and women with respectto gender role attitudes.
1255
American Journal of Sociology
TABLE 6
The Effect of Feminist Consciousness on the Gender Gap, 1980–92
22 Log Likelihood βgender
Model (df ) (SE)
1980:Gender main effect .................................................................... 1,128.47 .306*
(829) (.14)Gender main effect 1 feelings toward the women’s libera-
tion movement ........................................................................ 1,060.03 .336*(828) (.15)
1984:Gender main effect .................................................................... 1,574.42 .340*
(1,174) (.12)Gender main effect 1 feelings toward the women’s libera-
tion movement ........................................................................ 1,442.90 .322*(1,173) (.13)
1988:Gender main effect .................................................................... 1,340.79 .278*
(974) (.13)Gender main effect 1 feelings toward feminists ................... 1,238.27 .276*
(973) (.14)1992:
Gender main effect .................................................................... 1,565.43 .270*(1,154) (.12)
Gender main effect 1 feelings toward the women’s move-ment ......................................................................................... 1,359.64 .059
(1,153) (.13)
Note.—Dependent variable is coded “0” for Republican and “1” for the Democratic presidential candi-date. Sample sizes for the four elections are as follows: N 5 831 (1980); N 5 1,176 (1984); N 5 976 (1988);and N 5 1,156 (1992).
* P 5 .05 (two-tailed test).
of the political effects of labor force participation by adding an interac-tion of gender and labor force participation. The coefficient for this inter-action is significant (.364; SE 5 .129), and its presence in the model resultsin the coefficient for the main effect of gender shrinking to insignificance.These results provide evidence that gender differences in attitudes towardsocial service spending are a product of the specific spending preferencesof working women.
Feminist Consciousness
Our final analyses examine the possible role that feminist attitudes mayplay in the gender gap. Given that the wording of the NES item measuringfeminist consciousness has undergone significant changes (see n. 13), we
1256
The Gender Gap
TABLE 7
The Effects of Attitudes toward the Women’sMovement versus Social Service Spending
on Presidential Vote Choice, 1992
Logistic Regression PredictedCoefficient Effecta
βwomen’s movement ................................ .037* .172(.004)
βsocial services ...................................... .466* .155(.051)
βgender ............................................ 2.125 ⋅ ⋅ ⋅(.139)
β0 .................................................. 23.253* ⋅ ⋅ ⋅(.260)
Note.—SEs are presented in parentheses. Dependent variable is ma-jor party vote choice (coded “1” for the Democratic candidate). N 5 1,156.Higher scores on the feeling thermometer indicate more favorable viewsof the women’s movement; higher scores on the spending item indicatea preference for increased social service spending.
a Predicted increase in the probability of Democratic candidate choiceresulting from a 1 SD increase in a given independent variable (holdingthe other variables constant at their means).
* P 5 .05 (two-tailed test).
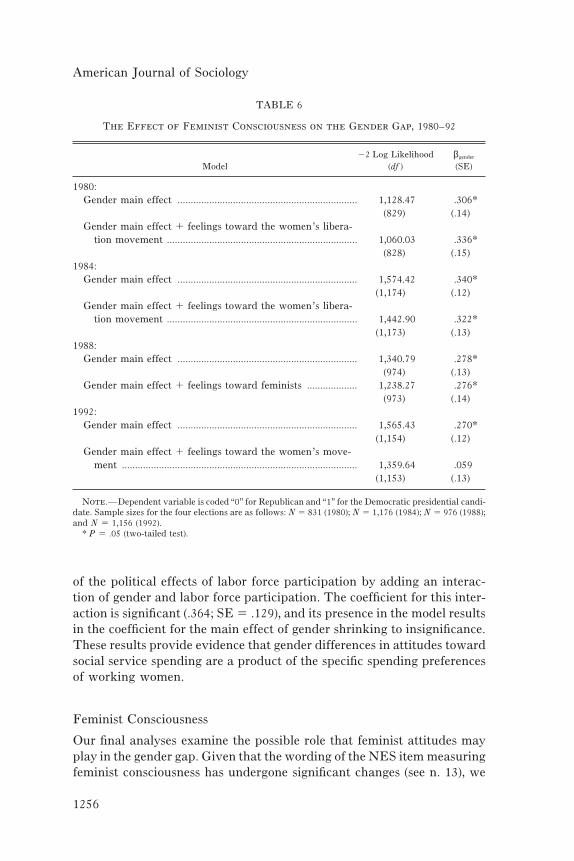
treat these analyses separately from the earlier analyses of policy attitudes.In table 6, we test whether adding the feminist consciousness feeling ther-mometer item to a model with a main effect for gender explains away thegender coefficient. The strategy is identical to our earlier analyses, but wetreat each year separately in light of the changes in the question wording.
Predictably, the gender main effect model yields a significant coefficientfor each of the four years (see the second column). In the first three elec-tions, however, adding the feminist consciousness feeling thermometerdoes not explain away the gender coefficient. The fit statistics favor thefeminist consciousness model, showing that attitudes toward the women’smovement have a significant impact on vote choice. Feminist conscious-ness thus does not account for the gender gap in these three elections.25
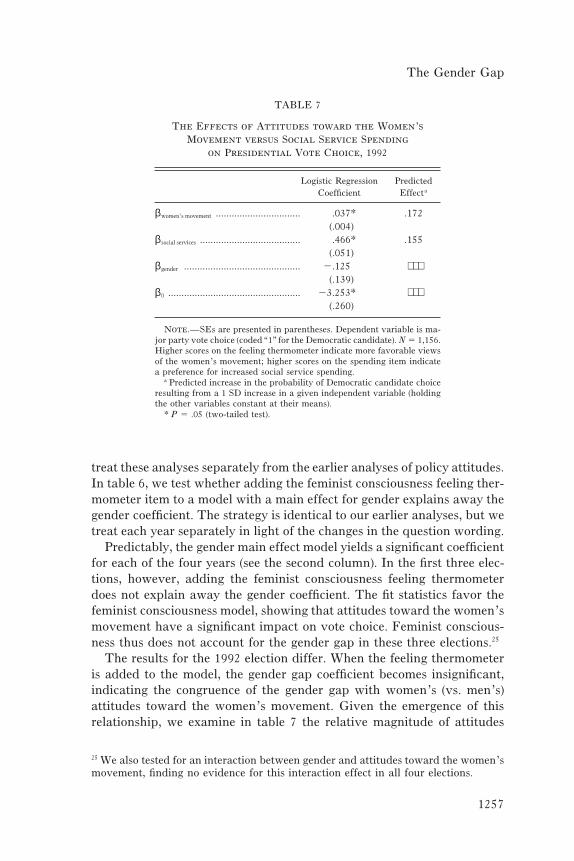
The results for the 1992 election differ. When the feeling thermometeris added to the model, the gender gap coefficient becomes insignificant,indicating the congruence of the gender gap with women’s (vs. men’s)attitudes toward the women’s movement. Given the emergence of thisrelationship, we examine in table 7 the relative magnitude of attitudes
25 We also tested for an interaction between gender and attitudes toward the women’smovement, finding no evidence for this interaction effect in all four elections.
1257
American Journal of Sociology
TABLE 8
OLS Regression Coefficients for Effects of Gender andLabor Force Participation on Attitudes toward the
Women’s Movement, 1992
Gender Labor Force Gender 3 LaborOnly Participation Force Participation
β0 .................................. 58.682* 59.347* 62.560*(.991) (1.38) (1.86)
βgender ............................ 6.126* 5.937* 1.149(1.35) (1.38) (2.27)
β labor force participant .............. ⋅ ⋅ ⋅ 2.930 25.417*(1.40) (2.19)
βgender 3 labor force participant .... ⋅ ⋅ ⋅ ⋅ ⋅ ⋅ 7.559*(2.85)
Note.—SEs are presented in parentheses. Dependent variable is the 100-pointfeeling thermometer (higher scores indicate more favorable views of the women’smovement). N 5 1,156. R2 5 .02 for all three models.
* P 5 .05 (two-tailed test).
toward the women’s movement and social service spending on vote choicein the 1992 election. Table 7’s first column of estimates are logistic regres-sion coefficients, and while both are significant, differences in the varianceand units of measurement among the two independent variables make adirect comparison between coefficients somewhat difficult.26 As a meansof directly comparing the magnitudes of these two effects, we thus present,in the second column, calculations that measure the impact of the twovariables in terms of changes measured in their (respective) standard devi-ations.27 The predicted probabilities values of .172 and .155 suggest thatthe impact of attitudes toward the women’s movement is slightly larger:Whereas a standard deviation increase in favorable feelings about thewomen’s movement increases the probability of favoring the Democraticcandidate by .17, a corresponding standard deviation increase in supportfor social service spending increases the probability by .16.
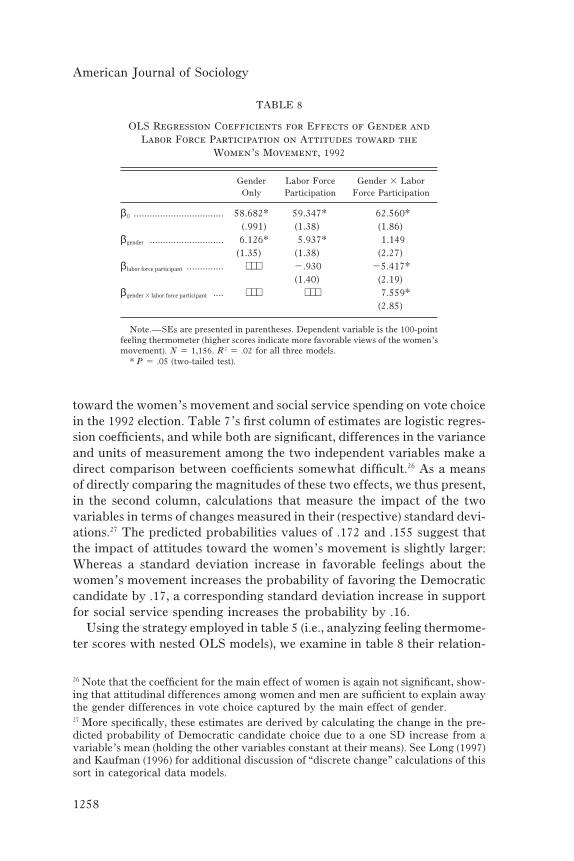
Using the strategy employed in table 5 (i.e., analyzing feeling thermome-ter scores with nested OLS models), we examine in table 8 their relation-
26 Note that the coefficient for the main effect of women is again not significant, show-ing that attitudinal differences among women and men are sufficient to explain awaythe gender differences in vote choice captured by the main effect of gender.27 More specifically, these estimates are derived by calculating the change in the pre-dicted probability of Democratic candidate choice due to a one SD increase from avariable’s mean (holding the other variables constant at their means). See Long (1997)and Kaufman (1996) for additional discussion of “discrete change” calculations of thissort in categorical data models.
1258

The Gender Gap
ship with labor force participation. The results are very similar to theearlier analyses of spending preferences: male-female differences in viewsof the women’s movement appear to be a product of working women’sdistinctive attitudes.28 We thus infer that, while feminist consciousnessemerged as a relevant source of gender differences in vote choice duringthe 1992 election, it is the distinctive experiences of working women thatappear to explain this interrelationship (Chaney et al. 1996).
DISCUSSION
There have been significant changes in the economic status of women inAmerican society since World War II, and these changes appear to haveimportant repercussions for electoral politics. Our analysis of the originsand development of the gender gap provide evidence that it can be tracedto the steady increase in the proportion of women in the paid labor force.The causal logic of our interpretation is summarized in the top half offigure 2. The steadily increasing proportion of women in the workplace—an arena where women have been, and continue to be, disadvantagedrelative to men—has resulted in a cumulative net shift among womentoward support for Democratic presidential candidates. The labor force/vote choice relationship among women is, however, mediated by theirviews of social provision and, more recently, by views of the women’smovement. More women are dependent on an activist public sector foraccess to jobs, public social provision for help with childcare and otherparental responsibilities, and (especially as actual or potential single moth-ers with lower-paid employment prospects) income maintenance pro-grams such as the Earned Income Tax Credit. As the party that has beenmore receptive to building or maintaining such social programs, the Dem-ocrats have thus benefited from the increasing proportion of women inthe workforce since the 1950s.
Our analyses show that the causal factors identified by the socializationand autonomy theses are largely irrelevant to the gender gap in presiden-tial elections. We find that it is not socialization processes that all womenexperience but later life experiences linked to work situation that has sig-nificant partisan effects. While the transformation of the traditional family
28 More specifically, the initial 6.126 (SE 5 1.35) coefficient for the main effect ofgender is largely unchanged when the main effect of labor force participation is pa-rameterized in the model but shrinks to a nonsignificant 1.149 (SE 5 2.27) when theinteraction between gender and labor force participation (7.559 [SE 5 2.85]) is addedto the model. In other words, the roughly six degrees difference in men’s and women’sfeelings about the women’s movement in 1992 is actually a product of the differencesamong working women (vs. men and nonworking women).
1259

American Journal of Sociology
is shaping voting preferences, it is doing so among both men and women,and thus cannot account for the gender gap. The role of feminist con-sciousness in the gender gap is an interesting and complicated issue. Atti-tudes toward the women’s movement do shape voting behavior, but be-cause both men and women have come to view it in a more favorablelight, changes in their respective attitudes do not appear to explain theemergence of the gender gap through 1988. This changed in the 1992 elec-tions, when increased differences in male versus female attitudes towardthe women’s movement became as important as their differing attitudestoward public social provision in explaining their divergent voting be-havior.
However, we cannot rule out another way in which rising feminist con-sciousness (and also spending attitudes) may have shaped the emergenceof the gender gap. The scenario is illustrated in the two panels of figure2. As discussed earlier, the top panel assumes that women are enteringthe labor force because of social and economic factors, such as greatereconomic opportunities, family disruption, or stagnating wages for maleworkers. The bottom panel, by contrast, implies that rising feminist con-sciousness and change in policy attitudes caused more women to enterthe workforce in the first place. If the latter is a better representation ofthe underlying process causing women to enter the labor force, then wecannot rule out a more fundamental causal role of attitudinal changes inthe emergence of the gender gap. As a result, their causal interrelation-ships with labor force participation are less certain (thus we designatethem with dashed lines in the bottom panel of fig. 2).
The issue raised by the two models shown is, in principle, straightfor-ward: “Do the observed differences [in women’s voting] result from differ-ential selection into the categories of the independent variable, or from‘reaction to the roles as they are lived’?” (Anderson and Cook 1985, p.609). However, existing scholarship is inconclusive on this issue. Somehave argued that it is entering an employment relationship that is the keyto shaping consciousness, while others have emphasized prior valuesabout gender roles.29 To adequately assess the role of selection versus em-ployment socialization, we would need panel data that surveys womenrespondents before and after they make the decision to enter the work-force. No such data is available over the long time period in which we areinterested, and we would not wish to generalize from the more historicallylimited panels that are available. It remains an issue worth further explo-ration.
29 For the argument about the work socialization argument in shaping women’s con-sciousness, see, e.g., Ferree (1980), Gerson (1985), and Sapiro (1991); for a more equivo-cal set of findings, see, e.g., Andersen and Cook (1985).
1260

The Gender Gap
Fig. 2.—Social and economic change versus attitudinal change in explainingthe gender gap.
With these caveats in mind, we conclude from our results that risinglabor force participation rates among women provide the best way of un-derstanding the origins of the gender gap to date. Our measure of “work”is, to be sure, limited in important ways. It bears noting that our simpledichotomous labor force participation variable ignores additional infor-mation about both the quantity and quality of participation (i.e., hoursworked, type of job). This is undoubtedly significant. For example, morewomen than men are employed in part-time or temporary jobs, withoutthe security of employment associated with regular full-time jobs. Womenare also less likely to be employed in higher-wage occupations. It is impor-tant to understand, however, that this means that our labor force partici-pation variable may underestimate the political effects of employment. In
1261

American Journal of Sociology
other words, if we had better data on work situation over our entire timeseries, the interrelationship between gender, work experience, and votechoice might actually be somewhat stronger than the results reported herewould imply.
The increasing importance of work on gender-based political divisionshas not been systematically understood by previous scholarly or journalis-tic analysts. Even when political commentators have referred to work-related factors among women, they have failed to grasp their politicalsignificance. For instance, a Time cover story (October 14, 1996), ap-pearing during the final weeks of the 1996 campaign, suggested that “BobDole and Bill Clinton will do anything to win the hearts and votes ofworking moms, but many of them are too busy to notice.” To the contrary,it appears that working women have noticed and are choosing accord-ingly.
REFERENCES
Abzug, Bella. 1984. Gender Gap. Boston: Houghton Mifflin.Almond, Gabriel, and Sidney Verba. 1963. The Civic Culture. Boston: Little, Brown.Alpern, Sara, and Dale Baum. 1985. “Female Ballots: The Impact of the Nineteenth
Amendment.” Journal of Interdisplinary History 26:43–67.Andersen, Kristi. 1975. “Working Women and Political Participation, 1952–1972.”
American Journal of Political Science 19:439–53.Andersen, Kristi, and Elizabeth A. Cook. 1985. “Women, Work, and Political Atti-
tudes.” American Journal of Political Science 29:606–25.Baxter, Sandra, and Marjorie Lansing. 1983. Women and Politics: The Visible Major-
ity. Ann Arbor: University of Michigan Press.Beckwith, Karen. 1986. American Women and Political Participation: The Impacts
of Work, Generation, and Feminism. Westport, Conn.: Greenwood.Bendyna, Mary E., and Celinda Lake. 1994. “Gender and Voting in the 1992 Presiden-
tial Election.” Pp. 237–54 in The Year of the Woman, edited by Elizabeth A. Cook,Sue Thomas, and Clyde Wilcox. Boulder, Colo.: Westview.
Bennett, Linda L. M., and Stephen E. Bennett. 1993. “Changing Views about GenderEquality in Politics: Gradual Change and Lingering Doubts.” Pp. 46–56 in Womenin Politics: Outsiders or Insiders? edited by Lois L. Duke. Englewood Cliffs, N.J.:Prentice-Hall.
Berelson, Bernard R., Paul F. Lazarsfeld, and William McPhee. 1954. Voting: A Studyof Opinion Formation in a Presidential Campaign. Chicago: University of ChicagoPress.
Bernhardt, Annette, Martina Morris, and Mark S. Handcock. 1995. “Women’s Gainsor Men’s Losses? A Closer Look at the Shrinking Gender Gap in Earnings.” Ameri-can Journal of Sociology 101:302–28.
Bianchi, Suzanne M., and Daphne Spain. 1986. American Women in Transition. NewYork: Russell Sage.
Bolce, Louis. 1985. “The Role of Gender in Recent Presidential Elections: Reaganand the Reverse Gender Gap.” Presidential Studies Quarterly 15:372–85.
Bourque, Susan C., and Jean Grossholtz. 1974. “Politics as Unnatural Practice: Politi-cal Science Looks at Female Participation.” Politics and Society 4:225–66.
1262

The Gender Gap
Brooks, Clem, and Jeff Manza. 1997a. “Class Politics and Political Change in theUnited States, 1952–1992.” Social Forces 76:379–408.
———. 1997b. “The Social and Ideological Bases of Middle-Class Political Align-ments in the United States, 1972–1992.” American Sociological Review 62:191–208.
———. 1997c. “Social Cleavages and Political Alignments: U.S. Presidential Elec-tions, 1960–1992.” American Sociological Review 63:937–46.
Burris, Val. 1984. “The Meaning of the Gender Gap: A Comment on Goertzel.” Jour-nal of Political and Military Sociology 12:335–43.
Campbell, Angus, Philip E. Converse, Warren Miller, and Donald E. Stokes. 1960.The American Voter. New York: Wiley.
Carroll, Susan J. 1988. “Women’s Autonomy and the Gender Gap: 1980 and 1982.”Pp. 236–57 in The Politics of the Gender Gap, edited by Carol Mueller. NewburyPark, Calif.: Sage.
Carroll, Susan J., and Linda M. G. Zerilli. 1993. “Feminist Challenges to PoliticalScience.” Pp. 55–76 in Political Science: The State of the Discipline II, edited byAda Finifter. Washington, D.C.: American Political Science Association.
Center for Political Studies. 1995. American National Election Studies, 1948–1994.MRDF and codebooks. Ann Arbor: Inter-University Consortium for Political andSocial Research, Institute for Social Research.
Chaney, Carole, R. Michael Alvarez, and Jonathan Nagler. 1996. “Explaining theGender Gap in the 1996 Presidential Election.” Paper presented at the meeting ofthe Midwest Political Science Association, Chicago, April.
Cherlin, Andrew. 1992. Marriage, Divorce, Remarriage. Cambridge, Mass.: HarvardUniversity Press.
Chodorow, Nancy. 1978. The Reproduction of Mothering. Berkeley and Los Angeles:University of California Press.
Clark, Cal, and Janet Clark. 1986. “Models of Gender and Political Participation inthe United States.” Women and Politics 6:5–25.
Conover, Pamela Johnston. 1988. “Feminists and the Gender Gap.” Journal of Politics50:985–1010.
Cook, Elizabeth A. 1989. “Measuring Feminist Consciousness.” Women and Politics9:71–88.
———. 1993. “Feminist Consciousness and Candidate Preference among AmericanWomen, 1972–1988.” Political Behavior 15:228–46.
Cook, Elizabeth A., and Clyde Wilcox. 1991. “Feminism and the Gender Gap: A Sec-ond Look.” Journal of Politics 53:1111–22.
Darcy, R., Susan Welch, and Janet Clark. 1994. Women, Elections, and Representa-tion, 2d ed. Lincoln: University of Nebraska Press.
Deitch, Cynthia. 1988. “Sex Differences in Support for Government Spending.” Pp.192–216 in The Politics of the Gender Gap, edited by Carol Mueller. Newbury Park,Calif.: Sage.
Delli Carpini, Michael X., and Esther R. Fuchs. 1993. “The Year of the Woman? Candi-dates, Voters, and the 1992 Elections.” Political Science Quarterly 108:29–36.
Elshtain, Jean Bethke. 1984. “Reclaiming the Socialist-Feminist Citizen.” SocialistReview 74:23–30.
Erie, Steven P., and Martin Rein. 1988. “Women and the Welfare State.” Pp. 173–91 in The Politics of the Gender Gap, edited by Carol Mueller. Newbury Park,Calif.: Sage.
Faludi, Susan. 1991. Backlash. New York: Crown.Feltner, Paula, and Leneen Goldie. 1974. “The Impact of Socialization and Personality
on the Female Voter: Speculations Tested with 1964 Presidential Data.” WesternPolitical Quarterly 27:680–92.
1263
American Journal of Sociology
Ferree, Myra Marx. 1980. “Working Class Feminism: A Consideration of the Conse-quences of Feminism.” Sociological Quarterly 21:173–84.
Firebaugh, Glenn, and Kevin Chen. 1995. “Vote Turnout of Nineteenth AmendmentWomen: The Enduring Effects of Discrimination.” American Journal of Sociology100:972–96.
Frankovic, Kathleen. 1982. “Sex and Politics: New Alignments, Old Issues.” PS 15:439–48.
Gerson, Kathleen. 1985. Hard Choices: How Women Decide about Work, Career, andMotherhood. Berkeley and Los Angeles: University of California Press.
———. 1987. “Emerging Social Divisions among Women: Implications for WelfareState Policies.” Politics and Society 15:213–21.
Gilens, Martin. 1988. “Gender and Support for Reagan: A Comprehensive Model ofPresidential Approval.” American Journal of Political Science 32:19–49.
Gilligan, Carol. 1982. In a Different Voice: Psychological Theory and Women’s Devel-opment. Cambridge, Mass.: Harvard University Press.
Goertzel, Ted G. 1983. “The Gender Gap: Sex, Family Income, and Political Opinionsin the Early 1980s.” Journal of Political and Military Sociology 11:209–22.
Greenstein, Fred. 1965. Children and Politics. New Haven, Conn.: Yale UniversityPress.
Gurin, Patricia. 1985. “Women’s Gender Consciousness.” Political Opinion Quarterly49:143–63.
Hartmann, Heidi. 1981. “The Family as the Locus of Gender, Class, and PoliticalStruggle.” Signs 6:366–94.
Hartmann, Susan M. 1989. From Margin to Mainstream: American Women and Poli-tics since 1960. Philadelphia: Temple University Press.
Heath, Anthony, Roger Jowell, and John Curtice. 1985. How Britain Votes. London:Pergamon.
Heideprien, Nikki, and Celinda C. Lake. 1987. “The Women’s Vote: The WinningEdge.” Policy Report 3 (7): 1, 6–7.
Hess, Robert D., and Judith V. Torney. 1967. The Development of Political Attitudesin Children. Chicago: Aldine.
Holden, Karen C., and Pamela J. Smock. 1991. “The Economic Costs of Marital Disso-lution.” Annual Review of Sociology 17:51–78.
Hout, Michael, Clem Brooks, and Jeff Manza. 1995. “The Democratic Class Strugglein the United States, 1948–1992.” American Sociological Review 60:805–28.
Inglehart, Ronald. 1990. Culture Shift in Advanced Industrial Societies. Princeton,N.J.: Princeton University Press.
Jennings, M. Kent. 1988. Preface to The Politics of the Gender Gap, edited by CarolMueller. Newbury Park, Calif.: Sage.
Kaufman, Robert. L. 1996. “Comparing Effects in Dichotomous Logistic Regression:A Variety of Standardized Coefficients.” Social Science Research 77:90–109.
Kelly, Rita Mae, and Mary Boutilier. 1974. The Making of Political Woman: A Studyof Socialization and Role Conflict. Chicago: Nelson-Hall.
Kenski, Henry C. 1988. “The Gender Factor in a Changing Electorate.” Pp. 38–60in The Politics of the Gender Gap, edited by Carol Mueller. Newbury Park, Calif.:Sage.
Klatch, Rebecca. 1987. Women of the New Right. Philadelphia: Temple UniversityPress.
Klein, Ethel. 1984. Gender Politics. Cambridge, Mass.: Harvard University Press.———. 1985. “The Gender Gap: Different Issues, Different Answers.” Brookings Re-
view 4 (Winter): 33–37.Lane, Robert. 1959. Political Life. New York: Free Press.
1264
The Gender Gap
Lemons, J. Stanley. 1973. The Woman Citizen: Social Feminism in the 1920s, 2d ed.Chicago: University of Chicago Press.
Lipset, Seymour Martin. (1960) 1981. Political Man. Baltimore: Johns Hopkins Uni-versity Press.
Long, J. Scott. 1997. Regression Models for Categorical and Limited Dependent Vari-ables. Thousand Oaks, Calif.: Sage.
Luker, Kristin. 1984. Abortion and the Politics of Motherhood. Berkeley and LosAngeles: University of California Press.
Mansbridge, Jane. 1985. “Myth and Reality: The ERA and the Gender Gap in the1980 Election.” Public Opinion Quarterly 49:164–78.
Manza, Jeff, and Clem Brooks. 1997. “The Religious Factor in U.S. Presidential Elec-tions, 1960–1992.” American Journal of Sociology 103:38–81.
Manza, Jeff, Michael Hout, and Clem Brooks. 1995. “Class Voting in Capitalist De-mocracies since World War II: Dealignment, Realignment, or Trendless Fluctua-tion?” Annual Review of Sociology 21:137–63.
Marini, Margaret M. 1989. “Sex Differences in Earnings in the United States.” Ameri-can Sociological Review 15:343–80.
McDonough, Eileen L. 1982. “To Work or Not to Work: The Differential Impact ofAchieved and Derived Status upon the Political Participation of Women, 1956–1976.” American Journal of Political Science 26:280–97.
Merriam, C. L., and H. F. Gosnell. 1924. Non-Voting: Causes and Methods of Control.Chicago: University of Chicago Press.
Miller, Arthur. 1983. “The Emerging Gender Gap in American Elections.” ElectionPolitics 1:7–12.
Miller, Arthur, Anne Hildreth, and Grace L. Simmons. 1988. “The Mobilization ofGender Group Consciousness.” Pp. 106–34 in The Political Interests of Gender,edited by Kathleen B. Jones and Anna G. Jonasdottir. Newbury Park, Calif.: Sage.
Miller, Warren E., and J. Merrill Shanks. 1996. The New American Voter. Cambridge,Mass.: Harvard University Press.
Mueller, Carol M., ed. 1988. The Politics of the Gender Gap. Newbury Park, Calif.:Sage.
Norris, Pippa. 1985. “The Gender Gap in Britain and America.” Parliamentary Affairs38:192–201.
Petersen, Trond, and Laurie A. Morgan. 1995. “Separate and Unequal: Occupation-Establishment Sex Segregation and the Gender Wage Gap.” American Journal ofSociology 101:329–65.
Peterson, Richard R. 1996. “A Re-Evaluation of the Economic Consequences of Di-vorce.” American Sociological Review 61:528–36.
Piven, Frances F. 1985. “Women and the State: Ideology, Power, and the WelfareState.” Pp. 265–87 in Gender and the Life Course, edited by Alice Rossi. New York:Aldine de Gruyter.
Plutzer, Eric. 1988. “Work Life, Family Life, and Women’s Support of Feminism.”American Sociological Review 53:640–49.
Plutzer, Eric, and John F. Zipp. 1996. “Gender Identity and Voting for Women Candi-dates.” Public Opinion Quarterly 60:30–57.
Poole, Keith, and Harmon Ziegler. 1985. Women, Public Opinion, and Politics. NewYork: Longman.
Raftery, E. Adrian. 1995. “Bayesian Model Selection in Sociology.” Sociological Meth-odology 25:111–63.
Rossi, Alice. 1983. “Beyond the Gender Gap: Women’s Bid for Political Power.” SocialScience Quarterly 64:718–33.
Ruddick, Sara. 1989. Maternal Thinking. Boston: Beacon Press.
1265
American Journal of Sociology
Sapiro, Virginia. 1983. The Political Integration of Women. Urbana: University ofIllinois Press.
———. 1991. “Feminism: A Generation Later.” Annals of the American Academy ofPolitical and Social Sciences 515:10–22.
Sears, David O., and Leonie Huddy. 1990. “On the Origins of Political Disunity amongWomen.” Pp. 249–77 in Women, Politics and Change, edited by Louise Tilly andPatricia Gurin. New York: Russell Sage.
Shapiro, Robert Y., and Harpreet Mahajan. 1986. “Gender Differences in Policy Pref-erences: A Summary of Trends from the 1960s to the 1980s.” Public Opinion Quar-terly 50:42–61.
Skocpol, Theda. 1992. Protecting Soldiers and Mothers. Cambridge, Mass.: HarvardUniversity Press.
Smeal, Eleanor. 1984. Why and How Women Will Elect the Next President. NewYork: Harper & Row.
Smith, Tom W. 1984. “The Polls: Gender and Attitudes toward Violence.” PublicOpinion Quarterly 48:384–96.
Sørensen, Annemette. 1992. “Estimating the Economic Consequences of Separationand Divorce: A Cautionary Tale from the United States.” Pp. 263–82 in EconomicConsequences of Divorce: The International Perspective, edited by L. J. Weitzmanand M. McLean. New York: Oxford University Press.
Spain, Daphne, and Suzanne Bianchi. 1996. Balancing Act: Motherhood, Marriage,and Employment among American Women. New York: Russell Sage Foundation.
Stouffer, Samuel. 1955. Communism, Conformity, and Civil Liberties. Garden City,N.Y.: Doubleday.
Tolleson Rinehart, Sue. 1992. Gender Consciousness and Politics. New York:Routledge.
Welch, Susan. 1977. “Women as Political Animals? A Test of Some Explanationsof Male-Female Political Participation Differences.” American Journal of PoliticalScience 21:711–30.
Welch, Susan, and John Hibbing. 1992. “Financial Conditions, Gender, and Votingin American National Elections.” Journal of Politics 54:197–213.
Wilcox, Clyde, Joseph Ferrara, and Dee Allsop. 1993. “Group Differences in EarlySupport for Military Action in the Gulf: The Effects of Gender, Generation, andEthnicity.” American Politics Quarterly 21:343–59.
Wirls, Daniel. 1986. “Reinterpreting the Gender Gap.” Public Opinion Quarterly 50:316–30.
———. 1991. “The Gender Gap in American Elections: Lingering Illusions and Politi-cal Realities.” Pp. 117–33 in Do Elections Matter? edited by Benjamin Ginzburgand Alan Stone. Armonk, N.Y.: M. E. Sharpe.
Witt, Linda, Karen M. Paget, and Glenna Mathews. 1994. Running as a Woman:Gender and Power in American Politics. New York: Free Press.
Wolfinger, Raymond, and Steven Rosenstone. 1980. Who Votes? New Haven, Conn.:Yale University Press.
1266