Embed Size (px)
Citation preview
The George Washington University Consolidated Financial Statements and Schedule of Expenditures of Federal Awards and Reports in Accordance with the OMB Uniform Guidance For the year ended June 30, 2019 EIN 53-0196584
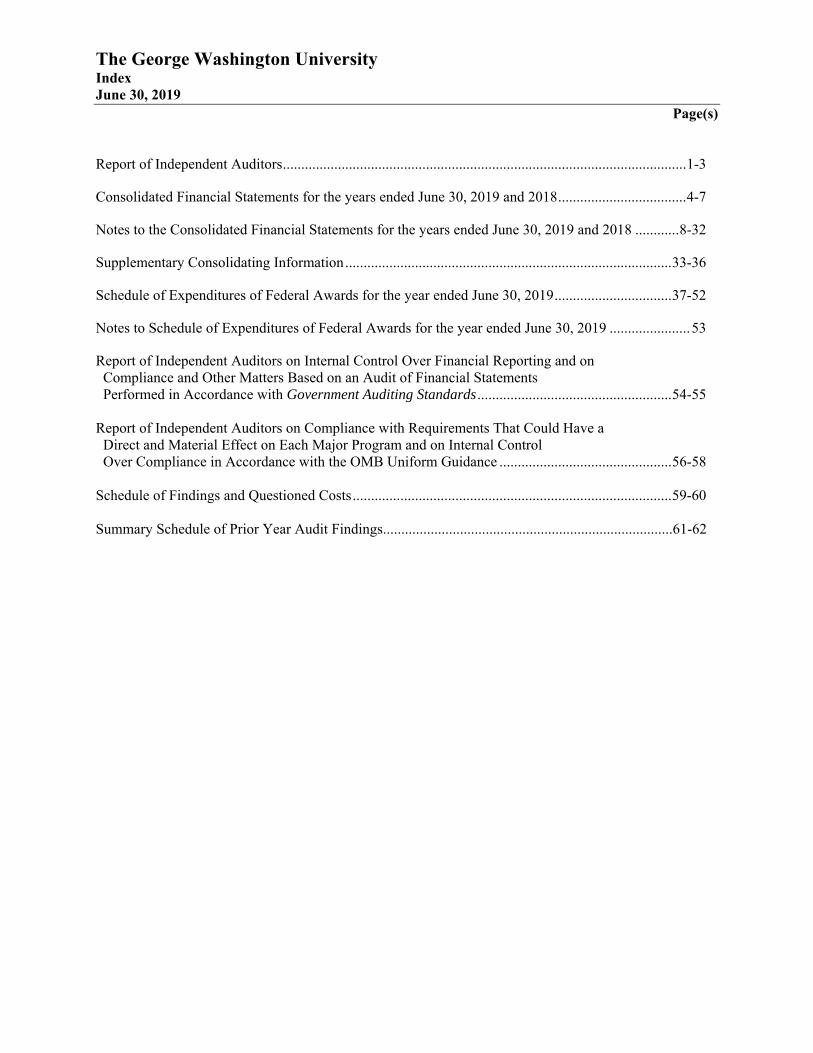
The George Washington University Index June 30, 2019
Page(s)
Report of Independent Auditors .............................................................................................................. 1-3
Consolidated Financial Statements for the years ended June 30, 2019 and 2018 ................................... 4-7
Notes to the Consolidated Financial Statements for the years ended June 30, 2019 and 2018 ............ 8-32
Supplementary Consolidating Information ......................................................................................... 33-36
Schedule of Expenditures of Federal Awards for the year ended June 30, 2019 ................................ 37-52
Notes to Schedule of Expenditures of Federal Awards for the year ended June 30, 2019 ...................... 53
Report of Independent Auditors on Internal Control Over Financial Reporting and on Compliance and Other Matters Based on an Audit of Financial Statements Performed in Accordance with Government Auditing Standards ..................................................... 54-55
Report of Independent Auditors on Compliance with Requirements That Could Have a Direct and Material Effect on Each Major Program and on Internal Control Over Compliance in Accordance with the OMB Uniform Guidance ............................................... 56-58
Schedule of Findings and Questioned Costs ....................................................................................... 59-60
Summary Schedule of Prior Year Audit Findings...............................................................................61-62
PricewaterhouseCoopers LLP, 1800 Tysons Blvd., McLean, VA 22102-4261 T: (703) 918-3000, F: (703) 918-3100, www.pwc.com/us
Report of Independent Auditors
To the Board of Trustees of The George Washington University
Report on the Consolidated Financial Statements
We have audited the accompanying consolidated financial statements of The George Washington University and its subsidiaries (“the University”), which comprise the consolidated statements of financial position as of June 30, 2019 and June 30, 2018, and the related consolidated statements of activities and of cash flows for the years then ended, and the related notes to the consolidated financial statements.
Management’s Responsibility for the Consolidated Financial Statements
Management is responsible for the preparation and fair presentation of the consolidated financial statements in accordance with accounting principles generally accepted in the United States of America; this includes the design, implementation, and maintenance of internal control relevant to the preparation and fair presentation of consolidated financial statements that are free from material misstatement, whether due to fraud or error.
Auditors’ Responsibility
Our responsibility is to express an opinion on the consolidated financial statements based on our audits. We conducted our audits in accordance with auditing standards generally accepted in the United States of America and the standards applicable to financial audits contained in Government Auditing Standards, issued by the Comptroller General of the United States. Those standards require that we plan and perform the audit to obtain reasonable assurance about whether the consolidated financial statements are free from material misstatement.
An audit involves performing procedures to obtain audit evidence about the amounts and disclosures in the consolidated financial statements. The procedures selected depend on our judgment, including the assessment of the risks of material misstatement of the consolidated financial statements, whether due to fraud or error. In making those risk assessments, we consider internal control relevant to the University's preparation and fair presentation of the consolidated financial statements in order to design audit procedures that are appropriate in the circumstances, but not for the purpose of expressing an opinion on the effectiveness of the University's internal control. Accordingly, we express no such opinion. An audit also includes evaluating the appropriateness of accounting policies used and the reasonableness of significant accounting estimates made by management, as well as evaluating the overall presentation of the consolidated financial statements. We believe that the audit evidence we have obtained is sufficient and appropriate to provide a basis for our audit opinion.
Opinion
In our opinion, the consolidated financial statements referred to above present fairly, in all material respects, the consolidated financial position of the University and its subsidiaries as of June 30, 2019 and 2018, and the changes in their net assets and their cash flows for the years then ended in accordance with accounting principles generally accepted in the United States of America.
2
Emphasis of Matters
As discussed in Note 1 to the consolidated financial statements, the University changed the manner in which it presents net assets and reports certain aspects of its financial statements as a not-for-profit entity, the manner in which it accounts for revenues from contracts with customers and the manner in which it accounts for certain grants and contributions in fiscal year 2019. Our opinion is not modified with respect to this matter.
As discussed in Note 16 to the consolidated financial statements, on December 14, 2018 the University became the sole corporate member of Medical Faculty Associates, Inc. Our opinion is not modified with respect to this matter.
Other Matters
Our audit was conducted for the purpose of forming an opinion on the consolidated financial statements taken as a whole. The consolidating information presented on pages 33 to 36 is the responsibility of management and was derived from and relates directly to the underlying accounting and other records used to prepare the consolidated financial statements. The consolidating information has been subjected to the auditing procedures applied in the audit of the consolidated financial statements and certain additional procedures, including comparing and reconciling such information directly to the underlying accounting and other records used to prepare the consolidated financial statements or to the consolidated financial statements themselves and other additional procedures, in accordance with auditing standards generally accepted in the United States of America. In our opinion, the consolidating information is fairly stated, in all material respects, in relation to the consolidated financial statements taken as a whole. The consolidating information is presented for purposes of additional analysis of the consolidated financial statements rather than to present the financial position, results of operations and cash flows of the individual companies and is not a required part of the consolidated financial statements. Accordingly, we do not express an opinion on the financial position, results of operations and cash flows of the individual companies.
Other Information
Our audit was conducted for the purpose of forming an opinion on the consolidated financial statements as a whole. The accompanying schedule of expenditures of federal awards for the year ended June 30, 2019 is presented for purposes of additional analysis as required by Title 2 U.S. Code of Federal Regulations Part 200, Uniform Administrative Requirements, Cost Principles, and Audit Requirements for Federal Awards (Uniform Guidance) and is not a required part of the consolidated financial statements. The information is the responsibility of management and was derived from and relates directly to the underlying accounting and other records used to prepare the consolidated financial statements. The information has been subjected to the auditing procedures applied in the audit of the consolidated financial statements and certain additional procedures, including comparing and reconciling such information directly to the underlying accounting and other records used to prepare the consolidated financial statements or to the consolidated financial statements themselves, and other additional procedures, in accordance with auditing standards generally accepted in the United States of America. In our opinion, the schedule of expenditures of federal awards is fairly stated, in all material respects, in relation to the consolidated financial statements taken as a whole.
3
Other Reporting Required by Government Auditing Standards
In accordance with Government Auditing Standards, we have also issued our report dated October 3, 2019 on our consideration of the University’s internal control over financial reporting and on our tests of its compliance with certain provisions of laws, regulations, contracts and grant agreements and other matters for the year ended June 30, 2019. The purpose of that report is solely to describe the scope of our testing of internal control over financial reporting and compliance and the results of that testing and not to provide an opinion on the effectiveness of internal control over financial reporting or on compliance. That report is an integral part of an audit performed in accordance with Government Auditing Standards in considering the University's internal control over financial reporting and compliance.
McLean, Virginia October 3, 2019
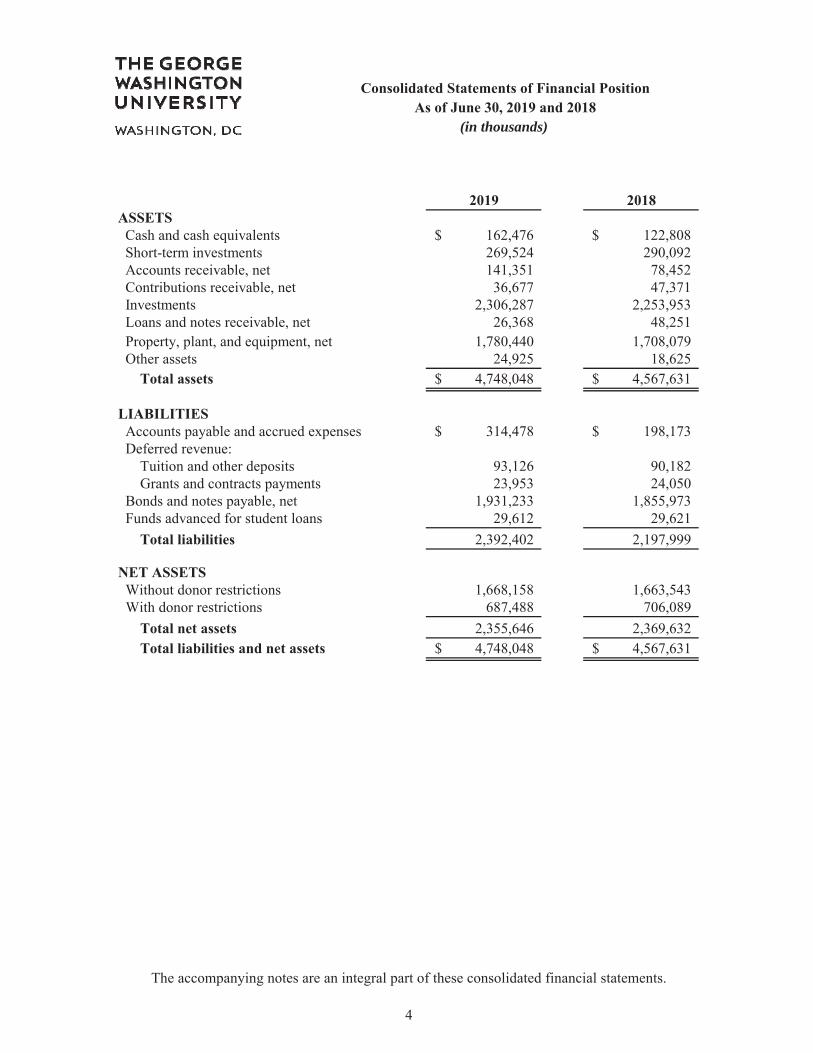
Cash and cash equivalents 162,476$ 122,808$ Short-term investments 269,524 290,092 Accounts receivable, net 141,351 78,452 Contributions receivable, net 36,677 47,371 Investments 2,306,287 2,253,953 Loans and notes receivable, net 26,368 48,251 Property, plant, and equipment, net 1,780,440 1,708,079 Other assets 24,925 18,625
4,748,048$ 4,567,631$
Accounts payable and accrued expenses 314,478$ 198,173$ Deferred revenue:
Tuition and other deposits 93,126 90,182 Grants and contracts payments 23,953 24,050
Bonds and notes payable, net 1,931,233 1,855,973 Funds advanced for student loans 29,612 29,621
2,392,402 2,197,999
Without donor restrictions 1,668,158 1,663,543 With donor restrictions 687,488 706,089
2,355,646 2,369,632 4,748,048$ 4,567,631$
(in thousands)
The accompanying notes are an integral part of these consolidated financial statements.
4
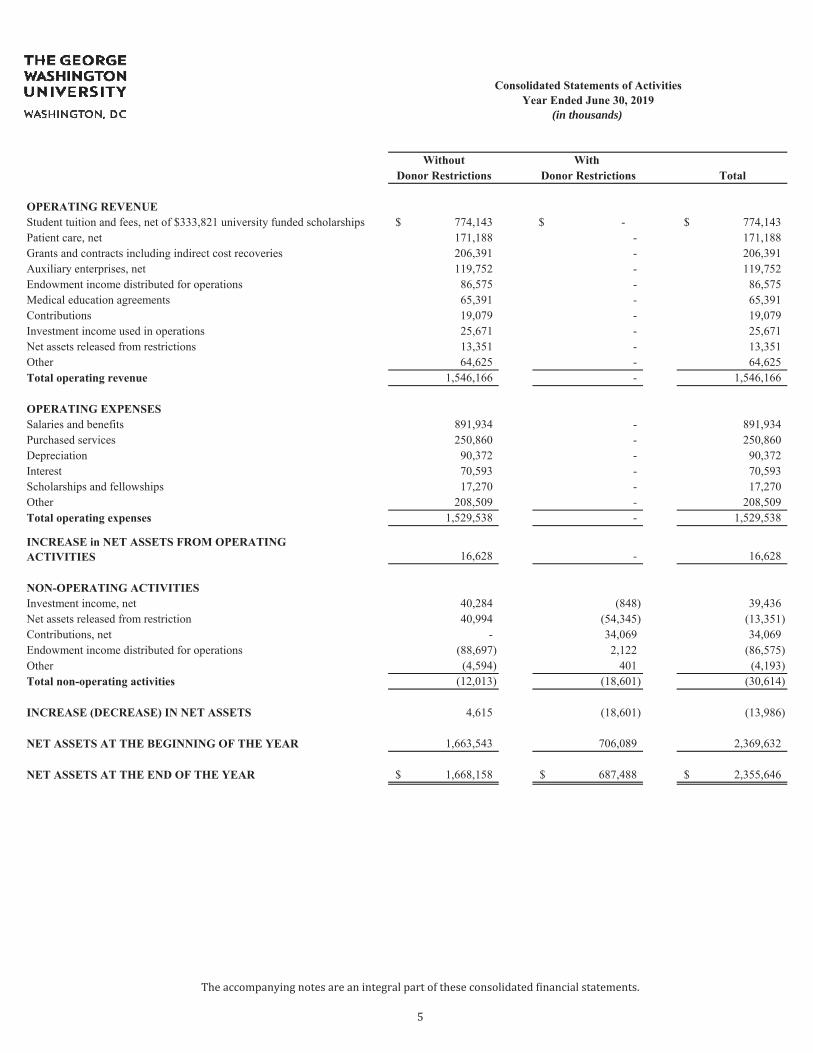
(in thousands)
Student tuition and fees, net of $333,821 university funded scholarships 774,143$ -$ 774,143$ Patient care, net 171,188 - 171,188 Grants and contracts including indirect cost recoveries 206,391 - 206,391 Auxiliary enterprises, net 119,752 - 119,752 Endowment income distributed for operations 86,575 - 86,575 Medical education agreements 65,391 - 65,391 Contributions 19,079 - 19,079 Investment income used in operations 25,671 - 25,671 Net assets released from restrictions 13,351 - 13,351 Other 64,625 - 64,625
1,546,166 - 1,546,166
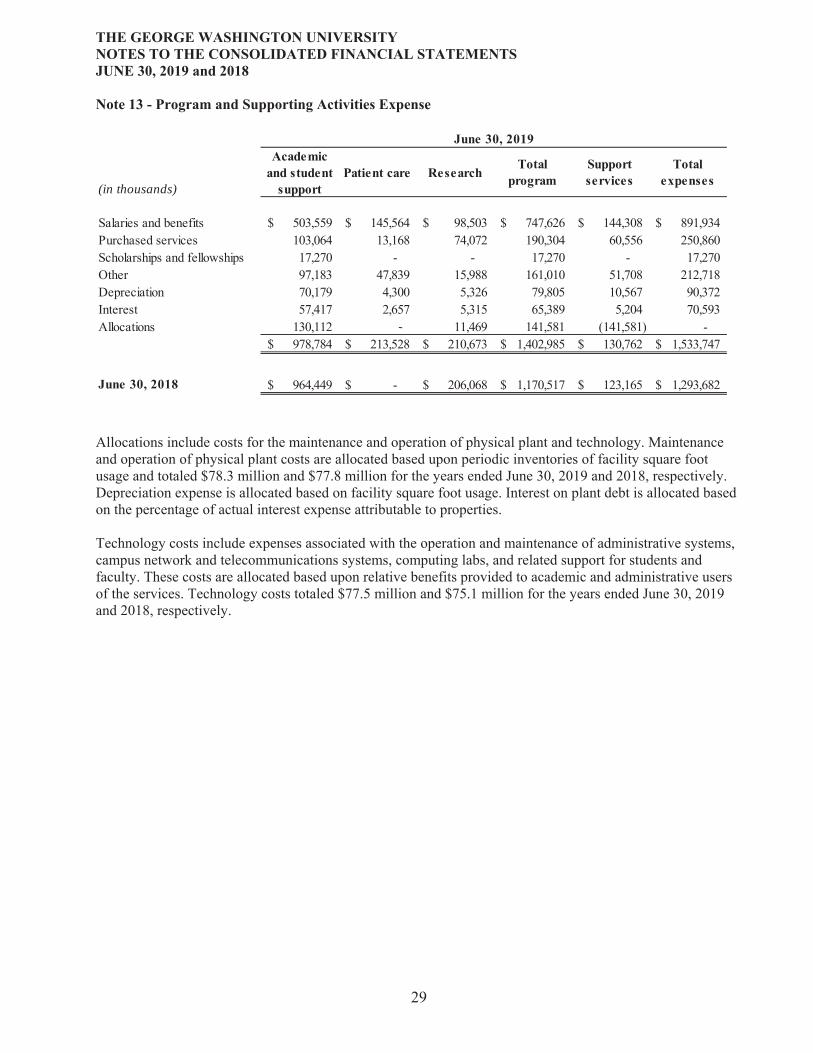
Salaries and benefits 891,934 - 891,934 Purchased services 250,860 - 250,860 Depreciation 90,372 - 90,372 Interest 70,593 - 70,593 Scholarships and fellowships 17,270 - 17,270 Other 208,509 - 208,509
1,529,538 - 1,529,538
16,628 - 16,628
Investment income, net 40,284 (848) 39,436 Net assets released from restriction 40,994 (54,345) (13,351) Contributions, net - 34,069 34,069 Endowment income distributed for operations (88,697) 2,122 (86,575) Other (4,594) 401 (4,193)
(12,013) (18,601) (30,614)
4,615 (18,601) (13,986)
1,663,543 706,089 2,369,632
1,668,158$ 687,488$ 2,355,646$
5
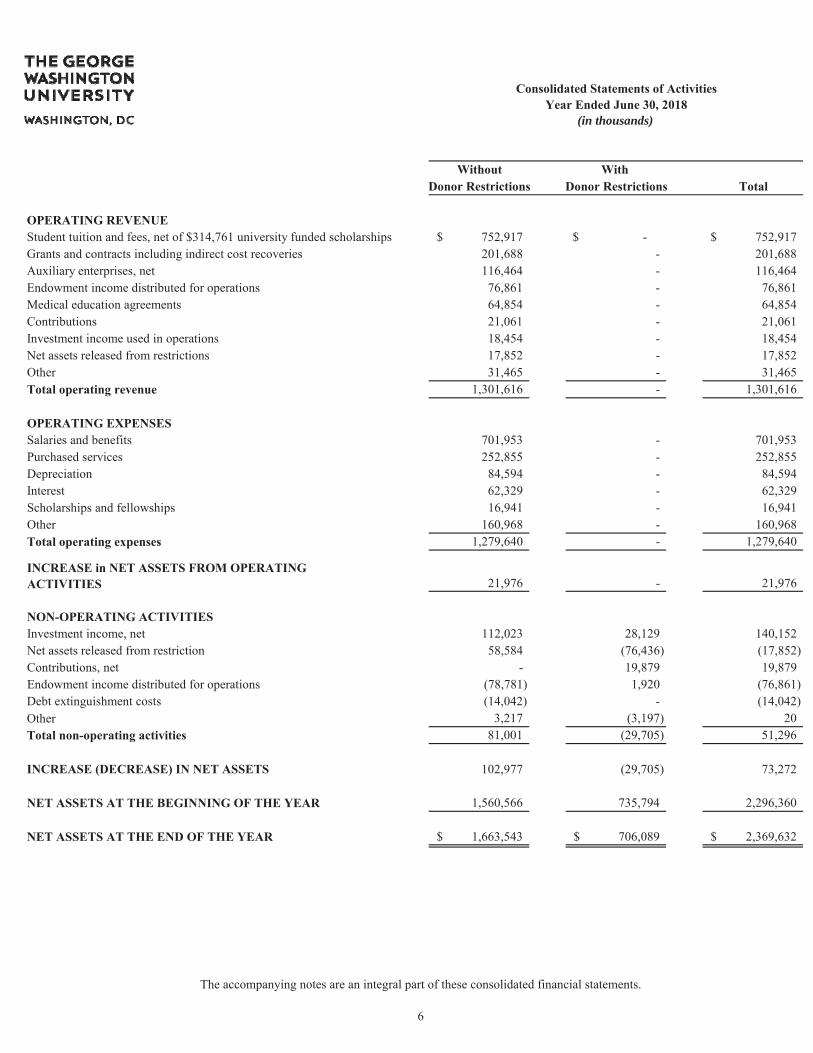
Student tuition and fees, net of $314,761 university funded scholarships 752,917$ -$ 752,917$ Grants and contracts including indirect cost recoveries 201,688 - 201,688 Auxiliary enterprises, net 116,464 - 116,464 Endowment income distributed for operations 76,861 - 76,861 Medical education agreements 64,854 - 64,854 Contributions 21,061 - 21,061 Investment income used in operations 18,454 - 18,454 Net assets released from restrictions 17,852 - 17,852 Other 31,465 - 31,465
1,301,616 - 1,301,616
Salaries and benefits 701,953 - 701,953 Purchased services 252,855 - 252,855 Depreciation 84,594 - 84,594 Interest 62,329 - 62,329 Scholarships and fellowships 16,941 - 16,941 Other 160,968 - 160,968
1,279,640 - 1,279,640
21,976 - 21,976
Investment income, net 112,023 28,129 140,152 Net assets released from restriction 58,584 (76,436) (17,852) Contributions, net - 19,879 19,879 Endowment income distributed for operations (78,781) 1,920 (76,861) Debt extinguishment costs (14,042) - (14,042) Other 3,217 (3,197) 20
81,001 (29,705) 51,296
102,977 (29,705) 73,272
1,560,566 735,794 2,296,360
1,663,543$ 706,089$ 2,369,632$
(in thousands)
The accompanying notes are an integral part of these consolidated financial statements.
6
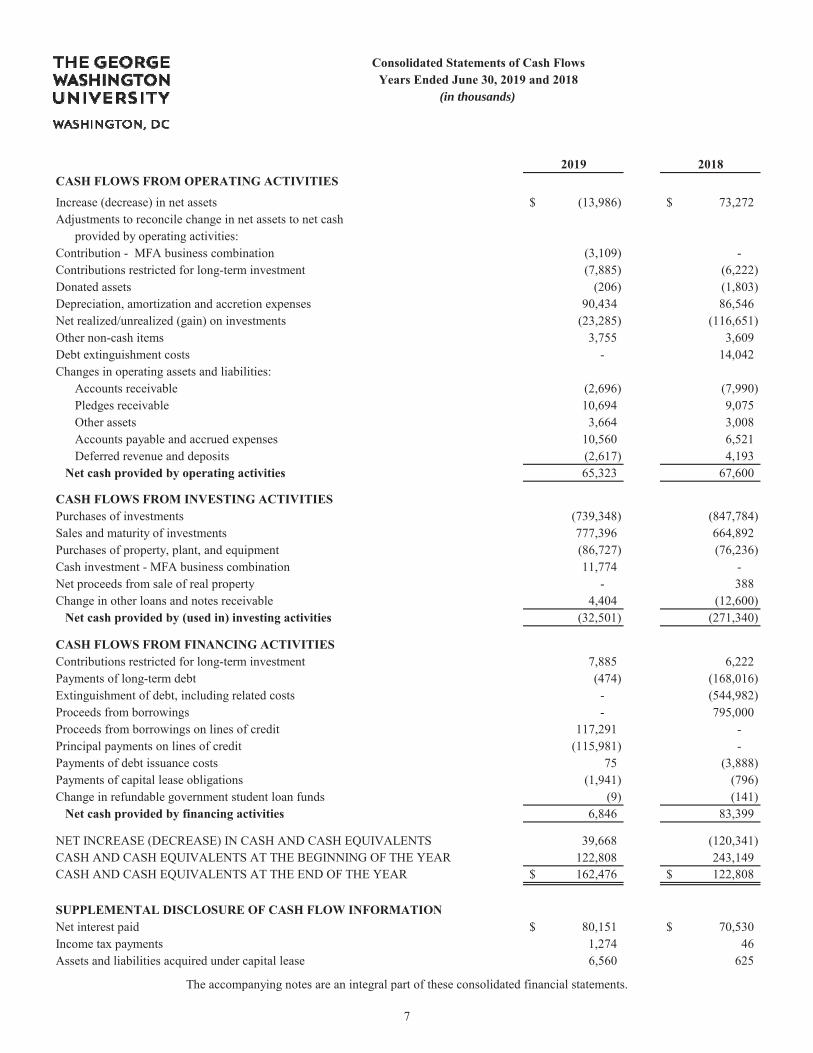
Increase (decrease) in net assets (13,986)$ 73,272$ Adjustments to reconcile change in net assets to net cash
provided by operating activities:Contribution - MFA business combination (3,109) - Contributions restricted for long-term investment (7,885) (6,222) Donated assets (206) (1,803) Depreciation, amortization and accretion expenses 90,434 86,546Net realized/unrealized (gain) on investments (23,285) (116,651) Other non-cash items 3,755 3,609Debt extinguishment costs - 14,042Changes in operating assets and liabilities:
Accounts receivable (2,696) (7,990) Pledges receivable 10,694 9,075Other assets 3,664 3,008Accounts payable and accrued expenses 10,560 6,521Deferred revenue and deposits (2,617) 4,193
65,323 67,600
(739,348) (847,784) 777,396 664,892 (86,727) (76,236) 11,774 -
- 3884,404 (12,600)
(32,501) (271,340)
7,885 6,222(474) (168,016)
- (544,982) - 795,000
117,291 - (115,981) -
75 (3,888) (1,941) (796)
(9) (141) 6,846 83,399
39,668 (120,341) 122,808 243,149 162,476$ 122,808$
80,151$ 70,530$ 1,274 46
Purchases of investmentsSales and maturity of investmentsPurchases of property, plant, and equipmentCash investment - MFA business combinationNet proceeds from sale of real propertyChange in other loans and notes receivable
Contributions restricted for long-term investmentPayments of long-term debtExtinguishment of debt, including related costsProceeds from borrowings Proceeds from borrowings on lines of creditPrincipal payments on lines of creditPayments of debt issuance costsPayments of capital lease obligationsChange in refundable government student loan funds
NET INCREASE (DECREASE) IN CASH AND CASH EQUIVALENTS CASH AND CASH EQUIVALENTS AT THE BEGINNING OF THE YEAR CASH AND CASH EQUIVALENTS AT THE END OF THE YEAR
Net interest paidIncome tax paymentsAssets and liabilities acquired under capital lease 6,560 625
(in thousands)
The accompanying notes are an integral part of these consolidated financial statements.
7
8
The George Washington University (the University) is a private, not-for-profit institution of higher education based in Washington, D.C. The University provides education and training services, primarily for students at the undergraduate, graduate, and postdoctoral levels, and performs research, training, and other services under grants, contracts, and similar agreements with sponsoring organizations, primarily departments and agencies of the U.S. Government. The University’s revenues are predominantly derived from student tuition, room, fees and patient service revenue. The University is exempt from federal income taxes under Section 501(c) (3) of the Internal Revenue Code.
The consolidated financial statements have been prepared on the accrual basis of accounting in conformity with accounting principles generally accepted in the United States of America (GAAP) and reporting practices prescribed for not-for-profit entities. The consolidated financial statements include the accounts of the George Washington University and its wholly owned subsidiaries which includes the Medical Faculty Associates, Inc. (MFA) as of December 14, 2018 following the business combination described in Note 16. All material intercompany transactions and balances have been eliminated.
MFA is a 501(c) (3) corporation formed in February 2000 to operate exclusively for the benefit of the University in providing clinical, teaching, and research services. Clinical services include professional physician and related health care services to patients in the greater Washington, DC community. MFA Physicians Insurance Company (MFA-PIC) is a wholly owned subsidiary of MFA and provides professional liability insurance for MFA and its employed physicians and providers. MFA maintains its accounts and prepares stand-alone financial statements in conformity with GAAP applicable to not-for-profit health care entities.
Highly liquid financial instruments with original maturities at dates of purchase of three months or less are classified as cash equivalents and include U.S. Treasury securities, collateralized interest-bearing repurchase agreements carried at fair value, and other short-term, highly liquid investments carried at fair value. Cash and cash equivalents held by endowment fund and other investment managers are included in Investments. Purchases and sales of investment cash equivalents are netted for reporting on the Consolidated Statements of Cash Flows.
Aggregate cash and cash equivalent balances maintained at financial institutions exceed the amount guaranteed by federal agencies and therefore bear risk. The University has not experienced any loss due to this risk.
Contributions, including unconditional promises to give, are recognized as revenues in the period received. Contributions received for capital projects, endowment funds, or student loans and contributions under split-interest agreements or perpetual trusts are reported as revenue with or without donor restrictions based the terms of gift agreements. Conditional promises to give are not recognized until the conditions on which they depend are substantially met. Contributions of assets other than cash are recorded at their estimated fair value at the date of the gift. Promises to give with payments to be received after one year from the date of the
9
financial statements are discounted at a risk-adjusted rate approximating the market rates for unsecured borrowing as required by fair value measurement accounting standards. Allowance is made for uncollectible contributions based upon management’s judgment after analysis of the creditworthiness of the donors, past collection experience, and other relevant factors.
Investments include both endowment and non-endowment investments owned by the University and are further detailed in Note 5. Investment income (loss) is included in revenue categories based on the existence or absence of donor restrictions.
Investments known as split-interest agreements are unique to not-for-profit organizations. These are agreements where donors enter into trust or other arrangements under which the University receives benefits shared with other beneficiaries. The assets associated with these arrangements are recorded at their fair value and are included in Investments (Note 5). Once liabilities to other beneficiaries are satisfied, the residual assets are transferred to the University.
The University manages the following types of arrangements. The associated liabilities to beneficiaries in these arrangements are calculated based on various actuarial assumptions and are recorded in Accounts payable and accrued expenses (Note 9).
Gift annuities consist of non-trust assets donated to the University in exchange for a fixed payment for the life of the beneficiary(s).
Pooled life income funds are donated funds received by the University in which the donor receives or assigns a life income. The funds are pooled by the University and are assigned a specific number of units in the pool. The beneficiary(s) is paid the amount of income earned on the donor's assigned units.
Charitable remainder trusts consist of trust assets donated to the University in exchange for a percentage of fair value-based payment for the life of the beneficiary(s).
The University is a beneficiary of trusts held by third parties which include:
Perpetual trusts where the University has an irrevocable right to income on trust assets in perpetuity, but never receives the assets held in trust. These beneficial interests are shown at fair value of the underlying assets, which approximates the discounted present value of the anticipated cash flows.
Charitable remainder trusts similar to those described above, except that the University does not hold the assets as trustee. These beneficial interests are shown at present value which is calculated using the fair value of the trust assets at the measurement date, discounted based on various actuarial assumptions impacting the timing of cash flows to the University.
Accounts receivable are reported at net realizable value. Accounts are written off against the allowance for doubtful accounts when determined to be uncollectible based upon management’s assessment of individual accounts. The allowance for doubtful accounts is estimated based on the University’s historical experience and periodic review of individual accounts. Patient receivables are recorded at net realizable value based on certain assumptions determined by each payor. The initial estimate of the balance is established by reducing the standard rate by any explicit and implicit price concessions. The University does not accrue interest on these accounts.
10
Loans receivable are primarily related to federal student financial aid programs and are carried at face value, less an allowance for doubtful accounts of $0.5 million at June 30, 2019 and 2018. The allowance for doubtful accounts is estimated based on the University’s historical experience and periodic review of individual accounts. The majority of the University’s loans receivable represents amounts due under federally guaranteed programs; therefore no reserves are recorded for the federal portion. Generally, payment on loans receivable commences upon graduation and can extend up to 10 years. These loans carry interest rates ranging from 3% to 7%. The carrying value of loans receivable approximates fair value. Funds provided by the U.S. Government under the Federal Perkins and Health Professions Student Loan Programs are loaned to qualified students. Health Profession funds may be loaned again after collection. The Perkins Loan program was not reauthorized by the federal government in September 2017, and therefore, collected funds will be returned to the U.S. Government and the University proportionate to their original funding. These federal loan programs have cash restricted as to their use of $7.4 million and $3.1 million as of June 30, 2019 and 2018, respectively.
Land, buildings, furniture, and equipment are stated at cost or fair value at the date of donation. Buildings, furniture, and equipment are depreciated on a straight-line basis over the estimated useful life. Interest cost incurred during construction is capitalized as part of the cost of capital projects. Equipment under capital leases is included in assets and liabilities at the value of future minimum lease payments discounted by the University’s incremental borrowing rate. Property acquired on federally funded awards that meets the University’s capitalization criteria is recorded as an asset of the University and depreciated in accordance with the University's depreciation policy. These assets are disposed of as prescribed by relevant federal requirements at the conclusion of the award.
Net assets and revenues, gains, and losses are classified based on the existence or absence of donor-imposed restrictions. The net assets of the University are classified and reported as follows:
– Net assets that are not subject to donor-imposed stipulations and are available for operations or designated by board of trustees for specific purpose or quasi-endowment.
– Net assets with donor restrictions are subject to donor-imposed stipulations and may be restricted by time or purpose, or may be restricted in perpetuity. Those restricted by time or purpose contain stipulations that may be or will be met either by actions of the University and/or by the passage of time. Those restricted in perpetuity are subject to stipulations that the asset be maintained permanently by the University. Generally, the donors of these assets permit the University to use all or part of the income earned on related investments for general or specific purposes. All revenues, gains, and expenses not restricted by donors are included in net assets without donor restrictions and are generally available for operations. Contributions are reported as increases in the appropriate category of net assets, except contributions with restrictions that are met in the same fiscal year they are received are included in revenues without donor restrictions. Expirations of restrictions recognized on net assets, i.e., the donor-stipulated purpose has been fulfilled and/or the stipulated time period has elapsed, are reported as releases from net assets with donor restrictions to net assets without donor restrictions. Restrictions on gifts to acquire or construct long-lived assets are considered met in the period in which the assets are placed in service.
11
Non-operating items include net investment returns that are available for future use, contributions with donor restrictions, net assets released from restrictions or for use in current year operations, changes in postretirement benefit obligations other than service costs, and significant non-recurring transactions not directly related to operations.
The University recognizes revenues from student tuition and fees within the fiscal year in which educational services are provided. Tuition discounts in the form of scholarships and grants-in-aid, including those funded by the endowment, research funds, and gifts, are reported as a reduction of tuition revenues. A tuition discount represents the difference between the stated charge for tuition and fees and the amount that is billed to the student and/or third parties making payments on behalf of the student. Cash payments to students, excluding compensation, are reported as Scholarships and fellowships expense in the Consolidated Statements of Activities.
Auxiliary enterprises revenue is primarily composed of housing revenue. Revenue from housing is recognized over the period it is earned as housing services are provided. Financial aid awarded specifically for housing is recorded as a reduction of auxiliary revenues.
Summer term tuition revenue and cash deposits received for summer housing contracts which span across the fiscal year-end are recognized to the extent the University has met the performance obligations as of the end of the fiscal year and the remainder is deferred to the following fiscal year.
As of June 30, 2019, $48.0 million of remaining performance obligations under open service contracts is reported as Deferred revenue on the Consolidated Statement of Financial Position. The University expects to recognize this entire amount in operating revenues during the fiscal year ending June 30, 2020. As of June 30, 2018, the University reported $49.3 million of remaining performance obligations under open service contracts as Deferred revenue, which was recognized as operating revenues during the fiscal year ended June 30, 2019.
The University recognizes grants and contracts sponsored research agreements revenue in accordance with the agreement, generally when expenditures are incurred. Any funding received in advance of expenditure is recorded in Deferred revenue: Grants and contract payments on the Consolidated Statements of Financial Position and discussed in Note 4.
The University recognizes patient service revenue associated with services provided by MFA to patients who have third party payor coverage on the basis of contractual rates for services rendered. MFA has agreements with third party payors including Medicare, Medicaid, Blue Shield, as well as other commercial and managed care insurance carriers. Contracts for payment for clinical services are negotiated with each of the carriers at an amount less than the established billing rate. For uninsured patients that do not qualify for charity care, MFA recognizes revenue on the basis of its standard rates for services provided (or on the basis of discounted rates, if negotiated or provided by policy), reduced by estimated implicit price concessions for patients who are unable or unwilling to pay based on historical experience with each class of patients/ payers. Net patient
12
service revenue is reported as estimated net realizable amounts from patients, third-party payors, government programs and others and is recognized in the period in which services are rendered.
The preparation of financial statements in conformity with GAAP requires management to make estimates and assumptions that affect the reported amounts and disclosures at the date of the financial statements. Actual results could differ from these estimates.
The University adopted ASU 2014-09, Revenue from Contracts with Customers on July 1, 2017. This standard requires entities to recognize revenue from customers when or as performance obligations of the contract are met. This standard was adopted using the full retrospective method. The adoption increased deferred revenue liability and reduced opening net assets of fiscal year 2018 by $25.5 million.
The University adopted ASU 2018-08, Clarifying the Scope and the Accounting Guidance for Contributions Received and Contributions Made effective on July 1, 2018 using the full prospective method. This update assists not-for-profit entities in evaluating whether transactions should be accounted for as contributions or as exchange transactions, and in determining whether a contribution is conditional. Due to this adoption, the majority of the University’s grant transactions are no longer considered exchange transactions and are now deemed contributions (mostly conditional contributions) where revenue recognized equals the expenses. The adoption of this standard did not have a material effect on the University’s financial statements.
The University retrospectively adopted ASU 2016-14, Presentation of Financial Statements for Not-for-Profit Entities, to the opening net assets of fiscal year 2018. The main requirements of the guidance include (a) presenting only two classes of net assets now entitled “net assets without donor restrictions” and “net assets with donor restrictions”, (b) classifying underwater amounts of donor-restricted endowment funds as “net assets with donor restrictions”, (c) use of placed-in-service approach for expiration of restrictions on capital gifts, (d) presentation of investment return net of expenses, and (e) disclosures of composition of net assets, liquidity, and expenses by both their natural and functional classification. The adoption of this standard increased net assets without donor restrictions and decreased net assets with donor restrictions by $8.3 million related to underwater endowment funds.
ASU 2016-02, Leases, will be effective for the University in fiscal year 2020. This standard requires recognition of rights and obligations arising from lease contracts, including existing and new arrangements, as assets and liabilities on the balance sheet. The University is currently evaluating the effect of adoption on the financial statements.
13
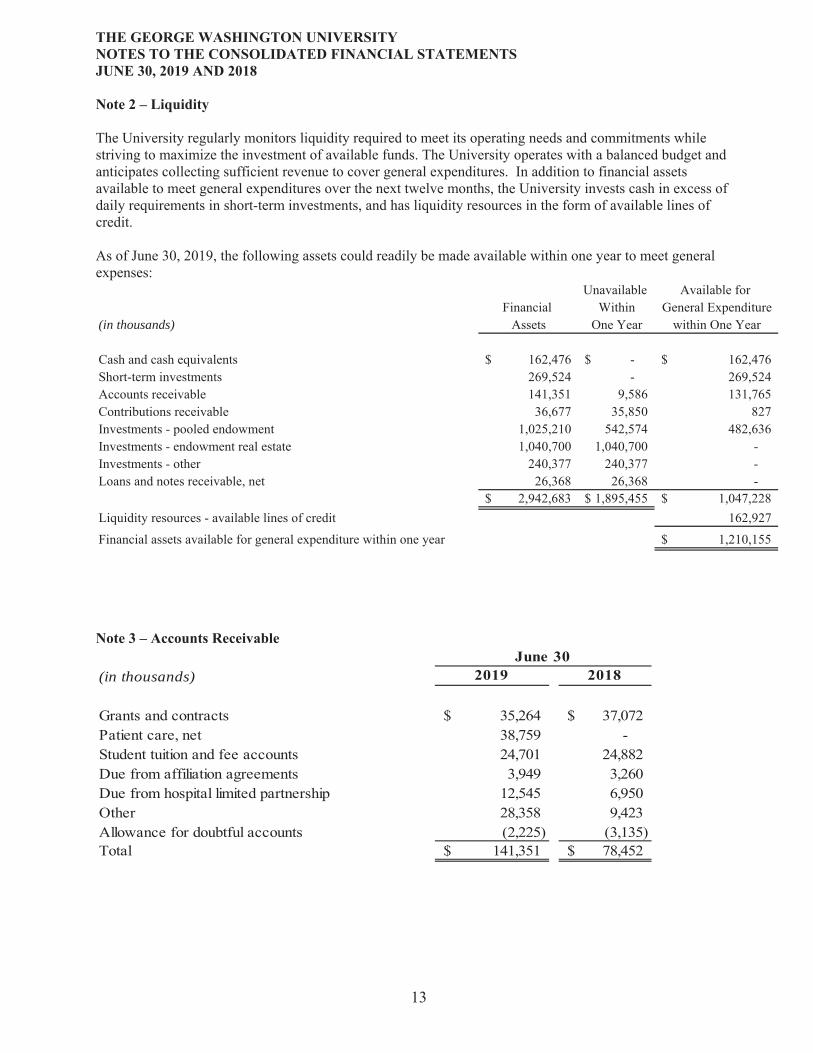
The University regularly monitors liquidity required to meet its operating needs and commitments while striving to maximize the investment of available funds. The University operates with a balanced budget and anticipates collecting sufficient revenue to cover general expenditures. In addition to financial assets available to meet general expenditures over the next twelve months, the University invests cash in excess of daily requirements in short-term investments, and has liquidity resources in the form of available lines of credit.
As of June 30, 2019, the following assets could readily be made available within one year to meet general expenses:
Unavailable Available for Financial Within General Expenditure
Assets One Year within One Year
162,476$ -$ 162,476$ 269,524 - 269,524 141,351 9,586 131,765
36,677 35,850 827 1,025,210 542,574 482,636 1,040,700 1,040,700 -
240,377 240,377 - 26,368 26,368 -
2,942,683$ 1,895,455$ 1,047,228$ 162,927
1,210,155$
(in thousands)
Cash and cash equivalentsShort-term investmentsAccounts receivableContributions receivableInvestments - pooled endowmentInvestments - endowment real estateInvestments - otherLoans and notes receivable, net
Liquidity resources - available lines of creditFinancial assets available for general expenditure within one year
(in thousands)
Grants and contracts 35,264$ 37,072$ Patient care, net 38,759 - Student tuition and fee accounts 24,701 24,882 Due from affiliation agreements 3,949 3,260 Due from hospital limited partnership 12,545 6,950 Other 28,358 9,423 Allowance for doubtful accounts (2,225) (3,135) Total 141,351$ 78,452$
14
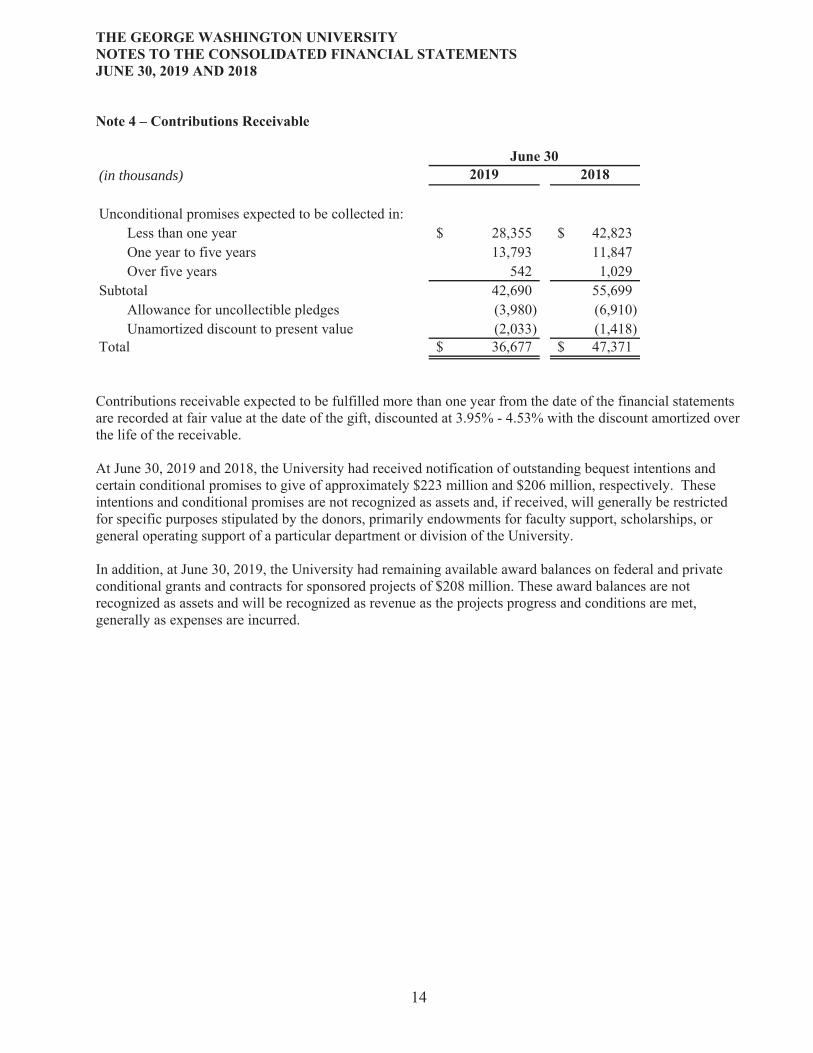
(in thousands)
Unconditional promises expected to be collected in:Less than one year 28,355$ 42,823$ One year to five years 13,793 11,847 Over five years 542 1,029
Subtotal 42,690 55,699 Allowance for uncollectible pledges (3,980) (6,910) Unamortized discount to present value (2,033) (1,418)
Total 36,677$ 47,371$
Contributions receivable expected to be fulfilled more than one year from the date of the financial statements are recorded at fair value at the date of the gift, discounted at 3.95% - 4.53% with the discount amortized over the life of the receivable.
At June 30, 2019 and 2018, the University had received notification of outstanding bequest intentions and certain conditional promises to give of approximately $223 million and $206 million, respectively. These intentions and conditional promises are not recognized as assets and, if received, will generally be restricted for specific purposes stipulated by the donors, primarily endowments for faculty support, scholarships, or general operating support of a particular department or division of the University.
In addition, at June 30, 2019, the University had remaining available award balances on federal and private conditional grants and contracts for sponsored projects of $208 million. These award balances are not recognized as assets and will be recognized as revenue as the projects progress and conditions are met, generally as expenses are incurred.
15
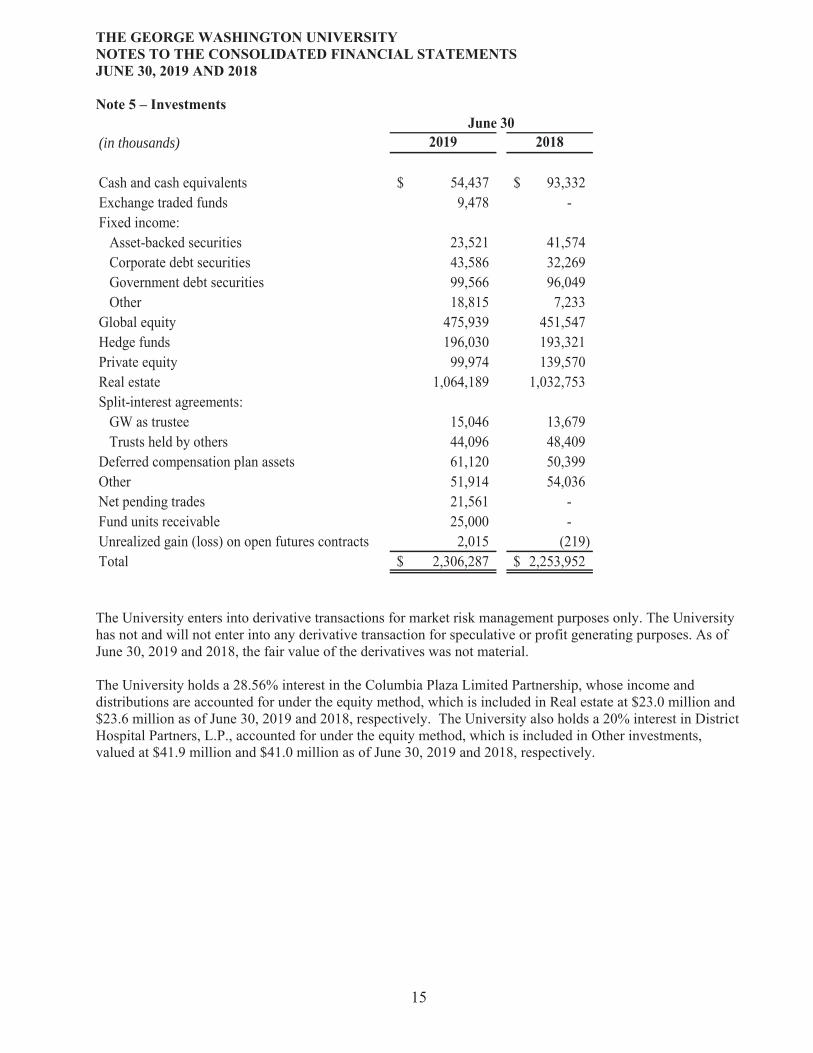
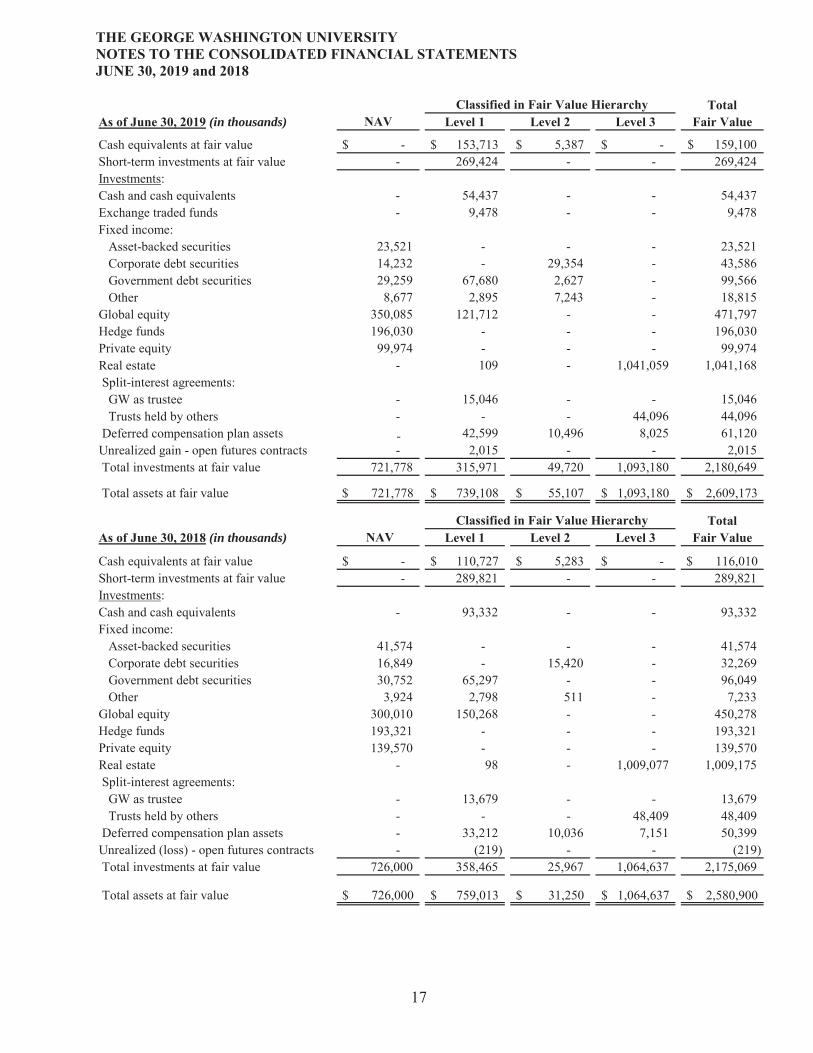
(in thousands)
Cash and cash equivalents 54,437$ 93,332$ Exchange traded funds 9,478 - Fixed income: Asset-backed securities 23,521 41,574 Corporate debt securities 43,586 32,269 Government debt securities 99,566 96,049 Other 18,815 7,233 Global equity 475,939 451,547 Hedge funds 196,030 193,321 Private equity 99,974 139,570 Real estate 1,064,189 1,032,753 Split-interest agreements: GW as trustee 15,046 13,679 Trusts held by others 44,096 48,409 Deferred compensation plan assets 61,120 50,399 Other 51,914 54,036 Net pending trades 21,561 - Fund units receivable 25,000 - Unrealized gain (loss) on open futures contracts 2,015 (219) Total 2,306,287$ 2,253,952$
The University enters into derivative transactions for market risk management purposes only. The University has not and will not enter into any derivative transaction for speculative or profit generating purposes. As of June 30, 2019 and 2018, the fair value of the derivatives was not material.
The University holds a 28.56% interest in the Columbia Plaza Limited Partnership, whose income and distributions are accounted for under the equity method, which is included in Real estate at $23.0 million and $23.6 million as of June 30, 2019 and 2018, respectively. The University also holds a 20% interest in District Hospital Partners, L.P., accounted for under the equity method, which is included in Other investments, valued at $41.9 million and $41.0 million as of June 30, 2019 and 2018, respectively.
16
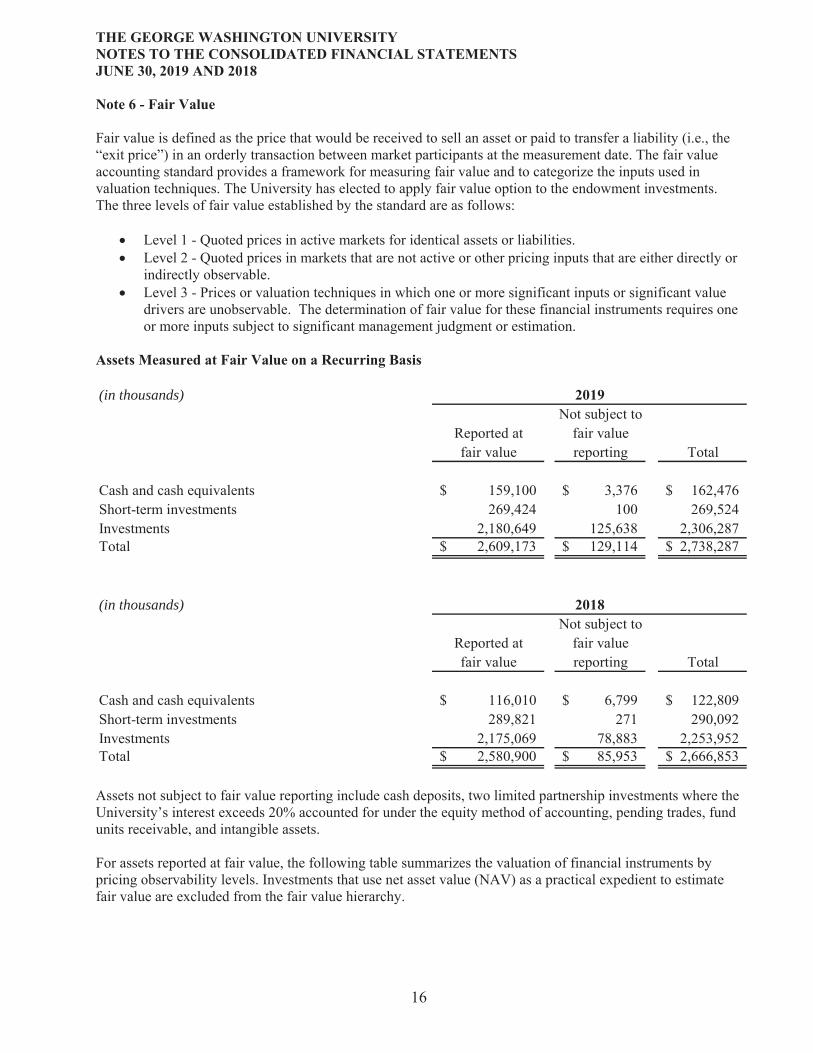
Fair value is defined as the price that would be received to sell an asset or paid to transfer a liability (i.e., the “exit price”) in an orderly transaction between market participants at the measurement date. The fair value accounting standard provides a framework for measuring fair value and to categorize the inputs used in valuation techniques. The University has elected to apply fair value option to the endowment investments. The three levels of fair value established by the standard are as follows:
Level 1 - Quoted prices in active markets for identical assets or liabilities. Level 2 - Quoted prices in markets that are not active or other pricing inputs that are either directly or indirectly observable. Level 3 - Prices or valuation techniques in which one or more significant inputs or significant value drivers are unobservable. The determination of fair value for these financial instruments requires one or more inputs subject to significant management judgment or estimation.
(in thousands)Not subject to
Reported at fair valuefair value reporting Total
Cash and cash equivalents 159,100$ 3,376$ 162,476$ Short-term investments 269,424 100 269,524 Investments 2,180,649 125,638 2,306,287 Total 2,609,173$ 129,114$ 2,738,287$
(in thousands)Not subject to
Reported at fair valuefair value reporting Total
Cash and cash equivalents 116,010$ 6,799$ 122,809$ Short-term investments 289,821 271 290,092 Investments 2,175,069 78,883 2,253,952 Total 2,580,900$ 85,953$ 2,666,853$
Assets not subject to fair value reporting include cash deposits, two limited partnership investments where the University’s interest exceeds 20% accounted for under the equity method of accounting, pending trades, fund units receivable, and intangible assets.
For assets reported at fair value, the following table summarizes the valuation of financial instruments by pricing observability levels. Investments that use net asset value (NAV) as a practical expedient to estimate fair value are excluded from the fair value hierarchy.
17
(in thousands)
Cash equivalents at fair value $ - $ 153,713 $ 5,387 $ - 159,100$ Short-term investments at fair value - 269,424 - - 269,424 Investments:Cash and cash equivalents - 54,437 - - 54,437 Exchange traded funds - 9,478 - - 9,478 Fixed income: Asset-backed securities 23,521 - - - 23,521 Corporate debt securities 14,232 - 29,354 - 43,586 Government debt securities 29,259 67,680 2,627 - 99,566 Other 8,677 2,895 7,243 - 18,815 Global equity 350,085 121,712 - - 471,797 Hedge funds 196,030 - - - 196,030 Private equity 99,974 - - - 99,974 Real estate - 109 - 1,041,059 1,041,168 Split-interest agreements: GW as trustee - 15,046 - - 15,046 Trusts held by others - - - 44,096 44,096 Deferred compensation plan assets 42,599 10,496 8,025 61,120 Unrealized gain - open futures contracts - 2,015 - - 2,015 Total investments at fair value 721,778 315,971 49,720 1,093,180 2,180,649
Total assets at fair value $ 721,778 $ 739,108 $ 55,107 $ 1,093,180 $ 2,609,173
(in thousands)
Cash equivalents at fair value $ - $ 110,727 $ 5,283 $ - $ 116,010Short-term investments at fair value - 289,821 - - 289,821 Investments:Cash and cash equivalents - 93,332 - - 93,332 Fixed income: Asset-backed securities 41,574 - - - 41,574 Corporate debt securities 16,849 - 15,420 - 32,269 Government debt securities 30,752 65,297 - - 96,049 Other 3,924 2,798 511 - 7,233 Global equity 300,010 150,268 - - 450,278 Hedge funds 193,321 - - - 193,321 Private equity 139,570 - - - 139,570 Real estate - 98 - 1,009,077 1,009,175 Split-interest agreements: GW as trustee - 13,679 - - 13,679 Trusts held by others - - - 48,409 48,409 Deferred compensation plan assets - 33,212 10,036 7,151 50,399 Unrealized (loss) - open futures contracts - (219) - - (219) Total investments at fair value 726,000 358,465 25,967 1,064,637 2,175,069
Total assets at fair value $ 726,000 $ 759,013 $ 31,250 $ 1,064,637 $ 2,580,900
-
18
The following estimates and assumptions were used to determine the fair value of each class of financial instruments listed above.
Cash, cash equivalents, short-term investments, and exchange traded funds - These investments include cash deposits in investment funds and short-term U.S. Treasury securities, money market accounts, and other short-term, highly liquid investments. Cash equivalents also include a bank repurchase agreement valued at $5.4 million at June 30, 2019 and $5.3 million at June 30, 2018 which is classified as Level 2. The repurchase agreement is collateralized by bank-owned securities issued by the U.S. Government or agencies thereof. All other cash equivalents are priced using independent market prices in the primary trading market and are classified as Level 1.
Fixed income - These investments generally include asset-backed securities, convertible bonds, corporate debt, investment funds with fixed income portfolios, federal and municipal bonds, and U.S. treasury notes. These assets are primarily valued using market prices, such as broker quotes, for the same or similar instruments. Securities in this category that trade in less active markets and are redeemable in the near term are typically categorized as Level 2. The fair value of investment funds not publicly traded has been estimated using the NAV of the funds which are calculated by the investment manager, and excluded from the fair value leveling table.
Global equity - These investments generally include separately held accounts, shares in commingled funds, and global equity holdings. Securities traded on an active exchange are priced using unadjusted market quotes for identical assets and are classified as Level 1. The fair value of commingled funds has been estimated using the NAV of the funds which are calculated by the investment manager, and excluded from the fair value leveling table.
Hedge funds - These investments generally include funds that invest in long and short positions, pursuing a diverse range of investment strategies. These investments are typically funds structured in a fund of funds vehicle. The objective of the funds is to generate long-term capital appreciation. The fair value of these investments has been estimated using the NAV of the funds which are calculated by the investment manager, and excluded from the fair value leveling table.
Private equity - These investments generally include limited partnerships that are not publicly traded and cannot be redeemed because the investments include restrictions that do not allow redemption through maturity. The fair values of these investments have been estimated using the NAV of the funds, which are calculated by the investment manager and are excluded from the fair value leveling table. The valuation policies adopted by the manager are reviewed for propriety, consistency, compliance, and completeness. Inputs used to determine fair value are based upon the best available information provided by the investment manager and may incorporate management judgments and best estimates after considering a variety of factors. For a small percentage of these investments, the manager reported NAV is prepared using non-U.S. GAAP, which may differ from fair value reported under U.S. GAAP. Where material differences are known to exist, management bases its measurements on fair value estimates obtained from the investment managers and/or third-party valuation advisors. Quantitative information about the significant unobservable inputs used in arriving at these fair value measurements is not readily available. Changes to these inputs may result in significant changes to the fair value measurement and such changes could be material to the consolidated financial statements.
19
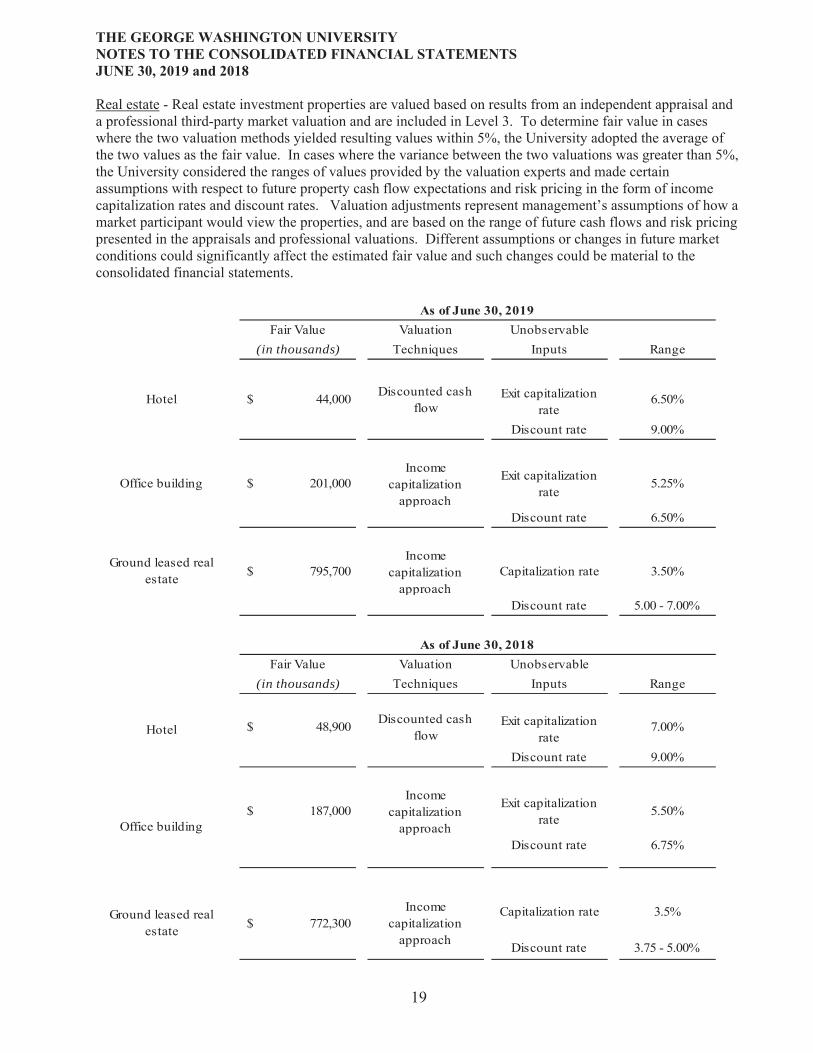
Real estate - Real estate investment properties are valued based on results from an independent appraisal and a professional third-party market valuation and are included in Level 3. To determine fair value in cases where the two valuation methods yielded resulting values within 5%, the University adopted the average of the two values as the fair value. In cases where the variance between the two valuations was greater than 5%, the University considered the ranges of values provided by the valuation experts and made certain assumptions with respect to future property cash flow expectations and risk pricing in the form of income capitalization rates and discount rates. Valuation adjustments represent management’s assumptions of how a market participant would view the properties, and are based on the range of future cash flows and risk pricing presented in the appraisals and professional valuations. Different assumptions or changes in future market conditions could significantly affect the estimated fair value and such changes could be material to the consolidated financial statements.
Fair Value Valuation Unobservable (in thousands) Techniques Inputs Range
$ 44,000 Discounted cash flow
Exit capitalization rate
6.50%
Discount rate 9.00%
$ 201,000 Income
capitalization approach
Exit capitalization rate
5.25%
Discount rate 6.50%
$ 795,700 Income
capitalization approach
Capitalization rate 3.50%
Discount rate 5.00 - 7.00%
Fair Value Valuation Unobservable (in thousands) Techniques Inputs Range
$ 48,900 Discounted cash flow
Exit capitalization rate
7.00%
Discount rate 9.00%
$ 187,000 Income
capitalization approach
Exit capitalization rate
5.50%
Discount rate 6.75%
Capitalization rate 3.5%
Discount rate 3.75 - 5.00%
Ground leased real estate $ 772,300
Income capitalization
approach
Office building
Hotel
Hotel
Office building
Ground leased real estate
20
Split-interest agreements - Assets received under split-interest agreements from donors where the University serves as trustee are categorized as Level 1 based on the observability of pricing inputs to the underlying investments held in those trusts. The University’s beneficial interests in perpetual trusts held by third parties are categorized as Level 3. These are valued using a discounted cash flow analysis based on the assumed timing and duration of those cash flows.
Deferred compensation plan assets - Assets purchased under deferred compensation arrangements include mutual funds, insurance company pooled separate accounts, and variable annuities and are categorized as Level 1, Level 2, or Level 3 based on the observability of pricing inputs for the investment vehicles. Funds that are publicly traded are categorized as Level 1, while Level 2 assets include funds which are not publicly traded, but have established NAV or are based on quoted prices for similar assets. Level 3 assets include annuity contracts issued by an insurance company.
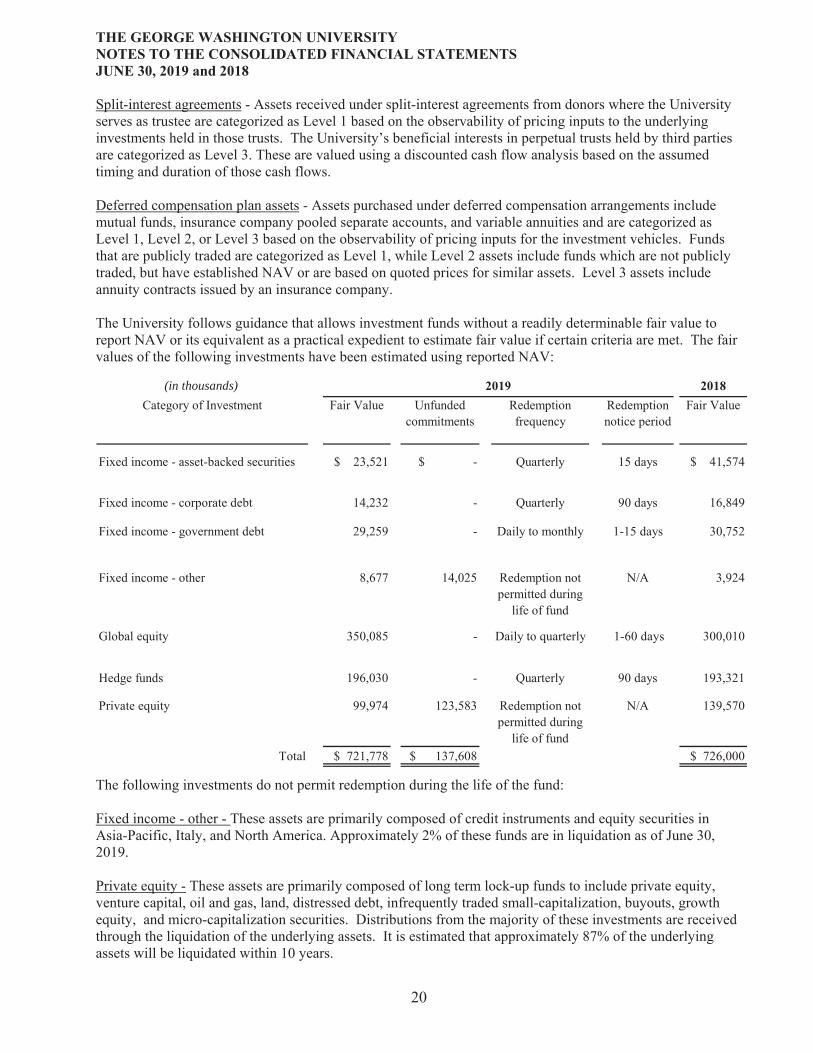
The University follows guidance that allows investment funds without a readily determinable fair value to report NAV or its equivalent as a practical expedient to estimate fair value if certain criteria are met. The fair values of the following investments have been estimated using reported NAV:
(in thousands)
Category of Investment Fair Value Unfunded commitments
Redemption frequency
Redemption notice period
Fair Value
Fixed income - asset-backed securities $ 23,521 $ - Quarterly 15 days $ 41,574
Fixed income - corporate debt 14,232 - Quarterly 90 days 16,849
Fixed income - government debt 29,259 - Daily to monthly 1-15 days 30,752
Fixed income - other 8,677 14,025 Redemption not permitted during
life of fund
N/A 3,924
Global equity 350,085 - Daily to quarterly 1-60 days 300,010
Hedge funds 196,030 - Quarterly 90 days 193,321
Private equity 99,974 123,583 Redemption not permitted during
life of fund
N/A 139,570
Total $ 721,778 $ 137,608 $ 726,000
The following investments do not permit redemption during the life of the fund:
Fixed income - other - These assets are primarily composed of credit instruments and equity securities in Asia-Pacific, Italy, and North America. Approximately 2% of these funds are in liquidation as of June 30, 2019.
Private equity - These assets are primarily composed of long term lock-up funds to include private equity, venture capital, oil and gas, land, distressed debt, infrequently traded small-capitalization, buyouts, growth equity, and micro-capitalization securities. Distributions from the majority of these investments are received through the liquidation of the underlying assets. It is estimated that approximately 87% of the underlying assets will be liquidated within 10 years.
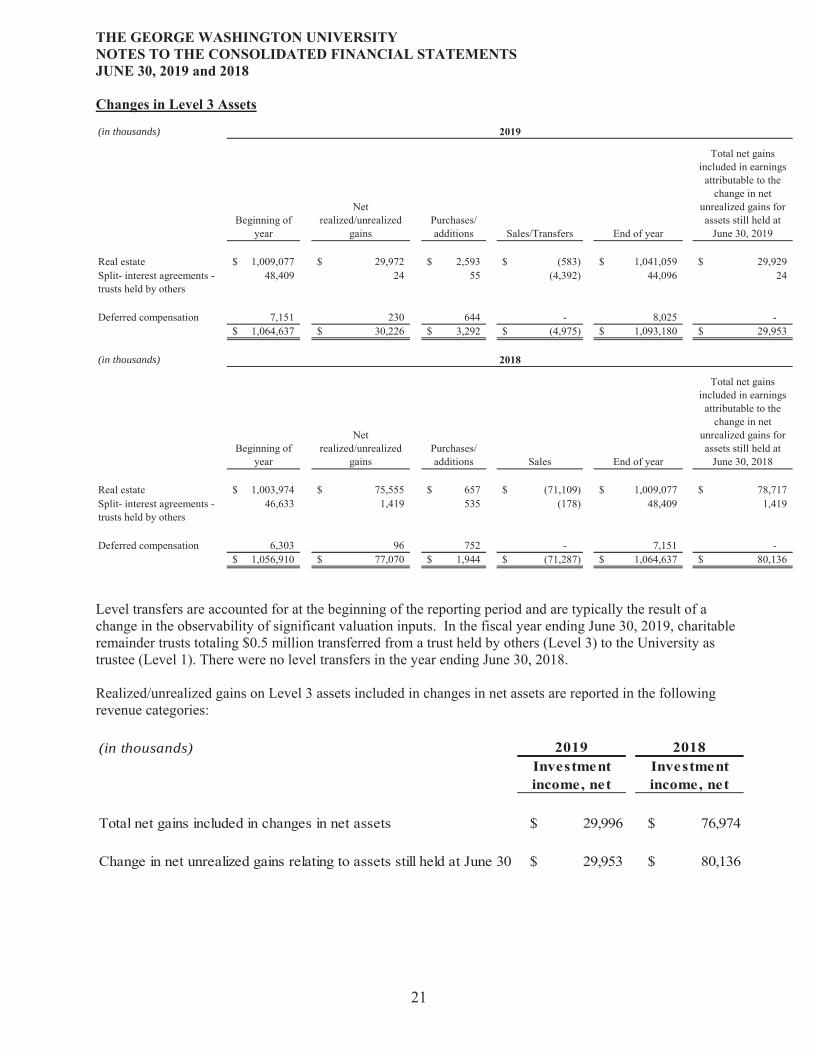
21
(in thousands)
Beginning of year
Net realized/unrealized
gains Purchases/ additions Sales/Transfers End of year
Total net gains included in earnings
attributable to the change in net
unrealized gains for assets still held at
June 30, 2019
Real estate 1,009,077$ 29,972$ 2,593$ (583)$ 1,041,059$ 29,929$ Split- interest agreements - trusts held by others
48,409 24 55 (4,392) 44,096 24
Deferred compensation 7,151 230 644 - 8,025 - 1,064,637$ 30,226$ 3,292$ (4,975)$ 1,093,180$ 29,953$
(in thousands)
Beginning of year
Net realized/unrealized
gains Purchases/ additions Sales End of year
Total net gains included in earnings
attributable to the change in net
unrealized gains for assets still held at
June 30, 2018
Real estate 1,003,974$ 75,555$ 657$ (71,109)$ 1,009,077$ 78,717$ Split- interest agreements - trusts held by others
46,633 1,419 535 (178) 48,409 1,419
Deferred compensation 6,303 96 752 - 7,151 - 1,056,910$ 77,070$ 1,944$ (71,287)$ 1,064,637$ 80,136$
Level transfers are accounted for at the beginning of the reporting period and are typically the result of a change in the observability of significant valuation inputs. In the fiscal year ending June 30, 2019, charitable remainder trusts totaling $0.5 million transferred from a trust held by others (Level 3) to the University as trustee (Level 1). There were no level transfers in the year ending June 30, 2018.
Realized/unrealized gains on Level 3 assets included in changes in net assets are reported in the following revenue categories:
(in thousands)
Total net gains included in changes in net assets $ 29,996 $ 76,974
Change in net unrealized gains relating to assets still held at June 30 $ 29,953 $ 80,136
22
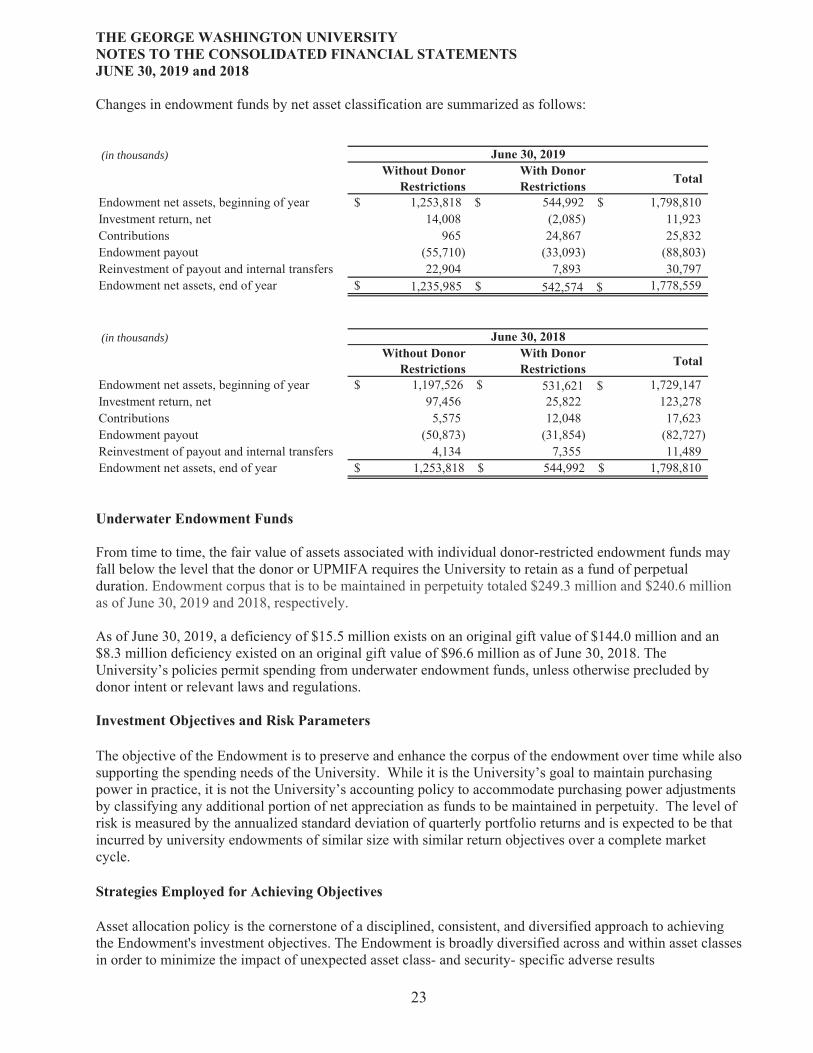
The University’s Endowment (Endowment) consists of the unitized investment pool, investment real estate, and separately managed funds. The Endowment provides stable financial support to a wide variety of programs and activities in perpetuity, playing a critical role in enabling the University to achieve its mission. Programs supported by the Endowment include scholarships, chairs and professorships, fellowships, research activities, and libraries. The Endowment includes both donor-restricted endowment funds and funds designated by the Board of Trustees to function as endowments. Net assets associated with endowment funds, including Board-designated endowment funds, are classified and reported based on the existence or absence of donor-imposed restrictions. Endowment funds without donor restrictions are board designated.
The University interprets the Uniform Prudent Management of Institutional Funds Act of 2007 (UPMIFA) as requiring the preservation of the fair value of the original gift as of the gift date of the donor-restricted endowment funds absent explicit donor stipulations to the contrary. The University classifies as net assets with donor restrictions (a) the original value of gifts donated to the permanent endowment, and (b) accumulations to the permanent endowment made in accordance with the direction of the applicable donor gift instrument. Appreciation on the donor-restricted endowment fund is classified as net assets with donor restrictions until those amounts are appropriated for expenditure by the University in a manner consistent with the standard of prudence prescribed by UPMIFA. In accordance with UPMIFA, the University considers the following factors in making a determination to appropriate or accumulate donor-restricted endowment funds:
The preservation of the fund over time The purposes of the organization and the donor-restricted endowment fund General economic conditions including the possible effects of inflation and deflation The investment policies and expected total return from income and the appreciation of investments Other resources of the organization
3
(in thousands)
(in thousands)
24
and avoid excessive portfolio volatility. The Endowment's long-term target asset allocation is approved by the Subcommittee on Endowment and Investments of the Board of Trustees.
The University's Board of Trustees establishes a spending policy that determines how endowment distributions are made. The spending policy is designed to balance current and future spending requirements by ensuring that a portion of investment return is distributed to operations in the form of payout for current expenditure with the remainder reinvested to shield against inflation. The payout rate is approved annually by the Board of Trustees as part of the budget process. Currently, spending increases in the payout are capped by the change in the Consumer Price Index for the Washington, DC metro area, adjusted for new gifts received during the year. The annual payout is intended to approximate 5% of the average fair value of the endowment. In establishing this policy, the University considered the long-term expected return on its endowment.
Accumulated appreciation in endowment funds with donor-restricted corpus is classified as net assets with donor restrictions until appropriated for spending under the spending policy. At the time of appropriation, the amount of investment income necessary to satisfy the spending policy for the endowment fund and related purpose restrictions, if applicable, is reflected as a Net assets released from restriction, which reduces net assets with donor restrictions and increases net assets without donor restrictions. Any excess of income earned over the approved spending amount is retained in net assets with donor restrictions.
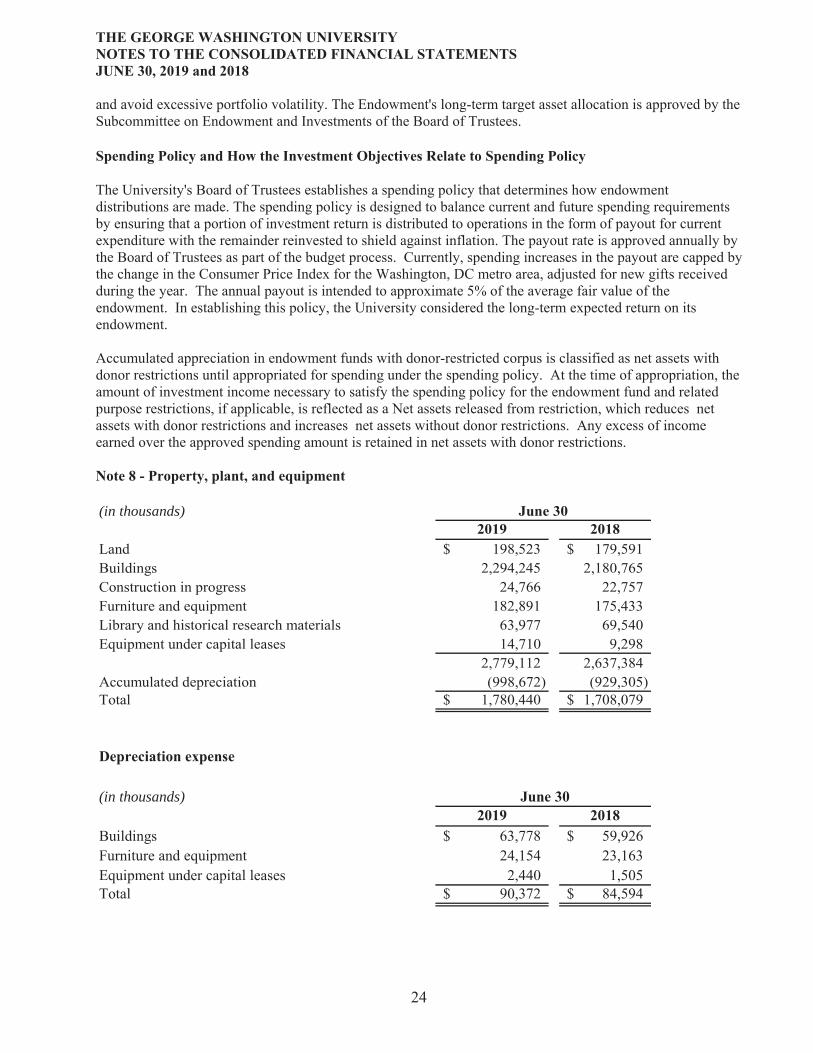
(in thousands)
Land 198,523$ 179,591$ Buildings 2,294,245 2,180,765 Construction in progress 24,766 22,757 Furniture and equipment 182,891 175,433 Library and historical research materials 63,977 69,540 Equipment under capital leases 14,710 9,298
2,779,112 2,637,384 Accumulated depreciation (998,672) (929,305) Total 1,780,440$ 1,708,079$
(in thousands)
Buildings 63,778$ 59,926$ Furniture and equipment 24,154 23,163 Equipment under capital leases 2,440 1,505 Total 90,372$ 84,594$
25
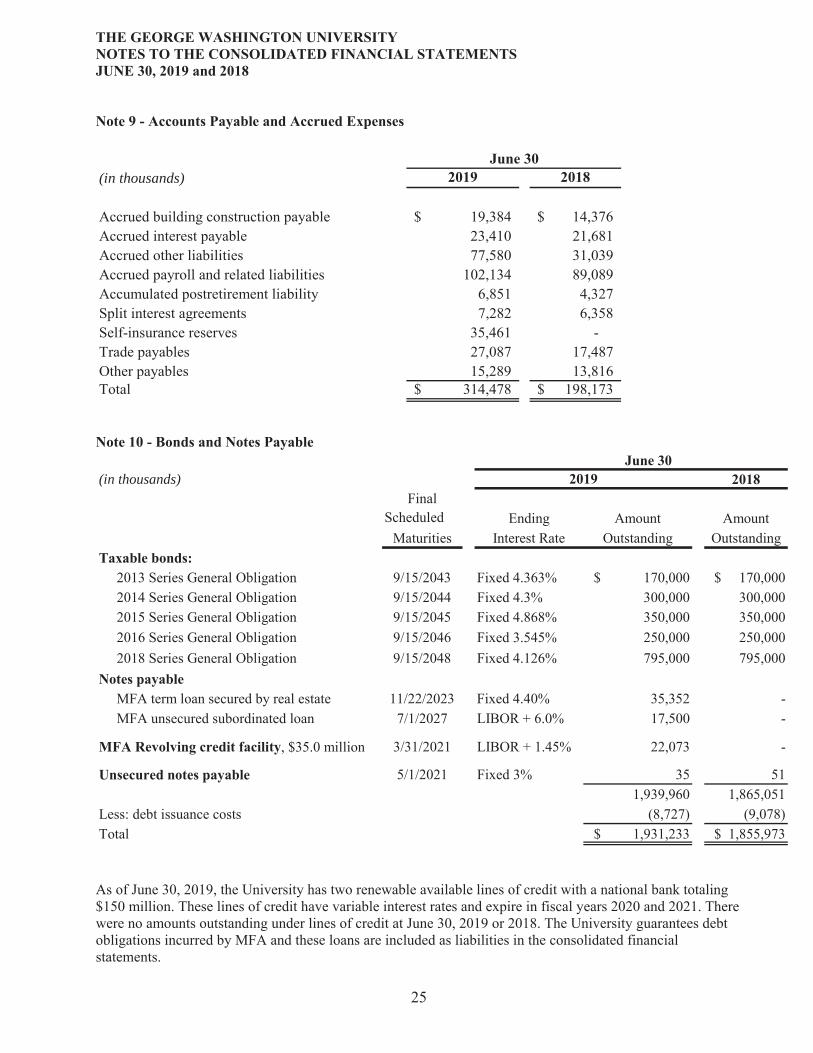
(in thousands)
Accrued building construction payable 19,384$ 14,376$ Accrued interest payable 23,410 21,681 Accrued other liabilities 77,580 31,039 Accrued payroll and related liabilities 102,134 89,089 Accumulated postretirement liability 6,851 4,327 Split interest agreements 7,282 6,358 Self-insurance reserves 35,461 - Trade payables 27,087 17,487 Other payables 15,289 13,816 Total 314,478$ 198,173$
(in thousands)Final
Scheduled Ending Amount AmountMaturities Interest Rate Outstanding Outstanding
2013 Series General Obligation 9/15/2043 Fixed 4.363% $ 170,000 $ 170,000 2014 Series General Obligation 9/15/2044 Fixed 4.3% 300,000 300,000 2015 Series General Obligation 9/15/2045 Fixed 4.868% 350,000 350,000 2016 Series General Obligation 9/15/2046 Fixed 3.545% 250,000 250,000 2018 Series General Obligation 9/15/2048 Fixed 4.126% 795,000 795,000
MFA term loan secured by real estate 11/22/2023 Fixed 4.40% 35,352 - MFA unsecured subordinated loan 7/1/2027 LIBOR + 6.0% 17,500 -
, $35.0 million 3/31/2021 LIBOR + 1.45% 22,073 -
5/1/2021 Fixed 3% 35 51 1,939,960 1,865,051
Less: debt issuance costs (8,727) (9,078)Total $ 1,931,233 $ 1,855,973
As of June 30, 2019, the University has two renewable available lines of credit with a national bank totaling $150 million. These lines of credit have variable interest rates and expire in fiscal years 2020 and 2021. There were no amounts outstanding under lines of credit at June 30, 2019 or 2018. The University guarantees debt obligations incurred by MFA and these loans are included as liabilities in the consolidated financial statements.
26
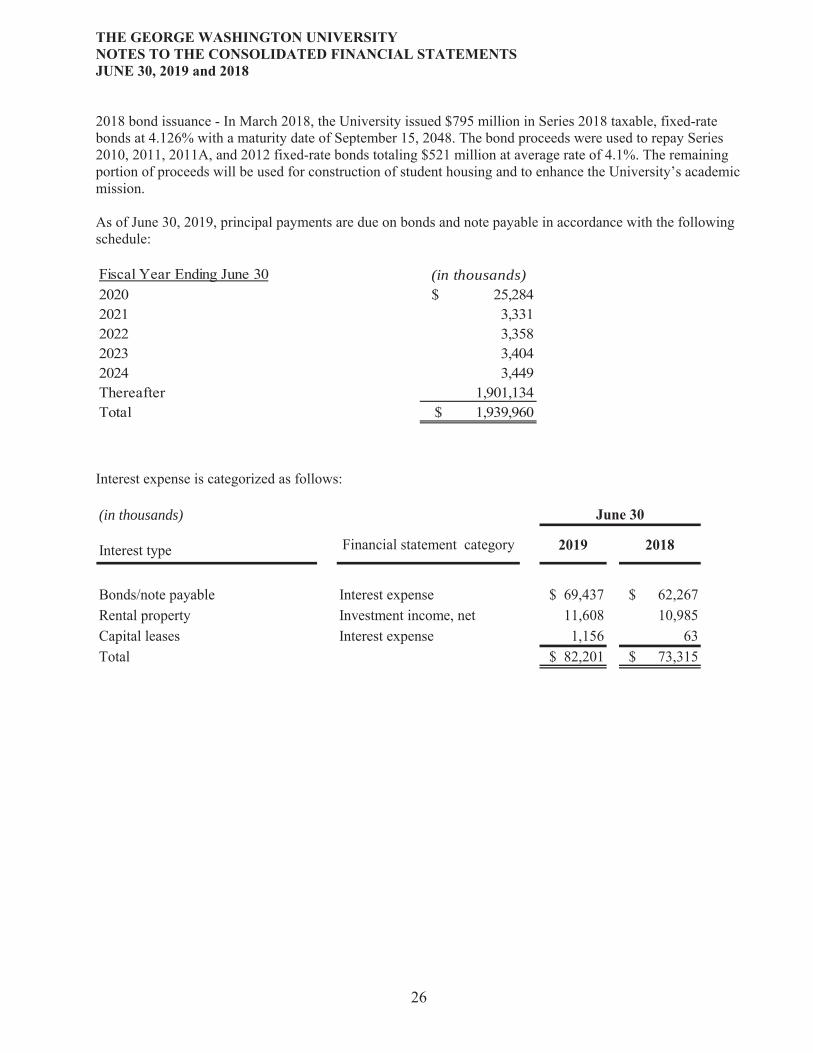
2018 bond issuance - In March 2018, the University issued $795 million in Series 2018 taxable, fixed-rate bonds at 4.126% with a maturity date of September 15, 2048. The bond proceeds were used to repay Series 2010, 2011, 2011A, and 2012 fixed-rate bonds totaling $521 million at average rate of 4.1%. The remaining portion of proceeds will be used for construction of student housing and to enhance the University’s academic mission.
As of June 30, 2019, principal payments are due on bonds and note payable in accordance with the following schedule:
(in thousands)2020 $ 25,284 2021 3,331 2022 3,358 2023 3,404 2024 3,449 Thereafter 1,901,134 Total $ 1,939,960
Fiscal Year Ending June 30
Interest expense is categorized as follows:
(in thousands)
Interest type Financial statement category
Bonds/note payable Interest expense $ 69,437 $ 62,267 Rental property Investment income, net 11,608 10,985 Capital leases Interest expense 1,156 63 Total $ 82,201 $ 73,315
27
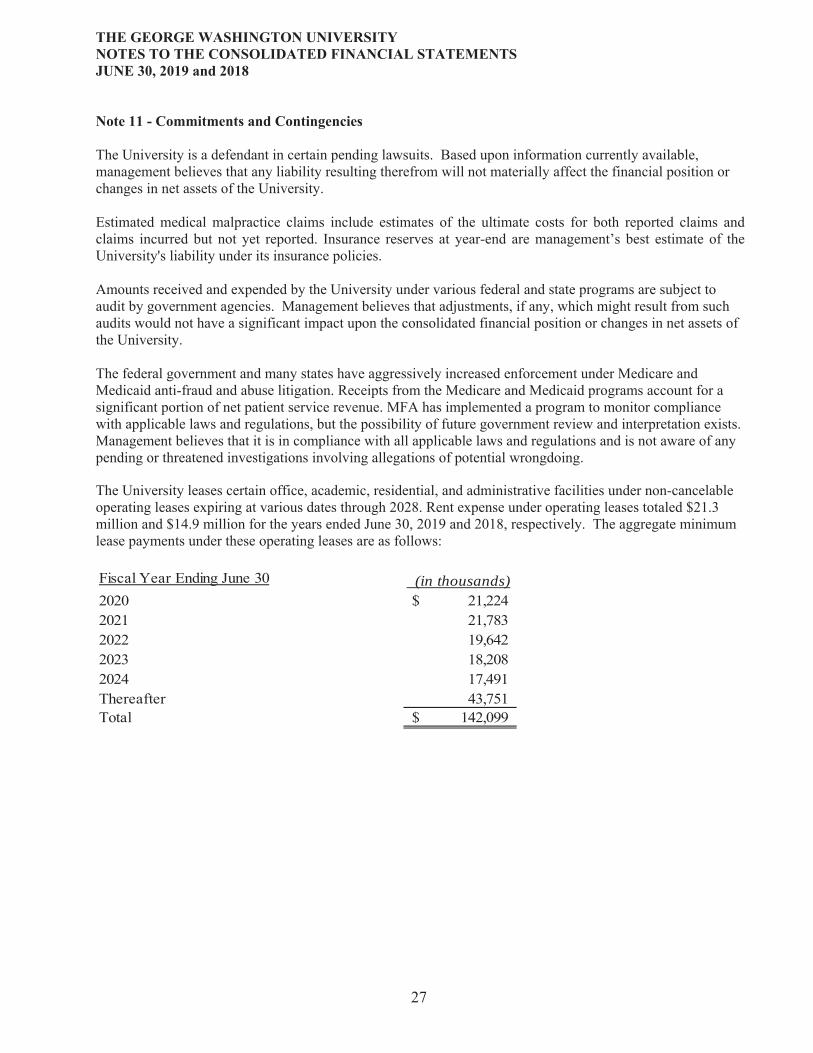
The University is a defendant in certain pending lawsuits. Based upon information currently available, management believes that any liability resulting therefrom will not materially affect the financial position or changes in net assets of the University.
Estimated medical malpractice claims include estimates of the ultimate costs for both reported claims and claims incurred but not yet reported. Insurance reserves at year-end are management’s best estimate of the University's liability under its insurance policies.
Amounts received and expended by the University under various federal and state programs are subject to audit by government agencies. Management believes that adjustments, if any, which might result from such audits would not have a significant impact upon the consolidated financial position or changes in net assets of the University.
The federal government and many states have aggressively increased enforcement under Medicare and Medicaid anti-fraud and abuse litigation. Receipts from the Medicare and Medicaid programs account for a significant portion of net patient service revenue. MFA has implemented a program to monitor compliance with applicable laws and regulations, but the possibility of future government review and interpretation exists. Management believes that it is in compliance with all applicable laws and regulations and is not aware of any pending or threatened investigations involving allegations of potential wrongdoing
The University leases certain office, academic, residential, and administrative facilities under non-cancelable operating leases expiring at various dates through 2028. Rent expense under operating leases totaled $21.3 million and $14.9 million for the years ended June 30, 2019 and 2018, respectively. The aggregate minimum lease payments under these operating leases are as follows:
(in thousands)2020 21,224$ 2021 21,783 2022 19,642 2023 18,208 2024 17,491 Thereafter 43,751 Total 142,099$
Fiscal Year Ending June 30
28
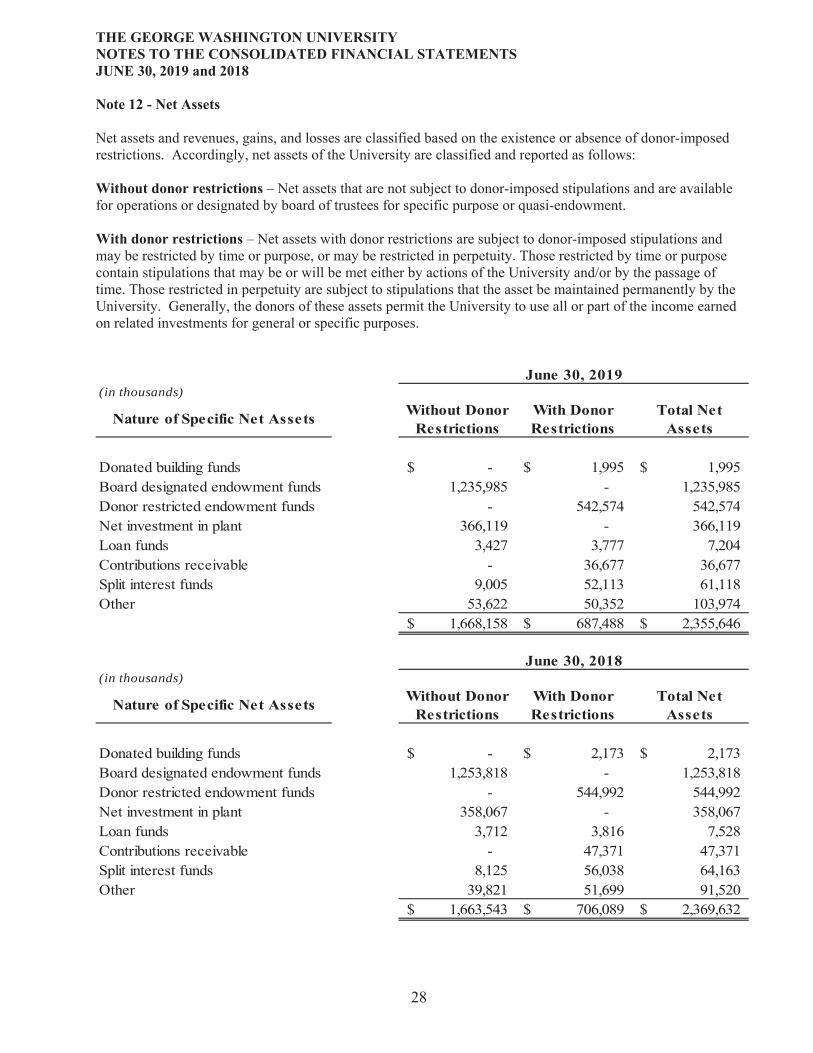
Net assets and revenues, gains, and losses are classified based on the existence or absence of donor-imposed restrictions. Accordingly, net assets of the University are classified and reported as follows:
– Net assets that are not subject to donor-imposed stipulations and are available for operations or designated by board of trustees for specific purpose or quasi-endowment.
– Net assets with donor restrictions are subject to donor-imposed stipulations and may be restricted by time or purpose, or may be restricted in perpetuity. Those restricted by time or purpose contain stipulations that may be or will be met either by actions of the University and/or by the passage of time. Those restricted in perpetuity are subject to stipulations that the asset be maintained permanently by the University. Generally, the donors of these assets permit the University to use all or part of the income earned on related investments for general or specific purposes.
(in thousands)
Donated building funds -$ 1,995$ 1,995$ Board designated endowment funds 1,235,985 - 1,235,985 Donor restricted endowment funds - 542,574 542,574Net investment in plant 366,119 - 366,119Loan funds 3,427 3,777 7,204 Contributions receivable - 36,677 36,677 Split interest funds 9,005 52,113 61,118 Other 53,622 50,352 103,974
1,668,158$ 687,488$ 2,355,646$
(in thousands)
Donated building funds -$ 2,173$ 2,173$ Board designated endowment funds 1,253,818 - 1,253,818 Donor restricted endowment funds - 544,992 544,992Net investment in plant 358,067 - 358,067Loan funds 3,712 3,816 7,528 Contributions receivable - 47,371 47,371 Split interest funds 8,125 56,038 64,163 Other 39,821 51,699 91,520
1,663,543$ 706,089$ 2,369,632$
9
(in thousands)
30
Full-time and regular part-time faculty and staff are eligible for participation in the University’s defined contribution retirement program. The program is administered by the University. Independent vendors receive contributions for the plan for investment purposes and process distributions from the plan. Any present or future employee who completes two years of service becomes eligible to participate in the program.
The plan consists of both a noncontributory and a matching component. All eligible participants receive a contribution equal to 4% of their base salary. In addition, for those employees electing to participate in the matching portion of the program, the University contributes an additional amount equal to 1½% for each 1% of eligible compensation contributed by the employee, but not to exceed an amount equal to 6% of the participant’s eligible compensation. Participants are immediately fully vested in both types of the University’s contributions. Eligible participants direct the investment of contributions made on their behalf. For eligible participants who do not provide investment direction for contributions, the University contributions are invested in a Qualified Default Investment Alternative based on the expected year of retirement. University contributions to the retirement plan amounted to $40.1 million and $39.2 million for the years ended June 30, 2019 and 2018, respectively.
The University provides health care and life insurance benefits to certain retired employees. These employees become eligible for benefits after meeting age and service requirements. Effective June 1, 2017, the University updated its post retirement benefit plan to provide a Medicare health insurance exchange for retirees and long-term disability participants who are age 65 or older. A Retiree Health Savings Plan is provided for retirees who are under age 65 or are not Medicare eligible. The plan change reduced the accumulated postretirement liability by approximately $16 million. The University’s policy is to fund postretirement benefits as payments are made. Accounts payable and accrued expenses include accumulated postretirement liability of $6.9 million and $4.3 million as of June 30, 2019 and 2018, respectively.
The University has a 20% limited partnership interest in District Hospital Partners, L.P. (DHP), which owns and operates the GW Hospital and provides support to the University in developing and maintaining the medical academic and research programs. The University’s investment in DHP is recorded on the equity basis of accounting. The University’s share of the partnership’s profits for the years ended June 30, 2019 and 2018 was approximately $12.2 million and $14.7 million, respectively.
The University and DHP have executed several agreements, which reimburse or compensate the University for providing services or personnel to assist in the continued operations of the GW Hospital. Medical education agreements revenue of approximately $38.4 million and $36.7 million was reported for the years ended June 30, 2019 and 2018, respectively. The receivable from DHP for the unpaid balance of these services is $4.8 million and $6.9 million as of June 30, 2019 and 2018, respectively. DHP has provided a $30.0 million line of credit to the MFA which had an outstanding balance of $17.5 million as of June 30, 2019. The MFA recorded contract revenue from DHP totaling $4.1 million for the period following the business combination effective December 14, 2018.
31
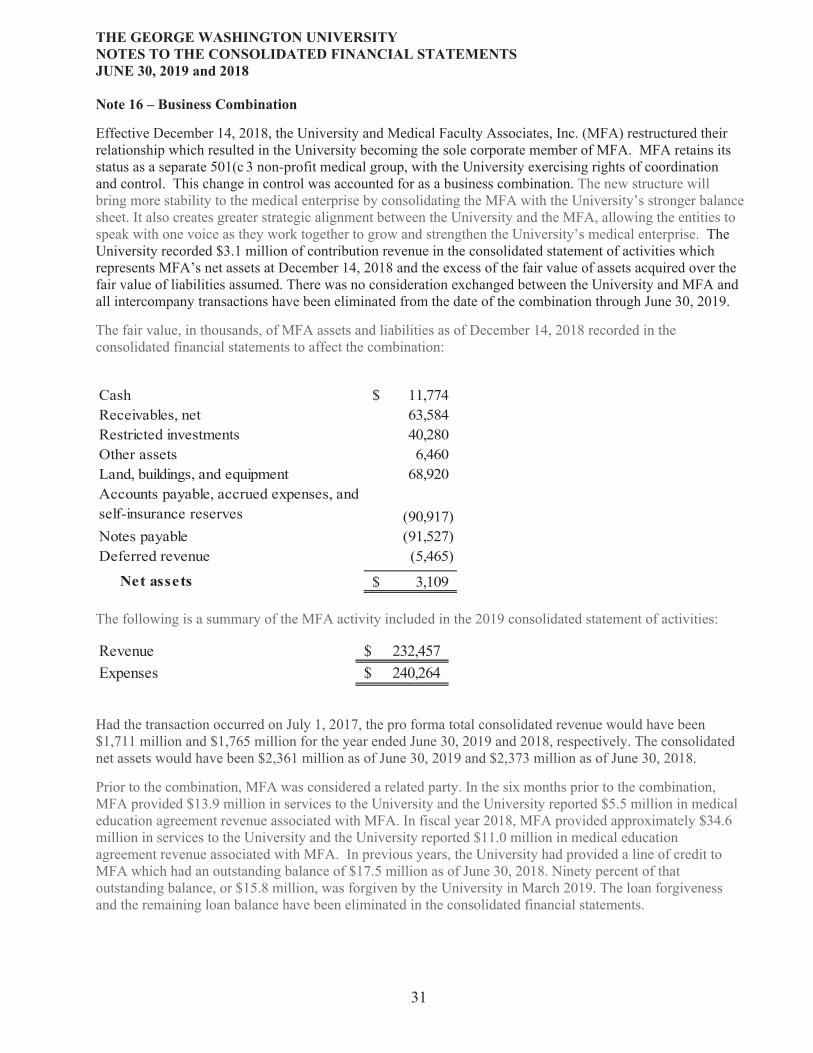
Effective December 14, 2018, the University and Medical Faculty Associates, Inc. (MFA) restructured their relationship which resulted in the University becoming the sole corporate member of MFA. MFA retains its status as a separate 501(c 3 non-profit medical group, with the University exercising rights of coordination and control. This change in control was accounted for as a business combination. The new structure will bring more stability to the medical enterprise by consolidating the MFA with the University’s stronger balance sheet. It also creates greater strategic alignment between the University and the MFA, allowing the entities to speak with one voice as they work together to grow and strengthen the University’s medical enterprise. The University recorded $3.1 million of contribution revenue in the consolidated statement of activities which represents MFA’s net assets at December 14, 2018 and the excess of the fair value of assets acquired over the fair value of liabilities assumed. There was no consideration exchanged between the University and MFA and all intercompany transactions have been eliminated from the date of the combination through June 30, 2019.
The fair value, in thousands, of MFA assets and liabilities as of December 14, 2018 recorded in the consolidated financial statements to affect the combination:
Cash 11,774$ Receivables, net 63,584 Restricted investments 40,280 Other assets 6,460 Land, buildings, and equipment 68,920
(90,917) Notes payable (91,527) Deferred revenue (5,465)
3,109$
Accounts payable, accrued expenses, and self-insurance reserves
The following is a summary of the MFA activity included in the 2019 consolidated statement of activities:
Revenue 232,457$ Expenses 240,264$
Had the transaction occurred on July 1, 2017, the pro forma total consolidated revenue would have been $1,711 million and $1,765 million for the year ended June 30, 2019 and 2018, respectively. The consolidated net assets would have been $2,361 million as of June 30, 2019 and $2,373 million as of June 30, 2018.
Prior to the combination, MFA was considered a related party. In the six months prior to the combination, MFA provided $13.9 million in services to the University and the University reported $5.5 million in medical education agreement revenue associated with MFA. In fiscal year 2018, MFA provided approximately $34.6 million in services to the University and the University reported $11.0 million in medical education agreement revenue associated with MFA. In previous years, the University had provided a line of credit to MFA which had an outstanding balance of $17.5 million as of June 30, 2018. Ninety percent of that outstanding balance, or $15.8 million, was forgiven by the University in March 2019. The loan forgiveness and the remaining loan balance have been eliminated in the consolidated financial statements.
32
The University has performed an evaluation of subsequent events through October 3, 2019, which is the date the financial statements were issued, noting no other events which affect the financial statements as of June 30, 2019.
33
Supplementary Consolidating Information
The accompanying notes are an integral part of these consolidating financial statements.
34
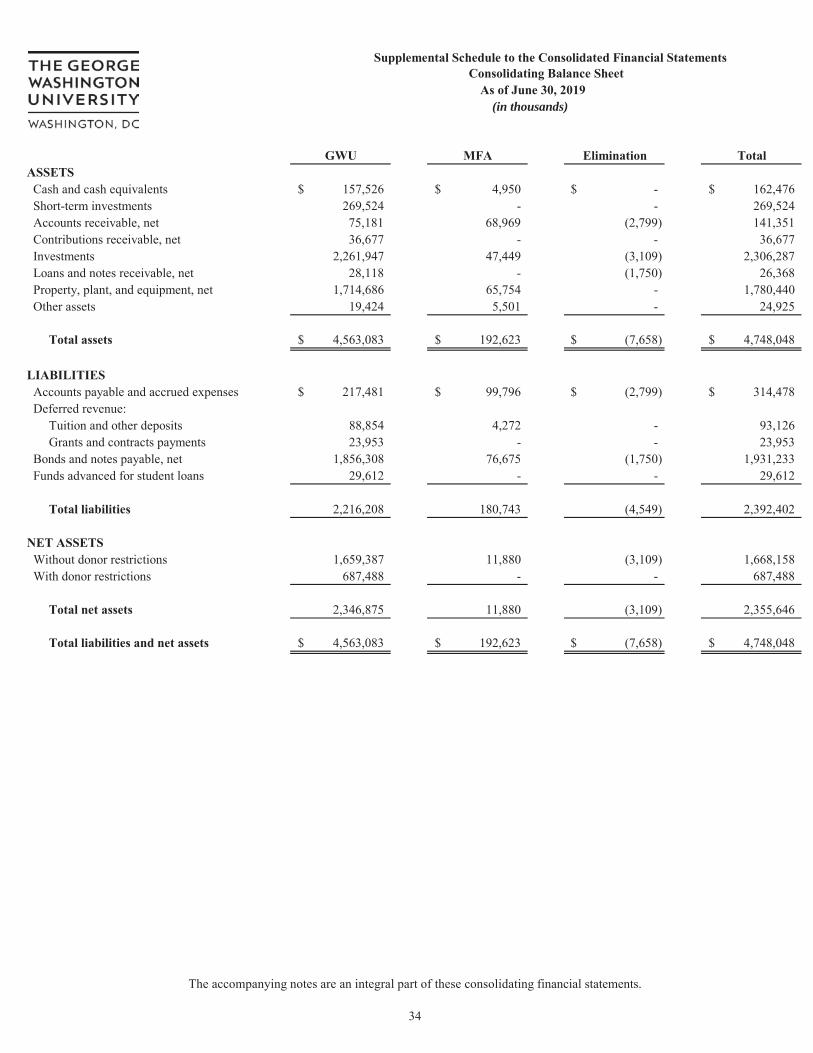
GWU MFA Elimination TotalASSETS Cash and cash equivalents 157,526$ 4,950$ -$ 162,476$ Short-term investments 269,524 - - 269,524 Accounts receivable, net 75,181 68,969 (2,799) 141,351 Contributions receivable, net 36,677 - - 36,677 Investments 2,261,947 47,449 (3,109) 2,306,287 Loans and notes receivable, net 28,118 - (1,750) 26,368 Property, plant, and equipment, net 1,714,686 65,754 - 1,780,440 Other assets 19,424 5,501 - 24,925
Total assets 4,563,083$ 192,623$ (7,658)$ 4,748,048$
LIABILITIES Accounts payable and accrued expenses 217,481$ 99,796$ (2,799)$ 314,478$ Deferred revenue:
Tuition and other deposits 88,854 4,272 - 93,126Grants and contracts payments 23,953 - - 23,953
Bonds and notes payable, net 1,856,308 76,675 (1,750) 1,931,233 Funds advanced for student loans 29,612 - - 29,612
Total liabilities 2,216,208 180,743 (4,549) 2,392,402
NET ASSETS Without donor restrictions 1,659,387 11,880 (3,109) 1,668,158 With donor restrictions 687,488 - - 687,488
Total net assets 2,346,875 11,880 (3,109) 2,355,646
Total liabilities and net assets 4,563,083$ 192,623$ (7,658)$ 4,748,048$
As of June 30, 2019
Supplemental Schedule to the Consolidated Financial Statements
(in thousands)
Consolidating Balance Sheet
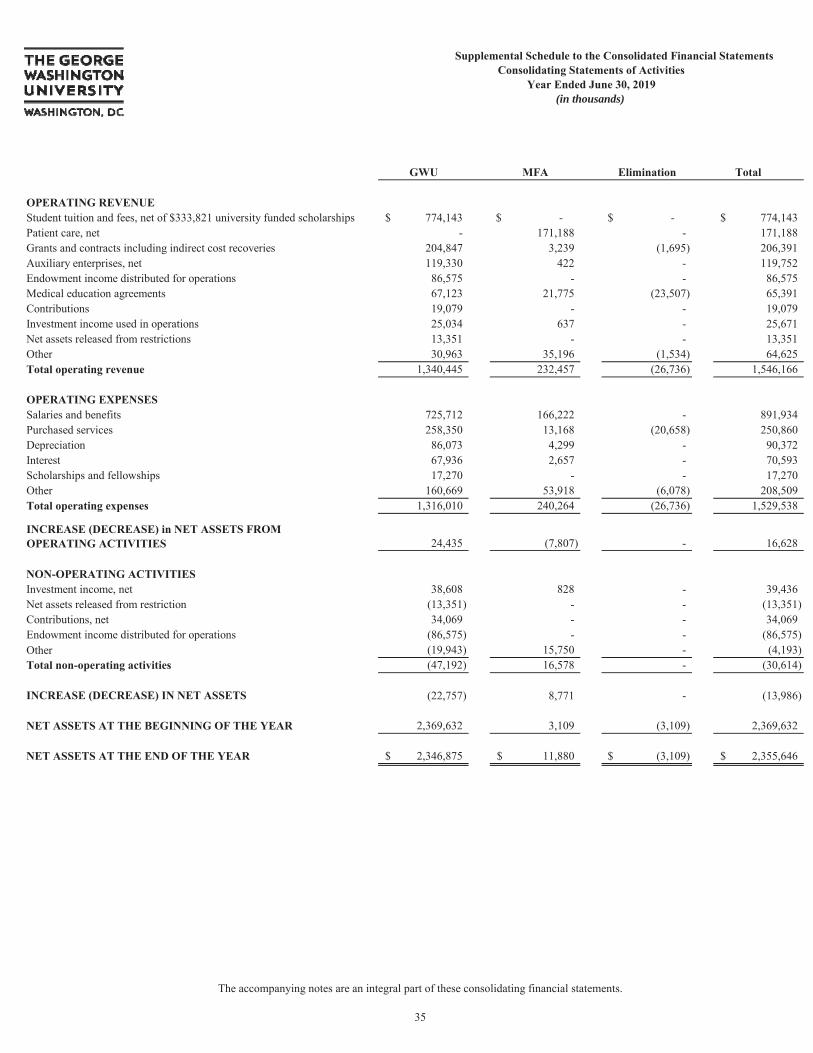
Student tuition and fees, net of $333,821 university funded scholarships 774,143$ -$ -$ 774,143$ Patient care, net - 171,188 - 171,188 Grants and contracts including indirect cost recoveries 204,847 3,239 (1,695) 206,391 Auxiliary enterprises, net 119,330 422 - 119,752 Endowment income distributed for operations 86,575 - - 86,575 Medical education agreements 67,123 21,775 (23,507) 65,391 Contributions 19,079 - - 19,079 Investment income used in operations 25,034 637 - 25,671 Net assets released from restrictions 13,351 - - 13,351 Other 30,963 35,196 (1,534) 64,625
1,340,445 232,457 (26,736) 1,546,166
Salaries and benefits 725,712 166,222 - 891,934 Purchased services 258,350 13,168 (20,658) 250,860 Depreciation 86,073 4,299 - 90,372 Interest 67,936 2,657 - 70,593 Scholarships and fellowships 17,270 - - 17,270 Other 160,669 53,918 (6,078) 208,509
1,316,010 240,264 (26,736) 1,529,538
24,435 (7,807) - 16,628
Investment income, net 38,608 828 - 39,436 Net assets released from restriction (13,351) - - (13,351) Contributions, net 34,069 - - 34,069 Endowment income distributed for operations (86,575) - - (86,575) Other (19,943) 15,750 - (4,193)
(47,192) 16,578 - (30,614)
(22,757) 8,771 - (13,986)
2,369,632 3,109 (3,109) 2,369,632
2,346,875$ 11,880$ (3,109)$ 2,355,646$
(in thousands)
The accompanying notes are an integral part of these consolidating financial statements.
35
36
The consolidating supplemental schedules as of and for the year ending June 30, 2019, are derived from and relate directly to the underlying accounting and other records used to prepare the consolidated financial statements. The consolidating supplemental schedules are presented for purposes of additional analysis of the consolidated financial statements and are not a required part of the consolidated financial statements. The individual components of the consolidating schedules are disclosed in Note 1 to the consolidated financial statements. The GWU component represents the full fiscal year 2019 activity, excluding the MFA. The MFA component represents activity from December 14, 2018 (the effective date of the business combination) through June 30, 2019.
Schedule of Expenditures of Federal Awards Notes to Schedule of Expenditures of Federal Awards and
Reports under the OMB Uniform Guidance
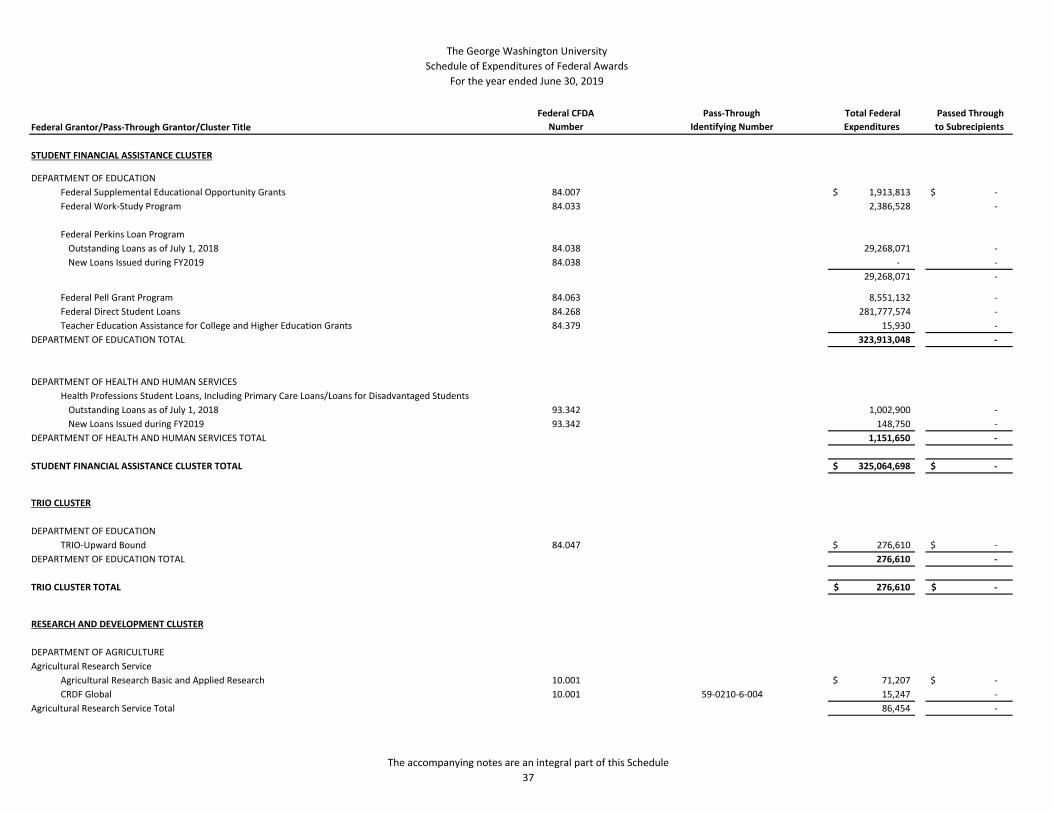
The George Washington UniversitySchedule of Expenditures of Federal Awards
For the year ended June 30, 2019
Federal Grantor/Pass‐Through Grantor/Cluster TitleFederal CFDA
NumberPass‐Through
Identifying Number Total FederalExpenditures
Passed Throughto Subrecipients
STUDENT FINANCIAL ASSISTANCE CLUSTER
DEPARTMENT OF EDUCATIONFederal Supplemental Educational Opportunity Grants 84.007 1,913,813$ ‐$ Federal Work‐Study Program 84.033 2,386,528 ‐
Federal Perkins Loan ProgramOutstanding Loans as of July 1, 2018 84.038 29,268,071 ‐ New Loans Issued during FY2019 84.038 ‐ ‐
29,268,071 ‐
Federal Pell Grant Program 84.063 8,551,132 ‐ Federal Direct Student Loans 84.268 281,777,574 ‐ Teacher Education Assistance for College and Higher Education Grants 84.379 15,930 ‐
DEPARTMENT OF EDUCATION TOTAL 323,913,048 ‐
DEPARTMENT OF HEALTH AND HUMAN SERVICESHealth Professions Student Loans, Including Primary Care Loans/Loans for Disadvantaged StudentsOutstanding Loans as of July 1, 2018 93.342 1,002,900 ‐ New Loans Issued during FY2019 93.342 148,750 ‐
DEPARTMENT OF HEALTH AND HUMAN SERVICES TOTAL 1,151,650 ‐
STUDENT FINANCIAL ASSISTANCE CLUSTER TOTAL 325,064,698$ ‐$
TRIO CLUSTER
DEPARTMENT OF EDUCATIONTRIO‐Upward Bound 84.047 276,610$ ‐$
DEPARTMENT OF EDUCATION TOTAL 276,610 ‐
TRIO CLUSTER TOTAL 276,610$ ‐$
RESEARCH AND DEVELOPMENT CLUSTER
DEPARTMENT OF AGRICULTUREAgricultural Research Service
Agricultural Research Basic and Applied Research 10.001 71,207$ ‐$ CRDF Global 10.001 59‐0210‐6‐004 15,247 ‐
Agricultural Research Service Total 86,454 ‐
The accompanying notes are an integral part of this Schedule 37
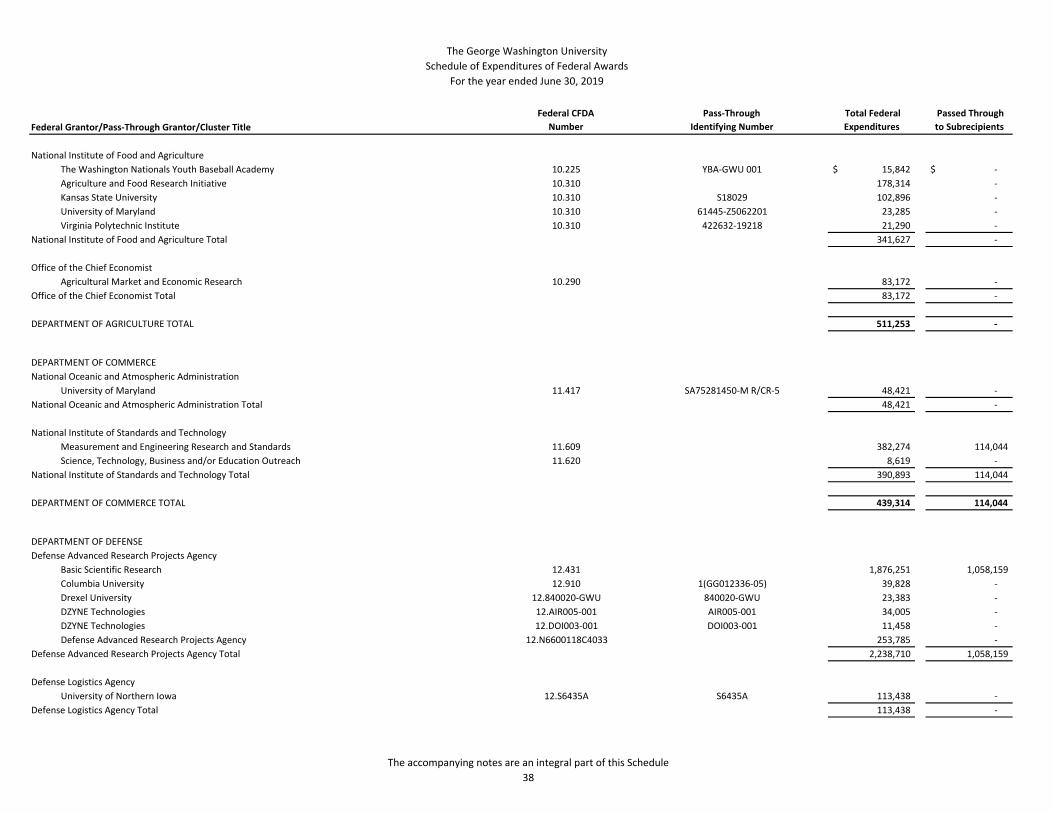
The George Washington UniversitySchedule of Expenditures of Federal Awards
For the year ended June 30, 2019
Federal Grantor/Pass‐Through Grantor/Cluster TitleFederal CFDA
NumberPass‐Through
Identifying Number Total FederalExpenditures
Passed Throughto Subrecipients
National Institute of Food and AgricultureThe Washington Nationals Youth Baseball Academy 10.225 YBA‐GWU 001 15,842$ ‐$ Agriculture and Food Research Initiative 10.310 178,314 ‐ Kansas State University 10.310 S18029 102,896 ‐ University of Maryland 10.310 61445‐Z5062201 23,285 ‐ Virginia Polytechnic Institute 10.310 422632‐19218 21,290 ‐
National Institute of Food and Agriculture Total 341,627 ‐
Office of the Chief EconomistAgricultural Market and Economic Research 10.290 83,172 ‐
Office of the Chief Economist Total 83,172 ‐
DEPARTMENT OF AGRICULTURE TOTAL 511,253 ‐
DEPARTMENT OF COMMERCENational Oceanic and Atmospheric Administration
University of Maryland 11.417 SA75281450‐M R/CR‐5 48,421 ‐ National Oceanic and Atmospheric Administration Total 48,421 ‐
National Institute of Standards and TechnologyMeasurement and Engineering Research and Standards 11.609 382,274 114,044 Science, Technology, Business and/or Education Outreach 11.620 8,619 ‐
National Institute of Standards and Technology Total 390,893 114,044
DEPARTMENT OF COMMERCE TOTAL 439,314 114,044
DEPARTMENT OF DEFENSEDefense Advanced Research Projects Agency
Basic Scientific Research 12.431 1,876,251 1,058,159 Columbia University 12.910 1(GG012336‐05) 39,828 ‐ Drexel University 12.840020‐GWU 840020‐GWU 23,383 ‐ DZYNE Technologies 12.AIR005‐001 AIR005‐001 34,005 ‐ DZYNE Technologies 12.DOI003‐001 DOI003‐001 11,458 ‐ Defense Advanced Research Projects Agency 12.N6600118C4033 253,785 ‐
Defense Advanced Research Projects Agency Total 2,238,710 1,058,159
Defense Logistics AgencyUniversity of Northern Iowa 12.S6435A S6435A 113,438 ‐
Defense Logistics Agency Total 113,438 ‐
The accompanying notes are an integral part of this Schedule 38
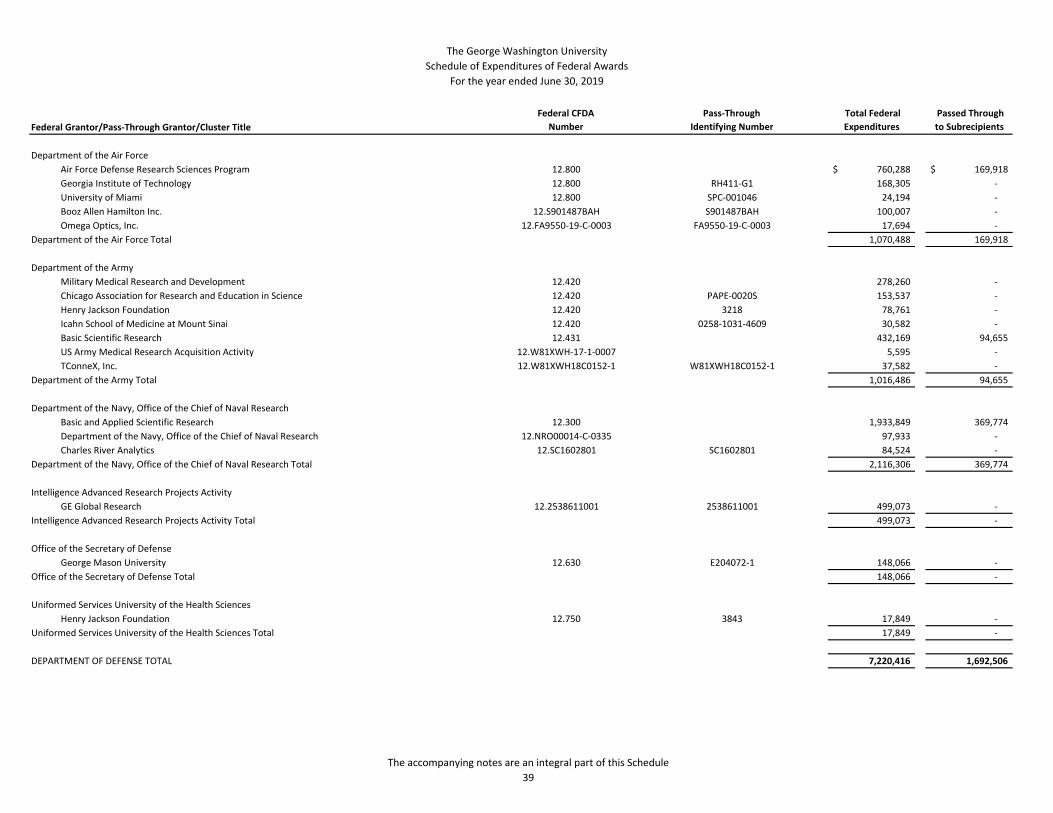
The George Washington UniversitySchedule of Expenditures of Federal Awards
For the year ended June 30, 2019
Federal Grantor/Pass‐Through Grantor/Cluster TitleFederal CFDA
NumberPass‐Through
Identifying Number Total FederalExpenditures
Passed Throughto Subrecipients
Department of the Air ForceAir Force Defense Research Sciences Program 12.800 760,288$ 169,918$ Georgia Institute of Technology 12.800 RH411‐G1 168,305 ‐ University of Miami 12.800 SPC‐001046 24,194 ‐ Booz Allen Hamilton Inc. 12.S901487BAH S901487BAH 100,007 ‐ Omega Optics, Inc. 12.FA9550‐19‐C‐0003 FA9550‐19‐C‐0003 17,694 ‐
Department of the Air Force Total 1,070,488 169,918
Department of the ArmyMilitary Medical Research and Development 12.420 278,260 ‐ Chicago Association for Research and Education in Science 12.420 PAPE‐0020S 153,537 ‐ Henry Jackson Foundation 12.420 3218 78,761 ‐ Icahn School of Medicine at Mount Sinai 12.420 0258‐1031‐4609 30,582 ‐ Basic Scientific Research 12.431 432,169 94,655 US Army Medical Research Acquisition Activity 12.W81XWH‐17‐1‐0007 5,595 ‐ TConneX, Inc. 12.W81XWH18C0152‐1 W81XWH18C0152‐1 37,582 ‐
Department of the Army Total 1,016,486 94,655
Department of the Navy, Office of the Chief of Naval ResearchBasic and Applied Scientific Research 12.300 1,933,849 369,774 Department of the Navy, Office of the Chief of Naval Research 12.NRO00014‐C‐0335 97,933 ‐ Charles River Analytics 12.SC1602801 SC1602801 84,524 ‐
Department of the Navy, Office of the Chief of Naval Research Total 2,116,306 369,774
Intelligence Advanced Research Projects ActivityGE Global Research 12.2538611001 2538611001 499,073 ‐
Intelligence Advanced Research Projects Activity Total 499,073 ‐
Office of the Secretary of DefenseGeorge Mason University 12.630 E204072‐1 148,066 ‐
Office of the Secretary of Defense Total 148,066 ‐
Uniformed Services University of the Health SciencesHenry Jackson Foundation 12.750 3843 17,849 ‐
Uniformed Services University of the Health Sciences Total 17,849 ‐
DEPARTMENT OF DEFENSE TOTAL 7,220,416 1,692,506
The accompanying notes are an integral part of this Schedule 39
The George Washington UniversitySchedule of Expenditures of Federal Awards
For the year ended June 30, 2019
Federal Grantor/Pass‐Through Grantor/Cluster TitleFederal CFDA
NumberPass‐Through
Identifying Number Total FederalExpenditures
Passed Throughto Subrecipients
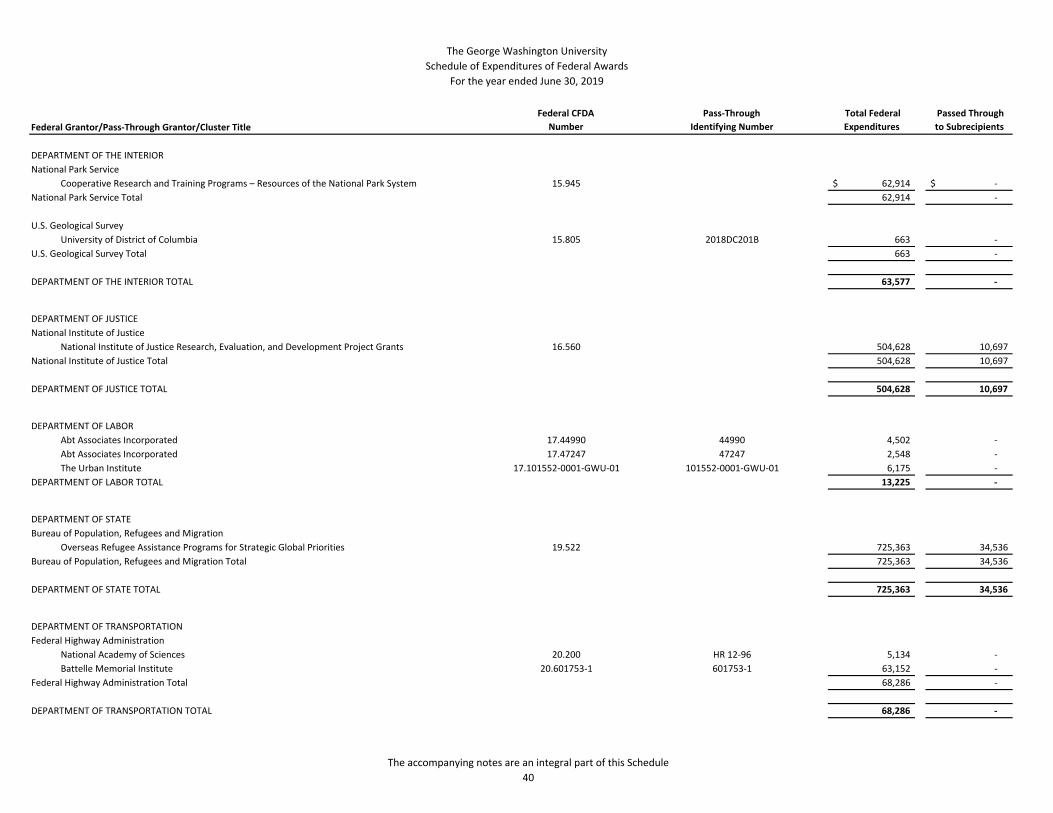
DEPARTMENT OF THE INTERIORNational Park Service
Cooperative Research and Training Programs – Resources of the National Park System 15.945 62,914$ ‐$ National Park Service Total 62,914 ‐
U.S. Geological SurveyUniversity of District of Columbia 15.805 2018DC201B 663 ‐
U.S. Geological Survey Total 663 ‐
DEPARTMENT OF THE INTERIOR TOTAL 63,577 ‐
DEPARTMENT OF JUSTICENational Institute of Justice
National Institute of Justice Research, Evaluation, and Development Project Grants 16.560 504,628 10,697 National Institute of Justice Total 504,628 10,697
DEPARTMENT OF JUSTICE TOTAL 504,628 10,697
DEPARTMENT OF LABORAbt Associates Incorporated 17.44990 44990 4,502 ‐ Abt Associates Incorporated 17.47247 47247 2,548 ‐ The Urban Institute 17.101552‐0001‐GWU‐01 101552‐0001‐GWU‐01 6,175 ‐
DEPARTMENT OF LABOR TOTAL 13,225 ‐
DEPARTMENT OF STATEBureau of Population, Refugees and Migration
Overseas Refugee Assistance Programs for Strategic Global Priorities 19.522 725,363 34,536 Bureau of Population, Refugees and Migration Total 725,363 34,536
DEPARTMENT OF STATE TOTAL 725,363 34,536
DEPARTMENT OF TRANSPORTATIONFederal Highway Administration
National Academy of Sciences 20.200 HR 12‐96 5,134 ‐ Battelle Memorial Institute 20.601753‐1 601753‐1 63,152 ‐
Federal Highway Administration Total 68,286 ‐
DEPARTMENT OF TRANSPORTATION TOTAL 68,286 ‐
The accompanying notes are an integral part of this Schedule 40
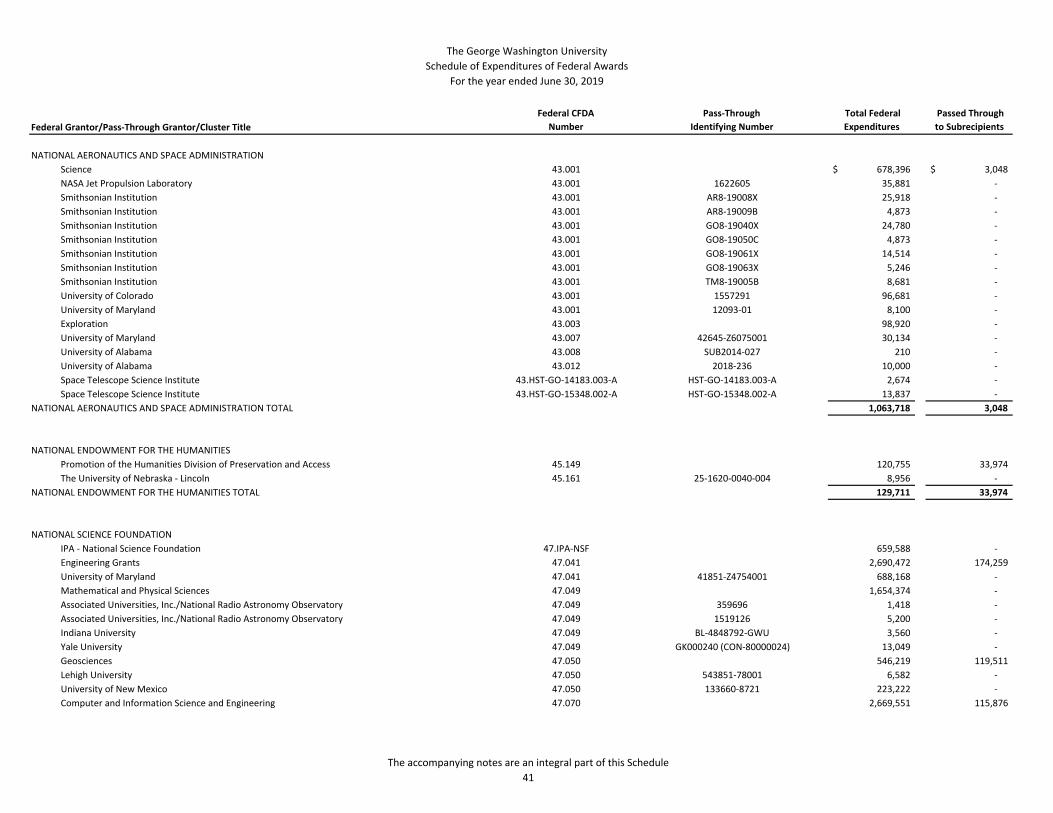
The George Washington UniversitySchedule of Expenditures of Federal Awards
For the year ended June 30, 2019
Federal Grantor/Pass‐Through Grantor/Cluster TitleFederal CFDA
NumberPass‐Through
Identifying Number Total FederalExpenditures
Passed Throughto Subrecipients
NATIONAL AERONAUTICS AND SPACE ADMINISTRATIONScience 43.001 678,396$ 3,048$ NASA Jet Propulsion Laboratory 43.001 1622605 35,881 ‐ Smithsonian Institution 43.001 AR8‐19008X 25,918 ‐ Smithsonian Institution 43.001 AR8‐19009B 4,873 ‐ Smithsonian Institution 43.001 GO8‐19040X 24,780 ‐ Smithsonian Institution 43.001 GO8‐19050C 4,873 ‐ Smithsonian Institution 43.001 GO8‐19061X 14,514 ‐ Smithsonian Institution 43.001 GO8‐19063X 5,246 ‐ Smithsonian Institution 43.001 TM8‐19005B 8,681 ‐ University of Colorado 43.001 1557291 96,681 ‐ University of Maryland 43.001 12093‐01 8,100 ‐ Exploration 43.003 98,920 ‐ University of Maryland 43.007 42645‐Z6075001 30,134 ‐ University of Alabama 43.008 SUB2014‐027 210 ‐ University of Alabama 43.012 2018‐236 10,000 ‐ Space Telescope Science Institute 43.HST‐GO‐14183.003‐A HST‐GO‐14183.003‐A 2,674 ‐ Space Telescope Science Institute 43.HST‐GO‐15348.002‐A HST‐GO‐15348.002‐A 13,837 ‐
NATIONAL AERONAUTICS AND SPACE ADMINISTRATION TOTAL 1,063,718 3,048
NATIONAL ENDOWMENT FOR THE HUMANITIESPromotion of the Humanities Division of Preservation and Access 45.149 120,755 33,974 The University of Nebraska ‐ Lincoln 45.161 25‐1620‐0040‐004 8,956 ‐
NATIONAL ENDOWMENT FOR THE HUMANITIES TOTAL 129,711 33,974
NATIONAL SCIENCE FOUNDATIONIPA ‐ National Science Foundation 47.IPA‐NSF 659,588 ‐ Engineering Grants 47.041 2,690,472 174,259 University of Maryland 47.041 41851‐Z4754001 688,168 ‐ Mathematical and Physical Sciences 47.049 1,654,374 ‐ Associated Universities, Inc./National Radio Astronomy Observatory 47.049 359696 1,418 ‐ Associated Universities, Inc./National Radio Astronomy Observatory 47.049 1519126 5,200 ‐ Indiana University 47.049 BL‐4848792‐GWU 3,560 ‐ Yale University 47.049 GK000240 (CON‐80000024) 13,049 ‐ Geosciences 47.050 546,219 119,511 Lehigh University 47.050 543851‐78001 6,582 ‐ University of New Mexico 47.050 133660‐8721 223,222 ‐ Computer and Information Science and Engineering 47.070 2,669,551 115,876
The accompanying notes are an integral part of this Schedule 41
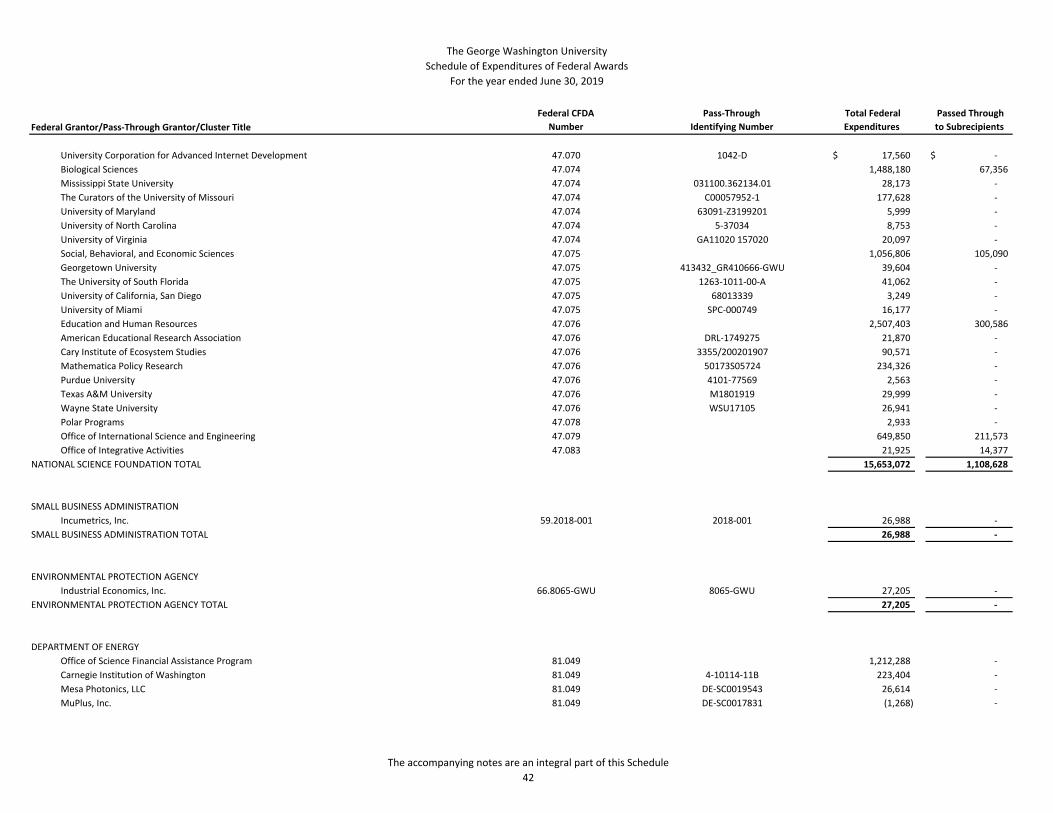
The George Washington UniversitySchedule of Expenditures of Federal Awards
For the year ended June 30, 2019
Federal Grantor/Pass‐Through Grantor/Cluster TitleFederal CFDA
NumberPass‐Through
Identifying Number Total FederalExpenditures
Passed Throughto Subrecipients
University Corporation for Advanced Internet Development 47.070 1042‐D 17,560$ ‐$ Biological Sciences 47.074 1,488,180 67,356 Mississippi State University 47.074 031100.362134.01 28,173 ‐ The Curators of the University of Missouri 47.074 C00057952‐1 177,628 ‐ University of Maryland 47.074 63091‐Z3199201 5,999 ‐ University of North Carolina 47.074 5‐37034 8,753 ‐ University of Virginia 47.074 GA11020 157020 20,097 ‐ Social, Behavioral, and Economic Sciences 47.075 1,056,806 105,090 Georgetown University 47.075 413432_GR410666‐GWU 39,604 ‐ The University of South Florida 47.075 1263‐1011‐00‐A 41,062 ‐ University of California, San Diego 47.075 68013339 3,249 ‐ University of Miami 47.075 SPC‐000749 16,177 ‐ Education and Human Resources 47.076 2,507,403 300,586 American Educational Research Association 47.076 DRL‐1749275 21,870 ‐ Cary Institute of Ecosystem Studies 47.076 3355/200201907 90,571 ‐ Mathematica Policy Research 47.076 50173S05724 234,326 ‐ Purdue University 47.076 4101‐77569 2,563 ‐ Texas A&M University 47.076 M1801919 29,999 ‐ Wayne State University 47.076 WSU17105 26,941 ‐ Polar Programs 47.078 2,933 ‐ Office of International Science and Engineering 47.079 649,850 211,573 Office of Integrative Activities 47.083 21,925 14,377
NATIONAL SCIENCE FOUNDATION TOTAL 15,653,072 1,108,628
SMALL BUSINESS ADMINISTRATIONIncumetrics, Inc. 59.2018‐001 2018‐001 26,988 ‐
SMALL BUSINESS ADMINISTRATION TOTAL 26,988 ‐
ENVIRONMENTAL PROTECTION AGENCYIndustrial Economics, Inc. 66.8065‐GWU 8065‐GWU 27,205 ‐
ENVIRONMENTAL PROTECTION AGENCY TOTAL 27,205 ‐
DEPARTMENT OF ENERGYOffice of Science Financial Assistance Program 81.049 1,212,288 ‐ Carnegie Institution of Washington 81.049 4‐10114‐11B 223,404 ‐ Mesa Photonics, LLC 81.049 DE‐SC0019543 26,614 ‐ MuPlus, Inc. 81.049 DE‐SC0017831 (1,268) ‐
The accompanying notes are an integral part of this Schedule 42
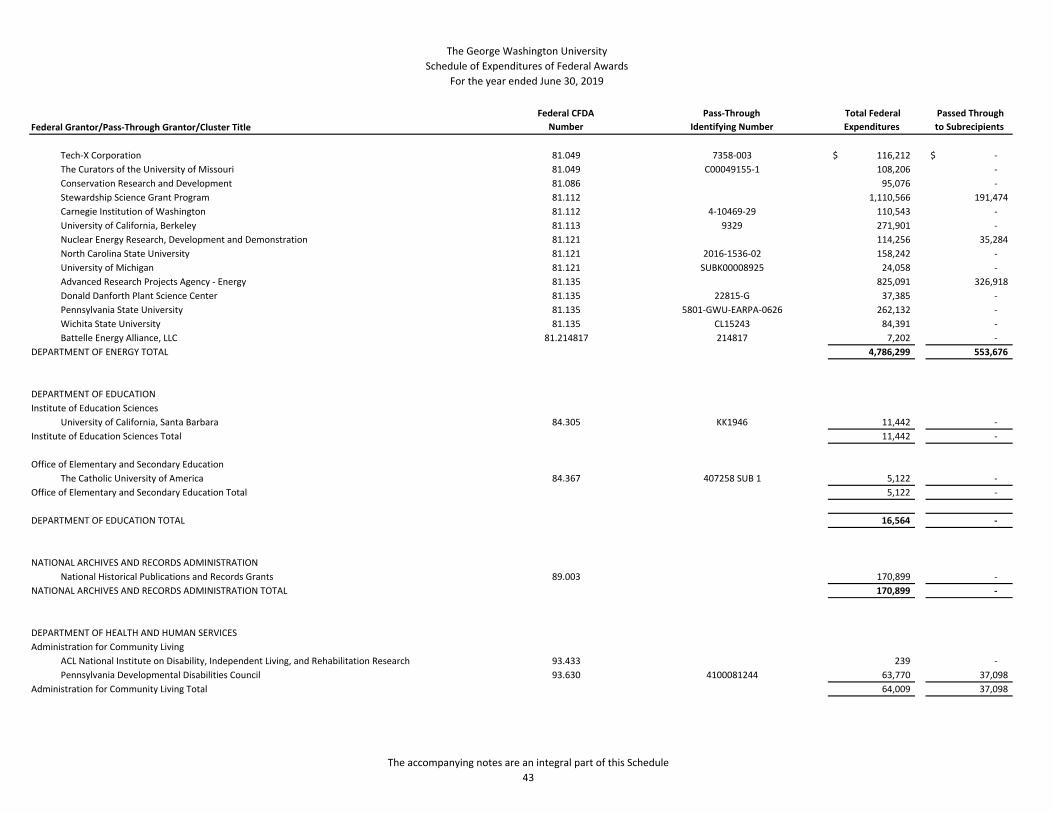
The George Washington UniversitySchedule of Expenditures of Federal Awards
For the year ended June 30, 2019
Federal Grantor/Pass‐Through Grantor/Cluster TitleFederal CFDA
NumberPass‐Through
Identifying Number Total FederalExpenditures
Passed Throughto Subrecipients
Tech‐X Corporation 81.049 7358‐003 116,212$ ‐$ The Curators of the University of Missouri 81.049 C00049155‐1 108,206 ‐ Conservation Research and Development 81.086 95,076 ‐ Stewardship Science Grant Program 81.112 1,110,566 191,474 Carnegie Institution of Washington 81.112 4‐10469‐29 110,543 ‐ University of California, Berkeley 81.113 9329 271,901 ‐ Nuclear Energy Research, Development and Demonstration 81.121 114,256 35,284 North Carolina State University 81.121 2016‐1536‐02 158,242 ‐ University of Michigan 81.121 SUBK00008925 24,058 ‐ Advanced Research Projects Agency ‐ Energy 81.135 825,091 326,918 Donald Danforth Plant Science Center 81.135 22815‐G 37,385 ‐ Pennsylvania State University 81.135 5801‐GWU‐EARPA‐0626 262,132 ‐ Wichita State University 81.135 CL15243 84,391 ‐ Battelle Energy Alliance, LLC 81.214817 214817 7,202 ‐
DEPARTMENT OF ENERGY TOTAL 4,786,299 553,676
DEPARTMENT OF EDUCATIONInstitute of Education Sciences
University of California, Santa Barbara 84.305 KK1946 11,442 ‐ Institute of Education Sciences Total 11,442 ‐
Office of Elementary and Secondary EducationThe Catholic University of America 84.367 407258 SUB 1 5,122 ‐
Office of Elementary and Secondary Education Total 5,122 ‐
DEPARTMENT OF EDUCATION TOTAL 16,564 ‐
NATIONAL ARCHIVES AND RECORDS ADMINISTRATIONNational Historical Publications and Records Grants 89.003 170,899 ‐
NATIONAL ARCHIVES AND RECORDS ADMINISTRATION TOTAL 170,899 ‐
DEPARTMENT OF HEALTH AND HUMAN SERVICESAdministration for Community Living
ACL National Institute on Disability, Independent Living, and Rehabilitation Research 93.433 239 ‐ Pennsylvania Developmental Disabilities Council 93.630 4100081244 63,770 37,098
Administration for Community Living Total 64,009 37,098
The accompanying notes are an integral part of this Schedule 43
The George Washington UniversitySchedule of Expenditures of Federal Awards
For the year ended June 30, 2019
Federal Grantor/Pass‐Through Grantor/Cluster TitleFederal CFDA
NumberPass‐Through
Identifying Number Total FederalExpenditures
Passed Throughto Subrecipients
Agency for Healthcare Research and QualityResearch on Healthcare Costs, Quality and Outcomes 93.226 68,337$ ‐$
Agency for Healthcare Research and Quality Total 68,337 ‐
Centers for Disease Control and PreventionOccupational Safety and Health Program 93.262 100,225 18,126 Boston University 93.262 4500002932 27,584 ‐ Centers for Disease Control and Prevention Investigations and Technical Assistance 93.283 226,520 ‐ National Foundation for the Centers for Disease Control and Prevention, Inc. 93.421 6 NU38OT000288‐01‐00 79,032 ‐ Provision of Technical Assistance and Training Activities to Assure Comprehensive Cancer Control Outcomes 93.427 485,024 ‐ Louisiana State University 93.808 PH‐18‐111‐025 5,447 ‐ Washington State Department of Health 93.808 N22423 5,920 ‐ The District of Columbia Department of Health 93.CW29654 CW29654 934,724 ‐
Centers for Disease Control and Prevention Total 1,864,476 18,126
Centers for Medicare and Medicaid ServicesTruven Health Analytics LLC 93.CMS‐TEFT‐GW CMS‐TEFT‐GW 104,923 ‐
Centers for Medicare and Medicaid Services Total 104,923 ‐
Food and Drug AdministrationFood and Drug Administration 93.HHSF223201510117C (1,078) ‐ Food and Drug Administration 93.HHSF223201510129C 48,677 ‐
Food and Drug Administration Total 47,599 ‐
Health Resources and Services AdministrationSchool‐Based Health Alliance 93.110 SBHA‐GW 001 16,938 ‐ University of Massachusetts 93.110 WA00583863/OSP2017206 348 ‐ Technical and Non‐Financial Assistance to Health Centers 93.129 414,655 ‐ The Medical University of South Carolina 93.236 MUSC18‐137‐8D474 30,411 ‐ National Center for Health Workforce Analysis 93.300 701,345 ‐ Health Careers Opportunity Program 93.822 393,864 ‐
Health Resources and Services Administration Total 1,557,561 ‐
Immediate Office of the Secretary of Health and Human ServicesMedical Reserve Corps Small Grant Program 93.088 188,457 47,461
Immediate Office of the Secretary of Health and Human Services Total 188,457 47,461
The accompanying notes are an integral part of this Schedule 44
The George Washington UniversitySchedule of Expenditures of Federal Awards
For the year ended June 30, 2019
Federal Grantor/Pass‐Through Grantor/Cluster TitleFederal CFDA
NumberPass‐Through
Identifying Number Total FederalExpenditures
Passed Throughto Subrecipients
National Institutes of HealthEnvironmental Health 93.113 385,892$ 61,139$ Oral Diseases and Disorders Research 93.121 320,789 100,732 Research Related to Deafness and Communication Disorders 93.173 320,343 57,997 Seehear LLC 93.173 SH_GWU_002 11,064 ‐ Yale University 93.213 GR101634 (CON‐80001053) 9,076 ‐ Yale University 93.213 GR104718 (CON‐80001491) 47,510 ‐ University of Arizona 93.233 217735 7,637 ‐ University of Chicago 93.233 FP053428 27,229 ‐ Mental Health Research Grants 93.242 2,589,921 1,391,529 Northwestern University 93.242 60050592 GWU 47,237 ‐ The Research Foundation for State University of New York 93.242 83202/2/1150777 27,939 ‐ University of Puerto Rico, Medical Sciences Campus 93.242 1R21MH119664‐01 13,896 ‐ University of Virginia 93.242 GB10691.PO#2133375 6,713 ‐ Alcohol Research Programs 93.273 483,938 ‐ Drug Abuse and Addiction Research Programs 93.279 339,363 30,308 Columbia University 93.279 6(GG008261) 31,866 ‐ Emory University 93.279 T855314 60,589 ‐ Truth Initiative Foundation 93.279 7016‐GWU 24,868 ‐ Discovery and Applied Research for Technological Innovations to Improve Human Health 93.286 845,720 253,896 University of Maryland 93.286 57821‐Z0093202 47,772 ‐ Minority Health and Health Disparities Research 93.307 998,842 92,147 Benten Technologies, Inc. 93.307 1R41MD012294‐01 2,686 ‐ Northwestern University 93.307 60044820 GWASHU 221,281 ‐ University of Pennsylvania 93.307 573518 34,176 ‐ University of Pennsylvania 93.307 576151 11,279 ‐ Virginia Institute of Technology 93.307 432098‐19218 21,375 ‐ Trans‐NIH Research Support 93.310 551,091 ‐ The Regents of the University of California 93.310 1553 G WF670 52,926 ‐ University of Georgia 93.310 SUB00001540 716,087 ‐ University of Oregon 93.310 281210B 587,390 ‐ Children's Research Institute 93.350 30003443‐01 1,685,794 ‐ Children's Research Institute 93.350 30003517 30,280 ‐ University of Wisconsin 93.353 769K613 13,277 ‐ Nursing Research 93.361 (54) ‐ Cancer Cause and Prevention Research 93.393 2,232,566 493,154 Georgetown University 93.393 413047_GR412999‐GW 77,040 ‐ Media Rez, LLC 93.393 R43CA232905 36,575 ‐ University of California, San Francisco 93.393 7850SC 993,740 ‐ University of Pennsylvania 93.393 565706 17,693 ‐
The accompanying notes are an integral part of this Schedule 45
The George Washington UniversitySchedule of Expenditures of Federal Awards
For the year ended June 30, 2019
Federal Grantor/Pass‐Through Grantor/Cluster TitleFederal CFDA
NumberPass‐Through
Identifying Number Total FederalExpenditures
Passed Throughto Subrecipients
Virginia Polytechnic Institute 93.393 432006‐19218 12,765$ ‐$ Yale University 93.393 GK000215 (CON‐0000564) 31,214 ‐ Cancer Detection and Diagnosis Research 93.394 981,361 430,312 Tufts University 93.394 102758‐00001/NIH072 6,432 ‐ Cancer Treatment Research 93.395 691,799 58,567 Cornell University 93.395 183827‐01 61,466 ‐ ImmunoBlue, LLC 93.395 DCACTIVE‐22438570.1 90,471 ‐ University of California, Los Angeles 93.395 1568 G WA553 32,631 ‐ Cancer Biology Research 93.396 2,172,819 355,091 University of Maryland 93.396 61391‐Z0121201 18,774 ‐ H. Lee Moffitt Cancer Center and Research Institute 93.397 10‐17469‐05‐06.G2 52,593 ‐ Cancer Research Manpower 93.398 4,136 ‐ Cardiovascular Diseases Research 93.837 3,809,778 404,482 Georgetown University 93.837 412513_GR409546‐GWU 141,147 ‐ InvivoSciences, Inc. 93.837 IR44HL13924801A1 96,703 ‐ Johns Hopkins University 93.837 2002843557 124,384 ‐ Johns Hopkins University 93.837 2003286657 85,085 ‐ Johns Hopkins University 93.837 2004026448 72,205 ‐ Nocturnal Product Development, LLC 93.837 2R42HL120511‐03 259,300 ‐ The University of Minnesota 93.837 N006187405 5,731 ‐ The University of Minnesota 93.837 N006187437 12,269 ‐ University of Virginia 93.837 GB10332 155744 22,281 ‐ University of Virginia 93.837 GB10332 158826 666,638 ‐ University of Virginia 93.837 GB10332 2151222 42,563 ‐ Washington University in St. Louis 93.837 WU‐16‐300 11,506 ‐ Lung Diseases Research 93.838 1,715,563 1,223,949 Children's Research Institute 93.839 30004447‐01 30,358 ‐ Diabetes, Digestive, and Kidney Diseases Extramural Research 93.847 43,458,517 30,240,400 Beckman Research Institute of the City of Hope 93.847 51990.2001413.669201 8,139 ‐ Case Western Reserve University 93.847 RES508522 406 ‐ Case Western Reserve University 93.847 RES509456 104,199 ‐ Case Western Reserve University 93.847 RES510572 102,853 ‐ Case Western Reserve University 93.847 RES512885 1,791 ‐ Case Western Reserve University 93.847 RES514026 108,689 ‐ Massachusetts General Hospital 93.847 225209 64,092 ‐ NYU Winthrop Hospital 93.847 3500‐07429(GWU) 44,799 ‐ Seattle Institute for Biomedical and Clinical Research 93.847 KS141‐GWU‐7 2,500 ‐ Seattle Institute for Biomedical and Clinical Research 93.847 KS141‐GWU‐8 270,956 ‐ Seattle Institute for Biomedical and Clinical Research 93.847 PJ115‐GWU‐1 15,430 ‐ The Research Foundation for State University of New York 93.847 1138946‐77867 5,103 ‐
The accompanying notes are an integral part of this Schedule 46
The George Washington UniversitySchedule of Expenditures of Federal Awards
For the year ended June 30, 2019
Federal Grantor/Pass‐Through Grantor/Cluster TitleFederal CFDA
NumberPass‐Through
Identifying Number Total FederalExpenditures
Passed Throughto Subrecipients
University of Connecticut 93.847 182459 12,923$ ‐$ University of Washington 93.847 UWSC9246 24,283 ‐ Wake Forest University 93.847 WFUHS 113617 29,869 ‐ Extramural Research Programs in the Neurosciences and Neurological Disorders 93.853 1,408,854 120,129 Case Western Reserve University 93.853 RES510437 80,286 ‐ Yale University 93.853 GK000561 (CON‐80000624) 21,099 ‐ Allergy and Infectious Diseases Research 93.855 13,241,429 4,299,192 Antigen Discovery, Inc. 93.855 ADI‐GWU 2018‐001 77,006 ‐ Brigham and Women's Hospital 93.855 109930 124,328 ‐ Brigham and Women's Hospital 93.855 117360 3,112 ‐ Children's Research Institute 93.855 30004046 15,040 ‐ Cornell University 93.855 183723‐05 440,494 ‐ Duke University 93.855 203‐7719 494,482 ‐ Duke University 93.855 A039053 748,443 ‐ Emory University 93.855 T842377 74,557 ‐ Emory University 93.855 T886653 134,739 ‐ Family Health International 93.855 15001681 880,476 ‐ Family Health International 93.855 HPTN‐MGA‐GWU‐1 418,158 ‐ Family Health International 93.855 PO17001872 386,975 ‐ Family Health International 93.855 PO17001882 870,275 870,275 Johns Hopkins University 93.855 2003368362 138,451 ‐ Johns Hopkins University 93.855 2003933944 5,070 ‐ Kaiser Foundation Hospitals 93.855 OOS030194‐01 235,941 ‐ Massachusetts General Hospital 93.855 229712 39,656 ‐ Massachusetts General Hospital 93.855 231767 45,039 ‐ Massachusetts General Hospital 93.855 232069 155,989 ‐ Massachusetts Institute of Technology 93.855 5710004110 15,156 ‐ New York University 93.855 F0504‐03 8,700 ‐ Stellenbosch University 93.855 S0005603 32,875 ‐ The University of Iowa 93.855 S00434‐01 26,538 ‐ The University of Iowa 93.855 W000834342 181,594 ‐ University of California, San Diego 93.855 91560036 62,805 ‐ University of Pittsburgh 93.855 0054948 (129999‐1) 13,532 ‐ Virginia Institute of Technology 93.855 432057‐19218 34,557 ‐ Washington University in St. Louis 93.855 WU‐16‐161 43,949 ‐ Biomedical Research and Research Training 93.859 820,430 368,481 Columbia University 93.859 1(GG011515‐01) 49,327 ‐ North Dakota State University 93.859 FAR0025511 96,615 ‐ University of Maryland 93.859 63309‐Z0138201 18,628 ‐ University of Pittsburgh 93.859 0045462 (128908‐3) 4,785 ‐
The accompanying notes are an integral part of this Schedule 47
The George Washington UniversitySchedule of Expenditures of Federal Awards
For the year ended June 30, 2019
Federal Grantor/Pass‐Through Grantor/Cluster TitleFederal CFDA
NumberPass‐Through
Identifying Number Total FederalExpenditures
Passed Throughto Subrecipients
Child Health and Human Development Extramural Research 93.865 15,400,087$ 6,995,959$ Children's Research Institute 93.865 30003597 36,625 ‐ Children's Research Institute 93.865 30003930 9,348 ‐ Children's Research Institute 93.865 30003930‐01 27,085 ‐ Children's Research Institute 93.865 30004197‐01 11,418 ‐ Children's Research Institute 93.865 30004874 8,378 ‐ Columbia University 93.865 1(GG011042‐01) 68,221 ‐ Columbia University 93.865 1(GG014633‐01) 228,610 ‐ Florida Atlantic University 93.865 GR‐K22 10,687 ‐ Johns Hopkins University 93.865 2004058862 13,934 ‐ Sharp Healthcare 93.865 M‐RO12018 GWU 3,637 ‐ The Regents of the University of California 93.865 9646 38,286 ‐ Trustees of Boston College 93.865 5104821‐1 24,235 ‐ Tufts University 93.865 100447‐00001 66,729 ‐ University of Maryland 93.865 1701118A 3,390 ‐ University of Michigan 93.865 3004152691 10,010 ‐ Yale University 93.865 M16A12585 (A10715) 9,347 ‐ Aging Research 93.866 484,929 80,224 Boston University 93.866 4500001984 144 ‐ Seattle Institute for Biomedical and Clinical Research 93.866 TD120‐GWU‐1 28,648 ‐ The University of Utah 93.866 10042502‐02 23,780 ‐ University of California, San Francisco 93.866 11175SC 116,790 ‐ University of Wisconsin 93.866 859K493 26,222 ‐ Vision Research 93.867 997,614 ‐ Thomas Jefferson University 93.867 080‐01000‐S04802 34,870 ‐ Thomas Jefferson University 93.867 080‐01000‐S04803 136,810 ‐ University of Illinois 93.867 7916 19,408 ‐ Medical Library Assistance 93.879 562 ‐ Johns Hopkins University 93.989 2004133810 10,043 ‐ Johns Hopkins University 93.989 2004133982 8,841 ‐ AI Biosciences, Inc. 93.HHSN272201700083C HHSN272201700083C 18,974 ‐ Baylor College of Medicine 93.7000000056 7000000056 245,707 ‐ Duke University 93.2036628 2036628 27,121 ‐ Duke University 93.A030553 A030553 57,119 ‐ University of Mississippi Medical Center 93.66111340819‐03 66111340819‐03 12,318 ‐
National Institutes of Health Total 109,109,244 47,927,963
Office of Aids ResearchMission Analytics Group, Inc. 93.HHSP233201500060I HHSP233201500060I 68,358 ‐
Office of Aids Research Total 68,358 ‐
The accompanying notes are an integral part of this Schedule 48
The George Washington UniversitySchedule of Expenditures of Federal Awards
For the year ended June 30, 2019
Federal Grantor/Pass‐Through Grantor/Cluster TitleFederal CFDA
NumberPass‐Through
Identifying Number Total FederalExpenditures
Passed Throughto Subrecipients
Program Support CenterProgram Support Center 93.HHSP23320095635WC 116,726$ ‐$
Program Support Center Total 116,726 ‐
DEPARTMENT OF HEALTH AND HUMAN SERVICES TOTAL 113,189,690 48,030,648
UNITED STATES AGENCY FOR INTERNATIONAL DEVELOPMENTUSAID Foreign Assistance for Programs Overseas 98.001 303,973 167,884 Elizabeth Glaser Pediatric Aids Foundation 98.001 AID‐OAA‐A‐14‐00060 68,910 ‐ Massachusetts Institute of Technology 98.001 5710004082 107,760 ‐ Texas Tech University 98.001 212057‐01 34,537 ‐ The Regents of the University of California 98.001 20112145407 2,637 ‐ Arizona State University 98.012 ASUB00000195 17,153 ‐
UNITED STATES AGENCY FOR INTERNATIONAL DEVELOPMENT TOTAL 534,970 167,884
UNITED STATES POSTAL SERVICEUnited States Postal Service 99.2BFAAS‐17‐B‐0018 100,259 ‐
UNITED STATES POSTAL SERVICE TOTAL 100,259 ‐
RESEARCH AND DEVELOPMENT CLUSTER TOTAL 145,245,437$ 51,749,641$
ALL OTHER FEDERAL AWARDS
DEPARTMENT OF AGRICULTUREAgricultural Market and Economic Research 10.290 85,340$ ‐$
DEPARTMENT OF AGRICULTURE TOTAL 85,340 ‐
DEPARTMENT OF COMMERCEIPA ‐ Department of Commerce 11.IPA‐Commerce 33,338 ‐
DEPARTMENT OF COMMERCE TOTAL 33,338 ‐
The accompanying notes are an integral part of this Schedule 49
The George Washington UniversitySchedule of Expenditures of Federal Awards
For the year ended June 30, 2019
Federal Grantor/Pass‐Through Grantor/Cluster TitleFederal CFDA
NumberPass‐Through
Identifying Number Total FederalExpenditures
Passed Throughto Subrecipients
DEPARTMENT OF DEFENSEIPA ‐ Department of Defense 12.IPA‐DOD 129,721$ ‐$ IPA ‐ Department of the Navy 12.IPA‐DOD 261,703 ‐ Basic and Applied Scientific Research 12.300 8,684 ‐ Institute of International Education 12.357 1801‐GWU‐08 626,671 ‐ Chicago Association for Research and Education in Science 12.420 PAPE‐0024 6,293 ‐ Institute of International Education 12.579 2603‐GWU‐30 232,847 ‐ Information Security Grants 12.902 34,664 ‐ GenCyber Grants Program 12.903 76,167 ‐ CyberSecurity Core Curriculum 12.905 3,557 ‐
DEPARTMENT OF DEFENSE TOTAL 1,380,307 ‐
DEPARTMENT OF THE INTERIORCooperative Research and Training Programs – Resources of the National Park System 15.945 41,239 ‐
DEPARTMENT OF THE INTERIOR TOTAL 41,239 ‐
DEPARTMENT OF LABORThe Viscardi Center 17.720 4019658 52,053 ‐ The Viscardi Center 17.720 4156885 156,729 ‐
DEPARTMENT OF LABOR TOTAL 208,782 ‐
DEPARTMENT OF STATEPublic Diplomacy Programs 19.040 1,390 ‐
DEPARTMENT OF STATE TOTAL 1,390 ‐
NATIONAL AERONAUTICS AND SPACE ADMINISTRATIONAmerican University 43.008 31377‐GWU‐16 37,154 ‐
NATIONAL AERONAUTICS AND SPACE ADMINISTRATION TOTAL 37,154 ‐
NATIONAL ENDOWMENT FOR THE HUMANITIESPromotion of the Humanities Division of Preservation and Access 45.149 22,825 ‐
NATIONAL ENDOWMENT FOR THE HUMANITIES TOTAL 22,825 ‐
The accompanying notes are an integral part of this Schedule 50
The George Washington UniversitySchedule of Expenditures of Federal Awards
For the year ended June 30, 2019
Federal Grantor/Pass‐Through Grantor/Cluster TitleFederal CFDA
NumberPass‐Through
Identifying Number Total FederalExpenditures
Passed Throughto Subrecipients
INSTITUTE OF MUSEUM AND LIBRARY SERVICESMuseums for America 45.301 48,124$ ‐$ Virginia Institute of Technology 45.313 545262‐19218 9,497 ‐
INSTITUTE OF MUSEUM AND LIBRARY SERVICES TOTAL 57,621 ‐
DEPARTMENT OF VETERANS AFFAIRSIPA ‐ Department of Veteran Affairs 64.IPA‐VA 508,995 ‐
DEPARTMENT OF VETERANS AFFAIRS TOTAL 508,995 ‐
DEPARTMENT OF ENERGYRenewable Energy Research and Development 81.087 (9,791) 7,911 Battelle Memorial Institute 81.315389 315389 17,624 ‐
DEPARTMENT OF ENERGY TOTAL 7,833 7,911
DEPARTMENT OF EDUCATIONNational Resource Centers Program for Foreign Language and Area Studies or Foreign Language and International Studies Program and Foreign Language and Area Studies Fellowship Program 84.015 256,977 ‐ Rehabilitation Long‐Term Training 84.129 516,506 ‐ Centers for International Business Education 84.220 387,063 ‐ VA Department for Aging and Rehabilitative Services 84.235 16‐176 72,442 ‐
San Diego State University Research Foundation 84.264 SA0000491 555,099 ‐ Southern University and A&M College 84.264 OSP‐02‐8300‐2017‐0018 121,876 ‐ Southern University and A&M College 84.264 OSP‐02‐8300‐2018‐0016 219,122 ‐
Subtotal 84.264 896,097 ‐
Special Education ‐ Personnel Development to Improve Services and Results for Children with Disabilities 84.325 308,156 ‐ Georgetown University 84.325 412691_GR412618‐GWU 32,045 ‐
Subtotal 84.325 340,201 ‐
English Language Acquisition State Grants 84.365 632,524 ‐ DEPARTMENT OF EDUCATION TOTAL 3,101,810 ‐
JAPAN U.S. FRIENDSHIP COMMISSIONJapan‐U.S. Friendship Commission Grants 90.300 31,132 ‐
JAPAN U.S. FRIENDSHIP COMMISSION TOTAL 31,132 ‐
The accompanying notes are an integral part of this Schedule 51
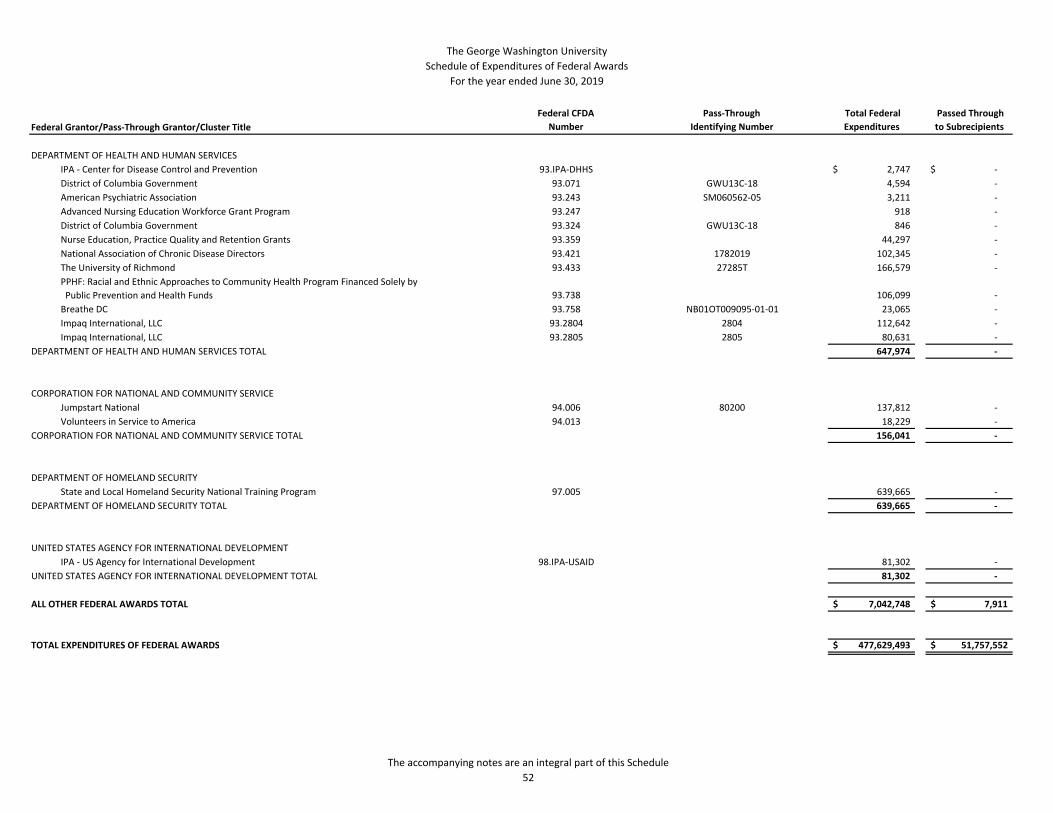
The George Washington UniversitySchedule of Expenditures of Federal Awards
For the year ended June 30, 2019
Federal Grantor/Pass‐Through Grantor/Cluster TitleFederal CFDA
NumberPass‐Through
Identifying Number Total FederalExpenditures
Passed Throughto Subrecipients
DEPARTMENT OF HEALTH AND HUMAN SERVICESIPA ‐ Center for Disease Control and Prevention 93.IPA‐DHHS 2,747$ ‐$ District of Columbia Government 93.071 GWU13C‐18 4,594 ‐ American Psychiatric Association 93.243 SM060562‐05 3,211 ‐ Advanced Nursing Education Workforce Grant Program 93.247 918 ‐ District of Columbia Government 93.324 GWU13C‐18 846 ‐ Nurse Education, Practice Quality and Retention Grants 93.359 44,297 ‐ National Association of Chronic Disease Directors 93.421 1782019 102,345 ‐ The University of Richmond 93.433 27285T 166,579 ‐ PPHF: Racial and Ethnic Approaches to Community Health Program Financed Solely by Public Prevention and Health Funds 93.738 106,099 ‐ Breathe DC 93.758 NB01OT009095‐01‐01 23,065 ‐ Impaq International, LLC 93.2804 2804 112,642 ‐ Impaq International, LLC 93.2805 2805 80,631 ‐
DEPARTMENT OF HEALTH AND HUMAN SERVICES TOTAL 647,974 ‐
CORPORATION FOR NATIONAL AND COMMUNITY SERVICEJumpstart National 94.006 80200 137,812 ‐ Volunteers in Service to America 94.013 18,229 ‐
CORPORATION FOR NATIONAL AND COMMUNITY SERVICE TOTAL 156,041 ‐
DEPARTMENT OF HOMELAND SECURITYState and Local Homeland Security National Training Program 97.005 639,665 ‐
DEPARTMENT OF HOMELAND SECURITY TOTAL 639,665 ‐
UNITED STATES AGENCY FOR INTERNATIONAL DEVELOPMENTIPA ‐ US Agency for International Development 98.IPA‐USAID 81,302 ‐
UNITED STATES AGENCY FOR INTERNATIONAL DEVELOPMENT TOTAL 81,302 ‐
ALL OTHER FEDERAL AWARDS TOTAL 7,042,748$ 7,911$
TOTAL EXPENDITURES OF FEDERAL AWARDS 477,629,493$ 51,757,552$
The accompanying notes are an integral part of this Schedule 52
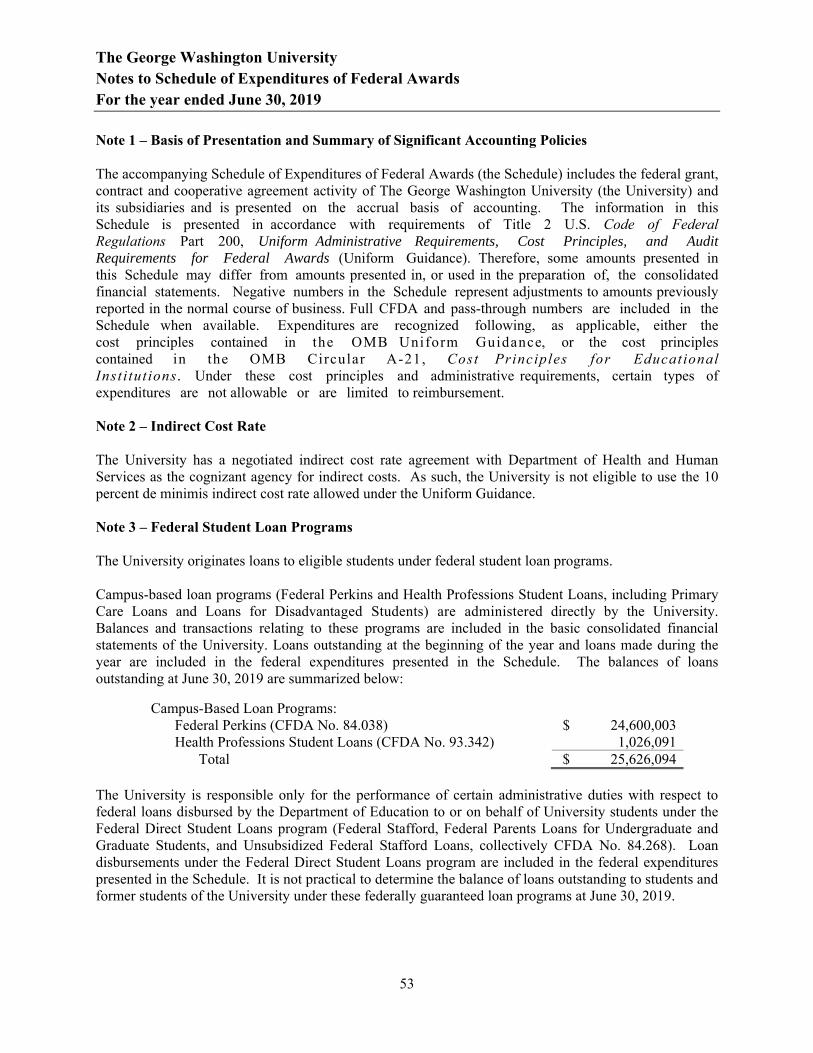
The George Washington University Notes to Schedule of Expenditures of Federal Awards For the year ended June 30, 2019
53
Note 1 – Basis of Presentation and Summary of Significant Accounting Policies
The accompanying Schedule of Expenditures of Federal Awards (the Schedule) includes the federal grant, contract and cooperative agreement activity of The George Washington University (the University) and its subsidiaries and is presented on the accrual basis of accounting. The information in this Schedule is presented in accordance with requirements of Title 2 U.S. Code of Federal Regulations Part 200, Uniform Administrative Requirements, Cost Principles, and Audit Requirements for Federal Awards (Uniform Guidance). Therefore, some amounts presented in this Schedule may differ from amounts presented in, or used in the preparation of, the consolidated financial statements. Negative numbers in the Schedule represent adjustments to amounts previously reported in the normal course of business. Full CFDA and pass-through numbers are included in the Schedule when available. Expenditures are recognized following, as applicable, either the cost principles contained in the OMB Uniform Guidance, or the cost principles contained in the OMB Circular A-21, Cost Principles for Educational Insti tutions . Under these cost principles and administrative requirements, certain types of expenditures are not allowable or are limited to reimbursement.
Note 2 – Indirect Cost Rate
The University has a negotiated indirect cost rate agreement with Department of Health and Human Services as the cognizant agency for indirect costs. As such, the University is not eligible to use the 10 percent de minimis indirect cost rate allowed under the Uniform Guidance.
Note 3 – Federal Student Loan Programs
The University originates loans to eligible students under federal student loan programs.
Campus-based loan programs (Federal Perkins and Health Professions Student Loans, including Primary Care Loans and Loans for Disadvantaged Students) are administered directly by the University. Balances and transactions relating to these programs are included in the basic consolidated financial statements of the University. Loans outstanding at the beginning of the year and loans made during the year are included in the federal expenditures presented in the Schedule. The balances of loans outstanding at June 30, 2019 are summarized below:
Campus-Based Loan Programs: Federal Perkins (CFDA No. 84.038) $ 24,600,003 Health Professions Student Loans (CFDA No. 93.342) 1,026,091
Total $ 25,626,094
The University is responsible only for the performance of certain administrative duties with respect to federal loans disbursed by the Department of Education to or on behalf of University students under the Federal Direct Student Loans program (Federal Stafford, Federal Parents Loans for Undergraduate and Graduate Students, and Unsubsidized Federal Stafford Loans, collectively CFDA No. 84.268). Loan disbursements under the Federal Direct Student Loans program are included in the federal expenditures presented in the Schedule. It is not practical to determine the balance of loans outstanding to students and former students of the University under these federally guaranteed loan programs at June 30, 2019.
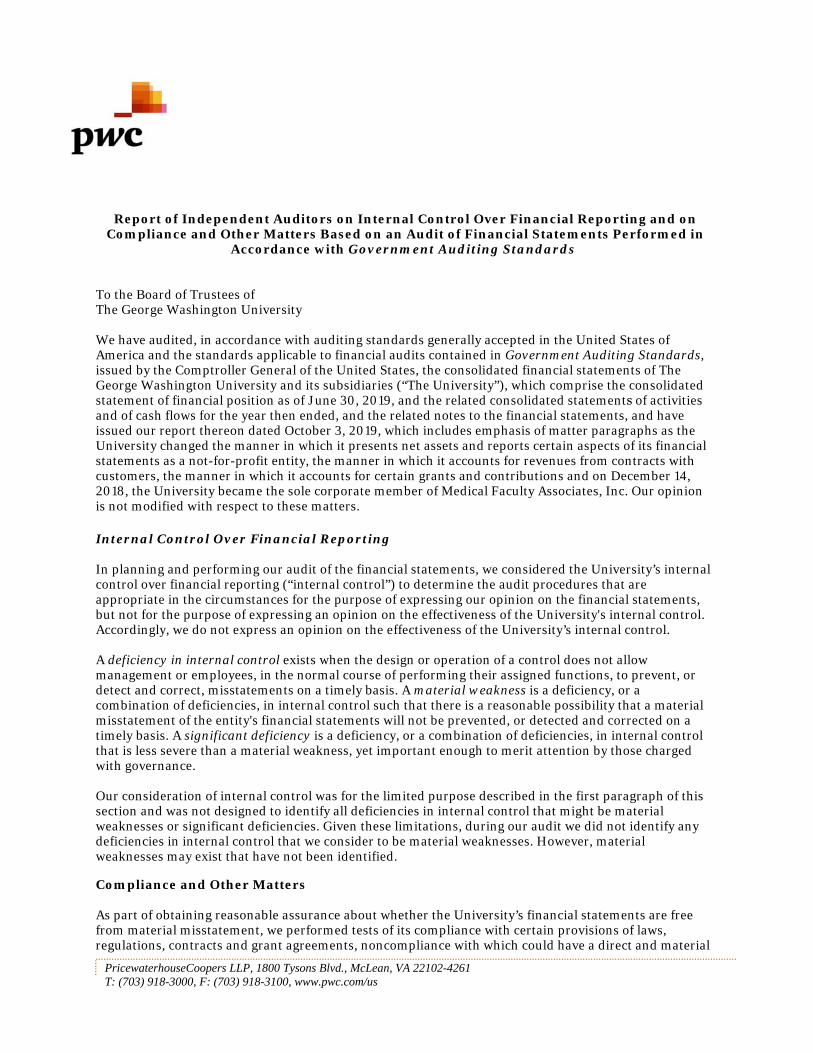
PricewaterhouseCoopers LLP, 1800 Tysons Blvd., McLean, VA 22102-4261 T: (703) 918-3000, F: (703) 918-3100, www.pwc.com/us
Report of Independent Auditors on Internal Control Over Financial Reporting and on Compliance and Other Matters Based on an Audit of Financial Statements Performed in
Accordance with Government Auditing Standards
To the Board of Trustees of The George Washington University
We have audited, in accordance with auditing standards generally accepted in the United States of America and the standards applicable to financial audits contained in Government Auditing Standards, issued by the Comptroller General of the United States, the consolidated financial statements of The George Washington University and its subsidiaries (“The University”), which comprise the consolidated statement of financial position as of June 30, 2019, and the related consolidated statements of activities and of cash flows for the year then ended, and the related notes to the financial statements, and have issued our report thereon dated October 3, 2019, which includes emphasis of matter paragraphs as the University changed the manner in which it presents net assets and reports certain aspects of its financial statements as a not-for-profit entity, the manner in which it accounts for revenues from contracts with customers, the manner in which it accounts for certain grants and contributions and on December 14, 2018, the University became the sole corporate member of Medical Faculty Associates, Inc. Our opinion is not modified with respect to these matters.
Internal Control Over Financial Reporting
In planning and performing our audit of the financial statements, we considered the University’s internal control over financial reporting (“internal control”) to determine the audit procedures that are appropriate in the circumstances for the purpose of expressing our opinion on the financial statements, but not for the purpose of expressing an opinion on the effectiveness of the University's internal control. Accordingly, we do not express an opinion on the effectiveness of the University’s internal control.
A deficiency in internal control exists when the design or operation of a control does not allow management or employees, in the normal course of performing their assigned functions, to prevent, or detect and correct, misstatements on a timely basis. A material weakness is a deficiency, or a combination of deficiencies, in internal control such that there is a reasonable possibility that a material misstatement of the entity's financial statements will not be prevented, or detected and corrected on a timely basis. A significant deficiency is a deficiency, or a combination of deficiencies, in internal control that is less severe than a material weakness, yet important enough to merit attention by those charged with governance.
Our consideration of internal control was for the limited purpose described in the first paragraph of this section and was not designed to identify all deficiencies in internal control that might be material weaknesses or significant deficiencies. Given these limitations, during our audit we did not identify any deficiencies in internal control that we consider to be material weaknesses. However, material weaknesses may exist that have not been identified.
Compliance and Other Matters
As part of obtaining reasonable assurance about whether the University’s financial statements are free from material misstatement, we performed tests of its compliance with certain provisions of laws, regulations, contracts and grant agreements, noncompliance with which could have a direct and material
55
effect on the determination of financial statement amounts. However, providing an opinion on compliance with those provisions was not an objective of our audit, and accordingly, we do not express such an opinion. The results of our tests disclosed no instances of noncompliance or other matters that are required to be reported under Government Auditing Standards.
Purpose of this Report
The purpose of this report is solely to describe the scope of our testing of internal control and compliance and the results of that testing, and not to provide an opinion on the effectiveness of the entity’s internal control or on compliance. This report is an integral part of an audit performed in accordance with Government Auditing Standards in considering the entity’s internal control and compliance. Accordingly, this communication is not suitable for any other purpose.
McLean, Virginia October 3, 2019
PricewaterhouseCoopers LLP, 1800 Tysons Blvd., McLean, VA 22102-4261 T: (703) 918-3000, F: (703) 918-3100, www.pwc.com/us
Report of Independent Auditors on Compliance with Requirements That Could Have a Direct and Material Effect on Each Major Program and on Internal
Control Over Compliance in Accordance with the Uniform Guidance
To the Board of Trustees of The George Washington University
Report on Compliance for Each Major Federal Program
We have audited The George Washington University’s (“the University’s”) compliance with the types of compliance requirements described in the OMB Compliance Supplement that could have a direct and material effect on each of the University’s major federal programs for the year ended June 30, 2019. The University’s major federal programs are identified in the summary of auditor's results section of the accompanying schedule of findings and questioned costs.
Management’s Responsibility
Management is responsible for compliance with federal statutes, regulations and the terms and conditions of its federal awards applicable to its federal programs.
Auditors’ Responsibility
Our responsibility is to express an opinion on compliance for each of the University’s major federal programs based on our audit of the types of compliance requirements referred to above. We conducted our audit of compliance in accordance with auditing standards generally accepted in the United States of America; the standards applicable to financial audits contained in Government Auditing Standards, issued by the Comptroller General of the United States; and the audit requirements of Title 2 U.S. Code of Federal Regulations Part 200, Uniform Administrative Requirements, Cost Principles, and Audit Requirements for Federal Awards (Uniform Guidance). Those standards and the Uniform Guidance require that we plan and perform the audit to obtain reasonable assurance about whether noncompliance with the types of compliance requirements referred to above that could have a direct and material effect on a major federal program occurred. An audit includes examining, on a test basis, evidence about the University’s compliance with those requirements and performing such other procedures as we considered necessary in the circumstances.
We believe that our audit provides a reasonable basis for our opinion on compliance for each major federal program. However, our audit does not provide a legal determination of the University’s compliance.
Opinion on Each Major Federal Program
In our opinion, the University complied, in all material respects, with the types of compliance requirements referred to above that could have a direct and material effect on each of its major federal programs for the year ended June 30, 2019.
57
Other Matters
As indicated in Part I to the accompanying Schedule of Findings and Questioned Costs, we have audited the Student Financial Assistance cluster as a major program. Also, as indicated in the first paragraph of this report, we performed our audit of compliance using the compliance requirements contained in the OMB Compliance Supplement, including those contained in Part V 5.3, Compliance Requirement N, Special Tests and Provisions, Section 10 “Gramm-Leach-Bliley Act-Student Information Security.” This section includes three suggested audit procedures with respect to verification that the institution (1) designated an individual to coordinate the information security program, (2) performed a risk assessment that addresses the three required areas in 16 CFR 314.4(b), and (3) documented a safeguard for each risk identified. Our procedures in relation to these three items were limited to inquiry of and obtaining written representation from management and obtaining and reading management’s documentation related to these three items. Our procedures did not include an analysis of the adequacy or completeness of the risk assessment performed or the safeguards for each risk identified by management.
Report on Internal Control Over Compliance
Management of the University is responsible for establishing and maintaining effective internal control over compliance with the types of compliance requirements referred to above. In planning and performing our audit of compliance, we considered the University’s internal control over compliance with the types of requirements that could have a direct and material effect on each major federal program to determine the auditing procedures that are appropriate in the circumstances for the purpose of expressing an opinion on compliance for each major federal program and to test and report on internal control over compliance in accordance with the Uniform Guidance, but not for the purpose of expressing an opinion on the effectiveness of internal control over compliance. Accordingly, we do not express an opinion on the effectiveness of the University’s internal control over compliance.
A deficiency in internal control over compliance exists when the design or operation of a control over compliance does not allow management or employees, in the normal course of performing their assigned functions, to prevent, or detect and correct, noncompliance with a type of compliance requirement of a federal program on a timely basis. A material weakness in internal control over compliance is a deficiency, or combination of deficiencies, in internal control over compliance, such that there is a reasonable possibility that material noncompliance with a type of compliance requirement of a federal program will not be prevented, or detected and corrected, on a timely basis. A significant deficiency in internal control over compliance is a deficiency, or a combination of deficiencies, in internal control over compliance with a type of compliance requirement of a federal program that is less severe than a material weakness in internal control over compliance, yet important enough to merit attention by those charged with governance.
Our consideration of internal control over compliance was for the limited purpose described in the first paragraph of this section and was not designed to identify all deficiencies in internal control over compliance that might be material weaknesses or significant deficiencies. We did not identify any deficiencies in internal control over compliance that we consider to be material weaknesses. However, material weaknesses may exist that have not been identified.
58
The purpose of this report on internal control over compliance is solely to describe the scope of our testing of internal control over compliance and the results of that testing based on the requirements of the Uniform Guidance. Accordingly, this report is not suitable for any other purpose.
McLean, Virginia December 5, 2019

Schedule of Findings and Questioned Costs
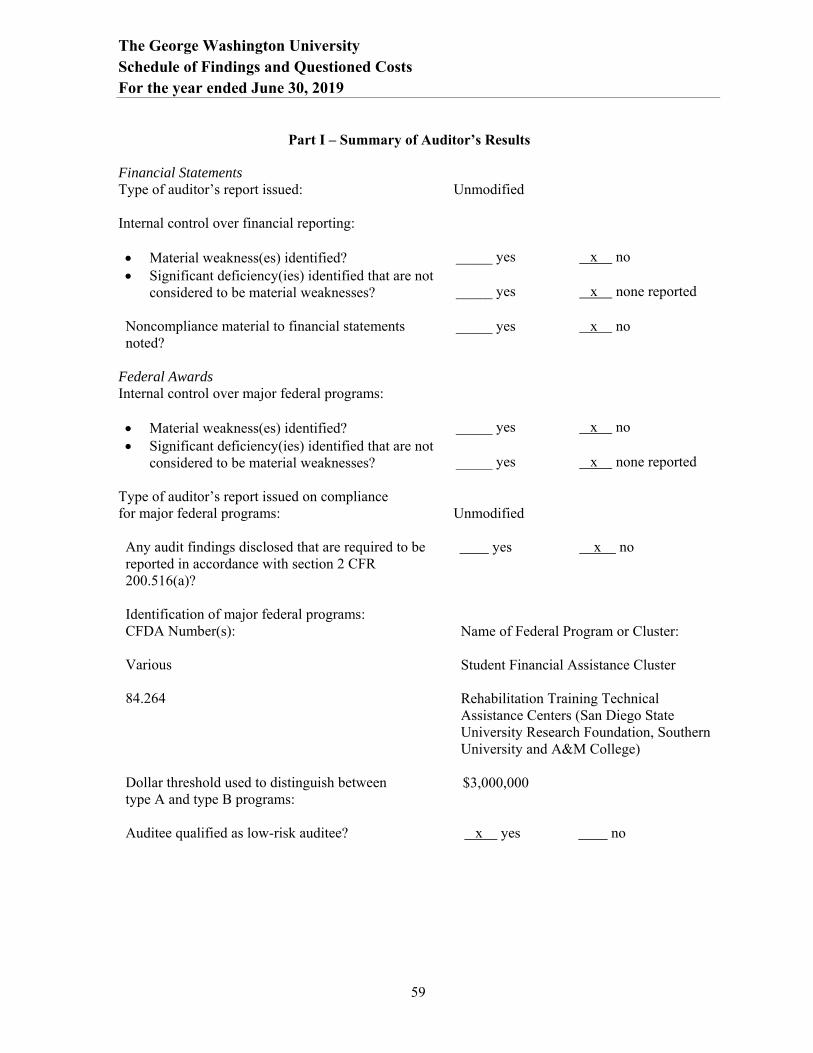
The George Washington University Schedule of Findings and Questioned Costs For the year ended June 30, 2019
59
Part I – Summary of Auditor’s Results
Financial Statements Type of auditor’s report issued: Unmodified
Internal control over financial reporting:
Material weakness(es) identified? _____ yes x no Significant deficiency(ies) identified that are not
considered to be material weaknesses? _____ yes x none reported
Noncompliance material to financial statements noted?
_____ yes x no
Federal Awards Internal control over major federal programs:
Material weakness(es) identified? _____ yes x no Significant deficiency(ies) identified that are not
considered to be material weaknesses? _____ yes x none reported
Type of auditor’s report issued on compliance for major federal programs: Unmodified
Any audit findings disclosed that are required to be reported in accordance with section 2 CFR 200.516(a)?
yes x no
Identification of major federal programs: CFDA Number(s):
Various
84.264
Dollar threshold used to distinguish between type A and type B programs:
Name of Federal Program or Cluster:
Student Financial Assistance Cluster
Rehabilitation Training Technical Assistance Centers (San Diego State University Research Foundation, Southern University and A&M College)
$3,000,000
Auditee qualified as low-risk auditee? x yes no

The George Washington University Schedule of Findings and Questioned Costs For the year ended June 30, 2019
60
Part II- Financial Statement Findings
There are no matters to be reported.
Part III- Federal Award Findings and Questioned Costs
There are no matters to be reported.

Summary Schedule of Prior Audit Findings
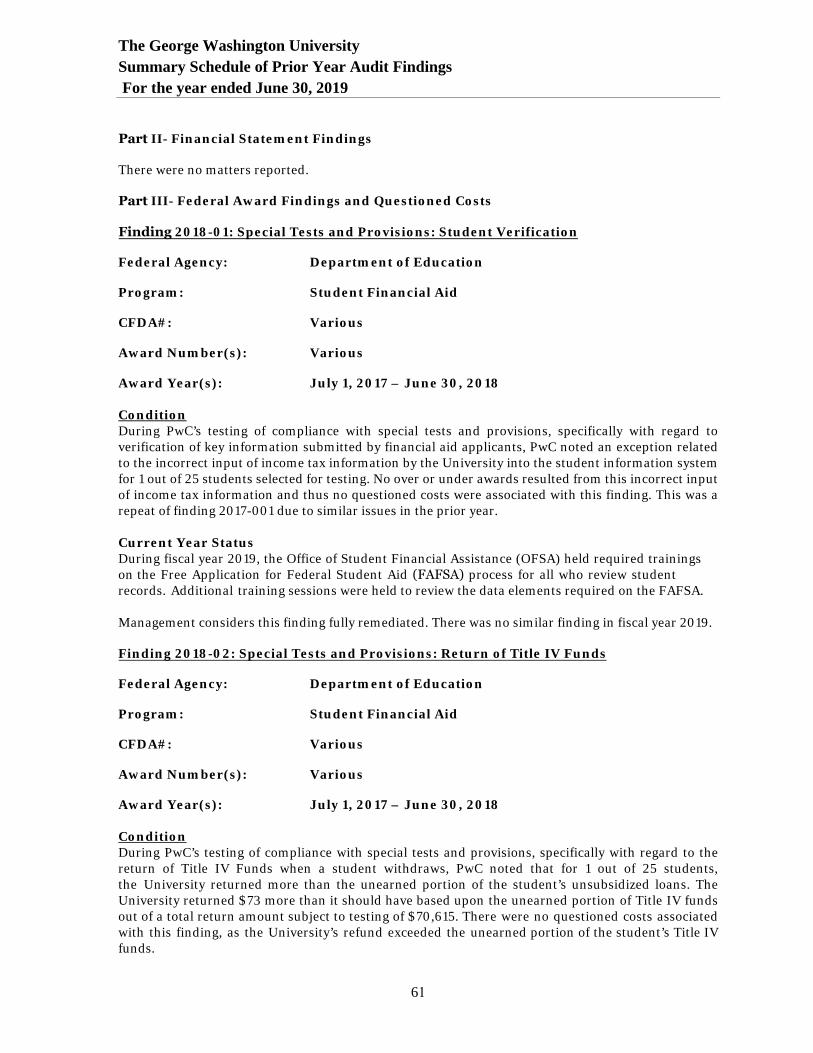
The George Washington University Summary Schedule of Prior Year Audit Findings For the year ended June 30, 2019
61
Part II- Financial Statement Findings
There were no matters reported.
Part III- Federal Award Findings and Questioned Costs
Finding 2018-01: Special Tests and Provisions: Student Verification
Federal Agency: Department of Education
Program: Student Financial Aid
CFDA#: Various
Award Number(s): Various
Award Year(s): July 1, 2017 – June 30, 2018
Condition During PwC’s testing of compliance with special tests and provisions, specifically with regard to verification of key information submitted by financial aid applicants, PwC noted an exception related to the incorrect input of income tax information by the University into the student information system for 1 out of 25 students selected for testing. No over or under awards resulted from this incorrect input of income tax information and thus no questioned costs were associated with this finding. This was a repeat of finding 2017-001 due to similar issues in the prior year.
Current Year Status During fiscal year 2019, the Office of Student Financial Assistance (OFSA) held required trainings on the Free Application for Federal Student Aid (FAFSA) process for all who review student records. Additional training sessions were held to review the data elements required on the FAFSA.
Management considers this finding fully remediated. There was no similar finding in fiscal year 2019.
Finding 2018-02: Special Tests and Provisions: Return of Title IV Funds
Federal Agency: Department of Education
Program: Student Financial Aid
CFDA#: Various
Award Number(s): Various
Award Year(s): July 1, 2017 – June 30, 2018
Condition During PwC’s testing of compliance with special tests and provisions, specifically with regard to the return of Title IV Funds when a student withdraws, PwC noted that for 1 out of 25 students, the University returned more than the unearned portion of the student’s unsubsidized loans. The University returned $73 more than it should have based upon the unearned portion of Title IV funds out of a total return amount subject to testing of $70,615. There were no questioned costs associated with this finding, as the University’s refund exceeded the unearned portion of the student’s Title IV funds.
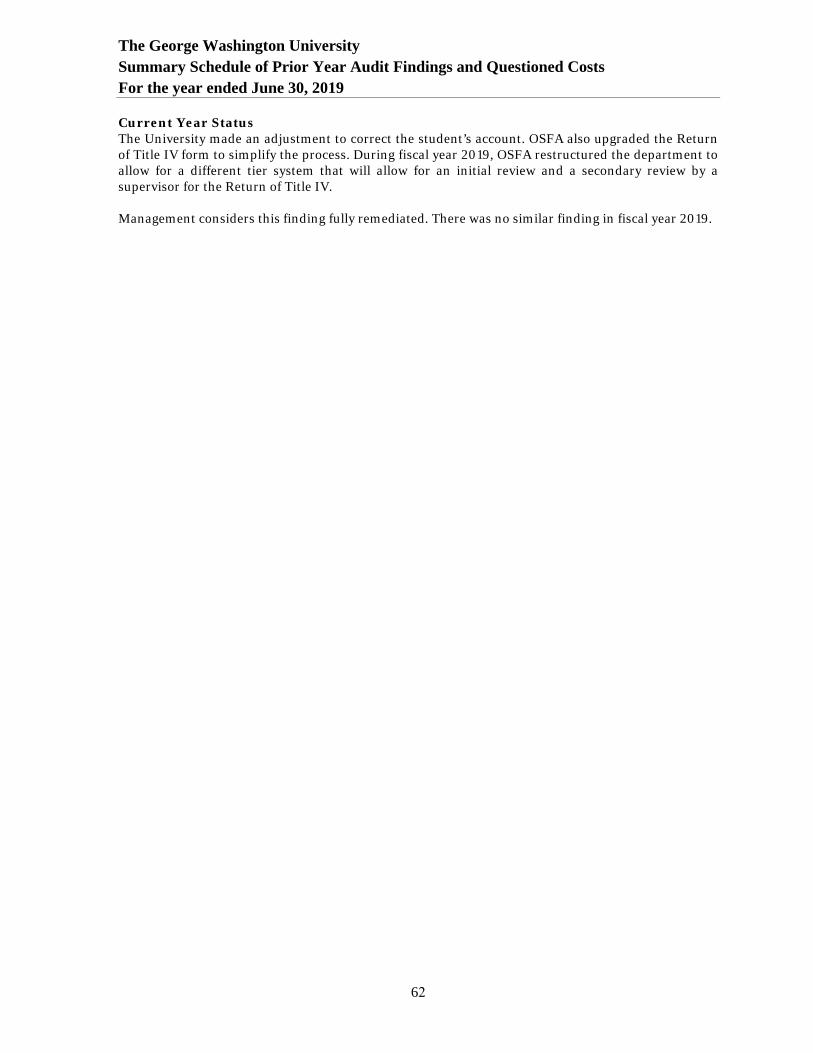
The George Washington University Summary Schedule of Prior Year Audit Findings and Questioned Costs For the year ended June 30, 2019
62
Current Year Status The University made an adjustment to correct the student’s account. OSFA also upgraded the Return of Title IV form to simplify the process. During fiscal year 2019, OSFA restructured the department to allow for a different tier system that will allow for an initial review and a secondary review by a supervisor for the Return of Title IV.
Management considers this finding fully remediated. There was no similar finding in fiscal year 2019.