Embed Size (px)
Citation preview

The Glass Ceiling: A Study The Glass Ceiling: A Study on Annual Salarieson Annual Salaries
Group 4Group 4Julie Shan, Brian Abe, Yu-Ting Cheng, Kathinka Tysnes, Huan Julie Shan, Brian Abe, Yu-Ting Cheng, Kathinka Tysnes, Huan Zhang, Andrew BoothZhang, Andrew Booth

AgendaAgenda
IntroductionIntroduction Exploratory AnalysisExploratory Analysis Linear Regression & AnalysisLinear Regression & Analysis ConclusionConclusion Further AnalysisFurther Analysis

IntroductionIntroduction
What?What? A sample of 1980’s managers A sample of 1980’s managers
salariessalaries Why?Why?
To determine factors that affect To determine factors that affect the salarythe salary
How?How? Linear regressionLinear regression

IntroductionIntroduction
Data Set AnalyzedData Set Analyzed A subsample of a large data set (from the A subsample of a large data set (from the
early 1980s) from a study investigating early 1980s) from a study investigating potential gender bias in determination of potential gender bias in determination of professional salary differentials. The professional salary differentials. The individuals come from several large individuals come from several large corporations. corporations.
Data was organized byData was organized by Management LevelManagement Level GenderGender Education LevelEducation Level Years in JobYears in Job SalarySalary

Exploratory AnalysisExploratory Analysis

Exploratory AnalysisExploratory Analysis
Affects of the independent Affects of the independent variables on the dependent variables on the dependent variable SALARY.variable SALARY.
Independent Variables:Independent Variables: Years in jobYears in job Management levelManagement level Education levelEducation level GenderGender

Exploratory AnalysisExploratory Analysis
Positive Positive Relationship Relationship Between Years Between Years in Job and in Job and SalarySalary
10000
15000
20000
25000
30000
0 4 8 12 16 20 24
YEARS
SA
LAR
Y
Salary vs. Years in Job

Exploratory AnalysisExploratory Analysis
Upper Upper Management Management Earns More Earns More Than Lower Than Lower ManagementManagement
10000
15000
20000
25000
30000
-0.2 0.0 0.2 0.4 0.6 0.8 1.0 1.2
MANAGEMENT
SA
LAR
Y
Salary vs. Management Level

Exploratory AnalysisExploratory Analysis
More More Educated Educated Managers Managers Earn MoreEarn More
Outliers May Outliers May Skew Skew Regression Regression ResultsResults
10000
15000
20000
25000
30000
0 1 2 3 4
EDUCATION
SA
LAR
Y
Salary vs. Education Level

Exploratory AnalysisExploratory Analysis
Female=0 if Female=0 if MaleMale
Female=1 if Female=1 if FemaleFemale
Note: Many Note: Many More Males More Males than Females than Females in Data Setin Data Set
Females Females Seem to have Seem to have Cap, Lower Cap, Lower Max SalaryMax Salary
10000
15000
20000
25000
30000
-0.2 0.0 0.2 0.4 0.6 0.8 1.0 1.2
FEMALE
SA
LAR
Y
Salary vs. Female

Exploratory AnalysisExploratory Analysis
New Variable: Female_managementNew Variable: Female_management 1 and 2 correspond to men and women in lower management 1 and 2 correspond to men and women in lower management
respectivelyrespectively 3 and 4 correspond to men and women in upper management 3 and 4 correspond to men and women in upper management
respectivelyrespectively
Again, females earn less, have a cap on salaryAgain, females earn less, have a cap on salary
10000
15000
20000
25000
30000
0 1 2 3 4 5
FEMALE_MANAGEMENT
SALA
RY
Salary vs. Female_Management
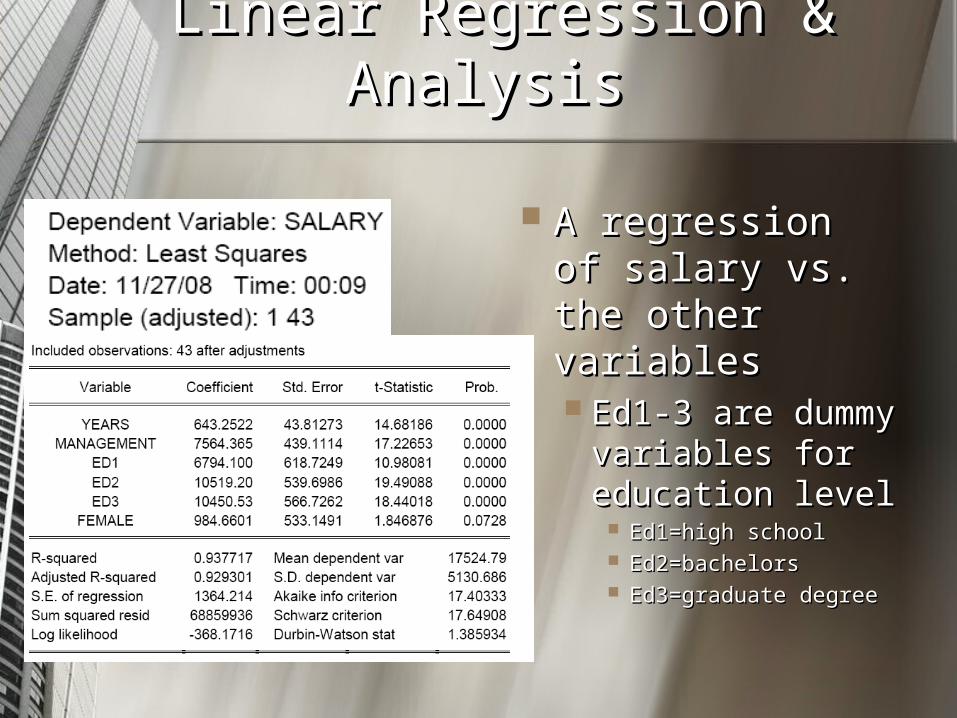
Linear Regression & Analysis Linear Regression & Analysis
A regression of A regression of salary vs. the salary vs. the other variablesother variables Ed1-3 are Ed1-3 are
dummy dummy variables for variables for education leveleducation level
Ed1=high schoolEd1=high school Ed2=bachelorsEd2=bachelors Ed3=graduate Ed3=graduate
degreedegree

Linear Regression & Analysis Linear Regression & Analysis
All variables, except female, are All variables, except female, are significant at a 5% level.significant at a 5% level.
RR22 = 0.94, so it is a good fit = 0.94, so it is a good fit The Durbin-Watson is less than The Durbin-Watson is less than
2 but greater than 1.2 but greater than 1.

Linear Regression & Analysis Linear Regression & Analysis
Jarque-Bera statistic is greater than Jarque-Bera statistic is greater than 0.05, indicating normality of the 0.05, indicating normality of the residualsresiduals
0
2
4
6
8
10
-2000 -1000 0 1000 2000 3000
Series: ResidualsSample 1 43Observations 43
Mean -1.45e-12Median 6.465925Maximum 3085.931Minimum -2363.230Std. Dev. 1280.438Skewness 0.299525Kurtosis 2.570329
Jarque-Bera 0.973732Probability 0.614549
Histogram of Residuals
Linear Regression & Analysis Linear Regression & Analysis
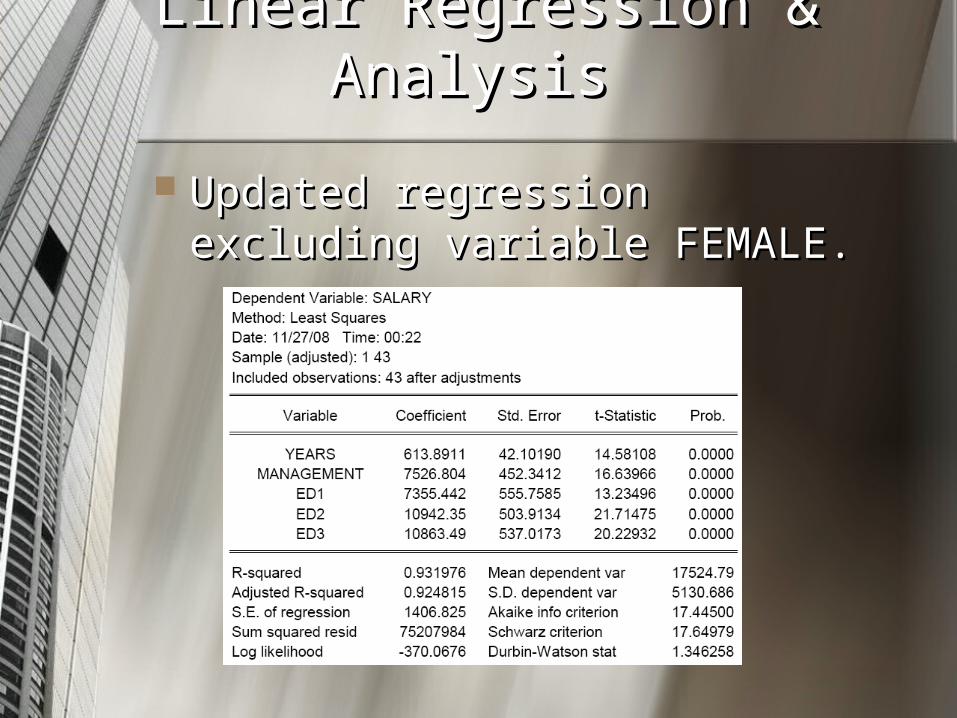
Updated regression excluding Updated regression excluding variable FEMALE.variable FEMALE.

Linear Regression & Analysis Linear Regression & Analysis
RR22 = 0.93: still a good fit. = 0.93: still a good fit. The Durbin-Watson statistic is The Durbin-Watson statistic is
once again less than 2 but once again less than 2 but greater than 1greater than 1

Linear Regression & Analysis Linear Regression & Analysis
Jarque-Bera statistic is greater than Jarque-Bera statistic is greater than 0.05, indicating normality of the 0.05, indicating normality of the residualsresiduals
0
1
2
3
4
5
6
7
8
-3000 -2000 -1000 0 1000 2000 3000
Series: ResidualsSample 1 43Observations 43
Mean -2.44e-12Median -148.6636Maximum 2850.258Minimum -2681.484Std. Dev. 1338.158Skewness 0.193549Kurtosis 2.286455
Jarque-Bera 1.180694Probability 0.554135
Histogram of Residuals

Linear Regression & Analysis Linear Regression & Analysis
Wald Test for equivalency of Wald Test for equivalency of intercepts for various education intercepts for various education levelslevels
HHo o : ED2=ED3: ED2=ED3 HHo o : ED1=ED2: ED1=ED2

Linear Regression & Analysis Linear Regression & Analysis
Final Model:Final Model:SALARY = 615.0378*YEARS + SALARY = 615.0378*YEARS +
7509.9807*MANAGEMENT + 7509.9807*MANAGEMENT +
7352.3861*ED1 + 7352.3861*ED1 +
10907.4441*ED2310907.4441*ED23

Linear Regression & Analysis Linear Regression & Analysis

ConclusionConclusion The variable FEMALE was not statistically The variable FEMALE was not statistically
significant.significant. No gender bias at a 5% significance level.No gender bias at a 5% significance level. There is gender bias at a 10% significance level.There is gender bias at a 10% significance level.
Other variables played important role in Other variables played important role in determining salary:determining salary: The number of years worked in a job add to salary level.The number of years worked in a job add to salary level. The higher one’s education level the higher the salary level.The higher one’s education level the higher the salary level. Upper management has higher salaries than lower Upper management has higher salaries than lower
management.management.

Further AnalysisFurther Analysis
Newer, Larger Data SetNewer, Larger Data Set Allows Removal of OutliersAllows Removal of Outliers
Additional Independent Variables:Additional Independent Variables: Company SizeCompany Size IndustryIndustry Age of CompanyAge of Company
More in Depth Analysis of Potential for More in Depth Analysis of Potential for Gender Bias (At 10% it was Gender Bias (At 10% it was Significant)Significant)

FinFin Any Questions?Any Questions?