Embed Size (px)
Citation preview
The Global Financial Crisis is far from over...
Steve KeenUniversity of Western Sydney
Debunking Economicswww.debtdeflation.com/blogs
www.debunkingeconomics.com
0 1 2 3 4 5 6 7 8 9 10 11 12 1325
20
15
10
5
0
5
10
15
20
25
Great Depressionincluding GovernmentGreat Recessionincluding Government
Debt-financed demand percent of aggregate demand
Years since peak rate of growth of debt (mid-1928 & Dec. 2007 resp.)
Per
cent
0
1870 1880 1890 1900 1910 1920 1930 1940 1950 1960 1970 1980 1990 2000 2010 20200
25
50
75
100
125
150
175
200
225
250
275
300
USAAustralia
Private debt to GDP ratios
Flow of Funds Table L1+Census Data; RBA Table D02
Yea
rs (
per
cent
of
GD
P)

The New Macroeconomic Puzzle• How did we go from this…
70 72 74 76 78 80 82 84 86 88 90 92 94 96 98 100 102 104 106 108 1102
0
2
4
6
8
10
12
14
16
InflationUnemploymentU-6 Measure
US Inflation and Unemployment since 1970
Year
Per
cent
70 72 74 76 78 80 82 84 86 88 90 92 94 96 98 100 102 104 106 108 1102
0
2
4
6
8
10
12
14
16
InflationUnemploymentU-6 Measure
US Inflation and Unemployment since 1970
Year
Per
cent
0 10 20 30 40 50 60 70 80 90 100 1105
0
5
10
15
InflationUnemployment
Great Moderation to Great Recession
Year
Per
cen
t p.a
.
0
• To this?• A Minskian explanation: debt-deflation

First Principles• Debt has macroeconomic impact; contra Bernanke:
– “Fisher’s idea was less influential in academic circles, though, because of the counterargument that debt-deflation represented no more than a redistribution from one group (debtors) to another (creditors).” (Bernanke 2000, p. 24)
• Minority of economists who predicted crisis displayed:– “a further concern, that growth in financial wealth
and the attendant growth in debt can become a determinant (instead of an outcome) of economic growth …” (Bezemer (2009, p. 10))
• Basic mechanisms:– Debt expands aggregate demand– Endogenous money creation– Financial instability

Rising debt increases aggregate demand
• Schumpeter: growing debt adds demand beyond that generated by sales of goods & services
• Debt essential for entrepreneurial function– Entrepreneur often has idea but no money– Needs purchasing power before has goods to sell– Gets purchasing power via loan from bank– Entrepreneurial demand thus not financed by
“circular flow of commodities” but by new bank credit– Since entrepreneurial activities essential feature of
growing economy, in real life “total credit must be greater than it could be if there were only fully covered credit. The credit structure projects not only beyond the existing gold basis, but also beyond the existing commodity basis.” (Schumpeter 1934, p. 101)
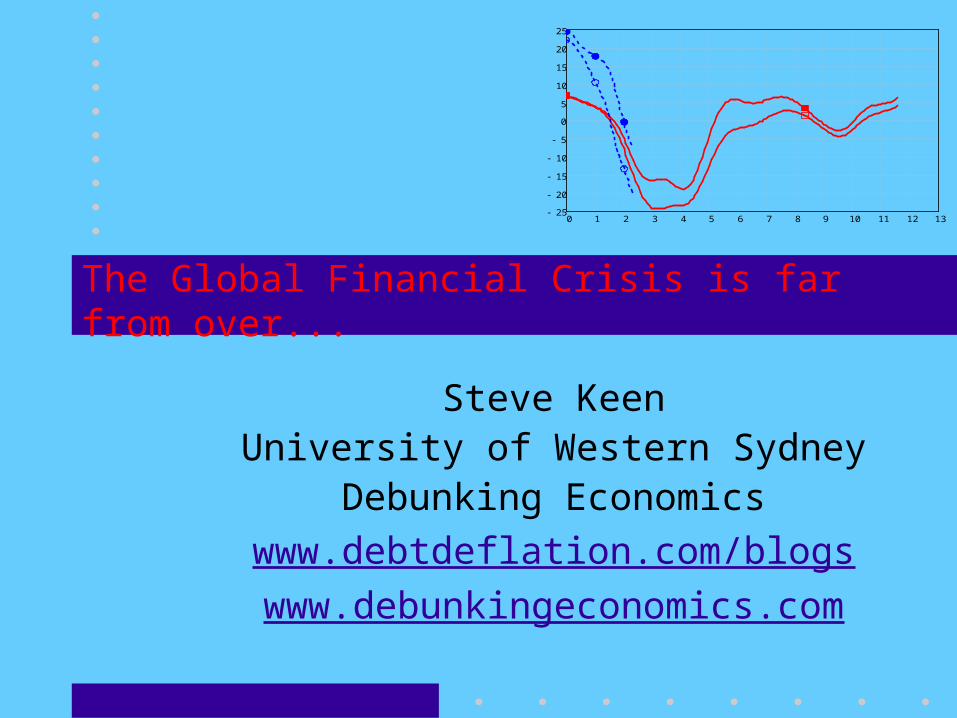
Endogenous money: “Loans create deposits”
• “In the real world banks extend credit, creating deposits in the process, and look for the reserves later” (Moore (1979, p. 539)—quoting Fed economist)
• “There is no evidence that … the monetary base … leads the cycle, although some economists still believe this monetary myth…, if anything, the monetary base lags the cycle slightly…
– The difference of M2-M1 leads the cycle by even more than M2 with the lead being about three quarters." (Kydland & Prescott, 1990, p. 14)

Financial instability
• “Stable growth is inconsistent with the manner in which investment is determined in an economy in which debt-financed ownership of capital assets exists, and the extent to which such debt financing can be carried is market determined.
• It follows that the fundamental instability of a capitalist economy is upward.
• The tendency to transform doing well into a speculative investment boom is the basic instability in a capitalist economy.” (Minsky 1982, p. 67)
• Current debt-assets price dual bubble biggest in history…

Rising debt increases aggregate demand• Asset bubbles & rising debt to GDP
1880 1890 1900 1910 1920 1930 1940 1950 1960 1970 1980 1990 2000 2010 20200
5
10
15
20
25
30
35
40
45
50
0
30
60
90
120
150
180
210
240
270
300
Shiller Lagging 10 Year P/E RatioCase-Shiller Real House Price IndexUS Private Debt to GDP
Asset price indices & Debt to GDP
Year
Pri
ce to
10
year
lagg
ed e
arni
ngs
ratio
Rea
l hou
se p
rice
inde
x; D
ebt t
o G
DP
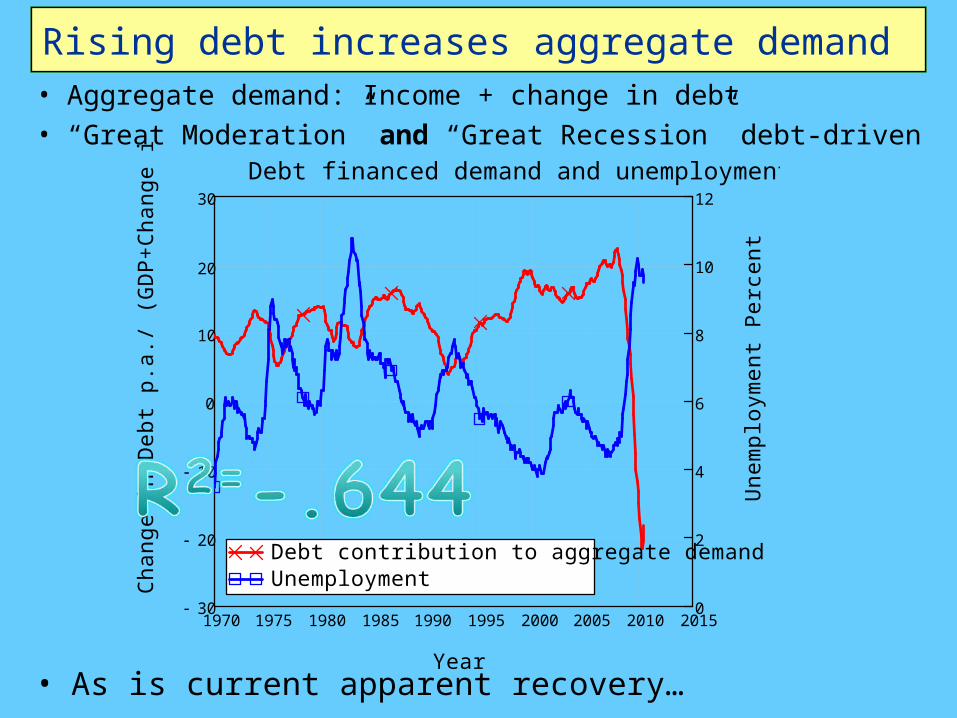
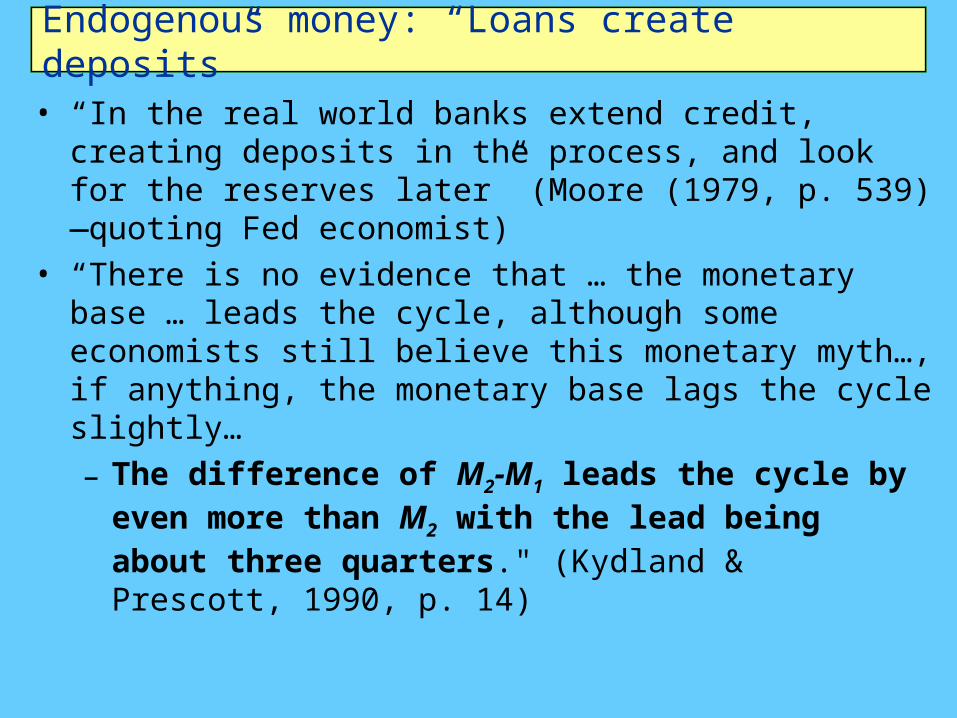
Rising debt increases aggregate demand• Aggregate demand: Income + change in debt• “Great Moderation” and “Great Recession” debt-driven
1970 1975 1980 1985 1990 1995 2000 2005 2010 201530
20
10
0
10
20
30
0
2
4
6
8
10
12
Debt contribution to aggregate demandUnemployment
Debt financed demand and unemployment
Year
Cha
nge
in D
ebt p
.a./
(GD
P+
Cha
nge
in D
ebt)
Une
mpl
oym
ent P
erce
nt
• As is current apparent recovery…

Rising debt increases aggregate demand• Change in AD: Change in GDP + acceleration in debt
1970 1975 1980 1985 1990 1995 2000 2005 2010 201530
20
10
0
10
20
30
75
50
25
0
25
50
75
Debt AccelerationChange in Unemployment
Debt financed demand and unemployment
Year
Cha
nge
in C
hang
e in
Deb
t p.a
./ G
DP
Cha
nge
in U
nem
ploy
men
t Per
cent
p.a
.
0
• Debt & disequilibrium-aware model needed to capture these processes
• Minsky’s Financial Instability Hypothesis
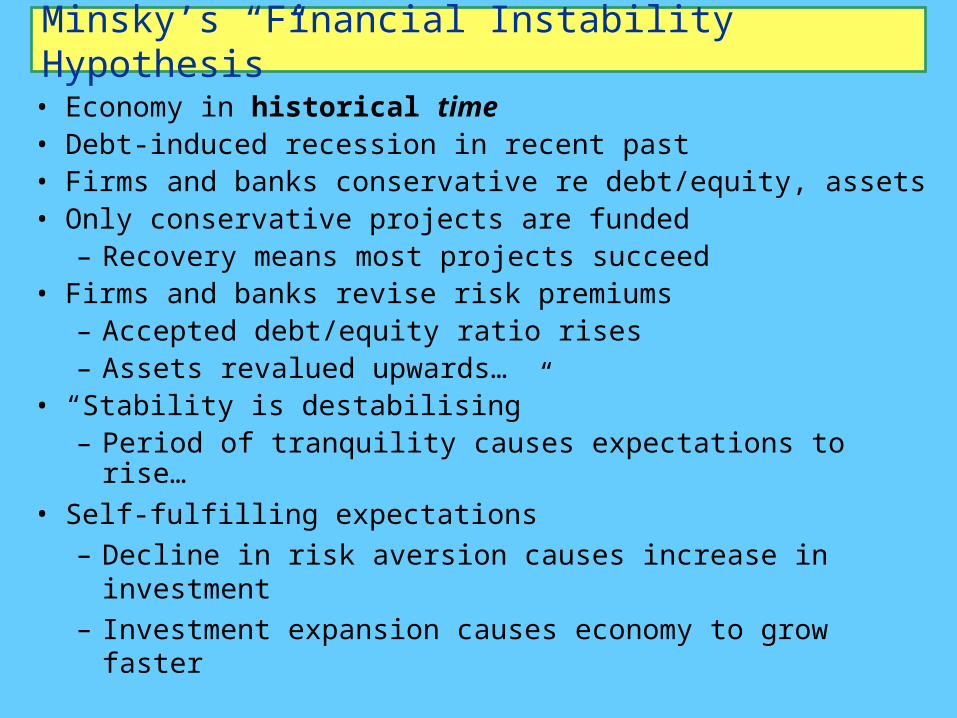
Minsky’s “Financial Instability Hypothesis”
• Economy in historical time• Debt-induced recession in recent past• Firms and banks conservative re debt/equity, assets• Only conservative projects are funded
– Recovery means most projects succeed• Firms and banks revise risk premiums
– Accepted debt/equity ratio rises– Assets revalued upwards…
• “Stability is destabilising”– Period of tranquility causes expectations to rise…
• Self-fulfilling expectations– Decline in risk aversion causes increase in
investment– Investment expansion causes economy to grow
faster

The Euphoric Economy
• Asset prices rise: speculation on assets profitable• Increased willingness to lend increases money supply
– Money supply endogenous , not under RBA control• Riskier investments enabled, asset speculation
rises• The emergence of “Ponzi” (Bond, Skase…) financiers
– Cash flow less than debt servicing costs– Profit by selling assets on rising market– Interest-rate insensitive demand for finance
• Rising debt levels & interest rates lead to crisis– Rising rates make conservative projects speculative– Non-Ponzi investors sell assets to service debts– Entry of new sellers floods asset markets– Rising trend of asset prices falters or reverses
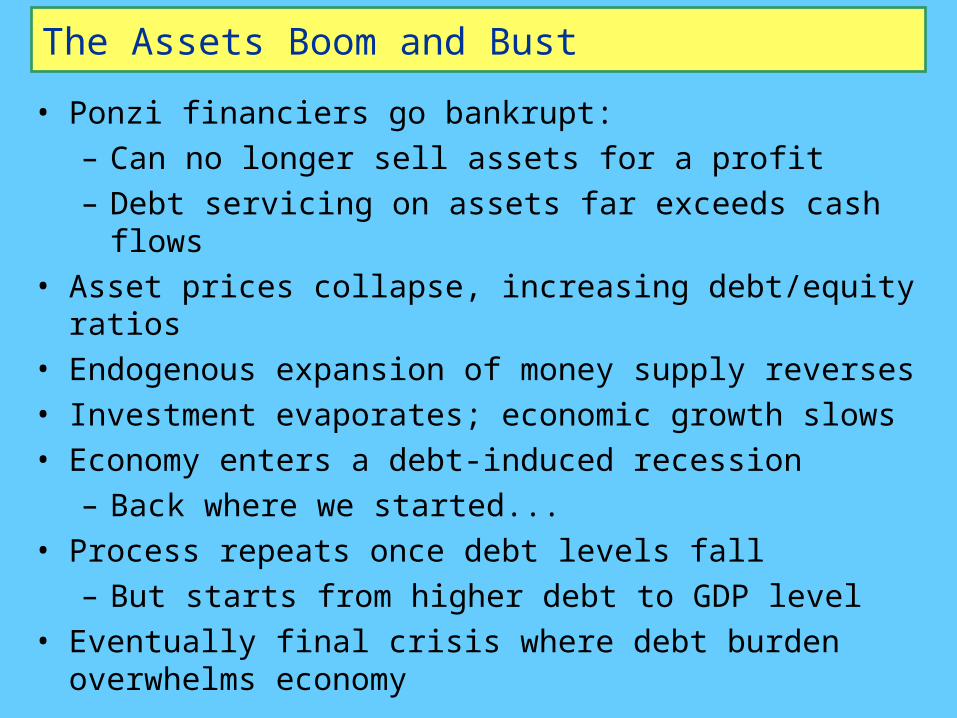
The Assets Boom and Bust
• Ponzi financiers go bankrupt:– Can no longer sell assets for a profit– Debt servicing on assets far exceeds cash flows
• Asset prices collapse, increasing debt/equity ratios• Endogenous expansion of money supply reverses• Investment evaporates; economic growth slows• Economy enters a debt-induced recession
– Back where we started...• Process repeats once debt levels fall
– But starts from higher debt to GDP level• Eventually final crisis where debt burden overwhelms
economy
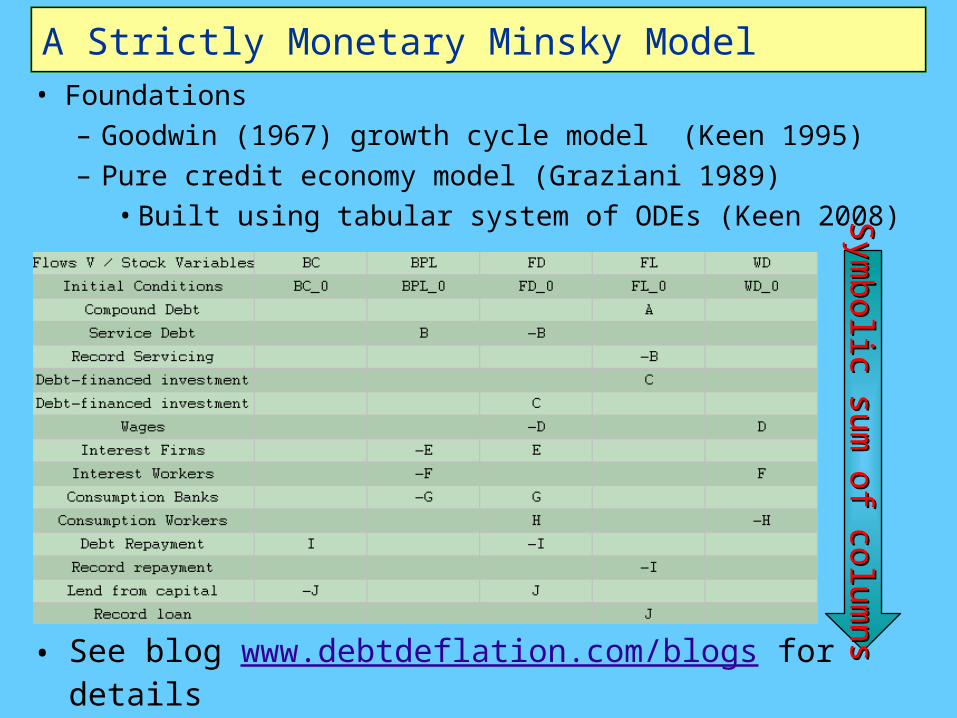
A Strictly Monetary Minsky Model• Foundations
– Goodwin (1967) growth cycle model (Keen 1995)– Pure credit economy model (Graziani 1989)
• Built using tabular system of ODEs (Keen 2008)Sym
bolic su
m o
f colu
mn
sS
ym
bolic su
m o
f colu
mn
s
• See blog www.debtdeflation.com/blogs for details• Especially Roving Cavaliers of Credit post
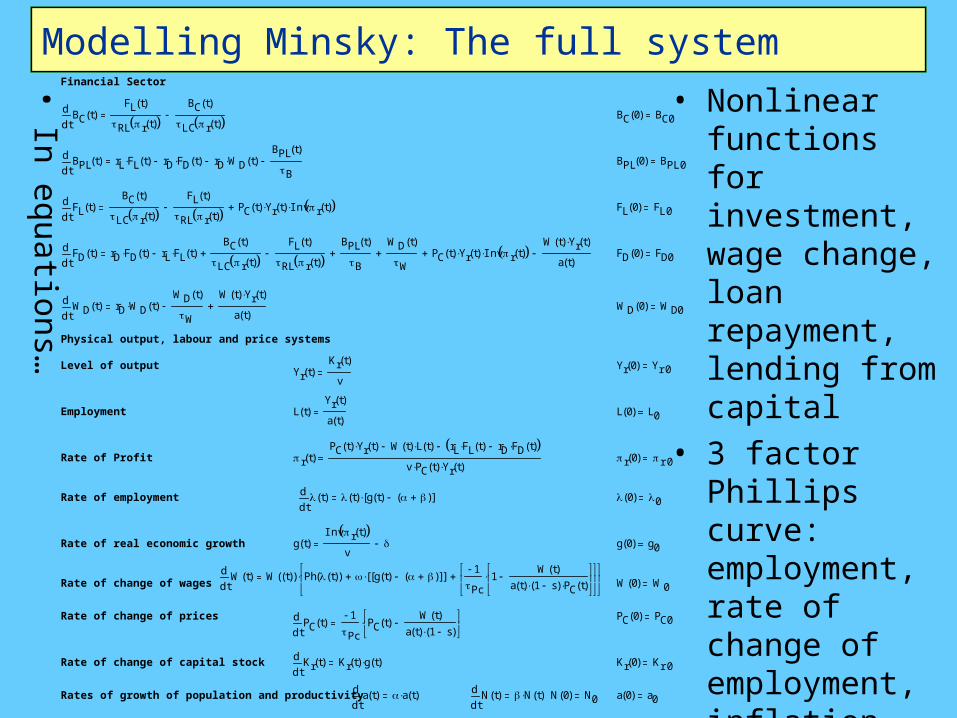
Modelling Minsky: The full system
•In
eq
uatio
ns…
Financial Sector
tBC t( )d
d
FL t( )
RL r t( ) BC t( )
LC r t( ) BC 0( ) BC0
tBPL t( )d
drL FL t( ) rD FD t( ) rD WD t( )
BPL t( )
B BPL 0( ) BPL0
tFL t( )d
d
BC t( )
LC r t( ) FL t( )
RL r t( ) PC t( ) Yr t( ) Inv r t( ) FL 0( ) FL0
tFD t( )d
drD FD t( ) rL FL t( )
BC t( )
LC r t( ) FL t( )
RL r t( ) BPL t( )
B
WD t( )
W PC t( ) Yr t( ) Inv r t( )
W t( ) Yr t( )
a t( ) FD 0( ) FD0
tWD t( )d
drD WD t( )
WD t( )
W
W t( ) Yr t( )
a t( ) WD 0( ) WD0
Physical output, labour and price systems
Level of output Yr 0( ) Yr0Yr t( )Kr t( )
v
Employment L t( )Yr t( )
a t( )L 0( ) L0
Rate of Profit r t( )PC t( ) Yr t( ) W t( ) L t( ) rL FL t( ) rD FD t( )
v PC t( ) Yr t( ) r 0( ) r0
Rate of employmentt t( )d
d t( ) g t( ) ( )[ ] 0( ) 0
Rate of real economic growth g t( )Inv r t( )
v g 0( ) g0
tW t( )d
dW t( )( ) Ph t( )( ) g t( ) ( )[ ][ ]
1Pc
1W t( )
a t( ) 1 s( ) PC t( )
Rate of change of wages W 0( ) W0
Rate of change of prices PC 0( ) PC0tPC t( )d
d
1Pc
PC t( )W t( )
a t( ) 1 s( )
Rate of change of capital stocktKr t( )d
dKr t( ) g t( ) Kr 0( ) Kr0
Rates of growth of population and productivityta t( )d
d a t( )
tN t( )d
d N t( ) N 0( ) N0 a 0( ) a0
• Nonlinear functions for investment, wage change, loan repayment, lending from capital
• 3 factor Phillips curve: employment, rate of change of employment, inflation
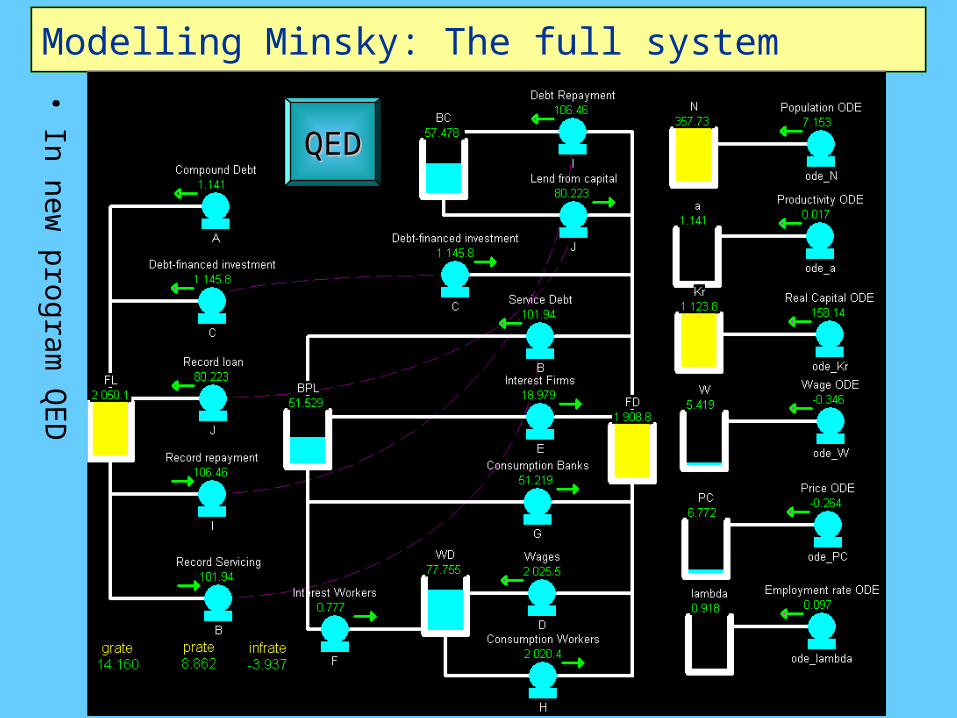
Modelling Minsky: The full system
•In
new
pro
gra
m Q
ED
QEDQED
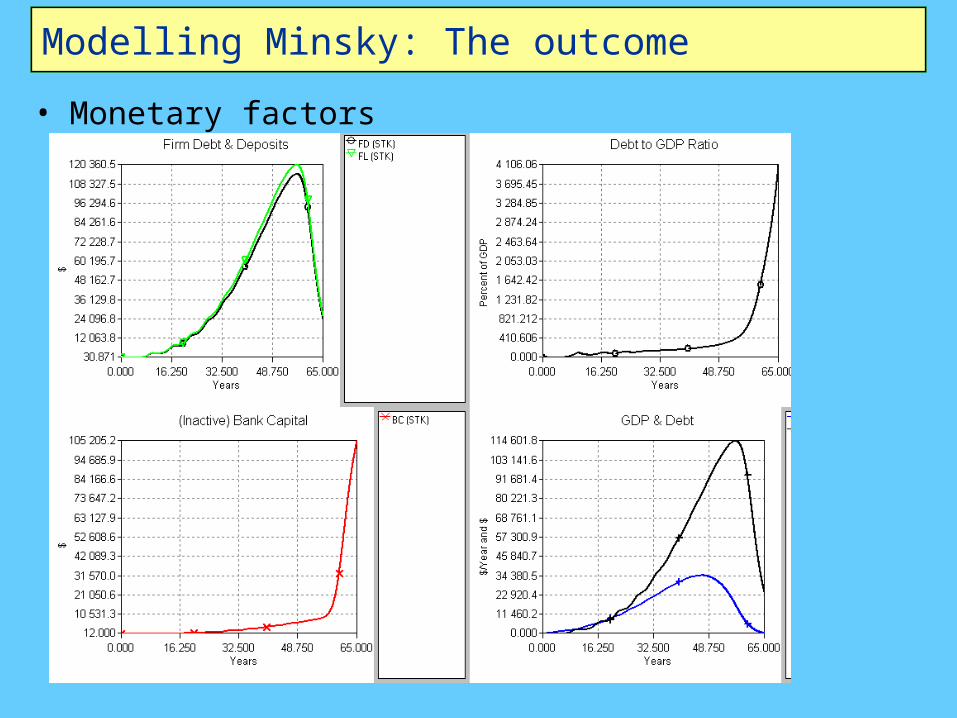
Modelling Minsky: The outcome
• Monetary factors

Modelling Minsky: The outcome
• Production, employment, wages and inflation

References• Bernanke, B. S. (2000). Essays on the Great Depression. Princeton,
Princeton University Press.• Bezemer, D. J. (2009). “No One Saw This Coming”: Understanding
Financial Crisis Through Accounting Models. Groningen, The Netherlands, Faculty of Economics University of Groningen.
• Blatt, J.M., Dynamic Economic Systems: A Post Keynesian Approach, ME Sharpe, Armonk.
• Goodwin, R. (1967). “A growth cycle” in C. H. Feinstein (ed.), Socialism, Capitalism and Economic Growth. Cambridge, Cambridge University Press: 54-58.
• Graziani, A. (1989). "The Theory of the Monetary Circuit." Thames Papers in Political Economy Spring: 1-26.
• Keen, S. (1995). "Finance and Economic Breakdown: Modeling Minsky's 'Financial Instability Hypothesis.'." Journal of Post Keynesian Economics 17(4): 607-635.
• Keen, S. (2008). Keynes’s ‘revolving fund of finance’ and transactions in the circuit. Keynes and Macroeconomics after 70 Years. R. Wray and M. Forstater. Cheltenham, Edward Elgar: 259-278.
References
• Kydland, F. E. and E. C. Prescott (1990). "Business Cycles: Real Facts and a Monetary Myth." Federal Reserve Bank of Minneapolis Quarterly Review 14(2): 3-18.
• Minsky, H. P. (1982). Can "it" happen again? : essays on instability and finance. Armonk, N.Y., M.E. Sharpe.
• Moore, B. J. (1979). "The Endogenous Money Stock." Journal of Post Keynesian Economics 2(1): 49-70.
• Schumpeter, J. A. (1934). The theory of economic development : an inquiry into profits, capital, credit, interest and the business cycle. Cambridge, Massachusetts, Harvard University Press.