Embed Size (px)
Citation preview
Ss
The Global Police Modernization and
Counter Terrorism Market 2014–2024
Report Price: US$4,800 (Single User)
The Global Police Modernization and Counter Terrorism Market 2014–2024
2
Summary
“The Global Police Modernization and Counter Terrorism Market 2014–2024” offers the reader detailed
analysis of the global Police Modernization and Counter Terrorism market over the next ten years, and
provides market size forecasts. It covers the key technological and market trends in the police modernization
and counter terrorism market.
The global police modernization and counter terrorism market is estimated to value US$XX billion in 2014
and increase at a CAGR of XX% during the forecast period, to reach its peak of US$XX billion by 2024. The
market consists of four categories: police force infrastructure, police force ordnance, mobility and others,
counter terrorism infrastructure, and counter terrorism ordnance, mobility and others. The police force
infrastructure segment is expected to account for XX% of the global police modernization and counter
terrorism market, followed by police force ordnance, mobility and others with XX%, counter terrorism
infrastructure with XX%, and counter terrorism ordnance, mobility and others with XX% of share. During the
forecast period, the cumulative global expenditure on police modernization and counter terrorism is expected
to reach US$XX billion.
“The Global Police Modernization and Counter Terrorism Market 2014–2024” provides detailed analysis of
the current industry size and growth expectations from 2014 to 2024, including highlights of key growth
stimulators. It also benchmarks the industry against key global markets and provides a detailed
understanding of emerging opportunities in specific areas.
Key Findings
In the aftermath of the September 11 attacks on the World Trade Center and the Pentagon, countries across
the world were forced to increase their spending on internal security, especially police forces and counter
terrorism. Events such as the 2008 Mumbai terror attacks in India, in which terrorists entered the country
through the sea route, and the 2004 hostage situation in Beslan, Russia, further highlighted the importance
of sustained spending on advanced internal security solutions with police and counter terrorism initiatives
assuming primary importance. Recent years have witnessed a significant increase in terrorist attacks and
crime levels in various countries. Increasing instances of illegal immigration, human trafficking, homicide,
piracy, and terrorist activities are driving the demand for advanced technologies and end-to-end solutions
which will promote better situational awareness in pivotal cities, critical infrastructure sites and also at
borders. Critical national infrastructure and important cities are being targeted by extremist groups and
therefore having better awareness in these areas allows a country to effectively counter unusual or
suspicious activity, thereby driving spending on new and advanced intelligence, surveillance and
reconnaissance technologies.
Key Features and Benefits
The report provides detailed analysis of the market for global Police Modernization and Counter Terrorism
during 2014–2024, including the factors that influence why countries are investing or cutting expenditure on
these segments. It provides detailed expectations of growth rates and projected total expenditure.
The Global Police Modernization and Counter Terrorism Market 2014–2024
3
1 Global Police Modernization and Counter Terrorism Market Size and Drivers
1.1 Police Modernization and Counter Terrorism Market Size and Forecast 2014–2024
1.1.1 Global Police Modernization and Counter Terrorism market expected to witness a marginal
increase
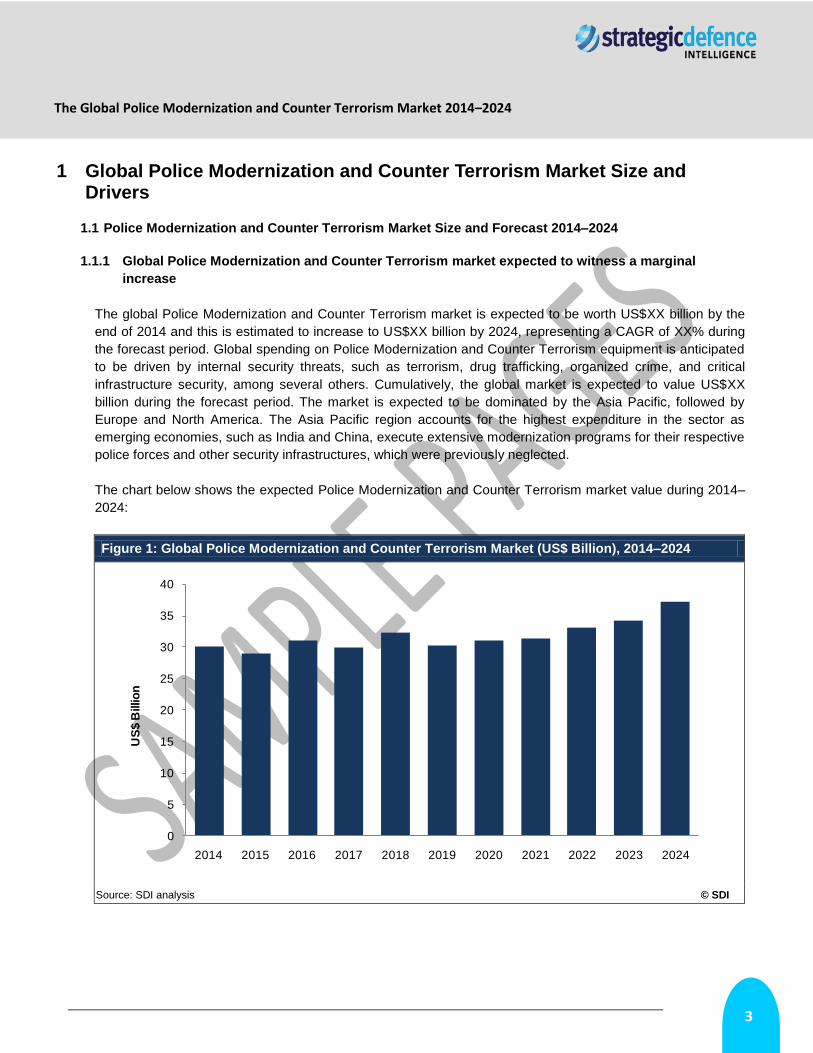
The global Police Modernization and Counter Terrorism market is expected to be worth US$XX billion by the
end of 2014 and this is estimated to increase to US$XX billion by 2024, representing a CAGR of XX% during
the forecast period. Global spending on Police Modernization and Counter Terrorism equipment is anticipated
to be driven by internal security threats, such as terrorism, drug trafficking, organized crime, and critical
infrastructure security, among several others. Cumulatively, the global market is expected to value US$XX
billion during the forecast period. The market is expected to be dominated by the Asia Pacific, followed by
Europe and North America. The Asia Pacific region accounts for the highest expenditure in the sector as
emerging economies, such as India and China, execute extensive modernization programs for their respective
police forces and other security infrastructures, which were previously neglected.
The chart below shows the expected Police Modernization and Counter Terrorism market value during 2014–
2024:
Figure 1: Global Police Modernization and Counter Terrorism Market (US$ Billion), 2014–2024
Source: SDI analysis © SDI
0
5
10
15
20
25
30
35
40
2014 2015 2016 2017 2018 2019 2020 2021 2022 2023 2024
US
$ B
illio
n
The Global Police Modernization and Counter Terrorism Market 2014–2024
4
1.2 Global Police Modernization and Counter Terrorism Market – Regional Analysis
1.2.1 Infrastructure for Counter Terrorism and Police Force in the US to support the global Police
Modernization and Counter Terrorism market
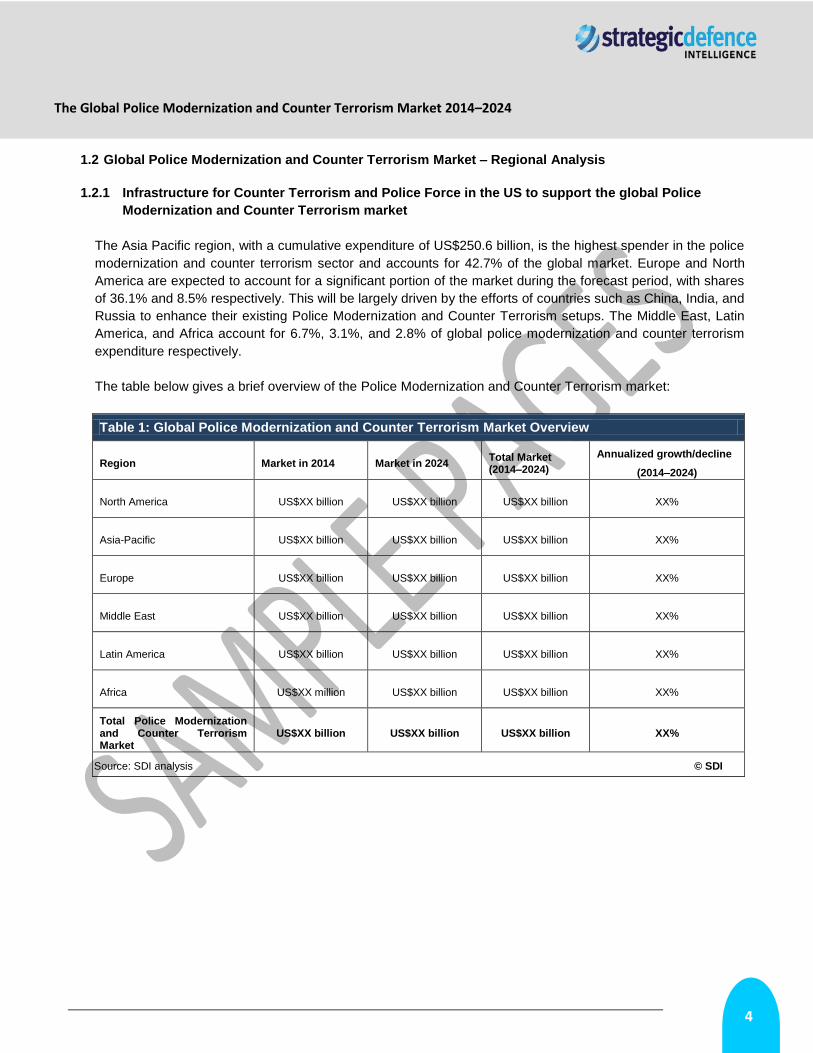
The Asia Pacific region, with a cumulative expenditure of US$250.6 billion, is the highest spender in the police
modernization and counter terrorism sector and accounts for 42.7% of the global market. Europe and North
America are expected to account for a significant portion of the market during the forecast period, with shares
of 36.1% and 8.5% respectively. This will be largely driven by the efforts of countries such as China, India, and
Russia to enhance their existing Police Modernization and Counter Terrorism setups. The Middle East, Latin
America, and Africa account for 6.7%, 3.1%, and 2.8% of global police modernization and counter terrorism
expenditure respectively.
The table below gives a brief overview of the Police Modernization and Counter Terrorism market:
Table 1: Global Police Modernization and Counter Terrorism Market Overview
Region Market in 2014 Market in 2024 Total Market (2014–2024)
Annualized growth/decline
(2014–2024)
North America US$XX billion US$XX billion US$XX billion XX%
Asia-Pacific US$XX billion US$XX billion US$XX billion XX%
Europe US$XX billion US$XX billion US$XX billion XX%
Middle East US$XX billion US$XX billion US$XX billion XX%
Latin America US$XX billion US$XX billion US$XX billion XX%
Africa US$XX million US$XX billion US$XX billion XX%
Total Police Modernization and Counter Terrorism Market
US$XX billion US$XX billion US$XX billion XX%
Source: SDI analysis © SDI
The Global Police Modernization and Counter Terrorism Market 2014–2024
5
2 SWOT Analysis of the Police Modernization and Counter Terrorism Market
Table 2: SWOT Analysis of the Police Modernization and Counter Terrorism Market
Source: SDI analysis © SDI
Strengths Weaknesses
Opportunities Threats
The Global Police Modernization and Counter Terrorism Market 2014–2024
6
3 Country Analysis – Police Modernization and Counter Terrorism
3.1 United States Market Size and Forecast 2014–2024
After the Iraq and Afghanistan wars, terrorist threats to the US have been on the ascendancy with the 2013
bombings at the Boston Marathon further highlighting the graveness of the current scenario. The country is
investing heavily in counterterrorism activities to counter the possible repercussions of „Global War on
Terrorism‟ on its internal security situation. Internal Security has been a critical area of activity for the US as it
strives to enhance the capabilities and preparedness of its Police Modernization and Counter Terrorism
department amidst a varied range of looming threats. The Department Homeland Security (DHS) has
implemented major reforms in the past by bringing several departments, which were previously spread across
the federal government, under a single centralized umbrella. This consolidation has helped improve the
competencies in the security domain and fostered better coordination and enhanced effectiveness. Agencies
that are now part of DHS include the Coast Guard, the Federal Emergency Management Agency (FEMA), the
Transportation Security Administration (TSA), the Immigration and Naturalization Service (INS), and Customs
and Border Protection (CBP).
Given the cost constraints, the demarcation of areas of critical responsibilities is expected to be the theme of
DHS spending throughout the forecast period. This has led to a strong focus on the introduction of advanced
capabilities in the areas of detection and assessment of chemical and biological agents, enforcing and
administering immigration laws, securing cyberspace, and counter terrorism, throughout the forecast period.
Major programs that contribute to US spending in counter terrorism include funding for US Investigation
Services, Enterprise Acquisition Gateway for Leading Edge Solutions II.
The Global Police Modernization and Counter Terrorism Market 2014–2024
7
The table below gives a brief overview of the US Police Modernization and Counter Terrorism market:
Table 3: US Police Modernization and Counter Terrorism Market Overview
Particulars Market in 2014 Market in 2024 Total Market (2014–2024 )
Annualized growth/decline
(2014–2024 )
Counter terrorism Infrastructure US$XX billion US$XX billion US$XX billion XX%
Police Force Infrastructure US$XX billion US$XX billion US$XX billion XX%
Counter terrorism Ordnance, Mobility and others
US$XX billion US$XX billion US$XX billion XX%
Police Force Ordnance, Mobility and others
US$XX billion US$XX billion US$XX billion XX%
Total Police Modernization and Counter Terrorism Market
US$XX billion US$XX billion US$XX billion XX%
Source: SDI analysis © SDI
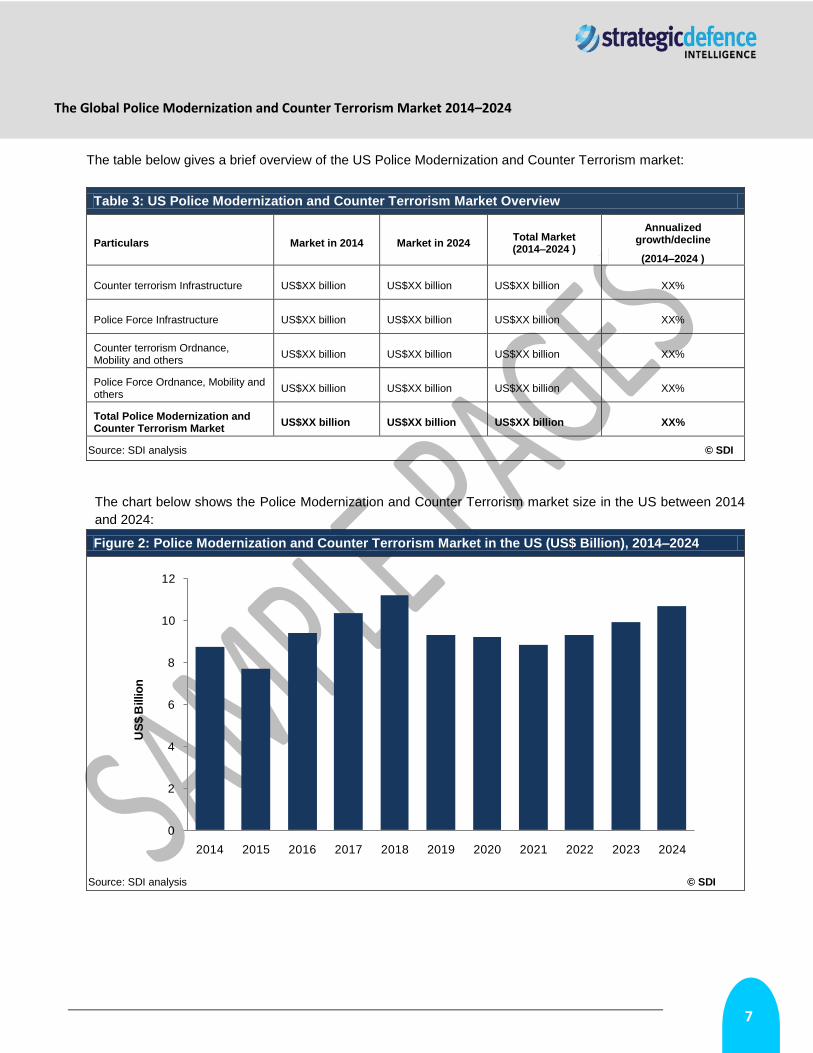
The chart below shows the Police Modernization and Counter Terrorism market size in the US between 2014
and 2024:
Figure 2: Police Modernization and Counter Terrorism Market in the US (US$ Billion), 2014–2024
Source: SDI analysis © SDI
0
2
4
6
8
10
12
2014 2015 2016 2017 2018 2019 2020 2021 2022 2023 2024
US
$ B
illio
n
The Global Police Modernization and Counter Terrorism Market 2014–2024
8
The table below shows the key US Police Modernization and Counter Terrorism programs:
Table 4: Key US Police Modernization and Counter Terrorism Programs
Program/Equipment Name
Type Quantity Procured
Supplier/Country Delivery Period
Total Contract Value
Secure Flight program Infrastructure XX DHS XX-XX XX
Project Bio Shield Counter
Terrorism XX NA XX-XX XX
Source: SDI analysis © SDI
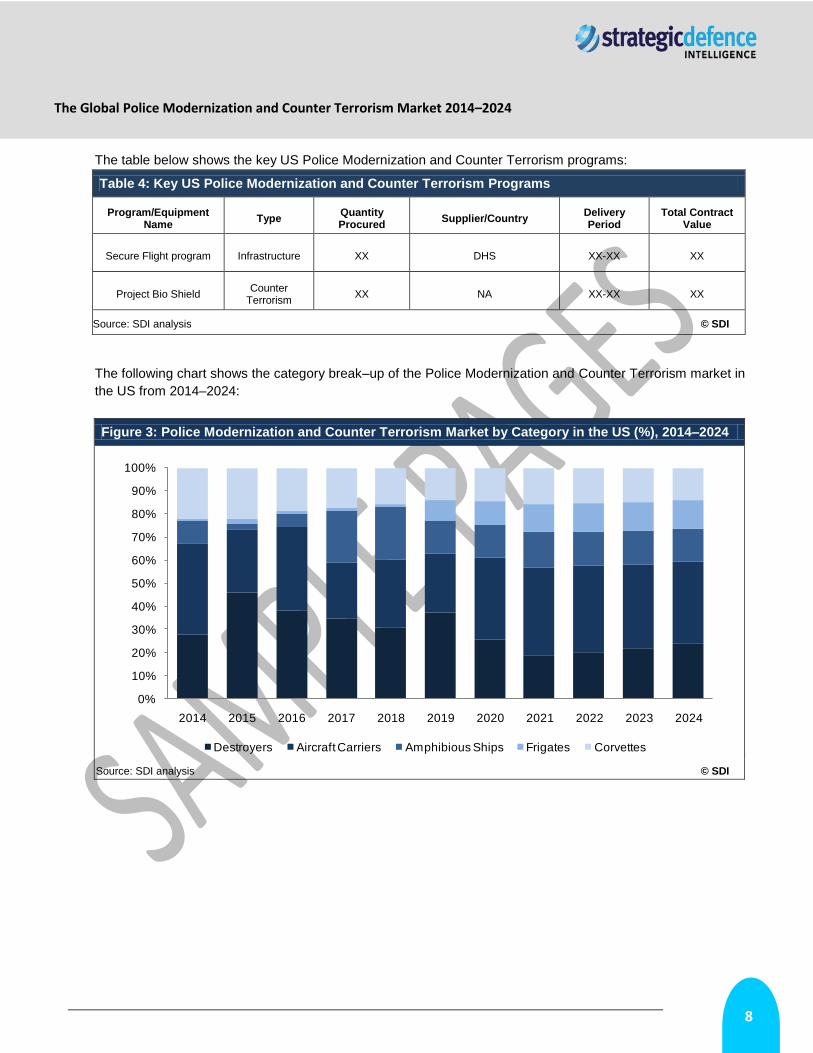
The following chart shows the category break–up of the Police Modernization and Counter Terrorism market in
the US from 2014–2024:
Figure 3: Police Modernization and Counter Terrorism Market by Category in the US (%), 2014–2024
Source: SDI analysis © SDI
0%
10%
20%
30%
40%
50%
60%
70%
80%
90%
100%
2014 2015 2016 2017 2018 2019 2020 2021 2022 2023 2024
Destroyers Aircraft Carriers Amphibious Ships Frigates Corvettes
The Global Police Modernization and Counter Terrorism Market 2014–2024
9
Report Methodology
Strategic Defense Intelligence (SDI) dedicated research and analysis teams consist of experienced
professionals with a background in industry research and consulting in the defense sector. The market size is
derived by consolidating ongoing procurement programs, modernization initiatives, and future procurement
plans, utilizing information gathered through primary and secondary sources. Forecasting is conducted based
on the lifetime of current inventory levels, suitability/need of the weapon category for a specific country, budget
availability, and opinion of leading industry experts. The following research methodology is followed for all
databases and reports.
Secondary Research
The research process begins with exhaustive secondary research to source reliable qualitative and
quantitative information related to the global Police Modernization and Counter Terrorism market. The
secondary research sources that are typically referred to include, but are not limited to:
Globally renowned think tanks
Industry associations
National government documents and statistical databases
Company websites, annual reports, financial reports, broker reports, and investor presentations
Industry trade journals and other literature
Internal and external proprietary databases
News articles, press releases, and webcasts specific to the companies operating in the market
Primary Research
SDI conducts hundreds of primary interviews a year with industry participants and commentators in order to
validate its data and analysis. A typical research interview fulfills the following functions:
Provides first-hand information on market size, market trends, growth trends, competitive landscape, and
future outlook.
Helps to validate and strengthen secondary research findings.
Further develops the analyses team‟s expertise and market understanding.
The participants who typically take part in such a process include, but are not limited to:
Industry participants: CEOs, VPs, business development managers, market intelligence managers, and
national sales managers.
External experts: investment bankers, valuation experts, research analysts, and key opinion leaders
specializing in defense markets.
The Global Police Modernization and Counter Terrorism Market 2014–2024
10
Conventions
Currency conversions are performed on the basis of average annual conversion rate format calculations.
All the values in tables, with the exception of compounded annual growth rate (CAGR) and compounded
annual rate of change (CARC) are displayed to one decimal place. Growth rates may, therefore, appear
inconsistent with absolute values due to this rounding method.
Related Reports
The Global Military Simulation and Virtual Training Market 2014–2024
The Global Military IT, Data and Computing Market 2014–2024
The Global Government Biometric Systems Market 2014–2024
The Global Military GPS/GNSS Market 2013–2023
The Global Military Ammunition Market 2013–2023
The Global Man-Portable Military Electronics Market 2013–2023

The Global Police Modernization and Counter Terrorism Market 2014–2024
11
TABLE OF CONTENTS
1 Introduction ......................................................................................................................... 11
1.1 What is this Report About? ............................................................................................................. 11
1.2 Definitions ...................................................................................................................................... 11
1.3 Summary Methodology ................................................................................................................... 13
1.4 About Strategic Defence Intelligence .............................................................................................. 14
2 Executive Summary ............................................................................................................ 15
3 Global Police Modernization and Counter Terrorism Market Size and Drivers.............. 17
3.1 Police Modernization and Counter Terrorism Market Size and Forecast 2014–2024 ...................... 17
3.1.1 Global police modernization and counter terrorism market to show positive growth during the forecast
period 17
3.2 Global Police Modernization and Counter Terrorism Market – Regional Analysis ........................... 18
3.2.1 Infrastructure for Counter Terrorism and Police Force in the US to support the global Police
Modernization and Counter Terrorism market .......................................................................................................20
3.2.2 Asia-Pacific region to lead the global Police Modernization and Counter Terrorism market ....................22
3.2.3 Market for police modernization and counter terrorism to remain robust in Europe throughout the forecast
period 24
3.2.4 Police modernization and counter terrorism market in the Middle East to increase at a CAGR of XX% .26
3.2.5 Brazil is expected to be the highest spender in the Police Modernization and Counter Terrorism sector in
the Latin American region ......................................................................................................................................27
3.2.6 Markets in Africa expected to increase over the forecast period ..............................................................28
3.3 Police Modernization and Counter Terrorism Sub–Sector Market Size Composition ...................... 29
3.3.1 Police Force Infrastructure to account for the highest expenditure in the Police Modernization and
Counter Terrorism market......................................................................................................................................29
3.3.2 Police force ordnance, mobility and others segment expected to constitute the second largest segment32
3.3.3 Counter terrorism infrastructure expected to constitute the third largest segment ...................................34
3.3.4 Market size of counter terrorism ordnance, mobility and others segment expected to rise at a CAGR of
XX% during the forecast period .............................................................................................................................36
3.4 Demand Drivers and Growth Stimulators ........................................................................................ 38
3.4.1 Cross border threats to drive spending on police modernization and counter terrorism ..........................38
3.4.2 Proliferation of terrorism to drive the Police Modernization and Counter Terrorism market .....................38
3.4.3 Adaptation of cyber technologies by criminal gangs and terrorists warrants increased spending on
innovative technologies .........................................................................................................................................39
3.4.4 Easy availability of CBRN device technology is increasing the need for countries to take added precaution
39
3.5 Defense Modernization Review ...................................................................................................... 40
The Global Police Modernization and Counter Terrorism Market 2014–2024
12
3.5.1 European police modernization and counter terrorism programs to continue despite budget cuts ..........40
3.5.2 Police modernization and counter terrorism budgets of Asian countries likely to be driven by threats
posed by neighboring countries and China‟s vast spending on national security .................................................40
3.5.3 Global economic slowdown leading to cuts in counter terrorism expenditure in the North American region
40
3.5.4 Major sporting events and a pressing need to modernize police force driving demand in Latin America 41
3.5.5 Security threats increasing the police modernization and counter terrorism budget of African countries 41
3.5.6 The Middle East is likely to be one of the highest spenders on police modernization and counter terrorism
41
4 Industry Trends, Recent Developments and Challenges ................................................. 43
4.1 Technological Developments .......................................................................................................... 43
4.1.1 US developing technologies to detect human intent .................................................................................43
4.1.2 A new sampling device to detect hazardous substances .........................................................................43
4.1.3 360 degree surveillance camera to aid law enforcement ..........................................................................43
4.1.4 Software to detect altered fingerprints ......................................................................................................44
4.2 Market Trends ................................................................................................................................ 45
4.2.1 Bio surveillance gaining in popularity ........................................................................................................45
4.2.2 Increase in government spending on civilian protection ...........................................................................45
4.2.3 Countries investing significantly to find attack patterns in cyber crimes ...................................................45
4.3 Industry Consolidation .................................................................................................................... 47
4.3.1 Joint ventures expected to increase over the forecast period...................................................................47
4.3.2 The police modernization and counter terrorism market to witness a phase of consolidation .................47
4.4 Key Challenges .............................................................................................................................. 48
4.4.1 High costs ..................................................................................................................................................48
4.4.2 Bureaucracy leading to conflict among agencies ......................................................................................48
4.4.3 The dynamic nature of CBRN threats makes it hard for companies to adapt ...........................................48
4.4.4 Counter measures against cyber weapons expected to be a significant challenge in the future .............49
5 SWOT Analysis of the Police Modernization and Counter Terrorism Market ................ 50
5.2 Strengths ........................................................................................................................................ 51
5.2.1 Continued threat of terrorist attacks ..........................................................................................................51
5.2.2 Technologically advanced tactics used by terrorists and drug traffickers driving further investment in this
sector 51
5.3 Weaknesses ................................................................................................................................... 52
5.3.1 High unit costs of security equipment .......................................................................................................52
5.4 Opportunities .................................................................................................................................. 53
5.4.1 Procurement schedules to increase steadily over the forecast period with the modernization of homeland
security departments of several countries .............................................................................................................53
The Global Police Modernization and Counter Terrorism Market 2014–2024
13
5.4.2 Demand for sophisticated technology solutions for homeland security expected to grow substantially
during the forecast period ......................................................................................................................................53
5.5 Threats ........................................................................................................................................... 55
5.5.1 US and European economic crisis ............................................................................................................55
6 Country Analysis – Police Modernization and Counter Terrorism Market ..................... 56
6.1 United States Market Size and Forecast 2014–2024 ...................................................................... 56
6.1.1 Counter terrorism infrastructure is expected to account for the largest share of US market ....................59
6.1.2 Spending on counter terrorism ordnance, mobility and others expected to be second largest segment in
the US 61
6.1.3 Expenditure on police force infrastructure expected to constitute the second largest market ..................63
6.2 France Market Size and Forecast 2014–2024 ................................................................................ 64
6.2.1 Police Force Ordnance, Mobility and others segment to grow at a CAGR of XX% over the forecast period
66
6.2.2 Counter Terrorism Infrastructure segment expected to account for the second largest segment of
expenditure ............................................................................................................................................................68
6.2.3 Counter Terrorism Ordnance, Mobility and others segments to grow at a CAGR of XX% .......................70
6.3 The United Kingdom Market Size and Forecast 2014–2024 ........................................................... 71
6.3.1 Police Force Ordnance, Mobility and others segment anticipated to account for the largest area of
expenditure over the forecast period .....................................................................................................................73
6.3.2 Spending on Police Force Infrastructure to grow at a CAGR of XX% ......................................................75
6.3.3 Counter terrorism infrastructure to account for the third largest segment of expenditure ........................76
6.4 China Market Size and Forecast 2014–2024 .................................................................................. 78
6.4.1 Police force infrastructure segment is expected to constitute the largest market share in China ............81
6.4.2 Spending on counter terrorism infrastructure to exhibit a CAGR of XX% during the forecast period .......83
6.5 Indian Market Size and Forecast 2014–2024.................................................................................. 85
6.5.1 Spending on police force infrastructure expected to exhibit a CAGR of XX% during the forecast period 89
6.5.2 Counter terrorism infrastructure expected to account for the second largest share .................................91
6.5.3 Police force Ordnance, Mobility and others segment is expected to constitute the third largest market
share in India .........................................................................................................................................................93
6.6 Japan Market Size and Forecast 2014–2024.................................................................................. 95
6.6.1 Police Force Infrastructure to account for the highest proportion of expenditure .....................................97
6.6.2 Police Force Ordnance, mobility and others accounts for second largest share of Japanese spending on
Police Modernization and Counter Terrorism ........................................................................................................99
6.7 Saudi Arabia Market Size and Forecast 2014–2024 ..................................................................... 101
6.7.1 Counter terrorism Ordnance, Mobility and others segment to account for the largest segment of
expenditure by Saudi Arabia over the forecast period ........................................................................................103
6.7.2 Counter Terrorism Infrastructure segment expected to exhibit a CAGR of XX% during the forecast period
104
The Global Police Modernization and Counter Terrorism Market 2014–2024
14
6.8 UAE Market Size and Forecast 2014–2024 .................................................................................. 105
6.8.1 UAE to allocate largest share towards counter terrorism infrastructure .................................................107
6.9 South Africa Market Size and Forecast 2014–2024 ...................................................................... 108
6.9.1 Police Force Ordnance, Mobility and others segment to account for the highest segment of expenditure
110
6.9.2 Police force infrastructure to account for the second largest segment in South Africa ..........................111
6.10 Brazil Market Size and Forecast 2014–2024 ................................................................................ 112
6.10.1 Police Force Infrastructure to account for the highest proportion of expenditure by Brazil on Police
Modernization and Counter Terrorism .................................................................................................................114
6.10.2 Police Force Ordnance and mobility accounts for second largest share of Brazilian spending on Police
Modernization and Counter Terrorism .................................................................................................................116
6.10.3 Counter terrorism infrastructure accounts for third largest share of Brazilian spending on Police
Modernization and Counter Terrorism .................................................................................................................117
6.11 Argentina Market Size and Forecast 2014–2024 .......................................................................... 118
6.11.1 Police force ordnance, mobility and others to account for the largest share of Argenitine expenditure .120
6.11.2 Argentine expenditure on police force infrastructure to increase at a CAGR of XX% ............................121
7 Major Police Modernization and Counter Terrorism Programs ..................................... 122
7.1.1 US - Project BioShield .............................................................................................................................122
7.1.2 UK - Digital interview recording managed service ..................................................................................123
7.1.3 UAE - Presidential Guard Command Counter terrorism training Program .............................................124
7.1.4 India - Crime and Criminal Tracking Network and Systems (CCTNS) ...................................................125
7.1.5 US - Secure Flight program.....................................................................................................................126
7.1.6 India - National Intelligence Grid (NATGRID) .........................................................................................127
7.1.7 US - Einstein Intrusion Detection Program .............................................................................................128
7.1.8 India - Punjab Police Modernization ........................................................................................................129
8 Competitive Landscape and Strategic Insights .............................................................. 133
8.1.1 Smiths Detection: Overview ....................................................................................................................133
8.1.2 Smiths Detection: Products and Services ...............................................................................................133
8.1.3 Smith Detection: Alliances.......................................................................................................................133
8.1.4 Smith Detection: Recent Contract Wins ..................................................................................................134
8.1.5 Computer Sciences Corp: Overview .......................................................................................................135
8.1.6 Computer Sciences Corp: Products and Services ..................................................................................135
8.1.7 Computer Sciences Corp: Recent Contract Wins ...................................................................................135
8.1.8 Computer Sciences Corp: Financial Analysis .........................................................................................135
8.1.9 EADS: Overview ......................................................................................................................................137
8.1.10 EADS: Products and Services ................................................................................................................137
8.1.11 EADS: Alliances ......................................................................................................................................138
The Global Police Modernization and Counter Terrorism Market 2014–2024
15
8.1.12 EADS: Recent Contract Wins .................................................................................................................138
8.1.13 Thales: overview .....................................................................................................................................138
8.1.14 Thales: products and services ................................................................................................................139
8.1.15 Thales: alliances ......................................................................................................................................139
8.1.16 Thales: recent contract wins ...................................................................................................................140
8.1.17 Thales: financial analysis ........................................................................................................................140
8.1.18 Elbit Systems: overview ..........................................................................................................................142
8.1.19 Elbit Systems: products and services .....................................................................................................142
8.1.20 Elbit Systems: recent contract wins ........................................................................................................143
8.1.21 Elbit Systems: Financial Analysis ............................................................................................................144
8.1.22 Northrop Grumman: Overview ................................................................................................................146
8.1.23 Northrop Grumman: Products and Services ...........................................................................................146
8.1.24 Northrop Grumman: Recent Contract Wins ............................................................................................148
8.1.25 Northrop Grumman: Financial Analysis ..................................................................................................149
8.1.26 Exelis Inc.: Overview ...............................................................................................................................150
8.1.27 Exelis: Products and Services .................................................................................................................150
8.1.28 Exelis: Alliances ......................................................................................................................................152
8.1.29 Exelis: Recent Contract Wins ..................................................................................................................152
8.1.30 Exelis: Financial Analysis ........................................................................................................................152
8.1.31 Raytheon: Overview ................................................................................................................................154
8.1.32 Raytheon: Products and Services ...........................................................................................................154
8.1.33 Raytheon: Alliances .................................................................................................................................155
8.1.34 Raytheon: Recent Contract Wins ............................................................................................................155
8.1.35 Raytheon: Financial Analysis ..................................................................................................................156
8.1.36 BAE Systems: Overview .........................................................................................................................158
8.1.37 BAE Systems: Products and Services ....................................................................................................158
8.1.38 BAE Systems: Alliances ..........................................................................................................................158
8.1.39 BAE Systems: Recent Contract Wins .....................................................................................................158
8.1.40 BAE Systems: Financial Analysis ...........................................................................................................159
8.1.41 L-3 Communications: Overview ..............................................................................................................161
8.1.42 L-3 Communications: Products and Services .........................................................................................161
8.1.43 L-3 Communications: Alliances ...............................................................................................................161
8.1.44 L-3 Communications: Recent Contract Wins ..........................................................................................161
8.1.45 L-3 Communications: financial analysis ..................................................................................................162
8.1.46 Lockheed Martin: Overview .....................................................................................................................164
8.1.47 Lockheed Martin: Products and Services ................................................................................................164
8.1.48 Lockheed Martin: Alliances .....................................................................................................................165
The Global Police Modernization and Counter Terrorism Market 2014–2024
16
8.1.49 Lockheed Martin: Recent Contract Wins .................................................................................................165
8.1.50 Lockheed Martin: Financial Analysis .......................................................................................................165
8.1.51 General Dynamics: Overview ..................................................................................................................167
8.1.52 General Dynamics: Products and Services.............................................................................................167
8.1.53 General Dynamics: Alliances ..................................................................................................................168
8.1.54 General Dynamics: Recent Contract Wins ..............................................................................................169
8.1.55 General Dynamics: Financial Analysis ....................................................................................................169
8.1.56 SAIC: Overview .......................................................................................................................................171
8.1.57 SAIC: Products and Services ..................................................................................................................171
8.1.58 SAIC: Alliances ........................................................................................................................................172
8.1.59 SAIC: Recent Contract Wins ...................................................................................................................173
8.1.60 SAIC: Financial Analysis .........................................................................................................................173
8.1.61 SAAB: Overview ......................................................................................................................................174
8.1.62 SAAB: Products and Services .................................................................................................................174
8.1.63 SAAB: Alliances ......................................................................................................................................175
8.1.64 SAAB: Recent Contract Wins ..................................................................................................................176
8.1.65 SAAB: Financial Analysis ........................................................................................................................176
8.1.66 CACI: Overview .......................................................................................................................................178
8.1.67 CACI: Products and Services ..................................................................................................................178
8.1.68 CACI: Alliances .......................................................................................................................................179
8.1.69 CACI: Recent Contract Wins ...................................................................................................................179
8.1.70 CACI: financial analysis ...........................................................................................................................180
9 Appendix ............................................................................................................................ 182
9.1 Methodology ................................................................................................................................. 182
9.2 About SDI ..................................................................................................................................... 182
9.3 Disclaimer .................................................................................................................................... 182
The Global Police Modernization and Counter Terrorism Market 2014–2024
17
LIST OF FIGURES
Figure 1: Global Police Modernization and Counter Terrorism Market (US$ Billion), 2014–2024 ........................................................................ 17 Figure 2: Police Modernization and Counter Terrorism Market Breakdown by Region (%), 2014–2024 .............................................................. 19 Figure 3: North American Police Modernization and Counter Terrorism Market (US$ Billion), 2014–2024 ......................................................... 21 Figure 4: Asia-Pacific Police Modernization and Counter Terrorism Market (US$ Billion), 2014–2024 ................................................................ 23 Figure 5: European Police Modernization and Counter Terrorism Market (US$ Billion), 2014–2024 ................................................................... 25 Figure 6: Middle East Police Modernization and Counter Terrorism Market (US$ Billion), 2014–2024 ................................................................ 26 Figure 7: Latin American Police Modernization and Counter Terrorism Market (US$ Billion), 2014–2024 ........................................................... 27 Figure 8: African Police Modernization and Counter Terrorism Market (US$ Billion), 2014–2024 ........................................................................ 28 Figure 9: Police Modernization and Counter Terrorism Market Breakdown by Segment (%), 2014–2024 ........................................................... 30 Figure 10: Police Force Infrastructure Market Size (US$ Billion), 2014–2024...................................................................................................... 31 Figure 11: Police Force Ordnance, Mobility and Others Market Size (US$ Billion), 2014–2024 ........................................................................... 33 Figure 12: Counter Terrorism Infrastructure Market Size (US$ Billion), 2014–2024 ............................................................................................ 35 Figure 13: Counter Terrorism Ordnance, Mobility and Others Market Size (US$ Billion), 2014–2024 .................................................................. 37 Figure 14: Police Modernization and Counter Terrorism Market in the US (US$ Billion), 2014–2024 .................................................................. 57 Figure 15: Police Modernization and Counter Terrorism Market Split By Category in the US (%), 2014–2024 .................................................... 58 Figure 16: Counter Terrorism Infrastructure Market Size in the US (US$ Billion), 2014–2024 ............................................................................. 60 Figure 17: Counter Terrorism Ordnance, Mobility and Others Market Size in the US (US$ Million), 2014–2024 .................................................. 62 Figure 18: Police Force Infrastructure Market Size in the US (US$ Million), 2014–2024 ..................................................................................... 63 Figure 19: Police Modernization and Counter Terrorism Market in France (US$ Billion), 2014–2024 .................................................................. 65 Figure 20: Police Modernization and Counter Terrorism Market Split by Sector in France (%), 2014–2024 ........................................................ 65 Figure 21: Police Force Ordnance, Mobility and Others Market Size in France (US$ Billion), 2014–2024 ........................................................... 67 Figure 22: Counter Terrorism Infrastructure Market Size in France (US$ Billion), 2014–2024 ............................................................................. 69 Figure 23: Counter Terrorism Ordnance, Mobility and Others Market Size in France (US$ Billion), 2014–2024 .................................................. 70 Figure 24: Police Modernization and Counter Terrorism Market in the UK (US$ Billion), 2014–2024 .................................................................. 72 Figure 25: Police Modernization and Counter Terrorism Market Split by Sector in UK (%), 2014–2024 .............................................................. 72 Figure 26: Police Force Ordnance, Mobility and Others Market Size in the UK (US$ Billion), 2014–2024 ........................................................... 74 Figure 27: Police Force Infrastructure Market Size in the UK (US$ Million), 2014–2024 ..................................................................................... 75 Figure 28: Counter Terrorism Infrastructure Market Size in the UK (US$ Million), 2014–2024 ............................................................................ 77 Figure 29: Police Modernization and Counter Terrorism Market in China (US$ Billion), 2014–2024 .................................................................... 79 Figure 30: Police Modernization and Counter Terrorism Market Split By Category in China (%), 2014–2024 ...................................................... 80 Figure 31: Police Force Infrastructure Market Size in China (US$ Billion), 2014–2024 ........................................................................................ 82 Figure 32: Counter Terrorism Infrastructure Market Size in China (US$ Billion), 2014–2024 ............................................................................... 84 Figure 33: Police Modernization and Counter Terrorism Market in India (US$ Billion), 2014–2024 ..................................................................... 87 Figure 34: Police Modernization and Counter Terrorism Market Split by Sector in India (%), 2014–2024 ............................................................ 88 Figure 35: Police Force Infrastructure Market Size in India (US$ Billion), 2014–2024 ......................................................................................... 90 Figure 36: Counter Terrorism Infrastructure Market Size in India (US$ Million), 2014–2024 ................................................................................ 92 Figure 37: Police Force Ordnance and Others Market Size in India (US$ Billion), 2014–2024 ............................................................................ 94 Figure 38: Police Modernization and Counter Terrorism Market in Japan (US$ Billion), 2014–2024 ................................................................... 96 Figure 39: Police Modernization and Counter Terrorism Market Split By Category in Japan (%), 2014–2024 ..................................................... 96 Figure 40: Police Force Infrastructure Market Size in Japan (US$ Million), 2014–2024 ....................................................................................... 98 Figure 41: Police Force Ordnance, Mobility and Others Market Size in Japan (US$ Million), 2014–2024 .......................................................... 100 Figure 42: Police Modernization and Counter Terrorism Market in Saudi Arabia (US$ Billion), 2014–2024 ....................................................... 102 Figure 43: Police Modernization and Counter Terrorism Market Split By Category in Saudi Arabia (%), 2014–2024 ......................................... 102 Figure 44: Counter Terrorism Ordnance, Mobility and others Market Size in Saudi Arabia (US$ Billion), 2014–2024 ....................................... 103 Figure 45: Counter Terrorism Infrastructure Market Size in Saudi Arabia (US$ Million), 2014–2024 ................................................................. 104 Figure 46: Police Modernization and Counter Terrorism Market in UAE (US$ Million), 2014–2024 .................................................................. 106 Figure 47: Counter Terrorism Infrastructure Market Size in UAE (US$ Million), 2014–2024 .............................................................................. 107 Figure 48: Police Modernization and Counter Terrorism Market in South Africa (US$ Million), 2014–2024 ....................................................... 109 Figure 49: Police Modernization and Counter Terrorism Market Split By Category in South Africa (%), 2014–2024 .......................................... 109 Figure 50: Police Force Ordnance, Mobility and Others Market Size in South Africa (US$ Million), 2014–2024 ................................................ 110 Figure 51: Police Force Infrastructure Market Size in South Africa (US$ Million), 2014–2024 ........................................................................... 111 Figure 52: Police Modernization and Counter Terrorism Market in Brazil (US$ million), 2014–2024 .................................................................. 113 Figure 53: Police Modernization and Counter Terrorism Market Split By Category in Brazil (%), 2014–2024 .................................................... 113 Figure 54: Police Force Infrastructure Market Size in Brazil (US$ Billion), 2014–2024 ...................................................................................... 115
The Global Police Modernization and Counter Terrorism Market 2014–2024
18
Figure 55: Police Force Ordnance, Mobility and Others Market Size in Brazil (US$ Million), 2014–2024........................................................... 116 Figure 56: Counter Terrorism Infrastructure Market Size in Brazil (US$ Million), 2014–2024 ............................................................................ 117 Figure 57: Police Modernization and Counter Terrorism Market in Argentina (US$ Million), 2014–2024 ........................................................... 119 Figure 58: Police Force Ordnance, Mobility and Others Market Size in Argentina (US$ Million), 2014–2024 .................................................... 120 Figure 59: Police Force Infrastructure Market Size in Argentina (US$ Million), 2014–2024 ............................................................................... 121 Figure 60: Computer Sciences Corp – Revenue Trend Analysis (US$ Billion), 2009–2013 ............................................................................... 136 Figure 61: Computer Sciences Corp – Operating Profit (US$ Billion), 2009–2013 ............................................................................................ 136 Figure 62: Computer Sciences Corp – Net Profit Trend Analysis (US$ Billion), 2009–2013 ............................................................................. 137 Figure 63: Thales - Revenue Trend Analysis (US$ Billion), FY2009–2013 ........................................................................................................ 141 Figure 64: Thales - Operating Profit Trend Analysis (EUR Million), FY2009–2013 ............................................................................................ 141 Figure 65: Thales - Net Profit Trend Analysis (EUR Million), FY2009–2013 ...................................................................................................... 142 Figure 66: Elbit Systems – Revenue Trend Analysis (US$ billion), 2009–2013 ................................................................................................. 144 Figure 67: Elbit Systems – Operating Profit (US$ million), 2009–2013 .............................................................................................................. 145 Figure 68: Elbit Systems – Net Profit Trend Analysis (US$ million), 2009–2013................................................................................................ 145 Figure 69: Northrop Grumman – Revenue Trend Analysis (US$ Billion), 2009–2013 ........................................................................................ 149 Figure 70: Northrop Grumman – Operating Profit (US$ Million), 2009–2013 ..................................................................................................... 149 Figure 71: Northrop Grumman – Net Profit Trend Analysis (US$ Million), 2009–2013 ....................................................................................... 150 Figure 72: Exelis – Revenue Trend Analysis (US$ Billion), 2009–2013 ............................................................................................................. 153 Figure 73: Exelis – Operating Profit (US$ Million), 2009–2013 .......................................................................................................................... 153 Figure 74: ITT Exelis – Net Profit Trend Analysis (US$ Million), 2009–2013 .................................................................................................... 154 Figure 75: Raytheon – Revenue Trend Analysis (US$ Billion), 2009–2013 ....................................................................................................... 156 Figure 76: Raytheon – Operating Profit (US$ Million), 2009–2013 .................................................................................................................... 157 Figure 77: Raytheon – Net Profit Trend Analysis (US$ Million), 2009–2013 ..................................................................................................... 157 Figure 78: BAE Systems – Revenue Trend Analysis (GBP Billion), 2009–2013 ................................................................................................ 159 Figure 79: BAE Systems – Operating Profit (GBP Million), 2009–2013 ............................................................................................................. 160 Figure 80: BAE Systems – Net Profit Trend Analysis (GBP Million), 2009–2013 .............................................................................................. 160 Figure 81: L-3 Communications – Revenue Trend Analysis (US$ Billion), 2009–2013 ...................................................................................... 162 Figure 82: L-3 Communications – Operating Profit Trend Analysis (US$ Million), FY2009–2013 ...................................................................... 163 Figure 83: L-3 Communications – Net Profit Trend Analysis (US$ Million), FY2009–20113 .............................................................................. 163 Figure 84: Lockheed Martin Corporation – Revenue Trend Analysis (US$ Billion), 2009–2013 ......................................................................... 166 Figure 85: Lockheed Martin Corporation – Operating Profit (US$ Million), 2009–2013 ...................................................................................... 166 Figure 86: Lockheed Martin Corporation – Net Profit Trend Analysis (US$ Million), 2009–2013 ........................................................................ 167 Figure 87: General Dynamics – Revenue Trend Analysis (US$ billion), 2009–2013.......................................................................................... 170 Figure 88: General Dynamics – Operating Profit (US$ million), 2009–2013 ...................................................................................................... 170 Figure 89: General Dynamics – Net Profit Trend Analysis (US$ million), 2009–2013 ........................................................................................ 171 Figure 90: SAIC – Revenue Trend Analysis (US$ Billion), 2008 – 2012 ............................................................................................................ 173 Figure 91: SAIC – Operating Profit (US$ Million), 2008–2012 .......................................................................................................................... 174 Figure 92: SAAB – Revenue Trend Analysis (SEK Billion), 2009–2013 ............................................................................................................ 176 Figure 93: SAAB – Operating Profit (SEK Million), 2009–2013.......................................................................................................................... 177 Figure 94: SAAB – Net Profit Trend Analysis (SEK Million), 2009–2013 .......................................................................................................... 177 Figure 95: CACI – Revenue Trend Analysis (US$ billion), 2009–2013 .............................................................................................................. 180 Figure 96: CACI – Operating Profit (US$ million), 2009–2013 ........................................................................................................................... 181 Figure 97: CACI – Net Profit Trend Analysis (US$ million), 2009–2013 ............................................................................................................ 181
The Global Police Modernization and Counter Terrorism Market 2014–2024
19
LIST OF TABLES
Table 1: Global Police Modernization and Counter Terrorism Market Overview .................................................................................................. 18 Table 2: Global Police Modernization and Counter Terrorism Market Overview .................................................................................................. 30 Table 3: SWOT Analysis of the Police Modernization and Counter Terrorism market ......................................................................................... 50 Table 4: US Police Modernization and Counter Terrorism Market Overview ....................................................................................................... 57 Table 5: Key US Police Modernization and Counter Terrorism programs ............................................................................................................ 58 Table 6: French Police Modernization and Counter Terrorism Market Overview ................................................................................................. 64 Table 7: UK Police Modernization and Counter Terrorism Market Overview ....................................................................................................... 71 Table 8: Chinese Police Modernization and Counter Terrorism Market Overview ............................................................................................... 78 Table 9: Major Chinese Police Modernization and Counter Terrorism Programs ................................................................................................. 80 Table 10: Indian Police Modernization and Counter Terrorism Market Overview ................................................................................................. 86 Table 11: Key Indian Police Modernization and Counter Terrorism Programs ..................................................................................................... 87 Table 12: Japanese Police Modernization and Counter Terrorism Market Overview ........................................................................................... 95 Table 13: Saudi Arabian Police Modernization and Counter Terrorism Market Overview .................................................................................. 101 Table 14: UAE Police Modernization and Counter Terrorism Market Overview ................................................................................................. 105 Table 15: Key Police Modernization and Counter Terrorism Programs ............................................................................................................. 106 Table 16: South African Police Modernization and Counter Terrorism Market Overview ................................................................................... 108 Table 17: Brazilian Police Modernization and Counter Terrorism Market Overview ........................................................................................... 112 Table 18: Argentine Police Modernization and Counter Terrorism Market Overview ......................................................................................... 118 Table 19: Program Details – Project BioShield program ................................................................................................................................... 122 Table 20: Program Details – Digital Interview Recording Managed Service ...................................................................................................... 123 Table 21: Program Details – Presidential Guard Command Counter terrorism training Program ....................................................................... 124 Table 22: Program Details – CCTNS Project .................................................................................................................................................... 125 Table 23: Program Details – Secure Flight program.......................................................................................................................................... 126 Table 24: Program Details – NATGRID Project................................................................................................................................................. 127 Table 25: Program Details – Einstein Intrusion Detection System ..................................................................................................................... 128 Table 26: Program Details – Punjab Police Modernization program .................................................................................................................. 129 Table 27: Smith Detection – Alliances ............................................................................................................................................................... 133 Table 28: Smith Detection– Recent Contract Wins ........................................................................................................................................... 134 Table 29: Computer Sciences Corp – Recent Contract Wins ............................................................................................................................ 135 Table 30: EADS – Alliances .............................................................................................................................................................................. 138 Table 31: EADS – Recent Contract Wins .......................................................................................................................................................... 138 Table 32: Thales – Alliances ............................................................................................................................................................................. 139 Table 33: Thales– Recent Contract Wins .......................................................................................................................................................... 140 Table 34: Elbit Systems – Recent Contract Wins .............................................................................................................................................. 143 Table 35: Northrop Grumman – Recent Contract Wins ..................................................................................................................................... 148 Table 36: Exelis – Alliances .............................................................................................................................................................................. 152 Table 37: Exelis – Recent Contract Wins .......................................................................................................................................................... 152 Table 38: Raytheon – Alliances ........................................................................................................................................................................ 155 Table 39: Raytheon – Recent Contract Wins .................................................................................................................................................... 155 Table 40: BAE Systems – Alliances .................................................................................................................................................................. 158 Table 41: BAE Systems – Recent Contract Wins .............................................................................................................................................. 158 Table 42: L-3 Communications – Alliances ....................................................................................................................................................... 161 Table 43: L-3 Communications – Recent Contract Wins ................................................................................................................................... 161 Table 44: Lockheed Martin – Alliances ............................................................................................................................................................. 165 Table 45: Lockheed Martin – Recent Contract Wins ......................................................................................................................................... 165 Table 46: General Dynamics – Alliances .......................................................................................................................................................... 168 Table 47: General Dynamics – Recent Contract Wins ...................................................................................................................................... 169 Table 48: SAIC – Alliances ............................................................................................................................................................................... 172 Table 49: SAIC – Recent Contract Wins ........................................................................................................................................................... 173 Table 50: SAAB – Alliances .............................................................................................................................................................................. 175 Table 51: SAAB – Recent Contract Wins .......................................................................................................................................................... 176 Table 52: CACI – Alliances ............................................................................................................................................................................... 179 Table 53: CACI – Recent Contract Wins ........................................................................................................................................................... 179