Embed Size (px)
Citation preview

The Great Recession and the
Changing Geography of
Food Stamp Receipt
Tim Slack and Candice A. Myers Louisiana State University
Pennington Biomedical Research Center
Prepared for the Rural Poverty Research Symposium,
Federal Reserve Bank of Atlanta, December 2 & 3, 2013
This research was supported by the Research Innovation and Development Grants in
Economics (RIDGE) Program administered by the Southern Rural Development
Center (SRDC) with funding from the USDA Economic Research Service (ERS).

Introduction and Background
The 18-month recession spanning Dec. 2007 to
June 2009 ranks as the worst US contraction
since Great Depression of 1930s
With origins in the collapse of the housing
market, the “Great Recession” led to systemic
crises in the financial sector and labor market
Major labor market dislocations, wealth destruction,
and declines in consumption
Multifaceted and large-scale federal response to
mitigate economic damage in the form of bailouts and
stimulus spending

Introduction and Background
Scope of crisis raises questions about degree to
which existing forms of disadvantage were
exacerbated and/or new forms of inequality
created
Great Recession distinctive in driving up
unprecedented participation in the Supplemental
Nutrition Assistance Program (SNAP)
Between 2007 and 2011 monthly SNAP rolls climbed
from ~26 million people (or 1 in 11 Americans) to
~45 million people (or 1 in 7 Americans)

Introduction and Background
Most research on SNAP dynamics has focused
on individual/household or state-level data
However, two studies have shown that local-level
characteristics exert significant influences on
SNAP receipt (Goetz et al. 2004; Slack & Myers 2012)
Demonstrate that county-level food stamp receipt
regionally concentrated/clustered (not spatially
random)
Impacts of downturn also spatially patterned
For example, NV, FL, AZ, CA, and MI

Research Objective and Questions
Seek to understand the changing geography of
SNAP receipt during the Great Recession
Q1: How did SNAP receipt change across
counties between 2007 and 2009?
Q2: What other types of local-level change were
associated with change in SNAP participation at
the county level?

Data and Methods
Draw data from the USDA, US Census Bureau,
US Dept. of Labor, and US Dept. of Housing and
Urban Development (HUD)
Counties are our unit of analysis
Use descriptive statistics, mapping, and weighted
least squares spatial regression models

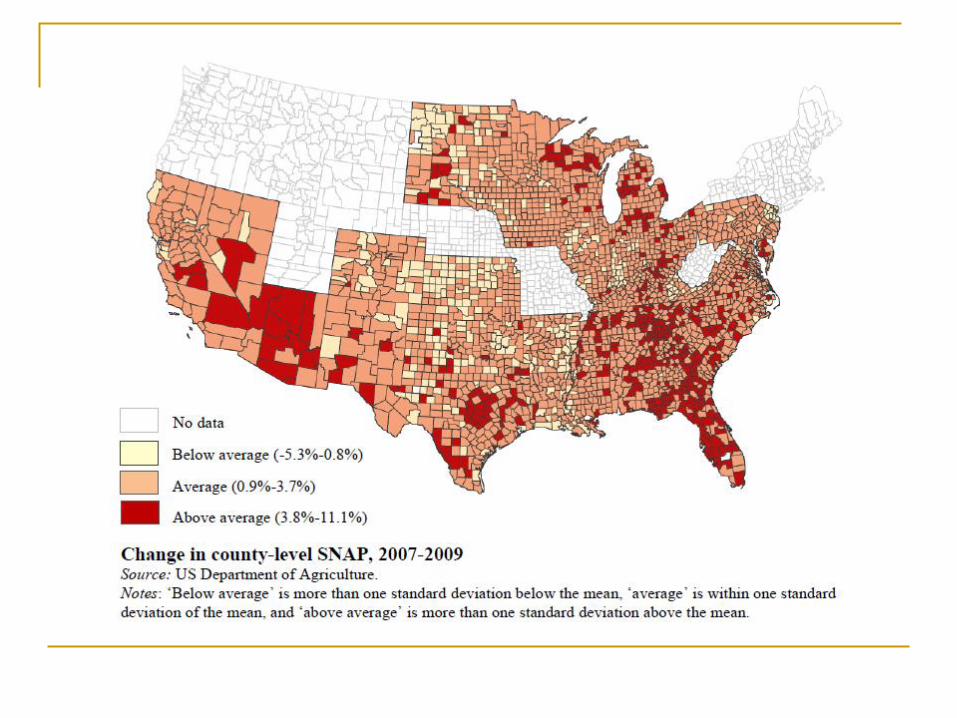
Dependent Variable
Data from USDA FNS
Percentage-point change in SNAP receipt
between 2007 and 2009
Percent county population using SNAP in 2009 minus
percent county population using SNAP in 2007
Focus on contiguous US
FNS does not provide county data for 16 states
Total sample of 2,485 counties in 32 states and
the District of Columbia

Data Coverage

Independent Variables
Data from Census Bureau, USDA, Dept. of Labor
and HUD. (All percentage-point change, unless dummy variable).
Poverty Experience
% poor; persistent poverty (1=yes)
Labor Market Conditions
% unemployed; % secondary/peripheral jobs
Population Structure
% female-headed families, % total population change; % 65 and older; %
under age 18; % black; % Latino; % foreign-born
Human Capital
% less than high school; % limited or no English
Residential Context
Foreclosure rate; segregation of poor vs. nonpoor, black vs. white, Latino
vs. white; MSA < 1 mil (1=yes), micro (1=yes), and noncore (1=yes)

2.3%
-5.3%
11.1%
-8.0%
-6.0%
-4.0%
-2.0%
0.0%
2.0%
4.0%
6.0%
8.0%
10.0%
12.0%
Mean Min. Max.
Percentage-point change in county-level SNAP receipt, 2007-2009


Regression Model Specification
Aim is to identify local-level changes with
significant linkages to changes in county-level
SNAP receipt during the Great Recession
Weight model by total county-level population
size
OLS would weight all counties equally, such that a
percentage-point change in a county with a population
of 100 would exert the same influence as a county with
a population of 1 million
Control for state fixed effects and spatial
“neighbor” effects

Regression Model Results
Shows significantly greater increases in SNAP
receipt in places characterized by:
Micropolitan (small town) settings
Increases in poverty
Increases in unemployment
More home foreclosures
Increases in Latino populations
Increases in SNAP receipt among neighboring locales

Regression Model Results
Shows significantly less change in SNAP receipt
in places characterized by:
Persistent poverty
Increases in single female family headship
Increases in older populations
Increases in black populations
Increases in less educated populations
Increases in poor/non-poor segregation

Conclusions
Local-level change in SNAP receipt was
responsive to the signature characteristics of the
Great Recession (e.g., poverty, unemployment
and home foreclosures)
Less change associated with factors that have
traditionally been linked to high SNAP receipt
(e.g., persistent poverty)
Particular increases in SNAP receipt in
micropolitan (small town) settings

Policy Implications
SNAP was very responsive to increased
hardship created by the Great Recession
Stands in stark contrast to TANF
Local and regional configurations matter
Suggests opportunities for regionally targeted
programmatic outreach
Suggests opportunities for building inter-state regional
networks among service providers
Supports current FNS efforts to work with local
community partners on SNAP outreach and education

Policy Implications
SNAP is an effective form of local economic
stimulus in the context of an economic crisis
USDA estimates that every $1 invested in SNAP in a
community generates an additional $1.80 of spending
in the local economy
Raises questions about wisdom of cutting SNAP
funding in the context of a slow and unequal
recovery